
Independent Consultant QAQC Review of the Crops ERA · Independent Consultant QAQC Review of the...
114
INDEPENDENT CONSULTANT QAQC REVIEW OF THE CROPS ERA CITY OF PORT COLBORNE COMMUNITY BASED RISK ASSESSMENT
Transcript of Independent Consultant QAQC Review of the Crops ERA · Independent Consultant QAQC Review of the...

INDEPENDENT CONSULTANT QAQC REVIEW OF THE CROPS ERA CITY OF PORT COLBORNE COMMUNITY BASED RISK ASSESSMENT

CONFIDENTIAL
INDEPENDENT CONSULTANT
QAQC REVIEW OF THE CROPS ERA
CITY OF PORT COLBORNE COMMUNITY
BASED RISK ASSESSMENT
Prepared for:
PUBLIC LIAISON COMMITTEE &
CITY OF PORT COLBORNE
c/o City of Port Colborne
66 Charlotte Street
Port Colborne, Ontario
L3K 3C8
Prepared by:
WATTERS ENVIRONMENTAL GROUP INC.
8800 Dufferin Street, Suite 303
Concord, Ontario
L4K 0C5
Revised November 2010
Reference No. 04-0007

Independent Consultant QAQC Review of the Crops ERA
City of Port Colborne CBRA Page i
Watters Environmental Group Inc. CONFIDENTIAL
Reference No. 04-0007 Revised November 2010
TABLE OF CONTENTS
SECTION PAGE
TABLE OF CONTENTS ................................................................................................................. i
1.0 INTRODUCTION ...............................................................................................................1
1.1 QUALITY CONTROL AND QUALITY ASSURANCE .......................................1
1.2 QA/QC ACTIVITIES AND THE ERA-CROPS STUDIES ...................................2
1.3 THE ROLE OF THE INDEPENDENT CONSULTANT IN QA/QC ....................3
1.4 SCOPE OF THE QA/QC REPORT ........................................................................3
2.0 FIELD TRIALS PROGRAM ..............................................................................................5
2.1 OBJECTIVE OF THE FIELD TRIAL STUDY ......................................................5
2.2 APPROACH TAKEN FOR QA/QC .......................................................................5
2.3 PROTOCOLS EMPLOYED IN CARRYING OUT THE FIELD WORK .............6
2.4 COMMENTS ON ADHERENCE TO, AND DEVIATIONS FROM,
PROTOCOLS ..........................................................................................................6
2.5 DATA QA/QC .........................................................................................................7
2.6 ACCEPTABILITY/LIMITATIONS OF STUDY ...................................................9
3.0 GREENHOUSE STUDY...................................................................................................20
3.1 OBJECTIVE OF STUDY ......................................................................................20
3.2 APPROACH TAKEN FOR QA/QC .....................................................................20
3.3 DATE(S) FIELD WORK CONDUCTED .............................................................21
3.4 PROTOCOLS EMPLOYED IN CARRYING OUT THE FIELD WORK ...........21
3.5 COMMENTS ON AND OBSERVED DEVIATIONS FROM PROTOCOLS ....21
3.6 DATA QA/QC .......................................................................................................22
3.7 ACCEPTABILITY/LIMITATIONS OF STUDY .................................................23
4.0 BIOMONITORING STUDY.............................................................................................29
4.1 OBJECTIVE OF THE BIOMONITORING STUDY ...........................................29
4.2 APPROACH TAKEN FOR QA/QC .....................................................................29
4.3 DATE(S) FIELD WORK CARRIED OUT ...........................................................29

Independent Consultant QAQC Review of the Crops ERA
City of Port Colborne CBRA Page ii
Watters Environmental Group Inc. CONFIDENTIAL
Reference No. 04-0007 Revised November 2010
TABLE OF CONTENTS (Continued)
SECTION PAGE
4.4 PROTOCOLS EMPLOYED IN CARRYING OUT THE BIOMONITORING
STUDY ..................................................................................................................29
4.5 COMMENTS ON ADHERENCE TO, AND DEVIATIONS FROM,
PROTOCOLS ........................................................................................................29
5.0 ANALYTICAL LABORATORY QA/QC FOR THE ERA-CROPS STUDY .................31
5.1 SPECIFIC COMMENTS REGARDING ANALYTICAL REPORTS .................31
5.2 FIELD AND LABORATORY QAQC ..................................................................31
6.0 CONCLUSIONS................................................................................................................34
6.1 PLANNING ...........................................................................................................34
6.2 SAMPLE TAKING ...............................................................................................34
6.3 ANALYSIS ............................................................................................................34
6.4 REPORTING .........................................................................................................34
LIST OF APPENDICES
Appendix 1: Field Trial Soil Results for the Refinery from JWEL and the Independent
Consultant
Appendix 2: Field Trial Soil Results for the Hruska Site from JWEL and the Independent
Consultant
Appendix 3: Greenhouse Soil Results from JWEL and the Independent Consultant
Appendix 4: Laboratory Certificates-of-Analyses for the Field Trial Soils from the Refinery
Site
Appendix 5: Laboratory Certificates-of-Analyses for the Field Trial Soils from the Hruska Site
Appendix 6: Laboratory Certificates-of-Analyses for the Greenhouse Studies

Independent Consultant QAQC Review of the Crops ERA
City of Port Colborne CBRA Page 1
Watters Environmental Group Inc. CONFIDENTIAL
Reference No. 04-0007 Revised November 2010
1.0 INTRODUCTION
A final Crop Studies report concerning the impacts of emissions from a former nickel refinery on
the natural environment within the City of Port Colborne, Ontario was prepared by Jacques
Whitford Environmental Limited (JWEL) [now Stantec Consulting], on behalf of its client, Vale
Inco (Inco). This six-volume report is entitled, “Community Based Risk Assessment Port
Colborne, Ontario; Crop Studies” and dated December 2004 (the Crops Report), and is one
component of a Community Based Risk Assessment (CBRA) that is attempting to address
potential impacts from former Inco emissions on agricultural crops, the natural environment, and
human health within the City of Port Colborne.
Watters Environmental Group Inc. (Watters Environmental) is the Independent Consultant to the
City of Port Colborne and the Public Liaison Committee (PLC) for the CBRA and has prepared
this report to document, review and comment on the overall quality of the individual technical
studies that were carried out by JWEL, as the basis for the Crops Report.
As the various modules of the CBRA evolved, quality assurance (QA) was built into every step
of the data gathering component. It is important to note that QA applies to every aspect of the
CBRA; from field sampling, to laboratory analysis, to data assessment, to final report
preparation. These activities are distinctly separate but intimately interrelated. Errors and biases
in any activity will affect the other activities. Analytical accuracy in the laboratory can never
compensate for errors made during sampling or indemnify against poor precision in the
laboratory or incorrect statistical treatment of collection. Great care to ensure representative
sample collection in the field will not indemnify against poor precision in the laboratory or
incorrect treatment of the sample data. In order to produce a reliable, trustworthy environmental
study, all of the components of the study must be properly planned, executed, documented, and
reported.
1.1 QUALITY CONTROL AND QUALITY ASSURANCE
Quality control (QC) is a planned system of activities whose purpose is to provide a quality
product. Quality assurance (QA) is a planned system of activities whose purpose is to provide
assurance that the quality control program is effective. The purpose of this report is to assess the
QC activities and the overall QA processes used in the Crops portion of the Port Colborne CBRA
that would allow an objective reviewer to form an opinion as to the accuracy, precision and
quality of the data on which the conclusions in the Crops Report are founded.

Independent Consultant QAQC Review of the Crops ERA
City of Port Colborne CBRA Page 2
Watters Environmental Group Inc. CONFIDENTIAL
Reference No. 04-0007 Revised November 2010
For a more detailed discussion of QA/QC and how it relates generally to environmental science,
and the CBRA in particular, the reader is referred to the Quality Assurance Review on the
Natural Environment in Port Colborne. (Watters Environmental, Revised Nov 2010).
1.2 QA/QC ACTIVITIES AND THE ERA-CROPS STUDIES
The Crops Study for the Port Colborne CBRA comprises three primary studies addressing
growth of crops in a “natural” field setting, in a greenhouse, and a biomonitoring study focused
on goldenrod in the natural environment.
Development of individual study protocols was undertaken by JWEL and, according to the
agreed procedures regarding the conduct of the CBRA, was required to be presented to the
Technical Sub-Committee (TSC) for its review and comment. This process was not consistently
followed for the Crops Studies.
JWEL provided training to field staff involved in the Crops Studies while their sub-contracted
analytical service, PSC Analytical, provided training to laboratory staff.
Record keeping of sampling and analytical work was provided by JWEL and PSC Analytical
respectively. The Independent Consultant also maintained records of its activities relating to
QA/QC during the conduct of field work.
An important QA/QC role of the Independent Consultant was to observe field activities to ensure
these were carried out in a manner consistent with the requirements of the study protocols. This
role was inconsistently carried out. Often fieldwork was initiated without the Independent
Consultant’s knowledge or with insufficient notice to allow for the Independent Consultant to be
present at the Site during field work activities. Consequently, many elements of the Crops Study
were carried out without independent observation and adequate QA/QC.
Concerns with QA/QC on the Crops Study centre on the generality of the study protocols. The
protocols lack specific information with regards to how the studies will be conducted and how
the data generated will be treated. This had significant adverse effects on the later conduct of the
Study and its ability to provide meaningful information. For example, the protocols fail to
specify acceptable ranges for the concentrations of nickel (Ni) in soil blends in the greenhouse
study. This resulted in a large gap between high and very high Ni soil concentrations used to
construct the dose-response curve in the critical zone where the change in slope is expected to
occur. This leads to additional uncertainty in the derived Predicted No Effect Concentration (i.e.,
PNEC).

Independent Consultant QAQC Review of the Crops ERA
City of Port Colborne CBRA Page 3
Watters Environmental Group Inc. CONFIDENTIAL
Reference No. 04-0007 Revised November 2010
Elements that demonstrated incomplete or inadequate QA implementation in the Port Colborne
Crops Study included: Comprehensive Planning, Documentation of Study Objectives,
Documentation of Study Methodologies and the Timely Identification and Resolution of
Problems.
1.3 THE ROLE OF THE INDEPENDENT CONSULTANT IN QA/QC
While the Independent Consultant’s role was primarily to assist the City of Port Colborne and
the PLC in understanding the science within the CBRA, an important additional responsibility
was to help ensure that QA was an integral part of the sampling, analytical, assessment and
reporting stages of the studies carried out for the CBRA. The Independent Consultant, with
input from the PLC, critiqued the study elements of these projects to sharpen the focus of the
project and to ensure that proper planning and sampling was carried out, as well as to ensure that
QA/QC was in place and could be documented for the various projects.
The Independent Consultant’s role in QA/QC for the Crops Study was largely limited to
evaluating the quality of sample preparation through collection and analysis of replicate samples.
The Independent Consultant also observed activities to ensure they were conducted in
accordance with the Study Protocols. As the Protocols were lacking in detail on many important
aspects of study design and procedure, this element of QA/QC is of limited value in the
assessment of the overall quality of experimental work.
1.4 SCOPE OF THE QA/QC REPORT
Studies such as those comprising the CBRA have a number of key elements:
Planning;
Sampling;
Analysis;
Data Assessment; and
Reporting.
In this review of QA/QC for the CBRA, elements primarily considered are associated with the
planning of the studies, sampling methodology and sample-taking, analysis of samples and
reporting.

Independent Consultant QAQC Review of the Crops ERA
City of Port Colborne CBRA Page 4
Watters Environmental Group Inc. CONFIDENTIAL
Reference No. 04-0007 Revised November 2010
At the request of a Port Colborne resident, this report has been revised to include the Certificate-
of-Analyses for the QA/QC samples collected by the Independent Consultant. These certificates
are provided in Appendices 4 to 6.

Independent Consultant QAQC Review of the Crops ERA
City of Port Colborne CBRA Page 5
Watters Environmental Group Inc. CONFIDENTIAL
Reference No. 04-0007 Revised November 2010
2.0 FIELD TRIALS PROGRAM
2.1 OBJECTIVE OF THE FIELD TRIALS
The objective of the Field Trials Program was to study the effects of intermediate and high soil
concentrations of chemicals of concern (CoC) on crops grown under natural field conditions.
Another objective of these trials was to link the dose-response experiments performed in the
greenhouse with the tests under natural field conditions by using “engineered plots”.
2.2 APPROACH TAKEN FOR QA/QC
All soil samples were split with the Independent Consultant and 20% of the field soils were
analyzed at the analytical laboratory for comparison with JWEL results. Vegetation samples
were coded by JWEL and analytical results were sent by the laboratory to both consulting firms.
Fieldwork took place predominantly from June 2001 to October 10, 2001. Some additional work
involving drying and splitting soil samples took place on December 18, 2001, March 4, 2002 and
April 10, 2002.
QA/QC for field testing and the engineered field plots was periodic. Representatives of the
Independent Consultant witnessed some preparation of the fields prior to planting and the
various growth stages of the plants. Independent Consultant representatives also witnessed
harvesting of some of the plants (such as radish, oats and corn at the Refinery Site) and the
collection of some of the field soils at the Refinery Site.
The Independent Consultant was represented at the washing, drying and weighing of plant
tissues and was present for the signing of chain-of-custody forms for vegetation samples and the
splitting of Refinery Plot and Hruska Plot soil samples.
Representatives of the Independent Consultant also witnessed plant growth at the greenhouse and
harvesting of oats from plots while at the Hruska Site. Some soil collection from the individual
plots following plant harvest was also observed.

Independent Consultant QAQC Review of the Crops ERA
City of Port Colborne CBRA Page 6
Watters Environmental Group Inc. CONFIDENTIAL
Reference No. 04-0007 Revised November 2010
2.3 PROTOCOLS EMPLOYED IN CARRYING OUT THE FIELD WORK
The protocols available at the time of sampling for the different field programs were:
“Field Trials Protocol #1: Year 2001 Field Testing for Crop Plant CoC Uptake and
the Effect of CoC-Impacted Soils on Plant Toxicity at the Clay 2 (Refinery) Field
Test Site. May 30, 2001.”
“Field Trials Protocol #2: Year 2001 Field Testing for Crop Plant CoC Uptake and
the Effect of CoC-Impacted Soils on Plant Toxicity at the Clay 3 (Hruska) Field Test
Site. May 30, 2001.”
“Field Trials Protocol #3: Year 2001 Field Plot Testing with Blended Port Colborne
Soils for Crop Plant CoC Uptake and the Effect of CoC-Impacted Soils on Plant
Toxicity (Engineered Plots). May 30, 2001.”
2.4 COMMENTS ON ADHERENCE TO, AND DEVIATIONS FROM,
PROTOCOLS
The protocols state that the fields will be sprayed to kill weeds, and that a biocide will
be incorporated into the soil. The protocols did not specify the chemicals used and
concentrations at which they should be applied.
The Protocols state that fertilizers will be tilled into the soil. Specific details of the
type of fertilizer and the concentrations to be added to the soil were not described in
the protocols.
The methodologies employed while working with the soil were not included in the
protocols (for example, the use of farm machinery, shovel and/or by hand).
The seed cultivars used in the 2000 field trials were not the same as those used in the
2001 trials, although this was a requirement of the protocols.
The Independent Consultant was not present to witness the soybean seeds mixed with
inoculants prior to planting and, consequently, it cannot be confirmed whether this
procedure took place. Details regarding the specific compounds in the inoculants and
the quantities to be mixed were not specified in the protocols.

Independent Consultant QAQC Review of the Crops ERA
City of Port Colborne CBRA Page 7
Watters Environmental Group Inc. CONFIDENTIAL
Reference No. 04-0007 Revised November 2010
The protocols state that normal planting densities, as recommended by the Ontario
Ministry of Agriculture, Food and Rural Affairs (OMAFRA), should be used but
these are not specified. Similarly, the methods to be used to ensure that the necessary
planting densities were achieved were not specified.
Details regarding the methodology of plant harvesting were not sufficiently complete
in the protocols. The protocols state that plant biomass will be measured but does not
describe how or where it will be performed. The protocols also state that plant tissue
concentrations will be measured, for both agronomic and toxicological purposes,
although sample preparation is not discussed.
A detailed schedule outlining exactly when insecticides, fertilizers and biocides
should be added to the soil, and when planting and all harvesting events should take
place, were not included in the protocols.
2.5 DATA QA/QC
Data QA/QC comparison was performed on soil samples collected in the field (see Appendix 1
and 2).
All vegetation results were shared between the consulting firms. The results for the soil samples
that the Independent Consultant had analyzed were tabulated for the four CoCs (i.e., arsenic,
cobalt, copper and nickel) and soil pH. The absolute and percent differences between JWEL and
the Independent Consultant results were calculated for each sample per CoC, per Site. The
absolute difference was calculated by subtracting the Independent Consultant value from the
JWEL value, and the percent difference was calculated as follows:
(JWEL value - the Ind. Cons. value) / ([JWEL value + the Ind. Cons. Value] / 2) 100.
The means of the absolute and percent differences were calculated for each CoC per Site.
Appendix 1 provides the field trial soil results for the JWEL data and the Independent Consultant
data, as well as the calculated differences for the Refinery Site. Appendix 2 provides similar
information for the Hruska Site.
Refinery Soils
The mean percent differences for the Refinery field soils were 0.71, 11.95, 9.86, 15.59 and
6.79% for arsenic (As), cobalt (Co), copper (Cu), nickel (Ni) and soil pH, respectively. In a
study such as this, a certain level of variability associated with the data is expected. The

Independent Consultant QAQC Review of the Crops ERA
City of Port Colborne CBRA Page 8
Watters Environmental Group Inc. CONFIDENTIAL
Reference No. 04-0007 Revised November 2010
variability can be due to natural phenomenon and/or the collection and analytical methodologies
applied. Variability is also associated with the data analysis. Varying levels of contaminant
concentrations in the samples can have a significant effect on the percent difference (for
example, a small difference in a low concentration can equate to a large percent difference
whereas a small difference in a high concentration equates to a small percent difference).
Figures 1 through 10 provide graphical representations of the degree of variability in the
Refinery field soil data.
Figures 1, 3, 5, 7 and 9 provide a comparison of the percent differences between the JWEL
results and the Independent Consultant results to the corresponding JWEL concentration, for As,
Co, Cu, Ni and pH levels in field trial soils at the Refinery site. Figures 2, 4, 6, 8 and 10 provide
a linear comparison of the JWEL and the Independent Consultant field trial soil results for As,
Co, Cu, Ni and pH concentrations. The dotted line in these figures represents a 1:1 ratio,
indicating the line that would arise if all of the concentrations in the JWEL samples and the
Independent Consultant samples were identical.
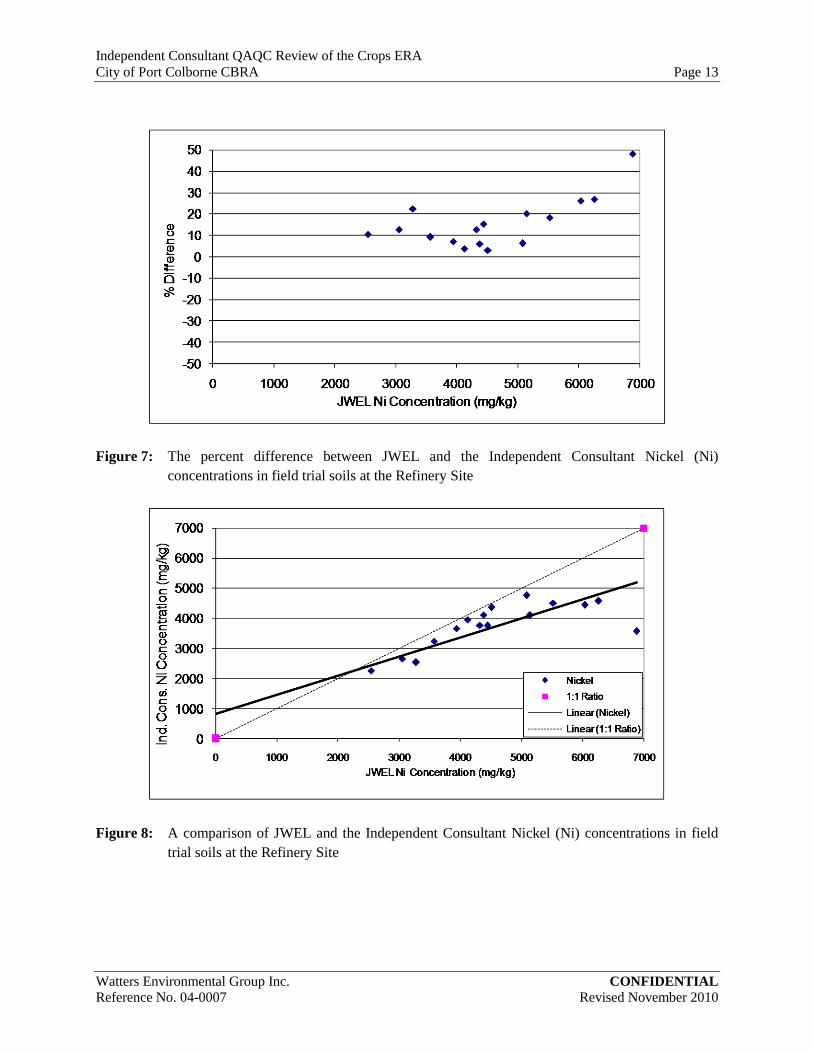
For all of the CoCs and soil pH, there is a tendency for the JWEL data to have higher
concentrations than the Independent Consultant data. There is; however, a fairly strong linear
relationship with the concentration results from JWEL and the Independent Consultant. A
statistical regression analysis was conducted on the slopes of the contaminant and 1:1 ratio trend
lines for all of the datasets. The analyses determined that there are significant differences
between the slopes of the trend lines for soil pH and all of the CoCs, except Arsenic. These
differences are not considered substantive and do not affect the use of the data.
Hruska Soils
The mean percent differences for the Hruska field soils were –22.45, 8.33, 6.67, 7.90 and 4.23%
for As, Co, Cu, Ni and soil pH, respectively. Figures 11 through 20 provide graphical
representations of the degree of variability in the field soil data between data collected by JWEL
and by the Independent Consultant.
Figures 11, 13, 15, 17 and 19 provide a comparison of the percent differences between the JWEL
results and the Independent Consultant results for As, Co, Cu, Ni and pH levels in field trial soils
at the Hruska site. Figures 12, 14, 16, 18 and 20 provide a linear comparison of the JWEL and
the Independent Consultant As, Co, Cu, Ni and pH concentrations, respectively, for field trial
soils at the Hruska site.

Independent Consultant QAQC Review of the Crops ERA
City of Port Colborne CBRA Page 9
Watters Environmental Group Inc. CONFIDENTIAL
Reference No. 04-0007 Revised November 2010
For the arsenic dataset, there is one sample (31X9) that has a high percent difference (i.e., over
400%). This is possibly a transcription error. Apart from this data point, for all of the CoCs and
the soil pH data, there is a fairly strong linear relationship with the concentration results from
JWEL and the Independent Consultant. Statistical regression analyses determined there to be
significant differences between the slopes of the contaminant and the 1:1 ratio trend lines for all
of the CoCs, but not for the soil pH data. However, as with the Refinery soil, none of the
differences are considered to be significant.
Engineered Plots
No QA/QC could be performed on the soils from the engineered plots. Despite several requests
from the Independent Consultant over a period of more than one year, the Independent
Consultant was not provided with the JWEL soil data.
2.6 ACCEPTABILITY/LIMITATIONS OF STUDY
Due to the low mean percent differences and fairly strong linear relationships between the JWEL
soil data and the Independent Consultant soil data, no systematic error with the data was
observed. The variability between the JWEL and the Independent Consultant soil results, for
both the Refinery and Hruska Sites, is reasonable for this study.
It is difficult to comment on how well the field trials protocols were followed as all three
protocols contain very few specific details on the required methodology.

Independent Consultant QAQC Review of the Crops ERA
City of Port Colborne CBRA Page 10
Watters Environmental Group Inc. CONFIDENTIAL
Reference No. 04-0007 Revised November 2010
Figure 1: The percent difference between JWEL and the Independent Consultant Arsenic
(As) concentrations in field trial soils at the Refinery Site
Figure 2: A comparison of JWEL and the Independent Consultant Arsenic (As)
concentrations in field trial soils at the Refinery Site

Independent Consultant QAQC Review of the Crops ERA
City of Port Colborne CBRA Page 11
Watters Environmental Group Inc. CONFIDENTIAL
Reference No. 04-0007 Revised November 2010
Figure 3: The percent difference between JWEL and the Independent Consultant Cobalt (Co)
concentrations in field trial soils at the Refinery Site
Figure 4: A comparison of JWEL and the Independent Consultant Cobalt (Co) concentrations in field
trial soils at the Refinery Site

Independent Consultant QAQC Review of the Crops ERA
City of Port Colborne CBRA Page 12
Watters Environmental Group Inc. CONFIDENTIAL
Reference No. 04-0007 Revised November 2010
Figure 5: The percent difference between JWEL and the Independent Consultant Copper (Cu)
concentrations in field trial soils at the Refinery Site
Figure 6: A comparison of JWEL and the Independent Consultant Copper (Cu) concentrations in field
trial soils at the Refinery Site
Independent Consultant QAQC Review of the Crops ERA
City of Port Colborne CBRA Page 13
Watters Environmental Group Inc. CONFIDENTIAL
Reference No. 04-0007 Revised November 2010
Figure 7: The percent difference between JWEL and the Independent Consultant Nickel (Ni)
concentrations in field trial soils at the Refinery Site
Figure 8: A comparison of JWEL and the Independent Consultant Nickel (Ni) concentrations in field
trial soils at the Refinery Site

Independent Consultant QAQC Review of the Crops ERA
City of Port Colborne CBRA Page 14
Watters Environmental Group Inc. CONFIDENTIAL
Reference No. 04-0007 Revised November 2010
Figure 9: The percent difference between JWEL and the Independent Consultant pH values in field trial
soils at the Refinery Site
Figure 10: A comparison of JWEL and the Independent Consultant pH values in field trial soils at the
Refinery Site

Independent Consultant QAQC Review of the Crops ERA
City of Port Colborne CBRA Page 15
Watters Environmental Group Inc. CONFIDENTIAL
Reference No. 04-0007 Revised November 2010
Figure 11: The percent difference between JWEL and the Independent Consultant Arsenic (As)
concentrations in field trial soils at the Hruska Site
Figure 12: A comparison of JWEL and the Independent Consultant Arsenic (As) concentrations in field
trial soils at the Hruska Site

Independent Consultant QAQC Review of the Crops ERA
City of Port Colborne CBRA Page 16
Watters Environmental Group Inc. CONFIDENTIAL
Reference No. 04-0007 Revised November 2010
Figure 13:The percent difference between JWEL and the Independent Consultant Cobalt (Co)
concentrations in field trial soils at the Hruska Site
Figure 14: A comparison of JWEL and the Independent Consultant Cobalt (Co) concentrations in field
trial soils at the Hruska Site

Independent Consultant QAQC Review of the Crops ERA
City of Port Colborne CBRA Page 17
Watters Environmental Group Inc. CONFIDENTIAL
Reference No. 04-0007 Revised November 2010
Figure 15: The percent difference between JWEL and the Independent Consultant Copper (Cu)
concentrations in field trial soils at the Hruska Site
Figure 16: A comparison of JWEL and the Independent Consultant Copper (Cu) concentrations in field
trial soils at the Hruska Site

Independent Consultant QAQC Review of the Crops ERA
City of Port Colborne CBRA Page 18
Watters Environmental Group Inc. CONFIDENTIAL
Reference No. 04-0007 Revised November 2010
Figure 17: The percent difference between JWEL and the Independent Consultant Nickel (Ni)
concentrations in field trial soils at the Hruska Site
Figure 18: A comparison of JWEL and the Independent Consultant Nickel (Ni) concentrations in field
trial soils at the Hruska Site

Independent Consultant QAQC Review of the Crops ERA
City of Port Colborne CBRA Page 19
Watters Environmental Group Inc. CONFIDENTIAL
Reference No. 04-0007 Revised November 2010
Figure 19: The percent difference between JWEL and the Independent Consultant pH values in field trial
soils at the Hruska Site
Figure 20: A comparison of JWEL and the Independent Consultant pH values in field trial soils at the
Hruska Site
Independent Consultant QAQC Review of the Crops ERA
City of Port Colborne CBRA Page 20
Watters Environmental Group Inc. CONFIDENTIAL
Reference No. 04-0007 Revised November 2010
3.0 GREENHOUSE STUDY
3.1 OBJECTIVE OF STUDY
The purpose of the Greenhouse Study was to identify the CoC dose-response concentrations for
sensitive agricultural crops, using soils and plants typical of the Port Colborne area.
3.2 APPROACH TAKEN FOR QA/QC
All soil samples were split with the Independent Consultant; 100% of the soils collected in the
field (before soils blended) and 20% of the greenhouse soils (after soils blended) were sent to the
analytical laboratory for comparison to JWEL results. Vegetation samples were coded by JWEL
and analytical results were shared between the consulting firms.
For Soil Collection, Soil Drying and Sieving into Barrels, QA/QC was periodic. The
Independent Consultant witnessed soil collection (high sand) and drying and sieving of several
soil types (high Welland Clay, low Welland Clay).
QA/QC was also periodic for Soil pH Adjustment, Soil Homogenization and Official Soil
Sample Collection; 100% of the “official” soil samples were sent for analysis by the Independent
Consultant.
The Independent Consultant witnessed the soil homogenization technique and, where completed,
pH adjustment (and/or readjustment) of soils (high Welland Clay, low Welland Clay). The
Independent Consultant also observed “official” soil sample collection and division of samples
(one for the Independent Consultant and one for JWEL) many times (high Welland Clay, low
Welland Clay, high sand, low Clay Till, high Clay Till).
QA/QC of Soil Blending was periodic. 100% of soil samples were split with the Independent
Consultant, while only 20% were analyzed. The blending procedure (Welland Clay) for a few of
the concentrations was observed by the Independent Consultant, as was sample collection (and
splitting with the Independent Consultant) of blended soils (sand, Welland Clay).
QA/QC was intermittent for the Greenhouse Testing. Various growth stages of the plants and
plant harvest (Oats in organic soil) were observed. The Independent Consultant observed the
washing, drying and weighing of plant tissue, as well as pH analysis of soil collected after plant
harvest. The Independent Consultant was present for the signing of chain-of-custody forms for
the vegetation samples.

Independent Consultant QAQC Review of the Crops ERA
City of Port Colborne CBRA Page 21
Watters Environmental Group Inc. CONFIDENTIAL
Reference No. 04-0007 Revised November 2010
3.3 DATE(S) FIELD WORK CONDUCTED
Fieldwork took place predominantly from May 30, 2001 to October 10, 2001. Some additional
work involving drying and splitting soil samples took place on December 18, 2001, March 4,
2002 and April 10, 2002.
3.4 PROTOCOLS EMPLOYED IN CARRYING OUT THE FIELD WORK
The protocol available at the commencement of fieldwork for the collection of soils was: “Soil
Sampling Protocol, Year 2001 Greenhouse and Field Trials”, draft version May 25, 2001.
For the vegetation testing portion of the program, the protocol available at the beginning of the
testing was: “Greenhouse Trials Protocol #1, Year 2001 Greenhouse Dose-Response for Crop
Plant CoC Uptake and Plant Toxicity on CoC Impacted Soils”, draft version May 25, 2001”.
During the testing a revised protocol was made available: “Greenhouse Trials Protocol #1, Year
2001 Greenhouse Dose-Response and pH Trials for Crop Plant CoC Uptake and Plant Toxicity
on CoC Impacted Soils”, revised version August 24, 2001.
3.5 COMMENTS ON AND OBSERVED DEVIATIONS FROM PROTOCOLS
Soil Sampling Protocol
The use of soil blending to create soil samples with a range of soil nickel
concentrations was a concern of the Independent Consultant and others on the TSC
long before the actual field work commenced for the Greenhouse Study. The issue
had been flagged as a potential critical flaw for the Study. The Soil Sampling
Protocol, Year 2001 Greenhouse and Field Trials was explicit in stating that “Beak
will be consulted on the selection”. Neither the Independent Consultant or the TSC
were consulted regarding the selection of all soil locations. The Independent
Consultant was also not consistently advised of the schedule for the collection of soil
from each of the locations.
Similarly, neither the Independent Consultant or the TSC were consulted regarding
the target pH of the soils collected in the field prior to pH adjustment (i.e., a
requirement of the protocol).

Independent Consultant QAQC Review of the Crops ERA
City of Port Colborne CBRA Page 22
Watters Environmental Group Inc. CONFIDENTIAL
Reference No. 04-0007 Revised November 2010
Greenhouse Trials Protocol #1
The method of application, specific compounds and amounts of fertilizer applied to
the soils in the greenhouse were not described in the protocol.
Details regarding the methodology, specific compounds (appropriate compost) and
amounts (proportions roughly the same as dolomitic limestone) added to each soil in
the greenhouse to amend the pH were not specified in the protocol.
Issues arose during testing regarding plant pathology and/or insect infestation. These
events were not foreseen and, consequently, there were no details provided in the
protocol describing the influence these issues might have on the Study and the actions
that would need to be taken to correct the issues, including aborting the Study. There
was no amendment made to the protocol once these issues were identified.
The protocol contained no description of the methodology to be employed to harvest
the plants (including, for example, information with respect to what exactly
constitutes a plant at maturity, how the plants should be dried or weighed, the specific
parts of the plants that should be sent for analysis, as well as if the soils should be
dried and homogenized prior to pH measurement).
The methodology for splitting soil samples was not described in the protocol. JWEL
and the Independent Consultant split the soil samples using a soil riffle splitter.
3.6 DATA QA/QC
Data QA/QC comparison of data sets was performed on soil samples collected in the field and on
blended soil samples (prior to testing). The pH testing of the soil samples collected at plant
harvest (after testing) was conducted by JWEL and the results were shared with the Independent
Consultant.
For the soil samples analyzed by the Independent Consultant, results for the four CoCs were
tabulated (i.e., As, Co, Cu and Ni, as well as soil pH). The absolute and percent differences
between the JWEL results and the Independent Consultant results were calculated for each
sample per CoC. The absolute difference was calculated by subtracting the Independent
Consultant value from the JWEL value. The percent difference was calculated as follows:
(JWEL value - the Ind. Cons. value) / ([JWEL value + the Ind. Cons. value] / 2) 100

Independent Consultant QAQC Review of the Crops ERA
City of Port Colborne CBRA Page 23
Watters Environmental Group Inc. CONFIDENTIAL
Reference No. 04-0007 Revised November 2010
The mean values of the absolute and percent differences were calculated for each CoC.
Appendix 3 provides the greenhouse soil results for the JWEL data and the Independent
Consultant data, as well as the calculated differences.
The mean percent differences for the greenhouse soils were –4.25, -11.15, -8.57, -22.71 and
3.46% for As, Co, Cu, Ni and soil pH, respectively. In a study such as this, a certain level of
variability associated with the data is expected. The variability may be due to natural
phenomenon and/or the collection and analytical methodologies applied. Variability is also
associated with the data analysis. Varying levels of contaminant concentrations in the samples
can have a significant effect on the percent difference (for example, a small difference in a low
concentration can equate to a large percent difference whereas a small difference in a high
concentration equates to a small percent difference). Figures 2 through 30 provide graphical
representations of the degree of variability in the greenhouse soil data.
Figures 21, 23, 25, 27 and 29 provide a comparison of the percentage differences between the
JWEL results and the Independent Consultant results to the corresponding JWEL concentration,
for As, Co, Cu, Ni and pH, respectively. Figures 22, 24, 26, 28 and 30 provide a linear
comparison of the JWEL and the Independent Consultant As, Co, Cu, Ni and pH concentrations,
respectively. The dotted line in these figures represents a 1:1 ratio, indicating the line that would
arise if all of the concentrations in the JWEL and the Independent Consultant samples were
identical.
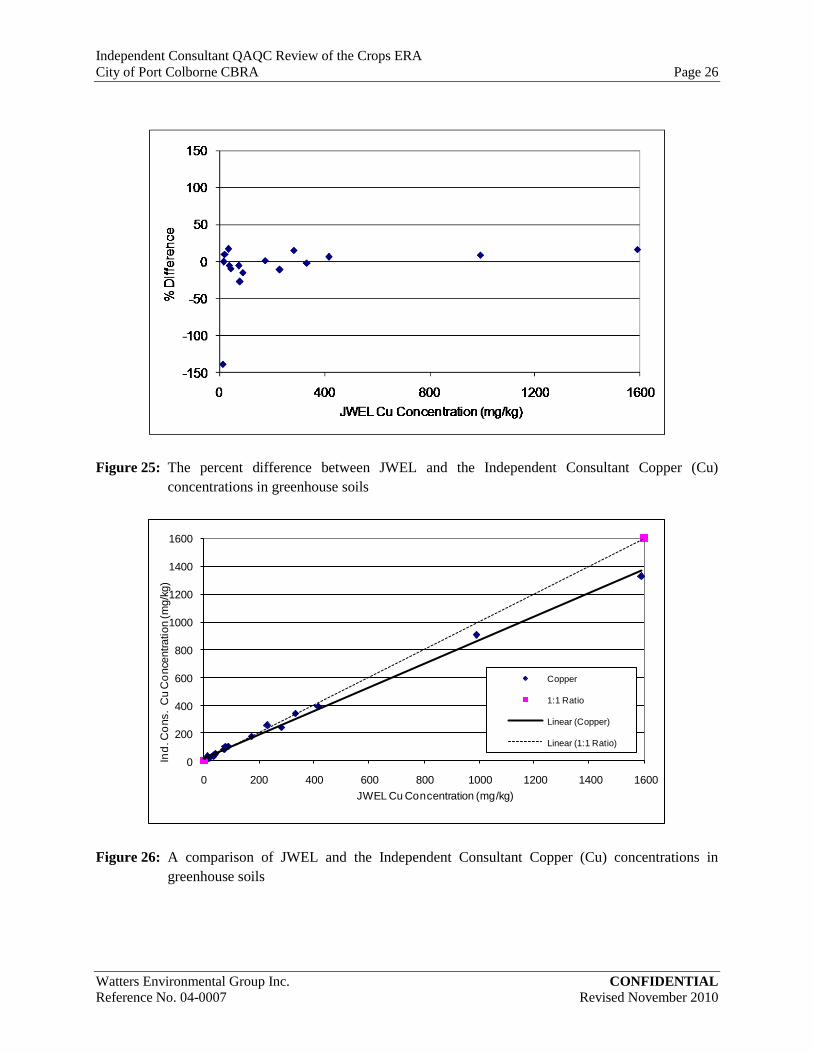
For all of the CoCs and the soil pH, the majority of variation with percent differences occurs at
the lower concentration levels and there is a strong linear relationship with the concentration
results from JWEL and the Independent Consultant. A statistical regression analysis was
conducted on the slopes of the contaminant and 1:1 ratio trend lines for each CoC. The analyses
determined that there was a significant difference between the slopes of the trend lines for all of
the CoCs, but not for the soil pH data. None of the differences are considered to be meaningful
based on the end use of this data.
3.7 ACCEPTABILITY/LIMITATIONS OF STUDY
Due to the low mean percent differences, the majority of data variation occurring at low
concentrations, and the strong linear relationships between the JWEL soil data and the
Independent Consultant soil data, no systematic error with the data was observed. The
variability between the JWEL soil results and the Independent Consultant soil results is
reasonable for this study. It is difficult to comment on how well the JWEL greenhouse protocol
was followed, as that protocol contains very little details with regards to methodology.

Independent Consultant QAQC Review of the Crops ERA
City of Port Colborne CBRA Page 24
Watters Environmental Group Inc. CONFIDENTIAL
Reference No. 04-0007 Revised November 2010
Figure 21: The percent difference between JWEL and the Independent Consultant Arsenic (As)
concentrations in greenhouse soils
Figure 22: A comparison of JWEL and the Independent Consultant Arsenic (As) concentrations in
greenhouse soils

Independent Consultant QAQC Review of the Crops ERA
City of Port Colborne CBRA Page 25
Watters Environmental Group Inc. CONFIDENTIAL
Reference No. 04-0007 Revised November 2010
Figure 23: The percent difference between JWEL and the Independent Consultant Cobalt (Co)
concentrations in greenhouse soils
Figure 24: A comparison of JWEL and the Independent Consultant Cobalt (Co) concentrations in
greenhouse soils
Independent Consultant QAQC Review of the Crops ERA
City of Port Colborne CBRA Page 26
Watters Environmental Group Inc. CONFIDENTIAL
Reference No. 04-0007 Revised November 2010
Figure 25: The percent difference between JWEL and the Independent Consultant Copper (Cu)
concentrations in greenhouse soils
0
200
400
600
800
1000
1200
1400
1600
0 200 400 600 800 1000 1200 1400 1600
Ind.
Con
s. C
u C
once
ntra
tion
(mg/
kg)
JWEL Cu Concentration (mg/kg)
Copper
1:1 Ratio
Linear (Copper)
Linear (1:1 Ratio)
Figure 26: A comparison of JWEL and the Independent Consultant Copper (Cu) concentrations in
greenhouse soils

Independent Consultant QAQC Review of the Crops ERA
City of Port Colborne CBRA Page 27
Watters Environmental Group Inc. CONFIDENTIAL
Reference No. 04-0007 Revised November 2010
Figure 27: The percent difference between JWEL and the Independent Consultant Nickel (Ni)
concentrations in greenhouse soils
Figure 28: A comparison of JWEL and the Independent Consultant Nickel (Ni) concentrations in
greenhouse soils

Independent Consultant QAQC Review of the Crops ERA
City of Port Colborne CBRA Page 28
Watters Environmental Group Inc. CONFIDENTIAL
Reference No. 04-0007 Revised November 2010
Figure 29: The percent difference between JWEL and the Independent Consultant pH values
in greenhouse soils
Figure 30: A comparison of JWEL and the Independent Consultant pH values in greenhouse
soils

Independent Consultant QAQC Review of the Crops ERA
City of Port Colborne CBRA Page 29
Watters Environmental Group Inc. CONFIDENTIAL
Reference No. 04-0007 Revised November 2010
4.0 BIOMONITORING STUDY
4.1 OBJECTIVE OF THE BIOMONITORING STUDY
The objectives of the Biomonitoring Study were to characterize natural flora growing in the
contaminated soils in Port Colborne and to evaluate the amounts of CoCs accumulated by these
plants and found in the soils in which they were growing. This data would then be used to
evaluate CoC levels found in the soil and accumulated by the natural vegetation, and to compare
with similar data from crop phytotoxicity studies.
4.2 APPROACH TAKEN FOR QA/QC
QA/QC was restricted to observing activities related to soil and plant sampling.
4.3 DATE(S) FIELD WORK CARRIED OUT
Field collection of samples of plant material and soil was carried out on September 11, 12 and 13
and subsequently on September 18, 2001.
4.4 PROTOCOLS EMPLOYED IN CARRYING OUT THE BIOMONITORING
STUDY
The protocol available at the time of sampling for the Biomonitoring Study was “Protocol for a
Biomonitoring Study”, dated August 22, 2001.
4.5 COMMENTS ON ADHERENCE TO, AND DEVIATIONS FROM,
PROTOCOLS
The initial intent of the Study, as expressed in the protocol, was to collect sixty plant specimens
from 15 to 20 locations in the study area. The type of plant is not specified in the protocol. The
rationale for selection of Goldenrod (Solidago spp.) is not clear. It is representative of
anthropogenically altered fields and roadsides and is not representative of the natural vegetation
of the area which was originally woodland and wetlands. There is no comparable crop species to
Goldenrod. The decision to sample Goldenrod exclusively was taken on Site on the first day of
sampling because JWEL advised that it was a dominant species at the highly contaminated site.
Sampling sites did not have uniform physiographic or ecological characteristics (i.e., plant
community including natural grasses, little or no slope and no standing moisture). For example,
the clay control site was not representative, as it was from disturbed vegetation in a narrow strip
between woodland and a road where edging effects could be confounding.
Independent Consultant QAQC Review of the Crops ERA
City of Port Colborne CBRA Page 30
Watters Environmental Group Inc. CONFIDENTIAL
Reference No. 04-0007 Revised November 2010
The protocol requires aboveground plant tissue to be collected and separated into vegetative and
reproductive structures. This requirement was not followed and the abovesurface parts of the
plant were actually collected as one sample.

Independent Consultant QAQC Review of the Crops ERA
City of Port Colborne CBRA Page 31
Watters Environmental Group Inc. CONFIDENTIAL
Reference No. 04-0007 Revised November 2010
5.0 ANALYTICAL LABORATORY QA/QC FOR THE ERA-CROPS
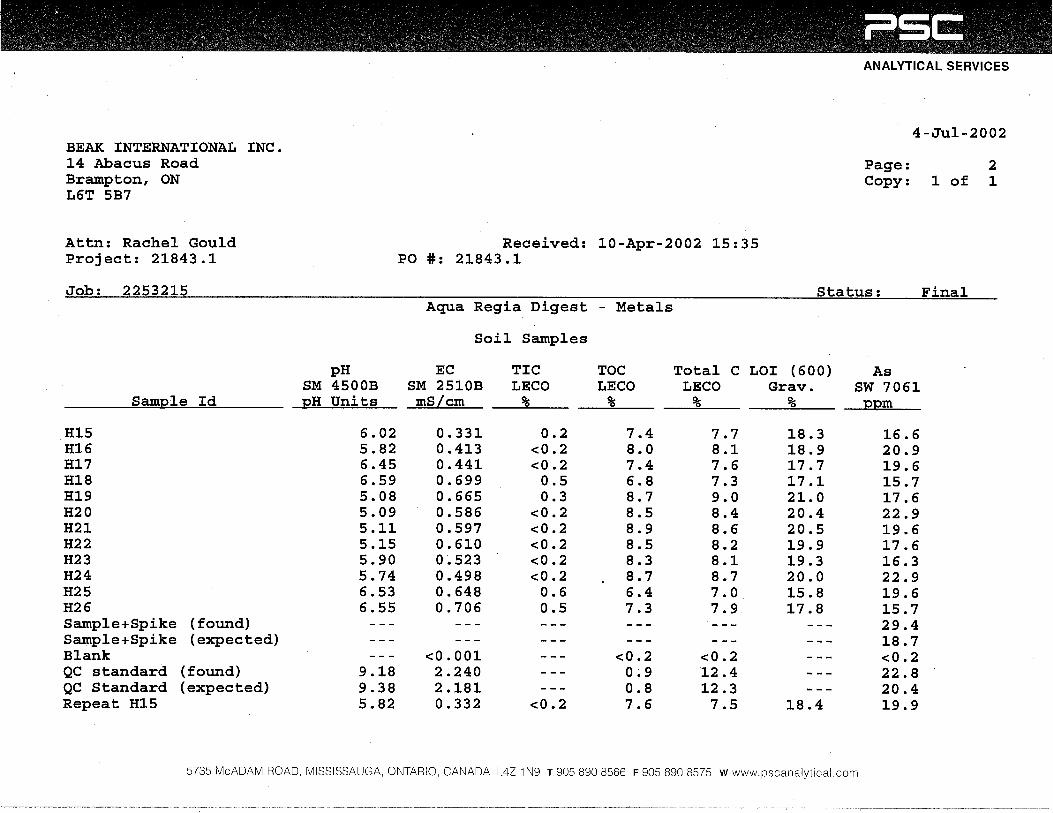
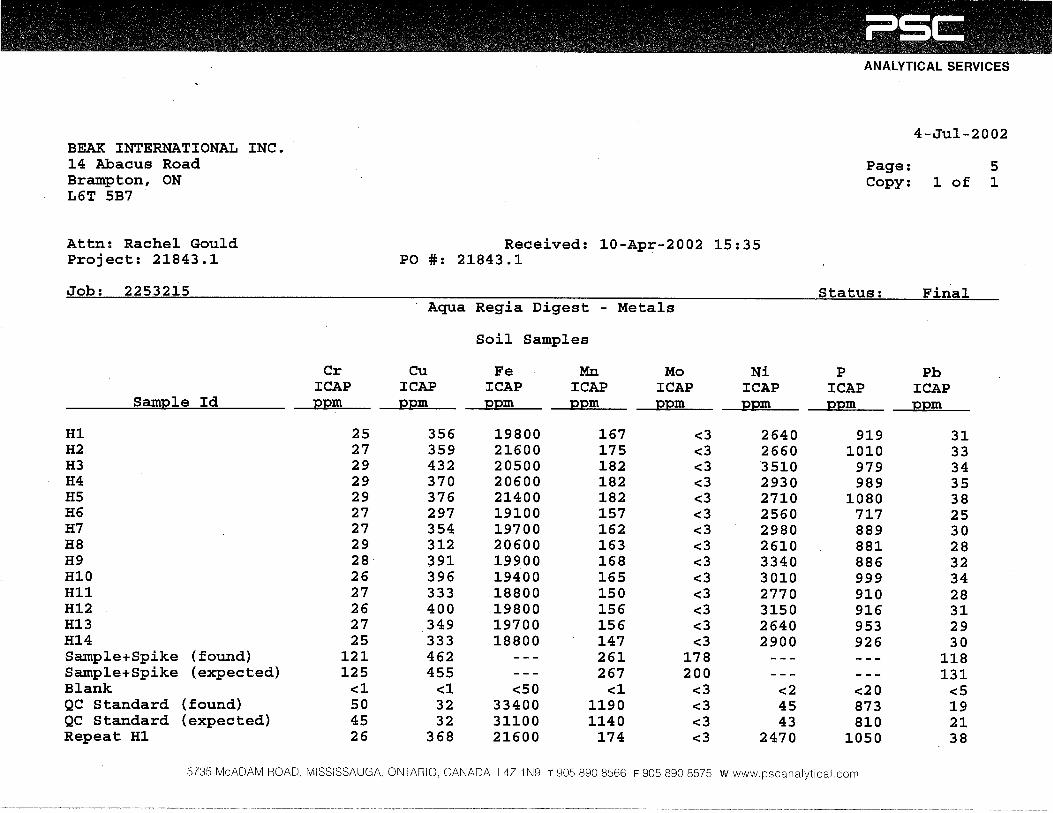
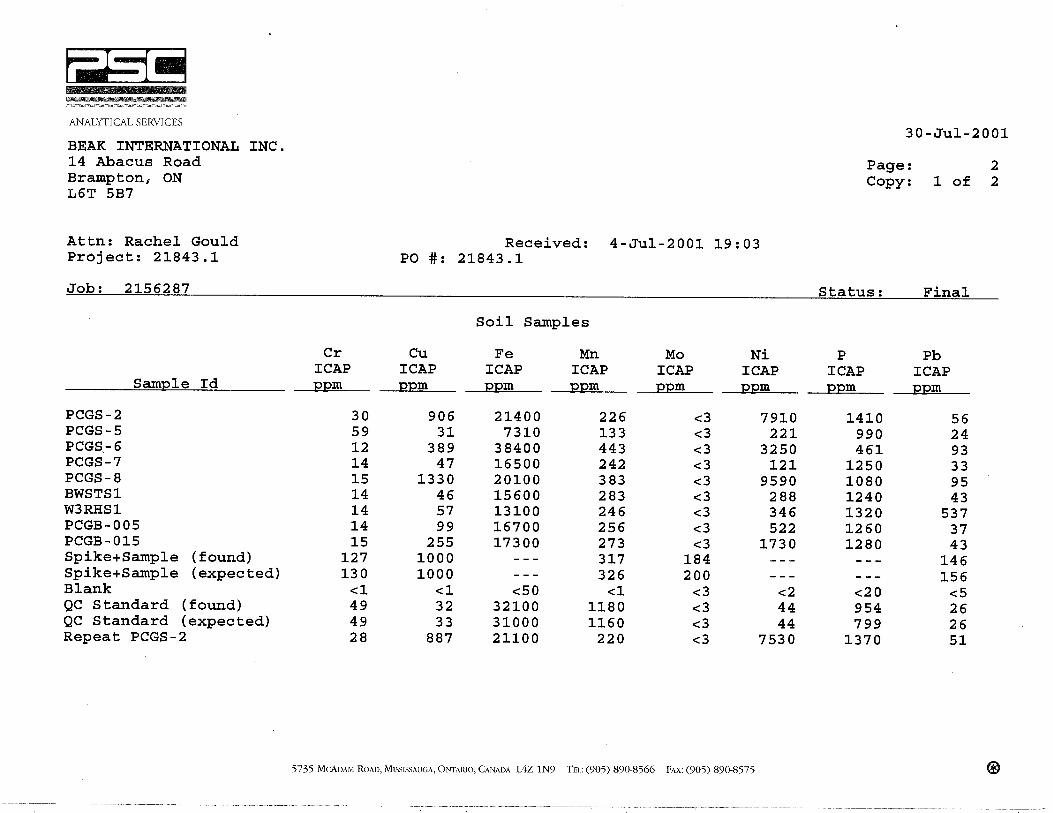
STUDY
5.1 SPECIFIC COMMENTS REGARDING ANALYTICAL REPORTS
Volume II of the Crops Report provides a good overview of the types of testing and the
analytical methods applied for soil testing. Volume III consists of Reports of Analysis and
accompanying QA/QC laboratory data. The QA/QC data is of high quality. The analytical
reports in Volume III generally show that appropriate analytical methods were applied, and that
proper laboratory QA/QC procedures were followed. Equally important, the results of the
QA/QC procedures indicate that the dataset is both accurate and precise, and that there were few
if any matrix effects or blank problems.
Acceptable Limits
Control limits of 30% were applied to laboratory QC samples.
5.2 FIELD AND LABORATORY QA/QC
Field Replicates - Soil
A field duplicate is a second sample taken after, and in the same manner, as an original sample.
Analysis of both samples provides an estimate of the variability between the two samples
(including the laboratory’s analytical variability). Variability between duplicates is higher for
soil samples than it is for water analyses, which is expected due to the comparative lack of
homogeneity in soils.
A comparison of duplicate samples provided in Volume III, Tab G, Table 1 (i.e., samples taken
in duplicate in the field, submitted to the laboratory, and tested at the laboratory, as duplicate
samples) shows:
Almost all of the differences between replicate samples for the CoCs are within the
30% guideline;
Almost all (95% of all the duplicate samples results) are within 30%, and most are
within 20%;

Independent Consultant QAQC Review of the Crops ERA
City of Port Colborne CBRA Page 32
Watters Environmental Group Inc. CONFIDENTIAL
Reference No. 04-0007 Revised November 2010
There are only three results that are not within 56% agreement; these include arsenic
results where the original and duplicate numbers are about 10 and 35 ppm for all
three samples, which when averaged result in differences of about 105%; and
Given the variability expected with soil sampling, these results indicate acceptable
soil sampling precision.
Field Replicates – Vegetation
Only seeds were present in sufficient sample mass to provide acceptable field sample
duplicates. These show acceptable precision: All duplicates agreed within 16%,99%
of the duplicates had a difference of less than 10% from the original results.
Laboratory Replicate Samples
A laboratory replicate is a re-analysis of a given sample subsequent to the original analysis. If
the sample is re-analyzed once, it is called a duplicate test, and it provides an estimate of the
analytical variability. As a general rule, the results for laboratory replicate testing would be
expected to show less variability than the results from field replicates, as field replicate data
would include both laboratory analytical variability and field sample variability.
Laboratory Replicate Data – Soil Samples
For 212 data sets (original + duplicate test, total 424 test results) only six showed a difference
greater than 35%. In fact, more than 97% of the datasets showed agreement with 30%, and most
are under 20%. These data indicate acceptable variability.
Laboratory Replicate Data – Vegetation Samples
The agreement between laboratory duplicates for vegetation sample analyses was acceptable.
There were 140 replicate pairs or 280 sets of analyses for a total of 1,120 results. For more than
90% of the pairs, agreement between the original and the duplicate result was better than 93%
and only four results varied by more than 30%. This low variability indicates excellent
analytical precision.
Standard Reference Data
The laboratory’s overall performance on standard reference materials (SRMs) for soil was good.
The average observed value for As was 15.5 (87%), for Co 13.9 (103.7%), for Cu 31.3 (90.5%)
and for Ni 70.2 (80%) of the certified values for each CoC.

Independent Consultant QAQC Review of the Crops ERA
City of Port Colborne CBRA Page 33
Watters Environmental Group Inc. CONFIDENTIAL
Reference No. 04-0007 Revised November 2010
All vegetation results were well within the 30% limit and the average observed SRM values were
all within 88% of the certified values. i.e:
Cobalt 0.35 (89.7%)
Copper 11.8 (96.7%)
Nickel 1.9 (88.8%)
The SRM data for both soil and vegetation indicates acceptable accuracy for the analytical work.

Independent Consultant QAQC Review of the Crops ERA
City of Port Colborne CBRA Page 34
Watters Environmental Group Inc. CONFIDENTIAL
Reference No. 04-0007 Revised November 2010
6.0 CONCLUSIONS
6.1 PLANNING
According to JWEL, the 2000 Crops Studies did not provide data considered acceptable for the
CBRA, which resulted in considerable pressure to conduct a repeat study in the next year.
Consequently, the preparation of protocols was rushed in order to be able to commence field
work in the 2001 growing season. Protocols were available only days before each of the studies
began and insufficient time was made available to subject them to an approval review by the
TSC and comment by the Independent Consultant.
The protocols are not sufficiently specific on methodology to be employed to ensure consistency
in the way fieldwork was carried out and consequently critical decisions on methodology were
made in the field (for example, the selection of Goldenrod in the Biomonitoring Study).
The lack of specificity in the protocols is a major problem for the Crops Study. Unknown
inconsistencies in methodology and the influence of decisions made in the field, mid-study, have
an unquantifiable influence on the results derived from the Studies.
6.2 SAMPLE TAKING
With the rush to commence field work, there was often insufficient notice given to the
Independent Consultant to allow mobilization of representatives to participate in the QA/QC
process. However, it is clear from the QA/QC that was completed that decisions on sampling
were made without the benefit of well thought out study design. Some of the protocols were not
followed by those carrying out the field work.
6.3 ANALYSIS
There are no concerns with the analytical work carried out for the Crops Study. There is a high
level of agreement between replicate soil samples taken and analyzed by JWEL with those of the
Independent Consultant.
6.4 REPORTING
The protocols presented in the Final Crops Studies Report are not the ones that were used to
guide the conduct of the Studies. Rather, they were written after the completion of the work and
describe what was actually done, not what was required to be done to ensure a credible study.
For example, the version of the Biomonitoring Study Protocol presented in the Report describes

Independent Consultant QAQC Review of the Crops ERA
City of Port Colborne CBRA Page 35
Watters Environmental Group Inc. CONFIDENTIAL
Reference No. 04-0007 Revised November 2010
the approach that was actually taken, including the decision taken in the field on the first day of
sampling, to select Goldenrod to be studied. The original protocol requires sampling from a
plant community that includes natural grasses, but not necessarily dominated by them. This
would have allowed a more direct comparison with other monocot crop species grown in Port
Colborne.
There is no record provided in the Crops Study Final Report of the actual protocol that was
available at the time of field work, and which should have been used to direct the conduct of the
Study. The reader of the Crops Report is, therefore, not able to independently determine whether
the initial intent of the study was actually achieved, which in turn, reduces the credibility of the
Crops Report.

APPENDIX 1
Field Trial Soil Results for the Refinery from JWEL and the
Independent Consultant
URES

Independent Consultant QAQC Review of the Crops ERA
City of Port Colborne CBRA Page 1-1
Watters Environmental Group Inc. CONFIDENTIAL
Reference No. 04-0007 Revised November 2010
APPENDIX 1: FIELD TRIAL SOIL RESULTS – REFINERY SITE
Arsenic
Site JWEL
Sample #
Ind. Cons.
Sample #
JWEL
As (mg/kg)
Ind. Cons.
As (mg/kg)
Absolute
Difference
%
Difference
Refinery 1A UN 5 R1 27.3 29.3 -2.0 -7.33
Refinery 1A 1X 1 R2 33.1 29.2 3.9 11.78
Refinery 1A 2X 3 R3 29.2 30.3 -1.1 -3.77
Refinery 1B CAL 5 R4 31.2 32.0 -0.8 -2.56
Refinery 2A UN 5 R5 30.3 29.7 0.6 1.98
Refinery 2A 1X 5 R6 26.0 25.3 0.7 2.69
Refinery 2A 2X 2 R7 32.4 33.2 -0.8 -2.47
Refinery 2B CAL 3 R8 16.8 18.8 -2.0 -11.90
Refinery 3A UN 5 R9 28.2 28.6 -0.4 -1.42
Refinery 3A 1X 1 R10 30.3 28.6 1.7 5.61
Refinery 3A 2X 1 R11 21.9 23.1 -1.2 -5.48
Refinery 3B CAL 3 R12 26.1 24.2 1.9 7.28
Refinery 4A UN 6 R13 32.2 29.2 3.0 9.32
Refinery 4A 1X 3 R14 24.3 24.7 -0.4 -1.65
Refinery 4A 2X 1 R15 25.3 24.2 1.1 4.35
Refinery 4B CAL 2 R16 24.3 23.1 1.2 4.94
Mean Absolute Difference
0.3
Mean % Difference
0.71

Independent Consultant QAQC Review of the Crops ERA
City of Port Colborne CBRA Page 1-2
Watters Environmental Group Inc. CONFIDENTIAL
Reference No. 04-0007 Revised November 2010
Copper
Site JWEL
Sample #
Ind. Cons.
Sample #
JWEL
Cu (mg/kg)
Ind. Cons.
Cu (mg/kg)
Absolute
Difference
%
Difference
Refinery 1A UN 5 R1 679 578 101 14.87
Refinery 1A 1X 1 R2 781 519 262 33.55
Refinery 1A 2X 3 R3 682 582 100 14.66
Refinery 1B CAL 5 R4 643 568 75 11.66
Refinery 2A UN 5 R5 625 550 75 12.00
Refinery 2A 1X 5 R6 546 500 46 8.42
Refinery 2A 2X 2 R7 629 603 26 4.13
Refinery 2B CAL 3 R8 309 293 16 5.18
Refinery 3A UN 5 R9 514 501 13 2.53
Refinery 3A 1X 1 R10 531 503 28 5.27
Refinery 3A 2X 1 R11 384 376 8 2.08
Refinery 3B CAL 3 R12 418 409 9 2.15
Refinery 4A UN 6 R13 582 547 35 6.01
Refinery 4A 1X 3 R14 532 486 46 8.65
Refinery 4A 2X 1 R15 520 477 43 8.27
Refinery 4B CAL 2 R16 454 371 83 18.28
Mean Absolute Difference
60.4
Mean % Difference
9.86
Independent Consultant QAQC Review of the Crops ERA
City of Port Colborne CBRA Page 1-3
Watters Environmental Group Inc. CONFIDENTIAL
Reference No. 04-0007 Revised November 2010
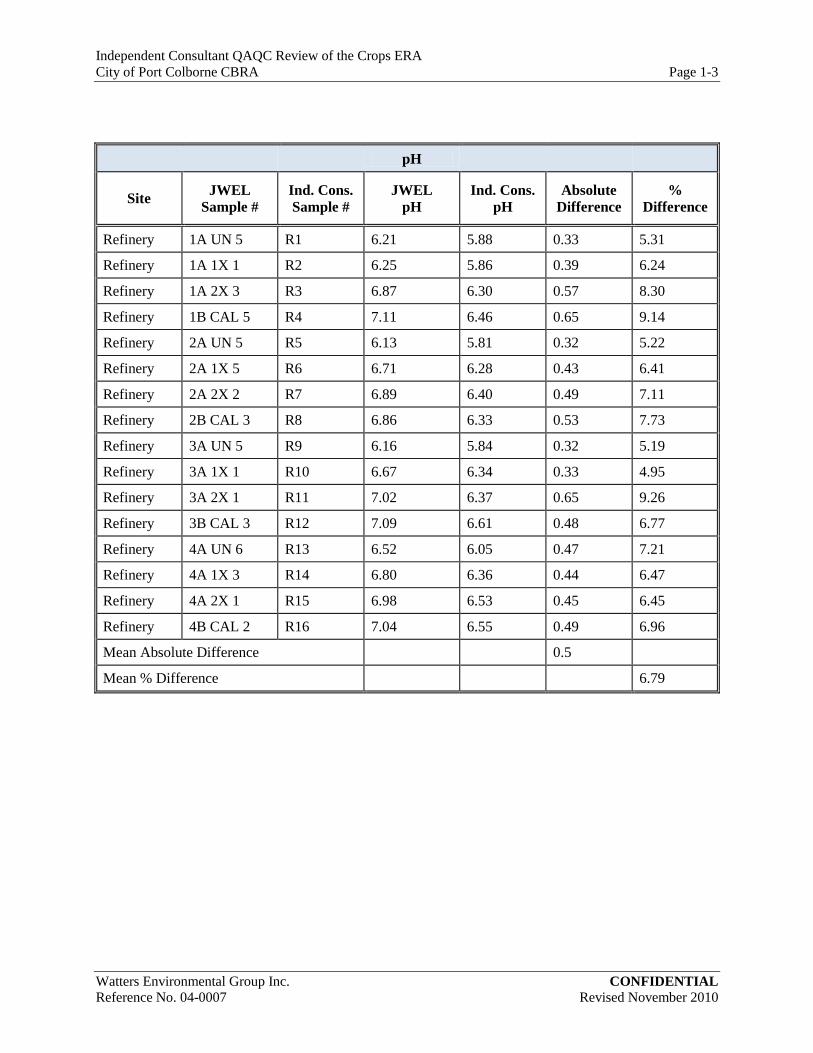
pH
Site JWEL
Sample #
Ind. Cons.
Sample #
JWEL
pH
Ind. Cons.
pH
Absolute
Difference
%
Difference
Refinery 1A UN 5 R1 6.21 5.88 0.33 5.31
Refinery 1A 1X 1 R2 6.25 5.86 0.39 6.24
Refinery 1A 2X 3 R3 6.87 6.30 0.57 8.30
Refinery 1B CAL 5 R4 7.11 6.46 0.65 9.14
Refinery 2A UN 5 R5 6.13 5.81 0.32 5.22
Refinery 2A 1X 5 R6 6.71 6.28 0.43 6.41
Refinery 2A 2X 2 R7 6.89 6.40 0.49 7.11
Refinery 2B CAL 3 R8 6.86 6.33 0.53 7.73
Refinery 3A UN 5 R9 6.16 5.84 0.32 5.19
Refinery 3A 1X 1 R10 6.67 6.34 0.33 4.95
Refinery 3A 2X 1 R11 7.02 6.37 0.65 9.26
Refinery 3B CAL 3 R12 7.09 6.61 0.48 6.77
Refinery 4A UN 6 R13 6.52 6.05 0.47 7.21
Refinery 4A 1X 3 R14 6.80 6.36 0.44 6.47
Refinery 4A 2X 1 R15 6.98 6.53 0.45 6.45
Refinery 4B CAL 2 R16 7.04 6.55 0.49 6.96
Mean Absolute Difference
0.5
Mean % Difference
6.79

Independent Consultant QAQC Review of the Crops ERA
City of Port Colborne CBRA Page 1-4
Watters Environmental Group Inc. CONFIDENTIAL
Reference No. 04-0007 Revised November 2010
Cobalt
Site JWEL
Sample #
Ind. Cons.
Sample #
JWEL
Co (mg/kg)
Ind. Cons.
Co (mg/kg)
Absolute
Difference
%
Difference
Refinery 1A UN 5 R1 88 70 18 20.45
Refinery 1A 1X 1 R2 96 60 36 37.50
Refinery 1A 2X 3 R3 93 72 21 22.58
Refinery 1B CAL 5 R4 81 71 10 12.35
Refinery 2A UN 5 R5 80 69 11 13.75
Refinery 2A 1X 5 R6 68 59 9 13.24
Refinery 2A 2X 2 R7 77 72 5 6.49
Refinery 2B CAL 3 R8 46 43 3 6.52
Refinery 3A UN 5 R9 69 66 3 4.35
Refinery 3A 1X 1 R10 67 61 6 8.96
Refinery 3A 2X 1 R11 54 49 5 9.26
Refinery 3B CAL 3 R12 58 54 4 6.90
Refinery 4A UN 6 R13 71 69 2 2.82
Refinery 4A 1X 3 R14 62 59 3 4.84
Refinery 4A 2X 1 R15 66 63 3 4.55
Refinery 4B CAL 2 R16 54 45 9 16.67
Mean Absolute Difference
9.3
Mean % Difference
11.95

Independent Consultant QAQC Review of the Crops ERA
City of Port Colborne CBRA Page 1-5
Watters Environmental Group Inc. CONFIDENTIAL
Reference No. 04-0007 Revised November 2010
Nickel
Site JWEL
Sample #
Ind. Cons.
Sample #
JWEL
Ni (mg/kg)
Ind. Cons.
Ni (mg/kg)
Absolute
Difference
%
Difference
Refinery 1A UN 5 R1 6030 4450 1580 26.20
Refinery 1A 1X 1 R2 6880 3570 3310 48.11
Refinery 1A 2X 3 R3 6260 4580 1680 26.84
Refinery 1B CAL 5 R4 5520 4510 1010 18.30
Refinery 2A UN 5 R5 5140 4100 1040 20.23
Refinery 2A 1X 5 R6 4440 3760 680 15.32
Refinery 2A 2X 2 R7 5080 4760 320 6.30
Refinery 2B CAL 3 R8 2540 2270 270 10.63
Refinery 3A UN 5 R9 4380 4110 270 6.16
Refinery 3A 1X 1 R10 4320 3770 550 12.73
Refinery 3A 2X 1 R11 3050 2660 390 12.79
Refinery 3B CAL 3 R12 3570 3240 330 9.24
Refinery 4A UN 6 R13 4510 4370 140 3.10
Refinery 4A 1X 3 R14 3940 3660 280 7.11
Refinery 4A 2X 1 R15 4120 3960 160 3.88
Refinery 4B CAL 2 R16 3280 2540 740 22.56
Mean Absolute Difference
796.9
Mean % Difference
15.59

APPENDIX 2
Field Trial Soil Results for the Hruska Site from JWEL and the Independent
Consultant
URES

Independent Consultant QAQC Review of the Crops ERA
City of Port Colborne CBRA Page 2-1
Watters Environmental Group Inc. CONFIDENTIAL
Reference No. 04-0007 Revised November 2010
APPENDIX 2: FIELD TRIAL SOIL RESULTS – HRUSKA SITE
Arsenic
Site JWEL
Sample #
Ind. Cons.
Sample #
JWEL
As (mg/kg)
Ind. Cons.
As (mg/kg)
Absolute
Difference
%
Difference
Hruska 1UN 1 H1 15.3 22.6 -7.3 -47.71
Hruska 1UN 2 H2 17.6 22.5 -4.9 -27.84
Hruska 11X 1 H3
19.8
Hruska 11X 2 H4 17.6 19.8 -2.2 -12.50
Hruska 1CAL 2 H5 16.5 21.6 -5.1 -30.91
Hruska 1CAL 3 H6 14.2 13.6 0.6 4.23
Hruska 2UN 4 H7 18.3 18.0 0.3 1.64
Hruska 2UN 5 H8 17.2 20.0 -2.8 -16.28
Hruska 21X 1 H9 22.2 20.7 1.5 6.76
Hruska 21X 2 H10 23.9 20.1 3.8 15.90
Hruska 2CAL 1 H11 18.9 15.8 3.1 16.40
Hruska 2CAL 10 H12 17.8 15.8 2.0 11.24
Hruska 3UN 2 H13 15.1 17.4 -2.3 -15.23
Hruska 3UN 3 H14 18.9 24.0 -5.1 -26.98
Hruska 31X 9 H15 3.3 16.6 -13.3 -403.03
Hruska 31X 10 H16 18.3 20.9 -2.6 -14.21
Hruska 3CAL 1 H17 20.3 19.6 0.7 3.45
Hruska 3CAL 2 H18 13.2 15.7 -2.5 -18.94
Hruska 4UN 2 H19 16.3 17.6 -1.3 -7.98
Hruska 4UN 4 H20 21.4 22.9 -1.5 -7.01
Hruska 4UN 4 H21 21.4 19.6 1.8 8.41
Hruska 4UN 7 H22 17.9 17.6 0.3 1.68
Hruska 41X 1 H23 19.4 16.3 3.1 15.98
Hruska 41X 3 H24 21.7 22.9 -1.2 -5.53
Hruska 4CAL 5 H25 17.0 19.6 -2.6 -15.29
Hruska 4CAL 6 H26 16.1 15.7 0.4 2.48
Mean Absolute Difference
-1.5
Mean % Difference
-22.45

Independent Consultant QAQC Review of the Crops ERA
City of Port Colborne CBRA Page 2-2
Watters Environmental Group Inc. CONFIDENTIAL
Reference No. 04-0007 Revised November 2010
Cobalt
Site JWEL
Sample #
Ind. Cons.
Sample #
JWEL
Co (mg/kg)
Ind. Cons.
Co (mg/kg)
Absolute
Difference
%
Difference
Hruska 1UN 1 H1 57 39 18 31.58
Hruska 1UN 2 H2 52 40 12 23.08
Hruska 11X 1 H3
52
Hruska 11X 2 H4 54 45 9 16.67
Hruska 1CAL 2 H5 53 42 11 20.75
Hruska 1CAL 3 H6 43 40 3 6.98
Hruska 2UN 4 H7 47 43 4 8.51
Hruska 2UN 5 H8 43 41 2 4.65
Hruska 21X 1 H9 52 49 3 5.77
Hruska 21X 2 H10 51 44 7 13.73
Hruska 2CAL 1 H11 41 40 1 2.44
Hruska 2CAL 10 H12 53 48 5 9.43
Hruska 3UN 2 H13 44 39 5 11.36
Hruska 3UN 3 H14 45 42 3 6.67
Hruska 31X 9 H15 41 40 1 2.44
Hruska 31X 10 H16 38 37 1 2.63
Hruska 3CAL 1 H17 43 45 -2 -4.65
Hruska 3CAL 2 H18 40 41 -1 -2.50
Hruska 4UN 2 H19 58 51 7 12.07
Hruska 4UN 4 H20 45 43 2 4.44
Hruska 4UN 4 H21 45 41 4 8.89
Hruska 4UN 7 H22 48 49 -1 -2.08
Hruska 41X 1 H23 45 46 -1 -2.22
Hruska 41X 3 H24 48 46 2 4.17
Hruska 4CAL 5 H25 42 35 7 16.67
Hruska 4CAL 6 H26 45 42 3 6.67
Mean Absolute Difference
4.2
Mean % Difference
8.33

Independent Consultant QAQC Review of the Crops ERA
City of Port Colborne CBRA Page 2-3
Watters Environmental Group Inc. CONFIDENTIAL
Reference No. 04-0007 Revised November 2010
Copper
Site JWEL
Sample #
Ind. Cons.
Sample #
JWEL
Cu (mg/kg)
Ind. Cons.
Cu (mg/kg)
Absolute
Difference
%
Difference
Hruska 1UN 1 H1 460 356 104 22.61
Hruska 1UN 2 H2 424 359 65 15.33
Hruska 11X 1 H3
432
Hruska 11X 2 H4 421 370 51 12.11
Hruska 1CAL 2 H5 436 376 60 13.76
Hruska 1CAL 3 H6 326 297 29 8.90
Hruska 2UN 4 H7 386 354 32 8.29
Hruska 2UN 5 H8 333 312 21 6.31
Hruska 21X 1 H9 417 391 26 6.24
Hruska 21X 2 H10 434 396 38 8.76
Hruska 2CAL 1 H11 361 333 28 7.76
Hruska 2CAL 10 H12 428 400 28 6.54
Hruska 3UN 2 H13 369 349 20 5.42
Hruska 3UN 3 H14 368 333 35 9.51
Hruska 31X 9 H15 344 349 -5 -1.45
Hruska 31X 10 H16 347 343 4 1.15
Hruska 3CAL 1 H17 380 376 4 1.05
Hruska 3CAL 2 H18 315 321 -6 -1.90
Hruska 4UN 2 H19 410 379 31 7.56
Hruska 4UN 4 H20 341 335 6 1.76
Hruska 4UN 4 H21 341 333 8 2.35
Hruska 4UN 7 H22 376 377 -1 -0.27
Hruska 41X 1 H23 359 350 9 2.51
Hruska 41X 3 H24 395 391 4 1.01
Hruska 4CAL 5 H25 325 281 44 13.54
Hruska 4CAL 6 H26 368 339 29 7.88
Mean Absolute Difference
26.6
Mean % Difference
6.67

Independent Consultant QAQC Review of the Crops ERA
City of Port Colborne CBRA Page 2-4
Watters Environmental Group Inc. CONFIDENTIAL
Reference No. 04-0007 Revised November 2010
Nickel
Site JWEL
Sample #
Ind. Cons.
Sample #
JWEL
Ni (mg/kg)
Ind. Cons.
Ni (mg/kg)
Absolute
Difference
%
Difference
Hruska 1UN 1 H1 3880 2640 1240 31.96
Hruska 1UN 2 H2 3430 2660 770 22.45
Hruska 11X 1 H3
3510
Hruska 11X 2 H4 3510 2930 580 16.52
Hruska 1CAL 2 H5 3460 2710 750 21.68
Hruska 1CAL 3 H6 2720 2560 160 5.88
Hruska 2UN 4 H7 3240 2980 260 8.02
Hruska 2UN 5 H8 2810 2610 200 7.12
Hruska 21X 1 H9 3570 3340 230 6.44
Hruska 21X 2 H10 3400 3010 390 11.47
Hruska 2CAL 1 H11 2850 2770 80 2.81
Hruska 2CAL 10 H12 3430 3150 280 8.16
Hruska 3UN 2 H13 3000 2640 360 12.00
Hruska 3UN 3 H14 3130 2900 230 7.35
Hruska 31X 9 H15 2770 2650 120 4.33
Hruska 31X 10 H16 2600 2620 -20 -0.77
Hruska 3CAL 1 H17 3010 3160 -150 -4.98
Hruska 3CAL 2 H18 2550 2610 -60 -2.35
Hruska 4UN 2 H19 3870 3340 530 13.70
Hruska 4UN 4 H20 2940 2920 20 0.68
Hruska 4UN 4 H21 2940 2800 140 4.76
Hruska 4UN 7 H22 3160 3220 -60 -1.90
Hruska 41X 1 H23 2950 3020 -70 -2.37
Hruska 41X 3 H24 3250 3150 100 3.08
Hruska 4CAL 5 H25 2630 2190 440 16.73
Hruska 4CAL 6 H26 2990 2850 140 4.68
Mean Absolute Difference
266.4
Mean % Difference
7.90

Independent Consultant QAQC Review of the Crops ERA
City of Port Colborne CBRA Page 2-5
Watters Environmental Group Inc. CONFIDENTIAL
Reference No. 04-0007 Revised November 2010
pH
Site JWEL
Sample #
Ind. Cons.
Sample #
JWEL
pH
Ind. Cons.
pH
Absolute
Difference
%
Difference
Hruska 1UN 1 H1 5.64 5.33 0.31 5.50
Hruska 1UN 2 H2 5.68 5.39 0.29 5.11
Hruska 11X 1 H3
5.91
Hruska 11X 2 H4 6.02 5.90 0.12 1.99
Hruska 1CAL 2 H5 6.77 6.49 0.28 4.14
Hruska 1CAL 3 H6 6.70 6.54 0.16 2.39
Hruska 2UN 4 H7 5.76 5.25 0.51 8.85
Hruska 2UN 5 H8 5.61 5.21 0.40 7.13
Hruska 21X 1 H9 5.96 5.85 0.11 1.85
Hruska 21X 2 H10 6.11 5.76 0.35 5.73
Hruska 2CAL 1 H11 6.51 6.45 0.06 0.92
Hruska 2CAL 10 H12 6.64 6.47 0.17 2.56
Hruska 3UN 2 H13 5.77 5.44 0.33 5.72
Hruska 3UN 3 H14 5.60 5.32 0.28 5.00
Hruska 31X 9 H15 6.45 6.02 0.43 6.67
Hruska 31X 10 H16 6.28 5.82 0.46 7.32
Hruska 3CAL 1 H17 6.86 6.45 0.41 5.98
Hruska 3CAL 2 H18 6.93 6.59 0.34 4.91
Hruska 4UN 2 H19 5.50 5.08 0.42 7.64
Hruska 4UN 4 H20 5.46 5.09 0.37 6.78
Hruska 4UN 4 H21 5.46 5.11 0.35 6.41
Hruska 4UN 7 H22 5.05 5.15 -0.10 -1.98
Hruska 41X 1 H23 5.98 5.90 0.08 1.34
Hruska 41X 3 H24 5.93 5.74 0.19 3.20
Hruska 4CAL 5 H25 6.55 6.53 0.02 0.31
Hruska 4CAL 6 H26 6.57 6.55 0.02 0.30
Mean Absolute Difference
0.3
Mean % Difference
4.23
APPENDIX 3
Greenhouse Soil Results from JWEL and the Independent Consultant
Independent Consultant QAQC Review of the Crops ERA
City of Port Colborne CBRA Page 3-1
Watters Environmental Group Inc. CONFIDENTIAL
Reference No. 04-0007 Revised November 2010
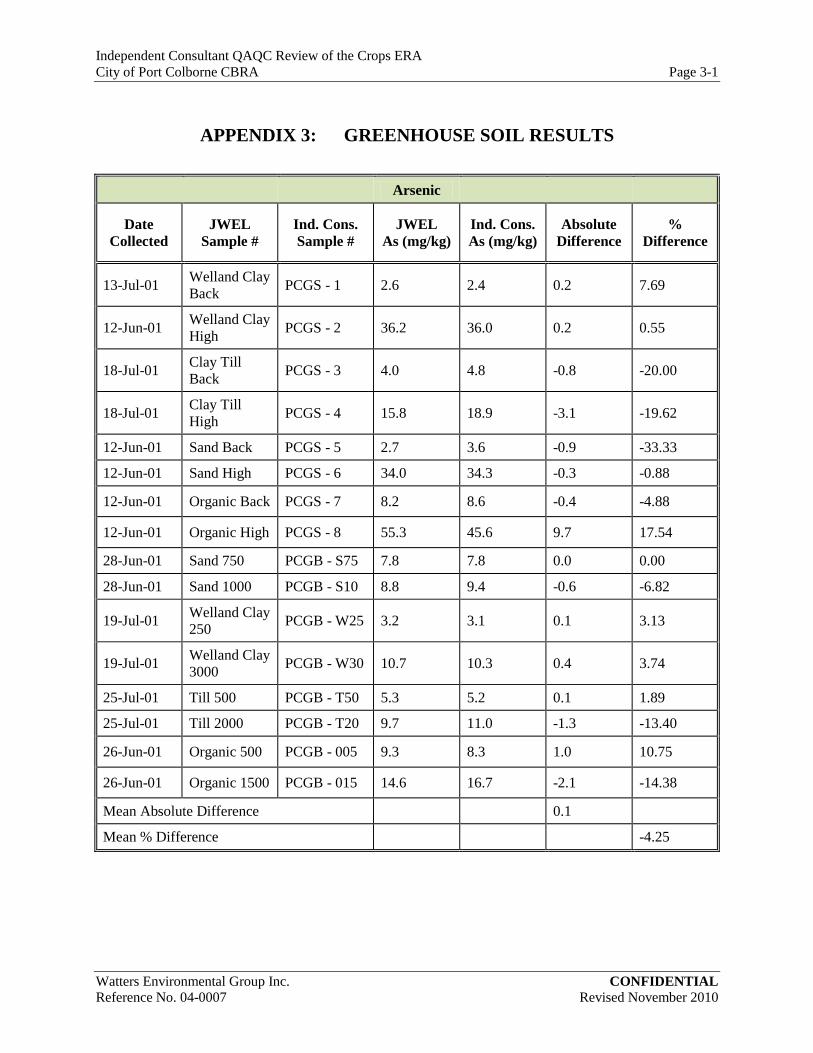
APPENDIX 3: GREENHOUSE SOIL RESULTS
Arsenic
Date
Collected
JWEL
Sample #
Ind. Cons.
Sample #
JWEL
As (mg/kg)
Ind. Cons.
As (mg/kg)
Absolute
Difference
%
Difference
13-Jul-01 Welland Clay
Back PCGS - 1 2.6 2.4 0.2 7.69
12-Jun-01 Welland Clay
High PCGS - 2 36.2 36.0 0.2 0.55
18-Jul-01 Clay Till
Back PCGS - 3 4.0 4.8 -0.8 -20.00
18-Jul-01 Clay Till
High PCGS - 4 15.8 18.9 -3.1 -19.62
12-Jun-01 Sand Back PCGS - 5 2.7 3.6 -0.9 -33.33
12-Jun-01 Sand High PCGS - 6 34.0 34.3 -0.3 -0.88
12-Jun-01 Organic Back PCGS - 7 8.2 8.6 -0.4 -4.88
12-Jun-01 Organic High PCGS - 8 55.3 45.6 9.7 17.54
28-Jun-01 Sand 750 PCGB - S75 7.8 7.8 0.0 0.00
28-Jun-01 Sand 1000 PCGB - S10 8.8 9.4 -0.6 -6.82
19-Jul-01 Welland Clay
250 PCGB - W25 3.2 3.1 0.1 3.13
19-Jul-01 Welland Clay
3000 PCGB - W30 10.7 10.3 0.4 3.74
25-Jul-01 Till 500 PCGB - T50 5.3 5.2 0.1 1.89
25-Jul-01 Till 2000 PCGB - T20 9.7 11.0 -1.3 -13.40
26-Jun-01 Organic 500 PCGB - 005 9.3 8.3 1.0 10.75
26-Jun-01 Organic 1500 PCGB - 015 14.6 16.7 -2.1 -14.38
Mean Absolute Difference
0.1
Mean % Difference
-4.25

Independent Consultant QAQC Review of the Crops ERA
City of Port Colborne CBRA Page 3-2
Watters Environmental Group Inc. CONFIDENTIAL
Reference No. 04-0007 Revised November 2010
Cobalt
Date
Collected
JWEL
Sample #
Ind. Cons.
Sample #
JWEL
Co (mg/kg)
Ind. Cons.
Co (mg/kg)
Absolute
Difference
%
Difference
13-Jul-01 Welland Clay
Back PCGS - 1 5 6 -1 -20.00
12-Jun-01 Welland Clay
High PCGS - 2 115 109 6 5.22
18-Jul-01 Clay Till
Back PCGS - 3 7 6 1 14.29
18-Jul-01 Clay Till
High PCGS - 4 47 46 1 2.13
12-Jun-01 Sand Back PCGS - 5 2 5 -3 -150.00
12-Jun-01 Sand High PCGS - 6 73 67 6 8.22
12-Jun-01 Organic Back PCGS - 7 6 7 -1 -16.67
12-Jun-01 Organic High PCGS - 8 154 142 12 7.79
28-Jun-01 Sand 750 PCGB - S75 13 13 0 0.00
28-Jun-01 Sand 1000 PCGB - S10 15 17 -2 -13.33
19-Jul-01 Welland Clay
250 PCGB - W25 7 6 1 14.29
19-Jul-01 Welland Clay
3000 PCGB - W30 36 30 6 16.67
25-Jul-01 Till 500 PCGB - T50 10 10 0 0.00
25-Jul-01 Till 2000 PCGB - T20 28 26 2 7.14
26-Jun-01 Organic 500 PCGB - 005 9 12 -3 -33.33
26-Jun-01 Organic 1500 PCGB - 015 24 29 -5 -20.83
Mean Absolute Difference
1
Mean % Difference
-11.15
Independent Consultant QAQC Review of the Crops ERA
City of Port Colborne CBRA Page 3-3
Watters Environmental Group Inc. CONFIDENTIAL
Reference No. 04-0007 Revised November 2010
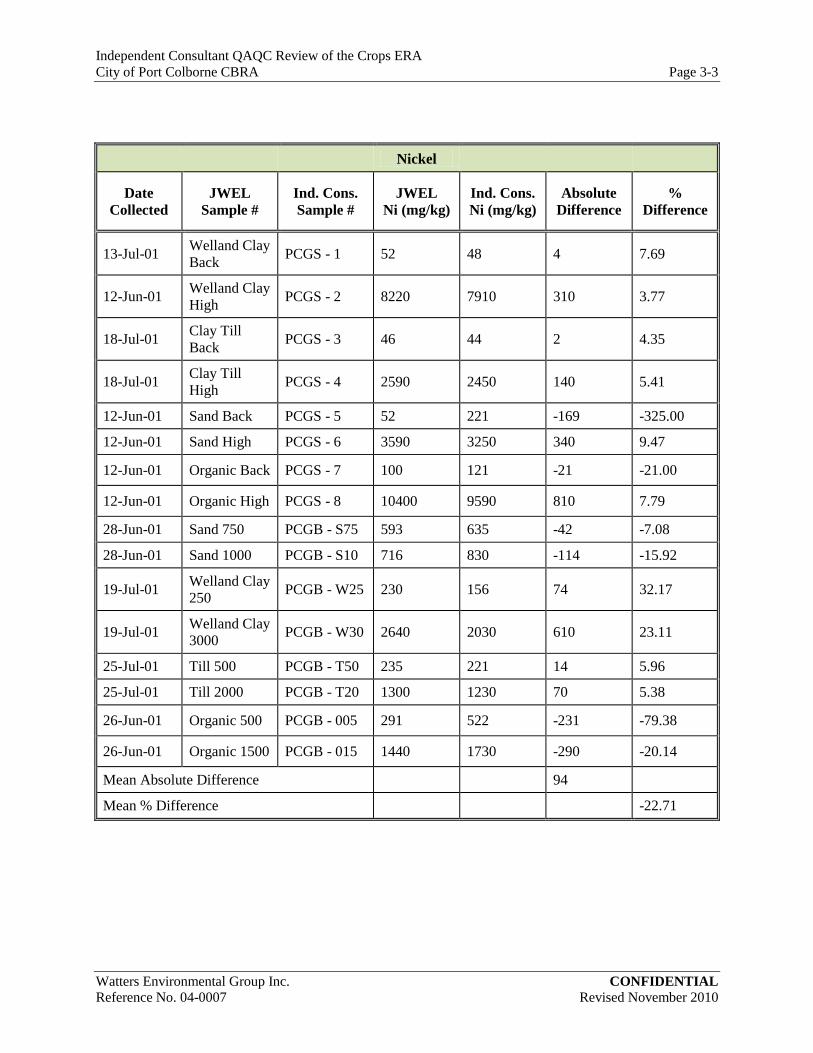
Nickel
Date
Collected
JWEL
Sample #
Ind. Cons.
Sample #
JWEL
Ni (mg/kg)
Ind. Cons.
Ni (mg/kg)
Absolute
Difference
%
Difference
13-Jul-01 Welland Clay
Back PCGS - 1 52 48 4 7.69
12-Jun-01 Welland Clay
High PCGS - 2 8220 7910 310 3.77
18-Jul-01 Clay Till
Back PCGS - 3 46 44 2 4.35
18-Jul-01 Clay Till
High PCGS - 4 2590 2450 140 5.41
12-Jun-01 Sand Back PCGS - 5 52 221 -169 -325.00
12-Jun-01 Sand High PCGS - 6 3590 3250 340 9.47
12-Jun-01 Organic Back PCGS - 7 100 121 -21 -21.00
12-Jun-01 Organic High PCGS - 8 10400 9590 810 7.79
28-Jun-01 Sand 750 PCGB - S75 593 635 -42 -7.08
28-Jun-01 Sand 1000 PCGB - S10 716 830 -114 -15.92
19-Jul-01 Welland Clay
250 PCGB - W25 230 156 74 32.17
19-Jul-01 Welland Clay
3000 PCGB - W30 2640 2030 610 23.11
25-Jul-01 Till 500 PCGB - T50 235 221 14 5.96
25-Jul-01 Till 2000 PCGB - T20 1300 1230 70 5.38
26-Jun-01 Organic 500 PCGB - 005 291 522 -231 -79.38
26-Jun-01 Organic 1500 PCGB - 015 1440 1730 -290 -20.14
Mean Absolute Difference
94
Mean % Difference
-22.71

Independent Consultant QAQC Review of the Crops ERA
City of Port Colborne CBRA Page 3-4
Watters Environmental Group Inc. CONFIDENTIAL
Reference No. 04-0007 Revised November 2010
Copper
Date
Collected
JWEL
Sample #
Ind. Cons.
Sample #
JWEL
Cu (mg/kg)
Ind. Cons.
Cu (mg/kg)
Absolute
Difference
%
Difference
13-Jul-01 Welland Clay
Back PCGS - 1 20 18 2 10.00
12-Jun-01 Welland Clay
High PCGS - 2 992 906 86 8.67
18-Jul-01 Clay Till
Back PCGS - 3 16 16 0 0.00
18-Jul-01 Clay Till
High PCGS - 4 333 338 -5 -1.50
12-Jun-01 Sand Back PCGS - 5 13 31 -18 -138.46
12-Jun-01 Sand High PCGS - 6 416 389 27 6.49
12-Jun-01 Organic Back PCGS - 7 43 47 -4 -9.30
12-Jun-01 Organic High PCGS - 8 1590 1330 260 16.35
28-Jun-01 Sand 750 PCGB - S75 74 78 -4 -5.41
28-Jun-01 Sand 1000 PCGB - S10 88 101 -13 -14.77
19-Jul-01 Welland Clay
250 PCGB - W25 35 29 6 17.14
19-Jul-01 Welland Clay
3000 PCGB - W30 282 238 44 15.60
25-Jul-01 Till 500 PCGB - T50 38 40 -2 -5.26
25-Jul-01 Till 2000 PCGB - T20 174 172 2 1.15
26-Jun-01 Organic 500 PCGB - 005 78 99 -21 -26.92
26-Jun-01 Organic 1500 PCGB - 015 230 255 -25 -10.87
Mean Absolute Difference
21
Mean % Difference
-8.57

Independent Consultant QAQC Review of the Crops ERA
City of Port Colborne CBRA Page 3-5
Watters Environmental Group Inc. CONFIDENTIAL
Reference No. 04-0007 Revised November 2010
pH
Date
Collected
JWEL
Sample #
Ind. Cons.
Sample #
JWEL
pH
Ind. Cons.
pH
Absolute
Difference
%
Difference
13-Jul-01 Welland Clay
Back PCGS - 1 6.52 6.26 0.26 3.99
12-Jun-01 Welland Clay
High PCGS - 2 5.85 5.76 0.09 1.54
18-Jul-01 Clay Till
Back PCGS - 3 5.57 5.25 0.32 5.75
18-Jul-01 Clay Till
High PCGS - 4 6.1 5.84 0.26 4.26
12-Jun-01 Sand Back PCGS - 5 7.16 6.81 0.35 4.89
12-Jun-01 Sand High PCGS - 6 7.2 6.82 0.38 5.28
12-Jun-01 Organic Back PCGS - 7 5.9 5.57 0.33 5.59
12-Jun-01 Organic High PCGS - 8 5.44 5.34 0.10 1.84
28-Jun-01 Sand 750 PCGB - S75 7.15 6.96 0.19 2.66
28-Jun-01 Sand 1000 PCGB - S10 7.18 6.96 0.22 3.06
19-Jul-01 Welland Clay
250 PCGB - W25 6.5 6.25 0.25 3.85
19-Jul-01 Welland Clay
3000 PCGB - W30 5.94 5.99 -0.05 -0.84
25-Jul-01 Till 500 PCGB - T50 5.65 5.39 0.26 4.60
25-Jul-01 Till 2000 PCGB - T20 5.99 5.69 0.30 5.01
26-Jun-01 Organic 500 PCGB - 005 5.72 5.62 0.10 1.75
26-Jun-01 Organic 1500 PCGB - 015 5.68 5.56 0.12 2.11
Mean Absolute Difference
0.22
Mean % Difference
3.46

APPENDIX 4
Laboratory Certificates-of-Analyses for the Field Trial Soils from the
Refinery Site


APPENDIX 5
Laboratory Certificates-of-Analyses for the Field Trial Soils from the
Hruska Site


APPENDIX 6
Laboratory Certificates-of-Analyses for the Greenhouse Studies


![Microsoft PowerPoint - QAQC Presentation_GIS_DAY.ppt [Compatibility Mode]](https://static.fdocuments.net/doc/165x107/56d6bd851a28ab30168e507e/microsoft-powerpoint-qaqc-presentationgisdayppt-compatibility-mode.jpg)