Final lieport, Univ. Health Center) Uncl as HC ~03/flE A01 ...
46
(NASA-CR-161487) COtIliTERCURBENT 180-27G69 DXSTRIBUIION OF BIOLOGICAI CELLS Final lieport, 1 Jan. 1978 - 31 Har. 1979 (Oregon Univ. Health Sciences Center) 46 p Uncl as HC ~03/flE A01 CSCL 06C 63/51 27915 FINAL REPORT COUNTERCURRENT DISTRIBUTION OF BIOLOGICAL CELLS January 1, 1978-March 31, 1979 Contract No. NAS8-32817 Principal Investigator : D. E. Brooks Prepared for: National Aeronautics and Space Administration George C. Marshall Space Flight Center Marshall Space Flight Center, Alabama 35812 Department of Neurology University of Oregon Health Sciences Center 3181 S. W. Sam Jackson Park Road Portland, Oregon 97201
Transcript of Final lieport, Univ. Health Center) Uncl as HC ~03/flE A01 ...
(NASA-CR-161487) COtI l iTERCURBENT 180-27G69 DXSTRIBUIION OF B I O L O G I C A I CELLS Final lieport, 1 Jan. 1978 - 31 Har. 1979 (Oregon Univ. Health Sciences Center) 46 p Uncl as HC ~ 0 3 / f l E A01 CSCL 06C 63/51 27915
FINAL REPORT
COUNTERCURRENT DISTRIBUTION OF BIOLOGICAL CELLS
January 1, 1978-March 31, 1979
Contract No. NAS8-32817
Principal Investigator : D. E. Brooks
Prepared for:
National Aeronautics and Space Administration George C. Marshall Space Flight Center
Marshall Space Flight Center, Alabama 35812
Department of Neurology University of Oregon Health Sciences Center
3181 S. W. Sam Jackson Park Road Portland, Oregon 97201
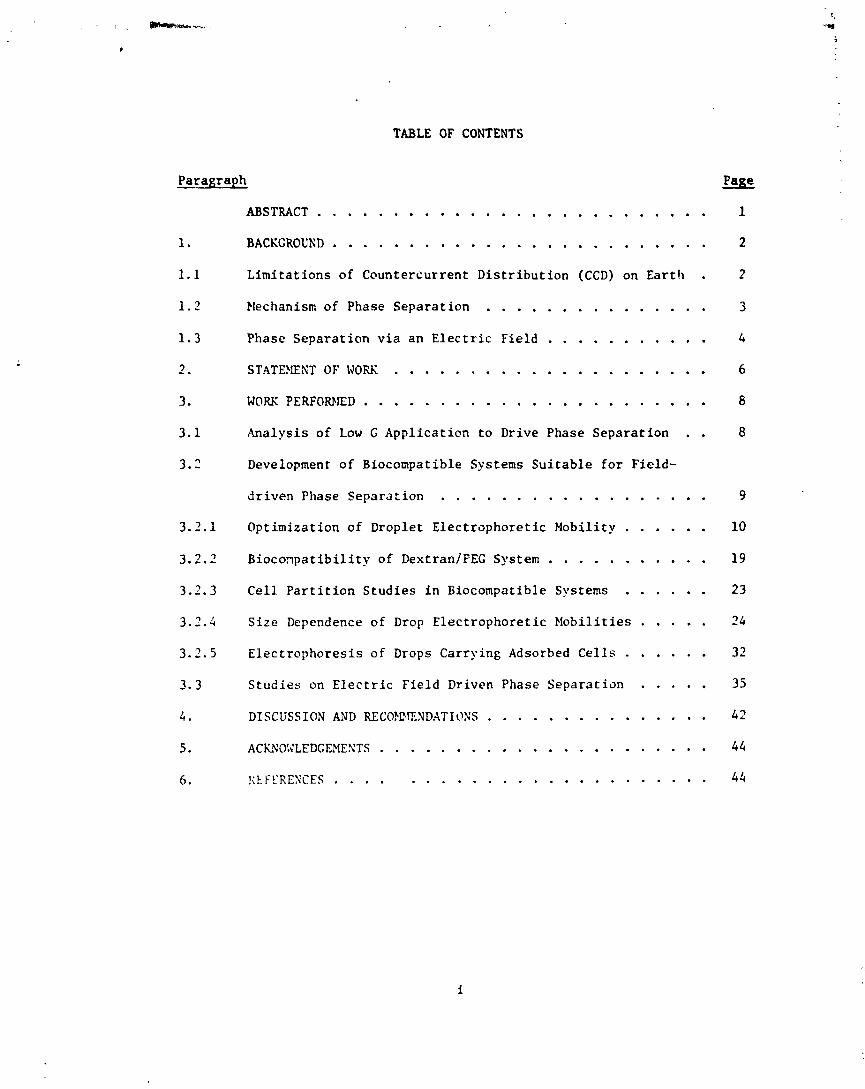
TABLE OF CONTENTS
Paragraph Page
ABSTRACT . . . . . . . . . . . . . . . . . . . . . . . . . . 1
1 . BACKGROUXD . . . . . . . . . . . . . . . . . . . . . . . . . 2
1.1 Limitations of Countercurrent Distribution (CCD) on Earth . 2
1.2 Plechanism of Phase Separation . . . . . . . . . . . . . . . 3
1.3 Phase Separation via an Electric Field . . . . . . . . . . . 4
3 .. STATEPENTOFWOK . . . . . . . . . . . . . . . . . . . . . 6
3 . WORK PERFORMED . . . . . . . . . . . . . . . . . . . . . . . 8
3.1 Analysis of Low G Application to Drive Phase Separation . . 8
3.2 Development of Biocompatible Systems Suitable for Field-
driven Phase Separation . . . . . . . . . . . . . . . . . . 9
3.2.1 Optimization of Droplet Electrophoretic Mobility . . . . . . 10
3 . 2 . 2 Bioconpatibility of Destran/FEC System . . . . . . . . . . . 19
3.2.3 Cell . Partition Studies in Biocompatible Systems . . . . . . 23
3.2.4 Size Dependence of Drop Electrophoretic Plobilities . . . . . 24
3.2.5 Electrophoresis of Drops Carrying Adsorbed Cells . . . . . . 32
3.3 Studies on Electric Field Driven Phase Separation . . . . . 35
. . . . . . . . . . . . . . . 4 . DISCUSS ION AND RECO?EIF,ND.ITIL.XS 42
. . . . . . . . . . . . . . . . . . . . . . 5 . ACLNO!JLEDGDfEXTS 44
. . . . . . . . . . . . . . . . . . . . . . . . 6 . KLFCRENCES 44
ABSTRACT
Basic studies have been made aimed at developing electric field driven
phase separation as a method for carrying out biological cell partition
studies in a reduced p.ravity environment. A neutral polsmer phase system
consistins of 7.5': destran 40 /4 .52 PEG 6, 0.11 lf Na phosphate, 5: fetal
bovine serum (FBS?, pH 7.5, has been developed which has a high phase droplet
electrophoretic mobility and retains cell viability over many hours. In
this and related systems the drop mobility is a linear function of drop
size, at least in the range 4 um-30 pm diameter. Drop mobility can be readily
varied by fractionally replacing phosphats with chloride, with nu loss of
cell viability. Adsorption of cells to the phase boundary has a minimal
effect on the electrophoresis of top phase, PEG-rich drops and decreases
bottom phase drop mobilities by aoout 25:i. Application of an electric field
of 4.5 v cm'l to a system containing 10:: v/v bottom phase cleared the system
more than two orders of magnitude faster than in the absence of the field.
At higher bottom phase concentrations a secondary phenomenon intervened in
the field driven separations which resulted in an increase in turbidity
after clearing had commenced. The increase was associated with a dilution
of the phase system in the chamber. The effect depended on the presence
of the electric field. It may he due to electroosmotic flow of buffer
through the Amicon membranes int~b the sample chamber and flow of phasc
systen; out into the rinse stream. Strategies to eliminate this problem
are proposed.

1. BACKGROUND
1.1 L i m i t a t i o n s of Countercurrent D i s t r i b u t i o n (CCD) on Ear th
Countercurrent d i s t r i b u t i o n of c e l l s has been app l i ed w i t h g r e a t s u c c e s s
t o r e l a t i v e l y small b i o l o g i c a l c e l l s , such as e r y t h r o c y t e s and lymphocytes.
However, t h e r e a r e a v a r i e t y of c e l l types such a s megakaryocytes, many tumor
c e l l and t i s s u e c u l t u r e l i n e s which a r e too l a r g e and/or dense t o be s e p a r a t e d
s u c c e s s f u l l y on e a r t h . Such c e l l s do no t remkin I n suspension long enough t o
a l low t h e phases t o s e p a r a t e and permit a t r a n s f e r a long t h e coun te rcur ren t
t r a i n .
I n a on€ g environment, t h e p a r t i t i o n of c e l l s i n phase-separated aqueous
polymer systems i s no t an equ i l ib r ium process . Although t h e phases themselves
can r e a d i l y be brought t o equ i l ib r ium, t h e d i s t r i b u t i o n of p a r t i t i o n e d m a t e r i a l
i s t ime dependent due t o sedimenta t ion. Only a f t e r a l l t h e c e l l s have
sedimented t o t h e phase boundary o r t h e bottom of t h e c o n t a i n e r w i l l t h e
d i s t r i b u t i o n be stat ionary--and then of no use. The dez ree t o which t h e non-
s t a t i o n a r y n a t u r e of t h e d i s t r i b u t i o n a f f e c t s t h e u s e f u l n e s s of p a r t i t i o n
depends on t h e sedimenta t ion r a t e of t h e c e l l s i n t h e a p p r c p r i a t e phase--that
is , on t h e c e l l s i z e , shape, and d e n s i t y and on t h e phase d e n s i t y and v i s c o s i t y .
Since c e l l p a r t i t i o n u s u a l l y occurs between t h e t o p , PEG-rich phase and t h e
i n t e r f a c e , l a r g e c e l l s o r c e l l clumps w i l l sediment i n t o the i n t e r f a c e from
t h e top phase dur ing t h e time i t t a k e s f o r t h e phases t o s e p a r a t e , d i s t o r t i n g
< h e t r u e , equ i l ib r ium d i s t r i b u t i o n . I f CCD is performed on such suspens ions ,
t h e m a t e r i a l t r a n s f e r r e d a s the top phase w i l l not con ta in a l l t h e c e l l s t h a t
belong i n t h a t phase and the bottom phase w i l l c o n t a i n t h e c e l l s t h a t have
sedimented i n t o t h e i n t e r f a c i a l r eg ion a s we l l a s those t h a t a r e t r u l y
adsorbed t h e r e . This gravi ty-dr iven accumulation has two r e l a t e d e f f e c t s on
t t ~ c CCD:

It reduces the resolution of separation for all cells with a
finite sedimentation rate; the CCD curves obtained for most
cell types will therefore represent only a fraction of the
separation in principle poc,:ible.
It eliminates the use of this separation technique entirely
for sufficiently large cells.
1.2 Plechanism of Phase Separation
Countercurrent distribution with two phase aqueous polymer systems
can be :~uccessfully applied on earth because phase separation occurs
sufficiently rapidly that the 6O to 120 transfers necessary for many
separations can be accomplished in a reasonable length of tine. Under the
best conditions, using a thin layer CCD apparatus to minimize the phase
thickness, it takes five minutes for dextran!PEG phases to separate, result-
ing in run times of up to 10 hours. Phase separation at one g is driven by
two mechanisms :
1. convective forces caused by the density difference between the
phases ;
2 . interfacial free energy which tends to minimize the interfacial
area between the phases.
In a low g environmect the convective forces will be too small to
produce phase separation in an acceptable length of time (% 5 min). More-
over, it is known that the interfacial tensions developed in these systems
are also too small (10-~-10-~ dyne cm'l) to be effective in driving separation.
This conclusion is based on the behavior of dextran/Fjcoll phase systems
which can be made with phases of equal density; such systems take many hours
to separate after mixing. An external driving force must therefore be applied
i f p a r t i t i o n experiments are t o be c a r r i e d ou t i n zero g.
1.3 Phase Separat ion v i a an E l e c t r i c F i e l d
The approach we have taken t o producing phase s e p a r a t i o n by a n
e x t e r n a l f o r c e invo lves t h e a p p l i c a t i o n of a smal l e l e c t r i c f i e l d a c r o s s
t h e system. This technique was suggested by t h e observa t ion (1) t h a t
d r o p l e t s of one phase suspended i n t h e o t h e r had an e a s i l y measurable
e l e c t r o p h o r e t i c mobi l i ty . Moreover, t h e mobi l i ty was found t o be a l i n e a r l y
i n c r e a s i n g f u n c t i o n of d r o p l e t s i z e , up t o a t l e a s t 1 5 um diameter. The
phase systems t h e r e f o r e fo l low t o some e x t e n t t h e behavior p r e d i c t e d by
Levich (2) and Levine's (3) theory o f t h e e l e c t r o p h o r e s i s of mercury drops
i n i o n i c s o l u t i o n s which p r e d i c t s such a dependence. The s i g n of t h e
m o b i l i t y i n v e r t s depending on which of t h e two phases is d i spersed ( i . e . ,
depending on which s i d e of t h e i n t e r f a c e is e x t e r n a l i z e d ) . Applying an
e x t e r n a l f i e l d w i l l t h e r e f o r e d r i v e d r o p l e t s of each phase i n o p p o s i t e
d i r e c t i o n s and , in p r i n c i p l e , induce phase separa t ion .
The p r i n c i p l e o f f i e ld -dr iven phase s e p a r a t i o n has now been . e r i f i e d
i n a s e r i e s of experiments supported by t h e NASA SET program. A phase
s e p a r a t i o n chamber a c r o s s which a knovm e l e c t r i c f i e l d can be app l ied was
cons t ruc ted by t h e Advanced Technology Operat ions Div i s ion of Beckman
Instruments. The appara tus c o n s i s t s of two e l e c t r o d e chambers con ta in ing
b r i g h t P t e l e c t r o d e s separa ted from a phase chamber (5 cm L x 0.5 cm W x
0.2 cm deep) by two Arnicon Dl-100 membranes. Feeder p o r t s g i v e access t o
t h e chamber f o r f i l l i n g and drainage. E lec t rode r i n s e b u f f e r is c i r c u l a t e d
through t h e upper and lower e l e c t r o d e chambers t o remove e l e c t r o d e r e a c t i o n
producto. The chamber and e l e c t r o d e assembly i s made of poly(methy1 rneth-
a c r y l a t e ) lapped and pol ished t o provide a good s e a l between t h e upper and

lower halves. The optical system used to follow phase separation turbtdi-
metrically consists of a small ruby laser whose beam diameter is limited to
Q 0.03 cm by an entrance aperture. The beam traverses the width of the
phase chamber at a vertical position which can be adjusted relative to the
midline. The beam intensity is measured with a solid stare detector and
amplifier after traversing the chamber and an 0.03 cm diameter exit aperture.
When 3 turbid mixed phase system is introduced into the chamber most
of the light is scattered off the optical axis and the photodetector output
is low. As the phases separate, the upper and lower phases clear, the
scattering decreases and the detector output increases with time, reflect-
ing the kinetics of separation. Experiments may be run in the presence or
absence of the electric field and the kinetics readily compared.
The first experiments carried out to demonstratp field-driven phase
separation utilized a system which exhibits very high phase drop mobilities
(%215-17 x lom4 ctn2 s-I v - ~ for a 6.5 um diameter drop). The polymers used
were sodium dextran sulfate (8% wlw) andqluronic P-104 (a block co-polymer
of polyethylene glycol and polypropylene glycol; 8% wlw), their solutions
containing 0.2 11 Kgcitrate. This phase system is not compatible with
biological cells (the dextran sulfate is toxic in high concentrations) but
was chosen to maximize the likelihood of demonstrating the effects of an
applied electric field in the presence of gravity-driven separation.
At phase volume ratios of 9 parts top phase:l part bottom phase the
effects of the electric field, E, were dramatic: at E 5 V cm'l the
initial slope of the light transmission vs time curve was up to 35 times
greater than at E = 0. The phases cleared completely in 1 to 2 minutes in
the field compared to 10-15 minutes in its absence. Application of the electric
field was obviously successful in driving phase separation in this system.
The current contract was awarded to continue work on electric field
driven phase separation, particularly to demonstrate the effect in a phase
system compatible with biological cells. The specific tasks to be
addressed are listed in the Statement of Work.
2. STATEMENT OF WORK
This work statenent covers work to be done to develop the capability
of countercurrent distribution of biological cells in space. The work
continues a preliminary assessment of the feasibility of the concept during
which electrophoretic separztion of .;he phases was demonstrated in apparatus
designed with flight experimentation in mind. At the same time, the
advantages of the space environment for countercurrent distribution of
cells was established. The following tasks should develop the capabilities
of this technique for use in space on an early Shuttle mission.
Task I
Techniques to separate the phases for both manned and automated
operation shall be developed. Emphasis now shall be placed on exploring
simple demonstrations of phase separation in weightlessness to determine
the crucial parameters of the operation, e.g. completeness of the phase and
cell separations and times required, fluid handling procedures and operational
measurements. The use of slow rotations to impose a small gravity force to
separate the phases (analogous to the separation of phases on Earth) shall
be investigated analytically and experimentally since this operation could
be used during an early Shuttle mission. Any advantages of inserting the
cells before or after the separation of phases by rotation should be
investigated. The availability of manned operation in the various transfer
steps of CCD should be examined. It must be kept in mind that the early
space exprrlmente can be exploratory to clearly show the capabilitlee of
CCD and answer questions raised by ground experiments.
Task I1
The electrophoretic separation of phases offers different advantages
and problems to CCD that have been identified during the past year. During
this year:
a) Phase compositions shall be studied to maximize the phase drop
el=ccrophoretic mobility while maintaining compatibility with biological
cells and a sufficient bulk phase potential difference to provide useful
cell part it ions. The phase forming polymers used in preliminary experiments
were not compatible with living cells.
b) Droplet electrophoresis shall be carried out with cells adsorbed at
the interfacs to determine the effects of such adsorption on droplet
mobility and to allow estimation of the maximum cell numberlphase volume
ratio feasible.
c) Drop acceleration in an electric field should allow one to make
distributions, and determine partition coefficients, on the ground by
deducting a small "blank value" due to gravity phase separation from the
results of rapid phase separation by electrophoresis.
d) Candidate phase systems will be allowed to phase separate in the
presence and absence of an electric field, with and without cells, to
attempt to estimate the effects of the field on cell partition, and the
maximum feasible strength.
Task I11
Chamber coatings will be tested for differential wettability by the
separated phases in order to maximize the driving forces for phase
localization. Polymeric coatings which in solution would phase separate
with one of the phase polymers but not the other would seem to be likely
candidates as coating materials. The ridge concept as an alternative method
for phase localization will have to be tested. Testing will establish if
this can be done in tubes of small diameter where interfacial effects are
increased and gravitational effects reduced.
Task IV
The contractor shall recommend a sequence of space and ground experiments
and the rationale to pursue countercurrent distribution of cells. The space
experiments should be identified to answer specific questions instead of
fitting into an available schedule of flight opportunities.
3. WORK PERFORMED
3.1 Analysis of Low G Application to Drive Phase Separation
As pointed out in 1.1, the finite sedimentation rate of cells produces
a non-stationary distribution of particles in the phase system during, and
following, phase separation. In the absence of gravity such sedimentation
will not occuw, but neither can the phases be expected to separate since
their de3sitj difference will no longer result in significant convective
motion. It has been suggested that application of a low centrifugal accel-
eration might provide enough convection to cause phase separation while not
producing sufficient cell sedimentation to adversely affect the partition
coefficient. The following simple argument strongly suggests that this
idea is not correct, however.
If a phase system is observed immediately after mixing,the entire
volume is initially occupied by emulsion and appears cloudy. As separation
begins, clear regions of pure upper and lower phase appear at the upper and
lower boundaries of the sample. The regions increase in height at the
expense of the t:hickness of the emulsion region as separation progresses.
Eventually the thinning emulsion contracts into a planar interface
separating the upper and lower phase. If cells are present in the system,
some of those which partition into the top phase will appear in the small
volume of top phase present at the top of the sample volume early in the
phase separation. As the emulsion interface recedes beneath these cells
they will begin to sediment with a velocity which, as given by the Stokes
expression, is proportional to the acceleration of gravity.
If the effect of cell sedimentation on the final distribution of cells
between the upper phase and interface is to be small upon completion of
phase separation, the cell sedimentation rate must be much less than the
velocity with which the emulsion interface settles. The interface settling
velocity will be detzrmined prima ily by the rate at which the individual
emulsion drops se6iment, although droplet-droplet interactions and secondary
flocus obviously will complicate the interpretation. The emulsion drop
sedimentation velocity will also be proportional to the acceleration
vector, however. Hence, the ratis ~f ce11 settling velocity to interface
settling velocity will be independent of the acceleration applied to the
system, as both rates are scaled by g. Since it is this relative cell
settling velocity which determines the degree to which the parti'-ion
technique can be applied to cell separati~n, varying the acceleration vector
in the system cannot prdvide any enhancement in performance over th-t
available at one g. Only a force which differs in its effect on the cells
and emulsion drops--such as that produced by an electric field--can
provide the recults sought.
3.2 Development of Biocompatible Systems Suitable for Field-driven Phase
Separation
3.2.1 Optimization of Droplet E lec t rophore t ic Mobi l i ty
Since t h e r a t e a t which t h e phases w i l l s epa ra t e i n an e l e c t r i c
f i e l d w i l l depend d i r e c t l y on t h e e l ec t rophore t i c mobil i ty of t h e phase
drops, var ious manipulations were ca r r i ed out t o t r y and maximize drop
mobili ty while maintaining biocompatibi l i ty and t h e capaci ty f o r u se fu l
p a r t i t i o n . Ea r l i e r work by the P. I. showed a s t ronq co r r e l a t i on ex is ted
between the degree t o which some s a l t s p a r t i t i o n i n t he phase systems and
drople t mobil i ty . The s a l t p a r t i t i o n i s apparent ly determined l a r g e l y by
t h e solvent binding o r organizing p rope r t i e s of t h e more hydrophobic phase
(PEG-rich). We therefore examined the e f f e c t s on drople t mobil i ty of a l t e r i n g
t h e charac te r of t he PEG-rich phase by incorporat ing i n t o i t molecules which
a r e more hydrophcbic than PEG. I n these experiments a standard phase system
composed of 5% dextran 500 (aol . w t . = 500,000), 4% PEG 6 (mol. w t . = 6,000)
and 0.1 11 Kgci t ra te t o which the following addi t ions were made: propylene
g lycol (PG, 5id-10% wlw); polypropylene glycol (PPG), nol. w t . = 400 (1%-10%);
PPG mol. w t . = 1,200 (1% i n presence of 5% and 10% PG t o make PPG so luble) .
I n addi t ion the c i t r a t e was replaced i n one s o t of measurements by 0.05 M,
0.1 M and 0.25 PI HEPES (N-2-hydroxyethyldiperazine-N'-2-*thane-sulfonc ac id ) ,
a molecule with a high dipole moment.
Phase systems were made from stock so lu t ions of 40% w/w PEG 6 (union
Carbide, Batch 553 IS54489), made up by weight, 18.57% w/w dextran 500
(Pharmacia Fine Chsmicals, Lot No. 7693), concentrat ion determinsd
pola r imet r ica l ly and 2.0 M Kgc i t r a t e (reagent grade). A l l phase systems
were made up by weight with a to? loading b a l ~ n c e t o + 0.005 g using twice
pyrex-dis t i l led water. The completed systems were shaken vigorously,
incubated i n a 25OC water bath f o r a t l e a s t 20 min, shaken and allowed t o
re -equi l ib ra te a t 25'C f o r a f u r t h e r period of a t l e a s t 30 min a f t e r which

time the syetel- was apun at 800 g for 20 min. The phases were separated
(discarding the interface region) and the suepensions for elec trophoreeis
made up at volume concentrations of approximately 4 x 10'3 v/v (bottom phase
drops in top phase) and 8 x 10'~ v/v (top phase drops in bottom). The droplet
suspensions could be stored overnight at 4 ' ~ provided they were equilibrated
at 2S°C for more than 20 min before use.
Electrophoretic motilities were measured ic a standard analytical cell
electrophoresis apparotuc with Ag/AgCl elec'iodes and a cylindrical chamber
at 25.0 f O.lOc, as described (4). A standard droplet diameter of 7-10 urn
was chosen. The electrical conductivities of some of the systems were
measured with a Radiometer Conductivity Meter.
The results of these experiments are summarized in Tables 3.2.1.1 to
3.2.1.4 below. Table 3.2.1.1 demonstrates that the drop mobilities were
independent of the electric field strength applied, as expected for the low
Reynold's number motion.
System Electric field Mobility + S.D. (no. drops) strength (V crn'l) (x 104 cm2 v-1 s-l)
Bottom drops in top phase
Top drops I.. bottom 3.9 phase 4.3
4.6 - - - -- - -
Table 3.2.1.1. Effect of electric field on phase droplet mobility. - --
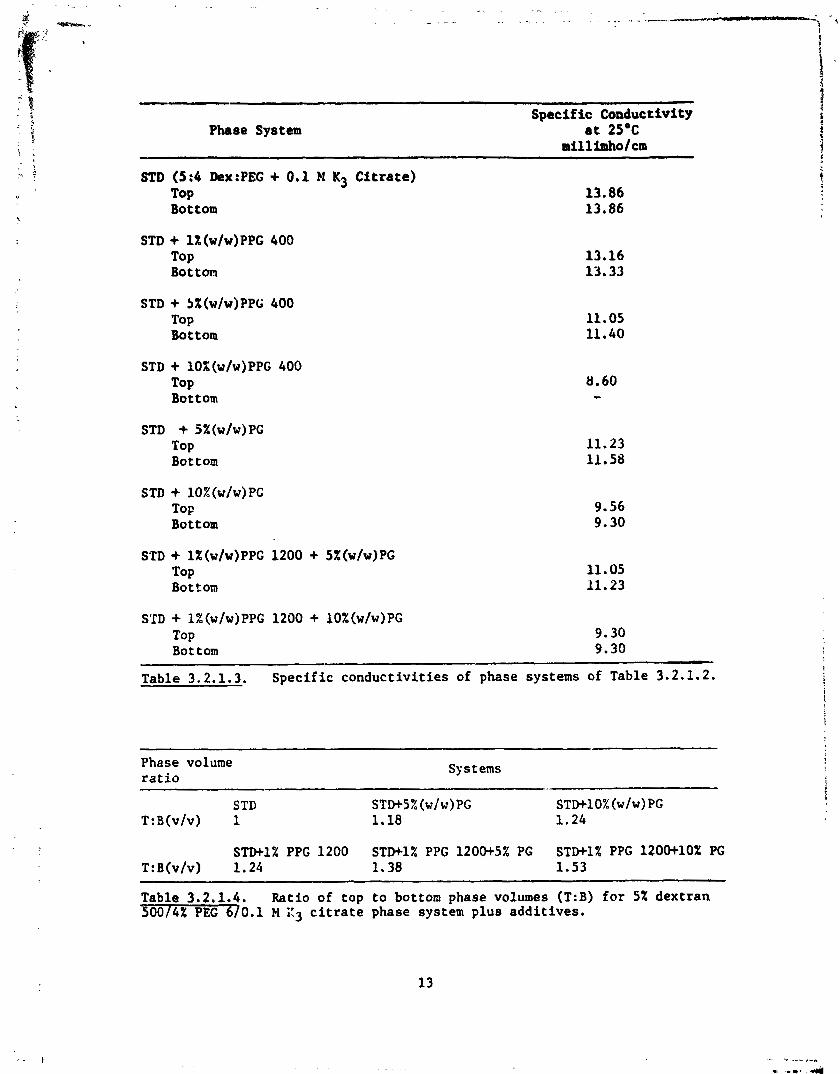
The effects of adding hydrophobic molecules to the standard system are
ziven in Table 3.2.1.2. In all cases decreased mobilities were observed,
probably due to increased phase viscosities. Table 3.2.1.3 shows that all

U U C3 l e e
- Specific Conductivity
Phaee System at 25'C
STD (5:G Dex:PEG + 0.1 N K3 Citrete) TOP Bottom
STD + l%(w/w)PPG 400 TOP Bottom
STD + !~X(w/w)PPti 400 TOP Bottom
STD + lOX(w/w)PPG 400 TOP Bottom
STD + 5%(w/w)PG TOP Bottom
STD f lO%(w/w)PG T ~ F Bottom
STD + lZ(w/w)PPG 1200 + 5%(wfw)PG Top Bottom
STD + l%(w/w)PPG 1200 + ~O%(W/W)PG TOP Bottom
Table 3.2.1.3. Specific conductivities of phase systems of Table 3.2.1.2.
Phase volume ratio
Systems
STD T:B(v/v) 1
STW1% PPG 1200 STD+l% PPG 1200+5% PG STD+l% PPG 1200+10% PG T:B(v/v) 1.24 1.38 1.53
- -
Table 3.2.1.4. Ratio of top to bottom phase volumes (T:B) for 5% dextran 50014% PEG 670.1 N iC3 citrate phase system plus additives.
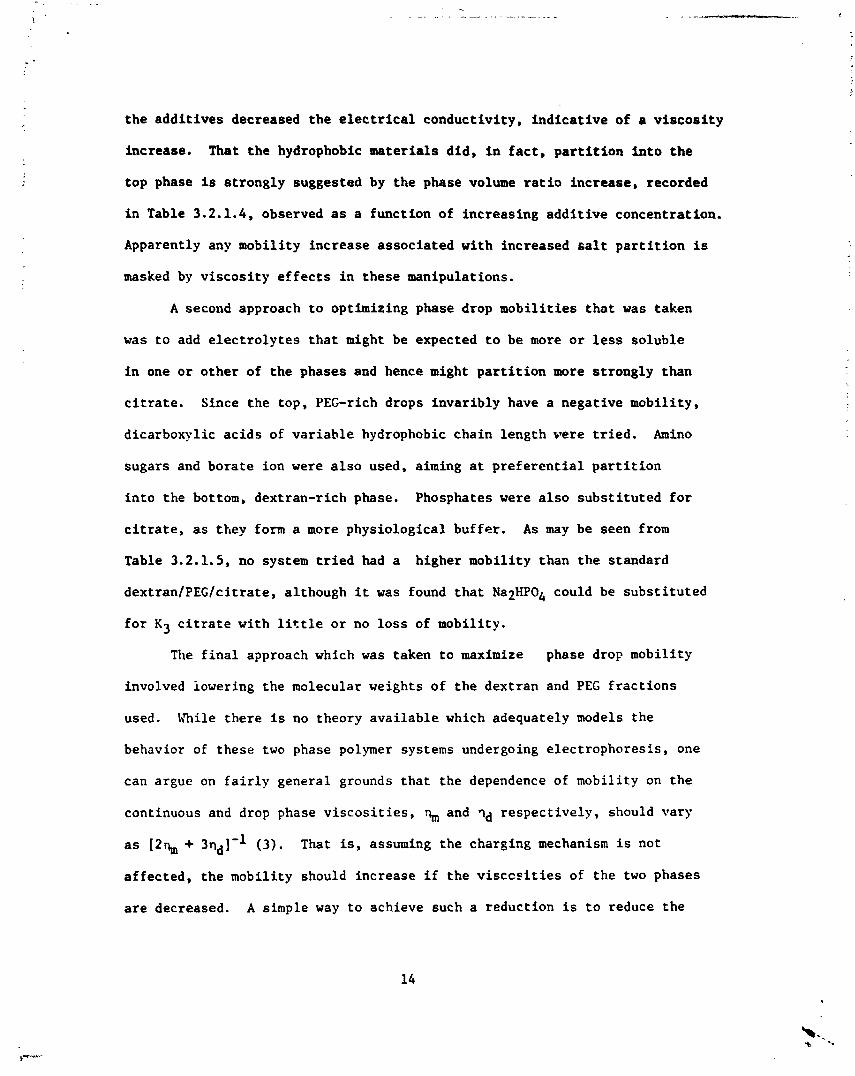
the additives decreased the electrical conductivity, indicative of a viscosity
increase. That the hydrophobic materials did, in fact, partition into the
top phase is strongly suggested by the phase volume ratio increase, recorded
in Table 3.2.1.4, observed as a function of increasing additive concentration.
Apparently any mobility increase associated with increased salt partition is
masked by viscosity effects in these manipulations.
A second approach to optimizing phase drop mobilities that was taken
was to add electrolytes that might be expected to be more or less soluble
in one or other of the phases and hence might partition more strongly than
citrate. Since the top, PEG-rich drops invaribly have a negative mobility,
dicarboxylic acids of variable hydrophobic chain length vere tried. Amino
sugars and borate ion were also used, aiming at preferential partition
into the bottom, dextran-rich phase. Phosphates were also substituted for
citrate, as they form a more physiological buffer. As may be seen from
Table 3.2.1.5, no system tried had a higher mobility than the standard
dextran/PEG/citrate, although it was found that Na2HP04 could be substituted
for Kg eitrate with little or no loss of mobility.
The final approach which was taken to maximize phase drop mobility
involved iowering the molecular weights of the dextran and PEG fractions
used. hhile there is no theory available which adequately models the
behavior of these two phase polymer systems undergoing electrophoresis, one
can argue on fairly general grounds that the dependence of mobility on the
continuous and drop phase viscosities, and qd respectively, should vary
as [Zrh, + 3nd]-l (3). That is, assuming the charging mechanism is not
affected, the mobility should increase if the visccsities of the two phases
are decreased. A simple way to achieve such a reduction is to reduce the

Mobility of Bottom Phase
Mobility of Top Phase
Phase System
Droplets4f in Top
Phase
~roplets* in Bottom Phase
(vm sec-l
v-I cm) fS .D.
(*)
(urn
sec-I
V-' cm)
55
. D.
(*)
------
5:4%
(w/w) Dextran 500:PEC
6
+ 0.10 M
Na2 Malonate
+0.45
+ 0.06 (6)
+ 0.10 M
Na2 Succinate
+0.
45 t 0.04 (10)
+ 0.10 M
Na2
Malonate +
0.05
M K3 Citrate
+0.85
+ 0.07 (10)
+ 0.10 M
Na2 Succinate +
0.05
M K3 Citrate
+1.00
+ 0.07 (10)
+ 0.10 M
Na Glucuronate +
0.05
M K3 Citrate
M.13
+ 0.01 (4)
-0.35
+ 0.05
(10)
+ 0.10 M
Glucosamine HC1
+=
O
= -0.16
t 0.05 (3)
P
VI
+ 0.10 M
Glucosamine HC1 +
0.05 M
K3 Citrate
+ < 0.14
-0.28
+ 0.04 (3)
+ 0.10 M
Na2HP04
+1.05
5 0.18 (30)
-1.58
+ 0.21 (10)
+ 0.10 M
Na2HP04 +
0.05
M K3 Citrate
+ 0.10 M
Na2 Borate
+ 0.10 M
Na2
Borate +
0.05
M K3 Citrate
+ 0.10 M
K3 Citrate
This phase system formed an irreversible gel
after stored overnight at 4OC
+ = 0
-0.25
+ 0.03 (5)
+0.45
+ 0.09 (5)
-1.00
+ 0.11
(20)
+1.15
+ 0.08 (15)
-1.63
+ 0.18 (20)
Table 3.2.1.2.
Electrophoretic mobilities of phase drops of 5% dextran 500/4X PEG 6 to which
electrolytes indicated have been added.
)standard
droplets a
re 7-10
urn d
iameter.
"~u
arb
er of
droplets timed.
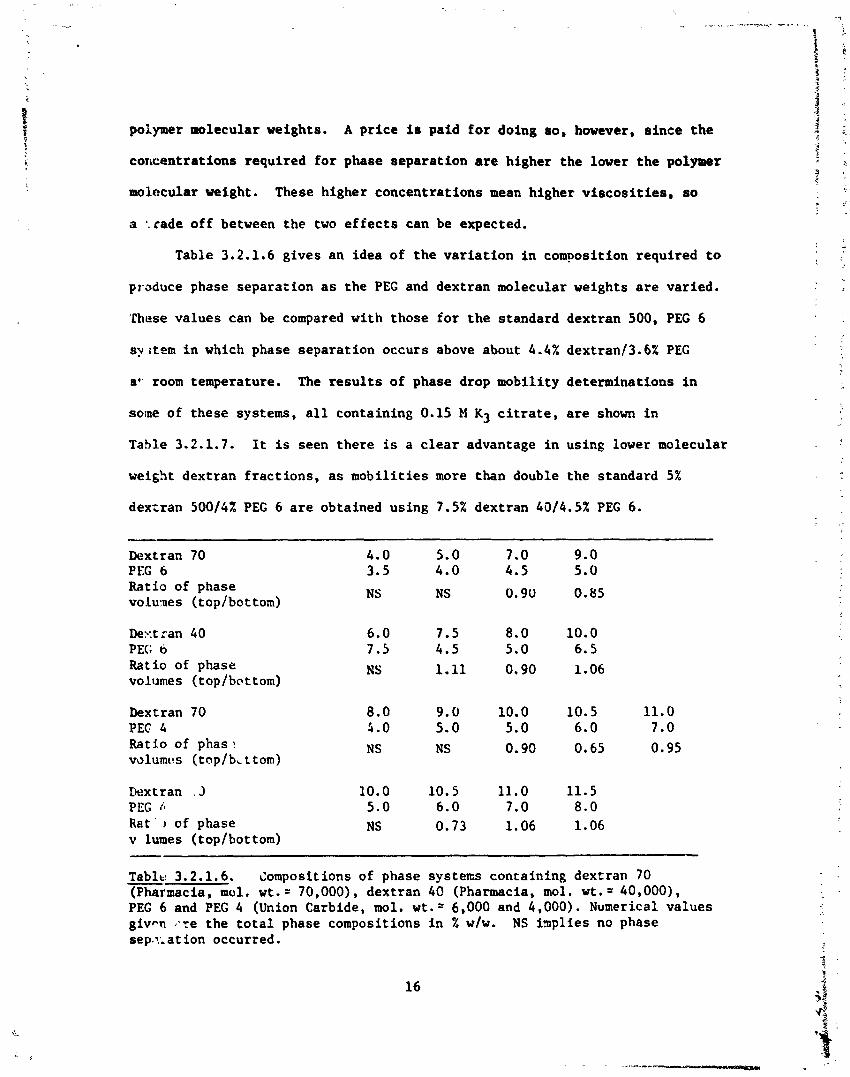
polymer molecular weights. A price is paid for doing so, however, since the
coricantrations required for phase separation are higher the lover the polymer
molecular weight. These higher concentrations mean higher viscosities, so
a trade off between the two effects can be expected.
Table 3.2.1.6 gives an idea of the variation in composition required to
praduce phase separation as the PEG and dextran molecular weights are varied.
These values can be compared with those for the standard dextran 500, PEG 6
sy ;tern in which phase separation occurs above about 4.4% dextranl3.6X PEG
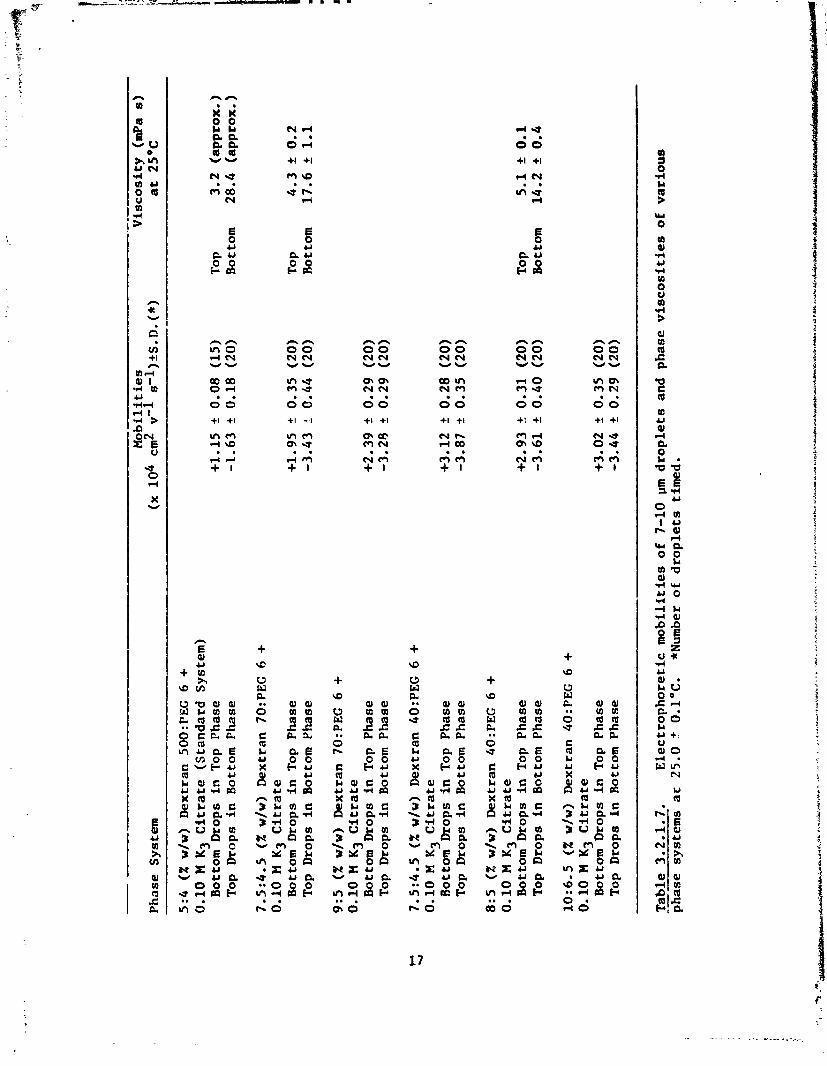
a*: room temperature. The results of phase drop mobility determinations in
some of these systems, all containing 0.15 M K3 citrate, are shown in
Table 3.2.1.7. It is seen there is a clear advantage in using lower molecular
weight dextran fractions, as mobilities more than double the standard 5%
dexzran 50014% PEG 6 are obtained using 7.5% dextran 4014.5% PEG 6.
Dextran 70 PEG 6 Ratio of phase volumes (top/bottom)
De?:tran 40 PEG ti Ratio of phase volumes (top/bottom)
Dextran 70 PEC 4 Ratio of phas ?
volumis (top/b,t tom)
Dextran . 3 PEG 6
Rat ' , of phase v lumes (toplbottom)
Table 3.2.1.6. Compositions of phase systems containing dextran 70 - (Pharmacia, mol. wt.= 70,000), dextran 40 (Pharmacia, mol. wt.= 40,000), PEG 6 and PEG 4 (Union Carbide, mol. wt.' 6,000 and 4,000). Numerical values given Cte the total phase compositions in X wlw. NS inplies no phase sep.7.; at ion occurred.
--
--
1: ,:
Mobilities
Viscosity
(mPa
s
) I:
(x 104 cm2 ,-I
s-l)ts.~.(*)
at 25%
Phase System
\l
5:4
(% w/w) kxtran 500:PEG 6 +
0.10 M K3 Citrate (Standard System)
Bottom Drops in Top
Phase
Top
Drops
in Bottom Phase
7.5:b.S
(X w/w)
Dextran 70:PEG 6 +
0.10 H K3
Citrate
Bottom Drops
in Top Phase
Top Drops in Bottom Phase
9:s
(X
wlw)
Dextran 70:PEG 6 +
0.10 M
K3 Citrate
Bottom Drops in Top Phase
Top Drops in Bottom
Phase
C,
Q
7.5:4.5
(X w/w) Dextran 40:PEC
6 +
0.10
M K3 Citrate
Bottm Drops in Top Phase
Top Drops in Bottom Phase
8:s
('XI w/w) Dextran 4O:PEG
6 +
0.10 M K3 Citrate
Bottom Drops in Top Phase
Top Drops in Bottom Phase
10:6.5
(4 w/w)
Dextran 40:PEG
6 +
0.10 M Kg Citrate
Bottom Drops in Top Phase
Top Drops in Bottom Phase
+1.15
t 0.08 (15)
Top
3.2
(ap
pro
x. j
-1.63
+ 0
.18
(20)
Bottom
28.4
(ap
pro
x. )
TOP
4.3
k 0.2
Bottom
17.6
+ 1.1
TOP
5.1
f 0.1
Bottom
14.2 f 0.4
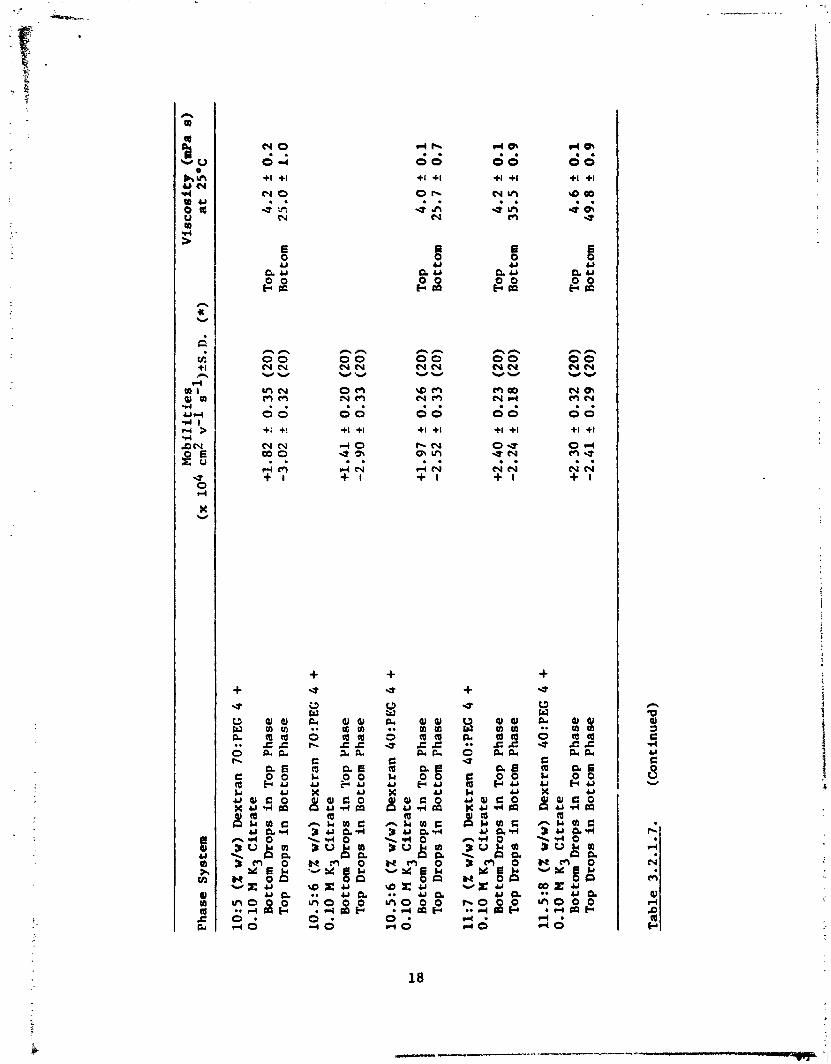
Table 3.2.1.7.
Electrophoretic mobilities of
7-10 pm droplets and phase viscosities of various
phase
systems ac
25.0
2 O.l°C.
*Number of droplets timed.
Phase S
yst
em
Mo
bil
itie
s V
isc
osi
ty (
mPa
s)
(X 104
~m
2
"-1 S
'lj+
s.~
. (*
) a
t 25
Oc
10:5 (X w/w)
Dex
tran
70:PEG
4 +
0.10 M K3 C
itra
te
Bot
tom
Dro
ps
in T
op
Ph
ase
Top
D
rops
in
Bot
tom
Ph
ase
10.5:6
(4 w/w)
Dex
tran
70:PEG 4
+ 0.10 M
Kg C
itra
te
Bot
tom
Dro
ps
in T
op P
has
e T
op D
rops
in
Bot
tom
Ph
ase
I 10.5:6
(X w/w)
Dex
tran
40:PEG
4 +
C,
0.10 M K3 C
itra
te
QI
Bot
tom
Dro
ps i
n T
op P
has
e
I T
op
Dro
ps
in B
otto
m P
has
e
11:7
(X w/w)
Dex
tran
4O:PEG
4 +
0.10 M K3 C
itra
te
Bot
tom
Dro
ps
in T
op P
has
e T
op D
rop
s in
Bot
tom
Ph
ase
11.5:8
(X w/w)
Dex
tran
40:PEG
4 +
0.10 M K3 C
itra
te
Bot
tom
Dro
ps i
n T
op P
has
e T
op D
rops
in
Bot
tom
Ph
ase
+1.82
+ 0.35 (20)
TO
P 4.2
? 0.2
-3.02
t 0.32 (20)
Bot
tom
25.0 f 1.0
+1.
97
t 0.26 (20)
TO
P 4.0
2 0.1
-2.5
2 + 0.33 (20)
Bot
tom
25
.7 f 0.7
+2.40
+ 0.23 (20)
TOP
4.2
2 0.1
-2.24
+ 0.18 (20)
Bot
tom
35.5 f 0.
9
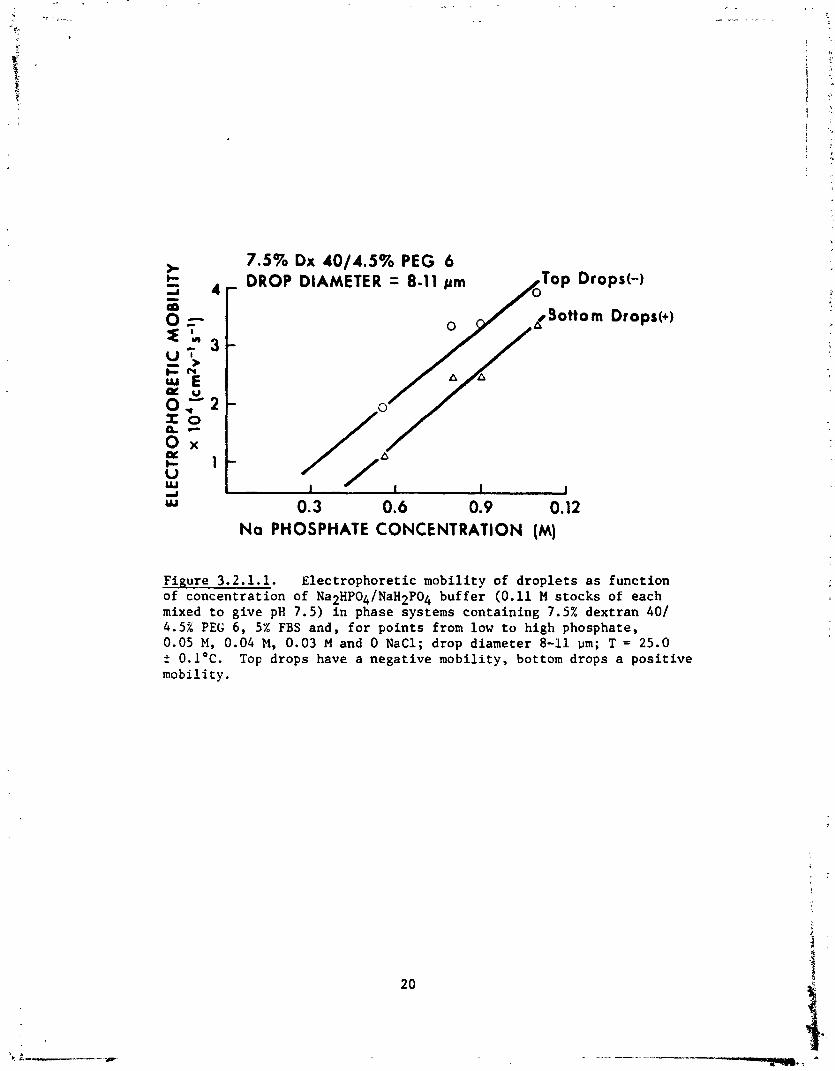
Because of the high drop mobilities obtained, it was decided to
utilize the 7.5% dextran 4014.52 PEG 6 system as the basis for future work.
The final experiments carried out to maximize drop mobility involved
examination of the effects of utilizing various proportions of 0.11 M
Na2HP04 buffer, pH 7.5, and 0.15 M NaCl to make phase systems of roughly
constant ionic strength which varied in their P04iC1 ratio. The systems
contained 5% fetal bovine serum (FBS; Grand Island Biological Co.) as it
wzs known that such an addition markedly improved cell viability (vide
infro'. The results, shown in Figure 3.2.1.1, indicate that at constant -.
pH and ionic strength the droplet mobility increases roughly linearly with
phosphate concentration. Varying the P04/C1 ratio therefore provides a
convenient technique for controlling the phase drop mobility without
drastically changing most of the other physical characteristics of the
system.
3.2.2 Biocompatibility of Dextran/PEG System
In order to examine the biocompatibility of the dextran 40/PEG 6
system, the viability of a typical nucleated mammalian cell type was
determined under conditions that approximated those present during CCD.
Spleens were removed from LAFl mice (Jackson Laboratories) which had been
ether-anesthetized and sacrificed by cervical dislocation. Splenic cell
suspensions were prepared and washed three times in 0.01 M phosphate-
buffered saline conteining SZ v/v heat-inactivated fetal calf serum
(PBS-FCS), pH 7.2, by centrifugation at 490 g for 10 min at 4OC. To 10 ml
of each phase system 0.1 ml of packed cells was added, the system shaken,
then allowed to stand at room temperature. Every 15 min each system was
shaken to re-disperse the phases and cells; a control suspension of cells
7.5% Dx 40/4.5% PEG 6 DROP DIAMETER = 8-11 pm Top Drops(-)
0
r Sottom Drops(+) A - 4 ; L:,
0.3 0.6 0.9 0.12 N o PHOSPHATE CONCENTRATION (M)
Figure 3.2.1.1. Electrophoretic mobility of droplets as function of concentration of Na2HP04/NaH2P04 buffer (0.11 M stocks of each mixed to give pH 7.5) in phase systems containing 7.5% dextran 401 4.54 PEG 6, 52 FBS and, for points from low to high phosphate, 0.05 M, 0.04 M, 0.03 M and 0 NaC1; drop diameter 8-11 urn; T = 25.0 2 O.l°C. Top drops have a negative mobility, bottom drops a positive mobility.

in phosphate-buffered saline (PBS) + 5% FBS was treated similarly. At the
intervals noted in Table 3.2.2.1, 1.0 ml aliquots were removed from each
system, 4 ml of PBS + 5% FBS added, the suspension centrifuged for 10 min
at 300 g and the supernatant discarded. To the cell button 6 drops of
0.1% filtered trypan blue in PBS was added. At least 100 cells were counted
for each sample, the viability being identified with the fraction of cells
counted which excluded the dye. All phase systems were made up of 7.5%
dextran 40/4.52 PEG 6, 5% FBS as earlier work had shown (D.E. Brooks and
H. Walter, unpublished) that cell viabilities were invariably low after CCD
if serum was not present. The effect on viability of diminishing the
concentration of chloride was examined, with the results shown in Table
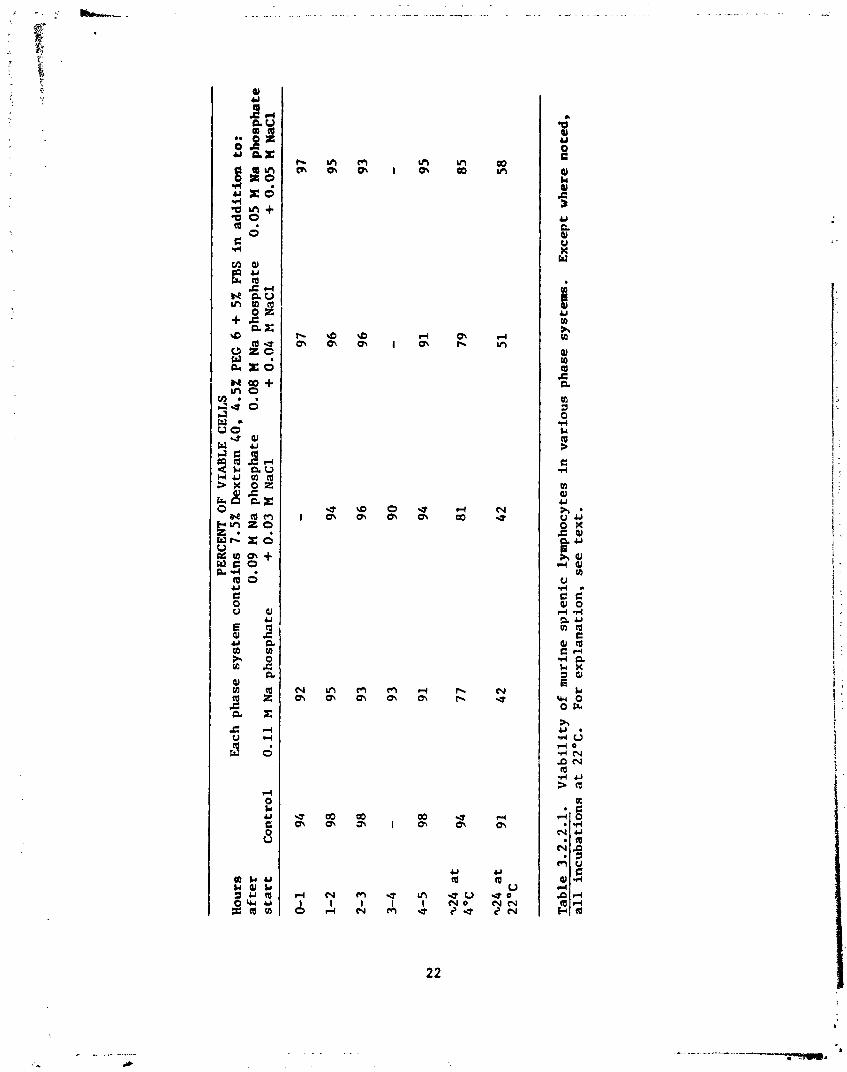
It is seen that in all the phase systems tested, shaking the suspensions
every 15 min for up to 5 hr at room temperature had very little effect, all
samples showing > 90% viability. There was no obvious advantage to adding
chloride to the systems over this period. In samples that were incubated
24 hr at 4OC (infrequent shaking) the viability in the phase systems decreased
about 157 relative to the 4" control, but again little effect of chloride was
found. Only in suspensions left 24 hr at room temperature was there any
improvement in viability in systems containing chloride. The effect in this
case was too small to render the viabilities acceptable, however.
The results demonstrate that the system with the highest drop mobility,
that containing pure 0.11 Pi phosphate buffer as the electrolyte, is able to
retain greater than 90% of a population of murine splenic lymphocytes
viable through 20 shakejsettle cycles in 5 hr at room temperature. A t 4 " C ,
but not room temperature, viabilities remained acceptable (> 75%) after 24 hr
PERCENT OF VIABLE CELLS
Hours
Each phase system contains 7.5% Dextran 40, 4
.5%
PEG 6
+ 5
% FBS in addition to:
after
0.0
9 M Na phosphate
0.08 M
Na phosphate
0.05 M Na phosphate
start
Control
0.11 M Na phosphate
+ 0.03 M NaCl
+ 0
.04
M NaCl
+ 0.05 M NaCl
Table 3.2.2.1.
Viability of murine splenic lymphocytes in various phase systems.
Except where noted,
all incubations at
22O
C.
For explanation, see text.
in the phase systems. The 7.5% dextran 40/4.5% PEG 6, 5% FBS, 0.11 M Na
phosphate system, pH 7.5, therefrra was considered to be a biocompatible
system well suited for studies on field-drivc phase separation.
3.2.3 Cell Partition Studies in Biocompati~lc Systems
Phase systems based on dextran low molecular weight and PEG fractions
have been used for several years in cell partition work in Sweden, particularly
where partition is determined by the interaction with the cell surface of PEG
to which an affinity ligand has been attached (5). In such affinity proce-
dures, the cells which partition into the top phase are those vhich interact
most strongly with the ligand since they will be preferentially coated with
PEG bound to the affinity group and will therefore partition into the top,
PEGrich phase. In the absence of an affinity ligand, erythrocytes, at least,
do not partition appreciably into the top phase, presumably because low
molecular weight dextran adsorbs more strongly to red cells than does
dextran 500 (6).
In the 7.5% dextran 4014.52 PEG 6, 5% FBS, 0.11 M Na phosphate system,
the partition of fresh, thrice PBS-washed human red cells was negligible,
consistent with the Swedish results. Addition of 0.01% w/w PEG-palmitate,
a lipid affinity ligand consisting of the PEG 6 ester of palmitic acid
(Chem Services Inc.) increased the partition of red cells to 50% (50% of the
cells added found in the top phase) only in the absence of FBS, however.
The FBS produced a white precipitate which collected at the interface (in
the presence or absence of PEG-palmitate) and was discarded before the
phases were used. The nature of this material was not investigated, but it
is possible that it bound a significant fraction of the ester, Certainly
there are components in serum (lipoproteins, albumin) which are capable of

binding f a t t y a c i d s , e f f e c t i v e l y removing them from t h e eystem. Th is enems a
l i k e l y exp lana t ion f o r t h e r e s u l t s obta ined.
The a b i l i t y of t h e dex t ran 40 system t o support c e l l p a r t i t i o n was n o t
pursued f u r t h e r . It was f e l t t h a t once a s p e c i f i c c e l l type t o be examined
by p a r t i t i o n was i d e n t i f i e d t h a t a p p r o p r i a t e phase systems, probably inc lud ing
a f f h i t y l i g a n d s , could be developed. It should be p o s s i b l e , fo.: i n s t a n c e ,
t o remove albumin and o t h e r serum s u b s t i t u e n t s w i t h hydrophobic binding sites
from FBS v i a hydrophobic a f f i n i t y chromatography, i f PEG-fatty a c i d e v t e r s
were t o be used, A f f i n i t y l i g a n d s based on non-lipid memkrane pq - . ties
would be less l i k e l y t o i n t e r a c t wi th serum components and coul2 ,ILI, j51y be
used i n t h e p resen t system. F i n a l l y , i f no o t h e r approach proved s u p e r i o r ,
t h e dex t ran molecular weight could be increased u n t i l t h e d e s i r e d p a r t i t i o n
behavior was obta ined. There was not t ime t o pursue t h e s e p o s s i b i l i t i e s
dur ing t h e p resen t e f f o r t . A s noted, work i n t h i s d i r e c t i o n would be somewhat
unfocussed without a s p e c i f i c c e l l type t o work on. It seems l i k e l y ,
however, based on t h e above reasoning and t h e pe rsona l exper ience of t h e P.I.,
t h a t f o r any p a r t i c a l a r c e l l type cond i t ions could be found t h a t would
produce u s e f u l p a r t i t ion behavior.
3.2.4 S ize Dependence of Drop Electrophorct3.c - M o b i l i t i e s
A remarkable c h a r a c t e r i s t i c of t h e e l e c t r o k i n e t i c behavior of t h e
phase d r o p l e t s is t h e i n c r e a s e i n e l e c t r o p h o r e t i c mobi l i ty wi th drop s i z e .
This c h a r a c t e r i s t i c is important f o r f i e l d - d r i v e n phase s e p a r a t i o n because
i t impl ies t h 7 t s e p a r a t i o n ought t o a c c e l e r a t e i n an e l e c t r i c f i e l d as
d r o p l e t s coa lesce and t h e i r average diameter inc reases . The only system
examined i n d e t a i l be fore t h e p resen t work was c a r r i e d ou t on a dex t ran 5001
PEG 6 system (1). It was found t h a t t h e m o b i l i t y i n c r e a ~ e d l i n e a r l y wi th
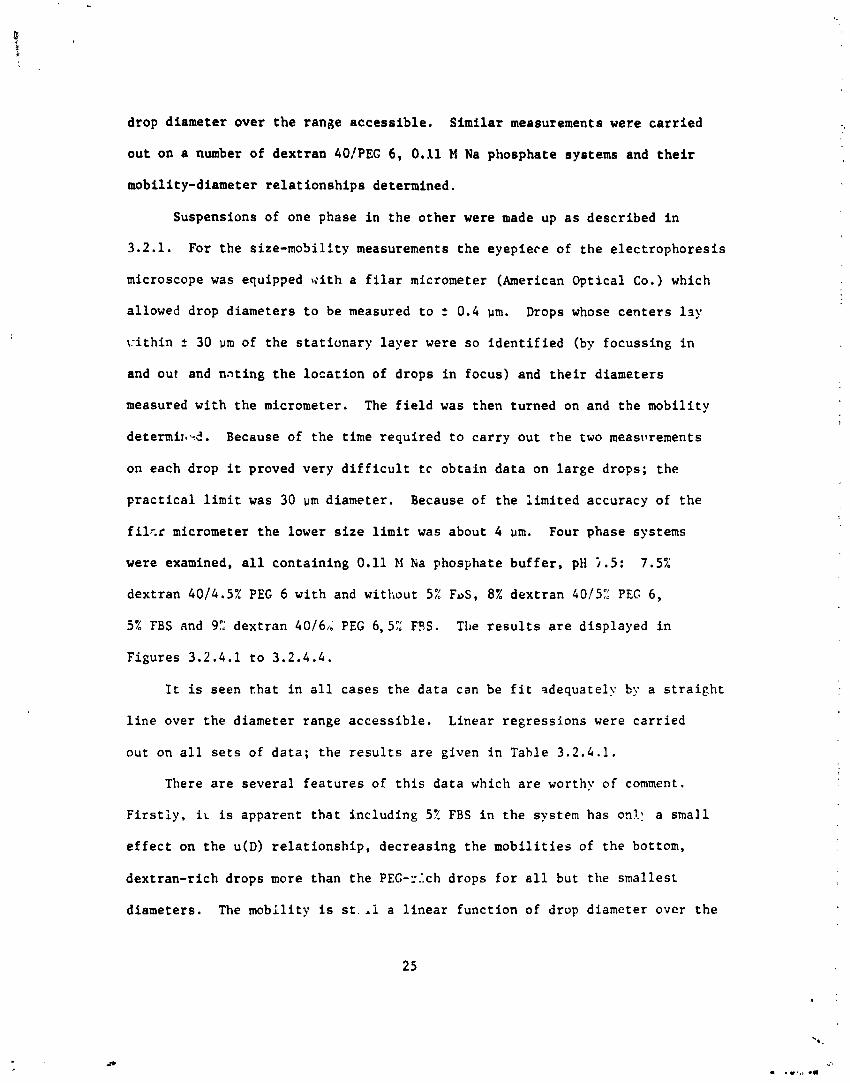
drop diameter over the range accessible. Similar measurements were carried
out on a number of dextran 40!PEG 6, 0.11 M Na phosphate systems and their
mobility-diameter relationships determined.
Suspensions of one phase in the other were made up as described in
3.2.1. For the size-mo5ility measurements the eyepiece of the electrophoresis
microscope was equipped with a filar micrometer (American Optical Co.) which
allowed drop diameters to be measured to 2 0.4 pm. Drops whose centers 13s
I-ithin t 30 urn of the stationary layer were so identified (by focussing in
and out and noting the location of drops in focus) and their diameters
measured with the micrometer. The field was then turned on and the mobility
determixl.:d. Because of the time required to carry out the two meastlrements
on each drop it proved very difficult tc obtain data on large drops; the
practical limit was 30 um diameter. Because of the Limited accuracy of the
fil,?r micrometer the lower size limit was about 4 um. Four phase systems
were examined, all containing 0.11 Pi ha phosphate buffer, pH 1.5: 7.57;
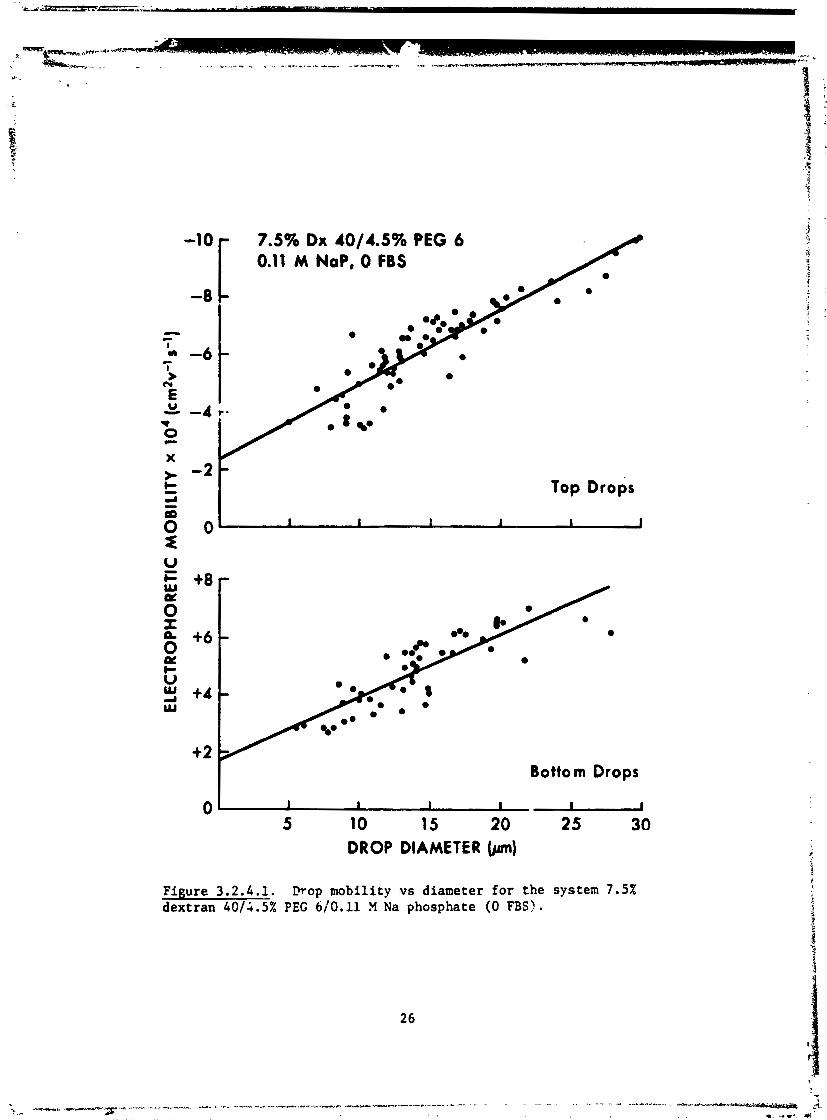
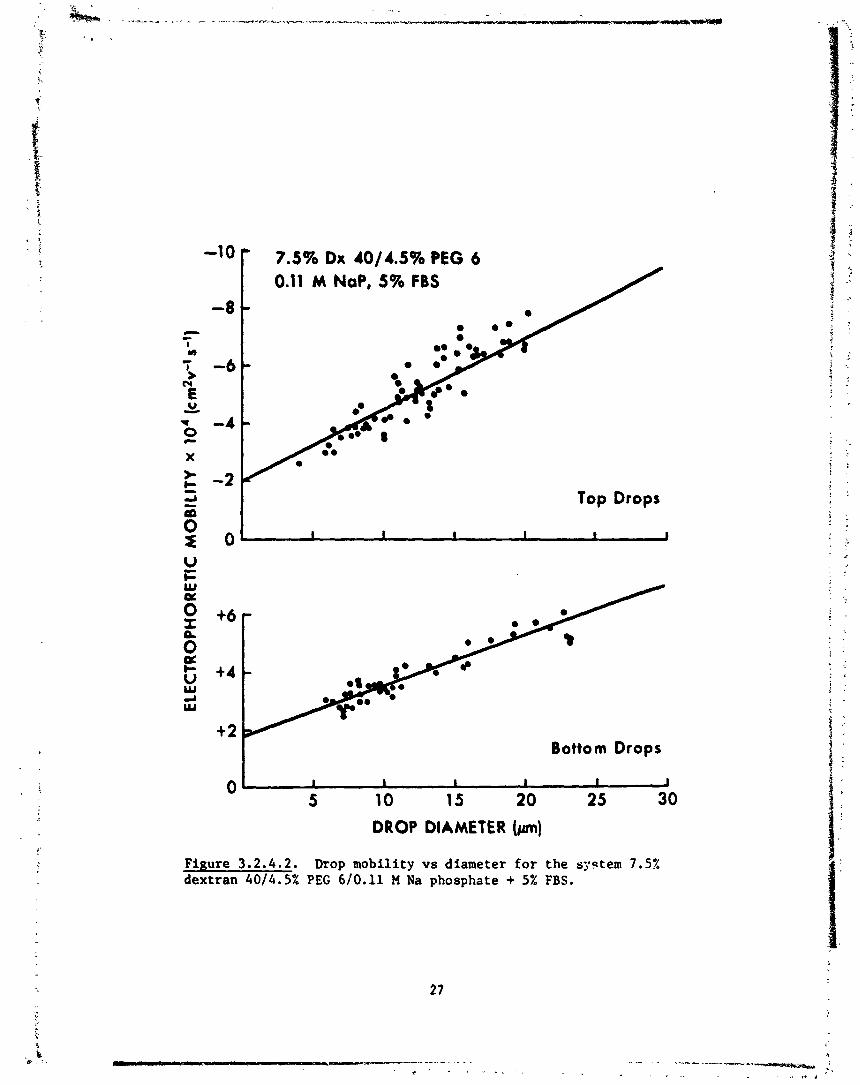
dextran 40/4,5% PEG 6 with and without 5% FuS, 8% dextran 40/5:: PEG 6,
5% FBS and 9:: dextran 40/6/d PEG 6.57: FFIS. The results are displayed in
Figures 3.2.4.1 to 3.2.4.4.
It is seen that in all cases the data can be fit qdequately by a straight
line over the diameter range accessible. Linear regressions were carried
out on all sets of data; the results are given in Table 3.2.4.1.
There are several features of this data which are worthy of comment.
Firstiy, ic is apparent that including 5' FBS in the system has onl: a small
effect on the u(D) relationship, decreasing the mobilities of the bottom,
dextran-rich drops more than the PEG-::.ch drops for all but the smallest
diameters. The mobility is st.,l a linear function of drop diameter over the
7.5% Dx 40/4.5% PEG 6 0.11 M Nap, 0 FBS
Top Drops
DROP DIAMETER (ym)
Figure 3.2.4.1. Drop mobility vs diameter for the system 7.5% dextran 40/4.5% PEG 61'0.11 ?l Na phosphate (0 FBS).
L 7.5% Ox 4014.5% PEG 6 0.11 M Nap, 5% FBS
-
-
=! - I Top Drops
I Bottom Drops
DROP DIAMETER (pm)
Figure 3 . 2 . 4 . 2 . Drop mobility vs diameter for the system 7.5% dextran 4014.5% PEG 6/0.11 M Na phosphate + 5% FBS.
8% Dx 40/5% PEG 6 0.11 M Nap, 5% FBS • * *
Top Drops
I Bottom Drops
DROP DIAMETER (pm)
Figure 3 . 2 . 4 . 3 . Drop mobility vs diameter for the system 8% dextran 4 0 / 5 % PEG 6/0.11 M Na phosphate + 5% FBS.

Drops
5 10 IS 20 25 30
DROP DIAMETER (pm)
Figure 3.2.4.4. Drop mobility vs diameter for the system 9% dextran 4016% PEG 610.11 M Na phosphate + 5% FBS.
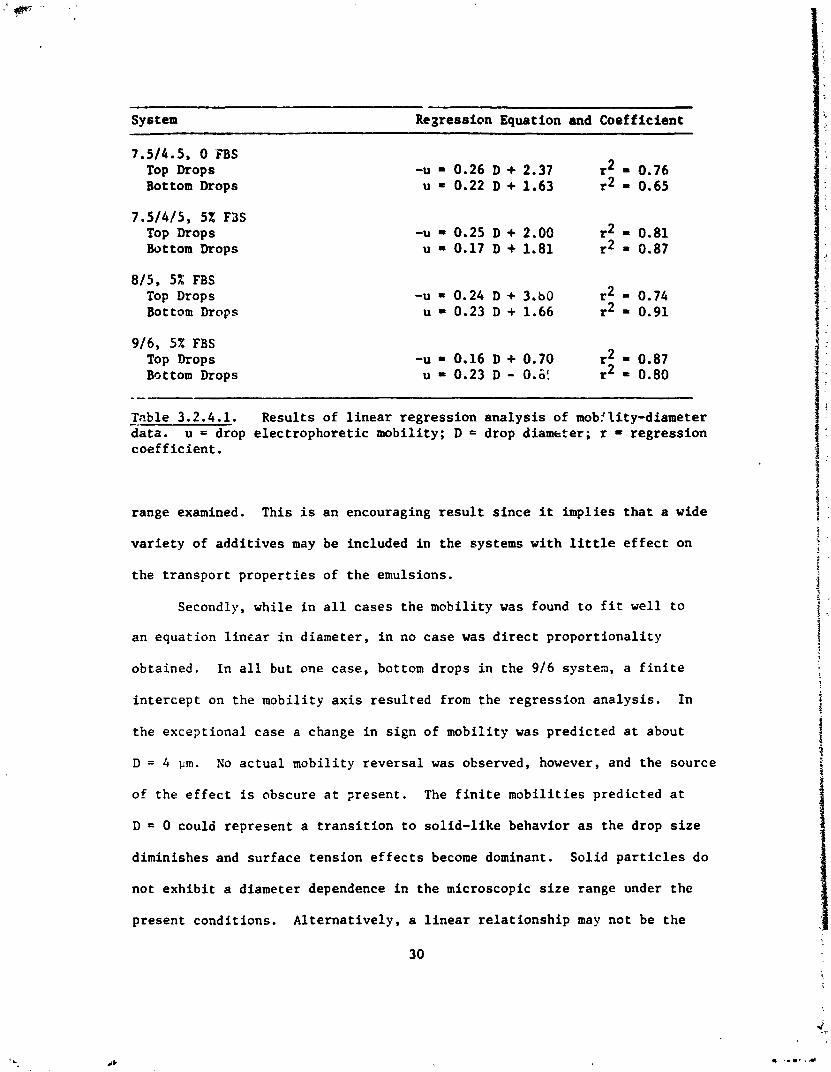
System - - - - - -
Rearession Equation and Coefficient
7 . 5 1 4 . 5 , 0 FBS Top Drops Bottom Drops
7 . 5 1 4 / 5 , 5% F3S Top Drops Bottom Drops
8/5, 5% FBS Top Drops Bottom Drops
9 / 6 , 5% FBS Top Drops P~tt0m Drops
Table 3.2.4.1. Results of linear regression analysis of mob!lity-diameter -. data. u = drop electrophoretic mobility; D = drop diamkter; r = regression coefficient.
range examined. This is an encouraging result since it implies that a wide
variety of additives may be included in the systems with little effect on
the transport properties of the emulsions.
Secondly, while in all cases the mobility was found to fit well to
an equation linear in diameter, in no case was direct proportionality
obtained. In all but one case, bottom drops in the 9/6 system, a finite
intercept on the mobility axis resulted from the regression analysis. In
the exceptional case a change in sign of mobility was predicted at about
D = 4 pm. No actual mobility reversal was observed, however, and the source
of the effect is obscure at ?resent. The finite mobilities predicted at
D = 0 could represent a transition to solid-like behavior as the drop size
diminishes and surface tension effects become dominant. Solid particles do
not exhibit a diameter dependence in the microscopic size range under the
present conditions. Alternatively, a linear relationship may not be the
30
true dependence of u on D, the fit obtained being only apparent due to the
scatter in the data. (The scatter could have been reduced by timing drops
only within f 10 um of the stationary level rather than f 30 but such a
procedure would have been too time consuming in the limited period available).
It is therefore entirely possible that the u(D) plots approach zero at
diameters below the limits of the measurement technique used.
The third point of interest in this data is that there is no simple
relationship between the u(D) behavior and the concentration of polymers
used to make up the phase systems, i.e., the distance the systems exist
above the critical point. ltro competing effects would be expected as the
phases became more concentrated. The increased phase viscosities will tend
to reduce the mobility as discussed earlier. Farther from the critical point
the salt partition increases, however, and the potential difference between
the phases increases, suggesting a mobility increase as well. Apparently
these two competing effects produce the complex results obtained.
There are two other points to be made regarding this data which are not
illustrated by the Figures. In all the measurements made to date, if, as
is usual, the sign of the mobility is identified with the sign of the zeta
potential and this sign is compared with that expected from the known salt
partition, it is found that the results are opposite to expectation (1).
There has been no satisfactory explanation put forward to date for this
striking observation. While it can be rationalized in principle by
positing the presence of a dipole of appropriate orientation at the phase
boundary, no physicochemical explanation for its presence has been presented.
Since there is no theory currently available which describes any of the
electrokinetic properties of these systems the sources of most of the effects
observed remain obscure.
The remaining interesting discovery made during the course of this
work relates to the kinetic behavior of the phase systems when the electric
field was suddenly removed. In both the 7.514.5 and 8/5 systems, instead
of the drop velocity rapidly going to zero as is found for solid particles,
it initially decreased rapidly but slow motion continued in the direction
of electrokinetic motion for times of the order of a minute. More remarkably,
drops of the 9/6 system, with the highest phase polymer concentrations,
actually reversed their motion when the field was turned off. This motion
did not seem to be due to convective flow, to leaks or to a shift in the
stationary level (it w.?s observed at all locations in the chamber).
Presumably the residual motion is associated with the slot7 relaxation of fluid
circulation inside the drop. Because of the free boundary at the interface
between the drop and its suspending medium the tangential fluid stresses
are continuous across the phase boundary, hence the damping of circulation
inside the drop might not be particularly severe. In the absence of a
detailed theory for the flows involved, however, this explanation must be
considered pure speculation.
3 . 2 . 5 Electrophoresis of Drops Carryiag Adsorbed Cells
Utilizing thc 7.5% dextran 40/4.5% PEG 6, 0.11 M Na phosphate, 5% FBS
system it was possible to observe the mobility behavior of phase drops with
washed human red cells adsorbed to the drop surface. The system was made up
as described earlier with red cells included in the dispersed phase. Again
it was possible to meaure the u(D) behavior by the technique used previously,
although the measurements were more difficult than those involving pure
systems because of the enhanced sedimentation rate of drops to which cells
were adsorbed. The results are shown in Figure 3.2.5.1.

Top Drops
I Bottom Drops
DROP DIAMETER (m)
Figure 3.2.5.1. Phase drop mob i l i t i e s a s a funct ion of drop diameter f o r t he system 7.52 dextran 40/4.5% PEG 610.11 M Na phosphate, 5% FBS + human red c e l l s . Dotted l i n e s i nd i ca t e da ta with no c e l l s present . umbers r e f e r t o numbers of red c e l l s adsorbed t o drop. Sol id l i n e s i nd i ca t e b e s t f i t t o da ta f o r one c e l l per drop.
The cells adsorbed t o t h e i n t e r f a c e were always found on t h e o u t s i d e
of t h e phase d rops r e g a r d l e s s of which phase was d i spersed . C e l l s were not
found suspended i n s i d e t h e i r o p s , bu t i t should be noted t h a t p a r t i t i o n
c o e f f i c i e n t s a r e low f o r e r y t h r o c y t e s i n t h i s p a r t i c u l a r system, as d i scussed
e a r l i e r . When t h e f i e l d was turned on t h e adsorbed c e l l s were swept t o t h e
t r a i l i n g edge of t h e drops but i n no case were any c e l l s d is lodged from t h e
i n t e r f a c e , even when t h e drop diameter was less than t h a t of t h e adsorbed
c e l l .
F igure 3.2.5.1 shows t h a t f o r t h e top drops w i t h n e g a t i v e m o b i l i t y ,
adsorbing one o r two c e l l s t o t h e s u r f a c e has ve ry l i t t l e e f f e c t on t h e
mobi l i ty . Cell adsorp t ion t o t h e bottom drops , which have a p o s i t i v e
mobi l i ty , produced a more s i g n i f i c a n t e f f e c t , depress ing t h e m o b i l i t y by
about 25% on t h e average. There d i d n o t seem t o be a s t r o n g dependence of
mobi l i ty dec.rease on t h e f r a c t i o n of t h e s u r f a c e covered once t h e f i r s t c e l l
was p r e s e n t , p a r t i c u l a r l y wi th t h e bottom drops .
It seems l i k e l y t h a t t h e d i f f e r e n t t a l e f f e c t of c e l l a d s o r p t i o ~ i on
top and bottom drops is due t o t h e s i g n of t h e red c e l l z e t a p o t e n t i a l .
Erythrocytes have a nega t ive mobi l i ty which i s a t l e a s t an o rder of magnitude
lower than t h e top drop m o b i l i t i e s . P a r t i a l l y covering t h e s u r f a c e of t h e
nega t ive m o b i l i t y drop wi th ,?elis would t h e r e f o r e be expected t o reduce i t s
mobi l i ty l e s s than t h a t of a b~t'orn phase drop wi th p o s i t i v e m o b i l i t y , i n
agreement wi th t h e observa t ions . It should be noted t h a t i t is n o t
n e c e s s a r i l y t h e magnitade of ihe c e l l z e t a p o t e n t i a l which i s r e s p o n s i b l e
f o r t h e reduc t ion i n drop mobi l i ty . It is known i n o t h e r systems t h a t
immobilizing t h e f r e e l i q u i d i n t e r f a c e of drops wi th adsorbed m a t e r i a l
reduces t h e r a t e of t r a n s p o r t of such drops ( 2 ) , s i n c e t a r g e n t i a l shear can
no longer be t r ansmi t t ed a c r o s s t h e bc ~ d a r y . Hence adsorbing even a t o t a l l y
neutral material to the drop surface could be expected to reduce the mobility.
That the effect of covering up to approximately 20% of the drop surface with
cells has such a small depressing effect on the mobility ie very encouraging
with regard to the prospect of field driven phase separation in cell
partition experiments.
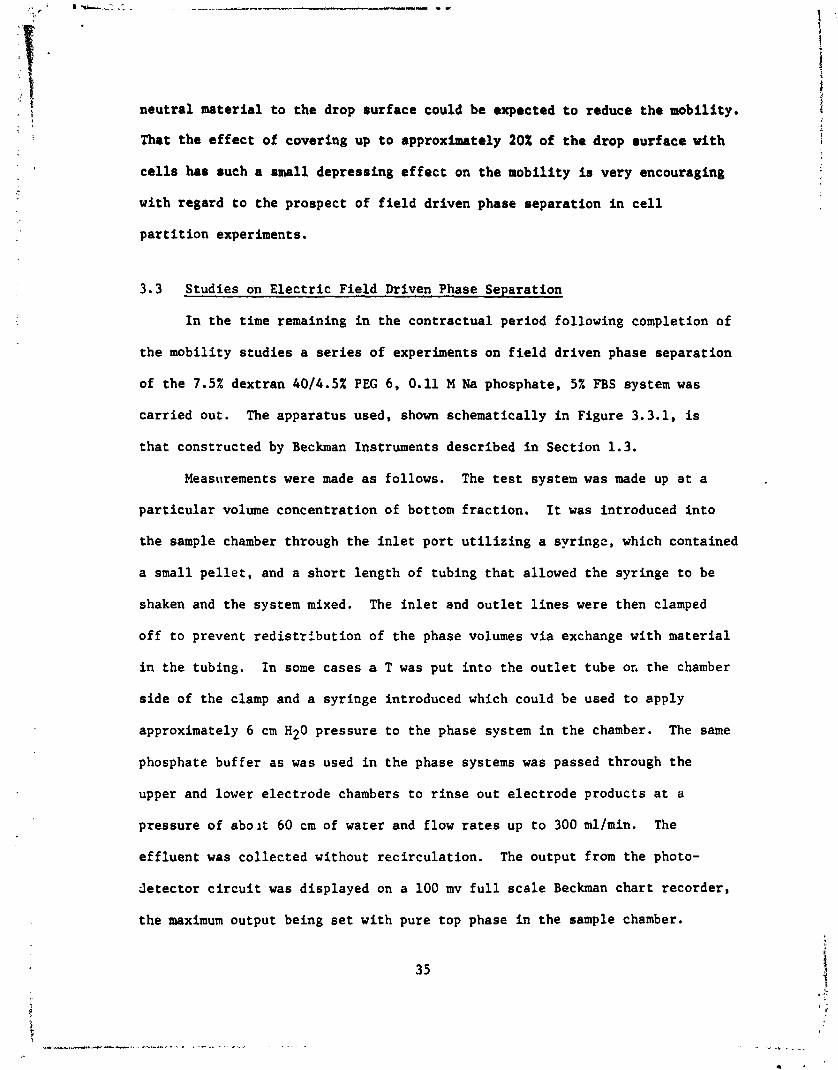
3.3 Studies on Electric Field Driven Phase Separation
In the time remaining in the contractual period following completion of
the mobility studies a series of experiments on field driven phase separation
of the 7.5% dextran 4014.5% PEG 6, 0.11 M Na phosphate, 5% FBS system was
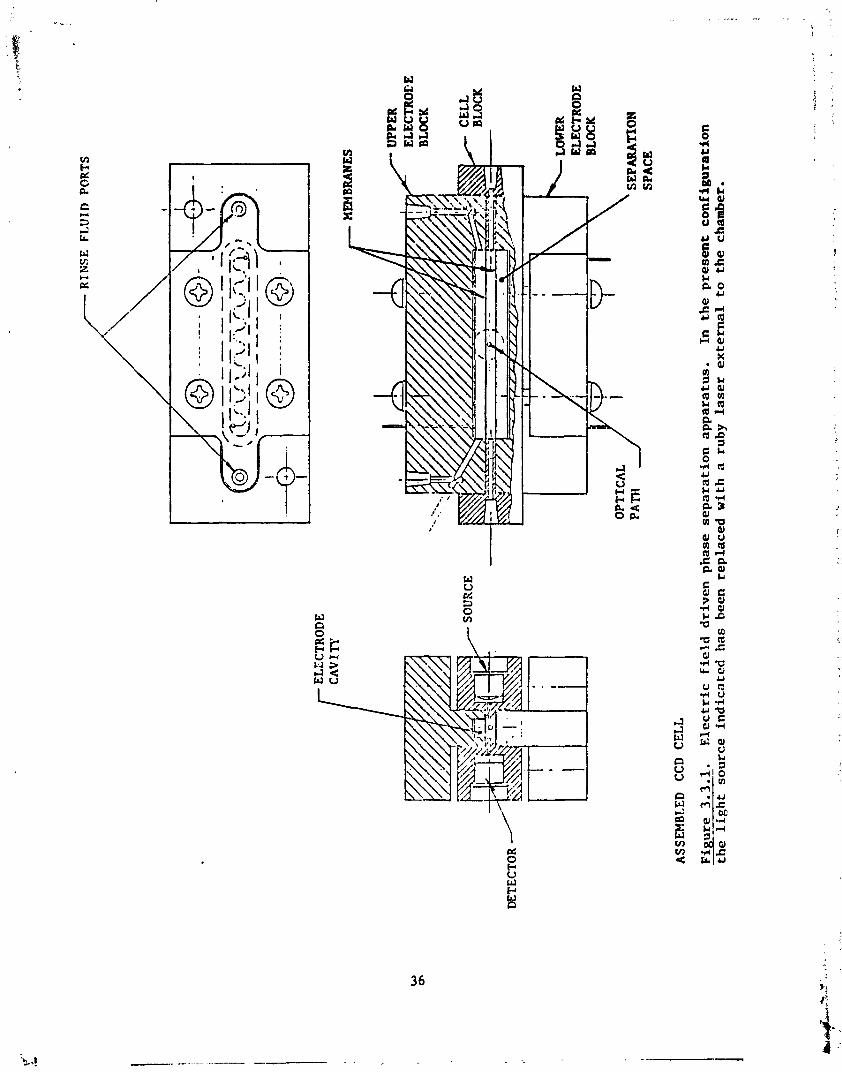
carried out. The apparatus used, shown schematically in Figure 3.3.1, is
that constructed by Beckman Instruments described in Section 1.3.
Measurements were made as follows. The test system was made up at a
particular volume concentration of bottom fraction. It was introduced into
the sample chamber through the inlet port utilizing a syringc, which contained
a small pellet, and a short length of tubing that allowed the syringe to be
shaken and the system mixed. The inlet and outlet lines were then clamped
off to prevent redistribution of the phase volumes via exchange with material
in the tubing. In some cases a T was put into the outlet tube or. the chamber
side of the clamp and a syringe introduced which could be used to apply
approximately 6 cm H20 pressure to the phase system in the chamber. The same
phosphate buffer as was used in the phase systems was passed through the
upper and lower electrode chambers to rinse out electrode products at ii
pressure of aboilt 60 cm of water and flow rates up to 300 mllmin. The
effluent was collected without recirculation. The output from the photo-
detector circuit was displayed on a 100 mv full scale Beckman chart recorder,
the maximum output being set with pure top phase in the sample chamber.
/-- RI
NSE
FL
UID
PO
RT
S
r E
LEC
TRO
DE
MEM
BRAN
ES
SOURCE
DET
ECTO
R
I
ELECTRODE
SPA
CE
ASS
EM
BL
ED
C
CD
CEL
L
Fig
ure
3
.3.1
. E
lec
tric
fie
ld d
riv
en p
ha
se s
epa
rati
on
ap
pa
ratu
s.
In
the
pre
sen
t co
nfi
gu
rati
on
th
e li
gh
t so
urc
e in
dic
ate
d h
as
bee
n r
epla
ced
wit
h a
ru
by
lase
r e
xte
rn
al
to t
he
cha
mbe
r.
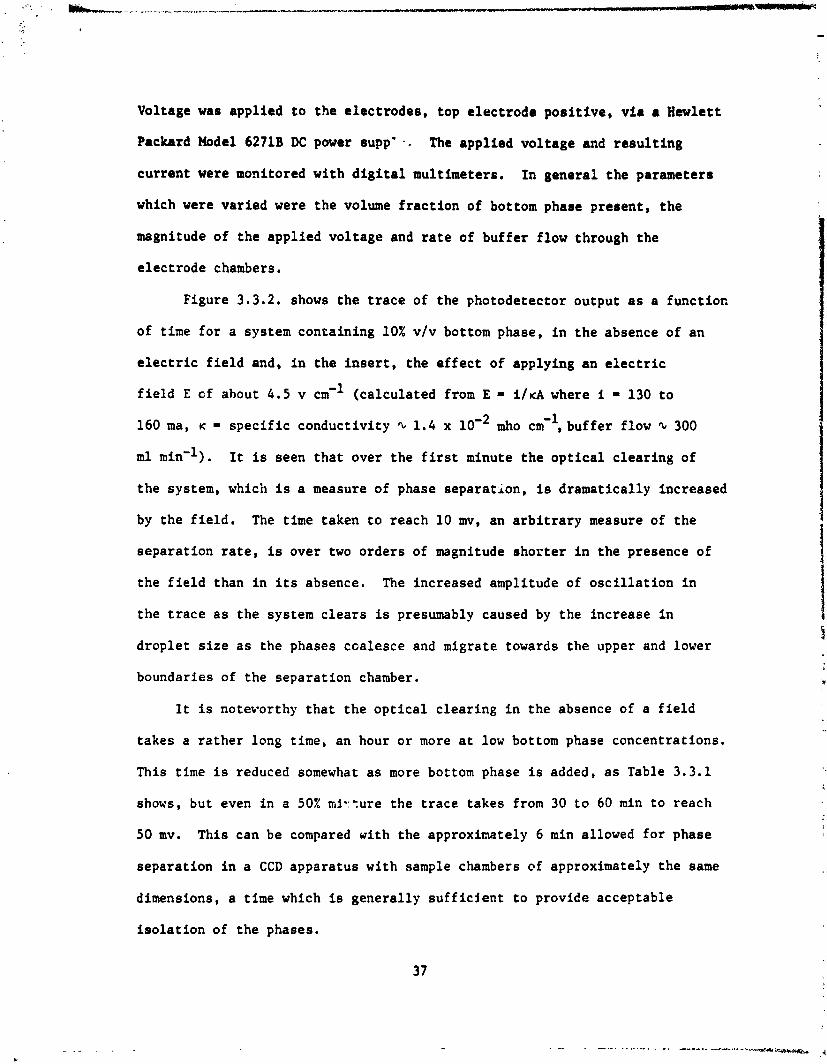
Voltage was applied to the electrodes, top electrode positive, via a Hewlttt
Packard Model 6271B DC power eupp' -. The applied voltage and resulting current were monitored with digital multimeters. In general the parameters
which were varied were the volume fraction of bottom phase present, the
magnitude of the applied voltage and rate of buffer flow through the
electrode chambers.
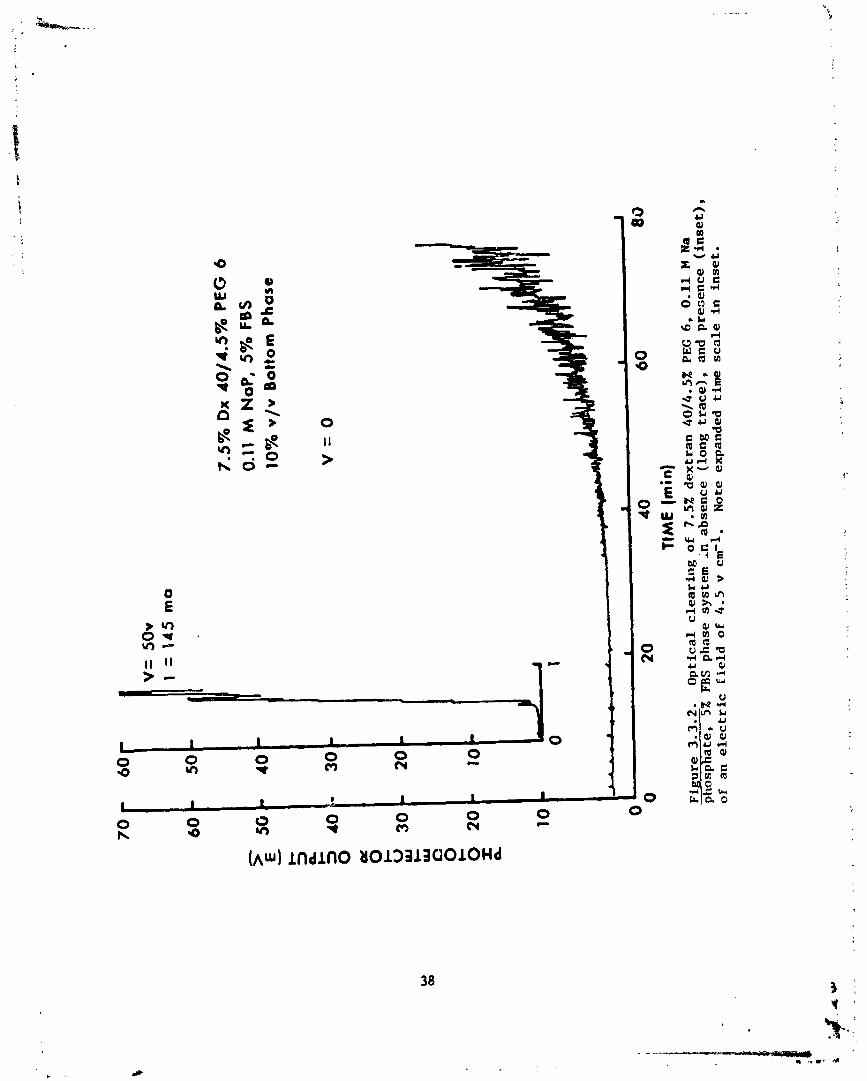
Figure 3.3.2. shows the trace of the photodetector output as a function
of time for a system containing 10% v/v bottom phase, in the absence of an
electric field and, in the insert, the effect of applying an electric
field E of about 4.5 v cm" (calculated from E = ~ / K A where i = 130 to
160 ma, K = specific conductivity Q, 1.4 x lo-* mho em-', buffer flow 1. 300
ml min'l). It is seen that over the first minute the optical clearing of
the system, which is a measure of phase separation, is dramatically increased
by the field. The time taken to reach 10 mv, an arbitrary measure of the
separation rate, is over two orders of magnitude shorter in the presence of
the field than in its absence. The increased amplitude of oscillation in
the trace as the system clears is presumably caused by the increase in
droplet size as the phases coalesce and migrate towards the upper and lower
boundaries of the separation chamber.
It is notevorthy that the optical clearing in the absence of a field
takes a rather long time, an hour or more at low bottom phase concentrations.
This time is reduced somewhat as more bottom phase is added, as Table 3.3.1
shows, but even in a 50% mi.::ure the trace takes from 30 to 60 min to reach
50 mv. This can be compared with the approximately 6 min allowed for phase
separation in a CCD apparatus with sample chambers of approximately the same
dimensions, a time which is generally sufficjent to provide acceptable
isolation of the phases.
o m '4 W C U P l a w N - a J r n n E * a + u t) u \ a obi5 u u a G 003 a c a r o n U d x - x-aJ = 01 . - was' E u u r r b P c o
,u ? g Z
O E l oo" e C E 4 0 s r U m u m a h g r l w u
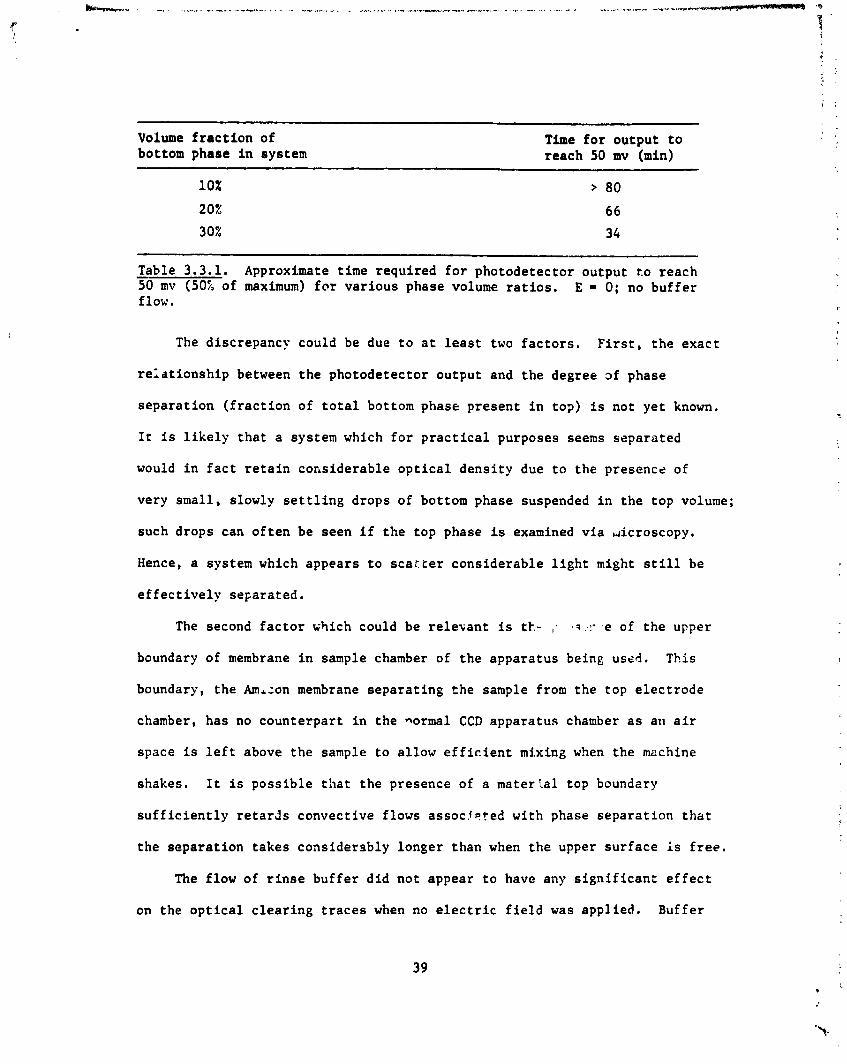
Volume fraction of bottom phase in system
Time for output to reach 50 mv (min)
Table 3.3.1. Approximate time required for photodetector output to reach 50 mv (50% of maximum) for various phase volume ratios. E = 0; no buffer flow.
The discrepancy could be due to at least two factors. First, the exact
relationship between the photodetector output and the degree c~f phase
separation (fraction of total bottom phase present in top) is not yet known.
I r is likely that a system which for practical purposes seems separated
would in fact retain considerable optical density due to the presencs of
very small, slowly settling drops of bottom phase suspended in the top volume;
such drops can often be seen if the top phase is examined via dcroscopy.
Hence, a system which appears to scatter considerable light might still be
effectively separated.
The second factor which could be rele~ant is tk.- ; .;::- .e of the upper
boundary of membrane in sample chamber of the apparatus being us&. This
boundary, the Aml:on membrane separating the sample from the top electrode
chamber, has no counterpart in the -orma1 CCD apparatus chamber as a11 air
space is left above the sample to allow efficient mixing when the machine
shakes. It is possible that the presence of a materLa1 top boundcry
sufficiently retards convective flows assoc!sted with phase separation that
the separation takes considerably longer than when the upper surface is free.
The flow of rinse buffer did not appear to have any significant effect
on the optical clearing traces when no electric field was applied. Buffer
flow was always necessary when the vol tage was turned on, however, i n order
t o remove gas bubbles from the e l ec t rodes and maintain the passage of
current . With the buf fer flow on f u l l (% 300 m l mid1) no d i f f i c u l t y w a s
experienced with maintaining cur ren t a t any des i red l e v e l (up t o a t l e a s t
160 ma) although there was considerable f l uc tua t ion about t he mean value a t
any vol tage se t t i ng , presumably due t o f l uc tua t ions i n r e s i s t ance associated
with the process of bubble geneyation and removal.
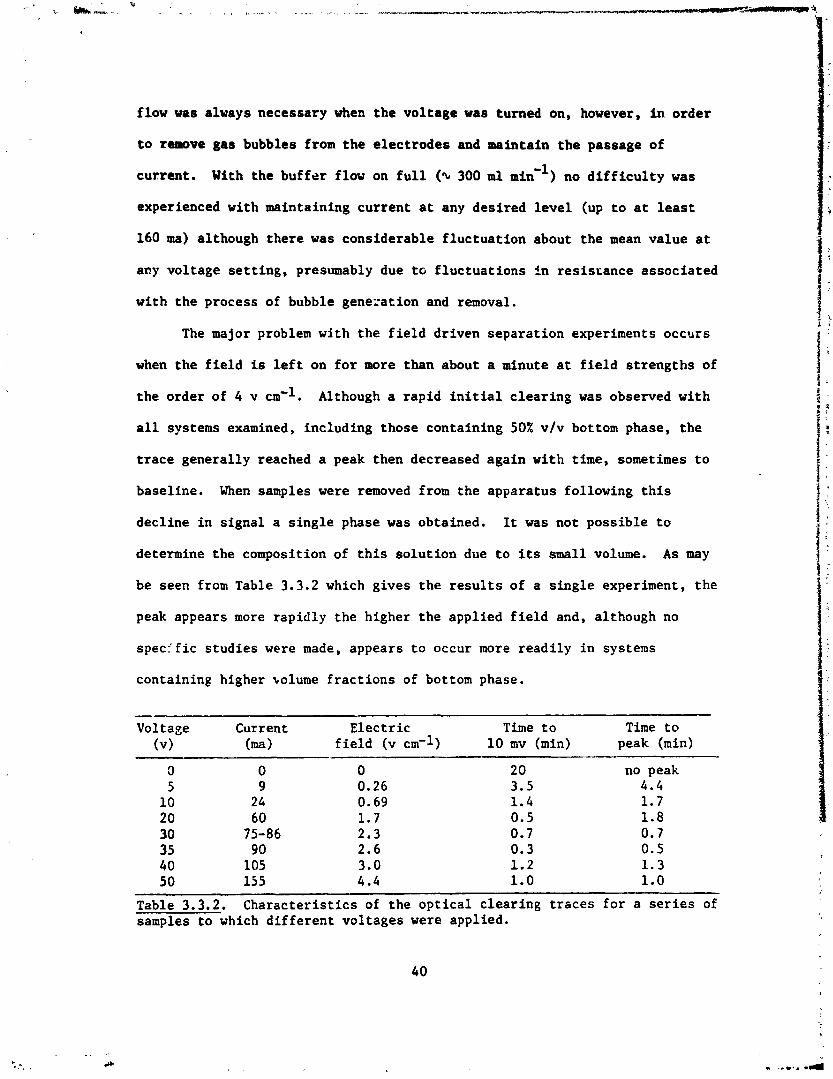
The major problem with the f i e l d dr iven separat ion experiments occurs
when the f i e l d is l e f t on f o r more than about a minute a t f i e l d s t r eng ths of
t he order of 4 v cm'l. Although a rapid i n i t i a l c l ea r ing was observed wi th
a l l systems examined, including those containing 50% v/v bottom phase, t he
t r a c e general ly reached a peak then decreased again with t i m e , sometimes t o
baseline. When samples were removed from the apparatus following t h i s
decl ine i n s igna l a s i n g l e phase was obtained. It was not poss ib le t o
determine the composition of t h i s so lu t ion due t o i ts small volume. A s may
be seen from Table 3.3.2 which gives the r e s u l t s of a s ing le experiment, t he
peak appears more rap id ly the higher the appl ied f i e l d and, although no
spec f f i c s tud ie s were made, appears t o occur more readi ly i n systems
containing higher tolume f r a c t i o n s of bottom phase.
- Voltage Current E lec t r i c Time t o Time t o
(v) (ma) f i e l d (v cm-1) 10 mv (min) peak (min)
no peak 4.4 1.7 1.8 0.7 0.5 1.3 1.0
Table 3.3.2. Charac ter i s t ics of the o p t i c a l c lear ing t r aces f o r a s e r i e s of samples t o which d i f f e r en t vol tages were applied.
Applying hydrostatic presrrure to the sample in the chamber (% 6 cm
H20) had no significant effect on the appearance of the peaknor did
varying the buffer flow. Care was taken to ensure the height of the buffer
reservoir above the sample chamber equalled the distance below the chamber the
outlet tube hung so that the buffer in the electrode chamber was at
approximately ambient pressure.
The system behaves as if, once current is passed, either polymer
selectively passes through the Amicon membranes or, more likely since both
polymers are neutral, electroosmosis through the Amicon membranes drives
phase solution out of the chamber and rinse buffer in to such an extent that
the polymer concentrations drop below the critical point and a single phase
solution results once the system is removed from the chamber and mixed. An
electroosmotic mechanism is consistent with the shortened time of appearance
of the peak with higher fields as under these conditions flow in and out of
the chamber would be more rapid. Presumably the secondary increase in
optical density is associated with the concentration gradients which would
be expected to appear during the postulated process.
It seems very likely, given the system behavior over short times, that
the initial increase in photodetector output is a reflec~ion of field driven
phase separation. A second phenomena, dependent on the presence and magnitude
of the electric field, intervenes however which results in an alteration in
the sample such that a single phase eventually is formed. Neither the nature
of this c?condary event nor strategies to overcome its consequences could be
examined dve to time and effort limitations in the current contract. Further
work in this area,along the lines suggested below, is clearly indicated.

4, DISCUSSION AND RECOBPIENDATIONS
The work described above has adde. considerably to our knowledge of the
behavior of phase systems in an electric field, of the effects of adsorbed
cells on the electrokinetic transport of phase drops and to some of the
practical problems associated with field driven phase separation. A
biocompatible phase system has been developed which bears high droplet
electrophoretic mobilities and the effect of an applied electric field in
accelerating the initial stages of phase separation has been demonstrated.
Within the limits of the present effort it has not been possible to
examine the effects of varying the surface free energies of the two halves
of the sample changer. However, since the interfacial free energy between
the phases is very low the differential wetting effects of each will be
small and it seems highly unlikely that surface effects would be large enough
to significantly effect phase separation over times of the order of a few
minutes.
It is recommended that future work be carried out in the following
areas.
1. Theoretical investigations need to be carried out with a view to
understanding in detail the electrophoretic behavior of isolated phase drops
and the dependence of the mobility on system parameters. The physicochemical
mechanisms responsible for the electrokinetic behavior ought to be examined
and tied in with those factors believed to be responsible for the partition
of cells in these systems. The effects of including solid particles in the
phase drops ard at the interface need to be understood, as do droplet con-
centration effects on the overall electrokinetic transport of a phase drop
emulsion.
iu;i.j&-",&.-*.ad,. I.. R. . 4. l - -1 * . - ?.' db
2. The process of electric field driven phase separation needs further
investigation. In particular, the phenomenon described in Section 3.3 leading
to the dilution of the phase system when the electric field is turned on
must be understood and the effect corrected. There would seem to be a
number of approaches that could be taken. Electroosmotic flow through the
Anicon membranes should be measured. If significant effects are found,
neutral membranes should be sought which would not produce electroosmosis.
Alternatively, it might be possible to replace one of the two limiting
membranes with a type which produced equivalent electroosmosis of the
opposite sign to the Amicon membranes. Appropriate arrangements of the two
could cancel out electroosnotic effects. Another possibility would be to
use membranes with such a small effective pore size that neither polymer
could pass through, thus eliminating the possibility of changing the con-
centration of either in the sample chanber.
3 . Techniques should be examined for rendering neutral polymer phase
systems capable of supporting cell viability for the order of hours at 4 O C
without the necessity of including serum in the systems. Since serum
contains so many complex materials it can be expected to interact with cell
surfaces and affinity ligands incorporated in phase systems in ways which
will degrade the behavior of the systems as separation media. The utility
of adding specific growth factors (insulin; platelet-derived fibroblast
growth factor) to maintain the viability of particular systems of interest
ought to be explored.
4 . Simple experiments to examine phase separation in a low g environment
ought to be flown in the Fluids Experiment System in Spacelab, both in the
absence and presence of electric field. The basic separation kinetics of,
for instance, the 7.5% dextran 4014.5% PEG 6 system ought to be examined as
4 3

a function of applied field strength, droplet mobility, and bottom phase
volume concentration, first in the absence, then in the presence of a
population of stabilized cells such as aldehyde-fixed erythrocytes. In
order to do this simply an understanding of the relationship between the
optical clearing of a system and the concentrations of bath polymers in the
top and bottom volumes must be gained. This can most easily be done by
utilizing polymers labelled with two different isotopes, such as 14c and
3 ~ , and correlating the distribution of the two labels in the top and bottom
volumes with the optical characteristics of the system as a function of time.
The experimental data owes its extent and accuracy to the diligence and
talent of Ms. Cherry Tamblpn and particularlv Charles Zukoski IV who carried
out the measurements described in this report and to whom I am deeply indebted.
I thank also Ms. Janet Cowan for meticulous secretarial and accounting services.
6. REFERENCES
1. Brooks, D.E., Seaman, G.V.F. and Walter, H., Potential distributions in phase-separated aqueous polymer solutions. In: Pi. Kerker (Ed.), Colloid and Interface Science, Vol. 4, Academic Press, NY (1976), p. 367.
2. Levich, V.G., Physicochemical Hydrodynamics, Prentice-Hall, Englewood Cliffs (1962), p. 493.
3. Levine, S. and O'Brien, R.N., A theory of electrophoresis of charged mercury drops in aqueous electrolyte solutions. J. Colloid Interface Sci. 43:616 (1973).
4. Seaman, G.V.F. Electrokinetic behavior of red blood cells. In: Surgenor, D. FlacX. (Ed.) The Red Blood Cell, Vol. 2, Academic Press, W (1975), pp. 1135-1229,
5. Eriksson, E., Albertsson, P-A. and Johansson, G., Hydrophobic surface properties of erythrocytes studied by affinity partition in aqueous two- phase systems. Molec. Cell. Biochem. 10:123 (1976).
6. Brooks, D.E., Greig, R.G. and Janzen, J. ~lechanisms of erythrocyte aggregation. In: Cokelet, G.C., Meiselman, H.J. and Brooks, D.E. Erythrocyte Mechanics and Blood Flow. Alan R. Liss, Inc., W (1980). pp. 119-140.