
EvaluateMedTech_World_Preview_2013
22
World Preview 2013, Outlook to 2018 The Future of Medtech
-
Upload
spenceblack7999 -
Category
Documents
-
view
33 -
download
0
description
Medtech marketr report
Transcript of EvaluateMedTech_World_Preview_2013

World Preview 2013, Outlook to 2018
The Future of Medtech
Welcome to the EvaluateMedTech™ World Preview 2013, Outlook to 2018
Launched in October 2012, the EvaluateMedTech™ service is focused on the medical device and diagnostic industry. Powered by Evaluate’s proven platform and high quality market intelligence, it allows life science and healthcare companies, investment banks, management consultancies, service providers and others to easily track and benchmark the sector and perform rapid analysis.
Our second annual EvaluateMedTech™ World Preview brings together many of our analyses to provide a top level insight into the expected performance of the medtech industry between now and 2018. Based on EvaluateMedTech™’s coverage of the world’s leading medical device and diagnostic companies, the World Preview highlights trends in medtech including consensus sales forecasts of leading industry analysts by device area to 2018, the top 20 companies in 2018, R&D spend current and future, FDA approvals, M&A and venture financing and enterprise value & focus analysis.
About Evaluate Ltd.
Evaluate is the trusted source for high quality commercial market intelligence and exclusive consensus sales forecasts to 2018. Our services are EvaluatePharma®, EvaluateMedTech™ and EvaluateClinicalTrials™. Our award-winning editorial arm, EP Vantage, leverages our market intelligence and analysis to cut through the noise, providing daily opinion and insights. Evaluate’s services give you the insights you need to ask the right questions and get the right answers. That’s intelligence you can act on. For more information visit: www.evaluategroup.com. On Twitter: @evaluatepharma, @evaluatemedtech, @epclinicaltrial, @epvantage
� North America: Debbie Paul Tel: 1-617-573-9453 Email: [email protected]
� Rest of the World: Will Hau Tel: +44 (0)20 7377 0800 Email: [email protected]
� Asia Pacific: Hiroshi Yamazaki Tel: +81 (0)80 1164 4754 Email: [email protected]
� General inquiries about this report: Christine Lindgren Tel: 1-617-573-9458 Email: [email protected]
Disclaimer
All intellectual property rights in this report remain that of Evaluate Ltd and/or its respective third party licensors. Whilst all reasonable steps have been taken to ensure that the data presented are accurate, Evaluate Ltd cannot accept responsibility for errors or omissions. Neither does Evaluate Ltd warrant the accuracy, merchantability or fitness for a particular purpose of the data. Nothing in the reports shall constitute investment, financial or legal advice and the contents of the reports are provided for information purposes only. The data is not intended to amount to advice and should not be used as a determining factor in any investment decision. This report may not be lent, resold, hired out or otherwise disposed of by way of trade in any form of binding or cover other than that in which it is published, without the prior written consent of Evaluate Ltd. Copyright © 2013 Evaluate Ltd. All rights reserved.
September 2013
2Co
pyr
igh
t ©
201
3 Ev
alu
ate
Ltd
. All
rig
hts
res
erve
d.
n the second edition of the EvaluateMedTech™ World Preview we can reveal the medtech market is expected to grow at 4.5% per year (CAGR) between 2012 and 2018, achieving global sales of $455bn in 2018 (page 6). The analysis is based on in-depth forecast models for the top 180 global medtech companies available within EvaluateMedTech™. This sales forecast represents the only current consensus view from equity analysts of the medtech market.
Moving towards specialisation
Though the single biggest medtech company, Johnson & Johnson, is a conglomerate, the prevalent trend in the medtech industry is towards increased company specialisation. Following Abbott’s highly successful split into two separate companies, one medtech, one pharma, and Covidien shedding its pharma operations, we could see a trend in others following suit in order to become smaller and nimbler. Indeed, J&J itself is considering selling its slow-growing diagnostics business; it would not be surprising if broad-based companies such as Siemens or 3M were to separate into more specialised concerns.
Regulatory standards tightening
Both the US and European medtech markets are seeing tightening of the rules governing the approval of medical devices. The proposed changes to the CE marking process currently moving through the European Parliament could see device-makers having to meet higher standards to get their products on sale. In the US, the FDA is considering bringing laboratory-developed tests, currently sold without requiring direct regulatory oversight, under its control – and the agency’s requirements have been getting stricter overall as well. The FDA has approved just 14 new PMAs so far this year – a 42% decline compared with the same point last year (page 12).
VC squeeze
Both changes could potentially lengthen the approval process, and consequently could scare investors away. The medtech industry used to offer venture capitalists a relatively quick return on their investment; VCs will be less keen to stump up cash if they know they have longer to wait for their payday. The 14% drop in the total venture funding in 2012 compared with 2011 suggests this may already be happening (page 19).
Growth and maturing
In vitro diagnostics is not only the largest segment within medtech, with predicted worldwide sales of $58.8bn in 2018, it is also one of the fastest growing, at a rate of 5.1% (page 13). The huge potential of companion diagnostics is one of the drivers here, and the advent of advanced molecular diagnostics is also contributing. If the proposed changes at the FDA take effect they could also spur growth in this market by forcing the withdrawal of many competing laboratory-developed tests from sale.
Elsewhere, though, markets are maturing from a period of fast expansion to one of slower growth. The cardiology, imaging and orthopedic sectors are all growing more slowly than the industry average, and higher regulatory bars and decreased investment could militate against the advent of transformative new technologies.
Ian Strickland Product Manager, EvaluateMedTech™
I
3
EvaluateMedTech™ Foreword
Co
pyr
igh
t ©
201
3 Ev
alu
ate
Ltd
. All
rig
hts
res
erve
d.

EvaluateMedTech™ World Preview 2013, Outlook to 2018 – Analysis Highlights
� Worldwide medtech sales forecast to grow by 4.5% (CAGR 2012 to 2018), reaching $455bn by 2018
� Medtech set to outperform the prescription drug market with a CAGR of 4.5% vs. 3.8% between 2012 and 2018 – but pharma forecast to catch up, with both industries estimated to grow by approximately 5% per year from 2015 to 2018
� Johnson & Johnson forecast to be the clear market leader in 2018 with medtech sales of $33.4bn
� In vitro diagnostics expected to be the world’s largest medtech segment in 2018, with sales of $58.8bn
� Global medtech R&D spend set to grow by 3.9% (CAGR) to $26.7bn in 2018
� Siemens predicted to be the top medtech R&D spender in 2018, with investment in new programmes forecast to reach $2bn, but Abbott’s spending is increasing fast following the AbbVie split
� Number of 1st time PMAs decreases 5% to 41 in 2012; 510(k) clearances up 1% to 3,185
� FDA approves 14 new PMAs in 2013 to end of August, representing a 42% decline compared with the same point last year
� Roche maintains leading position within in vitro diagnostics with sales of $11.3bn in 2018, and market share of 19.3%
� Medtronic maintains top spot in cardiology to 2018 with sales of $9.9bn and a 20% market share
� Johnson & Johnson set to dominate the slow-growing orthopedics market with 2018 market share of 26.6% and sales of $10.6bn
� M&A deal value falls by a startling 79% in H1 2013 vs. H1 2012 and deal count drops 15%
� Total deal value of medtech venture financing falls 14% to $3.8bn in 2012 vs. 2011 but expands 6% to $2.5bn in H1 2013 vs. H1 2012
4Co
pyr
igh
t ©
201
3 Ev
alu
ate
Ltd
. All
rig
hts
res
erve
d.
Johnson & Johnson forecast to be the clear market leader in 2018

Table of Contents
6 Worldwide Medtech Sales by Device Area in 2018
7 Worldwide Medtech Sales in 2018: Top 20 Companies
8 Worldwide Medtech vs. Prescription Drug Sales (2005-18)
9 Worldwide Medtech R&D Spend (2005-2018)
10 Medtech R&D Spend in 2018: Top 20 Companies
11 FDA Device Approval Analysis: 2005 to 2012
12 2013 FDA First Time PMA and HDE Approvals
13 In Vitro Diagnostics (IVD) Market to 2018
14 Cardiology Market to 2018
15 Diagnostic Imaging Market to 2018
16 Orthopedics Market to 2018
17 Ophthalmics Market to 2018
18 M&A Analysis: 2008 to H1 2013
19 Venture Financing Analysis: 2008 to H1 2013
20 Enterprise Value & Focus Analysis: 2013 Latest vs. 2012
5Co
pyr
igh
t ©
201
3 Ev
alu
ate
Ltd
. All
rig
hts
res
erve
d.

6Co
pyr
igh
t ©
201
3 Ev
alu
ate
Ltd
. All
rig
hts
res
erve
d.
In Vitro Diagnostics (IVD)CardiologyDiagnostic Imaging
Orthopedics
OphthalmicsEndoscopy
Drug Delivery
General & Plastic Surgery
Dental
Wound Management
0%
2%
4%
6%
8%
10%
12%
14%
16%
18%
+3.0% +3.5% +4.0% +4.5% +5.0% +5.5% +6.0%
WW
Mark
et
Sh
are
%
% Sales Growth: CAGR 2012-18
Analysis on Top 10 Device Areas in 2018, Market Share & Sales Growth (2012-18)Source: EvaluateMedTech™ (23 SEP 2013)
Note: Bubble = WW Sales in 2018
Worldwide Medtech Sales Forecast to Grow by 4.5% (CAGR) to $455bn by 2018; In Vitro Diagnostics remains Number 1 in 2018EvaluateMedTech™ finds that the market for medtech products, based on the consensus forecast for the leading 180 medtech companies, will grow by 4.5% per year (CAGR) between 2012 and 2018, to $455bn.In vitro diagnostics is expected to be the world's largest medtech segment in 2018, with sales of $58.8bn, beating cardiology and diagnostic imaging to the top spot. The fastest growing of the top 15 segments is neurology, which is set to grow at 6.9% per year (CAGR) between 2012 and 2018, to reach $8bn. Diabetic care and orthopedics are forecast to be the slowest growing segments within the top 15, expanding 3.4% per year (CAGR) between 2012 and 2018.
6
Worldwide Medtech Sales Forecast to Grow by 4.5% (CAGR) to $455bn by 2018; In Vitro Diagnostics remains Number 1 in 2018
EvaluateMedTech™ finds that the market for medtech products, based on the consensus forecast for the leading 180 medtech companies, will grow by 4.5% per year (CAGR) between 2012 and 2018, to $455bn.
In vitro diagnostics is expected to be the world’s largest medtech segment in 2018, with sales of $58.8bn, beating cardiology and diagnostic imaging to the top spot. The fastest growing of the top 15 segments is neurology, which is set to grow at 6.9% per year (CAGR) between 2012 and 2018, to reach $8bn. Diabetic care and orthopedics are forecast to be the slowest growing segments within the top 15, expanding 3.4% per year (CAGR) between 2012 and 2018.
Note: Analysis is based on the top 180 medtech companies. Sales in 2012 based on company reported data. Sales forecasts to 2018 based on a consensus of leading equity analysts’ estimates for segmental sales.
Worldwide MedTech Sales by Device Area in 2018

7Co
pyr
igh
t ©
201
3 Ev
alu
ate
Ltd
. All
rig
hts
res
erve
d.
Worldwide Medtech Sales in 2018: Top 20 Companies
WW Medtech Sales (2012/18): Top 20 Companies & Total Market
2018 Change Rank
Company Country 2012 2018 % CAGR 12-18 vs. Sep 12 ($bn) 2012 2018 Chg. (+/-) Chg. (+/-)
1 Johnson & Johnson USA 27.4 33.4 +3% -4.5 7.9% 7.3% -0.5pp -
2 Siemens Germany 17.7 21.7 +3% +1.6 5.1% 4.8% -0.3pp -
3 Medtronic USA 16.6 19.9 +3% -0.5 4.8% 4.4% -0.4pp -
4 Roche Switzerland 11.0 13.7 +4% +0.4 3.1% 3.0% -0.1pp -
5 General Electric USA 9.8 13.3 +5% -0.2 2.8% 2.9% +0.1pp -
6 Abbott Laboratories USA 9.6 12.7 +5% +0.4 2.8% 2.8% +0.0pp +1
7 Covidien USA 9.6 12.4 +4% -0.3 2.8% 2.7% -0.0pp -1
8 Philips The Netherlands 9.6 12.0 +4% +0.4 2.8% 2.6% -0.1pp -
9 Stryker USA 8.7 11.4 +5% +0.0 2.5% 2.5% +0.0pp -
10 Essilor International France 5.7 9.6 +9% +0.6 1.6% 2.1% +0.5pp +5
11 Novartis Switzerland 6.7 9.0 +5% -0.7 1.9% 2.0% +0.1pp -
12 Danaher USA 6.7 8.7 +5% +0.5 1.9% 1.9% +0.0pp -
13 B. Braun Melsungen Germany 6.5 8.7 +5% +0.3 1.9% 1.9% +0.0pp +1
14 Baxter International USA 5.1 8.6 +9% +1.2 1.4% 1.9% +0.5pp +3
15 Becton Dickinson USA 6.6 8.5 +4% +0.4 1.9% 1.9% -0.0pp -2
16 Boston Scientific USA 7.2 8.3 +2% +0.2 2.1% 1.8% -0.2pp -6
17 Olympus Japan 4.8 7.4 +8% +0.8 1.4% 1.6% +0.3pp +2
18 3M USA 5.0 6.4 +4% +0.1 1.4% 1.4% -0.0pp -
19 St. Jude Medical USA 5.5 6.3 +2% -1.0 1.6% 1.4% -0.2pp -3
20 Fresenius Germany 3.7 5.9 +8% +1.0 1.1% 1.3% +0.2pp +5
Total Top 20 183.5 237.9 +4% +0.7 52.6% 52.3% -0.2pp
Other 165.5 216.7 +5% 47.4% 47.7% +0.2pp
Total 349.0 454.6 +5% 100.0% 100.0%
Source: EvaluateMedTech™ (23 SEP 2013)
WW Market Share WW Medtech Sales ($bn)
33.4
21.719.9
13.7 13.3 12.7 12.4 12.0 11.49.6
0
5
10
15
20
25
30
35
40
Johnson &Johnson
Siemens Medtronic Roche GeneralElectric
AbbottLaboratories
Covidien Philips Stryker EssilorInternational
WW
Med
tech
Sale
s (
$b
n)
WW Medtech in 2018: Top 10 Companies Source: EvaluateMedTech™ (23 SEP 2013)
Note: Analysis is based on the top 180 medtech companies. Sales in 2012 based on company reported data. Sales forecasts to 2018 based on a consensus of leading equity analysts' estimates for segmental sales.2018 Change vs. Sep 12 ($bn) column represents the change in the consensus forecast since September 2012.
Johnson & Johnson Forecast to be Clear Market Leader in Medtech Sales in 2018EvaluateMedTech™ finds that Johnson & Johnson is forecast to be number one medtech company in terms of global medtech sales, with $33.4bn in sales in 2018. Nonetheless its share of the medtech market is expected to fall, from 7.9% in 2012 to 7.3% in 2018.The fastest growing of the top 20 companies follow two very different business strategies. Lens maker Essilor has a very narrow focus, whereas Baxter is active in many disparate areas including dialysis, drug delivery, wound management and regenerative medicine.Between 2012 and 2018 Boston Scientific is forecast to fall six ranking places, from 10th to 16th. With a CAGR of 2% between 2012 and 2018, the company looks likely to struggle to replace sales from its flagging cardiology businesses.
(-) (-) +1 -1 (-) (-) +5
Sales ($bn)CAGR 2012-18 (%)
Ranking Change 2012-18
+3%
+5%
+3%
+4%
+5%+5% +4% +4%
+9%
(-) (-) (-)
+3%
7
Johnson & Johnson Forecast to be Clear Market Leader in Medtech Sales in 2018
EvaluateMedTech™ finds that Johnson & Johnson is forecast to be number one medtech company in terms of global medtech sales, with $33.4bn in sales in 2018. Nonetheless its share of the medtech market is expected to fall, from 7.9% in 2012 to 7.3% in 2018.
The fastest growing of the top 20 companies follow two very different business strategies. Lens maker Essilor has a very narrow focus, whereas Baxter is active in many disparate areas including dialysis, drug delivery, wound management and regenerative medicine.
Between 2012 and 2018 Boston Scientific is forecast to fall six ranking places, from 10th to 16th. With a CAGR of 2% between 2012 and 2018, the company looks likely to struggle to replace sales from its flagging cardiology businesses.
Note: Analysis is based on the top 180 medtech companies. Sales in 2012 based on company reported data. Sales forecasts to 2018 based on a consensus of leading equity analysts’ estimates for segmental sales.
2018 Change vs. Sep 12 ($bn) column represents the change in the consensus forecast since September 2012.
Worldwide Medtech Sales in 2018: Top 20 Companies

8Co
pyr
igh
t ©
201
3 Ev
alu
ate
Ltd
. All
rig
hts
res
erve
d.
Worldwide Medtech vs. Prescription Drug Sales (2005-18)
WW Medtech vs. Prescription Drug Sales (2005-18)
WW Sales ($bn)
Year 2005 2006 2007 2008 2009 2010 2011 2012 2013 2014 2015 2016 2017 2018
WW Medtech Sales 219 241 267 295 299 316 340 349 357 374 394 414 434 455
Growth per Year +9.9% +11.0% +10.5% +1.2% +5.7% +7.9% +2.5% +2.2% +4.8% +5.3% +5.1% +4.9% +4.7%
Medtech as % of Rx 44.3% 44.5% 44.6% 45.5% 45.0% 46.1% 47.0% 49.0% 50.0% 50.7% 50.9% 51.0% 50.9% 51.0%
WW Prescription (Rx) 495 542 599 650 664 684 725 713 713 736 773 812 852 891
Growth per Year +9.4% +10.6% +8.4% +2.2% +3.0% +5.9% -1.7% +0.1% +3.3% +5.0% +5.0% +5.0% +4.6%
Source: EvaluateMedTech™ & EvaluatePharma® (23 SEP 2013)
CAGR 12-18
WW Medtech Sales
WW Prescription Drug Sales
+4.5%
+3.8%
219 241267
295 299 316340 349 357 374 394 414 434 455
495542
599650 664 684
725 713 713 736773
812852
891
0
100
200
300
400
500
600
700
800
900
1,000
2005 2006 2007 2008 2009 2010 2011 2012 2013 2014 2015 2016 2017 2018
WW
Med
tech
& R
x S
ale
s (
$b
n)
WW Medtech vs Prescription Drug Sales 2005-18 Source: EvaluateMedTech™ and EvaluatePharma® (23 SEP 2013)
WW Medtech Sales: +4.5% CAGR 2012-18
Medtech Set to Outperform Prescription Drug Market with 4.5% (CAGR) Growth vs. 3.8% between 2012 and 2018, But Pharma Forecast to Catch UpEvaluateMedTech™ consensus forecast finds that the worldwide market for medtech products is set to outperform the prescription drug market growth with 4.5% growth per year (CAGR) between 2012 and 2018, versus 3.8% for pharmaceuticals. However, from 2015 onwards growth in the prescription drug market is forecast to catch up, with annual growth of 5% forecast each year from 2015 to 2018 for both industries. Overall in 2018 the medtech industry will be 51.0% of the size of the prescription drug market, up from 44.3% in 2005.
Note: Prescription drug sales based on top 500 pharmaceutical and biotech companies from EvaluatePharma®.Sales to 2012 based on company reported sales data. Sales forecasts to 2018 based on a consensus of leading equity analysts' estimates for segmental sales.
10%11% 10%
1%
6%
8%
3% 2%
5%5% 5% 5% 5%
9%11%
8%
2%
3%
6%
-2%
0%
3%
5% 5% 5% 5%
-4%
-2%
0%
2%
4%
6%
8%
10%
12%
14%
2006 2007 2008 2009 2010 2011 2012 2013 2014 2015 2016 2017 2018
WW
Sale
s G
row
th %
WW Growth Rate: Medtech vs. Prescription Drug Sales 2006-18
Medtech Growth per Year
Prescription (Rx) Growth per Year
WW Prescription Sales: +3.8% CAGR 2012-18
2012: Euro crisis impacts euro sales converted to dollars.
2009: World economy contracted -2.2%
8
Medtech Set to Outperform Prescription Drug Market with 4.5% (CAGR) Growth vs. 3.8% between 2012 and 2018, But Pharma Forecast to Catch Up
EvaluateMedTech™ consensus forecast finds that the worldwide market for medtech products is set to outperform the prescription drug market growth with 4.5% growth per year (CAGR) between 2012 and 2018, versus 3.8% for pharmaceuticals. However, from 2015 onwards growth in the prescription drug market is forecast to catch up, with annual growth of 5% forecast each year from 2015 to 2018 for both industries. Overall in 2018 the medtech industry will be 51.0% of the size of the prescription drug market, up from 44.3% in 2005.
Note: Prescription drug sales based on top 500 pharmaceutical and biotech companies from EvaluatePharma®.
Sales to 2012 based on company reported sales data. Sales forecasts to 2018 based on a consensus of leading equity analysts’ estimates for segmental sales.
Worldwide Medtech vs. Prescription Drug Sales (2005-18)

9Co
pyr
igh
t ©
201
3 Ev
alu
ate
Ltd
. All
rig
hts
res
erve
d.
Worldwide Medtech R&D Spend (2005-2018)
WW Medtech R&D Spend by Medtech Companies (2005-2018)
WW Medtech R&D & Medtech Sales ($bn)
Year 2005 2006 2007 2008 2009 2010 2011 2012 2013 2014 2015 2016 2017 2018
Medtech R&D Spend 12.8 14.6 17.0 18.7 18.4 19.4 20.9 21.3 21.9 22.7 23.7 24.7 25.7 26.7
Growth per Year +14.2% +16.4% +9.6% -1.3% +5.5% +7.8% +1.5% +2.9% +4.0% +4.3% +4.2% +4.1% +3.9%
WW Medtech Sales 219 241 267 295 299 316 340 349 357 374 394 414 434 455
R&D as % of Medtech Sales 5.8% 6.1% 6.4% 6.3% 6.2% 6.2% 6.1% 6.1% 6.1% 6.1% 6.0% 6.0% 5.9% 5.9%
R&D as % of Medtech Sales (Top 20 in 2018) 8.0% 7.6%
Source: EvaluateMedTech™ (23 SEP 2013) CAGR 12-18 on Medtech R&D Spend
Cumulative 5 year R&D Spend (2008-12) $99bn
CAGR 08-12 on Medtech R&D Spend +3.3%
+3.9%
1315
1719 18
1921 21 22
2324
2526
27+14.2%
+16.4%
+9.6%
-1.3%
+5.5% +7.8%
+1.5%
+2.9%+4.0% +4.3% +4.2% +4.1% +3.9%
-4%
-2%
0%
2%
4%
6%
8%
10%
12%
14%
16%
18%
0
5
10
15
20
25
30
2005 2006 2007 2008 2009 2010 2011 2012 2013 2014 2015 2016 2017 2018
R&
D S
pen
d G
row
th %
WW
Me
dte
ch
R&
D S
pe
nd
($
bn
)
Worldwide Total Medtech R&D Spend in 2005-18Source: EvaluateMedTech™ (23 SEP 2013)
Global Medtech R&D Spend Set to Grow by 3.9% (CAGR) to $26.7bn by 2018EvaluateMedTech™ consensus forecast finds that worldwide medtech R&D is expected to grow at a healthy 3.9% per year (CAGR) between 2012 and 2018 to $26.7bn. The overall R&D investment rate is expected to be around 5.9% of sales in 2018, slightly down from the 6.1% observed in 2012, perhaps due to companies conserving their cash as payers squeeze prices. Within the top 20 companies the reinvestment rate is higher at 7.6% in 2018, but still down on the 8.0% seen in 2012.
Note: Analysis is based on the Top 180 medtech companies. R&D spend in 2012 based on company reported data. Forecast medtech R&D spend based on a consensus of leading equity analysts' estimates for company level R&D spend, extrapolated to medtech R&D when a company has non-medtech R&D activity.Medtech R&D is not disclosed by a number of companies and this analysis is limited to those companies with sufficient disclosure.
+3.9% CAGR 2012-18
9
Global Medtech R&D Spend Set to Grow by 3.9% (CAGR) to $26.7bn by 2018
EvaluateMedTech™ consensus forecast finds that worldwide medtech R&D is expected to grow at a healthy 3.9% per year (CAGR) between 2012 and 2018 to $26.7bn. The overall R&D investment rate is expected to be around 5.9% of sales in 2018, slightly down from the 6.1% observed in 2012, perhaps due to companies conserving their cash as payers squeeze prices. Within the top 20 companies the reinvestment rate is higher at 7.6% in 2018, but still down on the 8.0% seen in 2012.
Note: Analysis is based on the top 180 medtech companies. R&D spend in 2012 based on company reported data.
Forecast medtech R&D spend based on a consensus of leading equity analysts’ estimates for company level R&D spend, extrapolated to medtech R&D when a company has non-medtech R&D activity.
Medtech R&D is not disclosed by a number of companies and this analysis is limited to those companies with sufficient disclosure.
Worldwide Medtech R&D Spend (2005-2018)
10Co
pyr
igh
t ©
201
3 Ev
alu
ate
Ltd
. All
rig
hts
res
erve
d.
Medtech R&D Spend in 2018: Top 20 Companies
Medtech R&D Spend (2011/18): Top 20 Companies & Total Market
2018 Change Rank
Company 2012 2018 CAGR 12-18 vs. Sep 12 ($m) 2012 2018 Chg. (+/-) Chg. (+/-)
1 Siemens 1,706 2,023 +3% +36 9.6% 9.3% -0.3pp -
2 Johnson & Johnson 1,681 1,899 +2% -173 6.1% 5.7% -0.4pp -
3 Medtronic 1,557 1,823 +3% +9 9.4% 9.1% -0.2pp -
4 Abbott Laboratories 848 1,280 +7% +285 8.7% 10.1% +1.4pp +4
5 Philips 1,032 1,180 +2% +79 10.7% 9.8% -0.9pp -1
6 Roche 1,009 1,157 +2% +111 9.2% 8.4% -0.8pp -1
7 General Electric 960 1,156 +3% -10 9.8% 8.7% -1.1pp -1
8 Boston Scientific 889 991 +2% -5 12.3% 11.9% -0.4pp -1
9 St. Jude Medical 676 749 +2% -124 12.3% 12.0% -0.3pp -
10 Danaher 494 672 +5% +57 7.4% 7.7% +0.3pp -
11 Covidien 479 635 +5% -163 4.9% 5.0% +0.2pp -
12 Stryker 471 616 +5% +27 5.4% 5.4% -0.0pp +1
13 Becton Dickinson 472 591 +4% +47 7.1% 7.0% -0.2pp -1
14 Terumo 328 428 +5% -30 7.8% 7.8% -0.0pp -
15 Edwards Lifesciences 291 383 +5% -45 15.3% 13.4% -2.0pp +1
16 Essilor International 208 340 +9% -3 3.6% 3.5% -0.1pp +6
17 Novartis 285 335 +3% +45 4.3% 3.7% -0.5pp -
18 Olympus 315 334 +1% -5 6.6% 4.5% -2.1pp -3
19 B. Braun Melsungen 246 329 +5% +2 3.8% 3.8% -0.0pp -1
20 bioMérieux 217 272 +4% -17 13.5% 13.2% -0.3pp -
Total Top 20 14,165 17,193 +3% +122 8.0% 7.6% -0.4pp
Other 7,085 9,535 +5%
Total 21,251 26,729 +4% 6.1% 5.9%
Source: EvaluateMedTech™ (23 SEP 2013)
R&D As a % of Medtech SalesMedtech R&D ($m)
2,0231,899
1,823
1,2801,180 1,157 1,156
991
749672
0
500
1,000
1,500
2,000
2,500
Siemens Johnson &Johnson
Medtronic AbbottLaboratories
Philips Roche GeneralElectric
BostonScientific
St. JudeMedical
Danaher
Med
tech
R&
D S
pen
d (
$b
n)
Medtech R&D in 2018: Top 10 CompaniesSource: EvaluateMedTech™ (23 SEP 2013)
Note: Analysis is based on the top 180 medtech companies. R&D spend in 2012 based on company reported data. Forecast medtech R&D spend based on a consensus of leading equity analysts' estimates for company level R&D spend, extrapolated to medtech R&D when a company has non-medtech R&D activity.Medtech R&D is not disclosed by a number of companies and this analysis is limited to those companies with sufficient disclosure.2018 Change vs. Sep 12 ($m) column represents the change in the consensus forecast since September 2012.
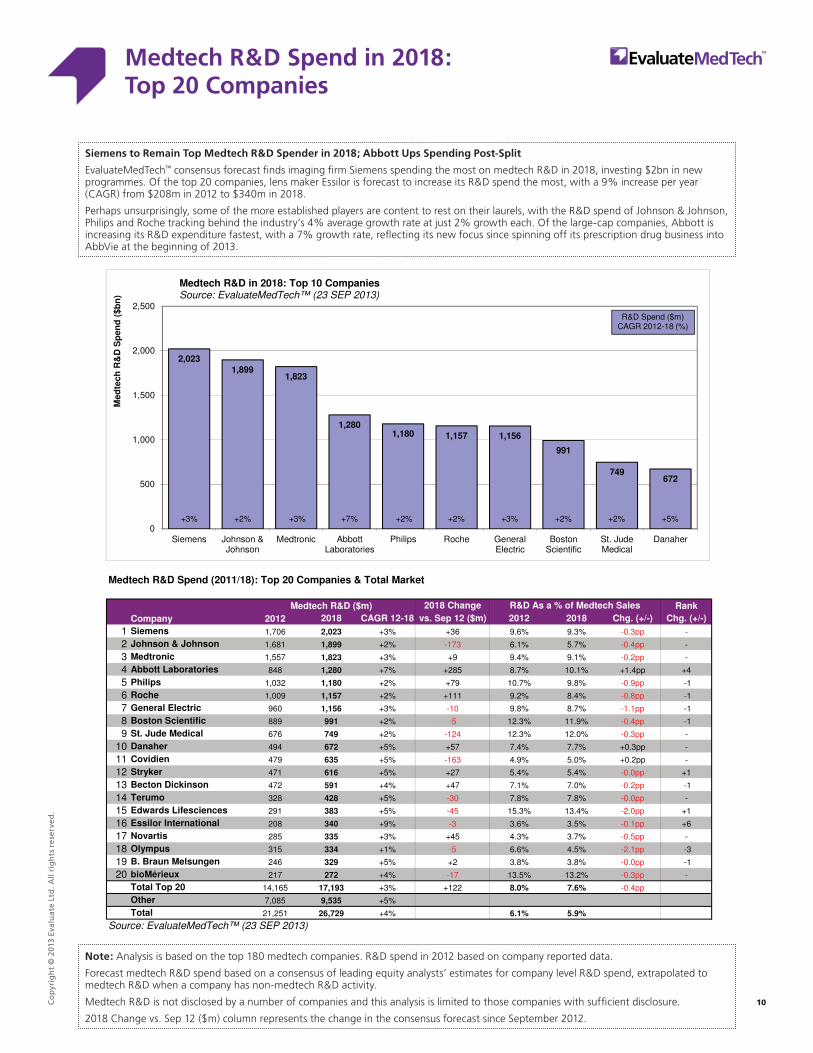
Siemens to Remain Top Medtech R&D Spender in 2018; Abbott Ups Spending Post-SplitEvaluateMedTech™ consensus forecast finds imaging firm Siemens spending the most on medtech R&D in 2018, investing $2bn in new programmes. Of the top 20 companies, lens maker Essilor is forecast to increase its R&D spend the most, with a 9% increase per year (CAGR) from $208m in 2012 to $340m in 2018.Perhaps unsurprisingly, some of the more established players are content to rest on their laurels, with the R&D spend of Johnson & Johnson, Philips and Roche tracking behind the industry’s 4% average growth rate at just 2% growth each. Of the large-cap companies, Abbott is increasing its R&D expenditure fastest, with a 7% growth rate, reflecting its new focus since spinning off its prescription drug business into AbbVie at the beginning of 2013.
+2% +7% +2%+2%+3% +2% +3% +2%
R&D Spend ($m)CAGR 2012-18 (%)
+5%+3%
10
Siemens to Remain Top Medtech R&D Spender in 2018; Abbott Ups Spending Post-Split
EvaluateMedTech™ consensus forecast finds imaging firm Siemens spending the most on medtech R&D in 2018, investing $2bn in new programmes. Of the top 20 companies, lens maker Essilor is forecast to increase its R&D spend the most, with a 9% increase per year (CAGR) from $208m in 2012 to $340m in 2018.
Perhaps unsurprisingly, some of the more established players are content to rest on their laurels, with the R&D spend of Johnson & Johnson, Philips and Roche tracking behind the industry’s 4% average growth rate at just 2% growth each. Of the large-cap companies, Abbott is increasing its R&D expenditure fastest, with a 7% growth rate, reflecting its new focus since spinning off its prescription drug business into AbbVie at the beginning of 2013.
Note: Analysis is based on the top 180 medtech companies. R&D spend in 2012 based on company reported data.
Forecast medtech R&D spend based on a consensus of leading equity analysts’ estimates for company level R&D spend, extrapolated to medtech R&D when a company has non-medtech R&D activity.
Medtech R&D is not disclosed by a number of companies and this analysis is limited to those companies with sufficient disclosure.
2018 Change vs. Sep 12 ($m) column represents the change in the consensus forecast since September 2012.
Medtech R&D Spend in 2018: Top 20 Companies

11Co
pyr
igh
t ©
201
3 Ev
alu
ate
Ltd
. All
rig
hts
res
erve
d.
FDA Device Approval Analysis: 2005 to 2012
FDA Approval Count (1st PMAs/ HDEs/ Supplementary PMAs/ 510(k)s)
Year 2005 2006 2007 2008 2009 2010 2011 2012
1st Time PMA/ HDE/ PDP 34 44 32 30 18 22 43 41
% Chg. +29% -27% -6% -40% +22% +95% -5%
Supplementary PMA/ PDP 735 1,062 1,117 1,488 1,498 1,841 2,192 2,380
% Chg. +44% +5% +33% +1% +23% +19% +9%
510(k) 3,205 3,257 3,035 3,102 3,044 2,850 3,150 3,185
% Chg. +2% -7% +2% -2% -6% +11% +1%
Total 3,974 4,363 4,184 4,620 4,560 4,713 5,385 5,606
% Chg. +10% -4% +10% -1% +3% +14% +4%
2012: FDA Approval Count (1st Time PMAs/ HDEs/ PDPs/ 510(k)s) & Medtech R&D Spend
Company
1 Medtronic
2 Boston Scientific
3 Abbott Laboratories
4 Johnson & Johnson
5 St. Jude Medical
6 Roche
7 Edwards Lifesciences
8 Siemens
9 Novartis
10 Stryker
TotalSource: EvaluateMedTech™ (23 SEP 2013)
0 45
471
41 2,380
0 5 43
3,185
R&D Spend
($m)
1,557
889
848
1,706
285
1 26
1 73
1,681
676
1,009
291
1 114
5 195
2 96
1 158
PMA/ HDEs -
First Approval
PMA/ PDPs -
Suppl.
510(k)
Clearance
Total
Approvals
2 461
1 573
35
45
173
119
81
66
619
498
218
197
52
48
5,606
18
82
14
21
39
7
7
34 44 32 30 18 22 43 41
3,205 3,257
3,035 3,102 3,0442,850
3,150 3,185
735
1,062 1,117
1,488 1,498
1,841
2,1922,380
0
500
1,000
1,500
2,000
2,500
3,000
3,500
0
10
20
30
40
50
60
2005 2006 2007 2008 2009 2010 2011 2012
No
. o
f S
up
PM
As
/ 5
10
(k)s
No
. o
f 1
st
PM
A/
HD
E/ P
DP
FDA Approval Count: 1st PMA/HDE/PDPs, 510(k)s & Supplementary PMA/PDPs Per Year Source: EvaluateMedTech™ (23 SEP 2013)
1st Time PMA/ HDE/ PDP 510(k) Supplementary PMA/ PDP
Number of 1st Time PMAs Decreases 5% to 41; 510(k) Approvals Up 1% to 3,185EvaluateMedTech™ found that the FDA approved 41 new PMAs/HDEs/PDPs (first time approvals) in 2012, a decrease of 5% from the 2011 figure of 43. In 2012 Abbott had the most first PMA/HDE approvals with five, whilst Medtronic had the most overallapprovals with 619. 510(k) clearances held steady, increasing by just 1% year-on-year to 3,185 in 2012.
Note: Based on Devices@FDA data. PMA (Pre-market Approval): a class III device which is a ‘life-sustaining or life-supporting implantable device'; usually require trials. 510(k): "substantially equivalent” to a legally marketed Class I, II, III device (where PMA not required). HDE (Humanitarian Device Exemption): a device for treating or diagnosing a disease/condition that affects <4,000 individuals
11
Number of 1st Time PMAs Decreases 5% to 41; 510(k) Approvals Up 1% to 3,185
EvaluateMedTech™ found that the FDA approved 41 new PMAs/HDEs/PDPs (first time approvals) in 2012, a decrease of 5% from the 2011 figure of 43. In 2012 Abbott had the most first PMA/HDE approvals with five, whilst Medtronic had the most overall approvals with 619. 510(k) clearances held steady, increasing by just 1% year-on-year to 3,185 in 2012.
Note: Based on Devices@FDA data.
PMA (Pre-market Approval): a class III device which is a ‘life-sustaining or life-supporting implantable device’; usually require trials.
510(k): “substantially equivalent” to a legally marketed Class I, II, III device (where PMA not required).
HDE (Humanitarian Device Exemption): a device for treating or diagnosing a disease/condition that affects <4,000 individuals in the US per year.
FDA Device Approval Analysis: 2005 to 2012
12Co
pyr
igh
t ©
201
3 Ev
alu
ate
Ltd
. All
rig
hts
res
erve
d.
2013 FDA First Time PMA and HDE Approvals
2013 FDA First Time PMA Approvals
Level 1 Level 2 Level 3 Company Product Code Name Device Name (Approval Code)Anesthesia &
Respiratory
Anesthesia &
Respiratory
Therapeutic
Devices
Other Anesthesia &
Respiratory
Therapeutic
Devices
03 May 13 Johnson &
Johnson
Computer-Assisted
Personalized Sedation System
SEDASYS COMPUTER-ASSISTED
PERSONALIZED SEDATION SYSTEM (P080009)
Cardiology Cardiac Prosthetic
Devices
Graft Prosthesis 14 Feb 13 Lombard
Medical
Technologies
System, Endovascular Graft,
Aortic Aneurysm Treatment
AORFIX FLEXIBLE STENT GRAFT SYSTEM
(P110032)
Cardiology Cardiovascular
Surgical Devices
Vascular Closure
Devices
31 Jan 13 Cardiva
Medical
Device, Hemostasis, Vascular VASCADE VASCULAR CLOSURE SYSTEM
(P120016)
Cardiology Interventional
Cardiology
Interventional
Catheters &
Guidewires
16 Aug 13 Pfm Medical Occluder, Patent Ductus,
Arteriosus
NIT-OCCLUD PDA (P120009)
Diagnostic Imaging Other Diagnostic
Imaging
Image Analyser
Systems
22 Aug 13 Parascript Analyzer, Medical Image PARASCRIPT ACCUDETECT 6.1.0 (P120004)
General & Plastic
Surgery
Surgical Prosthetic
Devices
Breast Prosthesis 14 Jun 13 Johnson &
Johnson
Prosthesis, Breast,
Noninflatable, Internal,
Silicone Gel-Filled
MENTOR MEMORYSHAPE BREAST IMPLANTS
(P060028)
General & Plastic
Surgery
Surgical Prosthetic
Devices
Breast Prosthesis 20 Feb 13 Allergan Prosthesis, Breast,
Noninflatable, Internal,
Silicone Gel-Filled
NATRELLE HIGHLY COHESIVE SILICONE-
FILLED BREAST IMPLANTS (P040046)
In Vitro Diagnostics
(IVD)
Molecular
Diagnostics
Infectious Disease
Molecular
Diagnostics
20 Jun 13 Abbott
Laboratories
Assay, Genotyping, Hepatitis
C Virus
ABBOTT REALTIME HCV GENOTYPE II, ABBOTT
REALTIME HCV GENOTYPE II CONTROL KIT,
URACIL-N-GLYCOSYLASE (UNG) (P120012)
In Vitro Diagnostics
(IVD)
Molecular
Diagnostics
Oncology Molecular
Diagnostics
12 Jul 13 QIAGEN Somatic Gene Mutation
Detection System
THERASCREEN EGFR RGQ PCR KIT (P120022)
In Vitro Diagnostics
(IVD)
Molecular
Diagnostics
Oncology Molecular
Diagnostics
29 May 13 bioMérieux Somatic Gene Mutation
Detection System
BIOMERIEUX THXID BRAF ASSAY KIT (P120014)
In Vitro Diagnostics
(IVD)
Molecular
Diagnostics
Oncology Molecular
Diagnostics
14 May 13 Roche Somatic Gene Mutation
Detection System
COBAS EGFR MUTATION TEST (P120019)
Orthopedics Spinal Devices Other Spinal
Devices
23 Aug 13 LDR Prosthesis, Intervertebral Disc MOBI-C CERVICAL DISC PROSTHESIS (TWO-
LEVEL INDICATION) (P110009)
Orthopedics Spinal Devices Other Spinal
Devices
07 Aug 13 LDR Prosthesis, Intervertebral Disc MOBI-C CERVICAL DISC PROSTHESIS (ONE-
LEVEL INDICATION) (P110002)
Wound Management Wound Closure
Devices
Surgical Sealants 01 Mar 13 Tenaxis
Medical
Sealant, Polymerizing ARTERX SURGICAL SEALANT (P100030)
2013 FDA HDE Approvals
Level 1 Level 2 Level 3 Company Product Code Name Device Name (Approval Code)Ophthalmics Ophthalmic
Prosthetic Devices
Other Ophthalmic
Prosthetic Devices
13 Feb 13 Second Sight
Medical
Products
Prosthesis, Retinal ARGUS® II RETINAL PROSTHESIS SYSTEM
(H110002)
Source: EvaluateMedTech™ (23 SEP 2013)
EvaluateMedTech Device Classification Decision
Date
EvaluateMedTech Device Classification Decision
Date
FDA Approves 14 New PMAs in 2013 to end of August, Representing a 42% Decline Compared with the Same Point Last YearEvaluateMedTech™ found that the FDA has so far approved just 14 new PMAs (pre-market approvals) and one HDE in 2013 to August 31st. This represents a 42% decline compared with the 24 new PMAs that had been approved at this point last year, perhaps reflecting tighter regulatory standards at the FDA.Four of the 14 approvals (29%) so far this year are in the fast growing molecular diagnostic area.
Note: Based on Devices@FDA data to 31st August 2013.PMA (Pre-market Approval): a class III device which is a ‘life-sustaining or life-supporting implantable device'; usually require trials. HDE (Humanitarian Device Exemption): a device for treating or diagnosing a disease/condition that affects <4,000 individuals in the US per year.
12
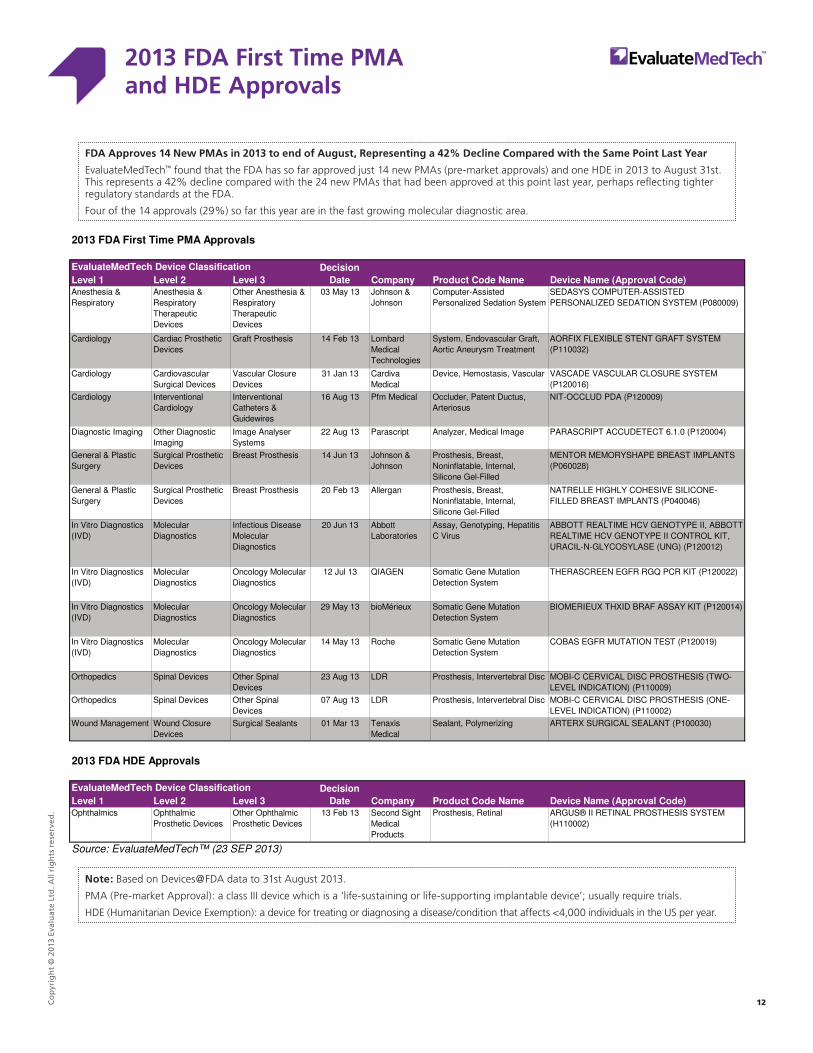
FDA Approves 14 New PMAs in 2013 to end of August, Representing a 42% Decline Compared with the Same Point Last Year
EvaluateMedTech™ found that the FDA has so far approved just 14 new PMAs (pre-market approvals) and one HDE in 2013 to August 31st. This represents a 42% decline compared with the 24 new PMAs that had been approved at this point last year, perhaps reflecting tighter regulatory standards at the FDA.
Four of the 14 approvals (29%) so far this year are in the fast growing molecular diagnostic area.
Note: Based on Devices@FDA data to 31st August 2013.
PMA (Pre-market Approval): a class III device which is a ‘life-sustaining or life-supporting implantable device’; usually require trials.
HDE (Humanitarian Device Exemption): a device for treating or diagnosing a disease/condition that affects <4,000 individuals in the US per year.
2013 FDA First Time PMA and HDE Approvals

13Co
pyr
igh
t ©
201
3 Ev
alu
ate
Ltd
. All
rig
hts
res
erve
d.
In Vitro Diagnostics (IVD) Market to 2018
Top 10 Companies & Total WW In Vitro Diagnostics Sales 2012-18
CAGR 2018 Change Rank Chg.
Rank Company 2012 2018 2012-18 vs. Sep 12 ($m) 2012 2018 2012-18
1 Roche 8,216 11,329 +6% +586 18.8% 19.3% -
2 Abbott Laboratories 4,292 6,292 +7% +647 9.8% 10.7% +2
3 Danaher 4,628 6,197 +5% +452 10.6% 10.5% -
4 Siemens 5,153 6,073 +3% +330 11.8% 10.3% -2
5 Thermo Fisher Scientific 2,912 3,749 +4% -58 6.7% 6.4% -
6 Becton Dickinson 2,538 3,203 +4% +62 5.8% 5.4% -
7 Alere 2,110 2,808 +5% +33 4.8% 4.8% -
8 Sysmex 1,666 2,542 +7% -535 3.8% 4.3% +1
9 Johnson & Johnson 2,069 2,143 +1% -427 4.7% 3.6% -1
10 bioMérieux 1,609 2,064 +4% -27 3.7% 3.5% -
Top 10 35,194 46,400 +5% +1062 80.7% 78.9%
Other 8,421 12,389 +7% 19.3% 21.1%
Total Industry 43,614 58,789 +5.1% 100.0% 100.0%
Source: EvaluateMedTech™ (23 SEP 2013); Consensus sales from equity analysts' reports
WW Sales ($m) WW Market Share
0%
20%
40%
60%
80%
100%
120%
140%
0 0.2 0.4 0.6 0.8 1 1.2 1.4
WW
Mark
et
Sh
are
%
% Sales Growth: CAGR 2011-18
Takeda: Actos generic competition expected 2012.
Note: Bubble = WW Sales in 2018
Novo: Solid growth in its core insulin franchise, including Tresiba (insulin degludec), and GLP-1 Victoza (liraglutide).
Merck: Strong growth in DPP-IV inhibitor
Roche Maintains Leading Position within In Vitro Diagnostics Market; J&J FlagsEvaluateMedTech™ consensus forecast finds Swiss giant Roche is the clear market leader within in vitro diagnostics with sales of $11.3bn in 2018, and a 19.3% market share*. But arguably the real success story is Abbott, which is expected to jump two ranking places to second spot between 2012 and 2018, with 2018 sales of $6.3bn.Conversely, Johnson & Johnson's diagnostic business is the slowest growing of the top 10 companies, with sales growing 1% (CAGR) between 2012 and 2018, a factor that may have influenced its recent decision to look for a buyer for the flagging business.
Roche
Abbott LaboratoriesDanaherSiemens
Thermo Fisher Scientific
0%
5%
10%
15%
20%
25%
+0% +1% +2% +3% +4% +5% +6% +7% +8% +9%
WW
Mark
et
Sh
are
%
% Sales Growth: CAGR 2012-18Note: Bubble = WW Sales in 2018
Analysis on WW Sales, Market Share & Sales Growth (2012-18)Source: EvaluateMedTech™ (23 SEP 2013)
Note: *Excludes Glucose Test Systems which are included in Diabetic Care classification.2018 Change vs. Sep 12 ($m) column represents the change in the consensus forecast since September 2012.
Abbott: Strong growth from Point of Care and Molecular Diagnostics
13
Roche Maintains Leading Position within In Vitro Diagnostics Market; J&J Flags
EvaluateMedTech™ consensus forecast finds Swiss giant Roche is the clear market leader within in vitro diagnostics with sales of $11.3bn in 2018, and a 19.3% market share*. But arguably the real success story is Abbott, which is expected to jump two ranking places to second spot between 2012 and 2018, with 2018 sales of $6.3bn.
Conversely, Johnson & Johnson’s diagnostic business is the slowest growing of the top 10 companies, with sales growing 1% (CAGR) between 2012 and 2018, a factor that may have influenced its recent decision to look for a buyer for the flagging business.
Note: *Excludes Glucose Test Systems which are included in Diabetic Care classification.
2018 Change vs. Sep 12 ($m) column represents the change in the consensus forecast since September 2012.
In Vitro Diagnostics (IVD) Market to 2018

14Co
pyr
igh
t ©
201
3 Ev
alu
ate
Ltd
. All
rig
hts
res
erve
d.
Cardiology Market to 2018
Top 10 Companies & Total WW Cardiology Sales 2012-18
CAGR 2018 Change Rank Chg.
Rank Company 2012 2018 2012-18 vs. Sep 12 ($m) 2012 2018 2012-18
1 Medtronic 8,695 9,866 +2% -487 22.8% 20.2% -
2 St. Jude Medical 5,080 5,662 +2% -893 13.3% 11.6% -
3 Boston Scientific 5,008 5,319 +1% +197 13.1% 10.9% -
4 Abbott Laboratories 2,925 3,532 +3% -33 7.7% 7.2% -
5 Edwards Lifesciences 1,866 2,826 +7% -665 4.9% 5.8% +2
6 Johnson & Johnson 1,985 2,667 +5% +22 5.2% 5.5% -1
7 Getinge 1,934 2,626 +5% +21 5.1% 5.4% -1
8 Terumo 1,775 2,558 +6% -5 4.7% 5.2% -
9 Covidien 1,602 2,192 +5% -200 4.2% 4.5% -
10 Asahi Kasei 653 1,498 +15% +82 1.7% 3.1% +3
Top 10 31,522 38,747 +3% -1961 82.6% 79.5%
Other 6,627 9,991 +7% 17.4% 20.5%
Total Industry 38,149 48,738 +4.2% 100.0% 100.0%
Source: EvaluateMedTech™ (23 SEP 2013); Consensus sales from equity analysts' reports.
WW Sales ($m) WW Market Share
Takeda: Actos generic competition expected 2012.
Note: Bubble = WW Sales in 2018
Merck: Strong growth in DPP-IV inhibitor
Takeda: Actos generic competition expected 2012.
Note: Bubble = WW Sales in 2018
Merck: Strong growth in DPP-IV inhibitor
Medtronic Set to Maintain Number 1 Position in Cardiology to 2018 but Asahi Kasei Growing FastEvaluateMedTech™ consensus forecast finds that Medtronic will remain the world's number one cardiology company with global sales of $9.9bn in 2018 and a market share of 20%. Asahi Kasei is set to be the fastest growing cardiology company in the top 10 with expected 15% per year growth (CAGR) between 2012 & 2018, driven by its acquisition of ZOLL Medical in 2012.
Medtronic
St. Jude Medical
Boston Scientific
Abbott Laboratories
Edwards Lifesciences
0%
5%
10%
15%
20%
25%
30%
+0% +1% +2% +3% +4% +5% +6% +7% +8% +9%
WW
Ma
rke
t S
ha
re %
% Sales Growth: CAGR 2012-18Note: Bubble = WW Sales in 2018
Note: General Electric & Philips do not disclose cardiology sales.2018 Change vs. Sep 12 ($m) column represents the change in the consensus forecast since September 2012.
Edwards: Solid growth in transcatheter heart valves segment.
Analysis on WW Sales, Market Share & Sales Growth (2012-18)Source: EvaluateMedTech™ (23 SEP 2013)
14
Medtronic Set to Maintain Number 1 Position in Cardiology to 2018 but Asahi Kasei Growing Fast
EvaluateMedTech™ consensus forecast finds that Medtronic will remain the world’s number one cardiology company with global sales of $9.9bn in 2018 and a market share of 20%. Asahi Kasei is set to be the fastest growing cardiology company in the top 10 with expected 15% per year growth (CAGR) between 2012 & 2018, driven by its acquisition of ZOLL Medical in 2012.
Note: General Electric & Philips do not disclose cardiology sales.
2018 Change vs. Sep 12 ($m) column represents the change in the consensus forecast since September 2012.
Cardiology Market to 2018

15Co
pyr
igh
t ©
201
3 Ev
alu
ate
Ltd
. All
rig
hts
res
erve
d.
Diagnostic Imaging Market to 2018
Top 10 Companies & Total WW Diagnostic Imaging Sales 2012-18
CAGR 2018 Change Rank Chg.
Rank Company 2012 2018 2012-18 vs. Sep 12 ($m) 2012 2018 2012-18
1 Siemens 10,421 12,959 +4% +1031 28.9% 28.7% -
2 General Electric 8,414 11,353 +5% -178 23.3% 25.2% -
3 Philips 4,878 6,162 +4% +200 13.5% 13.7% -
4 Toshiba 4,522 4,806 +1% -1047 12.5% 10.6% -
5 Carestream Health 1,525 1,977 +4% -55 4.2% 4.4% -
6 Hitachi Medical 1,344 1,329 -0% -520 3.7% 2.9% -
7 Agfa-Gevaert 951 986 +1% +69 2.6% 2.2% -
8 Konica Minolta 880 869 -0% -287 2.4% 1.9% -
9 Varian Medical Systems 493 757 +7% +11 1.4% 1.7% +1
10 Shimadzu 667 741 +2% -112 1.8% 1.6% -1
Top 10 34,094 41,939 +4% -889 94.5% 92.9%
Other 1,985 3,200 +8% 5.5% 7.1%
Total Industry 36,079 45,139 +3.8% 100.0% 100.0%
Source: EvaluateMedTech™ (23 SEP 2013); Consensus sales from equity analysts' reports
WW Sales ($m) WW Market Share
Siemens and General Electric to Retain Leading Positions in 2018EvaluateMedTech™ consensus forecast finds that Siemens and General Electric remain the dominant forces in the diagnostic imaging industry in 2018, with a combined market share of 53.9%. Of the two, Siemens is forecast to be the world's leading diagnostic imaging company in 2018 – just as it was in 2012 – based on worldwide sales of $13bn and a 28.7% market share. General Electric is set to close the gap on Siemens, though, with sales expected to grow by 5% per year (CAGR) to $11.4bn in 2018. Overall, the diagnostic imaging market is set to grow at 3.8% per year (CAGR) to $45.1bn in 2018.
Siemens
General Electric
Philips
Toshiba
Carestream Health
0%
5%
10%
15%
20%
25%
30%
35%
40%
+0% +1% +2% +3% +4% +5% +6% +7%
WW
Mark
et
Sh
are
%
% Sales Growth: CAGR 2012-18Note: Bubble = WW Sales in 2018
Note: Segment sales include servicing of machines.FUJIFILM's Diagnostic Imaging sales are not available.2018 Change vs. Sep 12 ($m) column represents the change in the consensus forecast since September 2012.
Analysis on WW Sales, Market Share & Sales Growth (2012-18)Source: EvaluateMedTech™ (23 SEP 2013)
15
Siemens and General Electric to Retain Leading Positions in 2018
EvaluateMedTech™ consensus forecast finds that Siemens and General Electric remain the dominant forces in the diagnostic imaging industry in 2018, with a combined market share of 53.9%. Of the two, Siemens is forecast to be the world’s leading diagnostic imaging company in 2018 – just as it was in 2012 – based on worldwide sales of $13bn and a 28.7% market share. General Electric is set to close the gap on Siemens, though, with sales expected to grow by 5% per year (CAGR) to $11.4bn in 2018. Overall, the diagnostic imaging market is set to grow at 3.8% per year (CAGR) to $45.1bn in 2018.
Note: Segment sales include servicing of machines.
FUJIFILM’s Diagnostic Imaging sales are not available.
2018 Change vs. Sep 12 ($m) column represents the change in the consensus forecast since September 2012
Diagnostic Imaging Market to 2018

16Co
pyr
igh
t ©
201
3 Ev
alu
ate
Ltd
. All
rig
hts
res
erve
d.
Orthopedics Market to 2018
Top 10 Companies & Total WW Orthopedics Sales 2012-18
CAGR 2018 Change Rank Chg.
Rank Company 2012 2018 2012-18 vs. Sep 12 ($m) 2012 2018 2012-18
1 Johnson & Johnson 7,238 10,642 +7% -503 22.1% 26.6% -
2 Stryker 4,932 6,402 +4% +321 15.1% 16.0% -
3 Zimmer 4,234 5,274 +4% +91 12.9% 13.2% -
4 Biomet 2,796 3,360 +3% -84 8.5% 8.4% +1
5 Medtronic 3,131 3,244 +1% -82 9.6% 8.1% -1
6 Smith & Nephew 2,178 2,394 +2% -261 6.7% 6.0% -
7 Arthrex 1,080 1,575 +6% n/a 3.3% 3.9% +1
8 NuVasive 581 844 +6% -58 1.8% 2.1% +1
9 Globus Medical 386 746 +12% n/a 1.2% 1.9% +4
10 Wright Medical Group 484 706 +6% +118 1.5% 1.8% +1
Top 10 27,040 35,187 +4% -458 82.6% 88.0%
Other 5,684 4,815 -3% 17.4% 12.0%
Total Industry 32,724 40,003 +3.4% 100.0% 100.0%
Source: EvaluateMedTech™ (23 SEP 2013); Consensus sales from equity analysts' reports
WW Sales ($m) WW Market Share
Johnson & Johnson
Stryker
Zimmer
BiometMedtronic
0%
5%
10%
15%
20%
25%
30%
35%
+0% +1% +2% +3% +4% +5% +6% +7% +8% +9%
WW
Mark
et
Sh
are
%
% Sales Growth: CAGR 2012-18Note: Bubble = WW Sales in 2018Note: Bubble = WW Sales in 2018
Johnson & Johnson Set to Entrench Domination of Slow-Growing Orthopedics Market EvaluateMedTech™ consensus forecast finds that, despite high-profile failures with some of its joint products, Johnson & Johnson is due to be the clear dominant force in orthopedics. It is forecast to command an even greater market share in 2018, 26.6%, than the already-leading 22.1% in 2012, largely owing to its acquisition of Synthes in June 2012.Overall, the orthopedics market is set to grow at 3.4% per year (CAGR), slower growth than the medtech industry as a whole, reflecting a lack of technological breakthroughs in a maturing market.
Note: Bubble = WW Sales in 2018
JNJ: Acquired Synthes in June 2012 for $19.7bn.
Analysis on WW Sales, Market Share & Sales Growth (2012-18)Source: EvaluateMedTech™ (23 SEP 2013)
Note: 2018 Change vs. Sep 12 ($m) column represents the change in the consensus forecast since September 2012.
16
Johnson & Johnson Set to Entrench Domination of Slow-Growing Orthopedics Market
EvaluateMedTech™ consensus forecast finds that, despite high-profile failures with some of its joint products, Johnson & Johnson is due to be the clear dominant force in orthopedics. It is forecast to command an even greater market share in 2018, 26.6%, than the already-leading 22.1% in 2012, largely owing to its acquisition of Synthes in June 2012.
Overall, the orthopedics market is set to grow at 3.4% per year (CAGR), slower growth than the medtech industry as a whole, reflecting a lack of technological breakthroughs in a maturing market.
Note: 2018 Change vs. Sep 12 ($m) column represents the change in the consensus forecast since September 2012.
Orthopedics Market to 2018

17Co
pyr
igh
t ©
201
3 Ev
alu
ate
Ltd
. All
rig
hts
res
erve
d.
Ophthalmics Market to 2018
Top 10 Companies & Total WW Ophthalmics Sales 2012-18
CAGR 2018 Change Rank Chg.
Rank Company 2012 2018 2012-18 vs. Sep 12 ($m) 2012 2018 2012-18
1 Essilor International 5,716 9,591 +9% +632 24.2% 29.1% +1
2 Novartis 6,206 8,479 +5% -703 26.3% 25.7% -1
3 Johnson & Johnson 2,996 3,519 +3% -376 12.7% 10.7% -
4 HOYA 1,958 2,564 +5% -257 8.3% 7.8% -
5 Valeant Pharmaceuticals* 1,750 2,448 +6% new entry 7.4% 7.4% new entry
6 Carl Zeiss 1,745 2,056 +3% -202 7.4% 6.2% -
7 The Cooper Companies 1,189 1,744 +7% +46 5.0% 5.3% -
8 Abbott Laboratories 1,097 1,322 +3% -124 4.7% 4.0% -
9 TOPCON 376 538 +6% -1 1.6% 1.6% -
10 NIDEK 370 397 +1% -102 1.6% 1.2% -
Top 10 23,402 32,658 +6% -1085 99.2% 99.2%
Other 188 279 0.8% 0.8%
Total Industry 23,590 32,937 +5.7% 100.0% 100.0%
Source: EvaluateMedTech™ (23 SEP 2013); Consensus sales from equity analysts' reports
WW Sales ($m) WW Market Share
0%
20%
40%
60%
80%
100%
120%
140%
0 0.2 0.4 0.6 0.8 1 1.2 1.4
WW
Mark
et
Sh
are
%
% Sales Growth: CAGR 2011-18
Takeda: Actos generic competition expected 2012.
Note: Bubble = WW Sales in 2018
Novo: Solid growth in its core insulin franchise, including Tresiba (insulin degludec), and GLP-1 Victoza (liraglutide).
Merck: Strong growth in DPP-IV inhibitor
Essilor To Replace Novartis as Top Ophthalmics Company by 2018EvaluateMedTech™ consensus forecast finds that Essilor will take over from Novartis as the leading ophthalmics company in 2018 with global sales of $9.6bn. The French maker of optical lenses is expected to demonstrate strong year-on-year growth of 9% between 2012 and 2018.Elsewhere, a new player has entered the game: Valeant Pharmaceuticals debuts in the top 10 at number 5 following its August 2013 acquisition of Bausch & Lomb, with 2018 sales forecast to reach $2.4bn.
Essilor International
Novartis
Johnson & Johnson
HOYA Valeant Pharmaceuticals*
0%
5%
10%
15%
20%
25%
30%
35%
40%
+0% +2% +4% +6% +8% +10% +12%
WW
Ma
rke
t S
ha
re %
% Sales Growth: CAGR 2012-18Note: Bubble = WW Sales in 2018
Valeant: Entered the Ophthalmics space in 2013 following acquisition of Bausch + Lomb
Note: *2012 sales figure and market share for Valeant represent those of Bausch + Lomb prior to acquisition.2018 Change vs. Sep 12 ($m) column represents the change in the consensus forecast since September 2012.
Analysis on WW Sales, Market Share & Sales Growth (2012-18)Source: EvaluateMedTech™ (23 SEP 2013)
17
Essilor To Replace Novartis as Top Ophthalmics Company by 2018
EvaluateMedTech™ consensus forecast finds that Essilor will take over from Novartis as the leading ophthalmics company in 2018 with global sales of $9.6bn. The French maker of optical lenses is expected to demonstrate strong year-on-year growth of 9% between 2012 and 2018.
Elsewhere, a new player has entered the game: Valeant Pharmaceuticals debuts in the top 10 at number 5 following its August 2013 acquisition of Bausch & Lomb, with 2018 sales forecast to reach $2.4bn.
Note: *2012 sales figure and market share for Valeant represent those of Bausch + Lomb prior to acquisition.
2018 Change vs. Sep 12 ($m) column represents the change in the consensus forecast since September 2012.
Ophthalmics Market to 2018

18Co
pyr
igh
t ©
201
3 Ev
alu
ate
Ltd
. All
rig
hts
res
erve
d.
M&A Analysis: 2008 to H1 2013
Count of Medtech M&A Deals vs. Total Medtech M&A Value (2008 - H1 2013)
Year 2008 2009 2010 2011 2012 H1 2012 H1 2013
Deal Count 209 164 253 246 224 112 95
% Chg. -22% 54% -3% -9% -15%
Deal Value ($bn) 36 13 50 77 46 31 6
% Chg. -65% 293% 55% -41% -79%
Top 10 MedTech M&A Closed Deals in H1 2013: Ranked on Deal Value
Completion Deal
Target Country (Status) Acquiror Date Value ($m)
1 Conceptus USA (Listed) Bayer 05 Jun 13 1,100
2 Trauson China (Listed) Stryker 01 Mar 13 764
3 Technolas Perfect Vision Germany (Private) Bausch + Lomb 28 Jan 13 645
4 Verinata Health USA (Private) Illumina 21 Feb 13 450
5 BioMimetic Therapeutics USA (Listed) Wright Medical Group 01 Mar 13 380
6 Angiotech's Interventional Business Canada (-) Argon Medical Devices 15 Apr 13 363
7 Young Innovations USA (Listed) Consortium of Investors 31 Jan 13 314
8 HemoCue Sweden (-) Danaher 09 Apr 13 300
9 Palomar Medical Technologies USA (Listed) Cynosure 24 Jun 13 287
10 Epocal Canada (Private) Alere 04 Feb 13 242
Other 1,624
Total 6,468
Source: EvaluateMedTech™ (23 SEP 2013)
$36bn $13bn $50bn $77bn $46bn
209
164
253246
224
0
50
100
150
200
250
300
0
50
100
150
200
250
300
350
2008 2009 2010 2011 2012
De
al C
ou
nt
De
al V
alu
e (
$b
n)
Count of Pharma M&A Deals vs. Total Pharma M&A Value (2005 - 2009) Source: EvaluatePharma® (30 APR 2010)
Deal Value Deal Count
M&A Deal Value Falls by a Startling 79% in H1 2013; Deal Count Also DropsEvaluateMedTech™ found that total deal values from M&A of medtech companies decreased by a shocking 79% to $6bn in H1 2013, compared with $31bn in H1 2012. The number of deals also declined significantly, by 15%, with 95 deals closed in H1 2013 vs. 112 in H1 2012. The largest deal in H1 2013, and the only one worth over $1bn, was the acquisition of contraception specialist Conceptus by Bayer. The second half of the year has, however, started more positively thanks to the recent closing of Valeant’s $8.7bn acquisition of Bausch + Lomb and Baxter’s $3.9bn acquisition of Gambro.
2005FUJ [YAM] ($20.8bn)SAN [DAI] ($15.4bn)
2006SCH [BAY] ($21.3bn)
PFE Cons [JNJ] ($16.6bn)
2007Organon [SGP] ($15.6bn)
MEDI [AZN] ($15.6bn)Serono [Merck] ($13.8bn)
2008Alcon [NVS] ($10.4bn)
2009WYE [PFE] ($68.0bn)
DNA [Roche] ($46.8bn)SGP [MRK] ($41.1bn)
Target [Acquiror] (Deal Value)
173% Growth
$36bn $13bn $50bn $77bn $46bn $31bn $6bn
209
164
253246
224
112
95
0
50
100
150
200
250
300
0
10
20
30
40
50
60
70
80
2008 2009 2010 2011 2012 H1 2012 H1 2013
De
al
Co
un
t
Deal
Valu
e (
$b
n)
Count of Medtech M&A Deals vs. Total Medtech M&A Value (2008 - H1 2013) Source: EvaluateMedTech™ (23 SEP 2013)
Deal Value ($bn) Deal Count
2009 AM Optics [ABT] $2.8bn
Target [Acquiror] (Deal Value)
Note: Analysis based on closing date of deal.*Alcon & Genzyme included in analysis as >25% of company sales are derived from medtech.
2010Alcon* [NVS] $28bnev3 [COV] $2.6bn
2011Genzyme* [SAN]: $20.1bn
Alcon* [NVS] $9.6bnBeckman C [DHR] $6.8bn
Kinetic C (P. Equity) $6.1bn
H1 2012Synthes [JNJ] $19.7bn
2008Alcon* [NVS] $10.4bn
Respironics (Philips) $5.1bnVentana (Roche) $3.4bn
S. Goldway (Philips) $3bn
2012Synthes [JNJ] $19.7bn
Gen-Probe [HOL] $3.7bn
18
M&A Deal Value Falls by a Startling 79% in H1 2013; Deal Count Also Drops
EvaluateMedTech™ found that total deal values from M&A of medtech companies decreased by a shocking 79% to $6bn in H1 2013, compared with $31bn in H1 2012. The number of deals also declined significantly, by 15%, with 95 deals closed in H1 2013 vs. 112 in H1 2012.
The largest deal in H1 2013, and the only one worth over $1bn, was the acquisition of contraception specialist Conceptus by Bayer. The second half of the year has, however, started more positively thanks to the recent closing of Valeant’s $8.7bn acquisition of Bausch + Lomb and Baxter’s $3.9bn acquisition of Gambro.
Note: Analysis based on closing date of deal.
*Alcon & Genzyme included in analysis as >25% of company sales are derived from medtech.
M&A Analysis: 2008 to H1 2013

19Co
pyr
igh
t ©
201
3 Ev
alu
ate
Ltd
. All
rig
hts
res
erve
d.
Venture Financing Analysis: 2008 to H1 2013
Count of Medtech Venture Financing Deals & Value (2008 - H1 2013)
Year 2008 2009 2010 2011 2012 H1 2012 H1 2013
Deal Count 244 333 360 433 319 188 216
% Chg. 36% 8% 20% -26% 15%
Deal Value ($m) 3,119 3,605 4,502 4,480 3,845 2,337 2,481
% Chg. 16% 25% -1% -14% 6%
Top 10 Venture Financing Deals in H1 2013: Ranked on Deal Value
Company Country Financing Round Date Deal
Value ($m)
1 TearScience Ophthalmics USA Series Undisclosed 26 Feb 13 70
2 Proteus Digital Health Patient Monitoring USA Series F 01 May 13 63
3 Mevion Medical Systems Radiology USA Series Undisclosed 25 Jun 13 55
4 Natera In Vitro Diagnostics USA Series E 01 May 13 55
5 RTI Surgical Orthopedics USA PIPE 12 Jun 13 50
6 Nevro Neurology USA Series C 07 Mar 13 48
7 BioFire Diagnostics In Vitro Diagnostics USA Series Undisclosed 02 May 13 45
8 Avedro Ophthalmics USA Series D 05 Mar 13 43
9 EndoChoice Gastroenterology USA Series Undisclosed 04 Jan 13 43
10 ElectroCore Neurology USA Series A 09 Apr 13 40
Other 1,970
Total 2,481
Source: EvaluateMedTech™ (23 SEP 2013)
Primary Focus
Value of Venture Financing Expands 6% in H1 2013; Deal Count Increases 15%EvaluateMedTech™ found that in H1 2013 the total deal value of medtech venture financing increased by 6% to $2.5bn, whilst the number of venture financing deals increased by 15% to 216.Morrisville, North Carolina-based TearScience’s $70m funding was the largest single round seen in the first half of 2013. The cash is earmarked for commercialisation of the company’s dry eye therapy. This chimes with the relatively rapid growth seen in the ophthalmics sector.
$3,119m
$3,605m
$4,502m $4,480m
$3,845m
$2,337m$2,481m
244
333360
433
319
188216
0
100
200
300
400
500
600
700
0
1000
2000
3000
4000
5000
2008 2009 2010 2011 2012 H1 2012 H1 2013
De
al C
ou
nt
De
al V
alu
e (
$m
)
Count of Venture Financing Deals vs. Total Venture Financing Value (2008 - H1 2013) Source: EvaluateMedTech™ (23 SEP 2013)
Deal Value Deal Count
Note: Includes investments in medtech companies only. Does not include pharmaceutical or biotech companies. Includes Private Investment in Public Equity (PIPE).
H1 2013 vs.H1 2012
19
Value of Venture Financing Expands 6% in H1 2013; Deal Count Increases 15%
EvaluateMedTech™ found that in H1 2013 the total deal value of medtech venture financing increased by 6% to $2.5bn, whilst the number of venture financing deals increased by 15% to 216.
Morrisville, North Carolina-based TearScience’s $70m funding was the largest single round seen in the first half of 2013. The cash is earmarked for commercialisation of the company’s dry eye therapy. This chimes with the relatively rapid growth seen in the ophthalmics sector.
Note: Includes investments in medtech companies only. Does not include pharmaceutical or biotech companies. Includes Private Investment in Public Equity (PIPE).
Venture Financing Analysis: 2008 to H1 2013

20Co
pyr
igh
t ©
201
3 Ev
alu
ate
Ltd
. All
rig
hts
res
erve
d.
Enterprise Value & Focus Analysis: 2013 Latest vs. 2012
Top 20 Medtech Companies in 2013 (2018 Sales: >$1bn): Ranked by Enterprise Value
% '13 Sales
Company Country Medtech 2012 Latest % Growth 2012 Latest % Growth
1 General Electric USA 8% 507 497 -2% 20.99 23.78 +13%
2 Johnson & Johnson USA 40% 190 240 +26% 70.10 88.57 +26%
3 Roche Switzerland 22% 183 231 +26% 199.59 250.45 +25%
4 Novartis Switzerland 12% 165 188 +14% 63.30 76.20 +20%
5 Sanofi France 2% 135 139 +3% 45.79 47.96 +5%
6 Siemens Germany 18% 101 122 +21% 102.69 117.24 +14%
7 Bayer Germany 4% 87 102 +17% 93.63 111.50 +19%
8 3M USA 17% 65 83 +27% 92.85 118.60 +28%
9 Medtronic USA 100% 41 53 +30% 40.79 53.58 +31%
10 Abbott Laboratories USA 45% 109 52 -52% 30.98 34.87 +13%
11 Danaher USA 47% 42 50 +20% 55.90 69.76 +25%
12 Baxter International USA 38% 39 46 +17% 66.66 71.78 +8%
13 Kimberly-Clark USA 8% 38 42 +11% 84.43 95.69 +13%
14 Valeant Pharmaceuticals Canada 18% 27 41 +52% 56.44 99.20 +76%
15 Thermo Fisher Scientific USA 25% 29 39 +33% 63.78 91.11 +43%
16 Fresenius Germany 23% 34 35 +4% 14.23 15.08 +6%
17 Philips The Netherlands 31% 25 34 +39% 26.48 33.07 +25%
18 Toshiba Japan 6% 30 32 +5% 23.55 24.35 +3%
19 Covidien USA 100% 30 31 +1% 57.74 60.45 +5%
20 Allergan USA 14% 26 26 -1% 91.64 88.77 -3%
Total Top 20 1,903 2,083 +9% avg. +20%
Source: EvaluateMedTech™ (23 SEP 2013)
Enterprise Value ($bn) Share Price ($ ADR)
$497bn
$240bn $231bn
$188bn
$139bn$122bn
$102bn$83bn
$53bn $52bn
+13%
+26% +25%
+20%
+5%
+14%
+19%
+28%
+31%
+13%
+0%
+5%
+10%
+15%
+20%
+25%
+30%
+35%
+40%
0
100
200
300
400
500
600
Gen
era
lE
lectr
ic
Joh
nson
&Joh
nson
Ro
che
No
vart
is
Sa
no
fi
Sie
men
s
Ba
yer
3M
Med
tro
nic
Ab
bo
ttL
ab
ora
tori
es
Sh
are
Pri
ce P
erf
orm
an
ce Y
TD
(%
)
En
terp
rise V
alu
e (
$b
n)
WW Ranking on Enterprise Value in 2013 (Latest)Source: EvaluateMedTech™ (23 SEP 2013)
General Electric Number 1 in Latest Enterprise Value RankingsEvaluateMedTech™ found US giant General Electric to be the largest company by enterprise value operating in the medtech space, with a figure of $497bn. General Electric is expected to derive 8% of its 2013 revenues from its medtech segment.The analysis includes only medtech companies that are forecast to have sales in excess of $1bn in 2018. The analysis reveals the extent to which large diversified companies operate within the medtech space. Only two of the top 20 companies derive more than 50% of sales from medtech: Medtronic and Covidien. Even Johnson & Johnson, the clear market leader in medtech, only generates 40% of group sales from medtech.
Note: Includes companies with >$1bn medtech sales in 2018.Valuation based on share price close and valuation on 13th September 2013.
S&P 2013 YTD Return: +18%
20
General Electric Number 1 in Latest Enterprise Value Rankings
EvaluateMedTech™ found US giant General Electric to be the largest company by enterprise value operating in the medtech space, with a figure of $497bn. General Electric is expected to derive 8% of its 2013 revenues from its medtech segment.
The analysis includes only medtech companies that are forecast to have sales in excess of $1bn in 2018. The analysis reveals the extent to which large diversified companies operate within the medtech space. Only two of the top 20 companies derive more than 50% of sales from medtech: Medtronic and Covidien. Even Johnson & Johnson, the clear market leader in medtech, only generates 40% of group sales from medtech.
Note: Includes companies with >$1bn medtech sales in 2018.
Valuation based on share price close and valuation on 13th September 2013.
Enterprise value for Abbott drops YTD following the spin-out of AbbVie on 1 January 2013.
Enterprise Value & Focus Analysis: 2013 Latest vs. 2012
Evaluate’s Solutions for the Life Science IndustryAt Evaluate, our focus is on the business success of our clients.Our services are delivered via online subscriptions and through custom solutions. Contact us today to find out more.
Leader in consensus forecasts and analysis of pharma and biotech
� Consensus sales forecasts of leading equity research analysts, currently to 2018
� Must-have data in an integrated, standardized platform
� Interactive NPV discount cash flow model for asset valuation and Calendar of Events tool
A new standard in medtech industry analysis via a consensus view
� Consensus sales forecasts of leading equity research analysts, currently to 2018
� Simplified medtech classification system correlated to FDA and company specified segments
� Six integrated FDA databases and EU CE Marks
High quality global clinical trial intelligence linked to essential information
� Full records of ClinicalTrials.gov, EudraCT and a Japanese Clinical Trials data source
� Integrated with in-depth EvaluatePharma product and indication information
� Unique search fields for custom analysis and reporting
Award-winning commentary and analysis by industry experts
� Daily round up of share price movements
� Future market events that will impact product value
� Searchable news and commentary powered by high quality Evaluate data
For more information please visit www.evaluategroup.com. On Twitter: @evaluate, @evaluatepharma, @evaluatemedtech, @epclinicaltrial, @epvantage.
21Co
pyr
igh
t ©
201
3 Ev
alu
ate
Ltd
. All
rig
hts
res
erve
d.

Evaluate – Headquarters – Evaluate Ltd, 11-29 Fashion Street, London E1 6PX United Kingdom
Tel: +44 (0)20 7377 0800 – Fax: +44 (0)20 7539 1801
Evaluate – North America – EvaluatePharma USA, Inc., 15 Broad Street, Suite 401, Boston, MA 02109 USA
Tel: 1-617 573-9450 – Fax: 1-617 573-9542
Evaluate – Japan – EvaluatePharma Japan KK, Tokyo, Japan
Tel: +81 (0) 80 1164 4754
www.evaluategroup.com
All intellectual property rights in this report remain that of Evaluate Ltd and/or its respective third party licensors. Whilst all reasonable steps have been taken to ensure that the datapresented are accurate, Evaluate Ltd cannot accept responsibility for errors or omissions. Neither does Evaluate Ltd warrant the accuracy, merchantability or fitness for a particular purpose of the data. Nothing in the reports shall constitute investment, financial or legal advice and the contents of the reports are provided for information purposes only. The data is not intended to amount to advice and should not be used as a determining factor in any investment decision. This report may not be lent, resold, hired out or otherwise disposed of by way of trade in any form of binding or cover other than that in which it is published, without the prior written consent of Evaluate Ltd. Copyright © 2013 Evaluate Ltd. All rights reserved.
Complimentary copies of our World Preview 2013, Outlook to 2018 Report can be downloaded at: www.evaluategroup.com/MedTechWP2013
Evaluate is the trusted source for high quality commercial market intelligence and exclusive consensus sales forecasts to 2018. Our services are EvaluatePharma®, EvaluateMedTech™ and EvaluateClinicalTrials™. Our award-winning editorial arm, EP Vantage, leverages our market intelligence and analysis to cut through the noise, providing daily opinion and insights. Evaluate’s services give you the insights you need to ask the right questions and get the right answers. That’s intelligence you can act on. For more information visit: www.evaluategroup.com. On Twitter: @evaluatepharma, @evaluatemedtech, @epclinicaltrial, @epvantage.
EVALMTWP2013
General inquires about this report: Christine Lindgren Tel: 1-617-573-9458 Email: [email protected]


