Economic Indicators and Monthly Overview April 2015
27
| [Presentation title] | [Client Name] | [Date] 1 Economic Indicators Last update 17.4.2015
-
Upload
sappihouston -
Category
Documents
-
view
492 -
download
3
Transcript of Economic Indicators and Monthly Overview April 2015
| [Presentation title] | [Client Name] | [Date] 1
Economic Indicators
Last update 17.4.2015

| Economic Indicators | 2
Economic Outlook Monthly Overview – April 2015
Europe:
• Consensus April GDP forecast for WE improved again from 1,6% to 1,7% for 2015 and from
1,8% to 1,9% for 2016.
• The EU industrial confidence improved slightly again in March from the previous month and
consumer confidence continued its path of considerable improvement.
• The IFO Business Climate index for Germany rose again in March, reaching its highest level
since July 2014. The German economy continues to expand.
• Optimism is growing in the Eurozone with stronger domestic demand fuelling growth in Germany
and Spain supported by the continued depression in consumer prices.
US:
• Consensus April GDP forecast for the US came down again from 3,1% to 2,9% for 2015 and from
2,9% to 2,8% for 2016.
• Declining US forecasts appear to underline the economy’s below-par end to 2014 and
subsequent downbeat mood in Q1 2015. Fears remain over the stalling demand for exports,
negatively impacted by the strong US dollar.
Japan:
• The April GDP growth forecast for Japan decreased from 1,1% to 1,0% for 2015, and remained
on 1,7% for 2016.
• The GDP outlook has worsened following a spate of disappointing data. The hope is that better
wage prospects, as well as lower inflation, will encourage consumers.
3 | Economic Indicators |
Eurostat Data

| Economic Indicators | 4
Economic Indicators – GDP EU 28
Source: Eurostat Feb 15
-5
-4
-3
-2
-1
0
1
2
3
4
08
Q1
09
Q1
10
Q1
11
Q1
12
Q1
13
Q1
14
Q1
%
GDP for the EU 28 countries at constant prices quarter vs. same quarter of last year
| Economic Indicators | 5
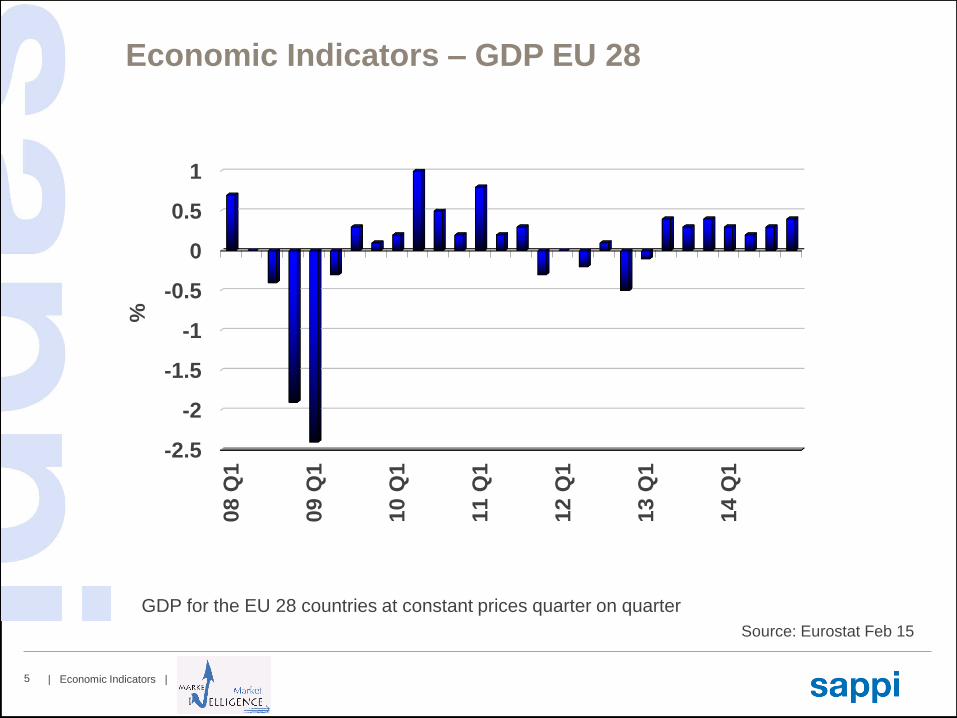
Economic Indicators – GDP EU 28
Source: Eurostat Feb 15
-2.5
-2
-1.5
-1
-0.5
0
0.5
1
08
Q1
09
Q1
10
Q1
11
Q1
12
Q1
13
Q1
14
Q1
%
GDP for the EU 28 countries at constant prices quarter on quarter
| Economic Indicators | 6
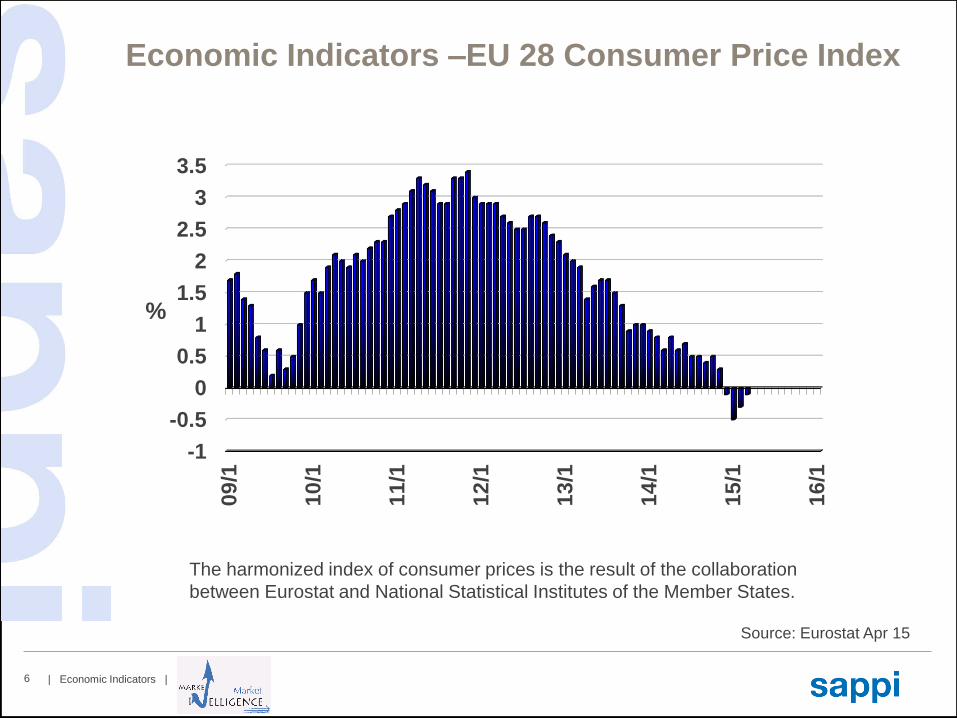
Economic Indicators –EU 28 Consumer Price Index
Source: Eurostat Apr 15
-1
-0.5
0
0.5
1
1.5
2
2.5
3
3.5
09
/1
10
/1
11
/1
12
/1
13
/1
14
/1
15
/1
16
/1
%
The harmonized index of consumer prices is the result of the collaboration
between Eurostat and National Statistical Institutes of the Member States.
| Economic Indicators | 7
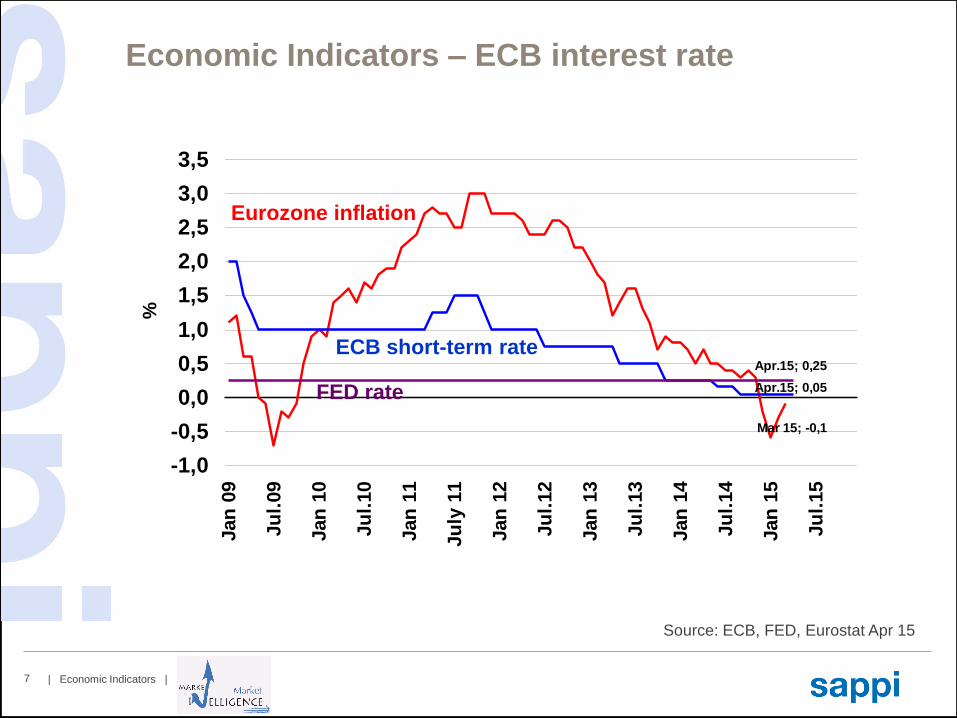
Economic Indicators – ECB interest rate
Source: ECB, FED, Eurostat Apr 15
Mar 15; -0,1
Apr.15; 0,05
Apr.15; 0,25
-1,0
-0,5
0,0
0,5
1,0
1,5
2,0
2,5
3,0
3,5
Jan
09
Ju
l.09
Jan
10
Ju
l.10
Jan
11
Ju
ly 1
1
Jan
12
Ju
l.12
Jan
13
Ju
l.13
Jan
14
Ju
l.14
Jan
15
Ju
l.15
%
ECB short-term rate
Eurozone inflation
FED rate
| Economic Indicators | 8
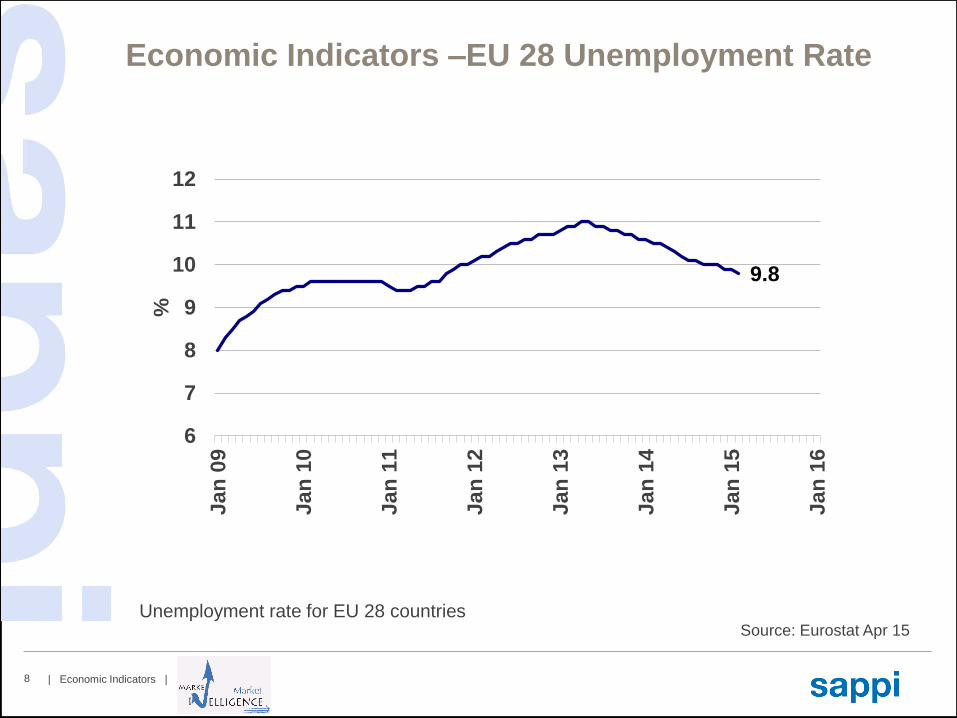
Economic Indicators –EU 28 Unemployment Rate
Source: Eurostat Apr 15
9.8
6
7
8
9
10
11
12
Jan
09
Jan
10
Jan
11
Jan
12
Jan
13
Jan
14
Ja
n 1
5
Jan
16
%
Unemployment rate for EU 28 countries

| Economic Indicators | 9
Economic Indicators – Industrial Confidence Ind EU
Source: Eurostat Apr 15
-40
-35
-30
-25
-20
-15
-10
-5
0
5
10Jan
09
Jan
10
Jan
11
Jan
12
Jan
13
Jan
14
Jan
15
Jan
16
Industrial confidence within EU 28 improved very slightly again in March.
The Industrial Confidence Indicator is the arithmetic average of the answers to the
questions on production expectations, order books and stocks.
| Economic Indicators | 10
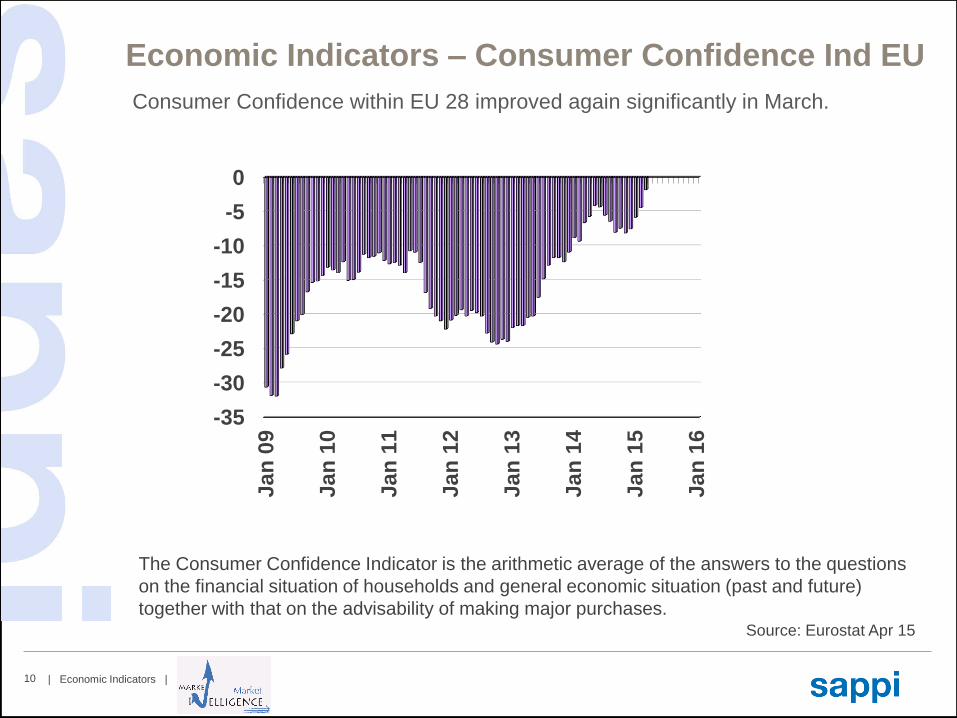
Economic Indicators – Consumer Confidence Ind EU
Source: Eurostat Apr 15
Consumer Confidence within EU 28 improved again significantly in March.
-35
-30
-25
-20
-15
-10
-5
0
Ja
n 0
9
Ja
n 1
0
Ja
n 1
1
Ja
n 1
2
Ja
n 1
3
Ja
n 1
4
Ja
n 1
5
Ja
n 1
6
The Consumer Confidence Indicator is the arithmetic average of the answers to the questions
on the financial situation of households and general economic situation (past and future)
together with that on the advisability of making major purchases.
| Economic Indicators | 11
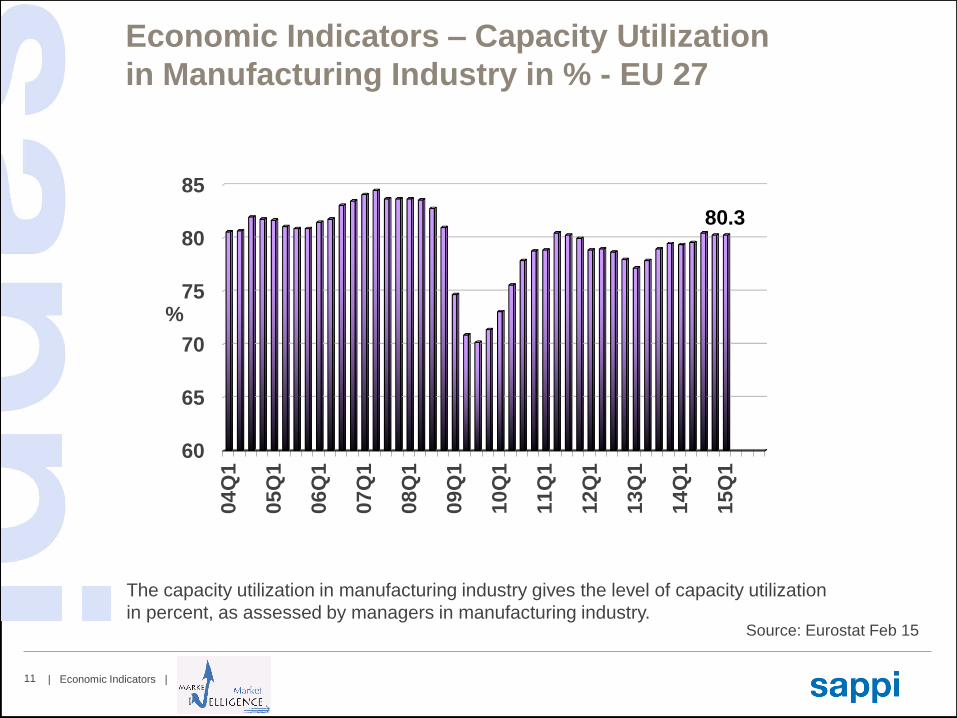
Economic Indicators – Capacity Utilization
in Manufacturing Industry in % - EU 27
Source: Eurostat Feb 15
60
65
70
75
80
85
04
Q1
05
Q1
06
Q1
07
Q1
08
Q1
09
Q1
10
Q1
11
Q1
12
Q1
13
Q1
14
Q1
15
Q1
80.3
%
The capacity utilization in manufacturing industry gives the level of capacity utilization
in percent, as assessed by managers in manufacturing industry.

| Economic Indicators | 12
Ifo Data
| Economic Indicators | 13
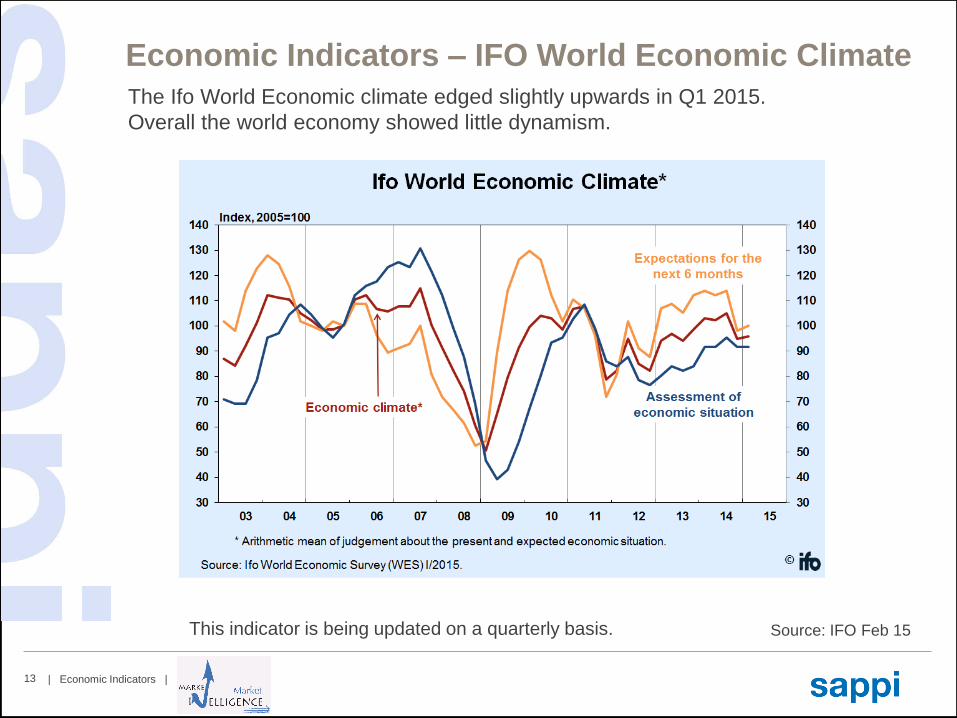
Economic Indicators – IFO World Economic Climate
Source: IFO Feb 15
The Ifo World Economic climate edged slightly upwards in Q1 2015.
Overall the world economy showed little dynamism.
This indicator is being updated on a quarterly basis.
| Economic Indicators | 14
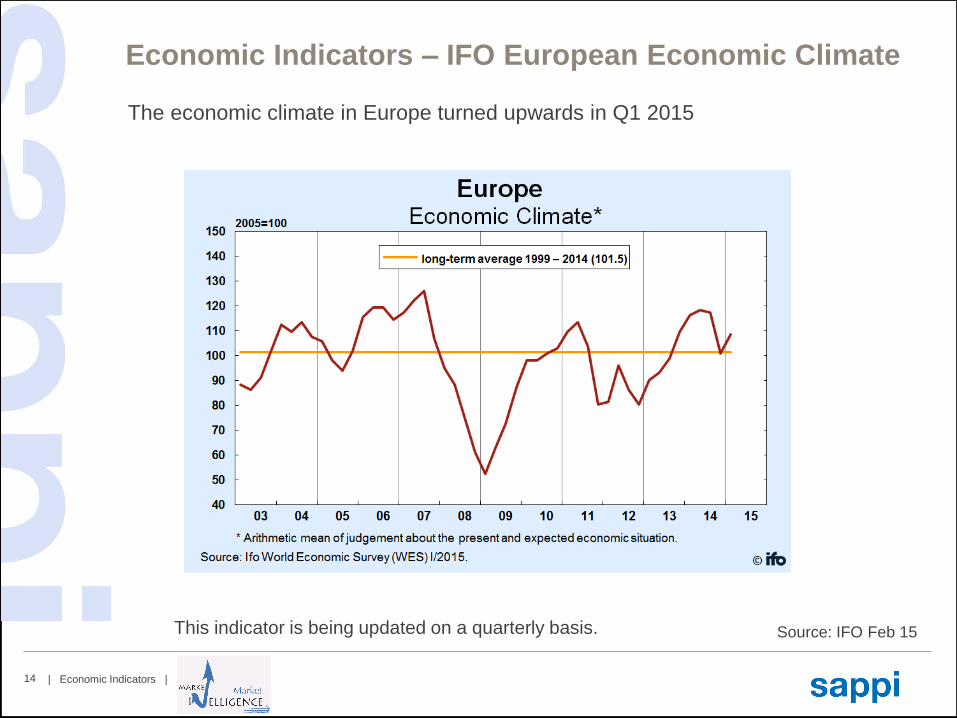
Economic Indicators – IFO European Economic Climate
Source: IFO Feb 15
The economic climate in Europe turned upwards in Q1 2015
This indicator is being updated on a quarterly basis.
| Economic Indicators | 15
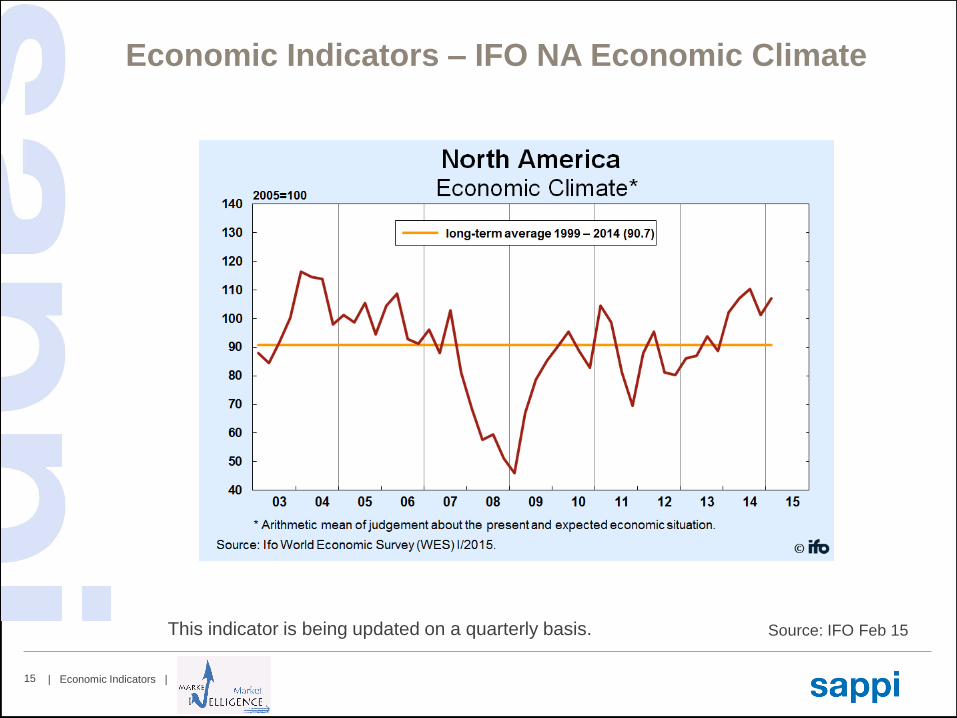
Economic Indicators – IFO NA Economic Climate
Source: IFO Feb 15 This indicator is being updated on a quarterly basis.

| Economic Indicators | 16
Economic Indicators – IFO Asia Economic Climate
Source: IFO Feb 15 This indicator is being updated on a quarterly basis.
| Economic Indicators | 17
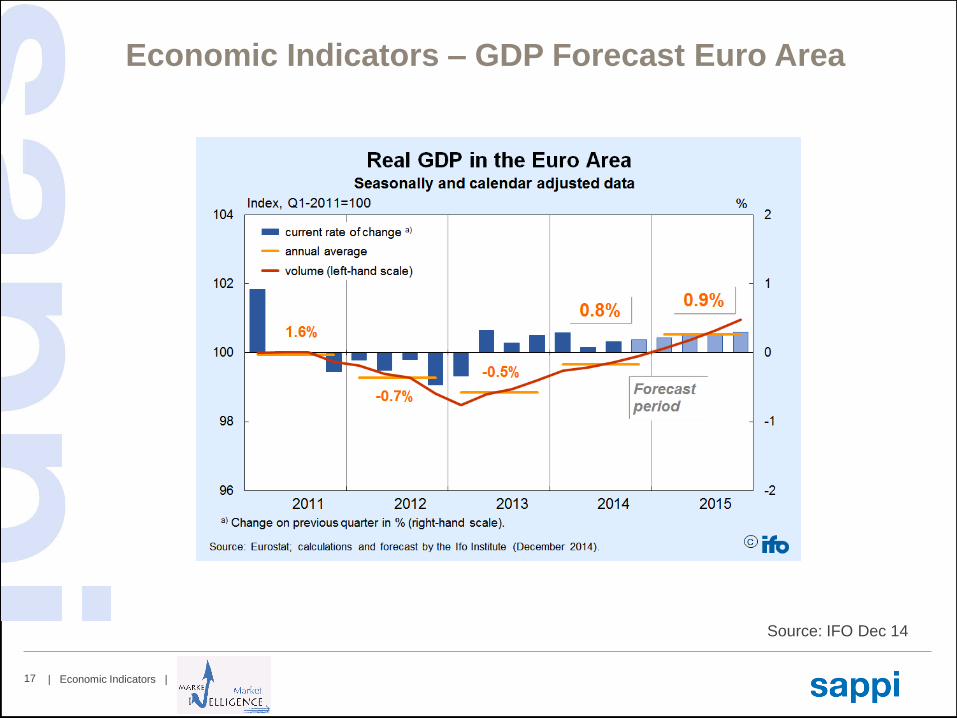
Economic Indicators – GDP Forecast Euro Area
Source: IFO Dec 14
| Economic Indicators | 18
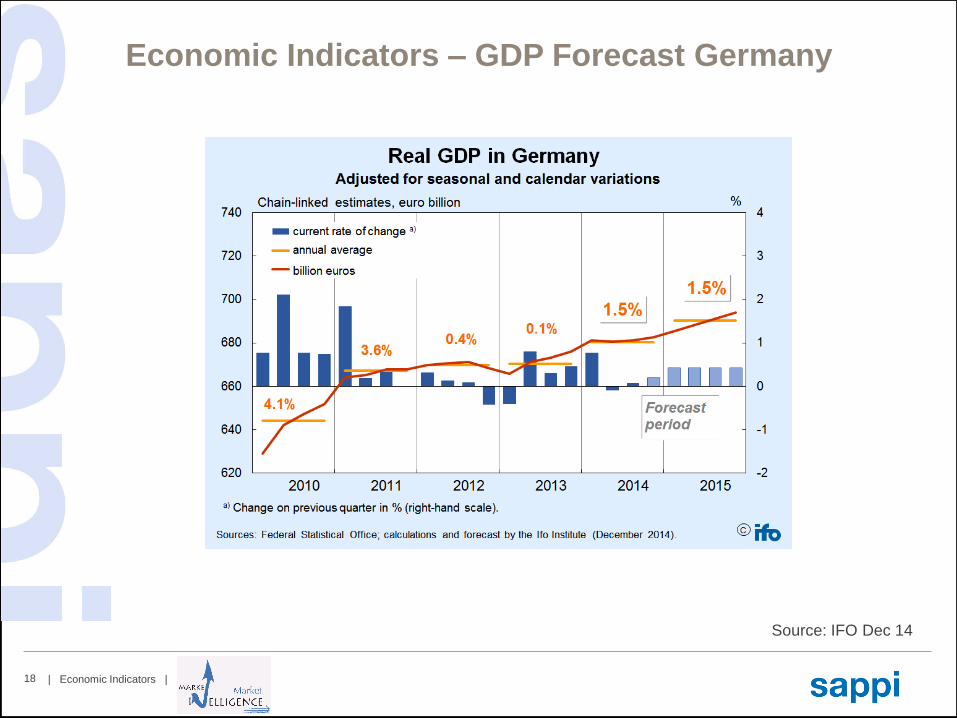
Economic Indicators – GDP Forecast Germany
Source: IFO Dec 14
| Economic Indicators | 19
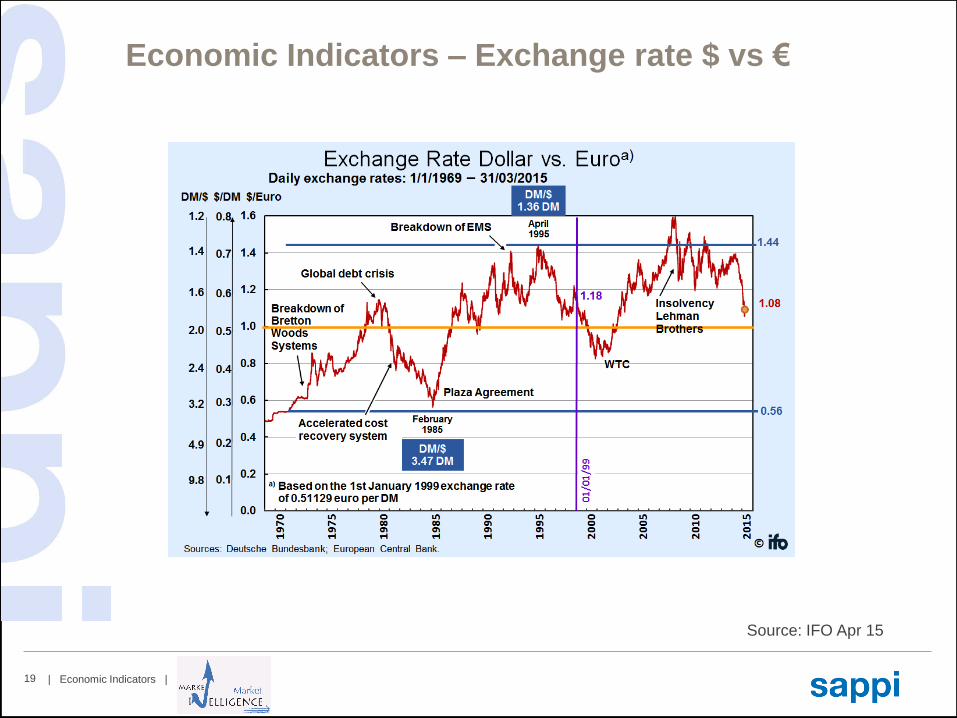
Economic Indicators – Exchange rate $ vs €
Source: IFO Apr 15
| Economic Indicators | 20
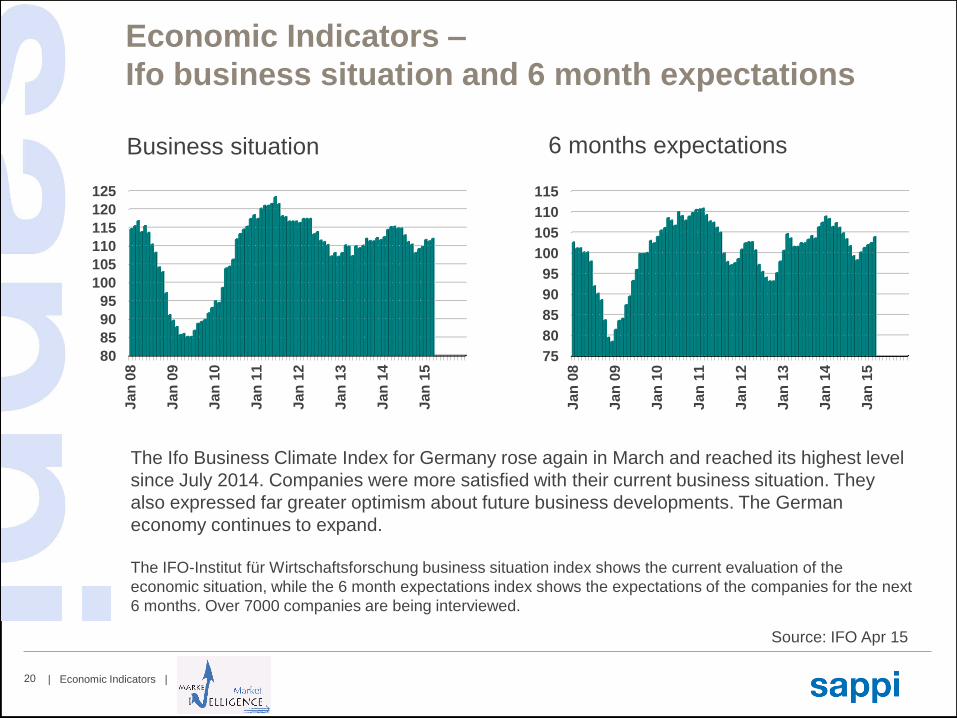
Economic Indicators –
Ifo business situation and 6 month expectations
Source: IFO Apr 15
75
80
85
90
95
100
105
110
115
Jan
08
Jan
09
Jan
10
Jan
11
Jan
12
Jan
13
Jan
14
Jan
15
80
85
90
95
100
105
110
115
120
125
Jan
08
Jan
09
Jan
10
Jan
11
Jan
12
Jan
13
Jan
14
Jan
15
Business situation 6 months expectations
The IFO-Institut für Wirtschaftsforschung business situation index shows the current evaluation of the
economic situation, while the 6 month expectations index shows the expectations of the companies for the next
6 months. Over 7000 companies are being interviewed.
The Ifo Business Climate Index for Germany rose again in March and reached its highest level
since July 2014. Companies were more satisfied with their current business situation. They
also expressed far greater optimism about future business developments. The German
economy continues to expand.

| Economic Indicators | 21
Economic Indicators – IFO Assessment of Current
Business Situation
Source: IFO Apr 15
The Ifo Business Climate Index for Germany rose again in March and reached its highest level
since July 2014. Companies were more satisfied with their current business situation. They
also expressed far greater optimism about future business developments. The German
economy continues to expand.
| Economic Indicators | 22
Zenith Data
| Economic Indicators | 23
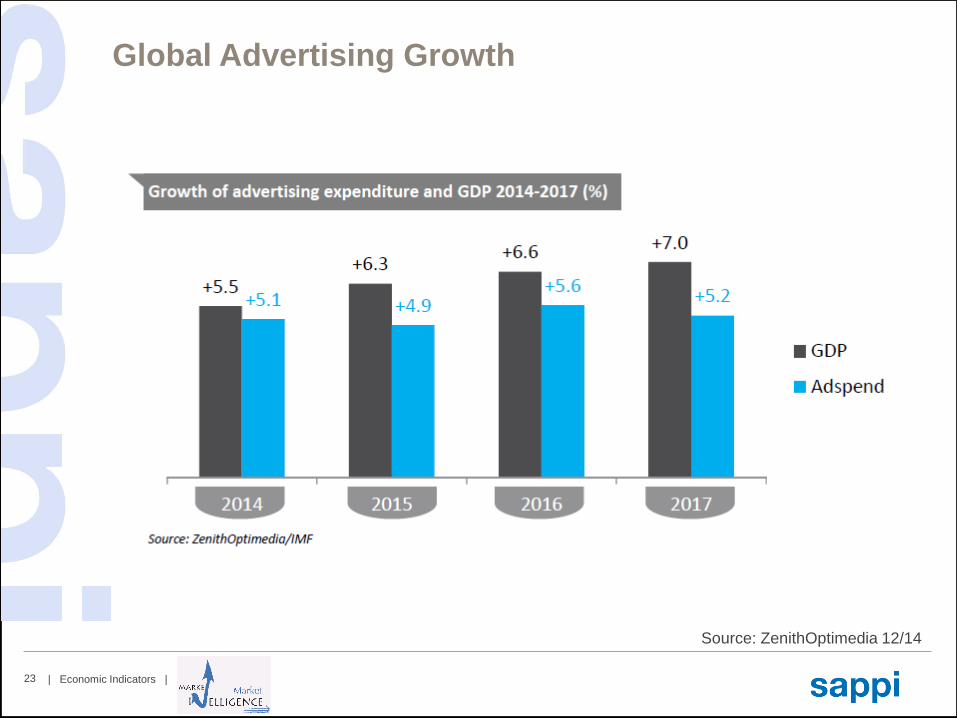
Global Advertising Growth
Source: ZenithOptimedia 12/14
| Economic Indicators | 24
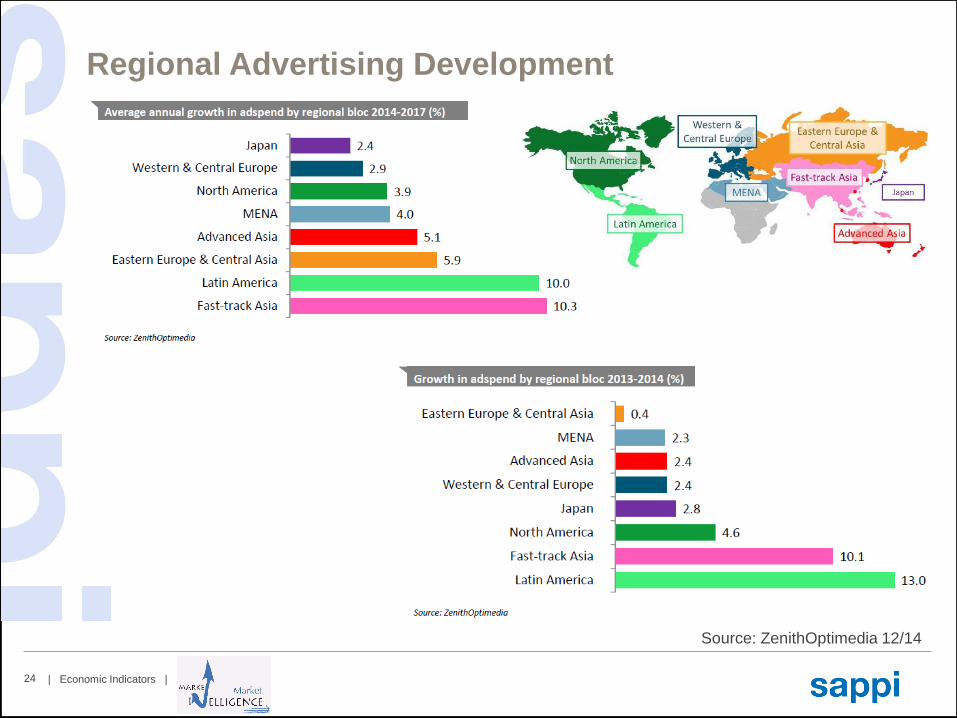
Regional Advertising Development
Source: ZenithOptimedia 12/14
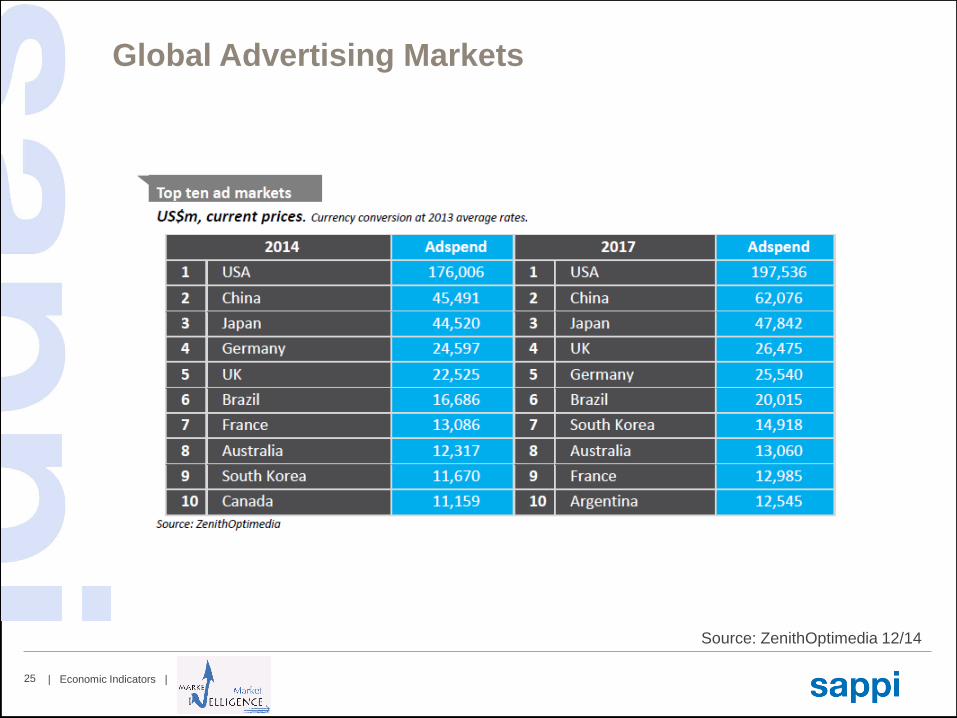
| Economic Indicators | 25
Global Advertising Markets
Source: ZenithOptimedia 12/14
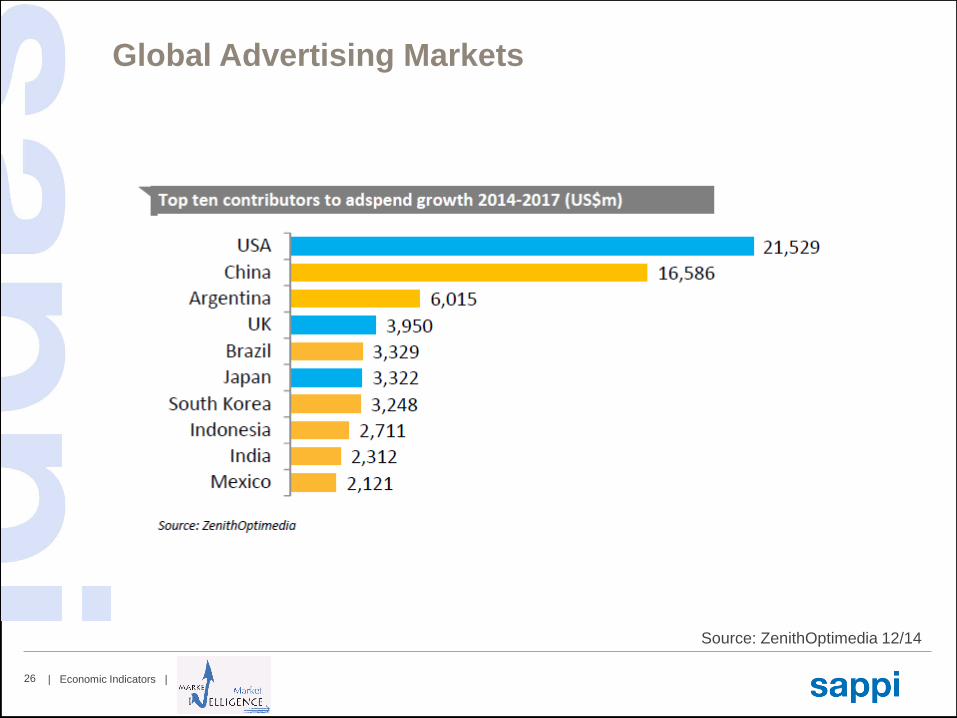
| Economic Indicators | 26
Global Advertising Markets
Source: ZenithOptimedia 12/14
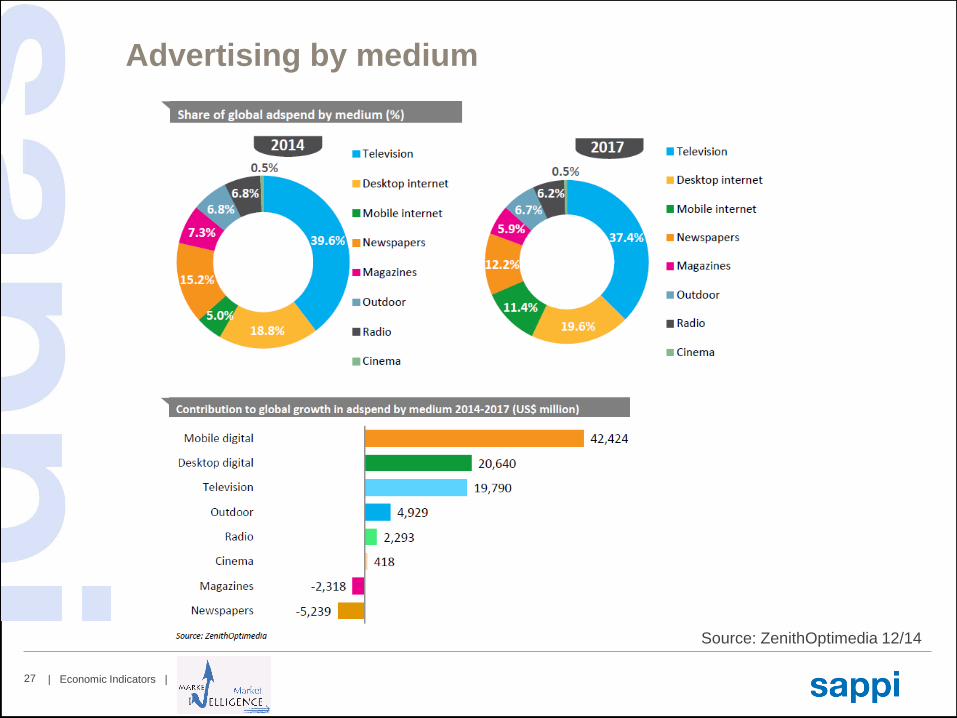
| Economic Indicators | 27
Advertising by medium
Source: ZenithOptimedia 12/14


![Economic Indicators: May 1979 - FRASER · JOINT RESOLUTION fS J. Res. S5] To print the monthly publication entitled ''Economic Indicators" Resolved by the Senate and House of Representatives](https://static.fdocuments.net/doc/165x107/5ea121ad7826b77be3544d0e/economic-indicators-may-1979-fraser-joint-resolution-fs-j-res-s5-to-print.jpg)


![Economic Indicators€¦ · [PUBLIC LAW 120—81sT CONGRESS; CHAPTER 237—IST SESSION] JOINT RESOLUTION IS. J. Res. 55] To print the monthly publication entitled "Economic Indicators"](https://static.fdocuments.net/doc/165x107/5ec00b385f05cb38650629bd/economic-indicators-public-law-120a81st-congress-chapter-237aist-session.jpg)