Monthly Economic Indicators - Metro Denver … Monthly Economic Indicators is a ... Lonely Planet...
24
Transcript of Monthly Economic Indicators - Metro Denver … Monthly Economic Indicators is a ... Lonely Planet...

Monthly analysis of 18 key economic indicators in Metro Denver
www.metrodenver.org
Energetic Bodies. Energetic Minds.
www.developmentresearch.net
Monthly Economic Indicators

Metro Denver Economic Development Corporation | January 10, 2017 | Page 1
The Monthly Economic Indicators is a comprehensive analysis of economic conditions in the seven‐county Metro Denver area, or the region comprised of Adams, Arapahoe, Boulder, Broomfield, Denver, Douglas, and Jefferson Counties. There are two metropolitan statistical areas (MSAs) located within the Metro Denver region: the Boulder MSA (Boulder County) and the Denver‐Aurora‐Lakewood MSA (the Denver MSA) (Adams, Arapahoe, Broomfield, Clear Creek, Denver, Douglas, Elbert, Gilpin, Jefferson, and Park Counties). This report presents recent data and long‐term trends for the seven‐county region, MSAs, or counties, depending on availability. The analysis includes four sections: labor force and employment, the consumer sector, residential real estate, and commercial real estate.
Notable Rankings
The Milken Institute’s 2016 Best‐Performing Cities Index named two Colorado metropolitan areas among the top‐25. The Fort Collins MSA ranked eighth, up six spots from last year, and the Denver‐Aurora‐Lakewood MSA ranked 13th, up three spots from last year. The index ranked 381 U.S. metro areas based on nine separate components including job growth and earnings. The Fort Collins MSA ranked 16th for job growth from 2014 to 2015 and fifth for wage growth from 2013 to 2014. The Denver‐Aurora‐Lakewood MSA ranked 10th for wage growth from 2013 to 2014, and 16th in both job growth and the number of high‐tech industries.
Denver will be the second‐best city for job seekers in 2017, according to NerdWallet. Analysts examined October unemployment rates, the growth of the working‐age population from 2010 to 2015, median earnings, and median 2015 monthly rent in the nation’s 100 largest cities. The burgeoning technology industry, robust aerospace industry, and more affordable cost of living contributed to Denver’s high rank.
The Boulder MSA ranked No. 1 in the “2016 Bloomberg Brain Concentration Index.” The company ranked metro areas based on their per capita concentration of residents working in science, technology, and engineering occupations or who have science and engineering college degrees or post‐graduate degrees. Boulder’s concentration of high‐tech industries and numerous federal laboratories contributed to its high rank. San Jose, Calif. ranked second, followed by Ann Arbor, Mich., Ithaca, N.Y., and Washington, D.C.
GoodCall ranked Loveland 40th and Denver ranked 51st in the nation among the “2017 Best Cities for New Grads.” The company analyzed factors including affordability, relative salary, entry‐level jobs available, and local amenities across 589 cities and towns. Roanoke, Va. and Canton, OH were the top two cities on the list.
Several Colorado companies were named to Glassdoor’s “Best Places to Work 2017.” Centennial‐based government software and consulting‐services provider Fast Enterprises ranked No. 6 on the national list for large companies. Fort Collins‐based Madwire and Denver‐based NetWorth Realty ranked among the top 50 list of small and medium companies.
According to the U.S. Census Bureau, Colorado’s population increased by almost 91,730 people between July 2015 and July 2016, the seventh‐fastest growth rate in the country. The state’s population topped 5.5 million residents for the first time and population growth of 1.7 percent was more than double the national average of 0.7 percent. Colorado ranked eighth among all states for the absolute increase in population.
Colorado ranked fifth among the top‐10 states for the well‐being of adults ages 55 and older, according to Gallup Healthway’s “2015 State Well‐Being Rankings for Older Americans.” The company analyzed factors including purpose, social, financial, community, and physical factors. Hawaii ranked first, followed by Arizona, New Hampshire, and North Dakota. West Virginia and Kentucky had the lowest levels of well‐being for older adults.
The United Health Foundation ranked Colorado the 10th‐healthiest state in the nation. The state ranked high for its low obesity rate (20.2 percent), high rate of physical activity, and low prevalence of diabetes, but ranked near the bottom for whooping cough (46th) and health disparities (48th) among people based on their education levels. Hawaii ranked first overall and Massachusetts ranked second.
CSM ranked first among the top‐10 schools in the nation for an engineering degree in 2016, according to College Factual. The company considered criteria such as graduate earnings, major focus, accreditation, and overall college

Metro Denver Economic Development Corporation | January 10, 2017 | Page 2
quality. Engineering is the most popular field of study at CSM, with majors in general engineering and petroleum engineering among the most sought‐after. The Georgia Institute of Technology ranked second and the Missouri University of Science and Technology ranked third.
Denver International Airport (DEN) ranked 11th‐highest for customer satisfaction among the nation’s 32 largest airports, according to J.D. Power and Associates’ 2016 North America Airport Satisfaction Study. More than 38,930 passengers participated in the study and rated airports’ terminal facilities, accessibility, security, baggage claim, processes for check‐in, and food and retail options. Portland International Airport ranked first and Tampa International Airport ranked second.
Lonely Planet ranked Denver ninth among the top 10 U.S. travel destinations in 2017. The city received accolades for its microbreweries, music scene, and direct access to ski areas via the Winter Park Express. Asheville, N.C. claimed the top spot, followed by Western Washington and Lincoln, Neb.
NerdWallet ranked Centennial as the eighth‐best city for first‐time homebuyers. To compile the ranking, analysts used data from the U.S. Census Bureau, online data provider NeighborhoodScout, and Down Payment Resource for the 448 largest places in the U.S. by population to assess affordability, livability, and stability. Centennial has the sixth‐lowest poverty level among all cities analyzed, the report said. Twelve other Colorado cities were named to the list.
Other Notable Rankings
The Daniels College of Business at the University of Denver ranked 44th among the “Best Undergraduate Business Programs of 2016,” according to Poets&Quants.com.
According to the U.S. Department of Education’s new “College Scorecard,” CSM produces the highest‐paid graduates out of 30 Metro Denver colleges. Alumni at CSM earned a median salary of $75,700 after 10 years of attending relative to the average annual cost of $25,777.
Metro Denver has seven of the nation’s most competitive neighborhoods for home sales, according to Redfin.com. The Lakeside neighborhood in Wheat Ridge is the area’s most competitive neighborhood (eighth nationally), followed by West Pleasant View in Golden (12th), College View in Denver (13th), Hoffman Town in Aurora (14th), Highline Villages in Aurora (17th), Union Square in Lakewood (23rd), and Horseshoe Park in Aurora (27th).
Denver recorded the second‐largest over‐the‐year increase (+150 percent) in hotel room construction of the nation’s largest cities, according to STR.
OAG Aviation Worldwide Ltd. ranked DEN 14th among the world’s 20 major airports for on‐time flight arrivals and departures. DEN also ranked eighth among major U.S. airports, with 81.2 percent of flights both leaving and arriving on time.
Denver ranked No. 8 among the list of the top holiday destinations in 2016, according to Allianz Global Assistance of Virginia. New York ranked first, followed by Los Angeles, Orlando, Fort Lauderdale, and San Francisco.
SmartAsset ranked Denver seventh and Boulder ranked 15th among the best cities for beer drinkers in 2016.
Three Colorado restaurants were named to OpenTable’s “100 Best Restaurants in America for 2016.” Carlos’ Bistro in Colorado Springs, Mizuna in Denver, and the Ski Tip Lodge in Keystone.
Policy Watch
Local
The Boulder County Board of Commissioners extended the county’s moratorium on oil and gas development to May 2017. The new extension, originally set to expire January 2017, will provide time for the board to complete research, draft regulations, and implement a plan for new oil and gas development rules.

Metro Denver Economic Development Corporation | January 10, 2017 | Page 3
Lafayette’s City Council approved an economic development package to allow for incentivizing new, mixed‐use development, the conveyance of a city hall lot, and an economic development agreement to help propel the stalled City Center project forward. The incentives will waive or rebate up to a total of $1 million for the building permit fee, city use tax, and plan check fee for the project. Further, the package includes a 20‐year, 5 percent loan of the building permit cost. The City Center project will include eight buildings, 196 apartments, 12 townhomes, a pool house/clubhouse, 200 multi‐family units, and 16,640 square feet of commercial space.
The city of Wheat Ridge plans to combine outdoor recreation with the coworking space concept at Ward Station, the last stop on the future Regional Transportation District’s Gold Line. The Ward Station Vision includes plans for a 15‐acre coworking space for outdoor recreation companies near Ward Road and 52nd Avenue, a mountain bike park, and opportunities for paddleboarding and kayaking. Spokespeople for the city say the space will be a centerpiece as a unique recreational node that takes advantage of access to the mountains via Interstate 70 and downtown Denver via rail.
Seven organizations in Colorado’s venture community created The Venture Zone, a workspace in Denver that provides startups with access to resources from early‐stage ideation through exit path. The membership‐based workspace includes Founder Institute Denver, Rockies Venture Club, Rockies Venture Institute, Thrive Workplace, Rockies Venture Fund, Future Venture Capital Co., Ltd., and FVC Americas. Monthly memberships range from $250 to $425 per month that include a desk at Thrive Workspace, meeting rooms, office resources, and access to conferences, sessions, and workshops.
Fort Collins‐based Innosphere will merge with Boulder‐based Innovation Center of the Rockies (ICR). ICR will become part of Innosphere and will give the startup incubator a physical presence in Boulder County. The combined organization will enhance the services and programs for both entrepreneurs and partner organizations, and will expand the state’s advanced industries.
Denver‐based Panasonic Enterprise Solutions announced they will partner with the Colorado Department of Transportation to test Internet‐connected and self‐driving vehicles on 90 miles of Interstate 70 in Colorado. CDOT, through its RoadX program, and Panasonic are developing a system in which information gathered from sensors on the road and vehicles driving the road will be shared within seconds with other vehicles and their drivers. The goal is to warn drivers—or the automated, driver‐assist systems in the cars—of obstacles in their path ahead in enough time for them to take action, or divert to another route.
Colorado is one of 35 worldwide semifinalists vying to build a hyperloop, proposing a 40‐mile high‐speed link between Denver International Airport and Greeley. Hyperloop One would carry passengers and cargo at speeds of up to 700 miles per hour in about 10 minutes. The finalists for the project will be announced in May 2017.
National Economic Overview
The U.S. Bureau of Economic Analysis (BEA) released the third estimate of real gross domestic product (GDP) for the third quarter of 2016. The estimate showed that GDP increased at a faster pace than initially thought, notching its best performance in two years. GDP rose at an annual rate of 3.5 percent through the third quarter, which was 2.1 percentage points above the second quarter rate of 1.4 percent. The third estimate represents more complete source data than the available data for the second estimate. The increase in GDP reflected positive contributions from personal consumption expenditures, exports, private inventory investment, nonresidential fixed investment, and federal government spending. The advanced estimate of fourth quarter 2016 GDP will be released January 27.
The December conference of the Federal Open Market Committee (FOMC) reported that economic activity expanded at a moderate pace and the labor market continued to strengthen. The committee reported that household spending has been rising moderately, but business fixed investment has remained soft. Despite a slight increase in inflation since the beginning of 2016, the rate is still below the committee’s longer‐run objective of 2 percent as a result of declines in energy prices and in prices of non‐energy imports. With this current economic outlook, the FOMC agreed to increase the target federal funds rate to a 0.5 percent to 0.75 percent range and it foresees three rate hikes in 2017. This is the first increase in the federal

Metro Denver Economic Development Corporation | January 10, 2017 | Page 4
funds rate since December 2015, which raised rates to a target range of 0.25 percent to 0.5 percent. The committee cautioned that any further federal funds rate increases would be gradual for some time. The next committee meeting will be held on January 31.
Economic Indexes & Notable Data Releases
National & International
The U.S. trade deficit was $42.6 billion in October, up $6.4 billion from the September deficit of $36.2 billion (revised). Imports increased to $229.0 billion, rising $3 billion between September and October. October exports were $186.4 billion, $3.4 billion less than September exports. Year‐to‐date, the deficit decreased $8.8 billion, or 2.1 percent, from the same period in 2015. Exports decreased $58.7 billion or 3.1 percent, and imports decreased $67.5 billion or 2.9 percent.
The Conference Board Leading Economic Index for the U.S. was unchanged between October and November, remaining at 124.6. Economists at the Conference Board reported that the index continued an upward trend through 2016, although at a moderate pace. The weakness in industrial and construction indicators offset improvements in the interest rate spread, initial unemployment insurance claims, and stock prices. They also stated that underlying trends in the index suggest the economy will continue expanding into the first half of 2017, but it is unlikely to accelerate considerably.
The Institute for Supply Management’s Purchasing Managers Index expanded in November, growing at a five‐month high. The index rose from 51.9 percent in October to 53.2 percent in November, expanding for the third‐straight month. Of the 18 manufacturing industries tracked in the index, 11 industries reported growth. The New Orders and Production indices increased 0.9 percentage points and 1.4 percentage points over‐the‐month, respectively. The Employment Index registered 52.3 percent, a decrease of 0.6 percentage points from the October reading of 52.9 percent. Survey respondents noted several trends including strong demand in computer and electronic products, rising employment in the machinery industry, and an increase in orders for textile mills and nonmetallic mineral products.
The Institute for Supply Management’s Non‐Manufacturing Index increased 2.4 percentage points in November to 57.2 percent, compared with the October level of 54.8 percent. The November index marked the 82nd consecutive month of growth, as measured by a value over 50, and was the highest reading since October 2015. Among the 18 non‐manufacturing industries tracked in the index, 14 reported growth between October and November. The Employment Index recorded the largest over‐the‐month increase, rising 5.1 percentage points to 58.2 percent. The Non‐Manufacturing Business Activity Index increased to 61.7 percent, 4 percentage points higher than the October reading, and was the 88th consecutive month of growth. The New Orders Index registered 57 percent, 0.7 percentage points lower than the October reading. Survey respondents in the finance and insurance industry reported that business conditions are holding steady and profits are above projections, while the health care and social assistance industry continues to face cost pressures.
Local
The Leeds Business Confidence Index rebounded sharply ahead of the first quarter of 2017. The index value of 60.3 for the first quarter of 2017 was 7.3 points above the previous quarter and 4.9 points above the prior year’s level, supported by strong readings in every component of the index. Of the index components, national economy confidence increased markedly from 48.2 in the fourth quarter of 2016 to 61.3 in the first quarter of 2017. Further, expectations for the state economy rose from 57.5 in the fourth quarter of 2016 to 62.8 in the first quarter of 2017. Expectations for profits and sales increased, with the profits index rising 7.2 points over‐the‐quarter to 59.4 and the sales index increasing 4.5 points over‐the‐quarter to 59.8. According to the report, the index remains in positive territory (above 50) for all metrics. Business leaders’ economic concerns regarding the election, political climate, and government regulation have abated. Further, lower corporate tax rates and attempts to deal with regulatory policy has helped stabilize business expectations for early 2017.

Metro Denver Economic Development Corporation | January 10, 2017 | Page 5
The Governor’s Office of State Planning and Budgeting and the Legislative Council released their forecasts for the state budget and predicted that the state will have a deficit of $119 million and $169 million in the current fiscal year, respectively. The deficit is almost half of the shortfall predicted in the September 2016 forecast, but will likely cause spending cuts during the 2017‐18 fiscal year. The most recent 2018 budget proposal includes a 4 percent increase in general fund spending, but falls $500 million short of the state’s needs in education, hospital, and road construction.
According to the Colorado Center on Law & Policy State of Working Colorado 2016, Colorado has performed well since 2007, gaining nearly 271,000 jobs and has surpassed its pre‐recession median household income, reaching $63,900 in 2015. However, an increasing number of Coloradans face wage stagnation, under‐employment, race‐based income gaps, and poverty as Colorado’s cost of living continues to surge upward. Further, the median hourly wage ($18.49) in 2015 remained below the pre‐recession median wage ($19.32) in 2007, signaling an uneven recovery.
Lockton Mountain West Benefit Group conducted its annual employer survey and found that average health insurance rates for employers will increase 4.7 percent in 2017, while the remainder of the cost will be absorbed by workers through higher premiums or reduced benefits. The increase is higher than employers in many other states face due to Colorado’s larger percentage of small employers and the number of employers in rural areas. The survey also found that 57 percent of employers in the state offer high‐deductible plans, roughly four‐times the amount in 2007. Further, 55 percent of employers reported they plan to increase employee contributions for family coverage, while 51 percent will increase employee contributions for single coverage.
Labor Force and Employment
Employment in Metro Denver rose 3.2 percent between November 2015 and 2016, or an additional 50,400 jobs during the period. The employment growth consisted of a 3.1 percent increase in the Denver‐Aurora‐Lakewood MSA, or an additional 43,400 jobs, and a 3.8 percent increase in the Boulder MSA, representing an additional 7,000 jobs. The natural resources and construction supersector reported the largest percentage increase over‐the‐year in employment, rising 9.8 percent or adding 10,000 jobs. The professional and business services supersector created the most jobs during the period (12,800 jobs), rising 4.4 percent over‐the‐year. The leisure and hospitality supersector also recorded significant growth, rising 7 percent. The information and financial activities supersectors recorded over‐the‐year employment declines, decreasing 2.2 percent and 1.7 percent, respectively.
Colorado employment rose 2.1 percent in November compared with the previous year’s level, adding 55,200 new jobs. National employment levels increased 1.6 percent over‐the‐year, with the addition of 2.3 million jobs.
Quarterly Census of Employment and Wages data was released for the second quarter of 2016 and reported that Metro Denver added fewer jobs than previously thought. The data showed that Metro Denver added 32,900 jobs over‐the‐year, a 2.4 percent growth rate compared with the Current Employment Statistics estimate of a 3 percent increase. The state added 50,500 jobs over‐the‐year, a 2 percent growth rate compared with the original estimate of 2.6 percent. Jobs in the construction, leisure and hospitality, professional and business services, mining and logging, and manufacturing sectors will likely be revised down from original estimates. Further, jobs in government, other services, and information may be revised down. Trade, transportation, and utilities, financial activities, and education and health services will likely be revised upward.

Metro Denver Economic Development Corporation | January 10, 2017 | Page 6
Nonfarm Wage & Salary Employment (000s, not seasonally adjusted)
Month of Month of Month of
Year‐to‐Date
Average
Year‐to‐Date
Average
Year‐to‐Date
Average
Annual Growth
Rate
Annual Growth
Rate
Nov‐16 (p) Oct‐16 (r) Nov‐15 2016 2015 % Change 2011 2006
Total 11‐County Metro Denver* 1,648.4 1,652.3 1,598.0 1,622.7 1,573.2 3.1% 1.8% 2.0%
Denver‐Aurora‐Lakewood MSA 1,458.2 1,463.3 1,414.8 1,437.8 1,393.2 3.2% 1.7% 2.1%
Boulder MSA 190.2 189.0 183.2 184.9 180.1 2.7% 2.8% 1.5%
Natural Resources & Construction 112.5 114.2 102.5 108.5 100.1 8.4% ‐0.5% 4.1%
Manufacturing 87.2 87.5 87.0 87.5 85.6 2.2% 2.2% ‐0.4%
Wholesale & Retail Trade 233.0 232.0 232.0 229.5 227.1 1.1% 1.5% 1.4%
Transp., Warehousing & Utilities 56.2 55.8 54.2 54.0 53.8 0.3% ‐0.7% 0.0%
Information 52.7 53.5 53.9 53.8 53.6 0.3% 0.0% ‐1.2%
Financial Activities 109.9 111.4 111.8 111.2 109.5 1.6% ‐0.2% 0.8%
Professional & Business Services 301.5 299.4 288.7 294.6 284.8 3.4% 3.9% 4.1%
Education & Health Services 212.5 211.5 201.4 206.1 199.3 3.4% 3.6% 2.9%
Leisure & Hospitality 185.4 189.5 173.3 185.3 174.7 6.1% 3.3% 2.9%
Other Services 61.0 61.9 59.6 61.0 59.5 2.6% 1.7% 2.1%
Government 236.5 235.6 233.6 231.2 225.3 2.6% 0.1% 1.3%
Federal Gov't 30.7 31.0 30.3 30.7 30.3 1.4% ‐3.0% ‐1.8%
State Gov't 62.5 62.3 61.0 59.2 57.4 3.1% 3.1% 1.0%
Local Gov't 143.3 142.3 142.3 141.3 137.6 2.7% ‐0.3% 2.2%
Colorado 2,625.5 2,634.6 2,570.3 2,604.7 2,536.0 2.7% 1.6% 2.4%
United States 146,399 145,920 144,122 144,154 141,661 1.8% 1.2% 1.8%
*Includes the Denver‐Aurora‐Lakewood MSA (Adams, Arapahoe, Broomfield, Clear Creek, Denver, Douglas, Elbert, Gilpin, Jefferson, and Park Counties) and the Boulder MSA (Boulder County).
Source: Colorado Department of Labor and Employment, Labor Market Information. (p) =preliminary (r) =revised
Metro Denver Industry Cluster Headlines
Aerospace
Centennial‐based United Launch Alliance (ULA) launched the U.S. Air Force Wideband Global SATCOM‐8 (WGS) satellite aboard a Delta IV rocket. After on‐orbit tests, WGS‐8 will begin operating in early 2017 and two more WGS satellites are in production, bringing the total constellation to 10 by 2019. The satellite was the eighth WGS satellite launched by ULA since 2007 and was ULA’s 114th‐consecutive successful launch.
The National Aeronautics and Space Administration (NASA) selected a space probe named Lucy, proposed by the Boulder office of the Southwest Research Institute, for its next Discovery‐class mission. The 12‐year mission will launch in October 2021 to study six asteroids near Jupiter to further scientific understanding of the early solar system. Jefferson County‐based Lockheed Martin Space Systems Co. will build, assemble, and test the spacecraft.
NASA tripled the number of flights awarded to SpaceX and Boeing Co., giving Centennial‐based United Launch Alliance four additional missions to ferry astronauts to the International Space Station. Boeing’s CST‐100 Starliner will launch aboard an Atlas V rocket carrying up to four astronauts and 220 pounds of cargo at a time beginning in 2018.
Aviation
The Denver City Council approved several projects for Denver International Airport (DEN). DEN will partner with Panasonic Enterprise Solutions to create an $11.5 million LED‐lighted “welcome sign” along Peña Boulevard. The
Metro Denver Economic Development Corporation | January 10, 2017 | Page 7
council also approved five‐year contracts with DEN’s current parking and shuttle bus contractors, totaling $268 million, and approved an intergovernmental agreement with Adams County and several suburban cities to create a regional agency focused on promoting development of DEN’s Aerotropolis. Further, Denver City Council contracted with several firms to upgrade checked‐baggage security at DEN. The $120 million contract includes the design and installation of specialized systems, equipment, and software used in carrying and screening checked baggage.
Travelport Worldwide Limited plans to consolidate the company’s three existing U.S. technology hubs in Denver, Atlanta, and Kansas City into two centers of excellence in Metro Denver and Atlanta. The consolidation will enhance and optimize the company’s operational and technological efficiency. Travelport operates a travel commerce platform that connects the world’s leading travel providers with online and offline travel agencies and other travel buyers.
Broadcasting and Telecommunications
Denver‐based Liberty Global merged with Netherlands‐based Vodafone Group, a company that operates European mobile phone networks. The $3.7 billion deal will allow the joint‐venture partners to offer bundles of cable television, broadband, and mobile services to 4.2 million video subscribers and 5.3 million wireless phone subscribers. Liberty Global is the largest multinational cable television and broadband provider worldwide.
SpotXchange Inc., a tech firm that provides an online video advertising platform, will move its headquarters from Westminster to Broomfield in May 2017. The company leased 38,730 square feet of Class A office space at 8181 Arista Place to accommodate its growing workforce and product offerings.
Energy – Fossil Fuels
BP plc will move the headquarters of its U.S. Lower 48 onshore business from Houston to downtown Denver. The company anticipates the office will open with at least 200 employees in early 2018, with more staff to be added later. The new office will improve access to key producing basins in the region and will create a strategic platform for growth.
Denver‐based DCP Midstream Partners LP acquired the assets of a joint venture between Phillips 66 and Spectra Energy Corp. to create the largest natural gas liquids producer and gas processor in the U.S. The $11 billion combined company will be renamed DCP Midstream LP and will help simplify its corporate structure and expand its projects in key U.S. producing basins, including the Denver‐Julesburg Basin.
Baker Hughes Inc. released the latest figures for Colorado’s oil and gas industry and reported that the industry added one more drilling rig in December, which is at a level not seen since November 2015. At the end of December, the state had 28 operating drilling rigs, up from 24 rigs a year ago. Analysts reported the U.S. rig count rose by 16 to 653, but remains down 47 from the 700 rigs operating a year ago.
Energy – Cleantech
Colorado will join with neighboring states Utah and Nevada on development of an electric vehicle charging network along key highway corridors. The corridors will include Interstates 70, 76, and 25 across Colorado; Interstates 70, 80, and 15 across Utah; and Interstates 80 and 15 across Nevada. Overall, the charging network will connect 2,000 miles of highway. An estimated 8,000 electric vehicles are on the road in Colorado, with the state offering a $5,000 tax credit on electric‐vehicle purchases. Additionally, Colorado is building charging stations on its own through the Charge Ahead Colorado program.
Healthcare and Wellness
The Coleman Co. plans to close its headquarters in unincorporated Jefferson County and eliminate 54 jobs by February 2017. Coleman’s parent company, Newell Brands, will fold management of the Coleman product line into its beverage‐ware businesses based in Chicago.

Metro Denver Economic Development Corporation | January 10, 2017 | Page 8
IT‐Software
Hiring for information technology (IT) jobs in Denver will be robust in the first half of 2017, according to the Robert Half Technology IT Hiring Forecast and Local Trends Report. The report indicates that 18 percent of Denver IT executives said they plan to expand their IT teams in the first half of 2017 and 67 percent said they only plan on filling existing IT vacancies. Spokespeople say startup growth in Denver has created demand for IT talent and consultants across many industries.
TapInfluence, a marketing technology company, moved its headquarters from Boulder to downtown Denver. The new space, which includes a production studio and meeting space, will allow the company to grow to as many as 75 employees. TapInfluence manages a network of bloggers with established audiences who consumer‐brand businesses can hire to make blogs videos, podcasts, and other digital content highlighting their products and household goods.
Boulder‐based VictorOps Inc. raised $15 million in a round of Series B funding for customer acquisition, sales and marketing, and product development. The company expects to hire another 15 to 25 employees in 2017. The latest round brings the company’s total funding to about $33 million.
Cloud Elements Inc. raised $13 million in venture capital financing and plans to increase its staff by a third to expand the market for the Denver‐based startup’s technology. Cloud Elements helps software developers publish, integrate, aggregate, and manage their application program interface through a unified platform. Since launching in 2013, the company has raised $21.2 million.
Centennial‐based IQNavigator and VMSBeeline will merge to form one of the largest independent VMS software providers in early 2017. The combined company will be co‐headquartered in Centennial and Jacksonville, Fla., which is Beeline’s domestic operations hub, and will deliver the next generation of technology innovation, end‐to‐end customer engagement services, and value‐add capabilities for managing the contingent workforce. The impact on the company’s existing employment base is unknown.
Technology staffing firm Fast Switch Ltd. will open an office in Denver to be near new clients. The company recruits full‐time hires, but primarily places workers on temporary projects or helps clients keep flexible staffing levels. The new office will bring the company’s total offices nationwide to 12.
Other Industry Headlines
Gluten‐free cracker manufacturer New Beat Foods will open a new 2,400‐square‐foot facility in Longmont. The company currently operates a commercial kitchen in South Boulder and plans to add additional workers once the Longmont kitchen is open.
Seagate Technology laid off 70 workers at its plant in Longmont as the company plans to reduce its workforce worldwide by 17 percent. The company expects to cut more jobs through 2017 as part of its global restructuring plan.
Dà‐Jiāng Innovations (DJI) Science and Technology Co., Ltd. opened its first Colorado authorized location in Lone Tree. The company sells and manufactures unmanned aerial vehicles, aerial photography and videography, gimbals, flight platforms, and propulsion systems to consumers.
National law and lobbying firm Michael Best Strategies, LLC opened an office in Denver. The company plans to hire a team of five strategists and lobbyists, adding weight to efforts in the state on issues such as construction‐defects reform.
Employment Outlook
The Manpower Employment Outlook Survey expects that the percentage of companies in the Denver‐Aurora MSA hiring in the first quarter of 2017 will decrease compared with the previous quarter. The percentage of companies hiring fell 3 percentage points between the fourth quarter of 2016 and the first quarter of 2017, with 25 percent of companies expanding their employment levels. The percentage of companies planning to decrease employment levels rose 2 percentage points from the fourth quarter, with 8 percent of companies planning to reduce employment levels. The

Metro Denver Economic Development Corporation | January 10, 2017 | Page 9
majority of companies intend to maintain staff levels through the first quarter of the year, despite the level falling 1 percentage point over‐the‐quarter to 64 percent. In the first quarter of 2017, job prospects appear best in construction, transportation and utilities, financial activities, leisure and hospitality, other services, and government. Employers in durable goods, manufacturing, information, professional and business services, and education and health services plan to reduce staffing levels.
Hiring expectations in the U.S. weakened slightly through the first quarter of 2017 compared with the prior quarter. The percentage of employers planning to increase employment levels fell 3 percentage points to 19 percent between the fourth quarter of 2016 and the first quarter of 2017. The percentage of companies planning to reduce employment levels was unchanged over‐the‐year and over‐the‐quarter, with 6 percent of companies planning to lay off employees. The percentage of companies planning to maintain staffing levels (73 percent) was 1 percentage point lower than the prior year’s level, but 4 percentage points above the previous quarter’s level. The survey analysts stated that recent political events have caused U.S. employers to remain cautiously optimistic and will keep their headcount stable for the next three months. Additionally, analysts stated there remains significant differences between industries and employers demanding increasingly specific skills to fill positions.
Employment Outlook Survey
Quarter 1 Quarter 4 Quarter 1 YTD YTD Ann Avg 2017 2016 2015 2017 2016 2012
Denver‐Aurora‐Broomfield MSA Percent of Companies Hiring 25% 28% 23% 25% 23% 17%
Percent of Companies Laying Off 8% 6% 4% 8% 4% 6%
Percent of Companies No Change 64% 65% 70% 64% 70% 74%
Percent of Companies Unsure 3% 1% 3% 3% 3% 3%
United States
Percent of Companies Hiring 19% 22% 20% 19% 20% 18%
Percent of Companies Laying Off 6% 6% 6% 6% 6% 8%
Percent of Companies No Change 73% 69% 72% 73% 72% 71%
Percent of Companies Unsure 2% 3% 2% 2% 2% 4%
Source: Manpower Inc.
Unemployment
Metro Denver’s unemployment rate in November decreased to 2.6 percent, the lowest rate since December 2000. The November unemployment rate was 0.3 percentage points below the prior month and 0.5 percentage points below the November 2015 level of 3.1 percent. All seven Metro Denver counties reported unemployment rates of 3 percent or lower in November and recorded over‐the‐month decreases in the unemployment rate. Boulder (2.2 percent) and Douglas (2.3 percent) counties reported the lowest unemployment rates of the seven‐county region. Adams County recorded the largest over‐the‐year decline, falling 0.7 percentage points, and Boulder, Arapahoe, and Jefferson counties reported over‐the‐year declines of 0.5 percentage points. Colorado’s unemployment rate fell 0.5 percentage points over‐the‐year to 2.8 percent during the month of November. The national unemployment rate of 4.4 percent in November was 0.3 percentage points below the October 2016 rate and was 0.4 percentage points below the previous year.

Metro Denver Economic Development Corporation | January 10, 2017 | Page 10
Labor Force Statistics (000s, not seasonally adjusted civilian labor force)
November 2016 (p) 2016 YTD AVG 2015 YTD AVG 2011 2006
Labor Force
Unemploy‐ment Rate
Labor Force
Unemploy‐ment Rate
Labor Force
Unemploy‐ment Rate
Ann Avg Unemploy‐ ment Rate
Ann Avg Unemploy‐ment Rate
Metro Denver 1,708.6 2.6% 1,690.8 3.1% 1,650.8 3.7% 8.1% 4.3%
Adams County 255.9 3.0% 253.7 3.7% 247.7 4.4% 9.9% 4.8%
Arapahoe County 346.2 2.6% 343.0 3.2% 335.0 3.8% 8.3% 4.3%
Boulder County 184.0 2.2% 180.6 2.7% 176.9 3.2% 6.5% 3.7%
Broomfield County 36.0 2.6% 35.6 3.0% 34.7 3.4% 7.0% 4.3%
Denver County 386.0 2.6% 382.4 3.2% 373.3 3.8% 8.6% 4.8%
Douglas County 178.0 2.3% 176.2 2.7% 171.7 3.1% 6.4% 3.6%
Jefferson County 322.3 2.5% 319.3 3.0% 311.7 3.6% 8.0% 4.2%
Colorado 2,906.9 2.8% 2,892.2 3.4% 2,828.5 3.9% 8.4% 4.3%
United States 159,451 4.4% 159,207 4.9% 157,119 5.3% 8.9% 4.6%
Source: Colorado Department of Labor and Employment, Labor Market Information. (p) =preliminary
November unemployment insurance claims increased in Metro Denver, rising 29.5 percent between October and November. However, the November level was 26.6 percent below the year‐ago level. Claims throughout Colorado also increased over‐the‐month, rising 25.2 percent. Similar to Metro Denver, Colorado’s unemployment insurance claims were 23.7 percent below the previous year’s level. Unemployment claims typically increase during the fourth quarter of each year due to company restructuring prior to the first of the year.
Weekly First‐Time Unemployment Insurance Claims
Month of Month of Month of YTD Avg YTD Avg YTD Avg Ann Avg Ann Avg2006 Nov‐16 Oct‐16 Nov‐15 2016 2015 % Change 2011
Metro Denver 1,462 1,129 1,992 1,217 1,319 ‐7.7% 1,789 1,161
Colorado 2,911 2,325 3,816 2,366 2,588 ‐8.6% 3,357 2,115
Note: Reference week data includes the 19th day of the month for all months except November and December, which include the 12th day of the month. Source: Colorado Department of Labor and Employment, Labor Market Information.
Consumer Sector
Sentiment & Spending
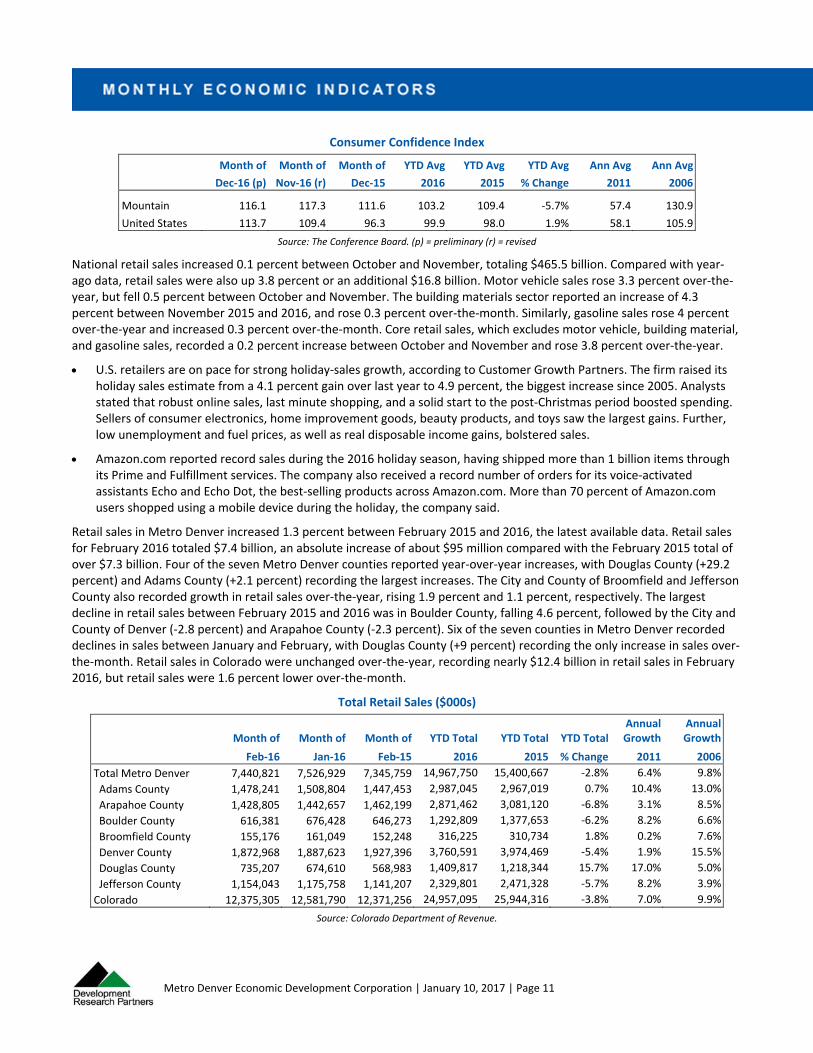
The Consumer Confidence Index for the U.S. rose to its highest level in more than 15 years in December, reporting a level of 113.7 from the revised November level of 109.4, a 3.9 percent increase over‐the‐month. The national index for December 2016 was also 18.1 percent above the December 2015 level. Analysts at The Conference Board stated that between November and December, the Present Situation Index fell 4.5 percent to 126.1 and the Expectations Index rose 11.8 percent to 105.5. Analysts also reported that the post‐election surge in optimism for the economy, jobs, income prospects, and stock prices contributed to rising expectations. Further, consumer confidence in 2017 will hinge on whether expectations of economic growth and policy are met. Consumers generally remain optimistic about labor market strength and business conditions.
Colorado is included in the Mountain Region Index and the area reported a decrease in consumer confidence between November and December. The index fell to 116.1 in December from the November revised level of 117.3, decreasing 1 percent over‐the‐month. Despite the over‐the‐month decline, the index rose 4 percent over‐the‐year. For the Mountain Region, the Present Situation Index fell to 137 in December from 145.7 in November (revised), while the Expectations Index increased to 102.2 from 98.3 in November (revised).
Metro Denver Economic Development Corporation | January 10, 2017 | Page 11
Consumer Confidence Index
Month of Month of Month of YTD Avg YTD Avg YTD Avg Ann Avg Ann Avg Dec‐16 (p) Nov‐16 (r) Dec‐15 2016 2015 % Change 2011 2006
Mountain 116.1 117.3 111.6 103.2 109.4 ‐5.7% 57.4 130.9
United States 113.7 109.4 96.3 99.9 98.0 1.9% 58.1 105.9
Source: The Conference Board. (p) = preliminary (r) = revised
National retail sales increased 0.1 percent between October and November, totaling $465.5 billion. Compared with year‐ago data, retail sales were also up 3.8 percent or an additional $16.8 billion. Motor vehicle sales rose 3.3 percent over‐the‐year, but fell 0.5 percent between October and November. The building materials sector reported an increase of 4.3 percent between November 2015 and 2016, and rose 0.3 percent over‐the‐month. Similarly, gasoline sales rose 4 percent over‐the‐year and increased 0.3 percent over‐the‐month. Core retail sales, which excludes motor vehicle, building material, and gasoline sales, recorded a 0.2 percent increase between October and November and rose 3.8 percent over‐the‐year.
U.S. retailers are on pace for strong holiday‐sales growth, according to Customer Growth Partners. The firm raised its holiday sales estimate from a 4.1 percent gain over last year to 4.9 percent, the biggest increase since 2005. Analysts stated that robust online sales, last minute shopping, and a solid start to the post‐Christmas period boosted spending. Sellers of consumer electronics, home improvement goods, beauty products, and toys saw the largest gains. Further, low unemployment and fuel prices, as well as real disposable income gains, bolstered sales.
Amazon.com reported record sales during the 2016 holiday season, having shipped more than 1 billion items through its Prime and Fulfillment services. The company also received a record number of orders for its voice‐activated assistants Echo and Echo Dot, the best‐selling products across Amazon.com. More than 70 percent of Amazon.com users shopped using a mobile device during the holiday, the company said.
Retail sales in Metro Denver increased 1.3 percent between February 2015 and 2016, the latest available data. Retail sales for February 2016 totaled $7.4 billion, an absolute increase of about $95 million compared with the February 2015 total of over $7.3 billion. Four of the seven Metro Denver counties reported year‐over‐year increases, with Douglas County (+29.2 percent) and Adams County (+2.1 percent) recording the largest increases. The City and County of Broomfield and Jefferson County also recorded growth in retail sales over‐the‐year, rising 1.9 percent and 1.1 percent, respectively. The largest decline in retail sales between February 2015 and 2016 was in Boulder County, falling 4.6 percent, followed by the City and County of Denver (‐2.8 percent) and Arapahoe County (‐2.3 percent). Six of the seven counties in Metro Denver recorded declines in sales between January and February, with Douglas County (+9 percent) recording the only increase in sales over‐the‐month. Retail sales in Colorado were unchanged over‐the‐year, recording nearly $12.4 billion in retail sales in February 2016, but retail sales were 1.6 percent lower over‐the‐month.
Total Retail Sales ($000s)
Month of Month of Month of YTD Total YTD Total YTD Total Annual Growth
Annual Growth
Feb‐16 Jan‐16 Feb‐15 2016 2015 % Change 2011 2006
Total Metro Denver 7,440,821 7,526,929 7,345,759 14,967,750 15,400,667 ‐2.8% 6.4% 9.8%
Adams County 1,478,241 1,508,804 1,447,453 2,987,045 2,967,019 0.7% 10.4% 13.0%
Arapahoe County 1,428,805 1,442,657 1,462,199 2,871,462 3,081,120 ‐6.8% 3.1% 8.5%
Boulder County 616,381 676,428 646,273 1,292,809 1,377,653 ‐6.2% 8.2% 6.6%
Broomfield County 155,176 161,049 152,248 316,225 310,734 1.8% 0.2% 7.6%
Denver County 1,872,968 1,887,623 1,927,396 3,760,591 3,974,469 ‐5.4% 1.9% 15.5%
Douglas County 735,207 674,610 568,983 1,409,817 1,218,344 15.7% 17.0% 5.0%
Jefferson County 1,154,043 1,175,758 1,141,207 2,329,801 2,471,328 ‐5.7% 8.2% 3.9%
Colorado 12,375,305 12,581,790 12,371,256 24,957,095 25,944,316 ‐3.8% 7.0% 9.9%
Source: Colorado Department of Revenue.

Metro Denver Economic Development Corporation | January 10, 2017 | Page 12
The U.S. Consumer Price Index (CPI) increased 1.7 percent between November 2015 and 2016, but fell 0.2 percent over‐the‐month. The increase in the overall CPI between November 2015 and 2016 was attributed to increases in medical care (+4 percent), housing (+2.9 percent), and other goods and services (+1.8 percent). There were also increases over‐the‐year in the recreation index (+0.8 percent), the transportation index (+0.5 percent), and the apparel index (+0.3 percent). The only two indices to report over‐the‐year declines were food and beverages (‐0.3 percent) and education and communication (‐0.3 percent). The core CPI—which excludes food and energy costs—increased 2.1 percent over‐the‐year, but was unchanged over‐the‐month.
According to the AAA Daily Fuel Gauge Report, the national average fuel price for December increased 7.8 percent from November to $2.37 per gallon. The December average fuel price was 19.2 percent higher than the prior year’s level ($1.99 per gallon). Metro Denver reported a 15.3 percent increase in the average fuel price between November and December. The average fuel price of $2.23 per gallon for December in Metro Denver was $0.14 lower than the national average. The area reported average fuel prices that were 23 percent higher in December 2016 than the previous year’s level.
Stock Market
Three of the four stock market indices improved between November and December, but all four recorded increases between December 2015 and 2016. The Bloomberg Colorado index declined 1 percent over‐the‐month to 517.0, but was 4 percent above the prior year’s level. The DJIA recorded the largest over‐the‐month and over‐the‐year increases, rising 3.3 percent and 13.4 percent, respectively. The NASDAQ recorded the smallest increase between November and December, rising 1.1 percent. The S&P 500 rose 1.8 percent over‐the‐month and increased 9.5 percent between December 2015 and 2016.
Stock Market Indexes
Month of Month of Month of YTD Return YTD Return Ann Avg Return
Ann Avg Return
Dec‐16 Nov‐16 Dec‐15 2016 2015 2011 2006
Bloomberg Colorado 517.0 522.4 497.0 4.0% ‐17.3% ‐3.6% 17.3%
S&P 500 2,238.8 2,198.8 2,043.9 9.5% ‐0.7% 0.0% 13.6%
NASDAQ 5,383.1 5,323.7 5,007.4 7.5% 5.9% ‐1.8% 9.5%
DJIA (Dow Jones) 19,762.6 19,123.6 17,425.0 13.4% ‐2.3% 5.5% 16.3%
Sources: Bloomberg.com; Yahoo! Finance.
Travel & Tourism
The average hotel occupancy rate in Metro Denver fell 14.2 percentage points to 64.6 percent occupancy in November compared with the October level. The November level was 2.3 percentage points below the previous year’s level. The average room rate for November was $131.67 per night, 12 percent lower than the October level, but 3 percent higher over‐the‐year. Occupancy rates typically decline during the fall and winter months.
Metro Denver Hotel Statistics
Month of Month of Month of YTD Avg YTD Avg YTD Avg Annual Annual
Nov‐16 Oct‐16 Nov‐15 2016 2015 % Change 2011 2006
Percent of Hotel Rooms Occupied 64.6% 78.8% 66.9% 76.8% 77.8% ‐1.3% 66.8% 66.4%
Average Hotel Room Rate $131.67 $149.57 $127.83 $142.19 $134.87 5.4% $109.94 $101.54
Source: Rocky Mountain Lodging Report.
Spokespeople for Denver International Airport (DEN) reported that over 5.2 million passengers passed through the airport in October, increasing 2.2 percent from the 5.1 million passengers in September. The October 2016 level was 8.3 percent higher than the October 2015 level, recording 398,400 additional passengers through the airport. DEN also recorded nearly 48.8 million passengers during the first 10 months of 2016, an increase of 8.2 percent compared with the same period in 2015. The October passenger volume made this the busiest October on record and the 14th consecutive month of record‐setting passenger traffic.

Metro Denver Economic Development Corporation | January 10, 2017 | Page 13
Denver International Airport Passengers
Month of Month of Month of YTD Total YTD Total YTD Total Annual Annual
Oct‐16 Sep‐16 Oct‐15 2016 2015 % Change 2011 2006
Number of Airline Passengers 5,226,077 5,112,271 4,827,675 48,745,394 45,049,318 8.2% 52,849,132 47,325,016
Source: Denver International Airport, Traffic Statistics.
Residential Real Estate
Denver’s Sun Valley neighborhood received a $30 million U.S. Department of Housing and Urban Development grant to transform its federally supported housing into sustainable, mixed‐income housing with access to transit, improved schools, and jobs. City officials say the grant will provide 750 new mixed‐income housing units and will generate more than $500 million in development as the neighborhood’s density triples in the next decade. Further, the 80‐acre community will reconnect to the city by reconfigured streets and with destinations that make it an appealing place to live and visit. Construction could begin as early as mid‐2017. In the northern part of the neighborhood, the Denver Broncos plan to construct a $351 million entertainment district with retail, commercial, and residential developments.
Embrey Development purchased a 4.2‐acre parcel near Colfax Avenue and Federal Boulevard for $8.1 million. The company plans to build 375 apartment units on the 60,000‐square‐foot property, which was formerly the site of the Festival Shopping Center.
Greystar Real Estate Partners will break ground on a 302‐unit, 16‐story apartment complex in Denver’s Golden Triangle neighborhood in January 2017. The Speer Apartments will be located at the northeast corner of Speer Boulevard and Bannock Street and is slated for completion in mid‐2019.
SW Development plans to break ground on a 45‐unit, affordable housing development at 29th Avenue and Sheridan Boulevard in early 2017. SloHiFlats will include 39 one‐bedroom apartments, six two‐bedroom apartments, an outdoor garden, and rooftop deck. The project is slated for completion in 2018.
Moonstar Investments is planning two new Golden Triangle developments at the corner of 10th Avenue and Acoma Street. One of the developments includes 21 new homes that will range from $600,000 to $1.1 million, measuring about 2,400 square feet. The other development across the street includes 15 smaller townhomes, which will start at about $600,000 and measure about 1,700 square feet.
Developer Ben Maxwell is planning 30 new townhomes and six duplexes on a 2‐acre site at the Sunnyside office complex. The developer also plans to lease 30,000 square feet of office space. Construction for the duplexes will begin in February 2017, with townhome construction beginning in mid‐2017.
Element Properties and Allison Management began construction on a three‐story, 28‐bed dormitory for Naropa University in Boulder. The $4 million project will have 28 rooms for single occupancy, a ground‐floor common area with kitchen, dining, meditation, study, and lounge space. The project is slated for completion in mid‐2017.
Hartman Ely Investments will redevelop Wheat Ridge’s historic Fruitdale School building into 16 multi‐family units. The Fruitdale Lofts will serve as the cornerstone project for the Fruitdale Development District and will be completed by the end of 2017.
Plans are underway for the 350‐acre Red Rocks Ranch residential development at the northeast corner of C‐470 and Morrison Road. The residential development applied for annexation with the city of Lakewood and the town of Morrison, and the new Rooney Valley master plan is nearing completion. The rezoning application will be voted on in early 2017.
Home Resales
Existing home sales in Metro Denver decreased between October and November, falling 6.8 percent to 4,766 homes sold during the month. However, home sales were 19.3 percent higher between November 2015 and 2016. Unsold homes on

Metro Denver Economic Development Corporation | January 10, 2017 | Page 14
the market were 5.7 percent lower in November 2016 than November 2015, with 259 fewer homes on the market as of the end of the month. The average sales price for single‐family homes rose 9.9 percent over‐the‐year to $433,374, while the average sales price of condominiums ($260,340) increased 6.1 percent during the same period. Between November 2015 and 2016, the single‐family market added about $38,920 to the average sales price, while the condominium market added about $14,970 to the average sales price.
Previously‐Owned Home Sales Activity
Month of Month of Month of YTD Total YTD Total YTD Total Ann Total Ann Total
Nov‐16 Oct‐16 Nov‐15 2016 2015 % Change 2011 2006
Home Sales (Closed) 4,766 5,115 3,996 55,415 56,178 ‐1.4% 38,105 50,244
Unsold Homes on Market 4,304 5,241 4,563 4,304 4,563 ‐5.7% 16,187 28,789
Average Sales Price‐Single Family $433,374 $427,991 $394,452 $432,931 $396,059 9.3% $279,858 $317,115
Average Sales Price‐Condo $260,340 $256,408 $245,372 $251,564 $228,399 10.1% $159,141 $188,745
Median Sales Price‐Single Family $365,000 $365,900 $331,000 $230,000 $249,900
Median Sales Price‐Condo $228,750 $225,000 $205,000 $124,900 $157,000
Source: Colorado Comps LLC; Denver Metro Association of Realtors; REcolorado.
According to the National Association of Realtors (NAR), existing‐home sales in November reached their highest annual rate since February 2007. Existing home sales rose 0.7 percent between October and November to 5.6 million homes sold annually. The existing home sales rate for November was 15.4 percent higher than the previous year’s level, adding 750,000 homes sold over‐the‐year. The housing inventory in November fell 8 percent over‐the‐month to 1.85 million existing homes and is 9.3 percent lower than the previous year. About 32 percent of existing home sales in November were first‐time home buyers, which was up from 30 percent from the prior year. NAR economists said the healthy job market and the anticipation of some buyers to close prior to rising mortgage rates have combined to drive sales higher in recent months. Mortgage rates are expected to increase with rising inflation and a strengthening economy. However, inventory is sparse and affordability remains an issue for buyers.
Home Prices
Long‐term U.S. mortgage rates reached their highest levels since April 2014, according to Freddie Mac. The rate on a 30‐year fixed‐rate mortgage averaged 4.32 percent for the week ending December 29, 2016, up from the prior week’s average rate of 4.30 and was 0.3 percentage points above the year‐ago rate of 4.01 percent. Despite the ninth‐consecutive week of increases, the annual average of the 30‐year fixed‐rate mortgage was 3.65 percent in 2016, the lowest annual average rate since 1971. Analysts stated that rising mortgage rates would impact home sales and affordability in 2017.
NAR data shows the November median existing‐home sales price across the U.S. was $234,900, an over‐the‐year increase of 6.8 percent. Median home prices rose for the 57th consecutive month and increased over‐the‐year in each of the nation’s four regions. The South reported the largest increase between November 2015 and 2016, rising 9.2 percent to a median home price of $206,900. Median home prices in the West were the highest among all four regions ($345,400), rising 8.5 percent over‐the‐year. The Midwest reported the lowest median home price ($180,300), which was 6.5 percent above the previous year’s level. The Northeast reported an over‐the‐year increase of 3.3 percent to $263,000.
Median Sales Price of Existing Single‐Family Homes ($000s)
Quarter 3 Quarter 2 Quarter 3 YTD Avg YTD Avg YTD Avg Median Median
2016 (p) 2016 (r) 2015 2016 2015 % Change 2011 2006
Boulder MSA $515.2 $549.6 $449.0 $514.8 $451.6 14.0% $353.1 $366.4
Denver‐Aurora MSA $386.8 $394.4 $353.0 $383.4 $351.3 9.1% $231.4 $249.5
United States $240.9 $240.7 $228.9 $232.9 $221.0 5.4% $166.2 $221.9
Source: National Association of REALTORS. (p) =preliminary (r) =revised
A separate NAR report revealed that median home prices throughout the Metro Denver area decreased between the second and third quarters of 2016, but were stable nationally. The median price in the Boulder MSA ($515,200) was 6.3

Metro Denver Economic Development Corporation | January 10, 2017 | Page 15
percent lower and the price in the Denver‐Aurora MSA ($386,800) was 1.9 percent lower. However, the median price in Boulder was 14.7 percent higher than the third quarter of 2015. Between the third quarters of 2015 and 2016, the Denver‐Aurora MSA recorded a 9.6 percent increase. The national median sales price rose a slight 0.1 percent over‐the‐quarter to $240,900 but was 5.2 percent higher than the previous year’s level. Of the 178 MSAs included in the third quarter 2016 report, the Boulder MSA reported the seventh highest median price and the third largest over‐the‐year increase. The Denver‐Aurora MSA median price was the 16th highest and had the 28th largest increase.
According to the S&P/Case‐Shiller home price index, Denver housing prices were unchanged between September and October. The Denver index was 188.65 in October, tying September’s record‐breaking level. Prices in 13 of the 20 cities tracked by the index increased over‐the‐month and all 20 cities recorded increases over‐the‐year. Denver’s home prices in October 2016 were 8.3 percent higher than the prior year’s level, recording the third largest over‐the‐year increase of the 20 cities. Seattle (+10.7 percent) and Portland (+10.3 percent) recorded the largest over‐the‐year increases, while New York (+1.7 percent) reported the smallest increase. The national home price index rose 5.6 percent between October 2015 and 2016. Analysts for the index reported that a shortage of housing inventory, healthy economic activity, and tighter lending standards since the recession continue to support higher home prices. Further, analysts also noted that recent increases in mortgage interest rates could temper home price gains into 2017, exacerbating affordability concerns and stagnant wage growth.
Foreclosures
Metro Denver recorded a 1.6 percent increase in foreclosures in November over the previous month and a 23 percent increase over the year‐ago level. Foreclosures increased in Metro Denver from 204 in November 2015 to 251 in November 2016. Five of the seven counties in the metro area reported increases in the number of foreclosures over‐the‐year.
Real Estate Foreclosures
Month of Month of Month of YTD Total YTD Total YTD Total Annual Total Annual Total
Nov‐16 Oct‐16 Nov‐15 2016 2015 % Change 2011 2006
Total Metro Denver* 251 247 204 2,913 3,166 ‐8.0% 16,708 18,958 Adams County 53 67 46 649 672 ‐3.4% 3,553 4,330 Arapahoe County 59 44 46 665 778 ‐14.5% 3,959 4,719 Boulder County 8 9 9 163 197 ‐17.3% 918 790 Broomfield County 2 2 1 30 33 ‐9.1% 207 194 Denver County 63 64 41 622 630 ‐1.3% 3,434 4,696 Douglas County 27 22 22 308 292 5.5% 1,781 1,258 Jefferson County 39 39 39 476 564 ‐15.6% 2,856 2,971
*The total number of election and demand setups (initial filings) received by county public trustees. Filings may be subsequently cured or withdrawn. Sources: County public trustees.
However, Boulder County reported an 11.1 percent decline and Jefferson County’s foreclosures were unchanged from the year‐ago level. Three of the seven counties reported decreases in foreclosures between October and November, consisting of Adams County, Boulder County, and the City and County of Denver. Foreclosures in Arapahoe and Douglas counties increased between October and November. Through November, only Douglas County has recorded an increase in 2016 over 2015 year‐to‐date.
Metro Denver Economic Development Corporation | January 10, 2017 | Page 16
RealtyTrac released the foreclosure report for November 2016, stating the U.S. foreclosure rate decreased 17 percent from the previous year’s level. The total filings for the month of November (842,723 filings) were also 18 percent lower than the previous month’s level. Further, one in every 1,526 U.S. housing units had a foreclosure filing during the month of November and the states with the highest November foreclosure rates were New Jersey, Delaware, Nevada, Connecticut, and Maryland.
New Homes
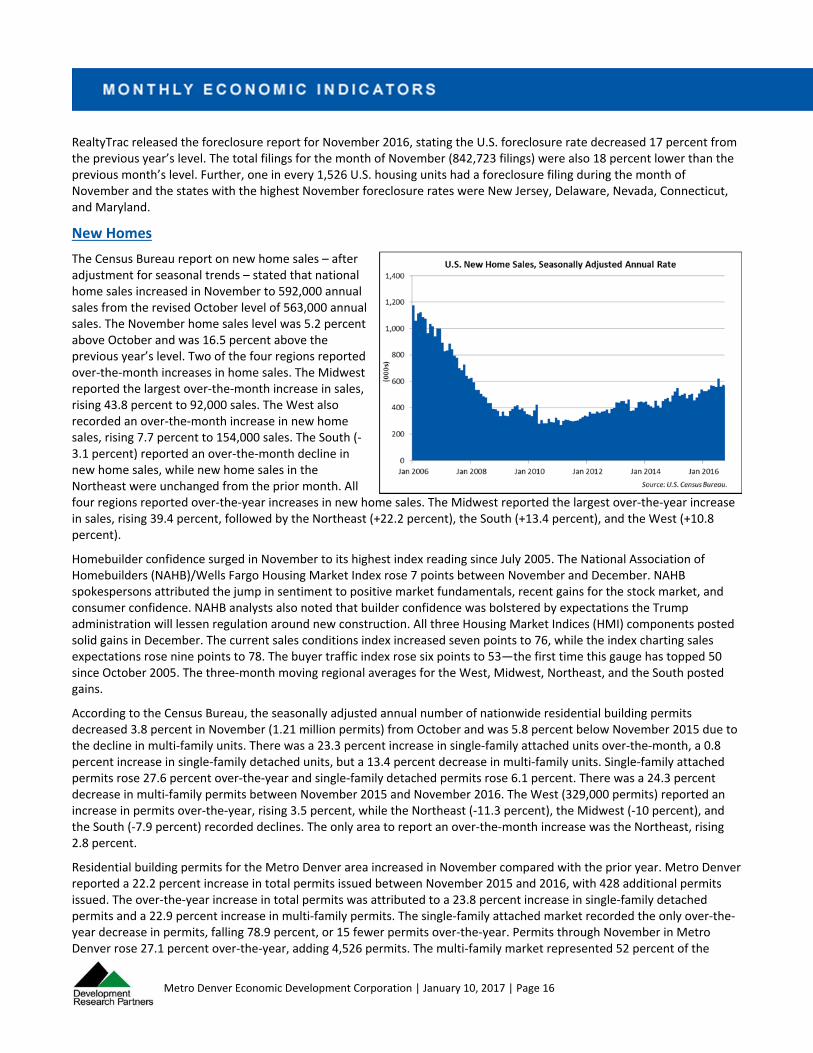
The Census Bureau report on new home sales – after adjustment for seasonal trends – stated that national home sales increased in November to 592,000 annual sales from the revised October level of 563,000 annual sales. The November home sales level was 5.2 percent above October and was 16.5 percent above the previous year’s level. Two of the four regions reported over‐the‐month increases in home sales. The Midwest reported the largest over‐the‐month increase in sales, rising 43.8 percent to 92,000 sales. The West also recorded an over‐the‐month increase in new home sales, rising 7.7 percent to 154,000 sales. The South (‐3.1 percent) reported an over‐the‐month decline in new home sales, while new home sales in the Northeast were unchanged from the prior month. All four regions reported over‐the‐year increases in new home sales. The Midwest reported the largest over‐the‐year increase in sales, rising 39.4 percent, followed by the Northeast (+22.2 percent), the South (+13.4 percent), and the West (+10.8 percent).
Homebuilder confidence surged in November to its highest index reading since July 2005. The National Association of Homebuilders (NAHB)/Wells Fargo Housing Market Index rose 7 points between November and December. NAHB spokespersons attributed the jump in sentiment to positive market fundamentals, recent gains for the stock market, and consumer confidence. NAHB analysts also noted that builder confidence was bolstered by expectations the Trump administration will lessen regulation around new construction. All three Housing Market Indices (HMI) components posted solid gains in December. The current sales conditions index increased seven points to 76, while the index charting sales expectations rose nine points to 78. The buyer traffic index rose six points to 53—the first time this gauge has topped 50 since October 2005. The three‐month moving regional averages for the West, Midwest, Northeast, and the South posted gains.
According to the Census Bureau, the seasonally adjusted annual number of nationwide residential building permits decreased 3.8 percent in November (1.21 million permits) from October and was 5.8 percent below November 2015 due to the decline in multi‐family units. There was a 23.3 percent increase in single‐family attached units over‐the‐month, a 0.8 percent increase in single‐family detached units, but a 13.4 percent decrease in multi‐family units. Single‐family attached permits rose 27.6 percent over‐the‐year and single‐family detached permits rose 6.1 percent. There was a 24.3 percent decrease in multi‐family permits between November 2015 and November 2016. The West (329,000 permits) reported an increase in permits over‐the‐year, rising 3.5 percent, while the Northeast (‐11.3 percent), the Midwest (‐10 percent), and the South (‐7.9 percent) recorded declines. The only area to report an over‐the‐month increase was the Northeast, rising 2.8 percent.
Residential building permits for the Metro Denver area increased in November compared with the prior year. Metro Denver reported a 22.2 percent increase in total permits issued between November 2015 and 2016, with 428 additional permits issued. The over‐the‐year increase in total permits was attributed to a 23.8 percent increase in single‐family detached permits and a 22.9 percent increase in multi‐family permits. The single‐family attached market recorded the only over‐the‐year decrease in permits, falling 78.9 percent, or 15 fewer permits over‐the‐year. Permits through November in Metro Denver rose 27.1 percent over‐the‐year, adding 4,526 permits. The multi‐family market represented 52 percent of the

Metro Denver Economic Development Corporation | January 10, 2017 | Page 17
permits issued through November, adding 3,674 permits over‐the‐year. The single‐family detached market represented 46 percent of the permits issued year‐to‐date and single‐family attached represented 2 percent of the total. Compared with October 2016, permits in November in Metro Denver fell 31.6 percent with 1,086 fewer permits. All three market types recorded permit decreases over‐the‐month.
Residential Building Permits
Month of Month of Month of YTD Total YTD Total YTD Total Total Total
Nov‐16 Oct‐16 Nov‐15 2016 2015 % Change 2011 2006
Single‐Family Detached Units 822 916 664 9,833 9,015 9.1% 3,885 12,938Single‐Family Attached Units 4 48 19 419 385 8.8% 309 428Multi‐Family Units 1,528 2,476 1,243 10,952 7,278 50.5% 3,005 4,769Total Units 2,354 3,440 1,926 21,204 16,678 27.1% 7,199 18,135
Source: U.S. Census Bureau.
Apartment Rental Market
The Denver Metro Apartment Vacancy and Rent Survey for the third quarter of 2016 reported declining vacancy for the third straight quarter in the metro area, falling 0.3 percentage points to 5.1 percent from the second quarter of 2016. However, the average vacancy rate in 2016 year‐to‐date was 0.7 percentage points above the prior year. Since third quarter 2015, the metro area has posted two quarters with the highest vacancy rates reported since the second quarter of 2010. Vacancy rates ranged from 4.1 percent in Jefferson County to 6 percent in Douglas County. Douglas County reported the largest over‐the‐year increase of the counties for the fourth straight quarter, rising 1.6 percentage points. Vacancy rates declined over‐the‐year in just two counties, Arapahoe and Jefferson.
Apartment Statistics
Quarter 3 Quarter 2 Quarter 3
YTD Average
YTD Average
YTD Average
Annual Average
Annual Average
2016 2016 2015 2016 2015 % Change 2011 2006
Apartment Vacancy Rate 5.1% 5.4% 5.0% 5.5% 4.8% 5.2% 7.0%
Average Monthly Rental Rate (all units) $1,368 $1,371 $1,292 $1,351 $1,254 7.8% $932 $850
Source: Denver Metro Apartment Vacancy and Rent Survey.
The average monthly rental rate of apartments in Metro Denver decreased during the third quarter of 2016, the first quarterly decline since fourth quarter 2013. The third quarter average rental rate in Metro Denver ($1,368) was 0.2 percentage points lower than the previous quarter’s level. However, the rate was 5.9 percent higher than the third quarter of 2015, representing an increase of $76 in average monthly rental rates over‐the‐year. The average rental rate ranged from $1,265 in Adams County to $1,511 in the Boulder/Broomfield area. All six submarkets reported over‐the‐year increases in average rental rates, ranging from 0.4 percent in the Boulder/Broomfield area to 8.5 percent in Denver County. While rents continued to increase in Metro Denver over‐the‐year, the 5.9 percent increase was much lower than the 13.3 percent increase recorded in the second quarter of 2015.
Commercial Real Estate
The Denver Art Museum (DAM) received a $25 million donation—the largest‐ever single gift to the DAM—to help finance a $150 million remodel of its Gio Ponti‐designed building. The gift from J. Landis Martin, the chairman of DAM’s board, and his wife Sharon will also help expand gallery spaces, add educational programs, and provide an updated welcome center. Construction is slated to begin by the end of 2018, with the project expected to be completed in 2021.
The Thrash Group plans to build a 123‐room boutique hotel in Golden, which will anchor the 22‐acre Gateway Village development. The Origin Red Rocks will target Red Rocks concertgoers and will include a 3,000‐square‐foot event space, shuttle service to Red Rocks, a restaurant, and a bar. The hotel is slated for completion in the spring of 2018.

Metro Denver Economic Development Corporation | January 10, 2017 | Page 18
Office Market
The Metro Denver office market reported declines in the vacancy rate and increases in the average lease rate through the fourth quarter of 2016. According to CoStar, the direct vacancy rate fell 0.3 percentage points over‐the‐year to 9.3 percent vacancy. The fourth quarter 2016 direct vacancy rate was the lowest fourth quarter vacancy rate since 2000 when the vacancy rate was 6.8 percent. The average lease rate rose 2.9 percent between the fourth quarters of 2015 and 2016, gaining $0.71 per square foot during the same period. Existing square footage in the office market increased 1.4 million square feet in 28 buildings during the same period.
Office construction in Metro Denver was robust during the fourth quarter of 2016. There was nearly 1.4 million square feet of space completed across 28 buildings in 2016. Some of the largest office buildings completed through 2016 included the 311,015‐square‐foot 1401 Lawrence office building in downtown Denver, the 175,755‐square‐foot Pearl West office building in Boulder, and the 127,000‐square‐foot FirstBank office building in Jefferson County. There was nearly 5.91 million square feet of space under construction during the fourth quarter of 2016, nearly double the amount of space under construction from the prior year. Of this space, nearly 3.8 million square feet of space was under construction in the City and County of Denver, the largest amount of space of the seven counties at 63.7 percent of total Metro Denver construction.
Office Market Statistics
Quarter 4 Quarter 3 Quarter 4 Quarter 4 Quarter 4 Quarter 4
2016 2016 2015 2014 2013 2012
Number of Buildings 6,092 6,087 6,064 6,032 6,006 5,990
Existing Square Feet (millions) 180.4 180.0 179.0 176.7 175.6 174.6
Vacant Square Feet (direct, millions) 16.9 16.9 17.1 17.8 19.4 20.9
Vacancy Rate (direct) 9.3% 9.4% 9.6% 10.0% 11.1% 12.0%
Vacancy Rate (with sublet) 10.2% 10.1% 10.2% 10.6% 11.5% 12.3%
Avg. Lease Rate (direct, per sq. foot, full service) $25.36 $25.15 $24.65 $23.50 $22.30 $20.89New Construction Completed (year‐to‐date) 1.36 MSF,
28 Bldgs0.98 MSF, 23 Bldgs
2.08 MSF, 27 Bldgs
1.16 MSF, 23 Bldgs
0.95 MSF, 15 Bldgs
0.87 MSF, 8 Bldgs
Currently Under Construction 5.91 MSF, 45 Bldgs
4.84 MSF, 36 Bldgs
3.18 MSF, 33 Bldgs
2.85 MSF, 25 Bldgs
1.79 MSF, 23 Bldgs
0.90 MSF, 10 Bldgs
Source: CoStar Realty Information, Inc. MSF=Million Square Feet
Industrial & Flex Market
Industrial Market Statistics
Quarter 4 Quarter 3 Quarter 4 Quarter 4 Quarter 4 Quarter 4
2016 2016 2015 2014 2013 2012
Number of Buildings 6,954 6,945 6,924 6,914 6,887 6,878
Existing Square Feet (millions) 210.7 209.2 206.2 204.6 201.9 200.8
Vacant Square Feet (direct, millions) 8.0 7.0 6.3 6.2 8.3 10.5
Vacancy Rate (direct) 3.8% 3.3% 3.1% 3.0% 4.1% 5.2%
Vacancy Rate (with sublet) 4.1% 3.6% 3.3% 3.2% 4.4% 5.7%
Avg. Lease Rate (direct, per square foot, NNN) $7.41 $7.26 $7.03 $6.03 $5.11 $4.71New Construction Completed (year‐to‐date) 4.51 MSF,
30 Bldgs2.71 MSF, 19 Bldgs
1.37 MSF, 7 Bldgs
2.60 MSF, 23 Bldgs
0.93 MSF, 5 Bldgs
0.58 MSF, 8 Bldgs
Currently Under Construction 2.33 MSF, 29 Bldgs
3.82 MSF, 34 Bldgs
2.97 MSF, 17 Bldgs
1.35 MSF, 6 Bldgs
2.01 MSF, 15 Bldgs
1.05 MSF, 7 Bldgs
Source: CoStar Realty Information, Inc. MSF=Million Square Feet

Metro Denver Economic Development Corporation | January 10, 2017 | Page 19
CoStar Realty data revealed that the industrial market continued to loosen during the fourth quarter of 2016. The fourth quarter direct vacancy rate was 0.7 percentage points higher than the fourth quarter of 2015. The average lease rate rose 5.4 percent between the fourth quarters of 2015 and 2016, adding $0.38 per square foot to the average lease rate. There was also a 2.1 percent increase over‐the‐quarter in the average lease rate. There were 30 industrial buildings completed in 2016, ranging from the 15,000‐square‐foot New Terrain Brewing building in Golden to the 545,000‐square‐foot Medline Industries building in Aurora. There were 29 buildings with over 2.3 million square feet of space under construction during the period.
Similar to the industrial market, the Metro Denver flex market recorded rising vacancy rates and average lease rates through the fourth quarter of the year. The direct vacancy rate for flex space rose 0.6 percentage points to 7.6 percent between the fourth quarters of 2015 and 2016. The average lease rate rose 4.9 percent over‐the‐quarter to $11.42 per square foot. The fourth quarter lease rate was also 8.2 percent higher than the prior year’s level and added $0.87 per square foot. There was 241,470 square feet of new space completed in 2016, including the 110,520‐square‐foot 150 Capital Drive building in Golden, the 54,960‐square‐foot TIC Corporate Training Facility in Aurora, and a 33,500‐square‐foot flex building in the Mountain West Business Center in unincorporated Jefferson County.
Flex Space Statistics
Quarter 4 Quarter 3 Quarter 4 Quarter 4 Quarter 4 Quarter 4
2016 2016 2015 2014 2013 2012
Number of Buildings 1,469 1,467 1,463 1,457 1,448 1,443
Existing Square Feet (millions) 41.7 41.6 41.5 41.1 40.4 40.2
Vacant Square Feet (direct, millions) 3.2 3.0 2.9 3.4 4.1 5.0
Vacancy Rate (direct) 7.6% 7.3% 7.0% 8.2% 10.1% 12.5%
Vacancy Rate (with sublet) 7.9% 7.7% 8.3% 9.5% 11.6% 13.9%
Avg. Lease Rate (direct, per square foot, NNN) $11.42 $10.89 $10.55 $9.89 $9.37 $8.65New Construction Completed (year‐to‐date) 0.24 MSF,
6 Bldgs0.13 MSF,
4 Bldgs0.50 MSF,
7 Bldgs0.57 MSF,
9 Bldgs 0.10 MSF,
3 Bldgs0.13 MSF,
3 BldgsCurrently Under Construction 0.39 MSF,
8 Bldgs0.36 MSF,
7 Bldgs0.22 MSF,
4 Bldgs0.32 MSF,
3 Bldgs 0.23 MSF,
5 Bldgs0.08 MSF,
3 Bldgs
Source: CoStar Realty Information, Inc. MSF=Million Square Feet
Retail Market
Metro Denver’s retail market continued to gain momentum through the fourth quarter of 2016. The direct vacancy rate decreased 0.5 percentage points between the fourth quarters of 2015 and 2016 and was 0.2 percentage points below the third quarter 2016 level. The fourth quarter direct vacancy rate was the lowest fourth quarter level since the fourth quarter of 2002. The average lease rate for retail space rose 3.4 percent over‐the‐year, adding $0.55 per square foot during this same period of time.
The majority of completed retail projects during the year were small projects. Of the 90 buildings completed in 2016, 57 of them were smaller than 10,000 square feet, with an overall average size of 5,586 square feet. Douglas and Arapahoe Counties recorded the largest amounts of retail space completed through 2016, reporting 419,020 square feet and 256,840 square feet of retail space completed, respectively. There were 51 buildings under construction at the end of 2016, totaling about 1.2 million square feet. Twenty‐three of the buildings under construction were larger than 10,000 square feet, spanning a total over 1 million square feet or 86 percent of total retail space under construction.

Metro Denver Economic Development Corporation | January 10, 2017 | Page 20
Retail Market Statistics
Quarter 4 Quarter 3 Quarter 4 Quarter 4 Quarter 4 Quarter 4
2016 2016 2015 2014 2013 2012
Number of Buildings 11,915 11,892 11,824 11,740 11,659 11,574
Existing Square Feet (millions) 164.9 164.6 163.6 162.2 161.2 159.7
Vacant Square Feet (direct, millions) 7.5 7.7 8.2 8.6 9.3 10.1
Vacancy Rate (direct) 4.5% 4.7% 5.0% 5.3% 5.8% 6.3%
Vacancy Rate (with sublet) 4.8% 4.9% 5.2% 5.4% 6.0% 6.5%
Avg. Lease Rate (direct, per square foot, NNN) $16.55 $16.35 $16.00 $15.66 $15.34 $14.75New Construction Completed (year‐to‐date) 1.32 MSF,
90 Bldgs0.93 MSF, 63 Bldgs
1.16 MSF, 66 Bldgs
0.59 MSF, 51 Bldgs
1.15 MSF, 69 Bldgs
0.59 MSF, 46 Bldgs
Currently Under Construction 1.19 MSF, 51 Bldgs
1.64 MSF, 59 Bldgs
0.94 MSF, 43 Bldgs
0.87 MSF, 37 Bldgs
0.42 MSF, 29 Bldgs
0.85 MSF, 27 Bldgs
Source: CoStar Realty Information, Inc. MSF=Million Square Feet

Metro Denver Economic Development Corporation | January 10, 2017 | Page 21
Monthly/Quarterly Direction Year‐Over‐Year Direction Year‐to‐Date Direction
Positive Changes 5 of 18 13 of 18 11 of 18
Nonfarm Employment Growth
‐3,900 +50,400 +49,500 Employment down 0.2% from
Oct. to Nov. Employment up 3.2% from
Nov. 2015 to 2016 YTD employment up 3.1%
through Nov.
% Companies Hiring (Denver Area)
25% 25% 25% Companies expecting to add workers fell 3 percentage points from 4Q 2016 to 1Q
2017
Companies expecting to add workers rose 2 percentage points from 1Q 2016 to 1Q
2017
YTD average up 3 percentage points compared with 2016
Unemployment Rate
2.6% ‐0.5 percentage
points 3.1%
Unemployment was down 0.3 percentage points from Oct. to
Nov.
Unemployment rate down from Nov. 2015 to 2016
Down from 2015 YTD average of 3.7%
Initial Unemployment Insurance Claims
+29.5% ‐26.6% ‐7.7% Claims increased from Oct. to
Nov. Claims decreased from Nov.
2015 to 2016 YTD average claims decreased
through Nov. 2016
Total Retail Sales ‐1.1% 1.3% ‐2.8%
Metro sales decreased from Jan. to Feb.
Metro sales up from Feb. 2015 to 2016
YTD sales down through Feb. 2016
Mountain Region Consumer Confidence
Index
116.1 4.0% 103.2 Index down 1% from Nov. to
Dec. Index up from Nov. 2015 to
2016 YTD average down 5.7%
through Dec. 2016
Hotel Occupancy
64.6% ‐2.3 percentage
points 76.8%
Decreased 14.2 percentage points from Oct. to Nov.
Occupancy decreased from Nov. 2015 to 2016
YTD occupancy down 1 percentage points from last
year
DIA Passengers 2.2% 8.3% 8.2%
Passengers up from Sept. to Oct.
Passengers up from Oct. 2015 to 2016
YTD passengers increased through Oct. 2016
Bloomberg Colorado Index
517.0 4.0% 4.0% Index down 1% from Nov. to
Dec. Index up from Dec. 2015 to
2016 YTD return through Dec. 2016
Dow Jones Industrial Average
19,762.6 13.4% 13.4% Index up 3.3% from Nov. to
Dec. Index up from Dec. 2015 to
2016 YTD return through Dec. 2016
Home Sales (closed) 4,766 19.3% 55,415
Sales down 6.8% from Oct. to Nov.
Sales up from Nov. 2015 to 2016
YTD sales down 1.4% through Nov. 2016
Median Home Price (Denver‐Aurora MSA)
$386,800 9.6% $383,400 Down 1.9% from 2Q 2016 to
3Q 2016 Price up from 3Q 2015 to 3Q
2016 YTD price 9.1% higher through
3Q 2016
Foreclosures 251 23.0% 2,913
Up 1.6% from Oct. to Nov. Up from Nov. 2015 to 2016 Down 8.0% YTD through Nov.
2016

Metro Denver Economic Development Corporation | January 10, 2017 | Page 22
Residential Building Permits (Total)
2,354 22.2% 21,204 Permits decreased 31.6% from
Oct. to Nov. Permits up from Nov. 2015 to
2016 YTD permits up 27.1% through
Nov. 2016
Apartment Vacancy Rate
5.1% 0.1 percentage
points 5.5%
Vacancy decreased 0.3 percentage points from 2Q
2016 to 3Q 2016
Vacancy increased from 3Q 2015 to 3Q 2016
YTD average up 0.7 percentage points from last
year
Office Vacancy Rate (with Sublet)
10.2% 0.0 percentage
points
0.0 percentagepoints
Vacancy rate up 0.1 percentage points from 3Q
2016 to 4Q 2016
Vacancy rate unchanged from 4Q 2015 to 4Q 2016
Vacancy rate unchanged from 4Q 2015 to 4Q 2016
Industrial Vacancy Rate (with Sublet)
4.1% +0.8 percentage
points
+0.8 percentage points
Vacancy rate up 0.5 percentage points from 3Q
2016 to 4Q 2016
4Q 2016 vacancy up from 3.3% one year ago
4Q 2016 vacancy up from 3.3% one year ago
Retail Space Vacancy Rate (with Sublet)
4.8% ‐0.4 percentage
points
‐0.4 percentage points
Vacancy rate down 0.1 percentage point from 3Q
2016 to 4Q 2016
4Q 2016 vacancy rate down from 5.2% one year ago
4Q 2016 vacancy rate down from 5.2% one year ago

Economic and Demographic Research Industry Studies Fiscal and Economic Impact Analysis Real Estate Economics 10184 West Belleview Avenue Suite 100 Littleton, Colorado 80127 www.DevelopmentResearch.net 303.991.0070