Major Economic Indicators: Monthly Update - … · 2017-06-21 · Major Economic Indicators:...
27
Major Economic Indicators: Monthly Update Volume 06/2017 June 2017 Monetary Policy Department BANGLADESH BANK
Transcript of Major Economic Indicators: Monthly Update - … · 2017-06-21 · Major Economic Indicators:...

Major Economic Indicators: Monthly Update
Volume 06/2017 June 2017
Monetary Policy Department
BANGLADESH BANK

0
Contents Page No.
Executive summary 1-2
1. Monetary and credit developments 3
2. Reserve money developments 4
3. CPI and inflation 5
4. Liquidity position of the scheduled banks 6
5. Financial sector prices
a) Weighted average yields on bills and bonds 7
b) Interest rate spread 8
6. Capital market developments 9
7. Agricultural credit and non-farm rural credit 10
8. Industrial and SME loans
a) Industrial term loans 11
b) Outstanding position of SME loans 11
9. Industrial production 12
10. Exports
a) Annual exports 13
b) Monthly exports 13
c) Category-wise breakdown of exports 14
11. Imports
a) Custom based import, import LCs settlement and LCs opening 15
b) Sector-wise fresh opening, settlement and outstanding LCs 16
c) Projected data on opening of import LCs & probable liabilities against BTB LCs 16
12. Workers’ remittances 17
13. Foreign exchange holdings by Bangladesh Bank and Commercial Banks 17
14. Foreign aid 18
15. Exchange rate movements 19
16. Balance of payments 20
17. Public finance
a) Government tax revenue collections 21
b) Sale and repayment of National Savings Certificates (NSC) 22
c) Budget financing 23
18. Food situations 23
Appendix 24 -25

1
Executive Summary
Broad money(M2) growth continued to slow down while private sector credit growth rises further in April 2017
1. Movement of monetary indicators
Broad money (M2) increased by 12.75 percent (y-o-y) in April 2017 which was lower
than 14.07 percent of the same month of the previous year. Net foreign assets and net
domestic assets registered 14.21 percent and 12.24 percent growth respectively in April
2017. Private sector credit recorded 16.21 percent growth in April 2017 which was
higher than 15.59 percent of the same month of the previous year.
12-month average inflation eased while point to point inflation went up in March 2017
Interest rate spread narrowed in April, 2017 while call money rate has increased up to June 18, 2017
Export is crawling at a slower rate during the first eleven months of FY17
Import growth increased sharply during the first ten months of FY17
2. Inflation scenario
The twelve-month average inflation slightly declined to 5.39 percent in March 2017
from 5.41 percent in February 2017. On the other hand, the point-to-point inflation
increased to 5.39 percent in March 2017 from 5.31 percent in February 2017.
3. State of the financial sector
The spread between the weighted average interest rates on advances and deposits of all
banks narrowed in April 2017 from that of March 2017 and stood at 4.65 percent. The
weighted average call money rate in the inter-bank money market increased to 3.87
percent up to June 18, 2017, as compared to 3.81 percent in May 2017.
4. External sector performance
Merchandise export increased to USD 31.79 billion during July-May, 2016-17 which
was 3.67 percent higher than USD 30.66 billion during the same period of the previous
fiscal year, according to EPB data.
Custom based import during July-April, 2016-17 increased by 11.74 percent and stood
at USD 39.15 billion compared to USD 35.04 billion during the same period of the
previous fiscal year.
Fresh opening of import LCs during July-April, 2016-17 increased by 13.83 percent as
compared to July-April, 2015-16 and stood at USD 39.97 billion. From the sectoral
distribution of LCs opening during the mentioned period, it is revealed that LCs opening
for the industrial raw materials is the highest at 36.91 percent of total LCs opening
followed by consumer goods at 12.53 percent.

2
Workers’ remittances inflow upturns sharply in May 2017 as compared to the previous months Current account balance has been continuing on deficit from the third month of FY17
Both total and net reciept of foreign aid decreased during the first ten months of FY17.
Forex reserves stood at 32.76 billion as on June 15, 2017 NBR tax revenue collection achieved significant growth during the first ten months of FY17.
Agricultural credit,
the general index of
industrial
production, SME
and industrial term
loans have
increased during
the period under
review.
External sector performance (contd.)
Receipts of workers’ remittances in May 2017 increased by 16.01 percent and stood at
USD 1.27 billion as compared to April 2017 and it also increased by 4.38 percent as
compared to the same month of the previous year. However, total receipts of workers’
remittances decreased by 14.19 percent during July-May, 2016-17 as compared to the
same period of the previous fiscal year and stood at USD 11.55 billion.
Current account balance recorded a deficit of USD 1.76 billion during July-April,
2016-17 due mainly to a significant trade deficit and lower income from services and
primary income accounts compared to July-April, 2015-16.
The total foreign aid disbursements during July-April, 2016-17 decreased by USD
0.25 billion or 9.34 percent and stood at USD 2.44 billion as compared to the same
period of the previous fiscal year. Net receipt of foreign aid also decreased by USD 0.28
billion and stood at USD 1.67 billion during July-April, 2016-17 as compared to the
same period of the previous fiscal year.
The gross foreign exchange reserves of BB stood at USD 32.25 billion (with ACU
liability of USD 0.42 billion) as of end May 2017, as compared to USD 32.52 billion
(with ACU liability of USD 1.12 billion) as of end April 2017. As per the latest available
data, gross foreign exchange reserves stood at USD 32.76 billion (with ACU liability of
USD 0.81 billion) as on June 15, 2017.
5. Developments in the fiscal sector NBR Tax Revenue collection stood at Taka 142758.80 crore during July-April, 2016-17
which was 19.62 percent higher than Taka 119344.23 crore during July-April, 2015-16.
6. Credit disbursement and industrial production
The disbursement of agricultural credit and non-farm rural credit increased by
21.80 percent and 24.66 percent respectively during July-April, 2016-17 as compared to
July-April, 2015-16.
Outstanding SME loans provided by banks and non-bank financial institutions at the
end of December 2016 increased by 16.03 percent compared to the same period of the
previous year.
Disbursement of industrial term loans during the second quarter of FY17 increased by
9.86 percent and stood at Taka 19575.20 crore and recovery increased by 14.51 percent
as compared to the corresponding period of the previous fiscal year.
The general index of industrial production (medium & large scale manufacturing)
stood at 276.20 during July-December 2016 recorded an increase of 8.71 percent from
the index of 254.06 during July-December 2015.
Note: The information furnished in this executive summary and the subsequent pages are provisional and subject to revision.

3
1. Monetary and credit developments
Broad money
The broad money (M2) recorded an increase of Taka
109849.30 crore or 12.75 percent at the end of April 2017
against the increase of Taka 106222.20 crore or 14.07
percent at the end of April 2016. Of the sources of broad
money, net domestic assets (NDA) rose by Taka 78200.30
crore or 12.24 percent and net foreign assets (NFA) rose by
Taka 31649.00 crore or 14.21 percent at the end of April
2017 as compared to the same month of the previous year.
M2 growth was slower in the current fiscal year than the
previous fiscal year during the first ten months.
Domestic credit
The domestic credit recorded an increase of Taka 90852.10
crore or 11.96 percent at the end of April 2017 against the
increase of Taka 80247.20 crore or 11.82 percent at the end
of April 2016. Credit to the private sector recorded a growth
of 16.21 percent while credit to the public sector decreased
by 11.91 percent in April 2017 as compared to the same
month of the previous year. Domestic credit growth was
slower in the current fiscal year than the previous fiscal year
during the first ten months due mainly to a big amount of
debt repayment by the government to the banking system.
11.82
12.1811.96
9.0
10.0
11.0
12.0
13.0
14.0
Jul.
Au
g.
Sep
.
Oct
.
No
v.
Dec
.
Jan
.
Feb
.
Mar
.
Ap
r.
May
Jun
.
Per
cen
tage
Trends of domestic credit growth
(year-on-year)
2015-16 2016-17
14.07
13.08
12.75
12.0
13.0
14.0
15.0
16.0
17.0
Jul.
Au
g.
Sep
.
Oct
.
No
v.
Dec
.
Jan
.
Feb
.
Mar
.
Ap
r.
May
Jun
.
Per
cen
tage
Trends of broad money growth
(year-on-year)
2015-16 2016-17
Outstanding stock
Particulars June 2015 June 2016R April 2017 P
June 2016
over
June 2015
April 2017
over
June 2016
April 2017
over
April 2016
April 2016
over
June 2015
April 2016
over
April 2015
1 2 3 4 5 6 7 8 9
189228.80 233135.60 254337.10 43906.80 21201.50 31649.00 33459.30 41443.20
(+23.20) (+9.09) (+14.21) (+17.68) (+22.87)
598385.30 683242.30 716926.70 84857.00 33684.40 78200.30 40341.10 64779.00
(+14.18) (+4.93) (+12.24) (+6.74) (+11.29)
a) Domestic credit 701526.50 801280.00 850268.10 99753.50 48988.10 90852.10 57889.50 80247.20
(+14.22) (+6.11) (+11.96) (+8.25) (+11.82)
Public sector 126927.10 130270.70 101020.30 3343.60 -29250.40 -13661.90 -12244.90 -6710.70
(+2.63) (-22.45) (-11.91) (-9.65) (-5.53)
Government (net) 110257.30 114219.60 84166.20 3962.30 -30053.40 -13376.20 -12714.90 -6738.70
(+3.59) (-26.31) (-13.71) (-11.53) (-6.46)
Other Public 16669.80 16051.10 16854.10 -618.70 803.00 -285.70 470.00 28.00
(-3.71) (+5.00) (-1.67) (+2.82) (+0.16)
Private sector 574599.40 671009.30 749247.80 96409.90 78238.50 104514.00 70134.40 86957.90
(+16.78) (+11.66) (+16.21) (+12.21) (+15.59)
b) Other items (net) -103141.20 -118037.70 -133341.40 -14896.50 -15303.70 -12651.80 -17548.40 -15468.20
C. Broad money (A+B) 787614.10 916377.90 971263.80 128763.80 54885.90 109849.30 73800.40 106222.20
(+16.35) (+5.99) (+12.75) (+9.37) (+14.07)
i) Currency outside banks 87940.80 122074.50 113757.50 34133.70 -8317.00 15011.90 10804.80 15865.80
(+38.81) (-6.81) (+15.20) (+12.29) (+19.14)
ii) Deposits 699673.30 794303.40 857506.30 94630.10 63202.90 94837.40 62995.60 90356.40
(+13.52) (+7.96) (+12.43) (+9.00) (+13.44)
a) Demand deposits 72873.40 90356.20 90538.60 17482.80 182.40 15242.90 2422.30 10940.40
(+23.99) (+0.20) (+20.24) (+3.32) (+17.00)
b) Time deposits 626799.90 703947.20 766967.70 77147.30 63020.50 79594.50 60573.30 79416.00
(+12.31) (+8.95) (+11.58) (+9.66) (+13.06)
(Taka in Crore)
Changes in outstanding stock
A. Net Foreign Assets of
banking system
B. Net Domestic Assets of
banking system
Source: Statistics Department.
Note:- Figures in brackets indicate percentage changes. P=provisional, R= Revised.

4
2. Reserve money developments
*Note :- The change in Net Domestic Assets (NDA) is calculated with the formula :
Reserve Money
Reserve money recorded an increase of Taka 26280.80 crore
or 15.91 percent at the end of April 2017 against the increase
of Taka 26170.60 crore or 18.82 percent at the end of April
2016. Of the sources of reserve money, Bangladesh Bank’s
net foreign assets increased by Taka 31322.80 crore or 14.87
percent while net domestic assets decreased by Taka 5042.00
crore or 11.09 percent at the end of April 2017 as compared
to April 2016.
Money multiplier stood at 5.07 in April 2017 which was 4.74
in June 2016.
18.8218.98
15.91
5.0
10.0
15.0
20.0
25.0
30.0
35.0
Jul.
Au
g.
Sep
.
Oct
.
No
v.
Dec
.
Jan
.
Feb
.
Mar
.
Ap
r.
May
Jun
.
Per
cen
tag
e
Trends of reserve money growth
(year-on-year)
2015-16 2016-17
Particulars June 2015 June, 2016R April 2017 P
June 2016
over
June 2015
April 2017
over
June 2016
April 2017
over
April 2016
April 2016
over
June 2015
April 2016
over
April 2015
1 2 3 4 5 6 7 8 9
Net Foreign Assets of 177401.30 218904.10 242030.00 41502.80 23125.90 31322.80 33305.90 41599.50
Bangladesh Bank (+23.39) (+10.56) (+14.87) (+18.77) (+24.60)
Net Domestic Assets of -28918.80 -25702.80 -50525.70 3216.00 -24822.90 -5042.00 -16564.90 -15428.90
Bangladesh Bank* (+11.12) (-96.58) (-11.09) (-57.28) (-51.34)
Claims on Govt.(net) 810.50 13373.70 2900.40 12563.20 -10473.30 2069.40 20.50 15159.60
(+1550.06) (-78.31) (+249.03) #REF! (-105.80) Claims on other public 2160.80 2015.50 1851.90 -145.30 -163.60 -183.70 -125.20 -34.20
(-6.72) (-8.12) (-9.02) (-5.79) (-1.65)
Claims on DMBs 5659.20 6024.40 5301.00 365.20 -723.40 -129.40 -228.80 -241.20
(+6.45) (-12.01) (-2.38) (-4.04) (-4.25)
Other items (net) -37549.30 -47116.40 -60579.00 -9567.10 -13462.60 -6798.30 -16231.40 -30313.10
Reserve money 148482.50 193201.30 191504.30 44718.80 -1697.00 26280.80 16741.00 26170.60
(+30.12) (-0.88) (+15.91) (+11.27) (+18.82)
Currency Issued 98153.90 132305.20 124862.70 34151.30 -7442.50 17803.90 8904.90 16005.40
(+34.79) (-5.63) (+16.63) (+9.07) (+17.58)
i) Currency outside banks 87940.80 122074.50 113757.50 34133.70 -8317.00 15011.90 10804.80 15865.80
(+38.81) (-6.81) (+15.20) (+12.29) (+19.14)
ii) Cash in tills 10213.10 10230.70 11105.20 17.60 874.50 2792.00 -1899.90 139.60
(+0.17) (+8.55) (+33.59) (-18.60) (+1.71)
Deposits held with BB 50328.60 60896.10 66641.60 10567.50 5745.50 8476.90 7836.10 10165.20
(+21.00) (+9.43) (+14.57) (+15.57) (+21.18)
Of which: Excess reserves 2323.89 5986.55 6088.75 3662.66 102.20 1658.69 2106.17 3305.15
Money multiplier 5.30 4.74 5.07 -0.56 0.33 -0.14 -0.09 -0.22
Note:- Figures in brackets indicate percentage changes. P=provisional, R= Revised.
Source: Statistics Department.
(Taka in crore)
Changes in outstanding stockOutstanding stock

5
3. CPI and Inflation
The twelve month average general inflation pulled down to
5.39 percent in March 2017 from 5.41 percent of February,
2017. The average food inflation increased to 5.20 percent
while the average non-food inflation decreased to 5.67
percent in March 2017 from February 2017.
The point to point general inflation increased to 5.39
percent in March 2017 from 5.31 percent in February 2017,
as both food and non-food inflation increased. Food
inflation stood at 6.89 percent and non-food inflation stood
at 3.18 percent in March 2017 as compared to 6.84 percent
and 3.07 percent respectively in February 2017.
4.9
5.0
5.2
5.3
5.5
5.6
5.8
5.9
6.1
6.2
6.4
Mar.
16
Ap
r.1
6
May
.16
Jun
.16
Jul.
16
Au
g.1
6
Sep
.16
Oct.
16
No
v.1
6
Dec.1
6
Jan
.17
Feb
.17
Mar.
17
Per
cen
tage
CPI(Base:FY2005-06=100) Inflation
12 month average Point to point
Index Inflation Index Inflation Index Inflation Index Inflation Index Inflation Index Inflation
2010-11 156.59 10.91 170.48 14.11 138.77 6.21 161.38 11.14 175.24 13.84 143.60 7.16
2011-12 170.19 8.69 183.65 7.72 152.94 10.21 170.32 5.54 179.74 2.57 158.25 10.20
2012-13 181.73 6.78 193.24 5.22 166.97 9.17 184.04 8.06 194.58 8.26 170.53 7.76
2013-14 195.08 7.35 209.79 8.57 176.22 5.54 196.86 6.97 210.15 8.00 179.82 5.45
2014-15 207.58 6.41 223.80 6.68 186.79 5.99 209.17 6.25 223.43 6.32 190.88 6.15
July 208.64 6.35 224.88 6.53 187.81 6.08 212.65 6.36 227.80 6.07 193.26 6.80
August 209.68 6.29 225.99 6.39 188.77 6.13 215.03 6.17 231.91 6.06 193.39 6.35
September 210.75 6.24 227.09 6.25 189.80 6.22 218.21 6.24 235.85 5.92 195.59 6.73
October 211.81 6.21 228.19 6.15 190.82 6.30 219.62 6.19 237.44 5.89 196.77 6.67
November 212.86 6.20 229.25 6.09 191.84 6.36 219.38 6.05 236.61 5.72 197.29 6.56
December 213.91 6.19 230.28 6.05 192.94 6.41 220.45 6.10 236.57 5.48 199.78 7.05
January 214.98 6.20 231.09 5.90 194.31 6.65 222.87 6.07 236.42 4.33 205.50 8.74
February 215.96 6.15 231.81 5.70 195.65 6.84 222.58 5.62 235.82 3.77 205.62 8.46
March 216.96 6.10 232.55 5.49 196.97 7.03 223.25 5.65 236.99 3.89 205.64 8.36
April 217.95 6.04 233.28 5.27 198.29 7.21 223.37 5.61 237.15 3.84 205.70 8.34
May 218.89 5.98 233.99 5.07 199.55 7.36 220.15 5.45 231.86 3.81 205.13 7.92
June 219.86 5.92 234.77 4.90 200.74 7.47 220.74 5.53 232.87 4.23 205.19 7.50
July 220.82 5.84 235.60 4.76 201.86 7.48 224.13 5.40 237.69 4.35 206.75 6.98
August 221.78 5.77 236.43 4.62 202.99 7.53 226.57 5.37 241.89 4.30 206.93 7.00
September 222.78 5.71 237.43 4.56 204.00 7.48 230.27 5.53 247.88 5.10 207.69 6.19
October 223.80 5.66 238.53 4.53 204.91 7.38 231.85 5.57 250.64 5.56 207.75 5.58
November 224.78 5.60 239.60 4.51 205.79 7.27 231.18 5.38 249.41 5.41 207.81 5.33
December 225.71 5.51 240.66 4.51 206.54 7.05 231.53 5.03 249.29 5.38 208.76 4.49
January 226.66 5.44 241.94 4.70 207.07 6.57 234.34 5.15 251.86 6.53 211.88 3.10
February 227.65 5.41 243.29 4.95 207.60 6.11 234.40 5.31 251.93 6.84 211.92 3.07
March 228.65 5.39 244.65 5.20 208.14 5.67 235.29 5.39 253.32 6.89 212.18 3.18
Source: Bangladesh Bureau of Statistics, Ministry of Planning.
Consumer Price Index (CPI) and Rate of Inflation at National Level (Base : FY2005-06=100)
2015-16
2016-17
Twelve-Month Average Basis Point to Point Basis
General Food Non-food General Food Non-food

6
4. Liquidity position of the scheduled banks
Total liquid assets of the scheduled banks stood at Taka 262122.85 crore as of end April 2017 which was Taka
262226.74 crore at the end of June 2016. The minimum required liquid assets of the scheduled banks was Taka
160470.34 crore as of end April 2017.
Scheduled banks’ holding of liquid assets as of end April 2017 in the form of cash in tills & balances with Sonali
Bank Ltd., CRR, excess reserves, FC clearing account balances with Bangladesh Bank and un-encumbered approved
securities were 4.64 percent, 22.64 percent, 2.34 percent, 2.07 percent, and 68.30 percent respectively of total liquid
assets.
250
550
850
1150
1450
1750
2050
2350
2650
2950
3250
Apr.
16
May
.16
Jun
.16
Jul.
16
Aug.1
6
Sep
.16
Oct
.16
Nov.1
6
Dec
.16
Jan.1
7
Feb
.17
Mar
.17
Apr.
17
billio
n t
ak
a
Liquid assets & minimum required liquidity
Liquid assets
Minimum Required Liquid Assets
Cash in
tills+balances with
SBL,
4.64%
CRR,
22.64%
Excess Reserve,
2.34%
Balances with BB
(Foreign
Currency),
2.07%
Unencumbered
approved
securities,
68.30%
Sectoral distribution of total liquid assets
(as of end April 2017)
As of end
June, 2016As of end April 2017
P
Foreign
Currency
1 2 3 4b 5 6=(3+4a+4b+5) 7
CRR* Excess Reserve
(un-invested cash)
State-owned Banks 108038.80 1678.45 16387.12 396.99 154.94 89205.67 107823.15 48801.30
Specialised Banks 1539.88 0.00 1670.85 49.78 1.84 0.00 1722.47 1670.85
Private Banks (Other
than Islamic)103584.56 7728.54 27299.60 854.04 1889.39 66149.06 103920.63 81342.29
Islamic Banks 29090.97 2205.10 11462.33 4253.74 528.90 8886.16 27336.23 21161.22
Foreign Banks 19972.54 550.89 2529.16 589.89 2849.94 14800.48 21320.37 7494.69
Total 262226.74 12162.98 59349.06 6144.44 5425.00 179041.37 262122.85 160470.34
(+4.64) (+22.64) (+2.34) (+2.07) (+68.30)
Note :- Figures in brackets indicate sectoral share in the total liquid assets. P=provisional, R= Revised.
1/ Balances with Bangladesh Bank in local currency = CRR + Excess Reserve.
2/ Minimum required liquid assets is the sum of CRR and SLR.
Comment: The data shown on the above table are based on the regulatiry purpose of Bangladesh Bank.
4a
*CRR is calculated @ 6.5% of total demand and time liabilities.
(In crore Taka)
Bank GroupTotal
Liquid Assets
Cash in tills +
balances with
Sonali Bank Ltd.
Balances with
Unencumbered
approved securities
Total
Liquid
Assets
Minimum
Required Liquid
Assets2/
Bangladesh Bank1/
Local Currency
Source : Department of Offsite Supervision.

7
5. Financial sector prices: a) Weighted average yields on bills and bonds
1/:
The weighted average yield on 91-Day Treasury Bills increased to 3.44 percent up to June 18, 2017 as compared to
2.86 percent in April 2017. Yields on 182-Day and 364-Day Treasury Bills up to June 18, 2017 increased to 4.03
percent and 4.32 percent respectively as compared to that of January 2017.
The weighted average yield on 2-Year BGTB increased to 4.90 percent in June 2017 compared to that of January
2017. The weighted average yield on 5-Year, 10-Year, 15-Year and 20-Year BGTB decreased to 5.02 percent, 6.62
percent, 7.15 percent and 7.48 percent respectively in February 2017 compared to that of January 2017.
The weighted average yield on 30-Day BB Bill up to June 18, 2017 decreased marginally to 2.96 percent compared
to the steady rate of 2.97 percent since October 2016 up to May 2017. The weighted average call money rate in the
inter-bank money market increased to 3.87 percent up to June 18, 2017 as compared to 3.81 percent in May 2017.
2.3
2.8
3.3
3.8
4.3
4.8
5.3
5.8
6.3
6.8
Jun.1
6
Jul.
16
Aug.1
6
Sep
.16
Oct
.16
Nov.1
6
Dec
.16
Jan.1
7
Feb
.17
Mar
.17
Apr.
17
May
.17
Jun.1
7
W.a
ve.
yie
ld in
per
cen
t
Yield on Treasury Bills
91-Day 182-Day 364-Day
3.0
3.8
4.5
5.3
6.0
6.8
7.5
Jun
.16
Jul. 1
6
Au
g.1
6
Sep
.16
Oct.
16
No
v.1
6
Dec.1
6
Jan
.17
Feb
.17
Ma
r.1
7
Ap
r.1
7
Ma
y1
7
Jun
.17
(Up
to 1
8)
W. av
era
ge r
ate
in
perc
en
t
Repo, Reverse Repo & Call Money Rate
Repo* Reverse Repo* Call Money Rate
u
BB Bill
91-Day 182-Day 364-Day 2-Year 5-Year 10-Year 15-Year 20-Year 30-Day
2015-16
July 5.33 6.28 6.62 7.62 8.56 9.75 10.03 10.35 5.25 7.25 5.25 5.67
August 5.41 5.91 6.34 7.11 7.57 8.39 8.57 8.93 5.25 7.25 5.25 5.63
September 5.33 5.58 6.15 6.41 7.31 8.18 8.43 8.98 5.25 7.25 5.25 5.71
October 5.17 5.54 5.67 6.41 7.35 7.96 7.83 8.20 5.01R 7.25 5.25 5.63
November 2.95 3.74 4.06 4.19 5.08 6.55 8.09 8.47 4.03 7.25 5.25 3.85
December 2.94 3.32 4.11 4.86 5.04 7.23 7.87 8.97 3.38 7.25 5.25 3.69
January 2.81 4.10 4.36 5.81 6.44 7.38 7.44 7.64 2.90 6.75 4.75 3.90
February 2.69 ---- ---- 4.79 5.89 5.95 7.18 7.58 2.88 6.75 4.75 3.73
March 2.87 ---- 4.32 4.97 5.92 6.64 7.57 7.97 2.90 6.75 4.75 3.68
April 3.46 4.51 4.93 5.25 6.16 6.91 7.79 8.19 2.95 6.75 4.75 3.68
May 3.55 4.45 5.04 5.52 6.21 7.02 7.84 8.28 2.96 6.75 4.75 3.67
June 3.96 4.67 5.17 5.97 6.51 7.29 7.97 8.41 2.96 6.75 4.75 3.70
2016-17
July 4.72 5.31 5.88 6.50 7.05 7.46 7.97 8.44 2.93 6.75 4.75 3.68
August 3.48 ---- ---- 5.99 6.53 7.10 7.80 8.24 2.96 6.75 4.75 3.65
September 3.26 3.99 4.25 5.31 ---- ---- 7.69 8.17 2.96 6.75 4.75 3.64
October 3.12 3.35 4.00 5.19 6.00 6.89 7.53 7.99 2.97 6.75 4.75 3.52
November 2.99 ---- ---- 4.39 5.72 6.77 7.46 7.91 2.97 6.75 4.75 3.56
December 2.98 3.23 3.76 ---- 5.91 6.32 7.64 7.89 2.97 6.75 4.75 3.62
January 2.97 3.14 3.53 4.23 5.79 6.65 7.47 7.78 2.97 6.75 4.75 3.54
February 2.90 ---- ---- ---- 5.02 6.62 7.15 7.48 2.97 6.75 4.75 3.50
March ---- ---- ---- ---- ---- ---- ---- ---- 2.97 6.75 4.75 3.66
April 2.86 ---- ---- ---- ---- ---- ---- ---- 2.97 6.75 4.75 3.76
May ---- ---- ---- ---- ---- ---- ---- ---- 2.97 6.75 4.75 3.81
June@
3.44 4.03 4.32 4.90 ---- ---- ---- ---- 2.96 6.75 4.75 3.87
Source: MPD, DMD Bangladesh Bank . 1/ Weighted average rate. ---- = there was no auction. @ = upto 18th
June, 2017.
* The Repo and Reverse Repo rates are re-fixed at 6.75% and 4.75% respectively, with effect from 14.01.2016.
Call
Money
Rate
Treasury Bills BGTB
Repo*Reverse
Repo*

8
b) Interest rate spread:
The spread between the weighted average interest rate on advances and deposits of all banks narrowed in April 2017 as
compared to March 2017 and stood at 4.65 percent. The spread of NBFIs also narrowed in April 2017 compared to
March 2017 and stood at 3.63 percent. The weighted average interest rate on deposits of banks continued on a
decreasing trend and stood at 4.97 percent in April 2017. On the other hand, the weighted average deposit rate of
NBFIs increased marginally in April 2017 compared to March 2017 and stood at 8.35 percent.
The spread for SME sector remained the same, while the spreads for other sectors narrowed in April 2017 compared to
those of March 2017.
3.4
3.6
3.8
4.0
4.2
4.4
4.6
4.8
5.0
5.2
Ap
r. 1
6
May
. 1
6
Jun
. 1
6
Jul.
16
Au
g 1
6
Sep
. 1
6
Oct.
16
No
v. 1
6
Dec. 1
6
Jan
. 1
7
Feb
. 1
7
Mar.
17
Ap
r. 1
7
W. A
ve.
rate
in
perc
en
t
Institution wise breakdown of interest rate spread
NBFIs Banks
2.7
3.2
3.7
4.2
4.7
5.2
5.7
6.2
6.7
7.2
Apr.
16
May
. 1
6
Jun
. 1
6
Jul.
16
Au
g 1
6
Sep
. 1
6
Oct
. 1
6
Nov. 16
Dec
. 1
6
Jan. 17
Feb
. 1
7
Mar
. 17
Ap
r. 1
7
W. A
ve.
rate
in
perc
en
t
Sector-wise breakdown of interest rate spread
SME Agriculture Large Industries Services
Interest rate
on deposits
Interest
rate on
advances
Spread
Interest
rate on
advances
Spread
Interest
rate on
advances
Spread
Interest
rate on
advances
Spread
Interest
rate on
advances
Spread
Interest
rate on
advances
Spread
Interest
rate on
deposits
Interest
rate on
advances
Spread
2015-16
July 6.78 11.57 4.79 12.67 5.89 11.27 4.49 9.81 3.03 11.37 4.59 11.97 5.19 10.54 14.70 4.16
August 6.74 11.51 4.77 12.58 5.84 11.22 4.48 9.73 2.99 11.31 4.57 11.96 5.22 10.41 14.52 4.11
September 6.66 11.48 4.82 12.49 5.83 11.20 4.54 9.77 3.11 11.11 4.45 11.36 4.70 10.34 14.45 4.11
October 6.58 11.35 4.77 12.45 5.87 11.04 4.46 9.71 3.13 10.94 4.36 11.50 4.92 10.16 14.32 4.16
November 6.46 11.27 4.81 12.23 5.77 10.98 4.52 9.66 3.20 10.91 4.45 11.44 4.98 10.02 14.16 4.14
December 6.34 11.18 4.84 12.33 5.99 10.86 4.52 9.63 3.29 10.78 4.44 11.10 4.76 9.87 14.03 4.16
January 6.21 11.05 4.84 12.36 6.15 10.49 4.28 9.56 3.35 10.55 4.34 11.04 4.83 9.72 13.90 4.18
February 6.10 10.91 4.81 12.02 5.92 10.39 4.29 9.58 3.48 10.41 4.31 10.92 4.82 9.55 13.72 4.17
March 5.92 10.78 4.86 11.74 5.82 10.51 4.59 9.59 3.67 10.19 4.27 10.80 4.88 9.34 13.51 4.17
April 5.77 10.64 4.87 11.64 5.87 10.36 4.59 9.54 3.77 10.24 4.47 10.80 5.03 9.16 13.27 4.11
May 5.67 10.57 4.90 11.57 5.90 10.29 4.62 9.49 3.82 9.88 4.21 10.52 4.85 9.01 13.16 4.15
June 5.54 10.39 4.85 11.48 5.94 10.08 4.54 9.50 3.96 9.80 4.26 10.39 4.85 8.95 13.07 4.12
2016-17
July 5.48 10.32 4.84 11.35 5.87 10.03 4.55 9.43 3.95 9.77 4.29 10.32 4.84 8.90 12.89 3.99
August 5.44 10.24 4.80 11.21 5.77 9.97 4.53 9.61 4.17 9.75 4.31 10.29 4.85 8.84 12.80 3.96
September 5.39 10.11 4.72 11.04 5.65 9.90 4.51 9.70 4.31 9.62 4.23 10.07 4.68 8.71 12.68 3.97
October 5.33 10.03 4.70 10.90 5.57 9.79 4.46 9.57 4.24 9.46 4.13 10.02 4.69 8.61 12.73 4.12
November 5.29 9.94 4.65 10.86 5.57 9.68 4.39 9.34 4.05 9.33 4.04 10.03 4.74 8.53 12.35 3.82
December 5.22 9.93 4.71 10.79 5.57 9.68 4.46 9.31 4.09 9.32 4.10 9.95 4.73 8.47 12.32 3.85
January 5.13 9.85 4.72 10.67 5.54 9.61 4.48 9.37 4.24 9.25 4.12 9.90 4.77 8.42 12.26 3.84
February 5.08 9.77 4.69 10.66 5.58 9.51 4.43 9.34 4.26 9.17 4.09 9.82 4.74 8.38 12.19 3.81
March 5.01 9.70 4.69 10.60 5.59 9.44 4.43 9.35 4.34 9.09 4.08 9.65 4.64 8.34 12.07 3.73
April 4.97 9.62 4.65 10.56 5.59 9.35 4.38 9.29 4.32 9.02 4.05 9.55 4.58 8.35 11.98 3.63
Source: Statistics Department, Bangladesh Bank .
Non-Bank FIsAll other sectors
(excluding SME)Agriculture Large Industries ServicesSME
Sector-wise break down of Interest Rate Spread in the banks
All Banks

9
6. Capital market developments:
The DSE Broad Index (DSEX) at the end of April
2017 stood significantly lower at 5475.55
compared to that of end March 2017. The total
market capitalization of all shares and debentures
of the listed securities at the end of April 2017 also
stood lower at Taka 371092.80 crore from Taka
379830.60 crore at the end of March 2017.
3000
3250
3500
3750
4000
4250
4500
4750
5000
5250
5500
5750
2000
2200
2400
2600
2800
3000
3200
3400
3600
3800
4000
Ap
r.1
6
Ma
y.1
6
Jun
.16
Jul.1
6
Au
g.1
6
Sep
.16
Oct.
16
No
v.1
6
Dec.1
6
Jan
.17
Feb
.17
Ma
r.1
7
Ap
r.1
7
Trends in market capitalisation and indices of DSE
Capitalisation in billion taka (LHS)
DSEX (RHS)
General Index /
Calender Issued Capital Market Turnover during DSE
Year and Debentures Capitalisation the Year Broad Index
2010 445 66436.00 347250.20 400991.28 8290.41
2011 501 87890.50 261673.00 156055.63 5257.61
2012 515 94987.60 240356.00 100108.49 4219.31
2013 529 99978.50 264779.00 95269.21 4266.55
2014 546 105492.60 325925.00 118852.15 4864.96
2015 559 110608.10 315976.00 103139.86 4629.64
DSE
End MonthIssued capital Market Turnover during
Broad Index
and debentures capitalisation the month (DSEX)
January,16 562 110860.70 315307.00 11349.63 4540.89
February,16 562 110982.70 314350.00 8642.15 4511.97
March,16 560 111163.60 303642.00 7997.27 4357.54
April,16 558 111557.40 299985.00 7504.74 4195.70
May,16 558 112116.00 310875.00 8142.22 4419.39
June,16 559 112741.00 318574.93 8138.30 4507.58
July,16 559 113000.40 320736.90 6573.62 4525.35
August,16 558 113039.20 319256.00 9629.30 4526.58
September,16 559 113138.80 328190.90 8689.38 4695.19
October,16 559 113449.00 323633.80 10560.50 4592.18
November,16 559 113900.40 332881.40 14149.83 4801.24
December,16 560 114530.00 341244.10 17780.21 5036.05
Janaury,17 560 114693.00 366811.50 34232.02 5468.34
February,17 562 114910.10 373930.40 19404.84 5612.70
March,17 562 115255.20 379830.60 21770.14 5719.61
April,17 562 115607.00 371092.80 15317.78 5475.55
Source : Dhaka Stock Exchange
Annual capital market developments (DSE)
Monthly capital market developments (DSE)
Enlisted issues
(Incl. Mutual
Funds/Deb.)
(Taka in crore )
Enlisted issues
(Incl. Mutual
Funds/Deb.)
(Taka in crore)

10
7. Agricultural credit and non-farm rural credit
The disbursement of agricultural credit and non-farm rural credit increased by 21.80 percent and 24.66 percent
respectively during July-April, 2016-17 compared to that of July-April, 2015-16. The banks disbursed a total of Taka
172.44 billion to both the sectors. The recovery from the agriculture sector increased by 12.16 percent, while from
non-farm rural credit decreased by 6.30 percent during July-April 2016-17 compared to the same period of the
preceding year.
The position of overdue agricultural credit as percentage of total outstanding improved as it has decreased from 17.96
percent at the end of April 2016 to 16.75 percent at the end of April 2017.
(Taka in crore)
Overdue as % Overdue as %
of outstanding of outstanding
6223.37 37148.24 16.75 5828.78 32452.19 17.96
(+6.77) (+14.47) (-27.10) (+5.38)
Source: Agricultural Credit Department.
April
End Month
2016-17P
2015-16R
Overdue Outstanding Overdue Outstanding
Overdue and outstanding credit in agricultural sector
300
600
900
1200
1500
1800
2100
2400
2700
3000
3300
3600
Jul.
Au
g.
Sep
.
Oct.
No
v.
Dec.
Jan
.
Feb
.
Ma
r.
Ap
r.
Ma
y
Jun
.
In c
rore
tak
a
Agricultural credit disbursement
2015-16 2016-17
30
50
70
90
110
130
150
170
190
210
230
250
270
Jul.
Au
g.
Sep
.
Oct.
No
v.
Dec.
Jan
.
Feb
.
Ma
r.
Ap
r.
Ma
y
Jun
.
In c
rore
ta
ka
Non-farm rural credit disbursement
2015-16 2016-17
a. Agricultural credit (Taka in crore) b. Non-farm rural credit (Taka in crore)
Disbursement Recovery Disbursement Recovery Disbursement Recovery Disbursement Recovery
July 945.31 893.78 770.17 711.63 July 110.69 51.87 86.74 78.70
August 933.15 1083.93 850.00 886.91 August 73.48 105.92 107.43 112.53
September 1238.48 1228.38 1242.68 1205.65 September 142.74 178.51 147.22 122.25
October 1644.19 1475.02 1261.23 1242.04 October 184.67 109.42 165.82 137.92
November 2133.42 1718.80 780.97 835.62 November 164.94 123.79 122.72 163.41
December 2114.37 1787.99 3099.32 2740.63 December 247.61 233.90 121.69 184.06
January 2013.73 1655.57 1192.92 1057.60 January 211.93 168.17 130.54 115.29
February 1574.79 1349.69 1143.76 1022.09 February 195.95 151.45 153.21 139.12
March 1723.59 1573.66 1327.57 1726.36 March 157.38 75.11 109.32 161.62
April 1334.10 1267.40 1184.46 1084.06 April 100.17 110.94 130.38 182.14
15655.13 14034.23 12853.09 12512.59 1589.56 1309.07 1275.06 1397.04
(+21.80) (+12.16) (+13.67) (+7.44) (+24.66) (-6.30) (+16.79) (+22.61)
Month2016-17
P2015-16
R
Month2016-17
P2015-16
R
July-April July-April
Programmed level for disbursement of agricultural credit and non-farm rural credit was Tk.17550.00 crore for FY17.
11
The revised target for disbursement
of SME loans during January-
December, 2016 is Taka 113503.43
crore.
8. Industrial and SME loans
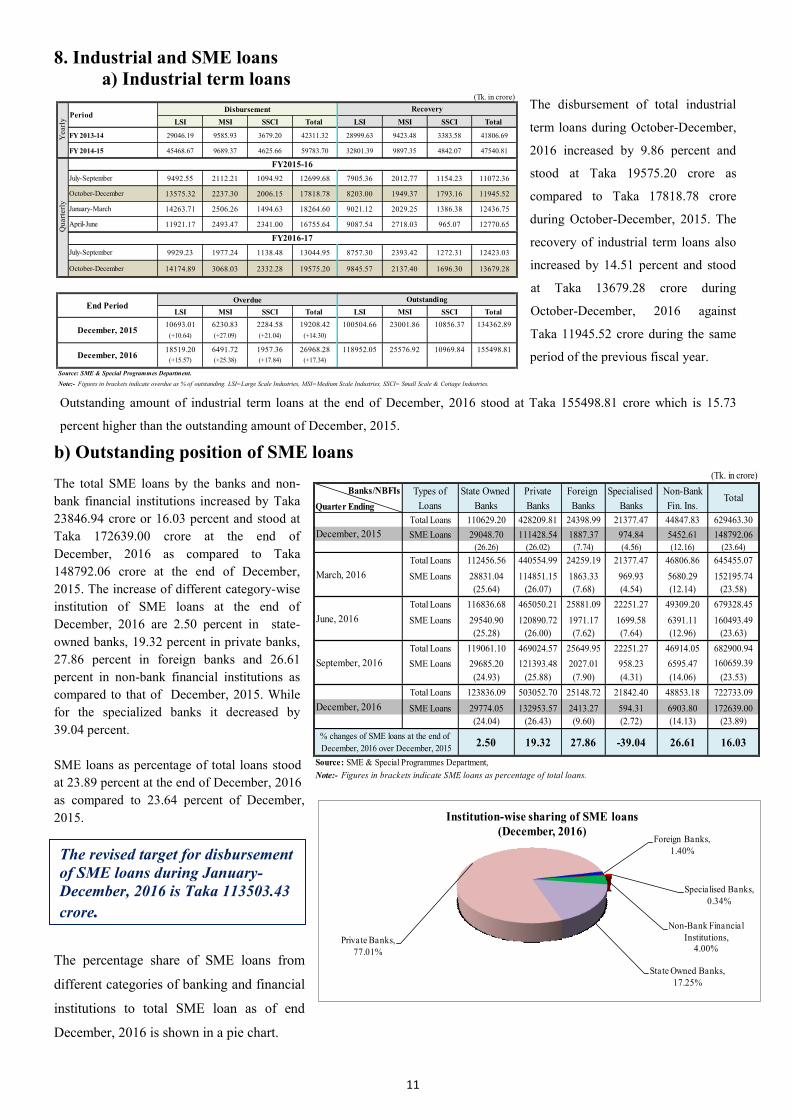
a) Industrial term loans
The disbursement of total industrial
term loans during October-December,
2016 increased by 9.86 percent and
stood at Taka 19575.20 crore as
compared to Taka 17818.78 crore
during October-December, 2015. The
recovery of industrial term loans also
increased by 14.51 percent and stood
at Taka 13679.28 crore during
October-December, 2016 against
Taka 11945.52 crore during the same
period of the previous fiscal year.
Outstanding amount of industrial term loans at the end of December, 2016 stood at Taka 155498.81 crore which is 15.73
percent higher than the outstanding amount of December, 2015.
b) Outstanding position of SME loans
The total SME loans by the banks and non-
bank financial institutions increased by Taka
23846.94 crore or 16.03 percent and stood at
Taka 172639.00 crore at the end of
December, 2016 as compared to Taka
148792.06 crore at the end of December,
2015. The increase of different category-wise
institution of SME loans at the end of
December, 2016 are 2.50 percent in state-
owned banks, 19.32 percent in private banks,
27.86 percent in foreign banks and 26.61
percent in non-bank financial institutions as
compared to that of December, 2015. While
for the specialized banks it decreased by
39.04 percent.
SME loans as percentage of total loans stood
at 23.89 percent at the end of December, 2016
as compared to 23.64 percent of December,
2015.
The percentage share of SME loans from
different categories of banking and financial
institutions to total SME loan as of end
December, 2016 is shown in a pie chart.
(Tk. in crore)
Disbursement
LSI MSI SSCI Total LSI MSI SSCI Total
FY 2013-14 29046.19 9585.93 3679.20 42311.32 28999.63 9423.48 3383.58 41806.69
FY 2014-15 45468.67 9689.37 4625.66 59783.70 32801.39 9897.35 4842.07 47540.81
9492.55 2112.21 1094.92 12699.68 7905.36 2012.77 1154.23 11072.36
13575.32 2237.30 2006.15 17818.78 8203.00 1949.37 1793.16 11945.52
14263.71 2506.26 1494.63 18264.60 9021.12 2029.25 1386.38 12436.75
11921.17 2493.47 2341.00 16755.64 9087.54 2718.03 965.07 12770.65
9929.23 1977.24 1138.48 13044.95 8757.30 2393.42 1272.31 12423.03
14174.89 3068.03 2332.28 19575.20 9845.57 2137.40 1696.30 13679.28
Overdue
LSI MSI SSCI Total LSI MSI SSCI Total
10693.01 6230.83 2284.58 19208.42 100504.66 23001.86 10856.37 134362.89
(+10.64) (+27.09) (+21.04) (+14.30) #REF!
18519.20 6491.72 1957.36 26968.28 118952.05 25576.92 10969.84 155498.81
(+15.57) (+25.38) (+17.84) (+17.34) #REF!
Note:- Figures in brackets indicate overdue as % of outstanding. LSI=Large Scale Industries, MSI=Medium Scale Industries, SSCI= Small Scale & Cottage Industries.
Yearl
y
July-September
FY2015-16
PeriodRecovery
April-June
FY2016-17
July-September
October-December
Source: SME & Special Programmes Department.
October-December
January-March
OutstandingEnd Period
December, 2016
December, 2015
Qu
art
erl
y
(Tk. in crore)
Types of State Owned Private Foreign Specialised Non-Bank
Loans Banks Banks Banks Banks Fin. Ins.
Total Loans 110629.20 428209.81 24398.99 21377.47 44847.83 629463.30
SME Loans 29048.70 111428.54 1887.37 974.84 5452.61 148792.06
(26.26) (26.02) (7.74) (4.56) (12.16) (23.64)
Total Loans 112456.56 440554.99 24259.19 21377.47 46806.86 645455.07
SME Loans 28831.04 114851.15 1863.33 969.93 5680.29 152195.74
(25.64) (26.07) (7.68) (4.54) (12.14) (23.58)
Total Loans 116836.68 465050.21 25881.09 22251.27 49309.20 679328.45
SME Loans 29540.90 120890.72 1971.17 1699.58 6391.11 160493.49
(25.28) (26.00) (7.62) (7.64) (12.96) (23.63)
Total Loans 119061.10 469024.57 25649.95 22251.27 46914.05 682900.94
SME Loans 29685.20 121393.48 2027.01 958.23 6595.47 160659.39
(24.93) (25.88) (7.90) (4.31) (14.06) (23.53)
Total Loans 123836.09 503052.70 25148.72 21842.40 48853.18 722733.09
SME Loans 29774.05 132953.57 2413.27 594.31 6903.80 172639.00
(24.04) (26.43) (9.60) (2.72) (14.13) (23.89)
2.50 19.32 27.86 -39.04 26.61 16.03
Note:- Figures in brackets indicate SME loans as percentage of total loans.
September, 2016
December, 2016
% changes of SME loans at the end of
December, 2016 over December, 2015
Source: SME & Special Programmes Department,
Banks/NBFIsTotal
Quarter Ending
December, 2015
March, 2016
June, 2016
State Owned Banks,
17.25%
Private Banks,
77.01%
Foreign Banks,
1.40%
Specialised Banks,
0.34%
Non-Bank Financial
Institutions,
4.00%
Institution-wise sharing of SME loans
(December, 2016)
12
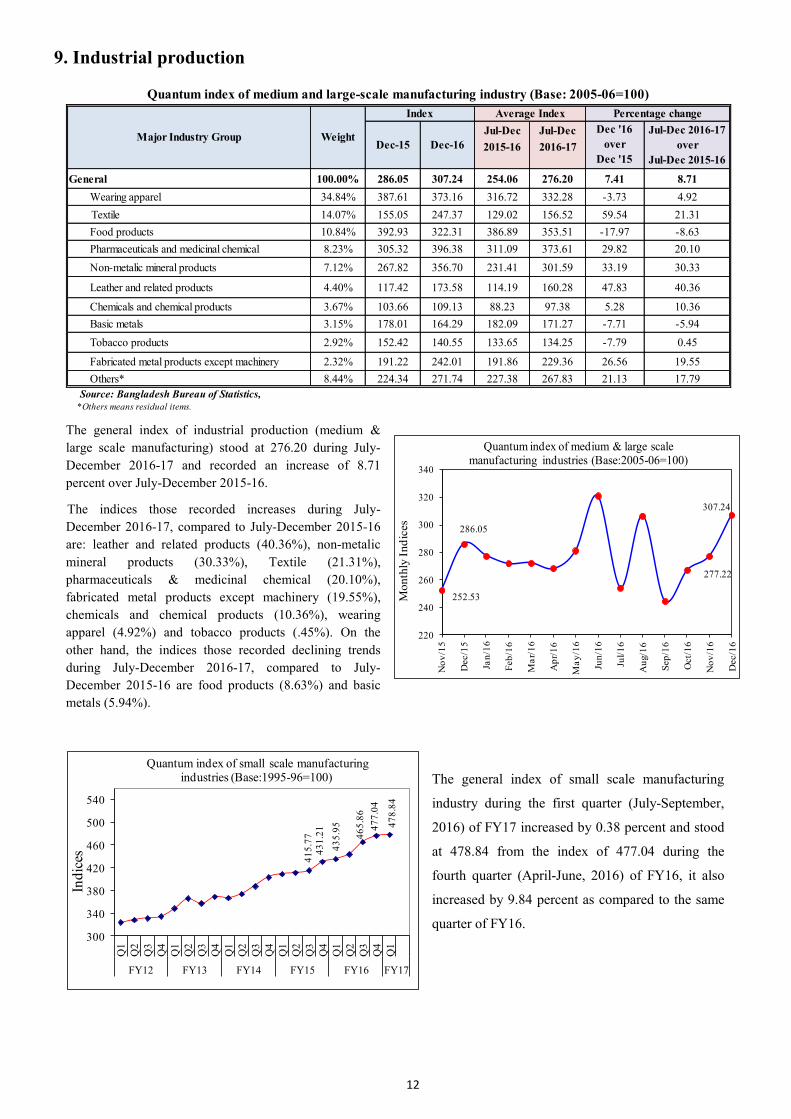
9. Industrial production
The general index of industrial production (medium &
large scale manufacturing) stood at 276.20 during July-
December 2016-17 and recorded an increase of 8.71
percent over July-December 2015-16.
The indices those recorded increases during July-
December 2016-17, compared to July-December 2015-16
are: leather and related products (40.36%), non-metalic
mineral products (30.33%), Textile (21.31%),
pharmaceuticals & medicinal chemical (20.10%),
fabricated metal products except machinery (19.55%),
chemicals and chemical products (10.36%), wearing
apparel (4.92%) and tobacco products (.45%). On the
other hand, the indices those recorded declining trends
during July-December 2016-17, compared to July-
December 2015-16 are food products (8.63%) and basic
metals (5.94%).
The general index of small scale manufacturing
industry during the first quarter (July-September,
2016) of FY17 increased by 0.38 percent and stood
at 478.84 from the index of 477.04 during the
fourth quarter (April-June, 2016) of FY16, it also
increased by 9.84 percent as compared to the same
quarter of FY16.
41
5.7
7
43
1.2
1
43
5.9
5
46
5.8
6
47
7.0
4
47
8.8
4
300
340
380
420
460
500
540
Q1
Q2
Q3
Q4
Q1
Q2
Q3
Q4
Q1
Q2
Q3
Q4
Q1
Q2
Q3
Q4
Q1
Q2
Q3
Q4
Q1
FY12 FY13 FY14 FY15 FY16 FY17
Ind
ices
Quantum index of small scale manufacturing industries (Base:1995-96=100)
252.53
286.05
277.22
307.24
220
240
260
280
300
320
340
No
v/1
5
Dec/1
5
Jan
/16
Feb
/16
Ma
r/1
6
Ap
r/1
6
Ma
y/1
6
Jun
/16
Jul/
16
Au
g/1
6
Sep
/16
Oct/
16
No
v/1
6
Dec/1
6
Month
ly I
nd
ices
Quantum index of medium & large scale manufacturing industries (Base:2005-06=100)
Jul-Dec Jul-Dec
2015-16 2016-17
General 100.00% 286.05 307.24 254.06 276.20 7.41 8.71
Wearing apparel 34.84% 387.61 373.16 316.72 332.28 -3.73 4.92
Textile 14.07% 155.05 247.37 129.02 156.52 59.54 21.31
Food products 10.84% 392.93 322.31 386.89 353.51 -17.97 -8.63
Pharmaceuticals and medicinal chemical 8.23% 305.32 396.38 311.09 373.61 29.82 20.10
Non-metalic mineral products 7.12% 267.82 356.70 231.41 301.59 33.19 30.33
Leather and related products 4.40% 117.42 173.58 114.19 160.28 47.83 40.36
Chemicals and chemical products 3.67% 103.66 109.13 88.23 97.38 5.28 10.36
Basic metals 3.15% 178.01 164.29 182.09 171.27 -7.71 -5.94
Tobacco products 2.92% 152.42 140.55 133.65 134.25 -7.79 0.45
Fabricated metal products except machinery 2.32% 191.22 242.01 191.86 229.36 26.56 19.55
Others* 8.44% 224.34 271.74 227.38 267.83 21.13 17.79
Source: Bangladesh Bureau of Statistics,
*Others means residual items.
Quantum index of medium and large-scale manufacturing industry (Base: 2005-06=100)
Major Industry Group Weight
Index Average Index Percentage change
Dec-15 Dec-16
Dec '16
over
Dec '15
Jul-Dec 2016-17
over
Jul-Dec 2015-16
13
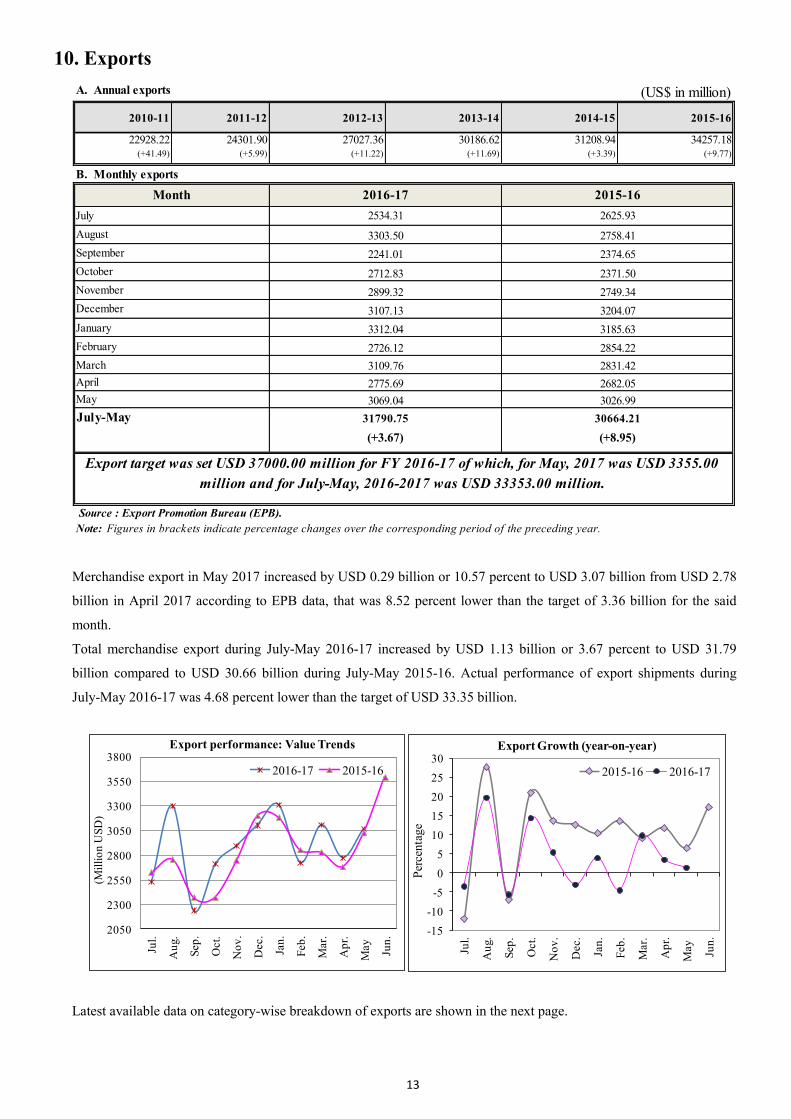
10. Exports
Merchandise export in May 2017 increased by USD 0.29 billion or 10.57 percent to USD 3.07 billion from USD 2.78
billion in April 2017 according to EPB data, that was 8.52 percent lower than the target of 3.36 billion for the said
month.
Total merchandise export during July-May 2016-17 increased by USD 1.13 billion or 3.67 percent to USD 31.79
billion compared to USD 30.66 billion during July-May 2015-16. Actual performance of export shipments during
July-May 2016-17 was 4.68 percent lower than the target of USD 33.35 billion.
Latest available data on category-wise breakdown of exports are shown in the next page.
2050
2300
2550
2800
3050
3300
3550
3800
Jul.
Au
g.
Sep
.
Oct.
No
v.
Dec.
Jan
.
Feb
.
Mar.
Ap
r.
May
Jun
.
(Mil
lio
n U
SD
)
Export performance: Value Trends
2016-17 2015-16
-15
-10
-5
0
5
10
15
20
25
30
Jul.
Au
g.
Sep
.
Oct.
No
v.
Dec.
Jan
.
Feb
.
Mar.
Ap
r.
May
Jun
.
Per
centa
ge
Export Growth (year-on-year)
2015-16 2016-17
A. Annual exports (US$ in million)
2010-11 2011-12 2012-13 2013-14 2014-15 2015-16
22928.22 24301.90 27027.36 30186.62 31208.94 34257.18(+41.49) (+5.99) (+11.22) (+11.69) (+3.39) (+9.77)
B. Monthly exports
January
February
March
July-May
3185.63
2016-17 2015-16
2534.31 2625.93
(+3.67) (+8.95)
31790.75 30664.21
Source : Export Promotion Bureau (EPB). P=Provisional; R=Revised.
Note: Figures in brackets indicate percentage changes over the corresponding period of the preceding year.
2749.342899.32
September
3303.50 2758.41
Export target was set USD 37000.00 million for FY 2016-17 of which, for May, 2017 was USD 3355.00
million and for July-May, 2016-2017 was USD 33353.00 million.
April 2775.69 2682.05
2726.12 2854.22
3109.76 2831.42
May 3069.04 3026.99
2712.83 2371.50
3312.04
2374.65
3204.073107.13
October
November
2241.01
December
July
August
Month

14
C. Category-wise breakdown of exports
Category-wise breakdown of exports shows that, during July-May, 2016-17 exports of tea (169.81%),
engineering products (including electric goods) (36.34%), chemical products (15.97%), jute goods (10.21%), raw
jute (8.14%) and knitwear (4.91%) experienced a positive growth compared to that of the same period of the
previous year. On the other hand, agricultural products (24.74%), Leather (10.31%), frozen & live fish (1.89%)
and woven garments (0.33%) experienced a negative growth during July-May, 2016-17 compared to the same
period of the previous year.
Woven
garments,
41.27%
Knitwear,
39.34%
Frozen and
Live fish,
1.49%
Jute goods
(excl.carpet),
2.33% Others,
15.58%
Category-wise share of total exports
(July-May, 2016-17)
Woven
garments,
42.93%
Knitwear,
38.87%
Frozen and
Live fish,
1.57%
Jute goods
(excl.carpet),
2.19%Others,
14.43%
Category-wise share of total exports
(July-May, 2015-16)
(US$ In million )
Particulars
In amount In percent
1. Raw Jute 162.01 149.82 +12.19 +8.14
2. Jute goods (excl.carpet) 741.68 672.95 +68.73 +10.21
3. Tea 4.29 1.59 +2.70 +169.81
4. Frozen and Live fish 472.85 481.96 -9.11 -1.89
5. Leather 224.86 250.71 -25.85 -10.31
6. Woven garments 13119.83 13163.42 -43.59 -0.33
7. Knitwear 12504.94 11920.20 +584.74 +4.91
8. Chemical products 128.22 110.56 +17.66 +15.97
9. Agricultural products* 122.48 162.74 -40.26 -24.74
10. Engineering products 660.36 484.34 +176.02 +36.34
11. Others** 3649.23 3265.92 +383.31 +11.74
TOTAL 31790.75 30664.21 +1126.54 +3.67
Source : Export Promotion Bureau (EPB).
Note:- * = Includes vegetables, fruits & tobacco, **Others = residual items.
FY17
(Up to May'17)
FY16
(Up to May'16)
Changes during FY17 over FY16

15
11. Imports
a) Custom based import, import LCs settlement and LCs opening
Custom based import during July-April 2016-17 stood
higher by USD 4.11 billion or 11.74 percent and stood
at USD 39.15 billion against USD 35.04 billion during
July-April 2015-16.
Settlement of import LCs during July-April 2016-17
increased by 11.98 percent and stood at USD 37.37
billion against USD 33.38 billion during July-April
2015-16.
Fresh opening of import LCs during July-April,
2016-17 increased by 13.83 percent and stood at USD
39.97 billion compared to USD 35.11 billion during
July-April 2015-16.
-30
-20
-10
0
10
20
30
40
Jul.
Au
g.
Sep
.
Oct.
No
v.
Dec.
Jan
.
Feb
.
Mar.
Ap
r.
May
Jun
.
Perc
en
tage
Growth of import
(year-on-year)
2015-16 2016-17
2013-14 2012-13 2013-14 2012-13 2013-14 2012-13
40616.40 37289.80 37188.84 32358.52 41818.56 35961.05
(+8.92) (+0.82) (+14.93) (-7.05) (+16.29) (-2.90)
Month 2015-16R 2014-15 2015-16 2014-15 2015-16 2014-15
July 2856.80 2556.10 3437.71 2964.69 3011.64 3655.65
August 3415.70 3458.80 3502.55 3461.55 3631.73 3475.02
September 3197.20 3733.00 2985.45 3369.85 3135.37 3704.30
October 3866.90 3304.00 3268.85 3145.15 3232.57 3142.60
November 3664.60 3059.20 3407.74 3259.60 4468.22 3760.76
December 3898.30 3444.80 3701.52 3390.64 3585.21 3547.28
January 3591.50 3268.80 3351.55 3037.47 3387.16 3501.47
February 3353.00 3202.00 3200.16 2807.87 3125.36 3257.30
March 3654.00 3404.10 3365.75 3351.97 3988.72 4262.45
April 3541.80 3835.50 3154.28 3179.16 3546.88 3518.94
May 4241.80 3899.20 3285.88 3205.56 3599.03 3682.60
June 3816.00 3538.20 3414.76 3281.73 4623.44 3560.39
July-June 43097.60 40703.70 40076.20 38455.24 43335.33 43068.76
(+5.88) (+0.21) (+4.22) (+3.41) (+0.62) (+2.99)
Month 2016-17P
2015-16R
2016-17P 2015-16 2016-17
P 2015-16
July 2941.50 2856.80 2804.36 3437.71 3097.80 3011.64
August 3796.60 3415.70 4353.94 3502.55 4203.03 3631.73
September 3531.30 3197.20 4451.61 2985.45 3471.54 3135.37
October 4124.70 3866.90 3530.65 3268.84 4119.23 3232.57
November 4221.60 3664.60 3882.78 3407.74 3801.95 4468.22
December 3994.10 3898.30 3565.46 3701.53 4329.31 3585.21
January 4301.70 3591.50 3962.34 3351.55 4441.16 3387.16
February 3760.90 3353.00 3294.45 3200.16 3775.34 3125.36
March 4311.20 3654.00 3790.07 3365.75 4430.74 3988.72
April 4170.50 3541.80 3738.15 3154.28 4297.71 3546.88
July-April 39154.10 35039.80 37373.82 33375.56 39967.79 35112.86
(+11.74) (+5.33) (+11.98) (+4.40) (+13.83) (-1.99)
P = Provisional. R=
Revised.
Month
R = Data has been revised upto March 2016 as per rivision by NBR.
Note:- 1. Figures in brackets indicate percentage changes over the corresponding period of the preceding year .
Source: National Board of Revenue (NBR), Foreign Exchange Operations Department of Bangladesh Bank , NA=Not Available.
(US$ in million)
Custom based import (c&f) Import LCs settlement Import LCs opening

16
b) Sector-wise fresh opening, settlement and outstanding of import LCs
Sector-wise comparative statistics of fresh opening, settlement and outstanding of import LCs during
July-April, 2016-17 and July-April, 2015-16 are shown below:
The developments of sectoral share in total LCs opening during July-April, 2016-17 and July-April, 2015-16 are
showing in the following pie charts.
Sector-wise detailed statistics of fresh opening, settlement and outstanding of import LCs during July-April, 2016-
17 and July-April, 2015-16 are given as Appendix.
C) Projected data on opening of import LCs and probable liabilities against back to back LCs of
authorised dealer banks
Data on projection of opening of import LCs and probable liabilities against back to back LCs sent by the
authorised dealer banks are USD 11.65 billion and USD 4.41 billion respectively during June-August, 2017. The
said liability is 13.47 percent of foreign exchange reserves as on June 15, 2017.
(US$ in million)
A. Consumer goods 5009.96 4209.97 3962.46 3832.24 1678.24 26.44 9.86 26.39
B. Intermediate goods 3389.77 3163.35 3095.14 2752.75 1728.53 9.52 14.92 -3.68
C. Industrial raw materials 14751.13 13598.36 13859.85 13135.87 7583.36 6.43 3.52 -16.18
D. Capital machinery 4314.59 4199.17 3626.47 2835.40 5621.82 18.97 48.10 1.72
E. Machinery for misc. inds. 4069.32 3848.78 3439.65 3551.98 1928.23 18.31 8.36 -3.40
F. Petroleum & petro.prodts. 2153.64 2125.67 1763.29 2094.47 694.20 22.14 1.49 -24.02
G. Others 6279.39 6228.51 5366.00 5172.87 3590.13 17.02 20.41 -4.36
Total 39967.79 37373.82 35112.86 33375.56 22824.51 13.83 11.98 -4.99
of which back to back 6596.52 5944.98 6304.18 5780.56 3301.09 4.64 2.84 -18.18
Source: Foreign Exchange Operations Department, Bangladesh Bank. P=Provisional.
Settlement of
LCs
Fresh
opening of
LCs
Fresh
opening of
LCs
Fresh
opening of
LCs
Settlement of
LCs
Settlement of
LCs
July-April, 2015-16
Sectors /
CommoditiesOutstanding
LCs at the
end period
Outstanding
LCs at the end
period
Percentage changes during July-April, 2016-17
over July-April, 2015-16
Outstanding
LCs at the
end period
July-April, 2016-17 P
527.43
3433.46
21684.84
2700.88
1862.71
2121.06
1664.93
6356.52
5718.75
Consumer
goods,
12.53%Intermediate
goods,
8.48%
Industrial raw
materials,
36.91%
Capital
machinery,
10.80%
Machinery for
misc. industry,
10.18%
Petroleum &
petro.products ,
5.39%
Others ,
15.71%
Sectoral sharing in LC Opening
(July-April, 2016-17)
Consumer
goods,
11.28% Intermediate
goods,
8.81%
Industrial raw
materials,
39.47%
Capital
machinery,
10.33%
Machinery for
misc. industry,
9.80%
Petroleum &
petro.products ,
5.02%
Others ,
15.28%
Sectoral sharing in LC Opening
(July-April, 2015-16)
(In million USD)
11652.08 4413.39
Aug'17
Probable liabilities of banks against back to back LCsMonth Opening of import LCs
3847.98 1478.18June'17
3921.09 1479.60
Source: All authorized dealer banks, compiled by Monetary Policy Department (MPD), Bangladesh Bank.
July'17
3883.01 1455.61
June-August, 2017
17
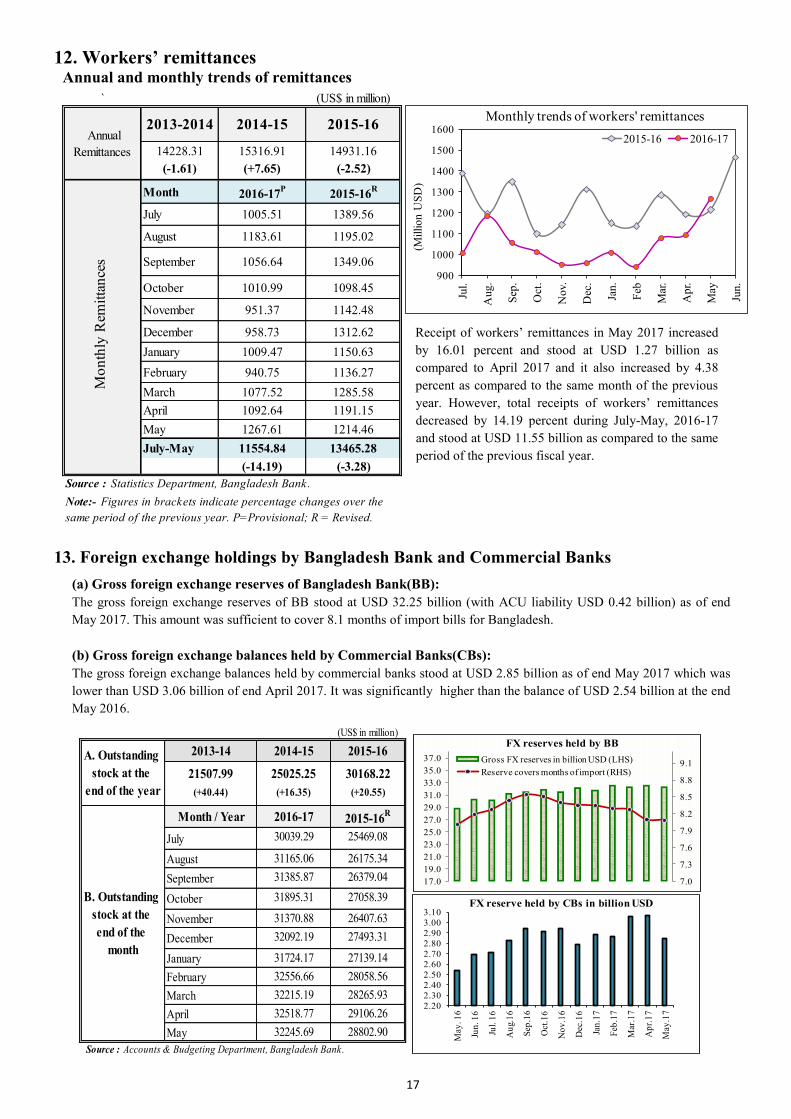
12. Workers’ remittances Annual and monthly trends of remittances
Receipt of workers’ remittances in May 2017 increased
by 16.01 percent and stood at USD 1.27 billion as
compared to April 2017 and it also increased by 4.38
percent as compared to the same month of the previous
year. However, total receipts of workers’ remittances
decreased by 14.19 percent during July-May, 2016-17
and stood at USD 11.55 billion as compared to the same
period of the previous fiscal year.
13. Foreign exchange holdings by Bangladesh Bank and Commercial Banks
(a) Gross foreign exchange reserves of Bangladesh Bank(BB):
The gross foreign exchange reserves of BB stood at USD 32.25 billion (with ACU liability USD 0.42 billion) as of end
May 2017. This amount was sufficient to cover 8.1 months of import bills for Bangladesh.
(b) Gross foreign exchange balances held by Commercial Banks(CBs):
The gross foreign exchange balances held by commercial banks stood at USD 2.85 billion as of end May 2017 which was
lower than USD 3.06 billion of end April 2017. It was significantly higher than the balance of USD 2.54 billion at the end
May 2016.
900
1000
1100
1200
1300
1400
1500
1600
Jul.
Au
g.
Sep
.
Oct
.
No
v.
Dec
.
Jan
.
Feb
Mar
.
Ap
r.
May
Jun
.
(Millio
n U
SD
)
Monthly trends of workers' remittances
2015-16 2016-17
` (US$ in million)
2013-2014 2014-15 2015-16
14228.31 15316.91 14931.16
(-1.61) (+7.65) (-2.52)
Month 2016-17P
2015-16R
July 1005.51 1389.56
August 1183.61 1195.02
September 1056.64 1349.06
October 1010.99 1098.45
November 951.37 1142.48
December 958.73 1312.62
January 1009.47 1150.63
February 940.75 1136.27
March 1077.52 1285.58
April 1092.64 1191.15
May 1267.61 1214.46
July-May 11554.84 13465.28
(-14.19) (-3.28)
Annual
Remittances
Mo
nth
ly R
emit
tan
ces
Source : Statistics Department, Bangladesh Bank.
Note:- Figures in brackets indicate percentage changes over the
same period of the previous year. P=Provisional; R = Revised.
(US$ in million)
2013-14 2014-15 2015-16
21507.99 25025.25 30168.22
(+40.44) (+16.35) (+20.55)
Month / Year 2016-17 2015-16R
July 30039.29 25469.08
August 31165.06 26175.34
September 31385.87 26379.04
October 31895.31 27058.39
November 31370.88 26407.63
December 32092.19 27493.31
January 31724.17 27139.14
February 32556.66 28058.56
March 32215.19 28265.93
April 32518.77 29106.26
May 32245.69 28802.90
Source : Accounts & Budgeting Department, Bangladesh Bank.
A. Outstanding
stock at the
end of the year
B. Outstanding
stock at the
end of the
month
17.0
19.0
21.0
23.0
25.0
27.0
29.0
31.0
33.0
35.0
37.0
7.0
7.3
7.6
7.9
8.2
8.5
8.8
9.1
FX reserves held by BB
Gross FX reserves in billion USD (LHS)
Reserve covers months of import (RHS)
2.20
2.30
2.40
2.50
2.60
2.70
2.80
2.90
3.00
3.10
May
. 16
Jun
. 16
Jul.
16
Au
g.1
6
Sep
.16
Oct
.16
No
v.1
6
Dec
.16
Jan
.17
Feb
.17
Mar
.17
Ap
r.1
7
May
.17
FX reserve held by CBs in billion USD

18
14. Foreign aid
Total foreign aid disbursements during July-April, 2016-17
decreased by USD 0.25 billion or 9.34 percent and stood at USD
2.44 billion.
After principle repayment of USD 0.76 billion, the net receipt of
foreign aid stood at USD 1.67 billion during July-April, 2016-17
as compared to USD 1.95 billion of the same period of the
previous year.
Food Project Total Payment Food Project Total Payment
Aid Aid Aid (Principal) Aid Aid Aid (Principal)
Month
July 0.00 120.15 120.15 96.50 23.65 0.00 192.19 192.19 195.73 -3.54
August 0.00 132.02 132.02 97.50 34.52 0.00 192.07 192.07 41.38 150.69
September 6.46 223.76 230.22 44.03 186.19 9.64 216.03 225.67 85.84 139.83
October 0.00 258.48 258.48 69.19 189.29 0.00 155.11 155.11 68.62 86.49
November 0.00 192.17 192.17 75.79 116.38 0.00 230.72 230.72 79.62 151.10
December 6.15 599.50 605.65 69.90 535.75 10.08 648.81 658.89 67.11 591.79
January 0.00 216.23 216.23 82.12 134.11 0.00 240.23 240.23 73.08 167.14
February 0.00 242.96 242.96 40.50 202.46 0.00 94.39 94.39 42.45 51.93
March 12.56 556.94 569.50 77.26 492.24 5.20 327.97 333.17 78.87 254.30
April 0.00 120.71 120.71 80.59 40.12 0.00 160.38 160.38 67.09 93.29
May 0.00 248.82 248.82 69.30 179.52 0.00 243.90 243.90 66.83 177.07
June 6.74 506.32 513.06 64.53 448.53 12.60 362.94 375.54 38.32 337.22
July-June 31.91 3418.06 3449.97 867.20 2582.77 37.52 3064.74 3102.26 904.94 2197.32
(-14.95) (+11.53) (+11.21) (-4.17) (+17.54) (+22.49) (+6.09) (+6.27) (-16.92) (+20.06)
Month
July 0.00 128.28 128.28 89.60 38.68 0.00 120.15 120.15 96.50 23.65
August 0.00 158.23 158.23 45.18 113.05 0.00 132.02 132.02 97.50 34.52
September 8.44 212.34 220.78 85.41 135.37 6.46 223.76 230.22 44.03 186.19
October 0.00 251.37 251.37 79.00 172.37 0.00 258.48 258.48 69.19 189.29
November 0.00 170.20 170.20 71.88 98.33 0.00 192.17 192.17 75.79 116.38
December 5.22 452.64 457.86 75.95 381.91 6.15 599.50 605.65 69.90 535.75
January 0.00 135.51 135.51 81.57 53.94 0.00 216.23 216.23 82.12 134.11
February 0.00 434.94 434.94 42.86 392.08 0.00 242.96 242.96 40.50 202.46
March 6.20 346.77 352.97 111.94 241.03 12.56 556.94 569.50 77.26 492.24
April 0.00 126.82 126.82 80.74 46.08 0.00 120.71 120.71 80.59 40.12
July-April 19.86 2417.10 2436.96 764.13 1672.83 25.17 2662.92 2688.09 733.38 1954.71
(-21.10) (-9.23) (-9.34) (+4.19) (-14.42) (+1.00) (+8.34) (+8.27) (-8.30) (+16.14)
Source : Bangladesh Bank & Ministry of Finance, P=Provisional; R = Revised
FY2016-17P FY2015-16
(US$ in million)
Net
Foreign
Aid
Net
Foreign
Aid
FY2015-16 FY2014-15
2436.96
2688.09
1672.83
1954.71
10
310
610
910
1210
1510
1810
2110
2410
2710
3010
July-April, 2016-17 July-April, 2015-16
(Mil
lion
US
D)
Foreign AidTotal Aid Net Aid
19
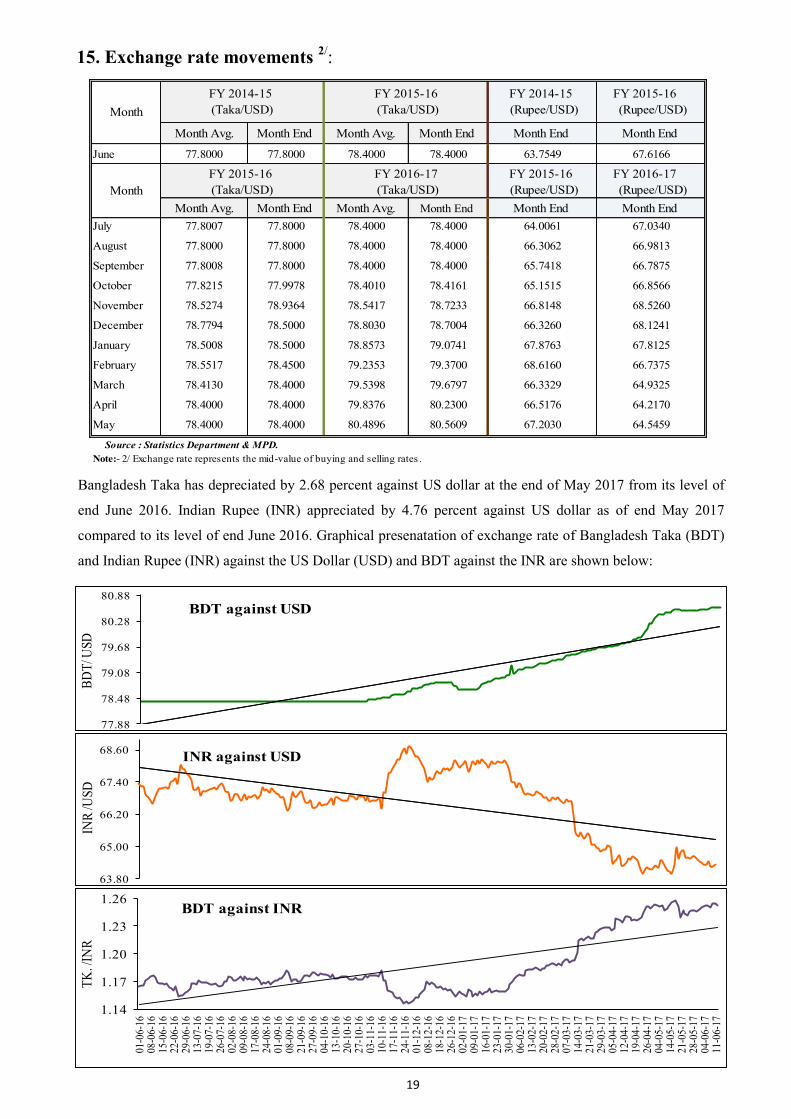
15. Exchange rate movements 2/
:
Bangladesh Taka has depreciated by 2.68 percent against US dollar at the end of May 2017 from its level of
end June 2016. Indian Rupee (INR) appreciated by 4.76 percent against US dollar as of end May 2017
compared to its level of end June 2016. Graphical presenatation of exchange rate of Bangladesh Taka (BDT)
and Indian Rupee (INR) against the US Dollar (USD) and BDT against the INR are shown below:
FY 2014-15 FY 2015-16
(Rupee/USD) (Rupee/USD)
Month Avg. Month End Month Avg. Month End Month End Month End
June 77.8000 77.8000 78.4000 78.4000 63.7549 67.6166
FY 2015-16 FY 2016-17
(Rupee/USD) (Rupee/USD)
Month Avg. Month End Month Avg. Month End Month End Month End
July 77.8007 77.8000 78.4000 78.4000 64.0061 67.0340
August 77.8000 77.8000 78.4000 78.4000 66.3062 66.9813
September 77.8008 77.8000 78.4000 78.4000 65.7418 66.7875
October 77.8215 77.9978 78.4010 78.4161 65.1515 66.8566
November 78.5274 78.9364 78.5417 78.7233 66.8148 68.5260
December 78.7794 78.5000 78.8030 78.7004 66.3260 68.1241
January 78.5008 78.5000 78.8573 79.0741 67.8763 67.8125
February 78.5517 78.4500 79.2353 79.3700 68.6160 66.7375
March 78.4130 78.4000 79.5398 79.6797 66.3329 64.9325
April 78.4000 78.4000 79.8376 80.2300 66.5176 64.2170
May 78.4000 78.4000 80.4896 80.5609 67.2030 64.5459
Source : Statistics Department & MPD.
Month
FY 2014-15 FY 2015-16
(Taka/USD) (Taka/USD)
Note:- 2/ Exchange rate represents the mid-value of buying and selling rates .
Month
FY 2015-16 FY 2016-17
(Taka/USD) (Taka/USD)
77.88
78.48
79.08
79.68
80.28
80.88
BD
T/ U
SD
BDT against USD
63.80
65.00
66.20
67.40
68.60
INR
/US
D
INR against USD
1.14
1.17
1.20
1.23
1.26
01-0
6-16
08-0
6-16
15-0
6-16
22-0
6-16
29-0
6-16
13-0
7-16
19-0
7-16
26-0
7-16
02-0
8-16
09-0
8-16
17-0
8-16
24-0
8-16
01-0
9-16
08-0
9-16
21-0
9-16
27-0
9-16
04-1
0-16
13-1
0-16
20-1
0-16
27-1
0-16
03-1
1-16
10-1
1-16
17-1
1-16
24-1
1-16
01-1
2-16
08-1
2-16
18-1
2-16
26-1
2-16
02-0
1-17
09-0
1-17
16-0
1-17
23-0
1-17
30-0
1-17
06-0
2-17
13-0
2-17
20-0
2-17
28-0
2-17
07-0
3-17
14-0
3-17
21-0
3-17
29-0
3-17
05-0
4-17
12-0
4-17
19-0
4-17
26-0
4-17
04-0
5-17
14-0
5-17
21-0
5-17
28-0
5-17
04-0
6-17
11-0
6-17
TK
. /IN
R
BDT against INR
20
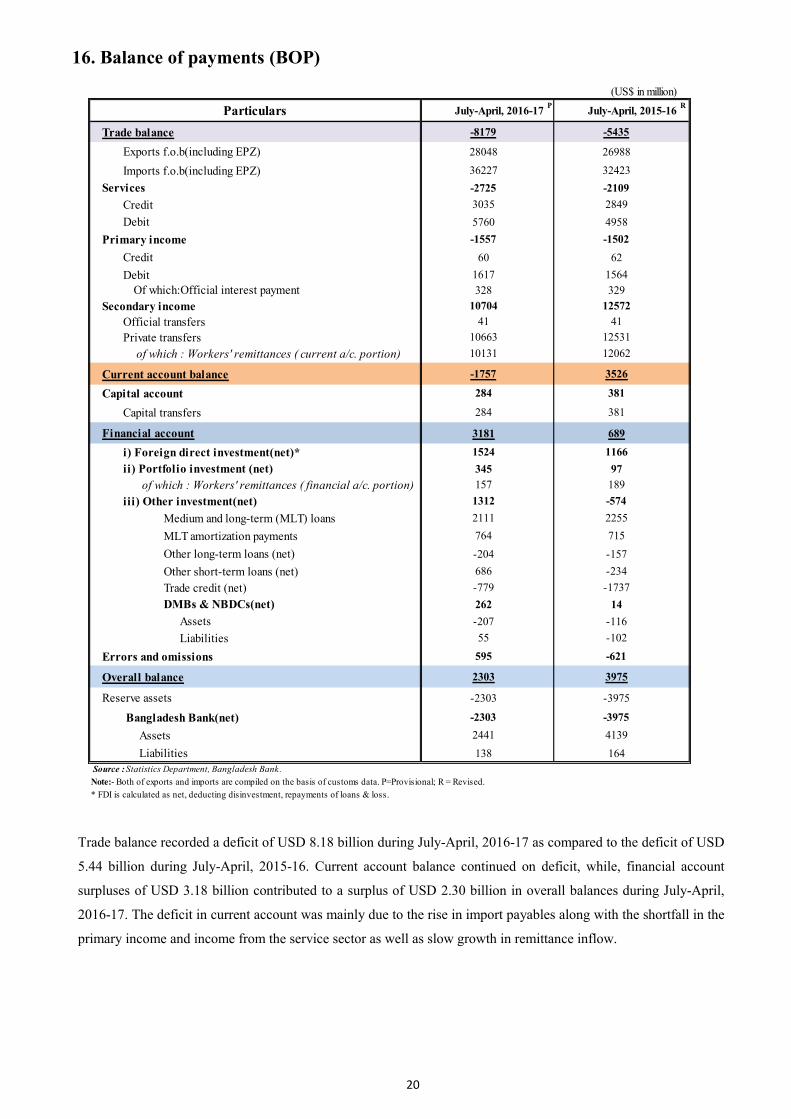
16. Balance of payments (BOP)
Trade balance recorded a deficit of USD 8.18 billion during July-April, 2016-17 as compared to the deficit of USD
5.44 billion during July-April, 2015-16. Current account balance continued on deficit, while, financial account
surpluses of USD 3.18 billion contributed to a surplus of USD 2.30 billion in overall balances during July-April,
2016-17. The deficit in current account was mainly due to the rise in import payables along with the shortfall in the
primary income and income from the service sector as well as slow growth in remittance inflow.
(US$ in million)
Particulars July-April, 2016-17P
July-April, 2015-16R
Trade balance -8179 -5435
Exports f.o.b(including EPZ) 28048 26988
Imports f.o.b(including EPZ) 36227 32423
Services -2725 -2109
Credit 3035 2849
Debit 5760 4958
Primary income -1557 -1502
Credit 60 62
Debit 1617 1564
Of which:Official interest payment 328 329
Secondary income 10704 12572
Official transfers 41 41
Private transfers 10663 12531
of which : Workers' remittances ( current a/c. portion) 10131 12062
Current account balance -1757 3526
Capital account 284 381
Capital transfers 284 381
Financial account 3181 689
i) Foreign direct investment(net)* 1524 1166
ii) Portfolio investment (net) 345 97
of which : Workers' remittances ( financial a/c. portion) 157 189
iii) Other investment(net) 1312 -574
Medium and long-term (MLT) loans 2111 2255
MLT amortization payments 764 715
Other long-term loans (net) -204 -157
Other short-term loans (net) 686 -234
Trade credit (net) -779 -1737
DMBs & NBDCs(net) 262 14
Assets -207 -116
Liabilities 55 -102
Errors and omissions 595 -621
Overall balance 2303 3975
Reserve assets -2303 -3975
Bangladesh Bank(net) -2303 -3975
Assets 2441 4139
Liabilities 138 164
Note:- Both of exports and imports are compiled on the basis of customs data. P=Provisional; R = Revised.
* FDI is calculated as net, deducting disinvestment, repayments of loans & loss.
Source : Statistics Department, Bangladesh Bank.

21
17. Public finance a) Government tax revenue collections
Total tax revenue collection (NBR & non-NBR) during July-March 2016-17 stood at Taka 130910.90 crore which was higher
by Taka 21405.97 crore or 19.55 percent against the collection of Taka 109504.93 crore during July-March 2015-16.
NBR tax revenue collection stood at Taka 142758.80 crore which was lower by Taka 13660.47 crore or 8.73 percent as
compared to the target set by NBR of Taka 156419.27 crore during July-April, 2016-17. However, this collection was 19.62
percent higher as compared to that of the same period of the previous year.
Revised target for NBR tax revenue collection is Taka 1,85,000.00 crore for FY17
-17
-12
-7
-2
3
8
13
18
23
28
33
38
43
48
Mar.
16
Ap
r.1
6
May
16
Jun
16
Jul 1
6
Au
g 1
6
Sep
16
Oct 1
6
No
v 1
6
Dec 1
6
Jan
17
Feb
17
Mar
17
Perc
en
tage
Growth of total tax revenue collection (year-on-year)
NBR Non-NBR Total
70
90
110
130
150
170
190
210
230
Jul.
Au
g.
Sep
.
Oct
.
No
v.
Dec
.
Jan
.
Feb
.
Mar.
Ap
r.
May
Jun
.
(Bil
lio
n tak
a)
Monthly flow of NBR tax revenue
2016-17 2015-16
Note:- Figures in brackets indicate the target of revenue collection.
Total Tax
Customs Customs Income Revenue
duties duties Tax Collections
1 2 4 6 7=(5+6) 1 2 3 4 5=(1+..+4) 6 7=(5+6)
July 1242.47 3862.23 2683.49 1805.95 9594.14 417.46 10011.60 1122.01 3528.60 2459.71 1617.74 8728.06 376.09 9104.15
August 1737.32 5074.41 2861.17 2754.57 12427.47 523.38 12950.85 1261.38 3780.11 2634.03 1952.19 9627.71 610.69 10238.40
September 1443.81 4999.08 5146.28 2824.75 14413.92 373.37 14787.29 1382.36 4835.24 4432.91 2109.32 12759.83 408.38 13168.21
October 1567.22 5264.70 3652.38R
2896.85 13381.15R
481.58 13862.73R
1309.26 4394.23 3307.76 2223.82 11235.07 406.43 11641.50
November 1779.09 5509.87 3929.55 2827.47 14045.98 471.80 14517.78 1569.71 4985.84 3138.55 2820.29 12514.39 462.98 12977.37
December 1921.88 5628.52 5939.36 2844.95 16334.71 464.60 16799.31 1593.82 4488.25 4610.99 2531.17 13224.23 486.57 13710.80
January 2085.41 5914.39 4275.72 3316.88 15592.40 525.52 16117.92 1490.70 4328.79 3447.14 2618.11 11884.74 424.56 12309.30
February 1711.09 5251.14 3744.71 2770.28 13477.22 435.77 13912.99 1483.99 4174.79 3247.01 2485.55 11391.34 425.24 11816.58
March 1869.65 5946.53 6258.52 3253.04 17327.74 622.68 17950.42 1660.76 4680.54 5217.03 2514.77 14073.10 465.53 14538.63
July-March 15357.94 47450.87 38491.18 25294.74 126594.73 4316.17 130910.90 12873.99 39196.39 32495.13 20872.96 105438.47 4066.46 109504.93
(+20.07) (+6.14) (+19.55) (+15.92) (+20.61) (+16.09)
April 1901.29 5901.29 5153.29 3208.20 16164.07 1447.16 4516.18 5348.65 2593.77 13905.76 478.24 14384.00
July-April 17259.23 53352.16 43644.47 28502.94 142758.80 4316.17 261841.34 14321.15 43712.57 37843.78 23466.73 119344.23 4544.71 123888.94
(+19.62) (-5.03) (+111.35) (+15.72) (+19.62) (+15.86)
Source: National Board of Revenue and Office of the Controller General of Accounts . P=Provisional, R=Revised; *=include supplementary duties & travel tax. --- = Not Available.
(Taka in crore)
Annual tax revenue collections 2010-2011 2012-2013 2012-2013 2013-2014 2014-2015 2015-2016
NBR Tax Revenue 79403.11 95058.99 103332.00 120819.86 155518.72
(75600.00) (92370.00) (112259.00) (125000.00) (135028.00) (150000.00)
135700.70
Non-NBR Tax Revenue1/ 3229.36 3631.58 4120.00 4612.64 5642.46
(3452.00) (3915.00) (4565.00) (5178.00) (5648.00) (5400.00)
4821.57
Total Tax Revenue 82632.47 98690.57 107452.00 125432.50 161161.18
(79052.00) (96285.00) (116824.00) (130178.00) (140676.00) (155400.00)
140522.27
Tax
(Taka in crore)
NBR Tax Revenue Non-NBR
Tax
Revenue1/
Total Tax
Revenue
Collections
NBR Tax Revenue Non-NBR
Tax
Revenue1/
VATIncome
others* Total VAT others* Total
3 5=(1+..+4)
Note:- Figures in brackets indicate percentage changes over the corresponding period of the preceding year.
2016-17P
2015-16R
1/Non-NBR tax revenue includes narcotics & liquor duty, taxes on vehicles, land revenue and stamp duty(non judicial).

22
b) Sale and repayment of National Savings Certificates (NSC)
The sale of National Savings Certificates (NSC) during
July-April, 2016-17 stood at Taka 60519.45 crore which
was 40.39 percent higher than the amount of sale during
July-April, 2015-16. The net borrowing of the
government through NSC during July-April, 2016-17
was Taka 42099.68 crore against Taka 26487.72 crore of
July-April, 2015-16.
The outstanding borrowing of the government through
NSC as of end April 2017 stood at Taka 180918.42
crore.
1600
2150
2700
3250
3800
4350
4900
5450
6000
Jul.
Au
g.
Sep
.
Oct.
No
v.
Dec.
Jan
.
Feb
.
Mar.
Ap
r.
May
Jun
.
(Tak
a in
crore)
Monthly net sale of NSC
2016-17 2015-16
(Taka in crore)
Repayment Outstanding at
(Principal) the end of the year
(1) (2) (3) 4=(2-3) (5)
17232.03 15175.13 2056.90 63438.32
18955.35 18476.33 479.02 63917.34
22553.93
12602.29
13927.13
20023.85
(Taka in crore)
Repayment Repayment
(Principal) (Principal)
July 4932.05 1433.68 3498.37 142317.11 3236.40 1260.12 1976.28 107106.42
August 6327.61 2030.40 4297.21 146614.32 4524.42 1873.51 2650.91 109757.33
September 5390.50 1535.99 3854.50 150468.82 3436.03 1382.23 2053.80 111811.13
October 6104.91 1838.31 4266.61 154735.43 4061.46 1708.75 2352.71 114163.84
November 6106.62 1703.76 4402.85 159138.28 4031.68 1739.52 2292.16 116456.00
December 4881.59 1727.57 3154.02 162292.30 3734.30 1754.57 1979.73 118435.73
January 7357.29 1936.70 5420.59 167712.89 5069.06 1771.68 3297.38 121733.11
February 6030.93 1642.51 4388.42 172101.31 4973.90 1686.33 3287.57 125020.69
March 6556.47 2190.62 4365.85 176467.16 5121.42 1823.71 3297.71 128318.40
April 6831.48 2380.22 4451.26 180918.42 4919.52 1620.06 3299.46 131617.86
July-April 60519.45 18419.77 42099.68 180918.42 43108.19 16620.47 26487.72 131617.86
(+40.39) (+10.83) (+58.94) (+37.46) (+22.60) (+50.64) (+9.78) (+30.93)
Note:- Figures in brackets indicate percentage changes over the corresponding period of the preceding year.
Revised target for net sale of NSC is Taka 45,000.00 crore for FY 2016-17.
Source:- National Savings Directorate.
2016-17 2015-16
2013-14 24309.59 11707.30 76397.48
Months Net sale SaleOutstanding at
the end period
2014-15 42659.79
2015-16 53712.45 33688.60 138818.74
772.84
Net saleOutstanding at
the end period
28732.66 105130.14
Sale Net saleFY
Sale
2010-11
2011-12
2012-13 64690.1823326.77

23
c) Budget financing
Government’s budget financing from domestic sources stood lower at Taka 119.50 billion during July-April,
2016-17 as compared to that of Taka 143.17 billion of July-April, 2015-16. Net foreign financing stood at Taka
131.88 billion in the period under review. Therefore, the total budget financing of the government during July-
April, 2016-17 stood lower at Taka 251.38 billion against Taka 296.42 billion during July-April, 2015-16.
However, Govt. borrowings stood short from govt.’s repayment and as a result govt.’s net borrowing from the
banking system stood negative at Taka 307.49 billion during July-April, 2016-17. While, govt. borrowing from the
non-banking sources stood remarkably higher at Taka 426.99 billion during July-April, 2016-17 as compared to
that of July-April, 2015-16. The total budget financing during July-April, 2016-17 stood at 1.28 percent of
projected GDP against 4.70 percent as envisaged in the national budget for FY17.
18. Food situations
Actual production of Aus and Aman were marginally higher at 157.91 lakh metric tons during July-April
2016-17 than 157.72 lakh metric tons during July-April, 2015-16. Imports for rice and wheat were higher at
48.95 lakh metric tons during July-April, 2016-17 than 35.81 lakh metric tons during July-April, 2015-16.
Procurement of rice and wheat during July-April, 2016-17 were also higher than that of July-April, 2015-16.
Public food distribution of rice and wheat was also higher during July-April, 2016-17 at 18.25 lakh metric tons
than 14.39 lakh metric tons during July- April, 2015-16. However, outstanding food stock was 46.10 percent
lower at 5.61 lakh metric tons during July- April, 2016-17 as compared to that of July- April, 2015-16.
Net Food grain Imports Public Public Foodgrain
Year Production Domestic Govt. & Private Domestic Distribution Stock Public
Target Production* food aid Procurement (End June)
FY2010-11 360.65 345.13 22.04 35.00 4.62 22.91 8.87
FY2011-12 357.25 348.20 10.50 12.40 14.26 20.95 12.48
FY2012-13 354.66 350.88 4.72 14.18 14.06 20.87 14.97
FY2013-14 358.81 356.56 8.56 21.37 14.34 22.20 11.53
FY2014-15 360.50 360.58 3.34 49.40 16.76 18.38 12.86
FY2015-16R 364.24 360.03 R 3.34 R 42.06 12.32 20.64 8.56
FY2016-17T
365.91R ---- 4.00 51.00 19.50 23.63 -
Source : Bangladesh Food Situation Report, FPMU, Ministry of Food & Disaster Management,Govt. of the Peoples Republic of Bangladesh.
Note : T = Target, P = Provisional, R = Revised, B = Boro. ---- = Data not avaiable.
*= After 10% deduction for seed, feed, waste etc.
3. Procurement (Rice and Wheat)B
4. Distribution (Rice & Wheat)
5. Food Stock
320.90
Particulars July-April, 2016-17P
324.52
14.57
(In lakh metric ton)
Total
Actual Domestic
Production
(Gross)
315.79 18.90
29.93
310.62 57.04
313.38 22.90
July-April, 2015-16
157.91 157.721. Production (Aus and Aman)
48.95 35.812. Imports (Rice & Wheat)
52.74
324.03 45.40
---- 55.00
8.56
18.25 14.39
5.61 10.41
** Only for Aus and Aman
(Taka in crore)
Year
Net borrowing of
the Govt. from
the banking
system 1/
Net non-bank
borrowing of
the Govt. from
the public 2/
Net foreign
financing 3/
Outstanding
Domestic debt
(end period)
Outstanding
domestic debt
as % of GDP@
at current
market priceR
1 2 3 4=(2+3) 5 6=(4+5) 7 8 9
2010-2011 19175.90 3012.93 22188.83R
7470.44 29659.27R
3.24R
139012.67 15.18
2011-2012 18784.20 2241.10 21025.30 9714.35 30739.65 2.91 160037.97 15.17
2012-2013 17873.00 7724.86 25597.86 15080.19 40678.05 3.39 185635.83 15.48
2013-2014 6627.80 15351.72 21979.52 14224.04 36203.56 2.69 207615.35 15.45
2014-2015R -7370.70 34723.57 27352.87 17067.58 44420.45 2.93 234968.22 15.50
2015-2016P 4326.60 34166.55 38493.15 20213.70 58706.85 3.39 273461.37 15.78
July-April, 2015-16 R -12391.30 26707.91 14316.61 15324.95 29641.55 1.71 249284.83 14.39
July-April, 2016-17P
-30749.30 42699.49 11950.19 13187.87 25138.06 1.28 285411.56 14.55
Source: Bangladesh Bank & Bangladesh Bureau of Statistics. P=Provisional ; R=Revised, 1/: Excludes interest, 2/: Excludes saving certificates held by the banks and includes
treasury bills & bonds held by the non-bank financial institutions through secondary auctions, T.bills & bonds have been taken at face value.
3/: Total aid disbursement less amortization payment, @
: nominal GDP (base 2005-06=100) has been used.
Total financing
Total financing
as % of GDP@
at current
market price
Total domestic
financing

24
APPENDIX
Break-up of fresh opening, settlement and outstanding of import LCs
Sectors / Commodities
Fresh
opening
of LCs
Settlement
of LCs
Fresh
opening of
LCs
Settlement
of LCs
Outstanding
LCs at the
end period
Fresh
opening of
LCs
Settlement
of LCs
Outstanding
LCs at the
end period
A. Consumer goods 5009.96 4209.97 3962.46 3832.24 1678.24 +1047.50 +377.73 +442.82
Rice and wheat 1138.32 976.87 969.06 952.52 337.37 +169.26 +24.36 +57.37
Sugar and salt 771.78 663.52 473.65 604.26 351.65 +298.13 +59.26 +126.74
Milk food 248.88 186.09 156.75 166.60 83.13 +92.12 +19.49 +36.30
Edible oil (refined) 728.55 617.06 639.30 611.46 304.10 +89.24 +5.60 +104.43
All kinds of fruits 277.31 224.34 222.84 196.10 40.25 +54.47 +28.24 +13.31
Pulses 589.75 426.78 391.36 320.77 169.73 +198.40 +106.01 +72.77
Onion 156.88 153.23 226.44 216.39 29.81 -69.56 -63.16 -0.59
Spices 149.18 135.84 94.80 92.65 26.80 +54.39 +43.20 +3.04
Second hand clothings 0.56 2.13 1.11 3.35 0.02 -0.55 -1.22 +0.04
Drugs and medicines(finished) 69.46 58.48 67.08 59.83 23.42 +2.38 -1.34 +1.06
Others 879.28 765.61 720.07 608.31 311.96 +159.21 +157.30 +1809.10
B. Intermediate goods 3389.77 3163.35 3095.14 2752.75 1728.53 +294.63 +410.60 -63.61
Coal 246.61 229.63 176.19 205.31 59.06 +70.42 +24.32 -4.13
Cement 12.85 13.64 7.32 5.04 7.51 +5.53 +8.60 +1.80
Clinker & limestone 550.93 479.32 486.81 452.46 233.55 +64.12 +26.87 +5.30
B. P. sheet 271.86 248.19 248.92 259.56 199.18 +22.94 -11.37 -31.96
Tin plate 10.78 8.21 9.85 11.67 2.65 +0.93 -3.46 +3.60
Scrap Vessels 604.88 629.96 652.28 575.18 433.92 -47.40 +54.78 -97.61
Iron and steel scrap 580.44 547.32 500.10 407.37 255.44 +80.34 +139.94 +72.54
Non-ferrous metal 199.37 188.01 209.97 168.71 101.53 -10.60 +19.31 -0.42
Paper and paper board 308.56 277.36 287.55 263.46 156.41 +21.01 +13.91 -25.83
Others 603.49 541.69 516.15 404.00 279.29 +87.34 +137.69 +1385.64
C. Industrial raw materials 14751.13 13598.36 13859.85 13135.87 7583.36 +891.28 +462.49 -1226.84
Edible oil (Crude) & oil seeds 944.15 768.05 989.09 780.57 749.93 -44.94 -12.52 -188.24
Textile fabrics (B/B & others) 5973.08 5404.01 5791.53 5333.59 2921.02 +181.55 +70.42 -581.62
Pharmaceutical raw materials 522.59 469.31 442.83 429.15 125.84 +79.75 +40.16 +26.54
Raw cotton 2357.63 2087.00 1872.69 1694.90 1396.77 +484.94 +392.10 -229.26
Cotton yarn 1118.48 977.19 946.36 913.38 491.46 +172.12 +63.81 +36.10
Copra 5.11 3.60 5.92 5.81 1.49 -0.81 -2.22 +3.07
Synthetic fibre & yarn 644.66 562.32 591.34 531.59 336.95 +53.32 +30.73 -15.19
Chemicals & chem. products 3185.44 3326.89 3220.08 3446.87 1559.90 -34.65 -119.98 +4796.626356.52
July-April, 2016-17 P
561.70
2339.40
152.38
1167.50
527.56
327.99
101.12
130.58
1664.93
6356.52
6.25
336.31
29.22
9.30
238.84
167.22
Outstanding
LCs at the
end period
29.84
0.06
24.48
2121.06
1664.93
(continued on page-25)
(US$ in million )
July-April, 2015-16over July-April, 2015-16
2121.06
394.74
478.40
119.43
408.54
53.56
242.50
Changes during July-April, 2016-17
4.56
321.77
54.92

25
APPENDIX
Break-up of fresh opening, settlement and outstanding of import LCs
Comments and suggestions may be sent to:
[email protected] [email protected] [email protected]
Sectors / Commodities
Fresh
opening
of LCs
Settlement
of LCs
Outsta
nding
LCs
Fresh
opening
of LCs
Settlement
of LCs
Outstanding
LCs at the
end period
Fresh
opening of
LCs
Settlement
of LCs
Outstanding
LCs at the
end period
D. Capital machinery 4314.59 4199.17 3626.47 2835.40 5621.82 +688.12 +1363.78 +96.93
Textile machinery 673.92 591.36 642.96 406.56 636.42 +30.96 +184.80 +46.02
Leather / tannery 20.70 20.18 28.77 8.01 19.89 -8.06 +12.17 -4.90
Jute industry 9.75 13.86 7.83 7.10 8.64 +1.92 +6.77 +1.72
Garment industry 734.91 589.96 635.91 502.98 606.82 +99.00 +86.98 +97.04
Pharmaceutical industry 131.68 98.80 83.88 68.86 54.15 +47.80 +29.94 +30.35
Packing industry 9.75 15.63 15.49 8.44 11.45 -5.74 +7.19 -1.95
Other industry 2733.88 2869.39 2211.62 1833.46 4284.45 +522.25 +1035.93 -71.35
E. Machinery for misc. inds. 4069.32 3848.78 3439.65 3551.98 1928.23 +629.66 +296.80 -65.53
Other machineries 704.91 674.48 603.09 606.53 337.61 +101.82 +67.95 -47.23
Marine diesel engine 9.99 15.82 11.44 17.80 60.22 -1.45 -1.98 -16.42
Computer & its accessories 312.14 304.86 311.33 293.08 101.93 +0.81 +11.78 +4.43
Motor vehicle & motorcycle parts 109.56 91.39 93.91 95.72 28.72 +15.65 -4.34 +7.61
Bicycle parts 66.83 52.35 48.27 45.22 15.47 +18.56 +7.13 +14.12
Other iron and steel products 415.83 390.14 341.14 328.94 249.94 +74.69 +61.20 -42.44
Motor vehicles 928.39 819.27 711.83 669.37 185.48 +216.55 +149.90 +99.02
Other electronics components 151.21 117.95 155.32 131.01 83.47 -4.10 -13.06 +19.51
Tractors & power tiller 70.49 60.85 73.90 70.24 21.80 -3.41 -9.39 +2.17
Others 1299.97 1321.68 1089.42 1294.08 843.60 +210.55 +27.61 -106.29
F. Petroleum & petro.prodts. 2153.64 2125.67 1763.29 2094.47 694.20 +390.35 +31.21 -166.77
Crude 357.00 296.01 301.54 517.84 294.58 +55.46 -221.84 -128.87
Refined 1796.64 1829.67 1461.75 1576.62 399.62 +334.89 +253.05 -37.90
G. Others 6279.39 6228.51 5366.00 5172.87 3590.13 +913.39 +1055.64 -156.67
Commercial sector 2810.11 3245.00 2262.19 2437.14 2279.08 +547.92 +807.86 -243.14
Industrial sector 3469.28 2983.51 3103.81 2735.72 1311.05 +365.47 +247.79 +86.46
Total 39967.79 37373.82 35112.86 33375.56 22824.51 +4854.93 +3998.25 -1139.67
of which back to back 6596.52 5944.98 6304.18 5780.56 3301.09 +292.33 +164.42 -600.21
Source: Foreign Exchange Operations Department(FEOD), Bangladesh Bank.
21684.84
2700.88
July-April, 2016-17 P
165.71
361.72
3433.46
2035.95
1397.51
284.51
102.97
23.97
737.31
527.43
43.80
106.37
36.33
29.59
207.49
84.50
9.50
4213.10
1862.71
290.38
5718.75
682.44
14.99
10.36
703.86
(US$ in million )
Changes during July-April, 2016-17
over July-April, 2015-16July-April, 2015-16