Crystal plasticity analysis of micro-deformation, lattice...
23
Proc. R. Soc. A doi:10.1098/rspa.2012.0050 Published online Crystal plasticity analysis of micro-deformation, lattice rotation and geometrically necessary dislocation density BY F. P. E. DUNNE 1, *, R. KIWANUKA 1 and A. J. WILKINSON 2 1 Department of Engineering Science, and 2 Department of Materials, University of Oxford, Oxford, UK A gradient-enhanced crystal plasticity model is presented that explicitly accounts for the evolution of the densities of geometrically necessary dislocations (GNDs) on individual slip systems of deforming crystals. The GND densities are fully coupled with the crystal slip rule. Application of the model to two distinct and technologically important crystal types, namely hcp Ti and ccp Ni, is given. For the hcp crystals, slip is permitted with a -type slip directions on basal, prismatic and pyramidal planes and c + a -type slip directions on pyramidal planes. First, a single crystal under four-point bending is simulated as the uniform strain gradient expected in the central span provides a good validation of the code. Then, uniaxial deformation of a model near-a Ti polycrystal has been analysed. The resulting distributions of GND densities that develop on the various slip system types have been compared with independent experimental observations. The model predicts that GND density on the c + a systems is approximately an order of magnitude lower than that for a -type systems in agreement with experiment. For the ccp case, slip is considered to take place on the <110>{111} slip systems. Thermal loading of a single-crystal nickel alloy sample containing carbide particles of size approximately 30 mm has been analysed. Detailed comparisons are presented between model predictions and results of high-resolution electron backscatter diffraction (EBSD) measurements of the micro-deformations, lattice rotations, curvatures and GND densities local to the nickel–carbide interface. Qualitatively, good agreement is achieved between the coupled and decoupled model elastic strains with the EBSD measurements, but lattice rotations and GND densities are quantitatively well predicted by the coupled crystal model but are less well captured by the decoupled model. The GND coupling is found to lead to reduced lattice rotations and plastic strains in the region of highest heterogeneity close to the Ni matrix/particle interface, which is in agreement with the experimental measurements. The results presented provide objective evidence of the effectiveness of gradient-enhanced crystal plasticity finite element analysis and demonstrate that GND coupling is required in order to capture strains and lattice rotations in regions of high heterogeneity. Keywords: crystal plasticity; electron backscatter diffraction; strain; lattice rotation; geometrically necessary dislocation density *Author for correspondence (fi[email protected]). Received 27 January 2012 Accepted 5 April 2012 This journal is © 2012 The Royal Society 1 on May 3, 2018 http://rspa.royalsocietypublishing.org/ Downloaded from
-
Upload
hoangkhanh -
Category
Documents
-
view
219 -
download
0
Transcript of Crystal plasticity analysis of micro-deformation, lattice...

on May 3, 2018http://rspa.royalsocietypublishing.org/Downloaded from
Proc. R. Soc. Adoi:10.1098/rspa.2012.0050
Published online
Crystal plasticity analysis of micro-deformation,lattice rotation and geometrically necessary
dislocation densityBY F. P. E. DUNNE1,*, R. KIWANUKA1 and A. J. WILKINSON2
1Department of Engineering Science, and 2Department of Materials,University of Oxford, Oxford, UK
A gradient-enhanced crystal plasticity model is presented that explicitly accounts for theevolution of the densities of geometrically necessary dislocations (GNDs) on individualslip systems of deforming crystals. The GND densities are fully coupled with the crystalslip rule. Application of the model to two distinct and technologically important crystaltypes, namely hcp Ti and ccp Ni, is given. For the hcp crystals, slip is permittedwith a-type slip directions on basal, prismatic and pyramidal planes and c + a-typeslip directions on pyramidal planes. First, a single crystal under four-point bending issimulated as the uniform strain gradient expected in the central span provides a goodvalidation of the code. Then, uniaxial deformation of a model near-a Ti polycrystal hasbeen analysed. The resulting distributions of GND densities that develop on the variousslip system types have been compared with independent experimental observations. Themodel predicts that GND density on the c + a systems is approximately an order ofmagnitude lower than that for a-type systems in agreement with experiment. For the ccpcase, slip is considered to take place on the <110>{111} slip systems. Thermal loadingof a single-crystal nickel alloy sample containing carbide particles of size approximately30 mm has been analysed. Detailed comparisons are presented between model predictionsand results of high-resolution electron backscatter diffraction (EBSD) measurements ofthe micro-deformations, lattice rotations, curvatures and GND densities local to thenickel–carbide interface. Qualitatively, good agreement is achieved between the coupledand decoupled model elastic strains with the EBSD measurements, but lattice rotationsand GND densities are quantitatively well predicted by the coupled crystal model but areless well captured by the decoupled model. The GND coupling is found to lead to reducedlattice rotations and plastic strains in the region of highest heterogeneity close to the Nimatrix/particle interface, which is in agreement with the experimental measurements.The results presented provide objective evidence of the effectiveness of gradient-enhancedcrystal plasticity finite element analysis and demonstrate that GND coupling is requiredin order to capture strains and lattice rotations in regions of high heterogeneity.
Keywords: crystal plasticity; electron backscatter diffraction; strain; lattice rotation;geometrically necessary dislocation density
*Author for correspondence ([email protected]).
Received 27 January 2012Accepted 5 April 2012 This journal is © 2012 The Royal Society1

2 F. P. E. Dunne et al.
on May 3, 2018http://rspa.royalsocietypublishing.org/Downloaded from
1. Introduction
It is becoming increasingly desirable to calculate strain and stress response atprogressively smaller length scales. Major drivers for this are in, for example,development of understanding of deformation, fatigue and texture evolution(Rugg et al. 2007). Here, we confine ourselves to length scales of order grainsize and hence relevant to polycrystalline materials for which there is significantinterest in slip transfer, slip localization, grain boundary sliding, twinning, fatiguecrack nucleation and micro-texture (Dunne et al. 2007a; Dunne & Rugg 2008;Gong & Wilkinson 2009; Bache & Dunne 2010; McDowell & Dunne 2010;Wang et al. 2010). Also of great interest is the ability to calculate accuratelythe evolving densities of dislocations, be they geometrically necessary (GND)or statistically stored (SSD), because of the potential roles played in latenthardening, initiation of recrystallization and nucleation of fatigue cracks, forexample. There are now many modelling techniques available in crystal plasticityfinite element (CPFE) analysis, reviewed in Roters et al. (2010), and for thedetermination of GND density, and their inclusion in modelling studies relatedto indentation size effects (Britton et al. 2010a; Wilkinson & Randman 2010),facet fatigue (Dunne et al. 2007a; Dunne & Rugg 2008) and micro-deformation(Cheong et al. 2005; Cheong & Busso 2006), for example, is widespread. However,what is currently less clear is how well current modelling techniques, and,in particular, CPFE methods, properly and accurately capture independentexperimentally observed behaviour; that is, at the level of individual grains,the strain and stress distributions, the lattice rotations and the densities ofGNDs. In addition, limited work has been reported on the modelling of GNDdevelopment in hcp polycrystals. Specifically, the slip anisotropy in hcp crystalsis significantly different from that in fcc and bcc systems because of the c- anda-type slip having differing Burger’s vectors and vastly different critical resolvedshear stresses (CRSSs). Slip in such systems occurs on basal, prismatic andpyramidal systems (a-type), and on first- and second-order pyramidal systems(c + a-type). Experimental observations (Britton et al. 2010b; Wilkinson et al.2010) show that c + a-type slip may occur at a resolved shear stress of 2.5–3.0 times that for a-type slip (Gong & Wilkinson 2009). A consequence of thisis that the densities of GNDs developing on the different slip systems duringdeformation have been measured to be orders of magnitude different (Brittonet al. 2010b). This poses challenges for crystal plasticity-coupled GND modellingtechniques that have not as yet been addressed. Hence, the primary aim of thispaper is to present detailed comparisons between length-scale-enhanced crystalplasticity calculation and high-resolution electron backscatter diffraction (EBSD)measurement of these quantities in an attempt to assess how well the laudableambitions referred to above are currently achievable.
The whole area of polycrystal modelling and experimental integration iscurrently, rightly, receiving much attention; an example of this is the recent140th annual meeting of the Minerals, Metals & Materials Society, USA, whichcontained this area as a major theme. One of the earlier detailed studies ofCPFE capabilities versus experimental observation was carried out by Kalidindiet al. (2004), who made use of pseudo-two-dimensional polycrystal experimentswith which to carry out detailed strain comparisons with crystal calculations,a technique used later by others (Dunne et al. 2007b). Wang et al. (2011),
Proc. R. Soc. A

Deformation, lattice rotation and GNDs 3
on May 3, 2018http://rspa.royalsocietypublishing.org/Downloaded from
Yang et al. (2011) and Zhao et al. (2008) have similarly carried out detailedand interesting studies of polycrystal deformation with crystal plasticity but,for surface-based measurements, the problem of comparing results with crystalcalculations in the absence of knowledge of subsurface crystallography remainsan issue. There is little doubt, however, that much progress is still to be madein order for CPFE predictions to be considered good (Wang et al. 2011; Yanget al. 2011), though work reported so far is based on conventional crystal plasticityas opposed to that which is gradient enhanced. In particular, the significantdifficulty of capturing the important features of grain boundary slip transfer hasbeen demonstrated (Wang et al. 2011).
Our approach in the present paper is to attempt to enable as close as possible atie-up between the experimental model and that used in gradient-enhanced CPFEanalyses. This paper begins by addressing GND development in hcp polycrystals.The physically based crystal plasticity model of Dunne et al. (2007c) is used,which is fully length-scale-dependent and contains explicitly the coupling betweenGND density and slip rate. We present a simple methodology for determinationof the GND densities on the individual basal, prismatic and pyramidal slipsystems and, importantly, present for the first time detailed comparisons of GNDactivity on the different systems with experimental EBSD observations for a Tialloy polycrystal.
We then focus on an fcc nickel single crystal which, after heat treatment,contains distinct and reasonably separated carbide particles of size approximately30 mm. The material when subjected to stress relief by heat treatment at 870◦Cand subsequent reduction of temperature to 20◦C undergoes significant thermalstrain at the single crystal–particle boundaries by virtue of the differing thermalexpansivities of the nickel single crystal and the carbide particles. The difference islarge enough to cause the development of plastic strain with gradients and hencelattice curvatures and densities of GNDs. Our methodology is to adopt high-resolution EBSD (Wilkinson et al. 2006, 2010) in order to measure the elasticstrains developed at the particle together with determination of the distributionof GND density from lattice curvature measurements (Karamched & Wilkinson2011). We also model a nominally identical material and loading using our GND-enhanced crystal plasticity approach, and present detailed comparisons of theresults obtained. Finally, we present the results of the same analysis in whichthe GND development is decoupled from the slip rule in order to assess theimportance of the coupling. Firstly, in §2, we describe the crystal plasticityformulation, the coupling between the density of GNDs and the slip rate, andthe determination of GND density from the plastic strain gradients.
2. Crystal plasticity finite element implementation
Crystal plasticity kinematics rely on the deformation gradient F , which isusually multiplicatively decomposed into elastic and plastic parts (Kroner 1960;Lee 1969),
F = vxvX
= FeFp with Fp = LpFp and Lp =n∑
i=1
gisi ⊗ ni , (2.1)
Proc. R. Soc. A

4 F. P. E. Dunne et al.
on May 3, 2018http://rspa.royalsocietypublishing.org/Downloaded from
where the plastic part of the velocity gradient Lp incorporates the crystallographicslip from the active slip systems i, with normal vector ni and slip direction vectorsi , and gi is computed according to a slip rule. The slip rule used here wasdeveloped by Dunne et al. (2007c), and is used in the following form:
gi = rmS bi2n exp
(−DF
kT
)sin h
((ti − ti
c)g0DV i
kT
)(2.2)
with DV i = lbi2 , where l = 1√j(rs
S+rG), where rm
S and rsS are the mobile and sessile
SSD densities, respectively, rG is the overall GND density, n is the frequency ofattempts (successful or otherwise) by dislocations to jump the energy barrier,bi is the Burger vector magnitude for the slip system i, DF is the Helmholtzfree energy, k is the Boltzmann constant, T is the temperature in Kelvin (K),ti is the resolved shear stress, ti
c is the CRSS (a slip system is considered activewhen ti ≥ ti
c), g0 is the shear strain that is work conjugate to the resolved shearstress, DV is the activation volume, l is the pinning distance and j is a coefficientthat indicates that not all sessile dislocations (SSDs or GNDs) necessarily act aspinning points. The superscript i indicates the quantity appropriate to the ithactive slip system (for example, the Burger vector for hcp a-type slip is differentfrom that for c + a-type slip). The subsequent implicit integration of constitutiveequations and the determination of the consistent elastic–plastic tangent stiffnessare also detailed in Dunne et al. (2007c).
(a) Geometrically necessary dislocations in hcp and fcc crystals
The determination of the GND density has been discussed by many authors(e.g. Nye 1953; Arsenlis & Parks 1999; Acharya & Bassani 2000; Cermelli &Gurtin 2001) and here we equate the closure failure (Nye 1953) written in termsof density of GNDs and the cumulative Burger vector (Acharya & Bassani 2000)given with respect to the deformed configuration to give
G =∑
i
(bi ⊗ riG) = (curlFe−1
)T, (2.3)
where Fe is the elastic deformation gradient, the summation is over all active slipsystems and G is introduced for convenience.
In crystals with high degrees of symmetry, the geometrical constraints ondislocation density, imposed by the plastic slip gradient field, can be satisfiedwith many different dislocation configurations (Arsenlis & Parks 1999). This isthe well-acknowledged non-uniqueness problem. In crystals of such symmetry, thenumber of distinct dislocation types may exceed the nine independent componentsof the Nye tensor, hence a unique solution for the dislocation density maynot be possible. Therefore, the GND density may be obtained only by solvingequation (2.3) with an imposed constraint such as minimization of stored energyor dislocation line length, for example.
Here, we address the problem for hcp crystals for which slip occurs on basal,prismatic and pyramidal slip systems, as shown in figure 1, in which the usualconvention of a single slip direction associated with a given slip system is assumed.a-type slip occurs on the basal, prismatic and a-pyramidal slip systems, whilec + a-type slip occurs on the primary (first order) and secondary (second order)
Proc. R. Soc. A

Deformation, lattice rotation and GNDs 5
on May 3, 2018http://rspa.royalsocietypublishing.org/Downloaded from
a1
a2
a3
c
basal <a>, 3
a1
a2
a3
c
prismatic <a>, 3
a1
a2
a3
c
pyramidal <a>, 6
a1
a2
a3
c
a1
a2
a3
c
1st order pyramidal <c + a>, 12 2nd order pyramidal <c + a>, 6
(a) (b) (c)
(d) (e)
Figure 1. HCP slip systems (courtesy of Hasija et al. 2003).
c + a-pyramidal slip systems as shown in figure 1. The Burger vector magnitudesbi for a-type slip (bi
a) and c + a-type slip (bia) differ by the c/a ratio. Similarly,
the CRSS required to initiate slip on the a-type (tac ) and c + a-type (tc+a
c ) slipsystems differs. Experimental observations show that c + a-type slip may occurat a resolved shear stress of 2.5–3.0 times that for a-type slip (Gong & Wilkinson2009). G in equation (2.3) is then written as
Na∑i=1
(riet
i ⊗ bia + ri
ssi ⊗ bi
a) +Nc∑i=1
(riet
i ⊗ bic + ri
ssi ⊗ bi
c) = G, (2.4)
where the first and second terms on the left-hand side of equation (2.4) arethe contribution to the dislocation content from a-type and c + a-type slip,respectively, and Na and Nc are the corresponding number of active slip systems,so that the total number of active slip systems N is given as N = Na + Nc. ti
is defined from the slip direction si and normal ni as ti = si × ni . Dependingon the active slip systems, the available number of screw-type systems varies.The maximum number of screw-type dislocation systems for the hcp crystaltype is nine, if dislocations of opposite sign are not differentiated. The numberof edge-type dislocation systems is always equal to the number of active slipsystems N .
Proc. R. Soc. A

6 F. P. E. Dunne et al.
on May 3, 2018http://rspa.royalsocietypublishing.org/Downloaded from
Once the active edge- and screw-type systems have been established, equations(2.3) and (2.4) may be written as a linear set of equations Ax = b in whichA(m, n) has dimension m = 9 and n = ne + ns, where ne and ns are the numberof edge types (ne = N ) and screw types, respectively. This gives a problem of(m = 9) linear equations with (n) unknowns. n may be such that n ≤ m or n > mdepending on the number of active slip systems.
For the screw components, a scheme has to be adopted to enable the screwdensity component for a given slip direction to be shared among the activeslip systems having the corresponding slip direction. In this case, the sharingis performed linearly among the systems according to their activity, where theextent of activity h for slip system i is defined as hi = ti/ti
c—a slip systemis not active if hi < 1. For example, if three systems 1, 2 and 3 have thesame slip direction and have extents of activity h1 ≥ 1, h2 ≥ 1 and h3 < 1,and if the screw density obtained for this slip direction is rs, then the screwdensities on the three slip systems are r1
s = rsh1/(h1 + h2), r2
s = rsh2/(h1 + h2)
and r3s = 0.
Arsenlis & Parks (1999) suggested two ways of solving the non-uniquenessproblem, one geometrically and the other energetically motivated. These involveminimizing L1 or L2, which are defined as follows by Kysar et al. (2010):
L1 =N∑
i=1
|riwi| and L2 =[
N∑i=1
[riwi]2]1/2
, (2.5)
where the w are possible weightings. Britton et al. (2010b) used the energy-motivated linear programming scheme to calculate GND densities from measured(i.e. experimental) curvatures using Matlab. The least-squares scheme minimizesthe sum of squares of the resulting dislocation densities. It is a special case of theL2 minimization for which w = 1. For the minimization, the Lapack libraries maybe used or the same result can be achieved via the Moore–Penrose pseudo-inverse.Whatever the choice, one obtains the exact solution to Ax = b for m ≥ n. The casefor m < n gives the solution to min (‖Ax − b‖2), and if there are multiple suchsolutions, then the solution ‖x‖2 is returned. Geometrically, this means finding theshortest possible dislocation line lengths. In the present work, the least-squaresscheme has been implemented into the CPFE code. Arsenlis & Parks (1999) arguethat the differences between this approach and the linear programming schemeare likely to be small. Kysar et al. (2010), however, show that differences canbecome significant under conditions of plane strain.
Finally, the evaluation of G from the curl terms in equation (2.3) is carried outas any other continuum variable within the finite element method with the addeddifficulty of accuracy for terms, which are second derivatives of displacements.The theoretical problem of interpreting G at boundaries (e.g. a grain boundary)crucially depends on length scale, but, within the continuum-level state variableapproach, all variables, including G, are considered continuum, and a grainboundary is simply being represented as a boundary between two regions ofdiffering crystallographic orientation. Interpretation of G (or indeed any othercontinuum quantity) at a grain or other boundary must therefore be carried outwith full cognizance of these assumptions.
Proc. R. Soc. A

Deformation, lattice rotation and GNDs 7
on May 3, 2018http://rspa.royalsocietypublishing.org/Downloaded from
3. Crystal plasticity analysis of hcp single and polycrystal geometricallynecessary dislocation development
In this section, we analyse the development of geometrically necessary dislocationswithin an hcp Ti alloy polycrystal using the GND-coupled crystal plasticityformulation described earlier. We then compare the results obtained with thosefrom independent experimental observations (Britton et al. 2010b), in particularaddressing the GND generation during deformation on the various hcp a- andc + a-type slip systems.
The material considered is taken to be a near-a polycrystal Ti alloy. Thematerial properties arising in the slip rule in equation (2.1) are detailed inappendix A, in which the a- and c + a-type systems are differentiated whereappropriate (a c/a ratio of 1.593 is used). The CRSSs for Ti have been obtainedfrom micro-mechanical bend tests (Gong & Wilkinson 2009), and the activationenergy chosen to ensure that uniaxial stress–strain behaviour resulting fora polycrystal sample under strain-controlled loading is reproduced, includingthe moderate strain-rate sensitivity observed in these materials even at roomtemperature (Dunne et al. 2007c), and g0 has been fixed for simplicity to gi
0 = bi/dfor slip system i, where d is a characteristic length set to be the average grainsize of 30 mm. Burger vector magnitudes, frequency of dislocation jumps andinitial density of SSDs are obtained from standard property data and includedin appendix A. Briefly, before considering polycrystal behaviour, we apply thecrystal model above for the purposes of validation to a simple problem; namely asingle-crystal beam subjected to four-point bending in order to produce a linearvariation of plastic strain and hence develop a constant GND density field ofknown slip activity.
(a) Four-point bending
A four-point single-crystal bending analysis provides a validity test of themodel because of the known form of the strain and stress fields developed betweenthe loading points. The linear variation of strain through the beam sectionis anticipated to lead to a constant plastic strain gradient and consequentlyGND density within the plastic zone. The (single) crystal orientation is specifiedsuch that the c-axis is normal to the beam axis, so that prismatic slip only isanticipated. The HCP single-crystal beam, with dimensions of 200 × 20 × 20 mm,is supported and loaded (under displacement control) at distances of 0.5 h and2 h, respectively, from the end, where h is the height of the beam. A deflection of2 mm is applied, and the beam is constrained in the z-direction such that a stateof plane strain is imposed.
The GND density was found to be constant through the thickness in the plasticregime in the pure bending region. This is expected because the plastic strainsare linear through the thickness so that the GND density, which is derived fromtheir gradients, would be expected to be constant. The magnitudes in the purebending section of the beam are within the expected range. Fleck et al. (1994) gavea one-dimensional single slip approximation for the density of GNDs as follows:
rG = 1b
vg
vx. (3.1)
Proc. R. Soc. A
8 F. P. E. Dunne et al.
on May 3, 2018http://rspa.royalsocietypublishing.org/Downloaded from
SDV10(avg: 75%)
(a)
y
xz
(b)
+6.378e–01+3.000e–01+2.500e–01+2.000e–01+1.500e–01+1.000e–01+5.000e–02–7.451e–09–5.000e–02–1.000e–01–1.500e–01–2.000e–01–2.500e–01–3.000e–01
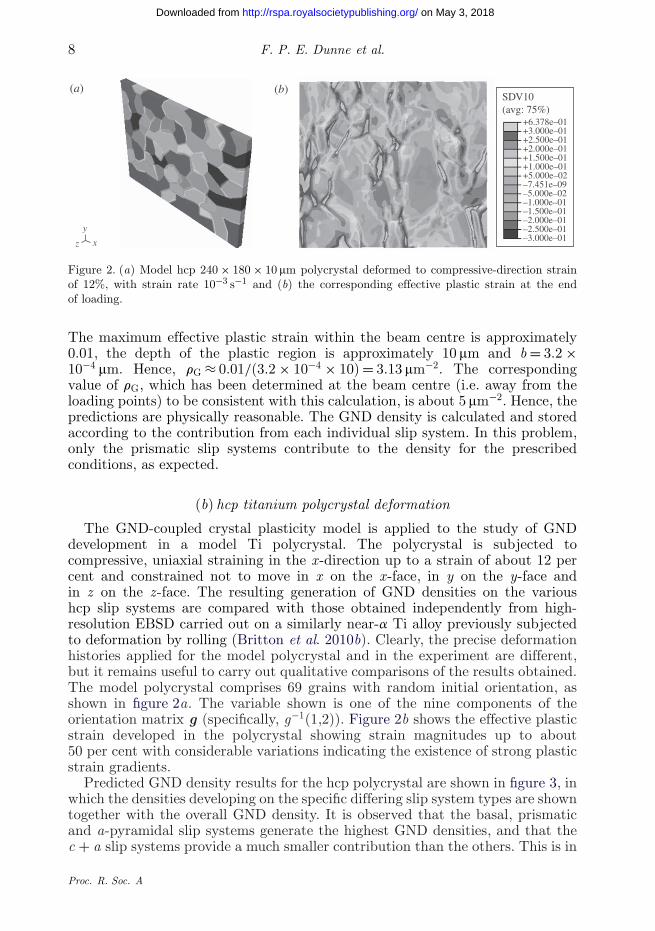
Figure 2. (a) Model hcp 240 × 180 × 10 mm polycrystal deformed to compressive-direction strainof 12%, with strain rate 10−3 s−1 and (b) the corresponding effective plastic strain at the endof loading.
The maximum effective plastic strain within the beam centre is approximately0.01, the depth of the plastic region is approximately 10 mm and b = 3.2 ×10⁻⁴ mm. Hence, rG ≈ 0.01/(3.2 × 10−4 × 10) = 3.13 mm−2. The correspondingvalue of rG, which has been determined at the beam centre (i.e. away from theloading points) to be consistent with this calculation, is about 5 mm−2. Hence, thepredictions are physically reasonable. The GND density is calculated and storedaccording to the contribution from each individual slip system. In this problem,only the prismatic slip systems contribute to the density for the prescribedconditions, as expected.
(b) hcp titanium polycrystal deformation
The GND-coupled crystal plasticity model is applied to the study of GNDdevelopment in a model Ti polycrystal. The polycrystal is subjected tocompressive, uniaxial straining in the x-direction up to a strain of about 12 percent and constrained not to move in x on the x-face, in y on the y-face andin z on the z-face. The resulting generation of GND densities on the varioushcp slip systems are compared with those obtained independently from high-resolution EBSD carried out on a similarly near-a Ti alloy previously subjectedto deformation by rolling (Britton et al. 2010b). Clearly, the precise deformationhistories applied for the model polycrystal and in the experiment are different,but it remains useful to carry out qualitative comparisons of the results obtained.The model polycrystal comprises 69 grains with random initial orientation, asshown in figure 2a. The variable shown is one of the nine components of theorientation matrix g (specifically, g−1(1,2)). Figure 2b shows the effective plasticstrain developed in the polycrystal showing strain magnitudes up to about50 per cent with considerable variations indicating the existence of strong plasticstrain gradients.
Predicted GND density results for the hcp polycrystal are shown in figure 3, inwhich the densities developing on the specific differing slip system types are showntogether with the overall GND density. It is observed that the basal, prismaticand a-pyramidal slip systems generate the highest GND densities, and that thec + a slip systems provide a much smaller contribution than the others. This is in
Proc. R. Soc. A

Deformation, lattice rotation and GNDs 9
on May 3, 2018http://rspa.royalsocietypublishing.org/Downloaded from
SDV31(avg: 75%)
+5.620e+00+3.000e+00+2.500e+00+2.000e+00+1.500e+00+1.000e+00+5.000e–01+0.000e+00–5.000e–01–1.000e+00–1.500e+00–2.000e+00–2.500e+00–3.000e+00
(a) (b)
(c) (d)
(e) (f)
Figure 3. Predicted GND densities (mm−2) in the model Ti polycrystal shown in figure 2 at anapplied strain of 12% on the following slip systems: (a) overall density, (b) basal, (c) prismatic,(d) a-pyramidal, (e) c + a pyramidal (primary) and (f ) c + a pyramidal (secondary).
good qualitative agreement with experiments reported by Britton et al. (2010b)and A. J. Wilkinson, B. Britton & P. Littlewood (2009, personal communication),who carried out a statistical analysis of their experimental results detailing the(normalized) frequencies of GNDs by slip system type, and these results arereproduced in figure 4 together with an equivalent analysis of the predictedresults. The model polycrystal analysis also enables the evolutions of the GNDstatistics to be obtained, and these are shown in figure 5 at four levels of strainthrough the loading history.
It can be seen that the predicted and experimental results show GND densitiesfor c + a-type slip to be an order of magnitude lower than those for a-type.During deformation, predictions show that GND densities progressively increase,
Proc. R. Soc. A

10 F. P. E. Dunne et al.
on May 3, 2018http://rspa.royalsocietypublishing.org/Downloaded from
0.5(a) (b)
0.4
0.3
no. p
oint
s
0.2
0.1
09 10 11 12
log (GND density)
13 14 15 16
experimental resultsnumerical results
9 10 11 12
log (GND density)
13 14 15 16
c + a pyramc + a screwa pyrama prisma basala screw
c + a pyramc + a screwa pyrama prisma basala screw
Figure 4. (a) Predicted and (b) experimental distributions of GND densities (m−2) on the slipsystems indicated for the model Ti polycrystal. The horizontal axis is logarithmic (base 10). Thevertical axes show normalized frequency of occurrences of given density within the microstructure.
0.5(a)
0.4
0.3
no. p
oint
s
0.2
0.1
0
numerical results (b) numerical results
0.5(c)
0.4
0.3
no. p
oint
s
0.2
0.1
09 10 11 12
log (GND density)
13 14 15 16
numerical results (d)
9 10 11 12
log (GND density)
13 14 15 16
numerical results
c + a pyramc + a screwa pyrama prisma basala screw
c + a pyramc + a screwa pyrama prisma basala screw
c + a pyramc + a screwa pyrama prisma basala screw
c + a pyramc + a screwa pyrama prisma basala screw
Figure 5. Predicted evolution of distributions of GND densities (m−2) on the slip systems indicatedfor the model Ti polycrystal at overall applied strains of (a) 3.2%, (b) 5.6%, (c) 8.0% and (d) 10.4%.
Proc. R. Soc. A

Deformation, lattice rotation and GNDs 11
on May 3, 2018http://rspa.royalsocietypublishing.org/Downloaded from
as does the material volume over which GND activity occurs. Both experimentaland predicted results show that the distribution of dislocation densities foreach slip system type is in effect skewed normal. The experimental data showmore significant c + a GND activity than is observed in the predictions. Bothexperiment and model show that a-pyramidal edge dislocations are the dominanttype. The a-screw dislocations appear significant too, but it should be noted thatthey include all screw contributions from all a-slip systems: a-pyramidal, basaland prismatic systems. Basal and prismatic systems contribute by about the sameamount in both the experimental data and predictions. The histograms show thatthe predicted GND densities fall within the physically expected range reportedin the literature and as shown in the experimental results.
(c) Discussion of titanium model and experiment
In computing the GND density from the experimentally measured curvatures(Britton et al. 2010b), it was assumed that all slip systems were active, so that,in the density calculation, the number of unknowns (the densities) was alwaysassumed to be higher than in reality. In the crystal plasticity model, only theactive slip systems are accounted for. This potentially provides an explanationfor the observation that the c + a coverage is higher for the experimental resultsthan that from the predictions. During deformation, the texture changes in sucha way as to become less favourable for c + a slip. This change is not capturedby assuming all systems are always active, as in the experimental analysis.In addition to the above, in the crystal model, there is full knowledge of thestrain gradients (i.e. all the nine components of Nye’s tensor are known); inthe experiment, only six of the nine components can be obtained (Britton et al.2010b) and the assumption of plane stress has to be made. No such assumptionor approximation is needed in the modelling.
An unexpected result is the dominance of the a-pyramidal slip in contributingto the GND density. In a separate numerical test, it was observed that ifa-pyramidal systems are assigned the same CRSS as the c + a pyramidals thenthey would rarely become activated. Energy considerations make it reasonablethat they should have a similar CRSS to that of the basals and prismatics, andthis is what has been assumed in the current modelling. The greater influence,therefore, of the a-pyramidals over the prismatic or basal systems may be dueto the fact that a-pyramidal slip can more readily be activated for orientationssuitable for both basal and prismatic slip, so that slip is possible over a widerrange of crystal orientations than for either of basal or prismatic slip.
A discussion of GND density is incomplete without reference to the lengthscale over which such gradients are measured. Kysar et al. (2010) argue thatit is necessary to choose a characteristic length scale for the volume underconsideration, so that the calculated value of the geometrically necessarydislocation density converges to a meaningful value. In the experiments, the pixel(point) size is 0.28 mm, whereas the characteristic element size in the simulationis 4 mm. The finite element resolution-related size effect was checked by Mayamaet al. (2009), who studied the organization of the GND structure in an fcc bicrystalsubjected to cyclic loading. Their results showed that a higher mesh resolutionled to a higher predicted GND density but qualitatively the spatial distributionwas not affected.
Proc. R. Soc. A

12 F. P. E. Dunne et al.
on May 3, 2018http://rspa.royalsocietypublishing.org/Downloaded from
In §4, we address GND development in an fcc nickel system and provide moredetailed and quantitative assessments of micro-strain, lattice rotation, curvatureand GND density by means of detailed comparisons with experiments.
4. Crystal plasticity analysis of fcc single-crystal nickel containing acarbide particle
The material studied is a directionally solidified nickel alloy provided by Rolls-Royce plc. Samples of dimensions 13.5 × 3 × 3 mm were cut from the stockprovided and subjected to an initial heat treatment of 1100◦C for 1 h followed byageing at 870◦C for 16 h. This solutionizing and ageing process was applied twiceand resulted in significant grain growth, and subsequent EBSD analysis revealedthat in fact single-crystal samples had been obtained containing carbide particlesof various sizes up to approximately 30 mm. EBSD also enabled determinationof the crystallographic orientation and, in the sample studied here, it was foundto be f1 = 83.5◦, f = 91.5◦, f2 = 0◦ in Bunge notation. Following cooling from870◦C, high-resolution EBSD was again used in order to quantify the elasticstrain distributions that resulted from the mismatch in thermal expansivities ofthe nickel single-crystal material and the carbide particle. Full details of the EBSDtechnique and the determination of the full strain field tensor components, latticerotations and GND density may be found in Karamched & Wilkinson (2011). Theparticular particle/matrix combination to be studied is shown in figure 6a. In theexperimental study, the samples were subsequently also subjected to four-pointbend tests, but we confine ourselves in this paper to the thermal loading problemfor the specific particle/matrix combination shown in figure 6a. An advantageof analysing such a system is that, in many respects, it becomes pseudo-two-dimensional in that there is no (or little) variation of crystallographic orientationthrough the depth. In addition, because it is single crystal, the often-encounteredissue of three-dimensional polycrystal surface measurements is largely eliminated,though the potential variation of the particle geometry through the thickness ofthe sample remains.
The corresponding geometrical finite element representation of the problem isshown in figure 6b, in which the carbide particle extends through the thicknessof the model. A full three-dimensional model is developed comprising 11 00020-noded quadratic three-dimensional finite elements, and results obtained fromthe front, free-surface are representative of those for a state of plane stress. Thesame assumption has been used in order to determine the full strain tensor fromthe EBSD analysis. In the finite element model, the boundaries are all assumedto be free, though analysis has shown that changing the conditions (e.g. suchthat all planar boundaries remain so) has limited impact on results obtainedlocal to the particle, which are those of interest here. The thermal loading isapplied in the model as shown in figure 7a. The temperature range imposed isidentical to that in the experiments, but the time scale used in the modellingis arbitrary because, although the crystal model incorporates rate sensitivity,these effects are likely to be negligibly small because, for most of the cooling, thematrix material behaviour remains elastic. It is only at the end of the coolingprocess that the thermal strains developed are large enough to cause the onsetof plasticity.
Proc. R. Soc. A

Deformation, lattice rotation and GNDs 13
on May 3, 2018http://rspa.royalsocietypublishing.org/Downloaded from
(a) (b)
Figure 6. (a) EBSD image of nickel alloy single-crystal matrix containing a large carbide particlesubjected to thermal loading and (b) the corresponding three-dimensional crystal plasticity finiteelement model.
SDV10(avg: 75%
+7.157e–02+1.500e–02+1.250e–02+1.000e–02+7.500e–03+5.000e–03+2.500e–03+0.000e+00–2.500e–03–5.000e–03–7.500e–03–1.000e–02–1.250e–02–1.500e–02
tem
p. (
°C)
1.0time (s)
870
20
(a) (b)
Figure 7. (a) The temperature history to which the Ni particle/matrix have been subjected and(b) the resulting predicted accumulated plastic strains that develop local to the particle but withinthe Ni single-crystal matrix.
The values of the material properties for the nickel alloy studied, includingthe thermal expansivities of the single-crystal nickel and the carbide, aregiven in appendix A. The carbide particle is assumed, reasonably, to deformelastically only.
In the slip rule in equation (2.1), the density of GNDs is coupled throughthe activation volume term DV such that any increase in GND density impactsdirectly on the slip rate. In the analyses presented later, results are obtained inusing the fully coupled slip rule and also the case in which the GND density isdecoupled. That is, for the decoupled analysis, in equation (2.1), while the GNDdensity is calculated, rgnd is taken to be zero in the slip rule. The GND density forthe fcc nickel system is determined for each active and independent slip system,taking full account of the edge or screw nature of the dislocation. The techniquesused are described in §2a.
Proc. R. Soc. A

14 F. P. E. Dunne et al.
on May 3, 2018http://rspa.royalsocietypublishing.org/Downloaded from
(a) Strain, lattice rotation and geometrically necessary dislocation densityanalyses of nickel sample
On cooling the particle/Ni matrix material from 870◦C to 20◦C, the mismatchin thermal expansivity between the single-crystal matrix and carbide particleleads to the establishment of thermal strains and hence stresses. In fact, thedifference in expansivity (see appendix A) is large enough, given the temperaturechange, to cause the development of plastic strains local to the particle. Theextent of the predicted plastic straining, obtained from the CPFE modelling,is shown in figure 7b. As a result of the heterogeneous nature of the particlegeometry, quite considerable variations and indeed gradients in plastic straindevelop and it is therefore anticipated that corresponding variations in latticerotation and GND development will as a result be observed. An importantobjective of this paper is to establish to what extent the detailed experimentalobservations can be captured accurately by the gradient-enhanced crystal modelpresented above. In figure 8, the results of high-resolution EBSD to determinethe elastic strains local to the particle, on the material-free surface, are shown(figure 8a–c) together with the corresponding CPFE results (figure 8d–f ). Thecolour scale bars in figure 8 relate to the experimental measurements, and thereis no one-to-one correspondence with the colour scales in the predicted elasticstrains. In the latter, the range of strain has been chosen to show to besteffect the calculated strain distributions, therefore providing, firstly, a qualitativecomparison with the measurements. Note that EBSD lattice distortion androtation measurements, and hence strains, are not possible within the carbideparticle. Accordingly, predicted strains within the carbide are not shown in thefield plots. Quantitative comparison is presented shortly. The thermal strainsdeveloped are, in the absence of geometrical constraint, dilatational in nature,and are not therefore captured in the EBSD-determined strain fields. Hence, inorder to compare like with like, in the calculated results, the purely dilatationalstrain has been subtracted from the total (for the direct components; this is notnecessary for the shear strains) in order to give the differential strains. In addition,the EBSD-measured strains are, of course, the elastic strains so that again, inensuring we compare like with like, the plastic strains have been removed fromthe total strain components in order to give just the elastic strains. Comparisonof the figures indicates good agreement in a qualitative sense between measuredand predicted elastic strains. Figure 9 shows the experimentally measuredand predicted in-plane lattice rotations. Again, good qualitative agreement isobserved. Note that the high-resolution EBSD technique allows a resolutionof lattice rotation of approximately 2 × 10⁻⁴ radians (Wilkinson et al. 2006),corresponding to about ±0.01◦.
In order to carry out a more quantitative assessment, two lines have beenintroduced in figure 6a. All the elastic strain components and lattice rotationsalong the vertical and horizontal lines have been extracted from both theexperimental measurements and CPFE model predictions and are shown infigure 10a–h. It is apparent that there are some aspects of the strain and latticerotations which are in good agreement but clearly others for which this is notthe case. For example, the direct strains along the vertical line in figure 10a,care found to be significantly over-predicted in magnitude, particularly very closeto the particle. In contrast, along the horizontal, the predicted xx elastic strainsare under-predicted close to the particle. Some of the shear strain distribution
Proc. R. Soc. A

Deformation, lattice rotation and GNDs 15
on May 3, 2018http://rspa.royalsocietypublishing.org/Downloaded from
0.01(a) (d)
(b) (e)
(c) (f )
e11
e22
e12
0.005
0
–0.005
–0.01
0.01
0.005
–0.005
–0.01
0.01
0
0.005
–0.005
–0.01
0
Figure 8. Field plots of components (as indicated) of elastic strains (a–c) experimentally determinedand (d–f ) those predicted from the crystal plasticity finite element model. There is no directcorrespondence of colour.
(a) (b)w12
0.01
0.005
0
–0.005
–0.01
Figure 9. Field plots of components (as indicated) of lattice rotations (a) experimentally determinedand (b) those predicted from the crystal plasticity finite element model. There is no directcorrespondence of colour.
Proc. R. Soc. A

16 F. P. E. Dunne et al.
on May 3, 2018http://rspa.royalsocietypublishing.org/Downloaded from
–0.004–0.002
00.0020.0040.0060.0080.010
(a) (b)
(c) (d)
(e)(f )
(g) (h)
0 10 20 30 40
stra
in x
x
–0.006
–0.005
–0.004
–0.003
–0.002
–0.001
0
0.001
0 5 10 15 20 25 30
0
0.0005
0.0010
0.0015
0.0020
0.00250.0030
0 5 10 15 20 25 30
0
0.002
0.004
0.006
0.008
0 10 20 30 40
stra
in y
y
–0.004–0.003–0.002–0.001
00.0010.0020.0030.0040.0050.0060.007
0 10 20 30 40
stra
in x
y
0
0.0005
0.0010
0.0015
0.0020
0.0025
0 5 10 15 20 25 30
00.0010.0020.0030.0040.0050.0060.0070.0080.009
0 5 10 15 20 25 30
0.005
0.010
5 10 15 20 25 30 35 40
latti
ce r
otat
ion
(rad
)
vertical position (mm)
horizontal position (mm)
–0.002
–0.004
verticalposition (mm)
–0.0005
–0.0010 horizontal position (mm)
vertical position (mm)–0.0005
–0.0010 horizontal position (mm)
0
–0.005
–0.010
–0.015
–0.020vertical position (mm) –0.001
–0.002 horizontal position (mm)
Figure 10. Graphs showing crystal plasticity finite element calculations and experimental EBSDmeasurements for the nickel/particle system subject to thermal loading. Results are shown alongthe vertical and horizontal lines given in figure 6a as follows: elastic strains xx along (a) the verticaland (b) the horizontal line; elastic strains yy along (c) the vertical and (d) the horizontal line; andelastic shear strains xy along (e) the vertical and (f ) the horizontal line; lattice rotations uxy along(g) the vertical and (h) the horizontal line. (a–h) Cross symbols, expt; filled square, CPFE.
characteristics are captured, others are clearly not. Lattice rotations, however,shown in figure 10g,h are quite well captured by the model in both magnitudeand distribution along the two lines shown in figure 6a. A particular implicationof this is for the CPFE model predictions for the GND densities, which are
Proc. R. Soc. A

Deformation, lattice rotation and GNDs 17
on May 3, 2018http://rspa.royalsocietypublishing.org/Downloaded from
14.5
14.0
13.5
13.0
12.5
(a) (b)
Figure 11. Field plots of density of geometrically necessary dislocations (a) experimentallydetermined and (b) those predicted from the crystal plasticity finite element model. The rangeis the same for both figures but there is no direct correspondence of colour.
20
40
60
80
100
120
0 5 10 15 20 25 30 35 40 0 5 10 15 20 25 30
GN
D d
ensi
ty (m
m–2
)
vertical position (mm) horizontal position (mm)
Figure 12. Graphs showing crystal plasticity finite element calculations and experimental EBSDmeasurements for the nickel/particle system subject to thermal loading. Total GND density isshown along the (a) vertical and (b) horizontal lines given in figure 6a. See text for interpretingexperimental data. (a,b) Cross symbols, expt and filled square, CPFE.
measured directly from the gradients of the lattice rotations. The predictedGND density distribution developed as a result only of the thermal excursionis shown in figure 11 together with that determined from EBSD measurementstaken from the sample-free surface. Again, reasonable qualitative agreement isobtained but a more quantitative comparison is shown in figure 12, in which,again, the variation of the experimentally determined and CPFE-predicted GNDdensities along the vertical and horizontal lines shown in figure 6a are given. Here,reasonable agreement can be seen in terms of both GND density magnitude andthe expected nature of the distribution.
(b) Comparison between the geometrically necessary dislocation coupled anduncoupled models
It is sometimes argued in the literature that the coupling between the evolvingGND density and its effect on subsequent plastic slip is crucial in ensuring
Proc. R. Soc. A
18 F. P. E. Dunne et al.
on May 3, 2018http://rspa.royalsocietypublishing.org/Downloaded from
the accuracy of crystal plasticity predictions. It is therefore of interest to testthis assertion particularly in the light of the quality (or otherwise!) of gradient-enhanced CPFE predictions and their comparison with experimental data at amicro-mechanical level. Hence, the CPFE analysis of the particle thermal problemdiscussed earlier has been repeated but, on this occasion, the GND coupling withthe slip rate shown in equation (2.1) is removed. That is, the GND density iscalculated from equation (2.3) just as it was in the earlier analysis, but this is notreflected in the slip rule in which, now, the activation volume, DV , is assumedto be constant and unaffected by the GND density such that its value remainsfixed at
DV = b2lp = b2√j(rim
ssd + rgnd)= b2√
jrimssd
, (4.1)
where the terms take the values previously used and given in appendix A. Thus,the results obtained are those for a conventional crystal plasticity formulationas opposed to one which is gradient enhanced. The comparisons of the resultsobtained for the elastic shear strains, lattice rotations and effective plastic strainsalong the vertical and horizontal lines shown in figure 6a for the Ni singlecrystal/particle material are given in figure 13a–f .
The elastic shear strains are shown in figure 13a,b, and, interestingly, thedifferences observed for the coupled and uncoupled analyses are really quite small.The lattice rotations, however, particularly those close to the particle/matrixinterface, do show quite substantial differences (almost a factor of 2) from thecoupled model, predicting substantially smaller rotations at the interface. Theexperimentally measured lattice rotations at the interface, shown in figure 10g,h,are in fact much closer to the coupled predictions than the uncoupled modelresults, and this suggests that the GND coupling is important for lattice rotation(and hence GND density) determination at locations of significant heterogeneity,e.g. at grain boundaries, triple points and so forth. It has long been arguedthat conventional crystal plasticity has been successful at capturing bulk graindeformation but has been shown to be problematic at grain boundaries (e.g.Kalidindi et al. 2004). The results presented here provide direct evidence thatgradient effects at locations of considerable heterogeneity do at least contributeto some of the differences observed in the past.
Figure 13e,f shows the distributions of effective plastic strain in which theeffect of the coupling can be seen to reduce the size of the highest plasticstrains while the region containing plastic deformation is slightly increased in size,particularly close to the particle/matrix interface. This, of course, is the location,from figures 11 and 12, at which the highest density of GNDs is seen to developand naturally, through the slip rule coupling, this inhibits subsequent plasticitydevelopment relative to the uncoupled model. Quite substantial differences inmagnitudes of plastic strain can be seen to be obtained from the two modelsindicating that at regions of heterogeneity, conventional crystal plasticity is likelyto overestimate the extent of plasticity.
(c) Discussion of nickel model and experiments
In this paper, we have attempted to provide detailed comparisons of the resultsof gradient-enhanced crystal plasticity predictions with EBSD measurements in a
Proc. R. Soc. A

Deformation, lattice rotation and GNDs 19
on May 3, 2018http://rspa.royalsocietypublishing.org/Downloaded from
–1.5 ¥ 10–3
–1.0 ¥ 10–3
–0.5 ¥ 10–3
0
0.5 ¥ 10–3
1.0 ¥ 10–3
1.5 ¥ 10–3
2.0 ¥ 10–3
2.5 ¥ 10–3
10 20 30
horizontal position (mm)
–0.2 ¥ 10–2
–0.4 ¥ 10–2
0
0.2 ¥ 10–2
0.4 ¥ 10–2
0.6 ¥ 10–2
0.8 ¥ 10–2
1.0 ¥ 10–2
1.2 ¥ 10–2
10 20 30
horizontal position (mm)
–0.0020
0.0020.0040.0060.0080.0100.0120.0140.0160.0180.020
10 20 30
horizontal position (mm)
–4 ¥ 10–3–3 ¥ 10–3–2 ¥ 10–3–1 ¥ 10–3
01 ¥ 10–32 ¥ 10–33 ¥ 10–34 ¥ 10–35 ¥ 10–36 ¥ 10–37 ¥ 10–3
10 20 30 40
stra
in x
y
vertical position (mm)
–5 ¥ 10–2
–4 ¥ 10–2
–3 ¥ 10–2
–2 ¥ 10–2
–1 ¥ 10–2
0
1 ¥ 10–2
10 20 30 40
latti
ce r
otat
ion
xy
vertical position (mm)
10 20 30 40
effe
ctiv
e pl
astic
str
ain
0
0.005
0.010
0.015
0.020
0.025
0.030
0.035
0.040
0.045
vertical position (mm)
(a) (b)
(c) (d)
(e) (f )
Figure 13. Graphs showing crystal plasticity finite element calculations for the nickel/particlesystem subject to thermal loading for the case of GND density coupled and uncoupled with theslip rule. Results are shown along the vertical and horizontal lines given in figure 6a as follows:elastic shear strains xy (a) along the vertical and (b) the horizontal line; lattice rotations uxy (c)along the vertical and (d) the horizontal line; effective plastic strains (e) along the vertical and (f )the horizontal line. (a–f ) Solid line, coupled; dotted line, uncoupled.
model heterogeneous material system under thermal loading. GND effects are nowincluded in a large range of model analyses for crack nucleation and growth, forthe initiation of recrystallization and for the nucleation of twinning, for example.It is therefore of considerable importance to demonstrate that the quantities ofrelevance at the appropriate length scale are in fact being determined correctlyand ideally accurately. Hence, we have aimed to test the ability of gradient crystalplasticity at a particular microstructural heterogeneity.
Some of the observed differences in the measured and predicted resultsinevitably originate from the modelling assumptions made. For example, whilefree-surface modelling results have been compared appropriately with free-surface
Proc. R. Soc. A

20 F. P. E. Dunne et al.
on May 3, 2018http://rspa.royalsocietypublishing.org/Downloaded from
EBSD measurements, in the model, the particle is assumed prismatic subsurface;this is unlikely to be strictly the case in reality. In addition, in the experimental Nialloy material, while it is known that the carbide particles are well dispersed suchthat inter-particle effects are likely to be small, they cannot be eliminated and thepossibility always exists that additional particles, not visible in figure 6a, existbelow the free surface and unfortunately close to the analysed particle. Further,the matter of boundary conditions is always important in these analyses; theregion of the material (figure 6a) modelled in figure 6b is in fact contained within alarger material sample, and the correct boundary conditions are therefore difficultto reproduce. However, studies with various different boundary conditions showthat the effects close to the particle are in fact small.
In summary, we find that the prediction of elastic micro-straining isqualitatively reasonable but not completely accurate. Lattice rotations, however,and GND densities, are found to be better predicted, in a quantitative sense,by gradient-enhanced crystal plasticity and that conventional, non-gradientplasticity is likely to be more in error particularly where gradient effects areimportant at, for example, phase interfaces, grain boundaries and triple points.
There remains the important need to continue to challenge and to testthe abilities of crystal plasticity modelling techniques by means of detailedcomparison of predicted results with micro-mechanical testing at the appropriatelength scale. Only in this way can confidence in its use for problems of significancebe developed.
5. Conclusions
Existing numerical techniques that address the well-known non-uniquenessproblem have been developed for the particular use of hcp crystals in whichGND density is assumed to develop on all the active independent slip systems.A technique has been presented for accounting for the slip systems shared byscrew-type dislocations. GND density is fully coupled with the crystal slip ruleadopted.
Analyses have been carried out of a model near-a Ti polycrystal subjectto deformation. The development of GND densities on the hcp a- and c + a-type slip systems (basal, prismatic and pyramidal) has been compared withcorresponding experimental measurements. In particular, the model predictionthat a-type densities are an order of magnitude higher than c + a-type is entirelyin keeping with experimental observations. The predicted distribution of a-typebasal, prismatic and pyramidal as well as c + a-type pyramidal GND densities isfound to show reasonable agreement with experimental observations.
Crystal plasticity analyses carried out for a single-crystal fcc nickel alloycontaining a carbide particle under thermal loading show that plastic strainingoccurs local to the carbide–nickel interface, leading to the development ofplastic strain gradients and densities of geometrically necessary dislocations.Quantitative comparisons of predicted results with those from high-resolutionEBSD show that micro-strain and lattice rotation distributions are reasonablywell captured, as are the distributions of GNDs. Coupling of the GND densitywith the crystal slip rule has been shown to be important in locations of highheterogeneity (such as phase interfaces, grain boundaries, triple points) where
Proc. R. Soc. A

Deformation, lattice rotation and GNDs 21
on May 3, 2018http://rspa.royalsocietypublishing.org/Downloaded from
lattice rotations and strains can be significantly in error if gradient effectsare neglected.
We are grateful to the Engineering and Physical Sciences Research Council (grant no.EP/C509870/1), and Rolls-Royce plc for financial support.
Appendix A. Material properties
(a) Slip rule
tc rmssd = rim
ssd(MPa) b (mm) k (JK−1) DF (J) n (s−1) (mm−2) g0 j
Ti: a-slip 200 3.2 × 10⁻⁴ 1.38 × 10⁻²³ 3.456 × 10⁻²⁰ 1.0 × 10¹¹ 0.05 8.33 × 10⁻⁶ 1.5 × 10⁻⁴
c + a-slip 500 5.1 × 10⁻⁴ — — — — — —Ni 230 3.5 × 10⁻⁴ 1.38 × 10⁻²³ 3.456 × 10⁻²⁰ 1.0 × 10¹¹ 0.05 8.33 × 10⁻⁶ 1.5 × 10⁻⁴
(b) Elastic moduli
Ti: E11 = 104 GPa; E33 = 143 GPa; G13 = 47 GPa; v12 = 0.48; v13 = 0.2Nickel single crystal: E = 207 GPa; n = 0.28Carbide particle: E = 2070 GPa; n = 0.28
(c) Thermal expansivities
Nickel single crystal: 20 ≤ q◦C ≤ 800; 13.0 × 10⁻⁶ ≤ a◦C−1 ≤ 15.0 × 10⁻⁶
Carbide particle: 20 ≤ q◦C ≤ 800; a = 4.5 × 10⁻⁶ ◦C−1
References
Acharya, A. & Bassani, J. 2000 Lattice incompatibility and a gradient theory of crystal plasticity.J. Mech. Phys. Solids 48, 1565–1595. (doi:10.1016/S0022-5096(99)00075-7)
Arsenlis, A. & Parks, D. M. 1999 Crystallographic aspects of geometrically-necessary andstatistically stored dislocation density. Acta Metall. Mater. 47, 1597–1611. (doi:10.1016/S1359-6454(99)00020-8)
Bache, M. R. & Dunne, F. P. E. 2010 Experimental and crystal plasticity studies of deformation andcrack nucleation in a titanium alloy. J. Strain Anal. 45, 391–399. (doi:10.1243/03093247JSA594)
Britton, T. B., Liang, H., Dunne, F. P. E. & Wilkinson, A. J. 2010a The effect of crystal orientationon the indentation response of commercially pure titanium: experiments and simulations. Proc.R. Soc. A 466, 695–719. (doi:10.1098/rspa.2009.0455)
Britton, T. B., Birosca, S., Preuss, M. & Wilkinson, A. J. 2010b Electron backscatter diffractionstudy of dislocation content of a macrozone in hot-rolled Ti-6Al-4V alloy. Scr. Mater. 62, 639–642. (doi:10.1016/j.scriptamat.2010.01.010)
Cermelli, P. & Gurtin, M. E. 2001 On the characterisation of geometrically necessary dislocationsin finite plasticity. J. Mech. Phys. Solids 49, 1539–1568. (doi:10.1016/S0022-5096(00)00084-3)
Cheong, K. S. & Busso, E. P. 2006 Effects of lattice misorientations on strain heterogeneities infcc polycrystals. J. Mech. Phys. Solids 54, 671–689. (doi:10.1016/j.jmps.2005.11.003)
Cheong, K. S., Busso, E. P. & Arsenlis, A. 2005 A study of microstructural length scale effects onthe behaviour of fcc polycrystals using strain gradient concepts. Int. J. Plast. 21, 1797–1814.(doi:10.1016/j.ijplas.2004.11.001)
Proc. R. Soc. A

22 F. P. E. Dunne et al.
on May 3, 2018http://rspa.royalsocietypublishing.org/Downloaded from
Dunne, F. P. E. & Rugg, D. 2008 On the mechanisms of fatigue facet nucleation in titanium alloys.Fatigue Fract. Eng. Mater. Struct. 31, 949–958. (doi:10.1111/j.1460-2695.2008.01284.x)
Dunne, F. P. E., Walker, A. & Rugg, D. 2007a A systematic study of hcp crystal orientation andmorphology effects in polycrystal deformation and fatigue. Proc. R. Soc. A 463, 1467–1489.(doi:10.1098/rspa.2007.1833)
Dunne, F. P. E., Wilkinson, A. & Allen, R. 2007b Experimental and computational studies oflow cycle fatigue crack nucleation in a polycrystal. Int. J. Plast. 23, 273–295. (doi:10.1016/j.ijplas.2006.07.001)
Dunne, F. P. E., Rugg, D. & Walker, A. 2007c Lengthscale-dependent, elastically anisotropic,physically-based HCP crystal plasticity: application to cold-dwell fatigue in Ti alloys. Int. J.Plast. 23, 1061–1083. (doi:10.1016/j.ijplas.2006.10.013)
Fleck, N., Muller, G. M., Ashby, M. F. & Hutchinson, J. W. 1994 Strain gradient plasticity: theoryand experiment. Acta Metall. Mater. 42, 475–487.
Gong, J. & Wilkinson, A. J. 2009 Anisotropy in the plastic flow properties of single-crystal alphatitanium determined from micro-cantilever beams. Acta Mater. 57, 5693–5705. (doi:10.1016/j.actamat.2009.07.064)
Hasija, V., Ghosh, S., Mills, M. J., Joseph, D. S. 2003 Deformation and creep modelling inpolycrystalline Ti-6Al alloys. Acta Mater. 51, 4533–4549. (doi:10.1016/S1359-6454(03)00289-1)
Kalidindi, S. R., Bhattacharyya, A., Doherty, R. D. 2004 Detailed analyses of grain-scale plasticdeformation in columnar polycrystalline aluminium using orientation image mapping and crystalplasticity models. Proc. R. Soc. Lond. A 460, 1935–1956. (doi:10.1098/rspa.2003.1260)
Karamched, P. S. & Wilkinson, A. J. 2011 High resolution electron back-scatter diffraction analysisof thermally and mechanically induced strains near carbide inclusions in a superalloy. ActaMater. 59, 263–272. (doi:10.1016/j.actamat.2010.09.030)
Kroner, E. 1960 Allgemeine kontinuumstheorie der versetzungen und eigenspannungen. Arch.Rational Mech. Anal. 4, 273–334.
Kysar, J., Saito, Y., Oztop, M., Lee, D. & Huh, W. 2010 Experimental lower bounds ongeometrically necessary dislocation density. Int. J. Plast. 26, 1097–1123. (doi:10.1016/j.ijplas.2010.03.009)
Lee, E. H. 1969 Elastic plastic deformation at finite strain. ASME J. Appl. Mech. 36, 1–6.Mayama, T., Ohashi, T. & Kondou, R. 2009 Geometrically necessary dislocation structure
organization in fcc bicrystal subjected to cyclic plasticity. Int. J. Plast. 25, 2122–2140.(doi:10.1016/j.ijplas.2009.02.001)
McDowell, D. L. & Dunne, F. P. E. 2010 Microstructure sensitive computational modellingof fatigue crack formation. Int. J. Fatigue 32, 1521–1542. (doi:10.1016/j.ijfatigue.2010.01.003)
Nye, J. 1953 Some geometrical relations in dislocated crystals. Acta Metall. 1, 153–162.(doi:10.1016/0001-6160(53)90054-6)
Roters, F., Eisenlohr, P., Hantcherli, L., Tjahjanto, D. D., Bieler, T. R. & Raabe, D. 2010Overview of constitutive laws, kinematics, homogenization and multiscale methods in crystalplasticity finite-element modeling: theory, experiments, applications. Acta Mater. 58, 1152–1211.(doi:10.1016/j.actamat.2009.10.058)
Rugg, D., Dixon, M. & Dunne, F. P. E. 2007 Effective structural unit size in titanium alloys.J. Strain Anal. 42, 269–279. (doi:10.1243/03093247JSA273)
Wang, I., Yang, Y., Eisenlohr, P., Bieler, T. R., Crimp, M. A. & Mason, D. E. 2010 Twin nucleationby slip transfer across grain boundaries in commercial purity titanium. Metall. Mater. Trans.A 41, 421–430. (doi:10.1007/s11661-009-0097-6)
Wang, I., Barabash, R. I., Yang, Y., Bieler, T. R., Crimp, M. A., Eisenlohr, P., Liu, W. & Ice,G. E. 2011 Experimental characterization and crystal plasticity modeling of heterogeneousdeformation in polycrystalline alpha-Ti. Metall. Mater. Trans. A 42, 626–635. (doi:10.1007/s11661-010-0249-8)
Wilkinson, A. J. & Randman, D. 2010 Determination of elastic strain fields and geometricallynecessary dislocation distributions near nanoindents using electron back scatter diffraction. Phil.Mag. 90, 1159–1177. (doi:10.1080/14786430903304145)
Proc. R. Soc. A

Deformation, lattice rotation and GNDs 23
on May 3, 2018http://rspa.royalsocietypublishing.org/Downloaded from
Wilkinson, A. J., Meaden, G. & Dingley, D. J. 2006 High resolution elastic strain measurementfrom electron backscatter diffraction patterns: new levels of sensitivity. Ultramicroscopy 106,307–313. (doi:10.1016/j.ultramic.2005.10.001)
Wilkinson, A. J., Clarke, E. E., Britton, T. B., Littlewood, P. & Karamched, P. S. 2010 High-resolution electron backscatter diffraction: an emerging tool for studying local deformation.J. Strain Anal. 45, 365–376. (doi:10.1243/03093247JSA587)
Yang, Y., Wang, L., Bieler, T. R., Eisenlohr, P. & Crimp, M. A. 2011 Quantitative atomic forcemicroscopy characterization and crystal plasticity finite element modeling of heterogeneousdeformation in commercial purity titanium. Metall. Mater. Trans. A 42, 636–644. (doi:10.1007/s11661-010-0475-0)
Zhao, Z., Ramesh, M., Raabe, D., Cuitino, A. M. & Radovitzky, R. 2008 Investigation of three-dimensional aspects of grain-scale plastic surface deformation of an aluminum oligocrystal. Int.J. Plast. 24, 2278–2297. (doi:10.1016/j.ijplas.2008.01.002)
Proc. R. Soc. A