CLIMATE CHANGE IMPACTS ON THE BULK POWER...
30
CLIMATE CHANGE IMPACTS ON THE BULK POWER SYSTEM: Assessing Vulnerabilities and Planning for Resilience By Justin Gundlach and Romany Webb February 2018
Transcript of CLIMATE CHANGE IMPACTS ON THE BULK POWER...
CLIMATE CHANGE IMPACTS ON
THE BULK POWER SYSTEM: Assessing Vulnerabilities and Planning for
Resilience
By Justin Gundlach and Romany Webb
February 2018
© 2018 Sabin Center for Climate Change Law, Columbia Law School
The Sabin Center for Climate Change Law develops legal techniques to fight climate change, trains
law students and lawyers in their use, and provides the legal profession and the public with up-to-
date resources on key topics in climate law and regulation. It works closely with the scientists at
Columbia University's Earth Institute and with a wide range of governmental, non-governmental
and academic organizations.
Sabin Center for Climate Change Law
Columbia Law School
435 West 116th Street
New York, NY 10027
Tel: +1 (212) 854-3287
Email: [email protected]
Web: http://www.ColumbiaClimateLaw.com
Twitter: @ColumbiaClimate
Blog: http://blogs.law.columbia.edu/climatechange
Disclaimer: This paper is the responsibility of The Sabin Center for Climate Change Law alone, and does not
reflect the views of Columbia Law School or Columbia University. This paper is an academic study provided
for informational purposes only and does not constitute legal advice. Transmission of the information is not
intended to create, and the receipt does not constitute, an attorney-client relationship between sender and
receiver. No party should act or rely on any information contained in this White Paper without first seeking
the advice of an attorney.
About the author: Justin Gundlach is a Staff Attorney at the Sabin Center for Climate Change Law
and an Associate Research Scholar at Columbia Law School. Romany Webb is a Climate Law
Fellow at the Sabin Center for Climate Change Law and an Associate Research Scholar at
Columbia Law School.
Climate Change Impacts on the Bulk Power System
Sabin Center for Climate Change Law | Columbia Law School i
EXECUTIVE SUMMARY
As the scale, speed, and implications of climate change come into focus, stakeholders in the
electricity sector are finding it increasingly difficult to turn a blind eye. However, many have opted
to attend to climate impacts in a piecemeal fashion, often merely responding to particular extreme
events—or types of extreme events, such as coastal storms or floods—and failing to consider the
larger phenomenon. This is true of the bulk power system (BPS) in regions overseen by
Independent System Operators and Regional Transmission Organizations (collectively, ISO/RTOs),
none of which have comprehensively assessed their systems’ vulnerabilities to climate change.
Lacking such assessments, ISO/RTOs cannot plan for the impacts of climate change, and thereby
ensure the continued reliability and resilience of the BPS.
The higher temperatures, more intense storms, and other weather extremes associated with
climate change pose numerous threats to the BPS. These threats are summarized in a table in the
appendix to this paper. As shown there, the impacts of climate change could force generating
facilities to curtail output or shutdown, and lead to widespread transmission outages. These
disruptions will be accompanied by other climate-driven phenomenon, including increases in
electricity load and the height of load peaks, which will further strain facilities.
While the nature and extent of generation and transmission impairments will vary across
the U.S.—due to differences in the nature and extent of climatic changes seen—no region will go
unscathed. It is, therefore, vital that all ISO/RTOs begin planning now for a future in which climate
change will feature. Otherwise, in the future, the BPS may be unable to deliver reliable electricity
services at just and reasonable rates as required by the Federal Power Act.
This paper offers ISO/RTOs advice on how to plan for climate change and identifies
resources and processes they could employ in the planning process. The regional variation in
climate change impacts, as well as differences in generation and transmission resources, prevent
formulation of a “one-size fits-all” approach to planning across ISO/RTO regions. Nevertheless,
there are a number of general principles which we recommend all ISO/RTOs follow, namely:
A detailed climate change vulnerability assessment should be undertaken to determine how
the components and operations of each ISO/RTO’s system will be affected by increasing
Climate Change Impacts on the Bulk Power System
Sabin Center for Climate Change Law | Columbia Law School ii
temperatures, changing precipitation patterns, more intense storms, droughts, and other
climate-driven weather extremes.
Vulnerability assessments should be based on downscaled projections of future climate
change in the ISO/RTOs’ respective operating regions. Many projections are available in
existing datasets, including those developed by NASA and the U.S. Geological Survey.
Gaps in available datasets (if any) should be noted and, if possible, filled by sponsoring
supplemental research.
Vulnerability assessments should consider multiple projections that reflect a range of
possible climate change scenarios, including a “worst case” (i.e., assuming continued high
greenhouse gas emissions lead to large temperature increases and rates of sea level rise).
The timeframe for each vulnerability assessment should reflect the anticipated useful life of
existing facilities or facilities scheduled for construction in the relevant ISO/RTO’s region.
Vulnerability assessments should be periodically reviewed and updated as new
information becomes available.
Building on the vulnerability assessment, a plan should be developed for how to adapt and
thereby prevent or manage the system disruptions that could threaten BPS reliability and
resilience.
Climate Change Impacts on the Bulk Power System
Sabin Center for Climate Change Law | Columbia Law School iii
CONTENTS
1. INTRODUCTION ................................................................................................................ 1
2. CLIMATE CHANGE AND THE BULK POWER SYSTEM ......................................... 4
2.1 Climate Change Impacts on Generating Facilities ...................................................................... 7
2.2 Climate Change Impacts on Transmission Facilities ............................................................... 11
2.3 Interrelated Impacts on Facilities and Load ............................................................................... 13
3. PLANNING FOR THE IMPACTS OF CLIMATE CHANGE .................................... 14
3.1 Approach to Planning ..................................................................................................................... 16
3.2 Existing Tools and Resources ........................................................................................................ 19
4. RECOMMENDATIONS ................................................................................................... 21
5. CONCLUSION ................................................................................................................... 22
APPENDIX A................................................................................................................................... 24
Climate Change Impacts on the Bulk Power System
Sabin Center for Climate Change Law | Columbia Law School 1
1. INTRODUCTION
The resilience of the bulk power system (BPS) to various types of disruption has been the
subject of much discussion in recent months. It was a key focus of the “Grid Reliability and
Resiliency Pricing” proceeding before the Federal Energy Regulatory Commission (FERC),1 the
agency responsible for overseeing six Independent System Operators and Regional Transmission
Organizations (collectively, ISO/RTOs) that manage much of the BPS.2 The proceeding, which
FERC opened on October 2, 2017 in response to a request from the Secretary of Energy, considered
the need for ISO/RTO-level reforms to support so-called “resilience resources” that have a ninety-
day fuel supply on-site. Concluding that a legal basis for such reforms was missing, FERC
terminated the proceeding on January 8, 2018. FERC noted, however, that resilience “warrants
further attention” and therefore opened another proceeding “to explore resilience issues in the
RTOs/ISOs” (resilience proceeding).3
For the purposes of the resilience proceeding, FERC proposes to define “resilience” as
“[t]he ability to withstand and reduce the magnitude and/or duration of disruptive events, which
includes the capability to anticipate, absorb, adapt to, and/or rapidly recover from such an event.”4
Notably, resilience is distinct from reliability. In the short term, reliability is defined as the
frequency and duration of outages due to “high frequency, low impact” events experienced in a
given service territory5 and, in the long-term, as the adequacy of energy supply vis-à-vis load in
1 Grid Resiliency Pricing Rule, 82 Fed. Reg. 46,940 (Oct. 10, 2017). 2 FERC, Regional Transmission Organizations (RTO)/Independent System Operators (ISO),
https://perma.cc/EVQ6-TZFJ (updated Dec. 21, 2017). FERC does not regulate the Electric Reliability Council
of Texas. See FERC, ERCOT, https://perma.cc/84GU-5W2P (updated Nov. 17, 2017). 3 Order Terminating Rulemaking Proceeding, Initiating New Proceeding, and Establishing Additional
Procedures, 162 FERC ¶ 61,012, P 10 (2018). It is possible, though not certain, that the current phase of the
proceeding will result in FERC calling for a full technical conference to address one or more sources of risk to
BPS resilience. 4 Id. at P 13 (citing the National Infrastructure Advisory Council’s 2009 Critical Infrastructure Resilience Final
Report and Recommendations at 8). 5 Examples of short-term reliability metrics include: System Average Interruption Frequency Index (SAIFI),
which captures the ratio of sustained outages over a year to the number of customers served (including both
affected and unaffected customers); System Average Interruption Duration Index (SAIDI), is similar, and is
often expressed as “consumer minutes” or “hours” to convey the average annual outage duration per
consumer in a given service territory; and Consumer Average Interruption Frequency Index (CAIFI), which
Climate Change Impacts on the Bulk Power System
Sabin Center for Climate Change Law | Columbia Law School 2
that territory. 6 Resilience, by contrast, is concerned with preparation for, responses to, and
recovery from less predictable “high impact, low frequency events.”7
The order convening the resilience proceeding noted that FERC has already examined and
addressed several types of risks to BPS reliability, both directly and via the North American
Electric Reliability Corporation (NERC)’s development of reliability standards. 8 According to
FERC, “[w]hile none of the Commission’s efforts . . . were specifically targeted at ‘resilience’ by
name, they were directed at elements of resilience, in that they sought to ensure the uninterrupted
supply of electricity in the face of fuel disruptions” or other risks.9 Risks addressed in a systematic
fashion include “fuel assurance,” “fuel supply issues during periods of system stress” (including
due to extreme weather events), and “cybersecurity and physical security threats, as well as
geomagnetic disturbances.”10 Missing from this list are risks arising from the effects of climate
captures the ratio of sustained outages over a year to the number of customers affected by those outages.
NATIONAL ACADEMY OF SCIENCES, ENHANCING THE RESILIENCE OF THE NATION’S ELECTRICITY SYSTEM 13 (Apr.
2017). 6 NORTH AMERICAN ELECTRICITY RELIABILITY CORPORATION (NERC), 2016 LONG-TERM RELIABILITY ASSESSMENT
(2016) (“NERC’s primary objective with the [Long-Term Reliability Assessment] is to assess resource and
transmission adequacy across the NERC footprint, and to assess emerging issues that have an impact on BPS
reliability over the next ten years.”). 7 Mathaios Panteli & Pierluigi Mancarella, The Grid: Stronger, Bigger, Smarter?, IEEE POWER ENERGY MAG.,
May/June 2015, at 58 (describing key parameters of resilience in electricity systems). 8 Section 215 of the Federal Power Act, which became law in 2005, invites FERC to certify as the Electricity
Reliability Organization (ERO) an entity able "to develop and enforce . . . reliability standards that provide
for an adequate level of reliability of the bulk-power system" in an objective and procedurally sound
manner. See Federal Power Act § 215(c)(1), codified at 16 U.S.C. § 824o; Energy Policy Act of 2005, Pub. L. 109–
58, § 1211(a), 119 Stat. 941 (Aug. 8, 2005). FERC certified the North American Electric Reliability Council
(NERC) as the ERO in 2006 (since 2007, the “C” has stood for “Corporation”). See 116 FERC ¶ 61,062 (2006).
NERC’s standards have been legally enforceable since 2007. See Mandatory Reliability Standards for the Bulk
Power System, Order No. 693, 72 Fed. Reg. 16,416 (April 4, 2007), FERC Stats. & Regs. ¶ 31,242 (2007), order
on reh’g, Order No. 693-A, 120 FERC ¶ 61,053 (2007). 9 Id. at 7. 10 Id. at 5–7. The Order cites the following past orders to illustrate and support these points: Centralized
Capacity Markets in Regional Transmission Organizations and Independent System Operators, 149 FERC ¶
61,145 (2014) (order addressing technical conferences on, among other things, the 2014 Polar Vortex); ISO
New England Inc. and New England Power Pool, 147 FERC ¶ 61,172 (2014), reh’g denied, 153 FERC ¶ 61,223
(2015), appeal pending sub nom., New England Power Generators Ass’n v. FERC, No. 16-1023 (D.C. Cir. filed
Jan. 19, 2016); PJM Interconnection, L.L.C., 151 FERC ¶ 61,208 (2015), reh’g denied, 155 FERC ¶ 61,157 (2016),
aff’d sub nom., Advanced Energy Mgmt. All. v. FERC, 860 F.3d 656 (D.C. Cir. 2017); Physical Security
Reliability Standard, Order No. 802, 149 FERC ¶ 61,140 (2014); Revised Critical Infrastructure Protection
Reliability Standards, Order No. 822, 154 FERC ¶ 61,037 (2016), reh’g denied, Order No. 822-A, 156 FERC ¶
Climate Change Impacts on the Bulk Power System
Sabin Center for Climate Change Law | Columbia Law School 3
change. To the extent that FERC, NERC, or individual ISO/RTOs have examined such risks, that
examination has been piecemeal, and has at no point taken into account downscaled climate
projections11 for the coming years and decades.
This paper argues that such an approach is inadequate to ensure the long-term resilience of
the BPS to climate change. That inadequacy is legal as well as practical. The Federal Power Act
(FPA) requires FERC to ensure the BPS operates in a manner that yields reliable electricity services
at rates that are just, reasonable, and not unduly discriminatory or preferential.12 To meet that
requirement, FERC relies on market mechanisms, reasoning that they “provide correct incentives
for [participants] to . . . make efficient investments in facilities and equipment.”13 However, FERC
has recognized that, for markets to provide “correct” investment incentives, they must account for
differences in the risk profiles of BPS facilities. 14 At present, because neither FERC nor the
ISO/RTOs have conducted a comprehensive assessment of climate risks to BPS facilities, it is
unclear whether those risks are duly unaccounted for.
While various facility owners have identified climate change as a source of material
physical risk to their operations,15 no one has sought to map such risks systematically at the
ISO/RTO level. This paper argues that such mapping is an essential first step toward ensuring that,
as the climate changes, the BPS continues to deliver reliable electricity services at just and
reasonable rates. The rest of the paper proceeds in three sections. Section 2 briefly describes key
61,052 (2016); Revised Critical Infrastructure Protection Reliability Standards, Order No. 829, 156 FERC ¶
61,050 (2016); Cyber Systems in Control Centers, Notice of Inquiry, FERC Stats. & Regs. ¶ 35,557 (2016);
Revised Critical Infrastructure Protection Reliability Standards CIP-003-7 – Cyber Security – Security
Management Controls, Notice of Proposed Rulemaking, 161 FERC ¶ 61,047 (2017); Reliability Standard for
Transmission System Planned Performance for Geomagnetic Disturbance Events, Order No. 830, 156 FERC ¶
61,215 (2016). 11 Downscaled projections identify likely future changes in climate-driven extreme weather and other
phenomenon at local scales. 12 16 U.S.C. §§ 824d(a)-(b) & 824o. 13 Price Formation in Energy and Ancillary Services Markets Operated by Regional Transmission
Organizations and Independent System Operators; Notice Inviting Post-Technical Workshop Comments, 80
Fed. Reg. 3,580 (Jan. 23, 2015). 14 See generally P.J.M Interconnection, L.L.C., 151 FERC ¶ 61,208 (2015), order on reh’g, 155 FERC ¶ 61,157
(2016). 15 See e.g., NextEra Energy, Inc., Florida Power & Light Co., Annual Report (Form 10-K) 26 (Feb. 23, 2017);
Consolidated Edison Company of New York, Inc., Annual Report (Form 10-K) 32 (Dec. 31, 2016); American
Electric Power Company, Inc., Annual Report (Form 10-K) 41–42 (Dec. 31, 2016).
Climate Change Impacts on the Bulk Power System
Sabin Center for Climate Change Law | Columbia Law School 4
risks climate change poses for the BPS. Section 3 identifies processes and resources that can be
employed to assess the BPS’s vulnerability to climate change and plan for climate resilience.
Section 4 contains recommendations for conducting vulnerability assessments and developing
resilience plans.
2. CLIMATE CHANGE AND THE BULK POWER SYSTEM
Since the start of the 19th century, annual average temperatures in the contiguous U.S. have
increased by up to 1.8°F (1.0°C), with two-thirds of this increase occurring in the last two decades.16
Those decades also saw a marked rise in the frequency and intensity of heat waves17 and other
extremes, including droughts, floods, and storms, 18 as well as climate-related environmental
changes such as sea level rise. 19 Conditions are expected to worsen in coming years as
temperatures continue to increase, leading to significant and widespread adverse impacts,
including on the BPS and the systems, communities, and individuals that rely on it.
Numerous sources—including reports of national laboratories,20 federal agencies,21 state
agencies,22 privately-sponsored researchers,23 and international organizations,24 corporate filings
16 R.S. Vose et al., Temperature Changes in the United States, in CLIMATE SCIENCE SPECIAL REPORT: FOURTH
NATIONAL CLIMATE ASSESSMENT 185, 186 (D.J. Wuebbles et al. eds., 2017), https://perma.cc/TD85-T3H8. 17 Id. at 191-192. 18 M.F. Wehner et al., Droughts, Floods, and Wildfires, in CLIMATE SCIENCE SPECIAL REPORT: FOURTH NATIONAL
CLIMATE ASSESSMENT 231, 231 (D.J. Wuebbles et al. eds., 2017), https://perma.cc/TD85-T3H8. 19 W.V. Sweet et al., Sea Level Rise, in CLIMATE SCIENCE SPECIAL REPORT: FOURTH NATIONAL CLIMATE
ASSESSMENT 333, 333 (D.J. Wuebbles et al. eds., 2017), https://perma.cc/TD85-T3H8. 20 See e.g., BENJAMIN L. PRESTON ET AL., RESILIENCE OF THE U.S. ELECTRICITY SYSTEM: A MULTI-HAZARD
PERSPECTIVE (2016), https://perma.cc/9G93-P824. 21 See e.g., U.S. DEPT. OF ENERGY, CLIMATE CHANGE & THE ELECTRICITY SECTOR: GUIDE FOR CLIMATE CHANGE
RESILIENCE PLANNING (2016), https://perma.cc/4WHR-EDFJ [hereinafter 2016 DOE Report]; U.S. DEPT. OF
ENERGY, U.S. ENERGY SECTOR VULNERABILITIES TO CLIMATE CHANGE & EXTREME WEATHER (2013),
https://perma.cc/9N8H-VM6S [hereinafter 2013 DOE Report]; ELECTRIC POWER RESEARCH INSTITUTE,
POTENTIAL IMPACT OF CLIMATE CHANGE ON NATURAL RESOURCES IN THE TENNESSEE VALLEY AUTHORITY
REGION (Nov. 2009), https://perma.cc/6YXR-QPBG. 22 See e.g., JAYANT SATHAYE ET AL., ESTIMATING RISK TO CALIFORNIA ENERGY INFRASTRUCTURE FROM PROJECTED
CLIMATE CHANGE (2012), https://perma.cc/2ANF-S8ZV. 23 See e.g., EDWARD VINE, PUBLIC POLICY INSTITUTE OF CALIFORNIA, ADAPTATION OF CALIFORNIA’S ELECTRICITY
SECTOR TO CLIMATE CHANGE (2008), https://perma.cc/5N2N-667Q. 24 See e.g., INTERNATIONAL ENERGY AGENCY, MAKING THE ENERGY SECTOR MORE RESILIENT TO CLIMATE
CHANGE (2015), https://perma.cc/5WSM-J45P.
Climate Change Impacts on the Bulk Power System
Sabin Center for Climate Change Law | Columbia Law School 5
with the U.S. Securities and Exchange Commission,25 and utilities’ climate change vulnerability
assessments and adaptation plans,26 have identified the effects of climate change as sources of
material physical risk for the generation and transmission segments of the BPS. The nature and
extent of risks to generation and transmission will vary across regions because, though the global
climate is generally growing warmer and stormier, regional climates will experience these and
other phenomenon to varying degrees,27 and also because different regions rely on different types
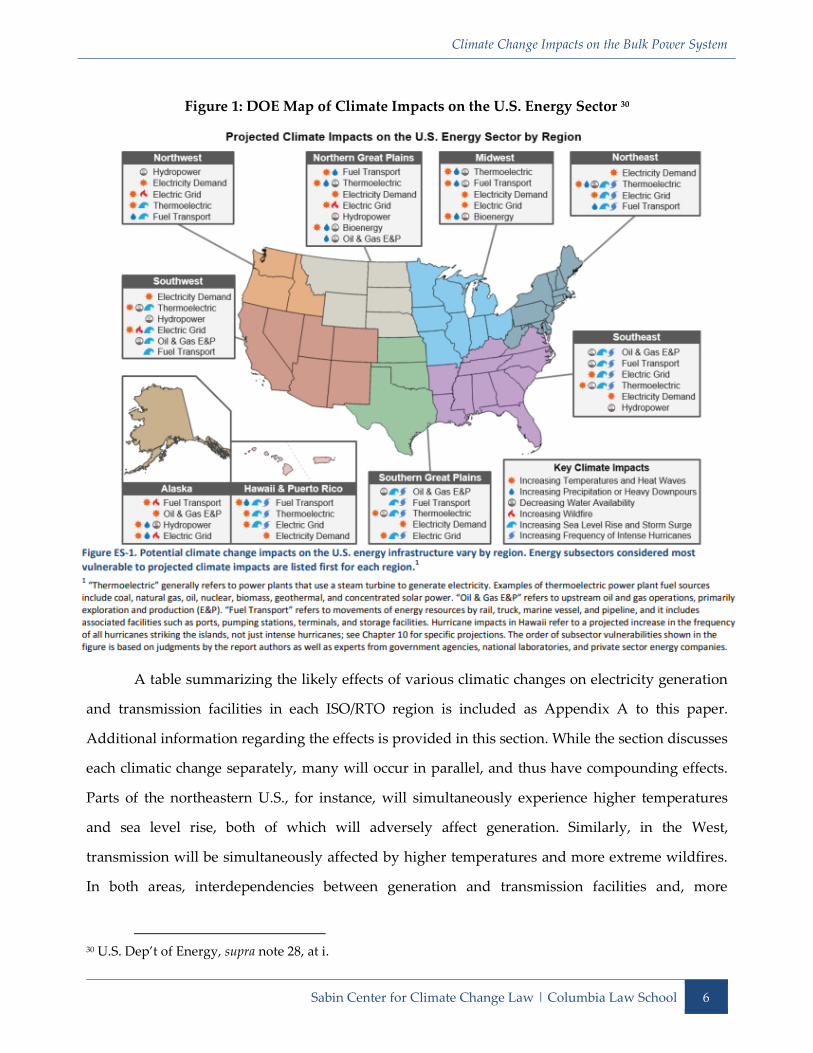
of generation and differently situated transmission facilities. However, according to a 2015
Department of Energy (DOE) report, which mapped climate impacts on different parts of the U.S.
energy sector, no region will go unscathed (see Figure 1).28 Thus, ISO/RTOs in all regions should be
planning for the effects of higher temperatures, heat waves, and more intense storms, which will
be felt nationwide, as well as for regional effects, such as sea level rise along the coasts, wildfires in
the West, drought in the Southwest and California, and more frequent and intense precipitation in
the Northeast.29
25 See e.g., the 10-Ks listed supra, in note 15. 26 TENNESSEE VALLEY AUTHORITY, CLIMATE CHANGE ADAPTATION PLAN—2016 UPDATE (June 2016),
https://perma.cc/AQ82-M736; CRYSTAL RAYMOND, SEATTLE CITY LIGHT CLIMATE CHANGE VULNERABILITY
ASSESSMENT AND ADAPTATION PLAN (2015), https://perma.cc/GBT2-2UV8. 27 See generally CLIMATE CHANGE IMPACTS IN THE UNITED STATES: THE THIRD NATIONAL CLIMATE ASSESSMENT
370–618 (J.M. Melillo et al., eds., U.S. Global Change Research Program 2014) [hereinafter 3rd NCA]. 28 U.S. DEP’T OF ENERGY, CLIMATE CHANGE AND THE U.S. ENERGY SECTOR: REGIONAL VULNERABILITIES AND
RESILIENCE SOLUTIONS (2015), https://perma.cc/3WQC-5JYV. 29 These effects are described thoroughly in chapters 16 to 25 of the 3rd NCA, supra note 27.
Climate Change Impacts on the Bulk Power System
Sabin Center for Climate Change Law | Columbia Law School 6
Figure 1: DOE Map of Climate Impacts on the U.S. Energy Sector 30
A table summarizing the likely effects of various climatic changes on electricity generation
and transmission facilities in each ISO/RTO region is included as Appendix A to this paper.
Additional information regarding the effects is provided in this section. While the section discusses
each climatic change separately, many will occur in parallel, and thus have compounding effects.
Parts of the northeastern U.S., for instance, will simultaneously experience higher temperatures
and sea level rise, both of which will adversely affect generation. Similarly, in the West,
transmission will be simultaneously affected by higher temperatures and more extreme wildfires.
In both areas, interdependencies between generation and transmission facilities and, more
30 U.S. Dep’t of Energy, supra note 28, at i.
Climate Change Impacts on the Bulk Power System
Sabin Center for Climate Change Law | Columbia Law School 7
generally, between the bulk and retail electricity systems may lead to further compounding of
effects.31
2.1 Climate Change Impacts on Generating Facilities
Climate change will have profound impacts on electricity generation in the U.S., disrupting
operations at many facilities, and forcing some to curtail output or entirely shutdown. The likely
extent of these and other impacts, under various climate change scenarios, has been explored in a
number of studies, the key findings of which are summarized below.
Increasing air temperatures: The Fourth National Climate Assessment, published in
November 2017, forecasts that annual average temperatures in the contiguous U.S. will rise by at
least 2.5°F (1.4°C) between 2021 and 2050. 32 Rising temperatures lower the efficiency of
thermoelectric generating facilities, including nuclear and fossil fuel plants equipped with steam
turbines, for at least three reasons. At higher temperatures:
1. the air mass of the turbine for a given volume intake is lower (i.e., as warmer air is less dense) ;
2. the pressure ratio within the turbine is lower, which reduces mass flow; and
3. the specific volume of air is higher, resulting in more power being consumed by the turbine
during compression.33
The degree of efficiency reductions will depend on, among other things, the design of the
generating facility and the fuel used. As an example, most natural gas facilities are designed to
operate at 59oF (15oC), and may experience efficiency reductions of up to 1% for each 1.8°F (1°C)
increase in temperatures above that level.34 While this may sound small, when extended regionally,
the impact on generator efficiency would be significant, particularly during heat waves. Research
31 See supra subpart 2.3. 32 Vose et al., supra note 16, at 195. 33 Sathaye et al., supra note 22, at 12. 34 Id. at 13 (citing previous studies finding that, for each 1.0oC increase in temperatures above 15oC, the
capacity of combined-cycle gas power plants may fall by 0.3-0.5% (if equipped with wet cooling) or up to
0.7% (if equipped with dry cooling) and indicating that, as “simple-cycle gas units . . . have been shown to be
more sensitive to ambient temperature relative to combined-cycle units,” the capacity of those units is
assumed to “decrease by 1.0 percent per degree Celsius above 15oC”). See also 2013 DOE Report, supra note
21, at 10 (noting that “the power output of natural gas-fired combustion turbines . . . is estimated to decrease
by approximately 0.6%-0.7% for a 1.8oF (1oC) increase in air temperature,” while “[f]or combined cycle
plants, output can decrease by approximately 0.3%-0.5%”).
Climate Change Impacts on the Bulk Power System
Sabin Center for Climate Change Law | Columbia Law School 8
undertaken by the Lawrence Berkeley National Laboratory (LBNL), focusing on gas-fired
generation in California, indicates that electricity losses on hot days could reach 10.3 gigawatts
(GW) by 2100 or 23.4% of total current gas-fired capacity.35 Electricity load on hot days is also
projected to increase,36 and with it the height of peak load, leading to an expected shortfall in peak
generating capacity of over 35%.37
Increasing water temperatures: Generation shortfalls can also occur due to high water
temperatures. Thermoelectric power plants generally require low-temperature water for cooling,
using it to condense steam that has passed over the turbine, and thereby create a vacuum to draw
more steam in.38 Increased water temperatures reduce the effectiveness of this process, leading to
turbine backpressure which lowers plant output.39 Some nuclear plants, for example, could see
declines in electricity output of 0.5% for each 1.8°F (1°C) increase in water temperatures.40 In cases
where water temperatures exceed technical specifications, plants may be forced to curtail output
by larger amounts or entirely shutdown. This occurred in Connecticut in 2012, when the Millstone
nuclear plant shut down after a heat wave caused cooling water temperatures to rise above the
maximum allowed under its permit from the Nuclear Regulatory Commission.41 Also in 2012, a
heat wave in Illinois affected operations at several nuclear and coal plants, causing them to exceed
35 Sathaye et al., supra note 22, at 18. This represents a 6.2 percent increase in the maximum peak capacity loss
compared to the period from 1961 to 1990. Id. 36 Id. at 35 (indicating that, in California, “per-capita peak loads are projected to increase between 10 percent
and 20 percent at the end of the century due to the effects of climate change on summer weekday afternoon
temperatures”). 37 Id. at 38. 38 Some thermoelectric generating plants are equipped with “dry cooling” systems which use ambient air to
cool the steam and condense it back to water. See STEVE FLEISCHLI & BECKY HAYAT, POWER PLANT COOLING
AND ASSOCIATED IMPACTS: THE NEED TO MODERNIZE U.S. POWER PLANTS & PROTECT OUR WATER RESOURCES &
AQUATIC ECOSYSTEMS 3 (2014), https://perma.cc/DUF4-4H9Z. 39 2013 DOE Report, supra note 21, at 10 (indicating that “[i]ncreases in . . . cooling water temperatures will
increase steam condensate temperatures and turbine backpressure, reducing power generation efficiency”). 40 Ahmet Durmayaz & Oguz Salim Sogut, Influence of Cooling Water Temperature on the Efficiency of a
Pressurized-Water Reactor Nuclear Power Plant, 30 INTL. J. OF ENERGY RESEARCH 799 (2006). 41 Matthew L. Wald, Heat Shuts Down a Coastal Reactor, N.Y. TIMES (Aug. 13, 2012), https://perma.cc/XE3C-
8AH7 (reporting that the shutdown occurred after water temperatures in Long Island Sound reached 76.7oF.
Under Millstone nuclear plant’s operating permit, the cooling water it extracts can be no warmer than 75oF).
Climate Change Impacts on the Bulk Power System
Sabin Center for Climate Change Law | Columbia Law School 9
thermal limits42 for cooling water discharges.43
Declining water availability: Many thermoelectric and other generating facilities, particularly
in the West and South, will also be affected by droughts, which may become more frequent and
severe due to climate change.44 This will reduce the availability of cooling water for thermoelectric
generating facilities, potentially forcing them to curtail or shut down operations. According to a
recent DOE study, under extreme drought conditions on par with those experienced during the
U.S. “dust bowl” of the 1930s, thermoelectric generation in the Southwest could decline by up to
20%.45 The study also predicted declines of almost 60% in the region’s hydroelectric generation
under extreme drought conditions.46 California has already experienced double-digit reductions in
hydroelectric generating capacity, for example, in 2014, when persistent drought caused it to fall to
just 58% of the ten-year average.47
Changing precipitation patterns: Hydroelectric and some thermal generating facilities will
also be affected by other changes in precipitation, including shifts to more precipitation falling as
rain rather than snow.48 This will increase runoff during winter months, overloading hydroelectric
reservoir capacity, and leading to the loss of energy normally available later in the year.49 Similar
losses may also occur as a result of earlier and more rapid thawing of the snowpack due to higher
temperatures. 50 In both cases, stream flows throughout the year will be lower, reducing the
42 Thermal limits have been established for cooling water discharged back into the environment (i.e.,
following use) to protect aquatic ecosystems. See R. SKAGGS ET AL., CLIMATE AND ENERGY-WATER-LAND
SYSTEM INTERACTIONS 2.14-2.15 (2012), https://perma.cc/969B-RAUS. 43 Matthew L. Wald, So, How Hot Was It? N.Y. TIMES (Jul. 17. 2012), https://perma.cc/TNK3-CMAP. 44 D.J. Wuebbles et al., Executive Summary, in CLIMATE SCIENCE SPECIAL REPORT: FOURTH NATIONAL CLIMATE
ASSESSMENT 10, 11 (D.J. Wuebbles et al. eds., 2017), https://perma.cc/TD85-T3H8. 45 ARGONNE NATIONAL LABORATORY, IMPACTS OF LONG-TERM DROUGHT ON POWER SYSTEMS IN SOUTH WEST
10, 37 (2012), https://perma.cc/7EKU-2Z3C (defining the “southwest” region to encompass Arizona,
California, Colorado, New Mexico, Nevada, Texas, and Utah). 46 Id. 47 Preston et al., supra note 20, at 13. 48 Wuebbles et al., supra note 44, at 22 (projecting “shifts to more precipitation falling as rain than snow in the
cold season in many parts of the central and eastern United States”). 49 Preston et al., supra note 20, at 13. 50 Id. See also Wuebbles et al., supra note 44, at 21 (indicating that “[t]here has been a trend toward earlier
snowmelt” and noting that this trend is expected to continue).
Climate Change Impacts on the Bulk Power System
Sabin Center for Climate Change Law | Columbia Law School 10
efficiency of hydroelectric generating facilities by reducing the pressure that drives their turbines.51
Intense deluges, like the one that accompanied Hurricane Harvey in 2017, have also saturated coal
piles, preventing their use as an energy source.52
Storms and flooding: All electricity generating facilities, regardless of type or location, will be
impacted by future storms which are expected to become more intense due to climate change.53
More intense rainstorms will contribute to inland flooding which can prevent the operation of
generating facilities, as seen in Nebraska in mid-2011, when floodwaters surrounded the Fort
Calhoun nuclear plant and prevented it returning to service after an earlier routine shutdown. 54
Similar issues have also occurred at coastal facilities due to hurricanes and associated storm
surge—e.g., in New York during Hurricane Sandy55—with this situation expected to worsen in the
future due to rising sea levels. Research by the National Laboratories suggests that, by 2050, sea
level rise could increase the number of generating facilities exposed to inundation from storm
surge during a weak (category 1) hurricane by 40%.56 Many facilities could also be inundated by
sunny-day or “nuisance” flooding caused solely by sea level rise—a recent DOE study of just four
coastal cities (Houston, Los Angeles, New York, and Miami) identified up to 315 energy facilities
that could be affected by 2100.57
51 2013 DOE Report, supra note 21, at 26. See also U.S. Dept. of Energy & U.S. Dept. of Homeland Security,
Dams & Energy Sectors Interdependency Study 24 (2011), https://perma.cc/9PB7-QFHR (indicating that
“[f]or every foot of elevation lost in Lake Mead, Hoover Dam produces 5.7 MW less power”). 52 Harvey's rain caused coal-to-gas switching: NRG Energy, PLATTS, Sept. 27, 2017. 53 See e.g., Wuebbles et al., supra note 44, at 21 (noting that “[t]he frequency and intensity of heavy
precipitation events in the United States are projected to continue to increase over the 21st century”). 54 The Fort Calhoun plant was shut-down prior to the flooding for refueling. The plant’s return to service
was delayed for several months due to persistent flood waters. See A.G. Sulzberger & Matthew L. Wald,
Flooding Brings Worries Over Two Nuclear Plants, N.Y. TIMES, Jun. 20, 2011,
http://www.nytimes.com/2011/06/21/us/21flood.html. 55 Steven Mufson, 3 Nuclear Power Reactors Shut Down During Hurricane Sandy, WASH. POST, Oct. 30, 2012,
https://perma.cc/BTX9-FDLF (noting that “[t]hree nuclear power reactors were shut down because of
electricity issues during Hurricane Sandy, while a fourth plant, Oyster Creek in New Jersey, remains in
“alert” mode because of high water levels in its water intake structure”). 56 JAMES BRADBURY ET AL., CLIMATE CHANGE & ENERGY INFRASTRUCTURE EXPOSURE TO STORM SURGE & SEA-
LEVEL RISE 11 (2015), https://perma.cc/3WKY-CVY9. 57 U.S. DEPT. OF ENERGY, EFFECT OF SEA LEVEL RISE ON ENERGY INFRASTRUCTURE IN FOUR MAJOR
METROPOLITAN AREAS 13 (2014), https://perma.cc/D23E-768D (predicting that, in Houston, 16 energy
facilities could be inundated by 2050 and 67 by 2100. In Los Angeles, 11 facilities could be inundated by 2050
Climate Change Impacts on the Bulk Power System
Sabin Center for Climate Change Law | Columbia Law School 11
2.2 Climate Change Impacts on Transmission Facilities
Climate change will also have impacts on electricity transmission facilities and operations,
though uncertainty remains as to the precise nature and extent of those impacts. The current state
of knowledge, based on research to date, is summarized below.58
Increasing air temperatures: Higher ambient air temperatures, particularly when
accompanied by higher humidity, increase transmission line resistance, which lowers the line’s
carrying capacity and increases the fraction of electricity lost rather than transmitted.59 The impacts
are likely to be particularly severe during future summer heat waves, when already high
temperatures rise by large amounts over short periods.60 NREL estimates that the 9°F (5oC) increase
in summer temperatures expected in parts of California by 2100 could reduce transmission
capacity by 7% to 8%. 61 Increasing temperatures will also reduce the useful life of some
transmission equipment,62 and cause lines to expand and sag, potentially resulting in them coming
into more frequent contact with trees.63 Furthermore, higher night-time temperatures (which have
risen faster than day-time temperatures) will reduce or eliminate opportunities for transmission
lines and equipment to cool.64
More frequent wildfires: Transmission facilities are also affected by wildfires which, due to
and 29 by 2100. In Miami, one facility could be inundated by 2050, and 49 by 2100. In New York, 17 facilities
could be inundated by 2050 and 170 by 2100.) 58 The authors are aware of conferences led by the Electric Power Research Institute (EPRI) and of EPRI-
authored research focused on this subject area. See, e.g., EPRI, How the Transmission Resiliency Research Fits
Together (Dec. 2015); EPRI, Proceedings of EPRI/NATF 2014 Resiliency Summit (Dec. 2014); EPRI,
Proceedings of the Industry Summit on Transmission System Resiliency to Severe Natural Events (June
2013). However, the results of such efforts sit behind very high paywalls and so are not publicly available.
They also seem not to have prompted the sort of assessments we call for in this paper, nor to have put to rest
the need for such assessments. 59 Sathaye et al., supra note 22, at 25. See also Preston et al., supra note [20], at 16. 60 Studies suggest that the impact of smaller temperature increases, occurring gradually over time, are likely
to prove easier to manage. See e.g., EDWARD VINE, ADAPTATION OF CALIFORNIA’S ELECTRICITY SECTOR TO
CLIMATE CHANGE 10 (2008), https://perma.cc/JV3M-LMJF. 61 Sathaye et al., supra note 22, at 27. 62 2016 DOE Report, supra note 21, at 10. 63 2013 DOE Report, supra note 21, at 13. 64 Id. at 12.
Climate Change Impacts on the Bulk Power System
Sabin Center for Climate Change Law | Columbia Law School 12
higher temperatures and drought conditions, are expected to become more frequent and intense.65
Wildfires can damage or destroy wooden transmission poles, and the associated soot and smoke
can affect the operation of lines, causing leakage currents66 and arcing.67 Grid operation can also be
affected by certain firefighting practices, including the use of fire retardants that foul lines.68 While
grid operators have traditionally been able to manage these impacts due to the redundancy built
into the transmission system, management is likely to become increasingly difficult as more
frequent, longer, and more severe wildfires threaten more facilities.69 This will be a particular
problem in California, where almost all transmission facilities are expected to face increased
wildfire risk by 2100, in some cases by 45% annually.70
Storms and flooding: Storm-related transmission disruptions could also increase in the future
as extreme weather events become more frequent and severe due to climate change. 71
Transmission facilities in some areas—e.g., the Midwest and Northeast—could be affected by more
intense winter storms that cause ice to accumulate on lines and equipment, and thereby cause
mechanical problems.72 Transmission lines may also be damaged by trees felled by accumulated ice
or uprooted during hurricanes.73 Hurricane-related flooding is another problem, as seen in Texas in
2017, when floodwaters from Hurricane Harvey inundated a number of transmission substations,
leading to outages.74 In total, Harvey-related flooding and winds caused widespread high-voltage
65 Wehner et al., supra note 18, at 249 (finding that “[t]he incidence of large forest fires in the western United
States and Alaska has increased since the early 1980s . . . and is projected to further increase in those
regions”). 66 Leakage currents may occur where particulate matter in soot accumulates on insulators. See Sathaye et al.,
supra note 22, at 40 (noting that “the insulators that attach the lines to the towers can accumulate soot,
creating a conductive path and causing leakage currents”). 67 Arcing may occur where ionized air in smoke acts as a conductor. See Id. (finding that “[i]onized air in
smoke can act as a conductor, causing arcing; either between lines, or between lines and the ground”). 68 Id. 69 Id. 70 Id. at 42 –45. 71 J.P. Kossin et al., Extreme Storms, in CLIMATE SCIENCE SPECIAL REPORT: FOURTH NATIONAL CLIMATE
ASSESSMENT 257, 257 (D.J. Wuebbles et al. eds., 2017), https://perma.cc/TD85-T3H8. 72 Hyde M. Merrill & James W. Feltes, Transmission Icing: A Physical Risk with a Physical Hedge, POWER
ENGINEERING SOCIETY GENERAL MEETING 1 (2006). See also Preston et al., supra note [20], at 16. 73 Id. at 10 & 16. 74 Kenny Mercado, CenterPoint Energy’s Response to Hurricane Harvey, Presentation to ERCOT Board of
Directors (Oct. 17, 2017), https://perma.cc/5KCJ-V2VK.
Climate Change Impacts on the Bulk Power System
Sabin Center for Climate Change Law | Columbia Law School 13
transmission outages, including on six 345 kilovolt (kV) lines and more than 200 69 to 138 kV
lines.75
2.3 Interrelated Impacts on Facilities and Load
The sections above identify various ways in which higher temperatures and other climatic
changes could disrupt the operation of generation and transmission facilities. These disruptions
would occur alongside higher peaks in electricity load—potentially high enough to strain
transmission and generation facilities’ capacities.76 PJM experienced an instance of this in 1999,
when a heat wave caused load to exceed projections by 10% and several transmission problems
followed, including transformer failures and—as a result of an increase in imported energy—a
depression in voltage.77
These strains create a pincer effect: higher load peaks amid higher temperatures increase
the likelihood of bumping into technical and operational limits on the supply side, at the same
time as higher temperatures also tighten those limits by reducing the efficiency and capacities of
transmission and generation facilities.78 Therefore, to usefully capture the full range of scenarios
that BPS facilities can expect to face, ISO/RTOs must consider potentially synergistic combinations
of coincident changes in operationally important factors. The California Energy Commission,79 for
one, seeks to do this by identifying what it calls “climate parameters” and incorporating those
parameters into relevant design specifications and planning criteria.80
75 U.S. Energy Information Administration, Hurricane Harvey Caused Electric System Outages & Affected Wind
Generation in Texas, TODAY IN ENERGY (Sep. 13, 2017), https://perma.cc/P7T3-QXMN. 76 EPRI, Temperature Impacts on Electricity Demand for Cooling in New York State; 2017 Technical Update
3-2 l – 3-5 (Sept. 2017); Matthew Bartos et al., Impacts of rising air temperatures on electric transmission ampacity
and peak electricity load in the United States, 11 ENVTL. RES. LETTERS 114008, 1 (Nov. 2016). 77 EPRI, JOINT TECHNICAL SUMMIT ON RELIABILITY IMPACTS OF EXTREME WEATHER AND CLIMATE CHANGE 3-1 –
3-5 (2008), https://perma.cc/6FNY-8WYN. 78 JAMES MCCALL ET AL., NAT'L RENEWABLE ENERGY LAB'Y, WATER-RELATED POWER PLANT CURTAILMENTS: AN
OVERVIEW OF INCIDENTS AND CONTRIBUTING FACTORS (2016), https://perma.cc/9TXQ-VH9G (reporting 43
curtailments due to higher water temperatures). 79 The California Energy Commission, formerly the Energy Resources Conservation and Development
Commission, is the state’s energy policy and planning agency, not to be confused with the California Public
Utility Commission. 80 Guido Franco, Cal. Energy Comm'n, Climate Parameters for the Energy System, 2017 IEPR Joint Agency
Workshop: Climate Adaptation and Resilience for the Energy System, Sacramento, Aug. 29, 2017,
https://perma.cc/JNK8-JQKB.
Climate Change Impacts on the Bulk Power System
Sabin Center for Climate Change Law | Columbia Law School 14
3. PLANNING FOR THE IMPACTS OF CLIMATE CHANGE
Given the potential for higher temperatures, more intense storms, and other climate-driven
phenomenon to disrupt operation of the BPS, FERC and ISO/RTOs’ resilience planning efforts
must recognize and account for the present and foreseeable future effects of climate change.
Ignoring rather than assessing those effects would invite a circumstance in which the BPS may be
unable to deliver reliable electricity services at just and reasonable rates as required by the FPA.
To explain, under the FPA, FERC must ensure that rates for the interstate81 transmission and
wholesale sale82 of electricity are just and reasonable and not unduly discriminatory or preferential,
and that the BPS operates reliably.83 To that end, ISO/RTOs under FERC’s jurisdiction operate
markets, which are intended to encourage the development of plentiful electricity supplies at low
prices.84 Both ISO/RTOs and FERC have recognized that, to achieve these goals, markets must be
designed so as to incentivize investment in new facilities capable of reliably delivering electricity.
This was the motivation behind recent reforms to the capacity market operated by PJM
Interconnection, L.L.C. (PJM).85 PJM argued, and FERC accepted, that its pre-existing capacity
market design failed to ensure the delivery of electricity during extreme weather and other
emergencies.86 To address this issue, PJM proposed market changes, which would have the effect
of increasing the compensation paid to facilities that reliably delivered electricity during
emergencies.87 In approving the proposal, FERC emphasized that it would “incentivize existing
reliable resources to stay in the market, while facilitating the entry of new reliable resources to
displace less reliable ones.”88
81 For the purposes of the FPA, the transmission and sale of electricity is “interstate” whenever electric
energy moves from the buyer to the seller via an interstate transmission grid, such as the eastern or western
interconnect. See Fed. Power Comm’n v. Florida Power & Light Co. 404 U.S. 452 (1972). 82 Under the FPA, “sales at wholesale are defined to mean sales to any person for resale. See 16 U.S.C. §
824(d). 83 16 U.S.C. §§ 824d(a)-(b) & 824o. 84 FERC, Electricity Markets: National Overview (last updated Apr. 13, 2017), https://perma.cc/PJX9-2A8X . See
also FERC v. Electric Power Supply Association 136 S. Ct. 760 (2015). 85 PJM operates the BPS in Delaware, Maryland, New Jersey, Pennsylvania, Virginia, the District of
Columbia, and parts of Illinois, Michigan, North Carolina, Ohio, Tennessee, and West Virginia 86 P.J.M Interconnection, L.L.C., 151 FERC ¶ 61,208 (2015), order on reh’g, 155 FERC ¶ 61,157 (2016). 87 Id. 88 Id.
Climate Change Impacts on the Bulk Power System
Sabin Center for Climate Change Law | Columbia Law School 15
FERC’s reasoning in the PJM case suggests that, to provide appropriate incentives for
investment, markets must account for differences in the risk profiles of BPS facilities.89 This can
only occur if there is a thorough mapping of risks which, to our knowledge, has not yet occurred in
the context of climate change. While a number of BPS facility owners have identified climate
change as a source of material physical risk to their operations,90 there has been no comprehensive
assessment of such risks at the ISO/RTO level.91 Rather, to the extent that any assessments have
occurred, they have generally been partial and piecemeal.
A prime example is ISO-New England92 (ISO-NE)’s 2017 Regional System Plan, which
identifies resource and transmission facilities needed to maintain BPS reliability over the next ten
years. 93 The plan assumes, for the purposes of projecting peak loads, that summer temperatures
will increase as they have done in the recent past, but does not consider the implications of
summer heat for transmission facility efficiency or lifespan. 94 Thus, even though ISO-NE is
assuming that increasing levels of summer heat will drive load and load peaks higher, as the
Department of Homeland Security observed in 2016, it “is not addressing climate change in its
planning activities to determine the grid enhancement requirements necessary to meet future
demand given projected temperature increases.”95 ISO-NE’s planning is often based on historic
trends which, given the existence of climate change, are not a good proxy for future conditions. In
particular, ISO-NE’s annual Capacity, Energy, Loads and Transmission Report, which forecasts
key details like expected transmission and large transformer losses and peak loads, looks to
“historical demand” and “weather data,” among other factors, but not climate projections.96
155 FERC ¶ 61,157 (2016). 90 See 10-Ks listed in note 15, supra. 91 See note 58, supra. 92 ISO-NE operates the BPS in Connecticut, Maine, Massachusetts, New Hampshire, Rhode Island, and
Vermont. 93 ISO-NE, 2017 REGIONAL SYSTEM PLAN (2017), https://perma.cc/4YSP-UWW5. 94 Id. at 19 & 41. 95 U.S. DEP'T OF HOMELAND SECURITY (DHS), CASCO BAY REGIONAL CLIMATE CHANGE RESILIENCY ASSESSMENT
40 (2016), https://perma.cc/8JL9-RWXJ. 96 The “2017-2026 Forecast Report of Capacity, Energy, Loads, and Transmission” is a source of assumptions
for use in electric planning and operations reliability studies. See ISO-NE, 2017 CELT REPORT: 2017-2026
FORECAST REPORT OF CAPACITY, ENERGY, LOADS AND TRANSMISSION (2017), https://perma.cc/Y3LV-F8D8. Its
"energy and peak load forecasts integrate state historical demand, economic and weather data, and the
Climate Change Impacts on the Bulk Power System
Sabin Center for Climate Change Law | Columbia Law School 16
We do not mean to single out ISO-NE here. It is by no means alone in its failure to
comprehensively assess the impacts of climate change on the BPS using downscaled climate
projections. ISO/RTOs typically leave such considerations to the states in which they operate or the
owners of facilities they oversee. By and large, however, those entities have not considered or
addressed the likely effects of future climate change on the BPS or its component parts. To
illustrate what this might mean, consider an example from the distribution segment of the grid:
testimony given before the New York Public Service Commission during the post-Sandy rate case
in 2013 revealed that Consolidated Edison97 had specified design parameters for its equipment that
would be incompatible with the summer temperatures expected to occur during the useful life of
that equipment.98 Climate vulnerability assessments of existing or planned segments of the BPS
could detect this sort of incompatibility—and failure to conduct such assessments is likely to leave
them present, but obscured from the analysis of risks to and constraints on BPS performance.
3.1 Approach to Planning
As discussed in section 2 above, the impacts of climate change on the BPS will vary by
region, as will the solutions available to ensure the system is climate resilient. Given this regional
variation, there can be no “one-size fits-all” approach to planning, though a number of general
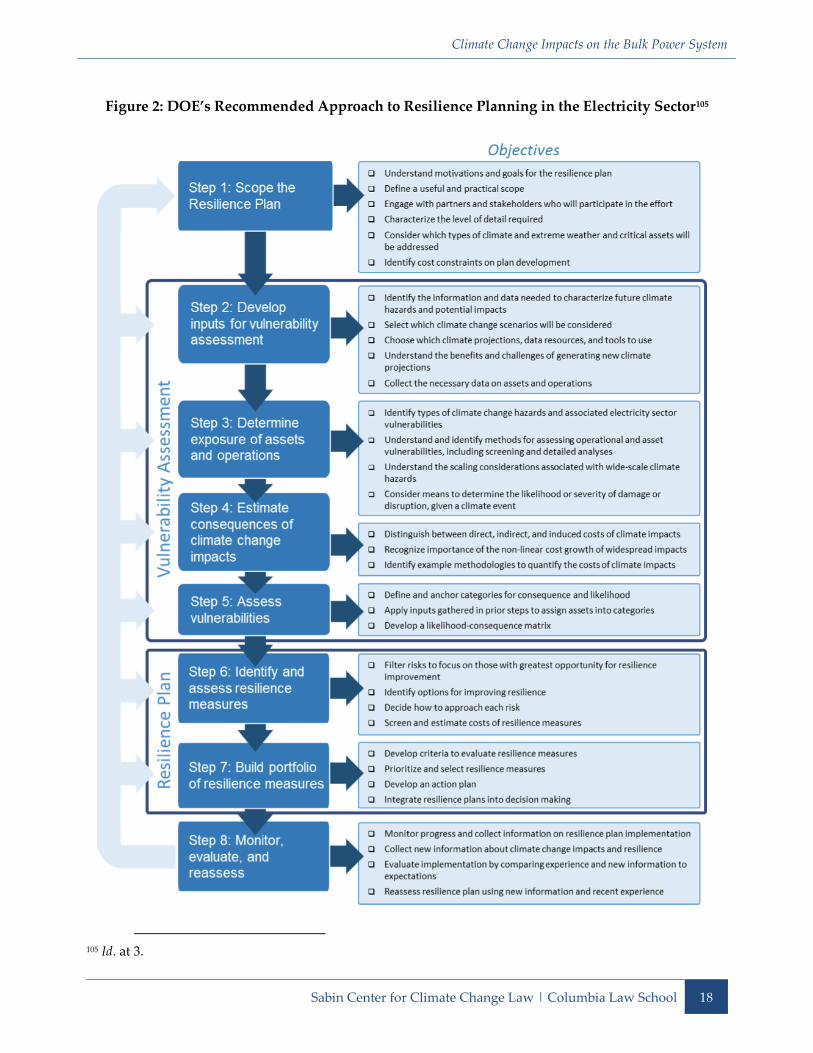
principles have been identified to guide the process. DOE, for example, has outlined eight key
steps for climate change resilience planning in the electricity sector (see Figure 2).99 Most of the
steps relate to the conduct of a vulnerability assessment which aims to identify where and under
what conditions facilities may be affected by rising temperatures, more intense storms, and other
impacts of utility-sponsored conservation and peak-load management programs." See ISO-NE, CELT Reports,
https://perma.cc/3PRT-RQJH (accessed Feb. 1, 2018). 97 Consolidated Edison is a distribution utility operating in New York City and Westchester County in New
York. 98 Report of Klaus H. Jacob on behalf of the New York State Office of the Attorney General, In re Con Edison
Major Rate Proceedings, Case Nos. 13-E-0030 et al., 10 tbl.2 (May 31, 2013) (listing expected departure from
1971-2000 baseline in 2020s, 2050s, and 2080s for, inter alia, ambient temperature); see also Consolidated
Edison Company of New York, Inc., Storm Hardening and Resiliency Collaborative Report 81 tbl.12 (Dec.
2013) (listing design standards under review for likely revision, including “temperature variable” and “heat
waves”). 99 2016 DOE Report, supra note 21.
Climate Change Impacts on the Bulk Power System
Sabin Center for Climate Change Law | Columbia Law School 17
climate-driven weather changes.100 Based on the results of the vulnerability assessment, a resilience
plan can be developed, identifying actions that should be taken to mitigate critical vulnerabilities,
either by reducing the probability of damage or disruption to facilities (e.g., through relocation or
hardening) or the consequences of any damage or disruption (e.g., by enhancing recoverability).
It is important that any planning effort take a long-term view and consider climate-related
risks over the expected useful life of transmission and generation facilities. Currently however,
stakeholders in the BPS planning process tend to employ ten to fifteen-year time horizons when
evaluating risks to reliability (and resilience),101 whereas generation and transmission facilities tend
to have useful lives of twenty-five to forty years or more.102 Thus, as DOE’s Quadrennial Energy
Review notes, "[p]lanning for decarbonization and climate resilience reaches beyond typical
planning horizons for grid operators."103
While taking a longer view is essential to adequately assess how the impacts of climate
change could constrain and disrupt BPS operations, simply expanding planning horizons would
add complexity and uncertainty to the plans developed by ISO/RTOs 104 —to a potentially
unworkable degree. Changes in technology, regulation, consumer demand, and other important
factors cannot be foreseen several decades in advance, yet the likelihood of such changes also
cannot be ignored because they could significantly affect the grounds for ISO/RTOs’ initial
100 Id. at iii. 101 See e.g., PJM, 2017 PJM Baseline Reliability Assessment for the 2017–2032 Period (Jan. 2018) (using 15-year
planning horizon). 102 See e.g., NERC, Reliability Assessments, https://perma.cc/XFC8-F6LP (accessed Feb. 5, 2018) (“Long-Term
Reliability Assessments annually assess the adequacy of the Bulk Electric System in the United States and
Canada over a 10-year period. The reports project electricity supply and demand, evaluate transmission
system adequacy, and discuss key issues and trends that could affect reliability.”); U.S. Energy Information
Administration, Nuclear Regulatory Commission resumes license renewals for nuclear power plants, TODAY IN
ENERGY (Oct. 29, 2014), https://perma.cc/D7HG-V2Q9 (reporting approvals of 20-year extensions on 40-year
operating licenses for 74 nuclear reactors); Edison Electric Institute, Transmission Projects: At A Glance (Dec.
2016), https://perma.cc/433Q-WQL7 (“. . . transmission assets are built to be in use for several decades . . . .”);
Electric Power Research Institute, Plant Support Engineering: Common Medium-Voltage Cable Specification
for Nuclear Power Plants, at vi (Oct. 2009) (“The existing fleet's medium-voltage cable population has an
average age of roughly 30 years.”). 103 Quadrennial Energy Review (Second Installment): Transforming the Nation's Electricity System 4-7 (Jan.
2017). 104 2016 DOE Report, supra note 21, at 86.
Climate Change Impacts on the Bulk Power System
Sabin Center for Climate Change Law | Columbia Law School 18
Figure 2: DOE’s Recommended Approach to Resilience Planning in the Electricity Sector105
105 Id. at 3.
Climate Change Impacts on the Bulk Power System
Sabin Center for Climate Change Law | Columbia Law School 19
planning decisions. And, of course, they could also alter aspects of the BPS’s vulnerability to
climate change and the options available to enhance its climate resilience. What to do? The
approach taken by California’s Pacific Gas and Electric (PG&E), 106 a distribution utility, to
assessing climate-related risk and resilience is instructive here.107 As part of its periodic Risk
Assessment Mitigation Phase (RAMP) effort PG&E has identified climate-driven hazards, potential
impacts of those hazards, and resilience measures that can mitigate or avoid them. But unlike other
types of risk which it assesses in just one timeframe, PG&E considers two time frames—2022 and
2050—when assessing risks arising from climate-driven hazards. 108 This approach serves to
highlight looming risks and likely constraints without forcing PG&E to speculate unduly about the
future. Furthermore, because PG&E’s RAMP efforts are periodic, it will revisit its assessment of
vulnerabilities and resilience options, updating them as appropriate.109
3.2 Existing Tools and Resources
As the foregoing discussion makes clear, significant information will be required to
conduct vulnerability assessments and prepare resilience plans, including localized climate change
projections. Such projections may be found in existing publicly available tools, datasets, and
reports developed by governmental, academic, and other independent bodies.110 Examples include:
NASA downscaled datasets;111
U.S. Geological Survey (USGS) National Climate Change and Wildlife Science Center
downscaled datasets;112
106 PG&E provides retail electricity services in the northern two-thirds of California, from Bakersfield to
almost the Oregon border. 107 PG&E, 2017 RISK ASSESSMENT AND MITIGATION PHASE 22-i – 22-20 (2017); PG&E, CLIMATE CHANGE
VULNERABILITY ASSESSMENT AND RESILIENCE STRATEGIES (2016), https://perma.cc/5LXQ-83U7. 108 Id. at 22-3. 109 2016 DOE Report, supra note 21, at 86–89 (calling for adaptive approach involving periodic review and
update). 110 Among the hundreds of datasets accessible via Data.gov, dozens capture information on climate-related
topics like precipitation, solar radiation, and temperature. See Data.gov, https://www.data.gov/climate/
(accessed Feb. 16, 2018). For a collection and description of tools and data useful for this and related
purposes, see JESSICA WENTZ, ASSESSING THE IMPACTS OF CLIMATE CHANGE ON THE BUILT ENVIRONMENT
UNDER NEPA AND STATE EIA LAWS: A SURVEY OF CURRENT PRACTICES AND RECOMMENDATIONS FOR MODEL
PROTOCOLS 15–26 (2015), https://perma.cc/M6MQ-S2UB. 111 National Aeronautics and Space Administration, NASA Earth Exchange (NEX) Downscaled Climate
Projections (NEX-DCP30).
Climate Change Impacts on the Bulk Power System
Sabin Center for Climate Change Law | Columbia Law School 20
ClimateNA (short for North America) dataset.113
New York City Panel on Climate Change data and reports;114 and
Cal-Adapt’s data, tools, and other resources;115
These resources draw on the climate models used by the Intergovernmental Panel on Climate
Change, an international body which periodically assesses global climate trends,116 and the U.S.
Global Change Research Program, which prepares national climate assessments.117 ISO/RTOs may
find it useful to review those bodies’ reports, which provide the most authoritative projections of
national and regional climate change trends.
Given uncertainty regarding the pace and magnitude of climate change—which will
depend on future emissions levels and any mitigation action taken—ISO/RTOs planning should
take into account multiple projections covering a range of scenarios (e.g., “high emissions,”
“medium emissions,” and “low emissions”).118 Plans should not be based solely on historic data,
particularly records of past storms and other extreme events, which are unlikely to reflect the
intensity of future events.
This encouragement to consult climate projections would be incomplete if it did not also
warn against reliance on data that are incomplete and/or ignore the future. The Flood Insurance
112 U.S. Geological Survey, New Statistically Downscaled Climate Data Available for the Conterminous U.S.,
http://bit.ly/2abfdNu (accessed Feb. 8, 2018); see also Adrienne Wootten et al., U.S. Geological Survey,
Downscaled Climate Projections for the Southeast United States: Evaluation and Use for Ecological
Applications, Open-File Report 2014–1190 (2014), https://perma.cc/7UYP-AF9R. 113 Tongli Wang et al., Locally Downscaled and Spatially Customizable Climate Data for Historical and Future
Periods for North America, PLoS ONE (June 2016) (describing ClimateNA software package, useful for
deriving downscaled climate data for North American locations). 114 Building the Knowledge Base for Climate Resiliency: New York City Panel on Climate Change 2015 Report, 1336
Ann. N.Y. Acad. Scis. 1–150 (2015). 115 See http://cal-adapt.org/ (accessed Feb. 8, 2018), Cal-Adapt is the product of a collaboration among state
agencies, universities, and private companies based in California. Susan Wilhelm, Cal. Energy Comm’n,
Unveiling Cal-Adapt 2.0: Facilitating Energy Sector Resilience and Providing Foundational Scenarios for
California’s Fourth Climate Change Assessment, IEPR Workshop on Adaptation and Resilience for the
Energy System, Sacramento, California, Aug. 29, 2017, https://perma.cc/27TJ-H2J7. 116 See Intergovernmental Panel on Climate Change, https://perma.cc/Y2S6-2GDA (accessed Feb. 9, 2018). 117 See U.S. Global Change Research Program, Climate Science Special Report, https://perma.cc/2XL4-SBDN
(accessed Feb. 9, 2018). 118 Consistent with this recommendation, PG&E’s Climate Resilience RAMP considers two emissions
scenarios. PG&E, supra note 107, at 22-3.
Climate Change Impacts on the Bulk Power System
Sabin Center for Climate Change Law | Columbia Law School 21
Rate Maps (FIRMs) developed by the Federal Emergency Management Authority (FEMA) for use
in the National Flood Insurance Program (NFIP) usefully illustrate this danger. To begin, FIRMs
are strictly backward looking, even though the risks they purport to depict are highly sensitive to
several climate-driven impacts. FIRMs also suffer from several other problematic limitations,
resulting from their design parameters and the funding and administration of mapping efforts.119
Currently, for instance, the maps do not reflect flood risks arising from the rapid accumulation of
precipitation, such as occurred in Houston during Hurricane Harvey. The Technical Mapping
Advisory Council (TMAC), established to review and suggest improvements to the maps, has
issued a host of recommendations to FEMA,120 most of which have gone largely unheeded.121
A 2017 Inspector General’s report highlighted several programmatic deficiencies as well, such as
the slow rate of updating and poor application of quality control measures.122 Thus BPS planning
decisions should not rely exclusively on FEMA flood maps to determine flood risk in the near or
long-term.
4. RECOMMENDATIONS
To ensure that the BPS continues to deliver reliable electricity services at just and
reasonable rates, FERC and ISO/RTOs must plan for the impacts of climate change.
Recommendations to guide the planning process are set out below.
A detailed climate change vulnerability assessment should be undertaken to determine how
the components and operations of each ISO/RTO’s system will be affected by increasing
119 For an overview of the key issues, see Michael Keller et al., Outdated and Unreliable: FEMA’s Faulty Flood
Maps Put Homeowners at Risk, Bloomberg, Oct. 6, 2017, https://perma.cc/QWN8-PNRL. Notably, mapping
efforts were an incidental feature of the NFIP until 2012, when new legislation incorporated them into the
independently authorized and funded National Flood Mapping Program. See Biggert-Waters Flood
Insurance Reform Act of 2012, Pub. L. No. 112-132, 126 Stat. 365 (May 31, 2012), codified at 42 U.S.C. § 4101b. 120 See TMAC, National Flood Mapping Program Review (June 2016), http://bit.ly/2sclUaH; TMAC, Future
Conditions Risk Assessment and Modeling (Dec. 2015), http://bit.ly/2fJY7Vq. 121 See Comment letter from Sabin Center for Climate Change Law to FEMA, re National Flood Insurance
Program Draft Nationwide Programmatic, June 1, 2017, at 7–10, https://perma.cc/3AGQ-Q7SF. 122 DHS OFFICE OF THE INSPECTOR GENERAL, FEMA NEEDS TO IMPROVE MANAGEMENT OF ITS FLOOD MAPPING
PROGRAMS (2017), http://bit.ly/2nNoLkV.
Climate Change Impacts on the Bulk Power System
Sabin Center for Climate Change Law | Columbia Law School 22
temperatures, changing precipitation patterns, more intense storms, droughts, and other
climate-driven weather extremes expected in their respective regions.
Vulnerability assessments should be based on downscaled projections of future climate
change in their respective operating regions. Many projections are available in existing
datasets, including those developed by NASA and the USGS.
Where even downscaled projections fail to provide data for key variables (e.g., humidity
(wet-bulb temperature) or temperatures at particular times of day) the entity conducting
the assessment should, at minimum, acknowledge the lack of complete information, and, if
possible, seek to supplement available data sets.
Multiple projections reflecting a range of possible climate change scenarios, including a
“worst case” (i.e., assuming continued high greenhouse gas emissions lead to large
temperature increases and rapid rates of sea level rise), should be considered in the
vulnerability assessment.
The timeframe for the vulnerability assessment should reflect the anticipated useful life of
existing facilities or facilities scheduled for construction in the relevant ISO/RTO’s region.
The vulnerability assessment should be periodically reviewed and updated as new
information becomes available.
Based on the vulnerability assessment, a resilience plan should be developed, outlining
measures that can be taken to prevent or manage system disruptions.
5. CONCLUSION
FERC and NERC’s ongoing efforts to address risks to electric reliability aim to, among
other things, “identif[y] long-term emerging issues and trends that do not necessarily pose an
immediate threat to reliability but will influence future [BPS] planning, development and system
Climate Change Impacts on the Bulk Power System
Sabin Center for Climate Change Law | Columbia Law School 23
analysis.”123 The resilience of the BPS to climate-driven impacts—and to other impacts amid
climate-related constraints—falls cleanly within this mandate. The implications of climate change
for the BPS should inform efforts by ISO/RTOs, FERC, and NERC to ensure its resilience to all
manner of disruptions.
123 NERC, Reliability Assessment and Performance Analysis, https://perma.cc/TMZ9-BXCL (accessed Feb. 1,
2018).
Climate Change Impacts on the Bulk Power System
Sabin Center for Climate Change Law | Columbia Law School 24
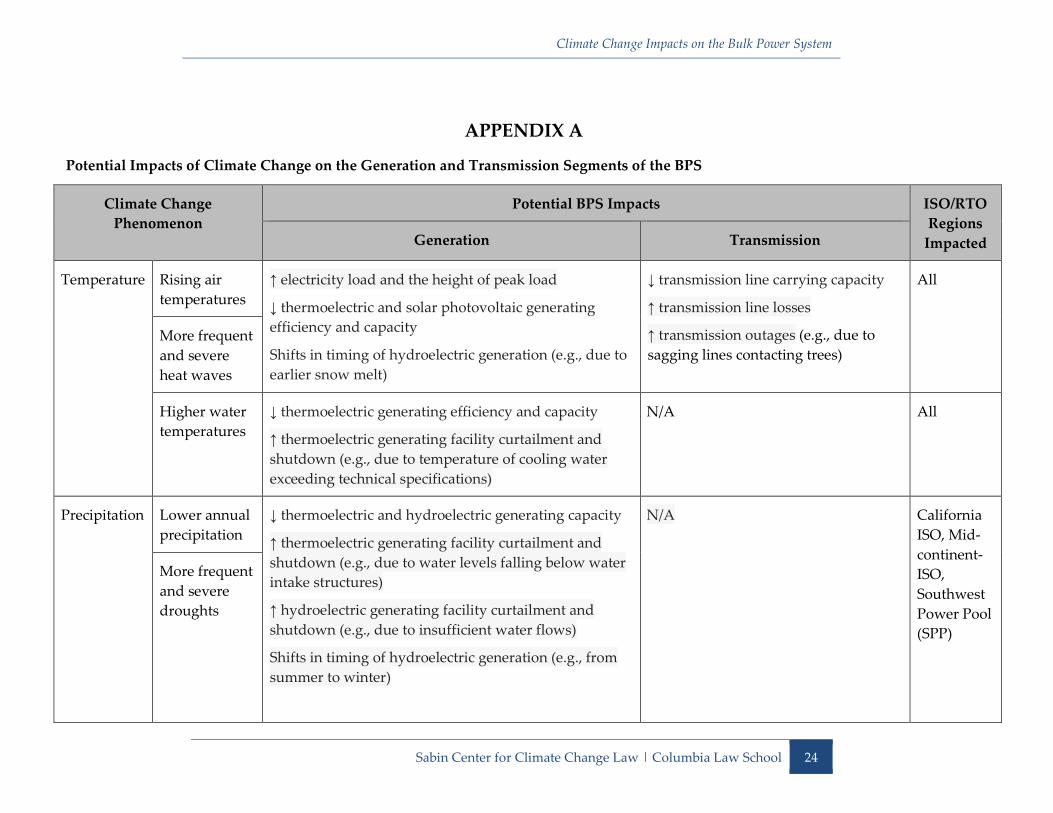
APPENDIX A
Potential Impacts of Climate Change on the Generation and Transmission Segments of the BPS
Climate Change
Phenomenon
Potential BPS Impacts ISO/RTO
Regions
Impacted Generation Transmission
Temperature Rising air
temperatures
↑ electricity load and the height of peak load
↓ thermoelectric and solar photovoltaic generating
efficiency and capacity
Shifts in timing of hydroelectric generation (e.g., due to
earlier snow melt)
↓ transmission line carrying capacity
↑ transmission line losses
↑ transmission outages (e.g., due to
sagging lines contacting trees)
All
More frequent
and severe
heat waves
Higher water
temperatures
↓ thermoelectric generating efficiency and capacity
↑ thermoelectric generating facility curtailment and
shutdown (e.g., due to temperature of cooling water
exceeding technical specifications)
N/A All
Precipitation Lower annual
precipitation
↓ thermoelectric and hydroelectric generating capacity
↑ thermoelectric generating facility curtailment and
shutdown (e.g., due to water levels falling below water
intake structures)
↑ hydroelectric generating facility curtailment and
shutdown (e.g., due to insufficient water flows)
Shifts in timing of hydroelectric generation (e.g., from
summer to winter)
N/A California
ISO, Mid-
continent-
ISO,
Southwest
Power Pool
(SPP)
More frequent
and severe
droughts
Climate Change Impacts on the Bulk Power System
Sabin Center for Climate Change Law | Columbia Law School 25
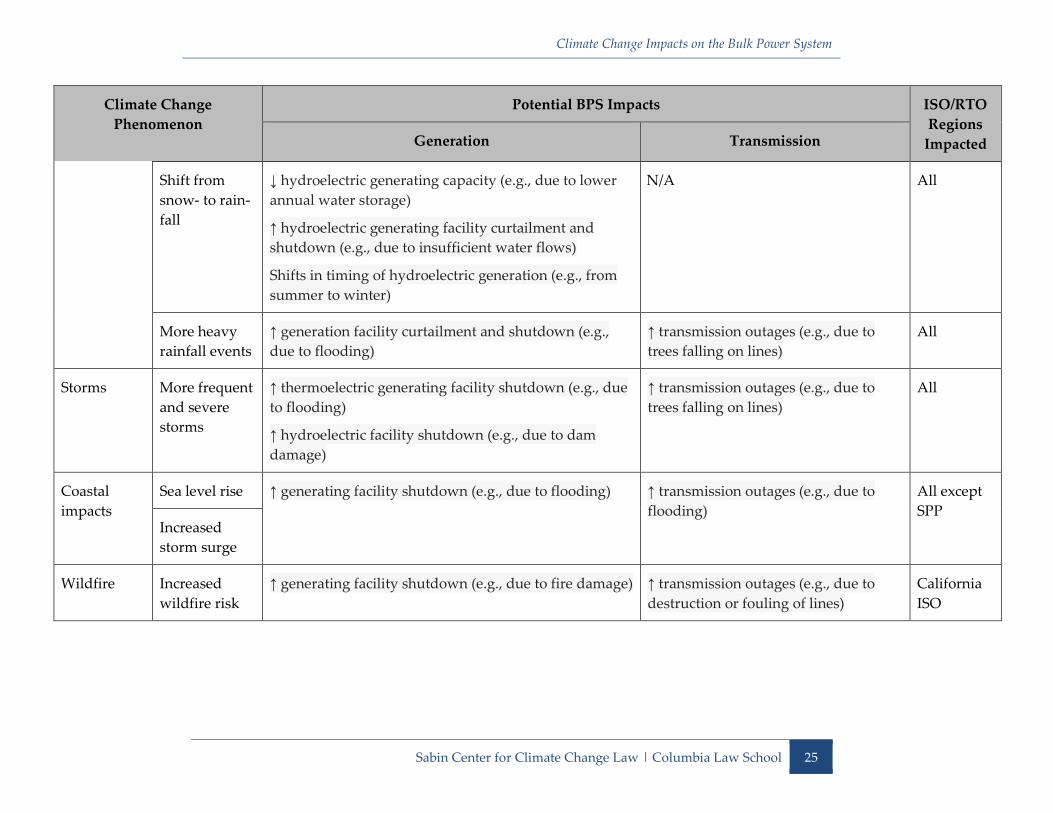
Climate Change
Phenomenon
Potential BPS Impacts ISO/RTO
Regions
Impacted Generation Transmission
Shift from
snow- to rain-
fall
↓ hydroelectric generating capacity (e.g., due to lower
annual water storage)
↑ hydroelectric generating facility curtailment and
shutdown (e.g., due to insufficient water flows)
Shifts in timing of hydroelectric generation (e.g., from
summer to winter)
N/A All
More heavy
rainfall events
↑ generation facility curtailment and shutdown (e.g.,
due to flooding)
↑ transmission outages (e.g., due to
trees falling on lines)
All
Storms More frequent
and severe
storms
↑ thermoelectric generating facility shutdown (e.g., due
to flooding)
↑ hydroelectric facility shutdown (e.g., due to dam
damage)
↑ transmission outages (e.g., due to
trees falling on lines)
All
Coastal
impacts
Sea level rise ↑ generating facility shutdown (e.g., due to flooding) ↑ transmission outages (e.g., due to
flooding)
All except
SPP Increased
storm surge
Wildfire Increased
wildfire risk
↑ generating facility shutdown (e.g., due to fire damage) ↑ transmission outages (e.g., due to
destruction or fouling of lines)
California
ISO