2008 Summer Operating Expected Conditions Bulk Power Operations Power Coordination Center Bulk Power...
29
2008 Summer Operating Expected Conditions Bulk Power Operations Power Coordination Center
-
Upload
brian-rich -
Category
Documents
-
view
215 -
download
0
Transcript of 2008 Summer Operating Expected Conditions Bulk Power Operations Power Coordination Center Bulk Power...
2008 Summer Operating Expected Conditions
2008 Summer Operating Expected Conditions
Bulk Power OperationsPower Coordination Center
Bulk Power OperationsPower Coordination Center
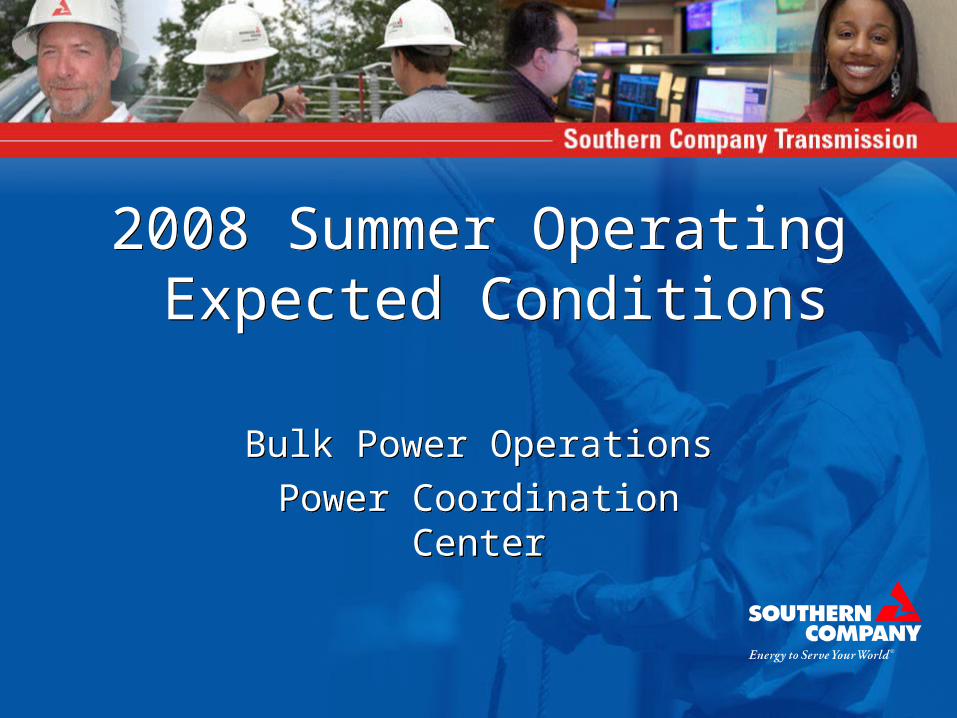
TOPICS
•2007 Review
•2008 SOCO Balancing Authority (BA) Area
Summer Weather Forecast
Peak Demand Forecast
Transmission Overview
Summer Preparations
The information contained in this presentation has been gathered from many sources to provide a general overview of expected summer operating conditions. While the data contained is believed to be accurate, Southern Companies assume no responsibility for its accuracy or any use by other parties.
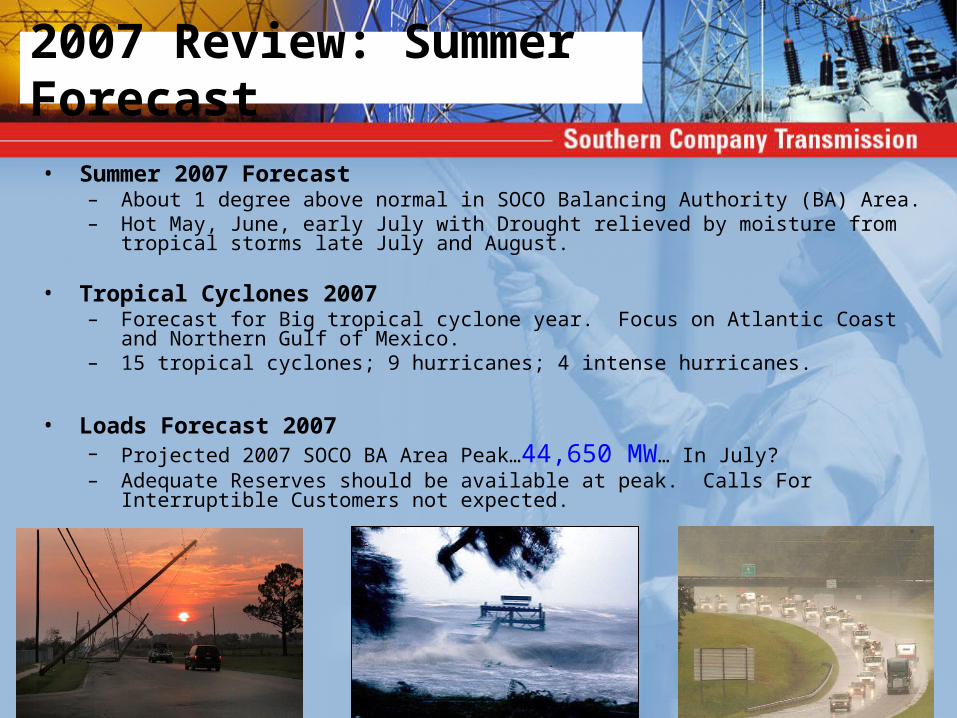
2007 Review: Summer Forecast
• Summer 2007 Forecast– About 1 degree above normal in SOCO Balancing Authority (BA) Area.– Hot May, June, early July with Drought relieved by moisture from tropical storms late July and August.
• Tropical Cyclones 2007– Forecast for Big tropical cyclone year. Focus on Atlantic Coast and Northern Gulf of Mexico.– 15 tropical cyclones; 9 hurricanes; 4 intense hurricanes.
• Loads Forecast 2007– Projected 2007 SOCO BA Area Peak…44,650 MW… In July?– Adequate Reserves should be available at peak. Calls For Interruptible Customers not expected.
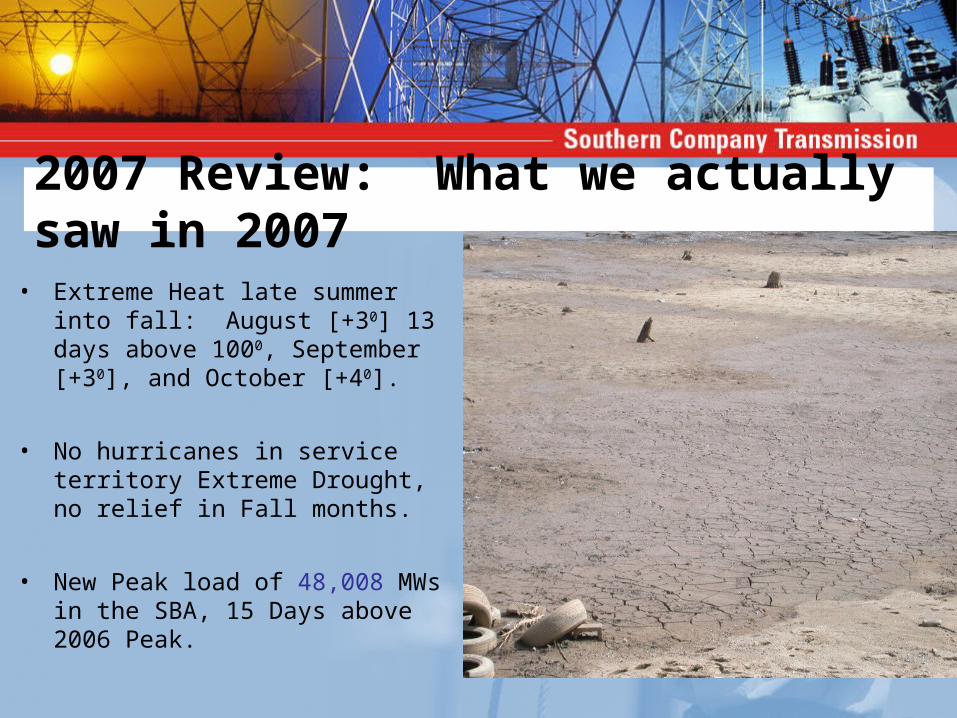
2007 Review: What we actually saw in 2007
• Extreme Heat late summer into fall: August [+30] 13 days above 1000, September [+30], and October [+40].
• No hurricanes in service territory Extreme Drought, no relief in Fall months.
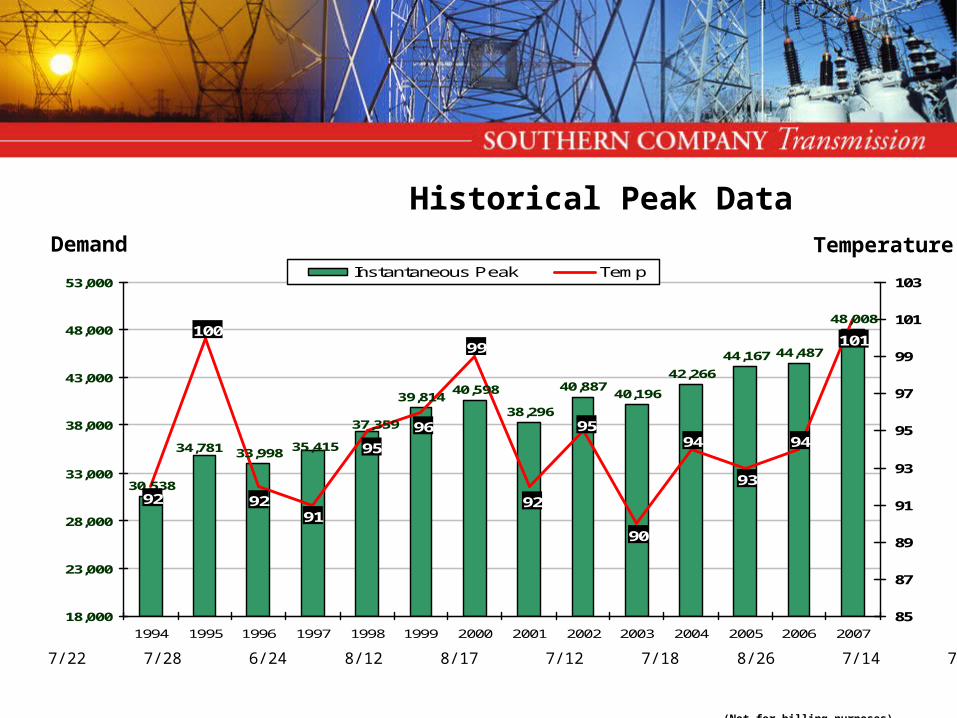
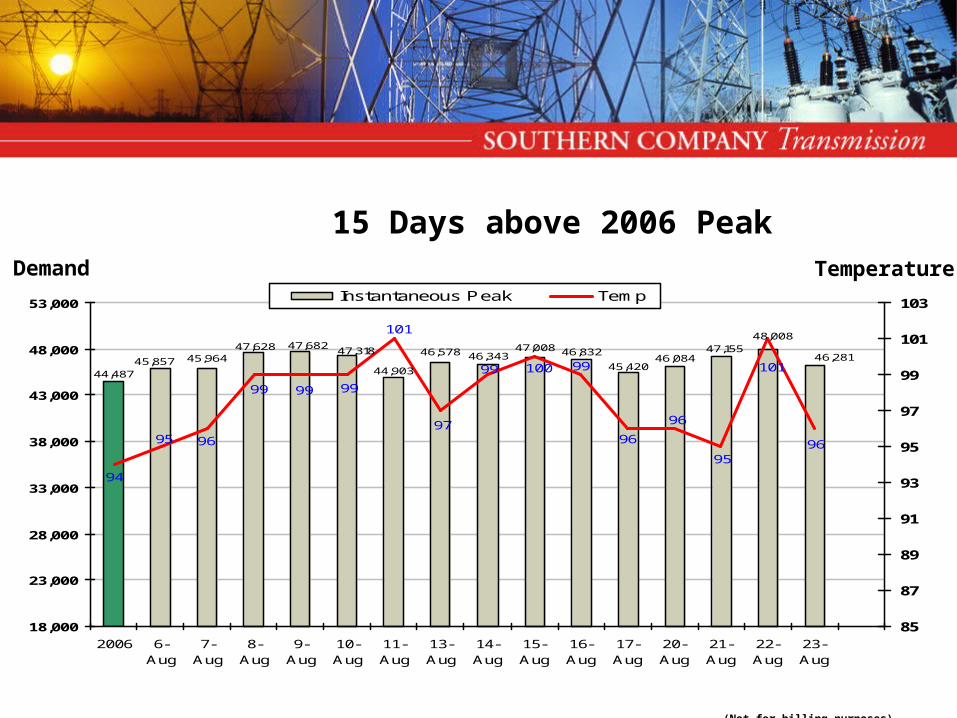
• New Peak load of 48,008 MWs in the SBA, 15 Days above 2006 Peak.
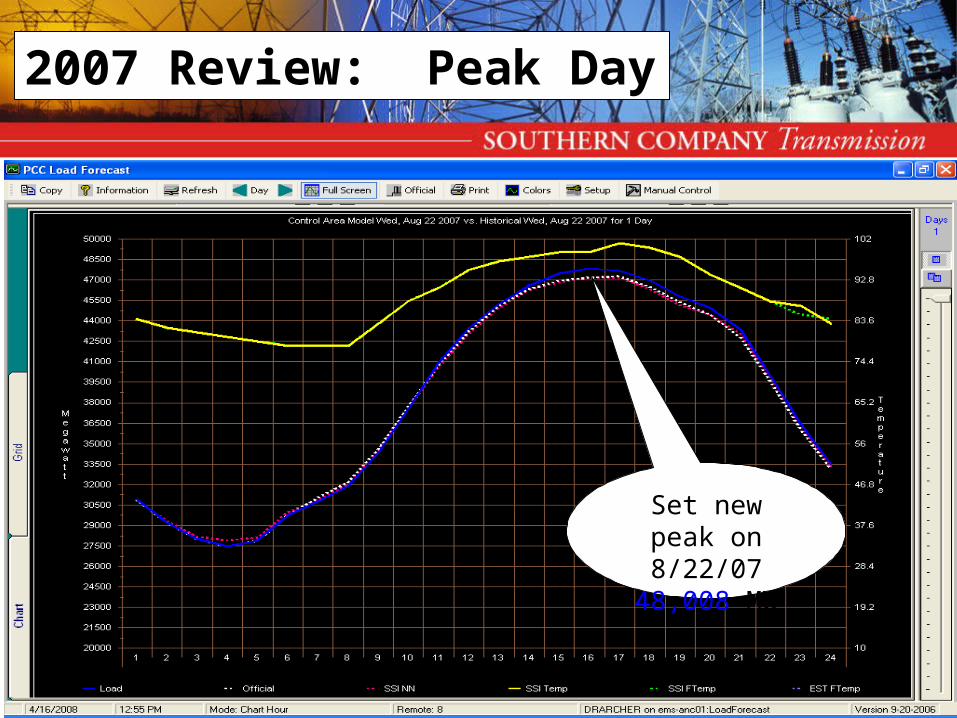
Set new peak on 8/22/07 48,008
MW
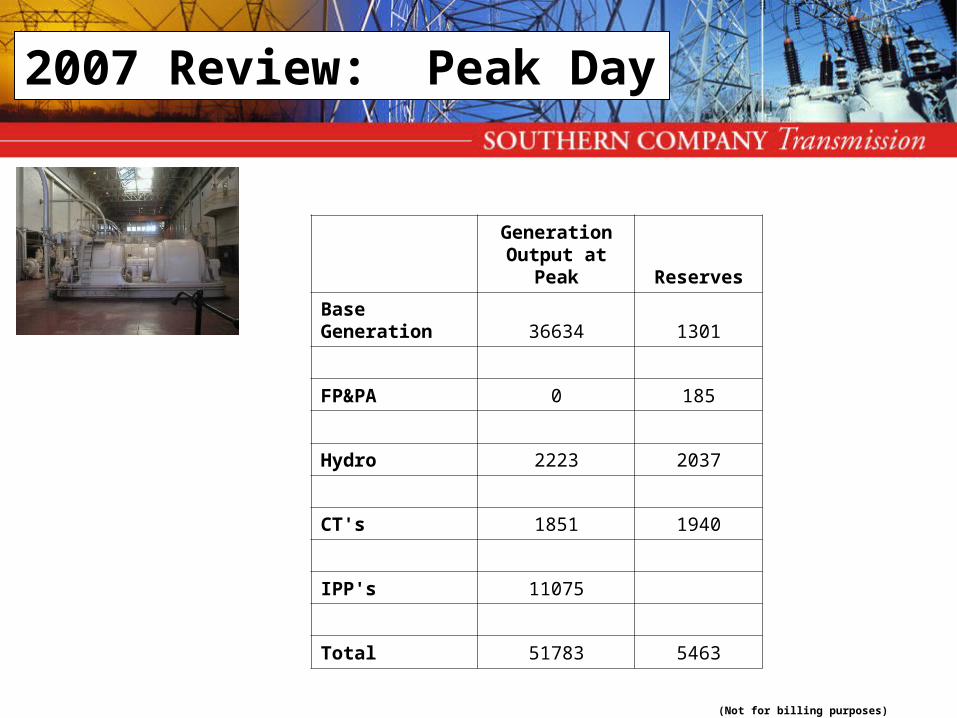
2007 Review: Peak Day
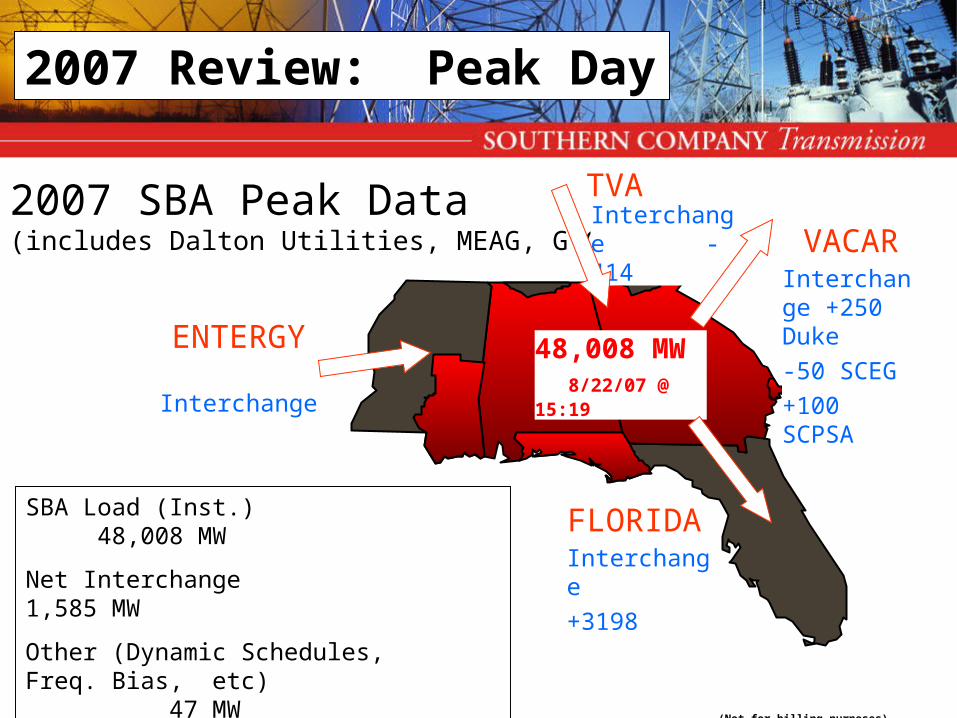
2007 SBA Peak Data(includes Dalton Utilities, MEAG, GTC ,SOCO)
Interchange -1478
Interchange -414
Interchange +250 Duke-50 SCEG+100 SCPSA
Interchange+3198
48,008 MW 8/22/07 @ 15:19
VACAR
TVA
ENTERGY
FLORIDASBA Load (Inst.) 48,008 MW
Net Interchange 1,585 MW
Other (Dynamic Schedules,Freq. Bias, etc) 47 MW
SBA Net Output @ Peak 49,640 MW
(Not for billing purposes)
2007 Review: Peak Day
2007 Review: Peak Day
(Not for billing purposes)
Generation
Output at Peak Reserves
Base Generation 36634 1301
FP&PA 0 185
Hydro 2223 2037
CT's 1851 1940
IPP's 11075
Total 51783 5463
33,998
39,81440,598
38,296
40,88740,196
42,266
44,167 44,487
48,008
37,359
34,781 35,415
30,538
101
94
93
94
90
92
95
92
96
10099
95
9192
18,000
23,000
28,000
33,000
38,000
43,000
48,000
53,000
1994 1995 1996 1997 1998 1999 2000 2001 2002 2003 2004 2005 2006 2007
85
87
89
91
93
95
97
99
101
103Instantaneous Peak Temp
- Historical Peak DataTemperatureDemand
8/30 8/18 7/22 7/28 6/24 8/12 8/17 7/12 7/18 8/26 7/14 7/26 8/7 8/22
(Not for billing purposes)
45,96446,578 47,008 47,155
46,08445,420
46,83246,343
44,903
48,008
46,28147,318
44,487
47,628
45,857
47,682
95
101
96
94
99
99
101
95
99
96
99
97
100 99
96
96
18,000
23,000
28,000
33,000
38,000
43,000
48,000
53,000
2006 6-Aug
7-Aug
8-Aug
9-Aug
10-Aug
11-Aug
13-Aug
14-Aug
15-Aug
16-Aug
17-Aug
20-Aug
21-Aug
22-Aug
23-Aug
85
87
89
91
93
95
97
99
101
103Instantaneous Peak Temp
- 15 Days above 2006 PeakTemperatureDemand
(Not for billing purposes)

Hrs. SBA Load > 40,000 MW
0
50
100
150
200
250
300
350
# of Hours
264
123
27
290
Lots of hours at high loads...
(Not for billing purposes)
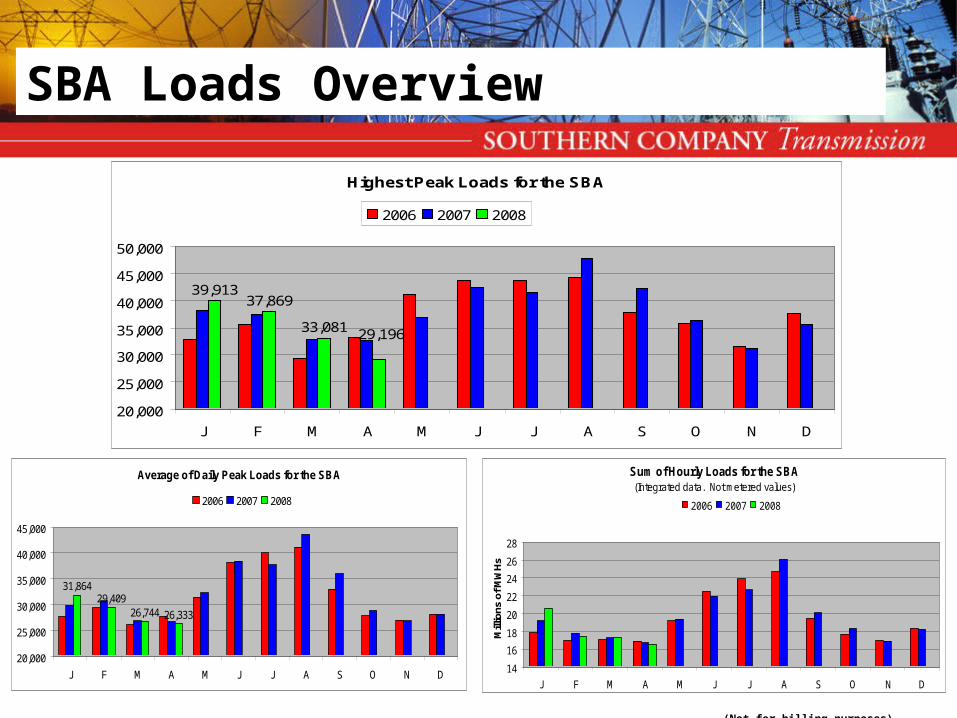
SBA Loads Overview
Highest Peak Loads for the SBA
39,91337,869
33,081 29,196
20,000
25,000
30,000
35,000
40,000
45,000
50,000
J F M A M J J A S O N D
2006 2007 2008
Average of Daily Peak Loads for the SBA
31,86429,409
26,744 26,333
20,000
25,000
30,000
35,000
40,000
45,000
J F M A M J J A S O N D
2006 2007 2008
Sum of Hourly Loads for the SBA(Integrated data. Not metered values)
14
16
18
20
22
24
26
28
J F M A M J J A S O N D
Mill
ions
of M
WH
s2006 2007 2008
2008 SOCO Balancing Authority (BA) Area Summer Weather Forecast
“The trouble with weather forecasting is that it's right too often for us to ignore it and wrong too often for us to rely on it.” Patrick Young
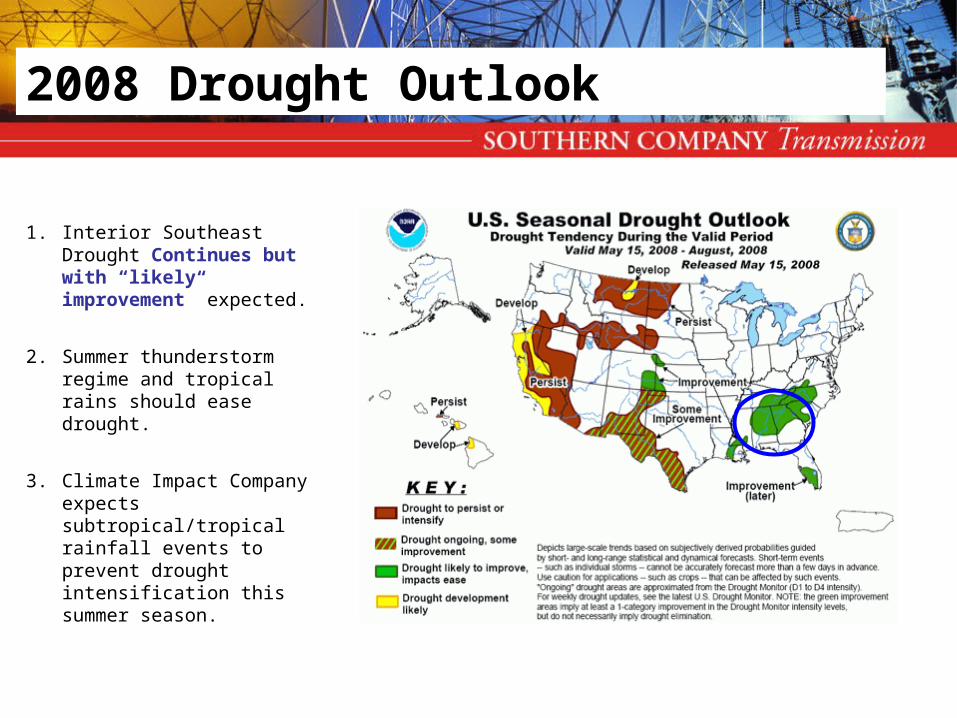
1. Interior Southeast Drought Continues but with “likely improvement” expected.
2. Summer thunderstorm regime and tropical rains should ease drought.
3. Climate Impact Company expects subtropical/tropical rainfall events to prevent drought intensification this summer season.
2008 Drought Outlook
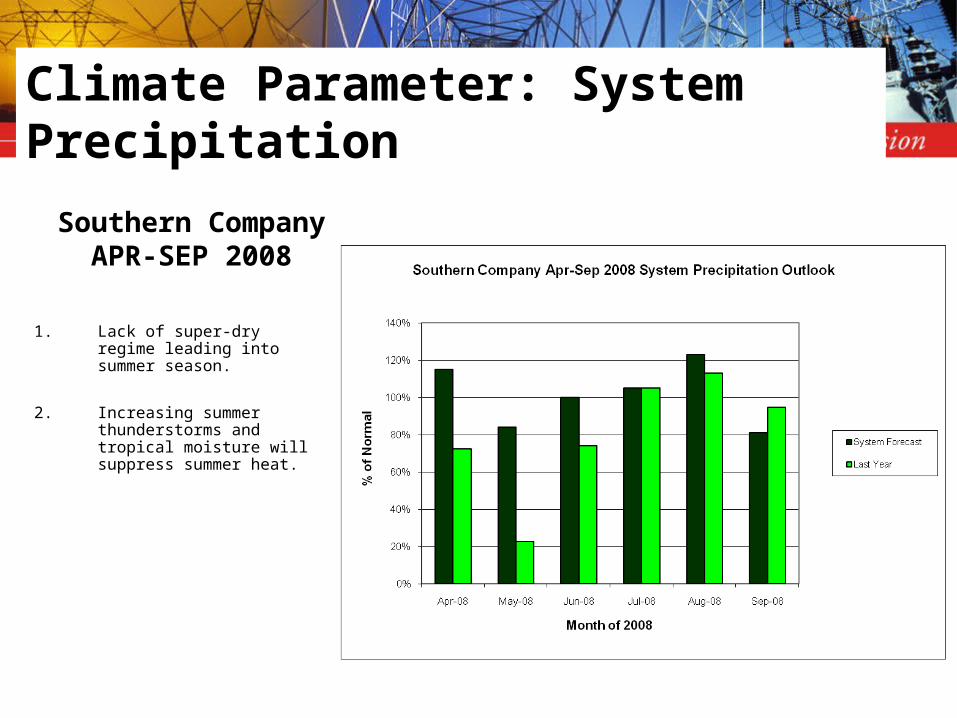
1. Lack of super-dry regime leading into summer season.
2. Increasing summer thunderstorms and tropical moisture will suppress summer heat.
Southern Company APR-SEP 2008
Climate Parameter: System Precipitation
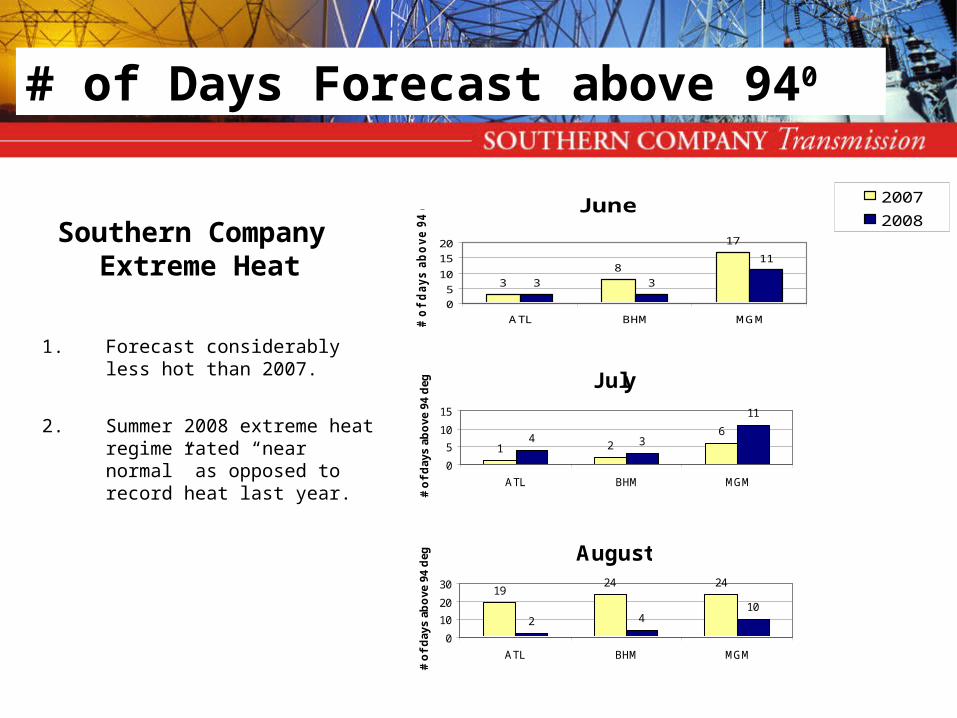
1. Forecast considerably less hot than 2007.
2. Summer 2008 extreme heat regime rated “near normal” as opposed to record heat last year.
Southern Company Extreme Heat
# of Days Forecast above 940
June
3
8
17
3 3
11
0
5
10
15
20
ATL BHM MGM# o
f d
ays a
bo
ve 9
4 d
eg 2007
2008
July
1 26
4 3
11
0
5
10
15
ATL BHM MGM
# o
f d
ays
abo
ve 9
4 d
eg
August
1924 24
2 410
0
10
20
30
ATL BHM MGM
# o
f d
ays
abo
ve 9
4 d
eg

• Slightly warmer-than-normal summer.
• Warmest month compared to normal is June. July/August close to normal.
• Much different from last summer, lacking month-to-month extremes and lack of (record) heat.
• Key is rainfall that suppresses heat and eases affect of drought on the temperature pattern.
• If subtropical/tropical rainfall events fail to occur, a hotter summer is likely.
• Risk of affects from tropical cyclones at above normal risk this year.
2008 Summer Forecast Summary
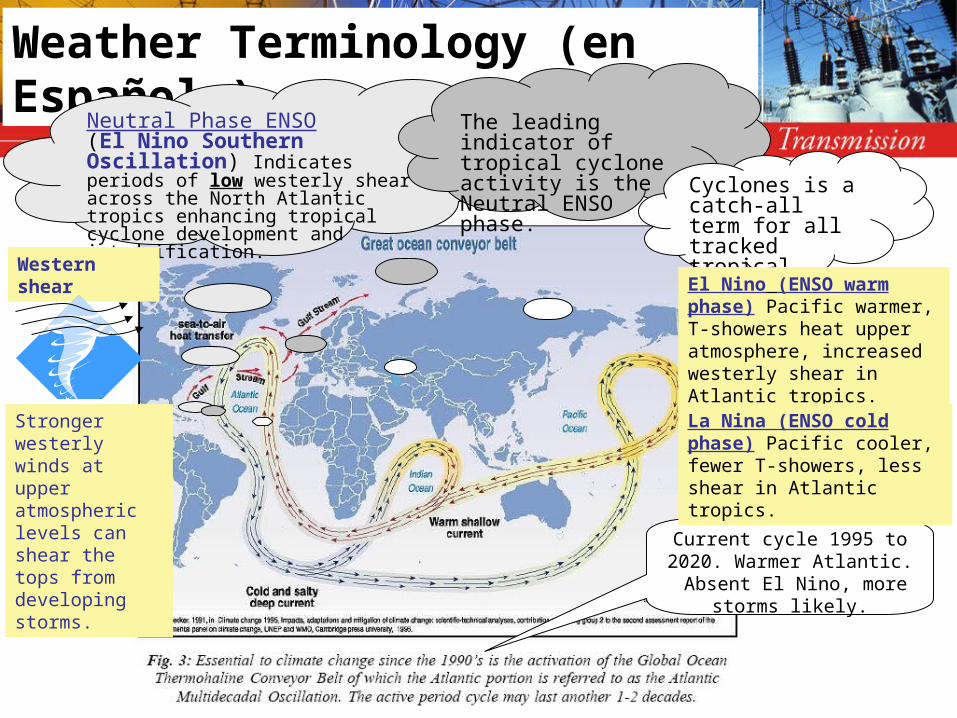
Weather Terminology (en Español )
Neutral Phase ENSO(El Nino Southern Oscillation) Indicates periods of low westerly shear across the North Atlantic tropics enhancing tropical cyclone development and intensification.
The leading indicator of tropical cyclone activity is the Neutral ENSO phase.
Cyclones is a catch-all term for all tracked tropical storms.
El Nino (ENSO warm phase) Pacific warmer, T-showers heat upper atmosphere, increased westerly shear in Atlantic tropics.
Current cycle 1995 to 2020. Warmer Atlantic. Absent El
Nino, more storms likely.
La Nina (ENSO cold phase) Pacific cooler, fewer T-showers, less shear in Atlantic tropics.
Western shear
Stronger westerly winds at upper atmospheric levels can shear the tops from developing storms.
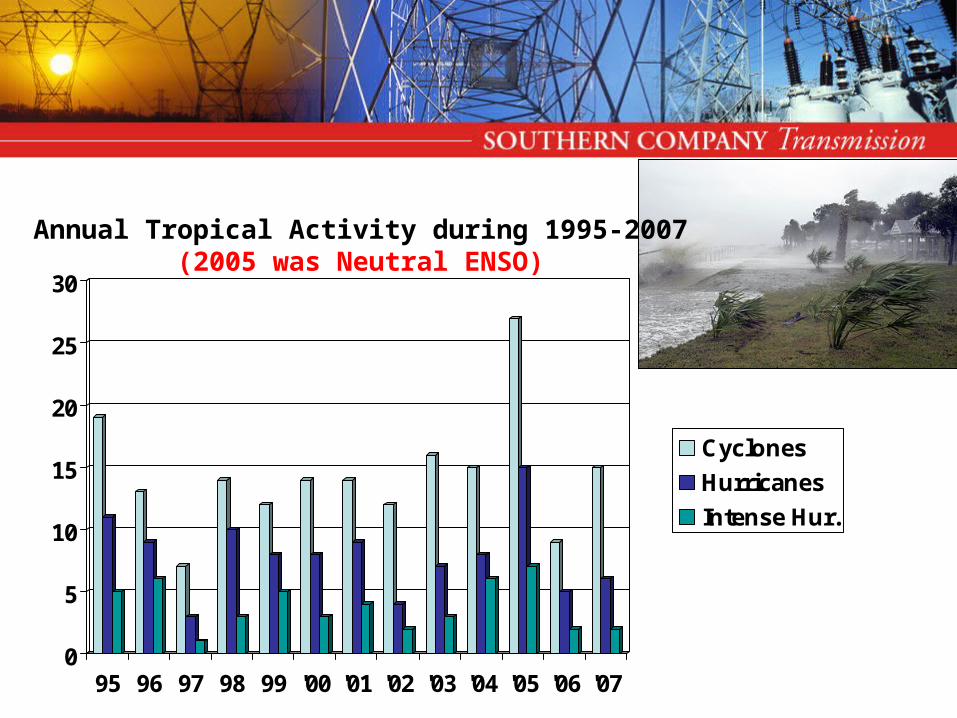
0
5
10
15
20
25
30
95 96 97 98 99 '00 '01 '02 '03 '04 '05 '06 '07
Cyclones
Hurricanes
Intense Hur.
Annual Tropical Activity during 1995-2007(2005 was Neutral ENSO)
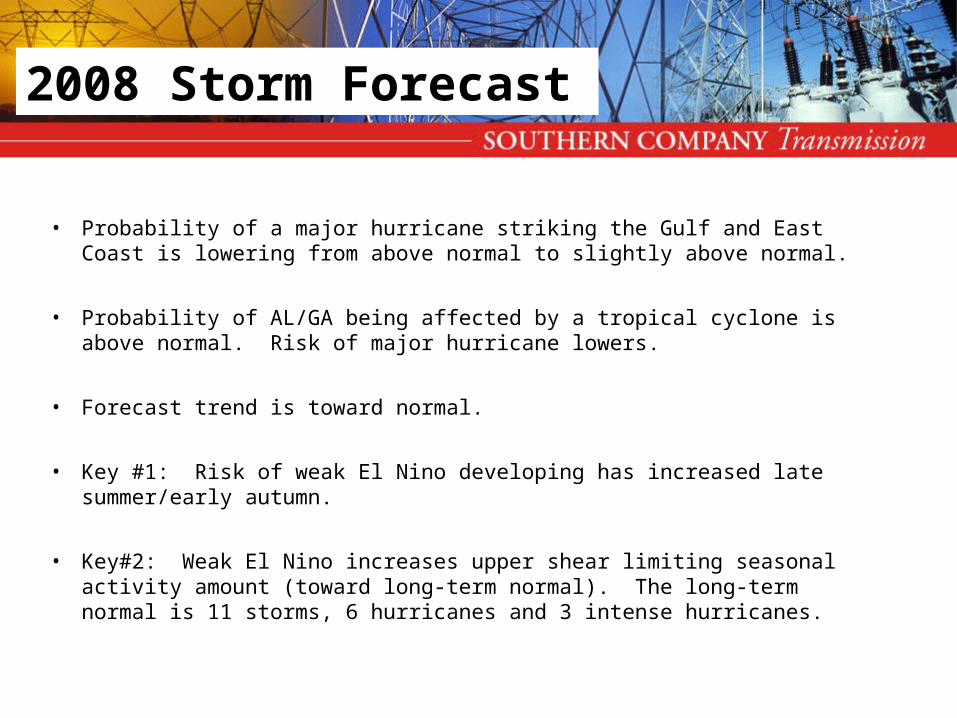
• Probability of a major hurricane striking the Gulf and East Coast is lowering from above normal to slightly above normal.
• Probability of AL/GA being affected by a tropical cyclone is above normal. Risk of major hurricane lowers.
• Forecast trend is toward normal.
• Key #1: Risk of weak El Nino developing has increased late summer/early autumn.
• Key#2: Weak El Nino increases upper shear limiting seasonal activity amount (toward long-term normal). The long-term normal is 11 storms, 6 hurricanes and 3 intense hurricanes.
2008 Storm Forecast
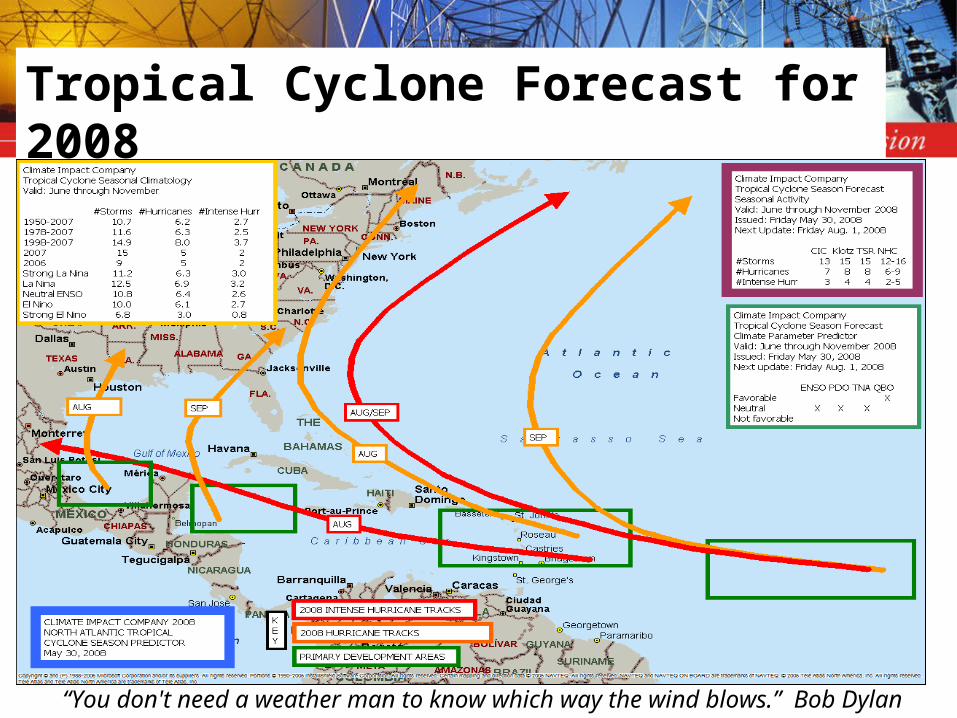
“You don't need a weather man to know which way the wind blows.” Bob Dylan
Tropical Cyclone Forecast for 2008
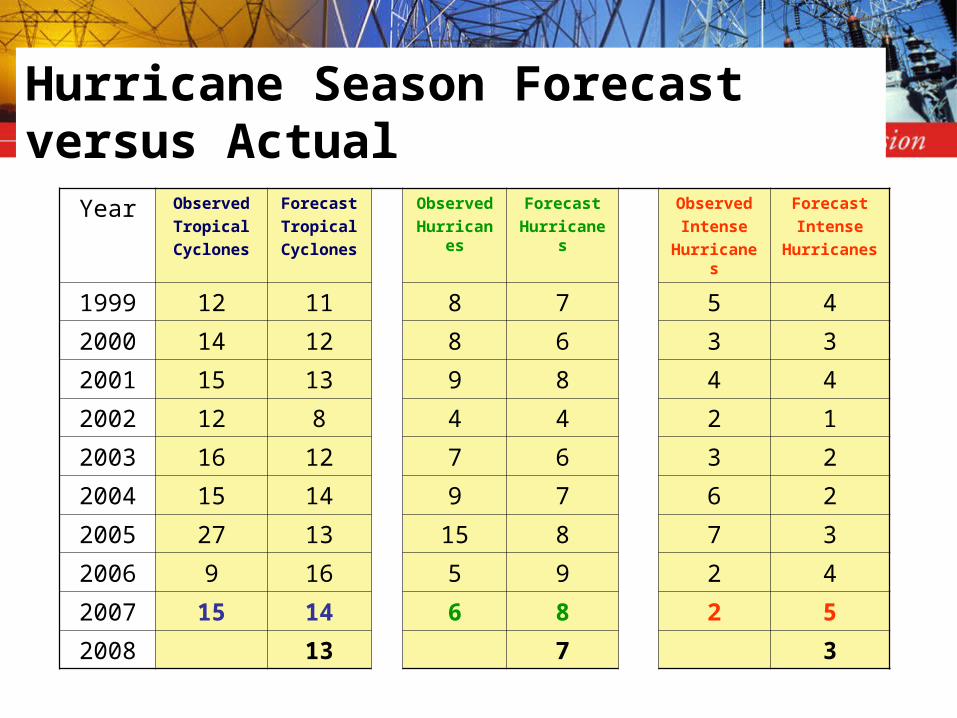
Year Observed
Tropical
Cyclones
Forecast
Tropical
Cyclones
Observed
Hurricanes
Forecast
Hurricanes
Observed
Intense
Hurricanes
Forecast
Intense
Hurricanes
1999 12 11 8 7 5 4
2000 14 12 8 6 3 3
2001 15 13 9 8 4 4
2002 12 8 4 4 2 1
2003 16 12 7 6 3 2
2004 15 14 9 7 6 2
2005 27 13 15 8 7 3
2006 9 16 5 9 2 4
2007 15 14 6 8 2 5
2008 13 7 3
Hurricane Season Forecast versus Actual
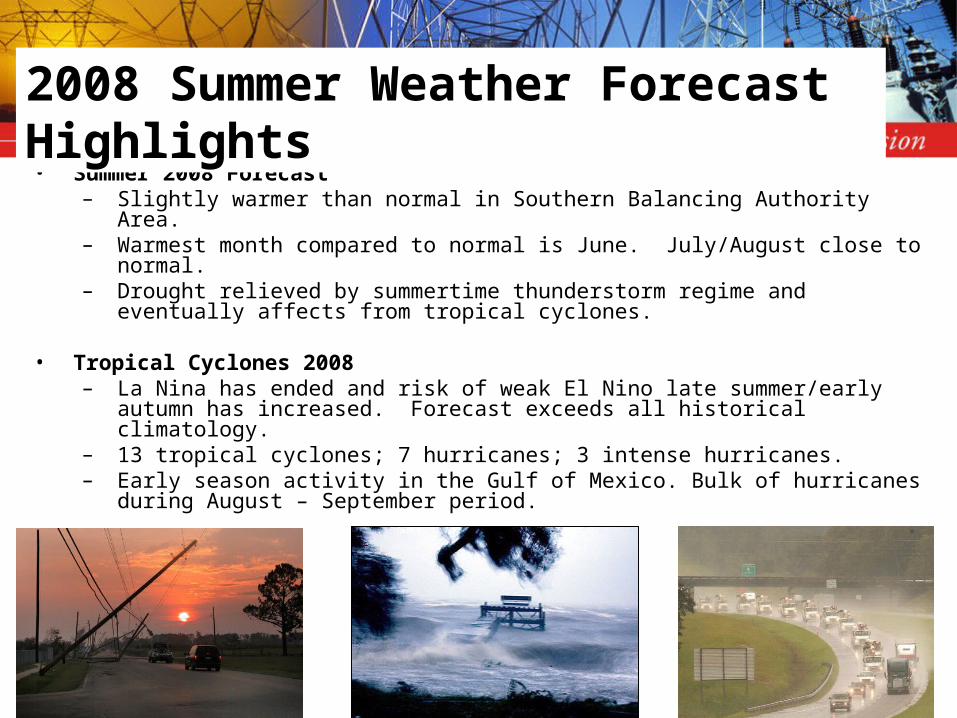
• Summer 2008 Forecast– Slightly warmer than normal in Southern Balancing Authority Area.– Warmest month compared to normal is June. July/August close to normal.– Drought relieved by summertime thunderstorm regime and eventually affects from
tropical cyclones.
• Tropical Cyclones 2008– La Nina has ended and risk of weak El Nino late summer/early autumn has
increased. Forecast exceeds all historical climatology.– 13 tropical cyclones; 7 hurricanes; 3 intense hurricanes.– Early season activity in the Gulf of Mexico. Bulk of hurricanes during August –
September period.
2008 Summer Weather Forecast Highlights
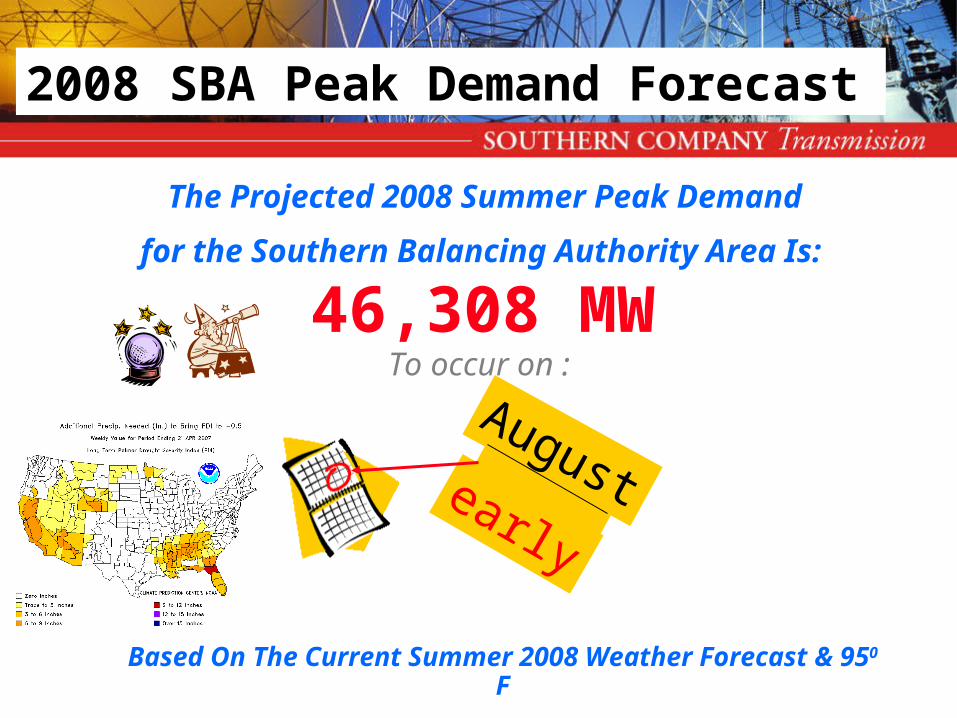
46,308 MW
Based On The Current Summer 2008 Weather Forecast & 950 F
Augustearly
The Projected 2008 Summer Peak Demand
for the Southern Balancing Authority Area Is: :
To occur on :
2008 SBA Peak Demand Forecast
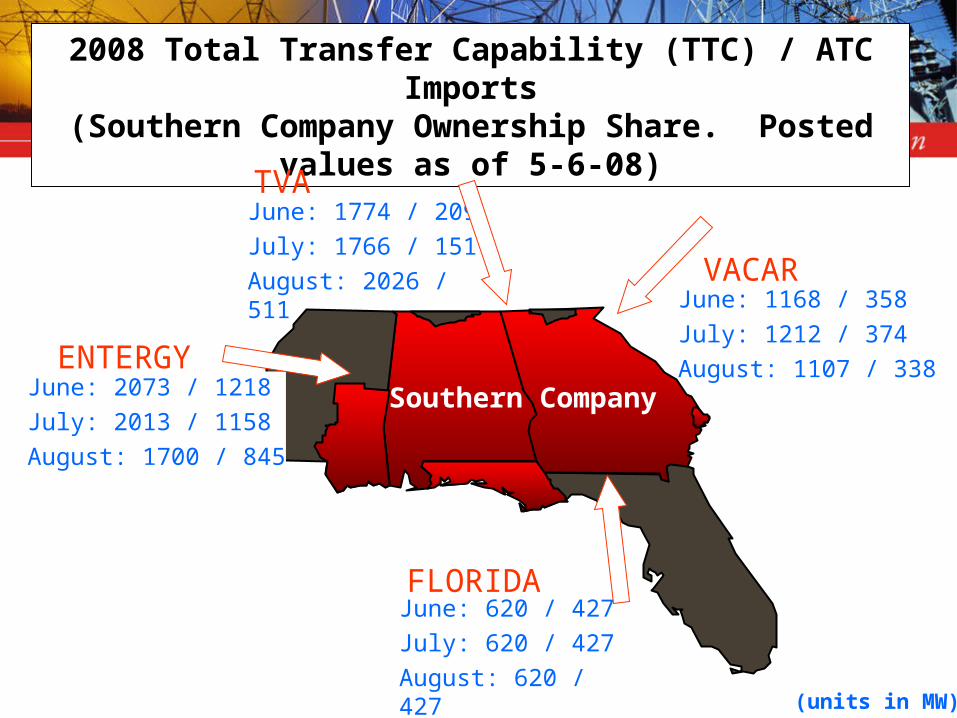
2008 Total Transfer Capability (TTC) / ATC Imports(Southern Company Ownership Share. Posted values as of 5-6-08)
June: 2073 / 1218July: 2013 / 1158August: 1700 / 845
June: 1774 / 209July: 1766 / 151August: 2026 / 511
June: 1168 / 358July: 1212 / 374August: 1107 / 338
June: 620 / 427July: 620 / 427August: 620 / 427
Southern Company
VACAR
TVA
ENTERGY
FLORIDA
(units in MW)
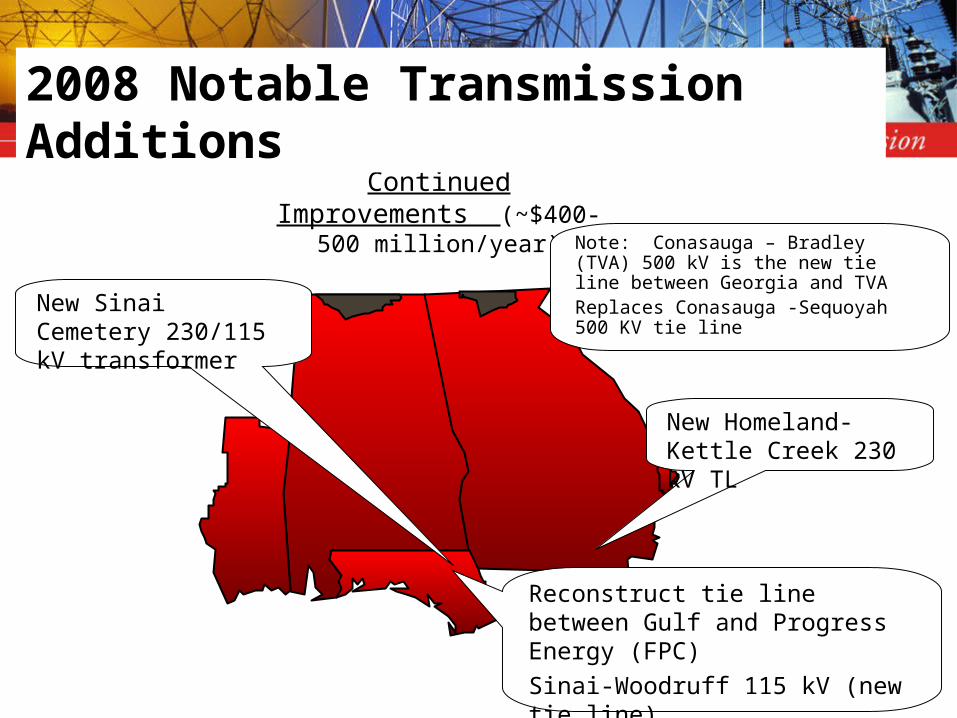
New Homeland-Kettle Creek 230 kV TL
Reconstruct tie line between Gulf and Progress Energy (FPC)
Sinai-Woodruff 115 kV (new tie line)
Replaces Scholz-Wooduff 115 kV
New Sinai Cemetery 230/115 kV transformer
Continued Improvements (~$400-500 million/year)
Note: Conasauga – Bradley (TVA) 500 kV is the new tie line between Georgia and TVA Replaces Conasauga -Sequoyah 500 KV tie line
2008 Notable Transmission Additions
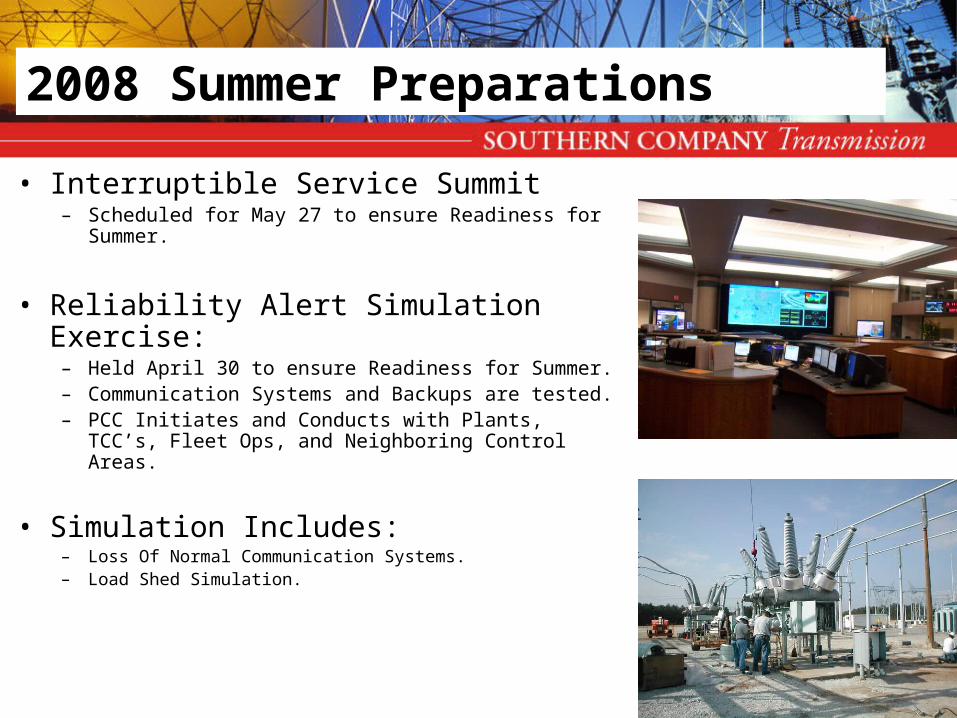
• Interruptible Service Summit– Scheduled for May 27 to ensure Readiness for
Summer.
• Reliability Alert Simulation Exercise:– Held April 30 to ensure Readiness for Summer.– Communication Systems and Backups are tested.– PCC Initiates and Conducts with Plants, TCC’s, Fleet
Ops, and Neighboring Control Areas.
• Simulation Includes:– Loss Of Normal Communication Systems.– Load Shed Simulation.
2008 Summer Preparations
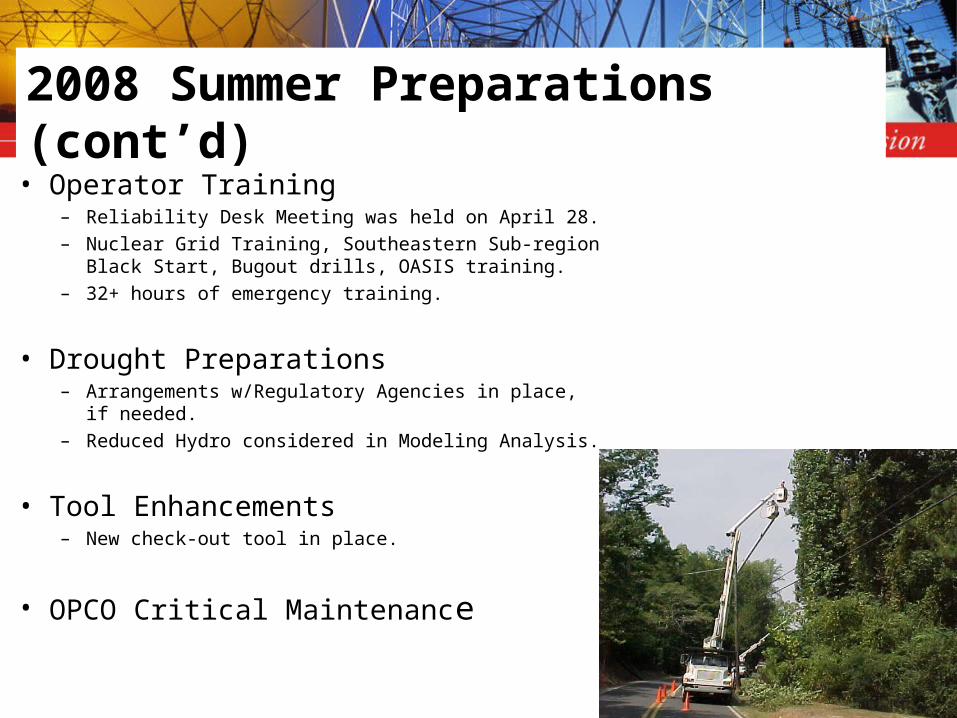
• Operator Training– Reliability Desk Meeting was held on April 28.– Nuclear Grid Training, Southeastern Sub-region Black
Start, Bugout drills, OASIS training.– 32+ hours of emergency training.
• Drought Preparations– Arrangements w/Regulatory Agencies in place, if
needed.– Reduced Hydro considered in Modeling Analysis.
• Tool Enhancements– New check-out tool in place.
• OPCO Critical Maintenance
2008 Summer Preparations (cont’d)
– Loads will be large, but handled proficiently.• Projected 2008 SBA Peak…46,308 MW… In August?• Operators monitor the system continuously and are prepared to respond with
appropriate operating procedures.
– Interfaces are heavily utilized and will be busy.• Occasional Import reductions possible, especially if significant outages or fuel
(dispatch) volatility. • Export capability is available if market develops.
– Adequate Reserves should be available at peak.• Assuming 3% EFOR and hydro available. 950 day.• Prolonged drought may limit hydro and may lead to temperature limits at some
plants. • Purchases expected to supplement designated resources.• Calls For Interruptible Customers not expected.
Summary: 2008 Summer Preparations

QUESTIONS???