A-4 2014 Recent Weather Impacts on the Bulk Power … 1 of 18 Item No: A-4 January 16, 2014 Recent...
18
Page 1 of 18 Item No: A-4 January 16, 2014 Recent Weather Impacts on the Bulk Power System Good morning Madame Chairman and Commissioners. I am here to provide an update on the bulk power system performance during last week’s extreme cold weather event. The information in this presentation is derived from details provided by NERC, the Regional Entities, and the reliability coordinators, along with some public sources. NERC continuously monitored the system during the polar vortex event and was in contact with both Commission staff and the industry through the week. Commission staff and NERC would like to thank all of the entities for providing us with additional information to support this presentation. We note that much of the information in this presentation is preliminary and subject to further verification and revision. Last week, cold temperatures stressed the bulk power system with high loads, increased generator forced outages, and other challenging operating conditions. The bulk power system remained stable and generally performed reliably throughout the event. The credit for this good outcome goes to the many system operators and other utility personnel who worked long and hard, and communicated extensively with each other to keep the grid up and running.
-
Upload
hoangkhuong -
Category
Documents
-
view
214 -
download
0
Transcript of A-4 2014 Recent Weather Impacts on the Bulk Power … 1 of 18 Item No: A-4 January 16, 2014 Recent...

Page 1 of 18
Item No: A-4January 16, 2014
Recent Weather Impacts on the Bulk
Power System
Good morning Madame Chairman and Commissioners. I am here to provide an update on the bulk power system performance during last week’s extreme cold weather event. The information in this presentation is derived from details provided by NERC, the Regional Entities, and the reliability coordinators, along with some public sources. NERC continuously monitored the system during the polar vortex event and was in contact with both Commission staff and the industry through the week. Commission staff and NERC would like to thank all of the entities for providing us with additional information to support this presentation. We note that much of the information in this presentation is preliminary and subject to further verification and revision. Last week, cold temperatures stressed the bulk power system with high loads, increased generator forced outages, and other challenging operating conditions. The bulk power system remained stable and generally performed reliably throughout the event. The credit for this good outcome goes to the many system operators and other utility personnel who worked long and hard, and communicated extensively with each other to keep the grid up and running.

Page 2 of 18
Jan. 6 – 8 Cold Snap
Monday, January 6 Tuesday, January 7
Temperature at 7 AM EST
Source: Ventyx Velocity Suite.
Beginning on Sunday, January 5th and continuing through Wednesday, January 8th, a significant cold weather system moved across the Eastern United States. Temperatures were generally 20 to 40 degrees below normal for this time of year. For example, Monday temperatures remained around 15 degrees below zero in Minneapolis, and barely reached 10 degrees in Nashville. Atlanta, meanwhile, experienced over 50 consecutive hours of sub-freezing temperatures, and Indianapolis had 33 consecutive hours of sub-zero temperatures. For many areas, cold weather this severe and widespread had not been seen since the mid-1990s.

Page 3 of 18
Preparations
Generator winterization
Cancel scheduled outages
Review unit fuel procurements
Commit additional units
Coordinate with neighbors
In the days leading up to the cold snap, system operators and generator owners took steps to prepare their systems and equipment for the freezing temperatures. For generators, such actions typically include the deployment of additional insulation, supplemental heating to prevent critical components from freezing, and dual-fuel capability testing. System operators worked to cancel or postpone scheduled outages, commit additional resources, request information about fuel restrictions, and ensure adequate staffing. MISO, for example, arranged for operating personnel to stay onsite to ensure full staffing during the event. Neighboring system operators shared information with each other regarding weather forecasts, resource availability, and other pertinent information. This coordination continued as the weather event developed, as system operators with excess generation worked to make additional power available to neighboring markets. The Friday prior to the cold snap, PJM filed an application with the Commission for a week-long waiver of certain non-disclosure provisions in the PJM operating agreement. As granted by the Commission, the waiver allowed PJM to engage in unit-specific review of day-ahead plans with the interstate natural gas pipelines to help ensure that adequate supplies of natural gas were available and to confirm unit availability. Earlier in the fall, the Commission conditionally accepted a series of ISO New England tariff revisions implementing the ISO’s Winter Reliability Program. Among other things, this program established an oil inventory service for oil-fired and dual-fuel units. The ISO has reported that oil was firing around one quarter of the total generation in the region at peak, roughly equal to the amount of generation burning natural gas. In the aftermath of the event, system operators are comparing their next-day load projections to actual loads, and considering the need for any changes in their load forecasting models.

Page 4 of 18
Natural Gas
Record or near-record gas demand across the Eastern United States
Pipeline capacity restrictions No unmanageable effect on bulk power
system reliability System operators used their emergency
coordination procedures
At this time, it appears that Midwest, Northeast, and Southeast regions set record demands for natural gas, while other parts of the Eastern and Central U.S. were near their all-time peaks. One compressor station outage on the Texas Eastern pipeline in Western Pennsylvania resulted in throughput reductions of nearly 600,000 decatherms per day, or about ten percent of the pipeline load. Most other pipelines curtailed interruptible or secondary firm transportation and storage services. While fuel restrictions certainly stressed the electric supply, system operators were able to maintain reliable electric service. In New England, for example, six units totaling around 1,200 MW were not able to procure fuel initially when called intraday by the ISO. This request, however, was made on behalf of another RTO and did not affect power supply in New England. Electric system operators have also reported that their gas-electric coordination procedures generally worked well. For example, MISO contacted several gas pipelines starting on January 3, and made subsequent schedule adjustments in order to ensure adequate generation.

Page 5 of 18
Other Fuels
Coal• Frozen stockpiles
• Quality issues
Dual-Fuel / Oil
Wind• Turbine minimum operating temperatures
In addition to gas restrictions, system operators reported problems such as frozen coal stockpiles at coal-fired generating stations, and problems with fuel switching at dual-fuel units. Wind turbines were also affected by the cold, with some wind turbine models reaching their minimum operating temperatures. Two nuclear units tripped due to equipment problems, but it is not clear at this time if the problems were related to the cold temperatures. On the whole, preliminary data indicates that forced outages were significant in some regions. However, more analysis is needed to determine how much of this was weather-related. Demand response was also helpful during the event. For example, the New York ISO requested voluntary demand response on January 7th so that it could assist another RTO seeking resources.
Page 6 of 18
ISO/RTO Peak Loads
0
50
100
150
Dem
and
(GW
)
NERC WinterAssessment ForecastActual Peak Load
Source: NERC Winter Assessment & ISOs/RTOs. Data is preliminary.
Many system operators in the Eastern United States broke their winter peak demand records. MISO, SPP, ERCOT, PJM, and the New York ISO all set winter peak demand records, as did most of the utilities in the Southeast. NERC’s Winter Assessment, which was released last month, forecasted adequate reserve margins across the country for this winter. This forecast was based on “50/50” or average weather. Due to the extreme temperatures, the peak loads last week were often much higher than forecasted. For example, actual system loads exceeded the Winter Assessment forecasts by approximately 7 percent in PJM and around 9 percent in MISO.
Page 7 of 18
Midcontinent ISO
70
85
100
115
Jan 6 Jan 7 Jan 8
Dem
and
(GW
)
MISO
Source: Ventyx Velocity Suite. Data is preliminary.
New Winter Peak
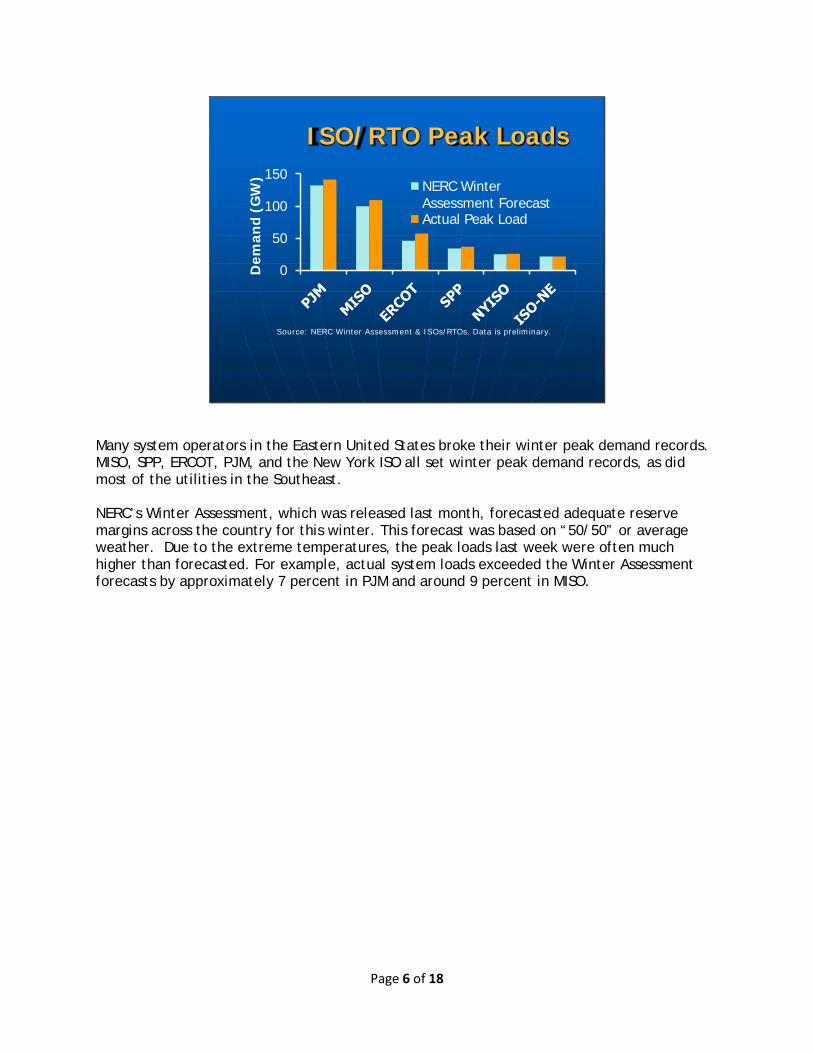
MISO was the first region to be affected by the cold weather, setting a new all-time winter peak of nearly 110 GW on Monday. There were no problems attributed to the recent integration of the MISO South region, and the Reliability Coordinators in the area agreed to temporarily raise the MISO South transfer limit from 2,000 MW to 2,500 MW to allow additional power to be delivered to other regions.

Page 8 of 18
Southwest
Source: Ventyx Velocity Suite. Data is preliminary.
20
30
40
50
60
Jan 6 Jan 7 Jan 8
Dem
and
(GW
)
Emergency Alerts& Demand Response
New Winter Peak
New Winter Peak
ERCOT
SPP
ERCOT issued an energy emergency alert, deployed demand response and made media appeals for conservation on Monday morning, but did not need to resort to additional emergency procedures. On Tuesday morning, ERCOT set a new winter peak demand record of over 57 GW, just slightly above the previous record peak from the February 2011 cold snap. The SPP region established a new winter peak of nearly 37 GW on Monday. SPP issued an energy emergency warning for one balancing authority for a few hours, but did not need to use other emergency procedures.
Page 9 of 18
Southeast
0
2
4
6
8
0
5
10
15
20
Jan 6 Jan 7 Jan 8
SCE&
G (
GW
)
Du
ke (
GW
)
Duke
SCE&G
Selected demand curves from OASIS Postings. Data is preliminary.
New Winter Peaks
SCE&G Load Shed
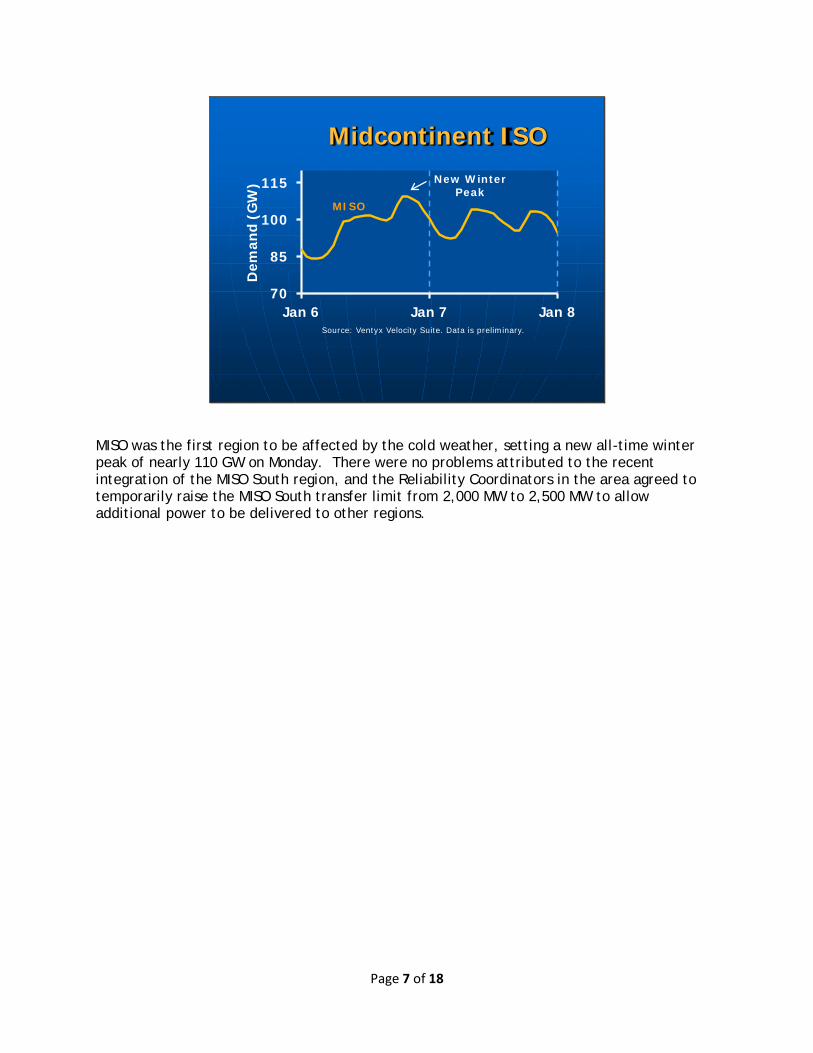
In the Southeast, many utilities set all-time winter peak demand records and issued calls for conservation. Duke Energy Progress and South Carolina Electric and Gas implemented voltage reductions on Tuesday morning. Several generating units also tripped in the SCE&G area, forcing the company to implement rotating outages and shed approximately 300 MW of firm load during the morning peak. The load was restored later in the morning.

Page 10 of 18
PJM
70
95
120
145
Jan 6 Jan 7 Jan 8
Dem
and
(GW
)
Source: Ventyx Velocity Suite. Data is preliminary.
PJM
Voltage Reduction
Demand Response
New Winter Peak
PJM experienced high loads and tight operating conditions from Monday evening through Wednesday morning. On Monday evening, PJM’s reserves were particularly tight, and the RTO directed member utilities to implement a 5% voltage reduction. The voltage reduction was in effect for around one hour. On Tuesday afternoon, PJM set a new winter peak of around 141 GW. During this time, PJM deployed demand response and requested emergency energy purchases from neighboring markets, but did not need to invoke other emergency procedures.
Page 11 of 18
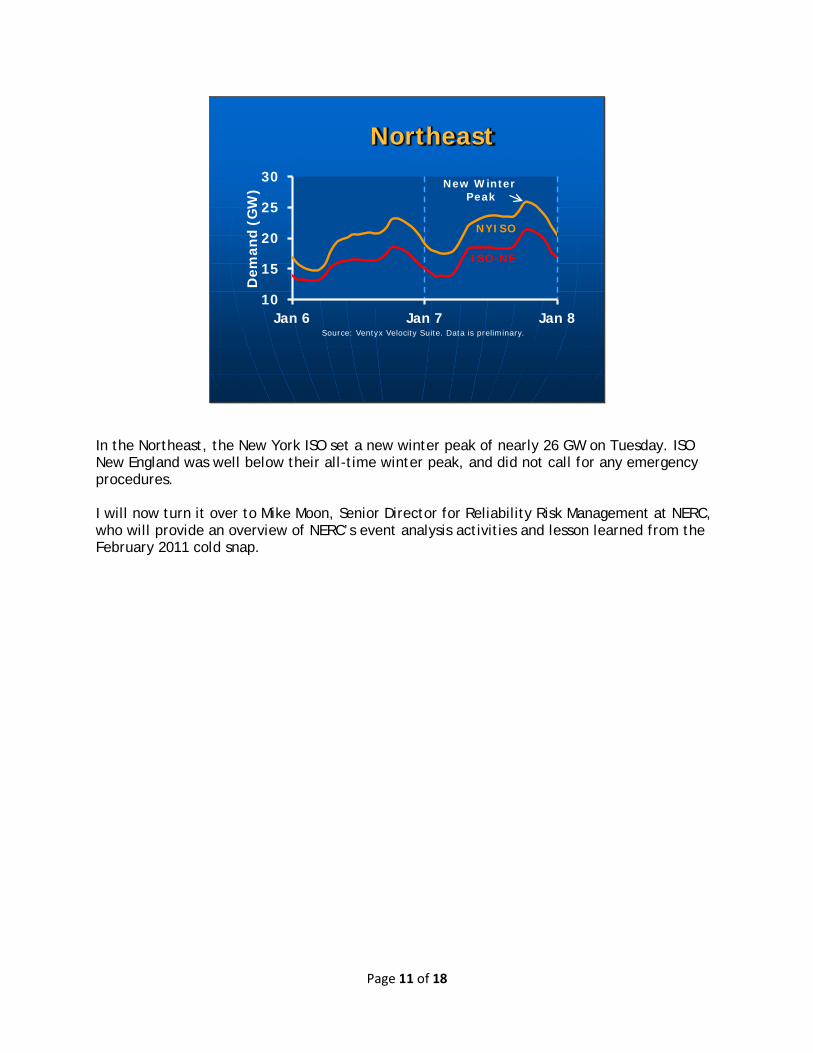
Northeast
10
15
20
25
30
Jan 6 Jan 7 Jan 8
Dem
and
(GW
)
Source: Ventyx Velocity Suite. Data is preliminary.
NYISO
ISO-NE
New Winter Peak
In the Northeast, the New York ISO set a new winter peak of nearly 26 GW on Tuesday. ISO New England was well below their all-time winter peak, and did not call for any emergency procedures. I will now turn it over to Mike Moon, Senior Director for Reliability Risk Management at NERC, who will provide an overview of NERC’s event analysis activities and lesson learned from the February 2011 cold snap.

Page 12 of 18
Context Event Analysis• Always opportunities to
learn• Too early to draw
conclusions• Preliminary information and
data• Further analytical efforts
Complete event analysis reports Determine root and
contributing causes Identify trends
Event Analysis
Chairman LaFleur, Commissioners and staff, thank you for the opportunity to speak today. The Federal Energy Regulatory Commission, NERC and NERC’s stakeholders share a common interest in ensuring the reliability of the bulk power system of North America. Thus, as Mr. Burnham indicated, we have been working the past week with your staff and the utilities to gather the data you have just heard, and this data is consistent what we have learned from the industry. However, the facts presented today should not be considered an event analysis. Rather, the preliminary data will help direct analytical efforts, which will include lessons learned and recommendations for further improving preparation and processes during extreme circumstances. For example, forced generation outages in the most severely impacted areas of the Eastern Interconnection on January 6 and 7 appear to be minimally 50 GW. Upon a rudimentary analysis, this is higher than the historical wintertime average forced outage of 33 GW. Additional analysis is needed to understand the initial outage numbers in their overall context of performance relative to historical trends, recognizing that not all of the outages were due to weather. The Event Analysis program is a fundamental and critical component that supports the electric reliability organization by providing insight and guidance through the identification and dissemination of valuable information to owners, operators and users of the bulk power system. The high level of stakeholder commitment to identifying lessons learned after events and striving to achieve the highest level of reliability is a primary foundation of this program. The ability to learn and develop sound recommendations and lessons learned for industry are the fastest way to proactively inform industry of reliability risks and provide positive steps to improve reliability. The continued encouragement of collaboration and voluntary disclosure of events and disturbances by registered entities is critical to this rapid learning and reliability focus. The ability to track lessons learned and measure impact is still maturing.

Page 13 of 18
Lessons learned are now published with a survey capability to better gauge the industry use of these publications. Required reports have been received , and NERC staff is currently analyzing and identifying areas for further analysis. TRE and ERCOT have already conducted some initial site visits. Event analysis reports will be submitted to NERC and the Regional Entities by registered entities. NERC and the Regional Entities will review each entity event report and conduct root cause analysis in coordination with the registered entities.

Page 14 of 18
•Thirteen published Seven - Generation Two - Transmission Four - Bulk Power System Operations and Procedural
Control
•NERC Operating Committee Guideline Generating Unit Winter Weather Readiness – Current
Industry Practices
2011 Cold Snap Event Lessons Learned
In addition to discussing data collection and analysis related to the recent polar vortex, I would also like to provide a brief synopsis of the lessons learned from the 2011 Cold Weather Event of February 1-5, 2011. FERC and NERC released a joint staff report on the Cold Weather Event of February 2011. The report detailed 26 recommendations for the electric industry. Thirteen targeted lessons learned were published over the course of a year beginning in September of 2011. These lessons learned covered a range of critical functions from staffing, design, maintenance, operations and training. Using the key findings and recommendations from the Cold Weather Event Report, seven lessons learned were developed that focused on maintaining individual unit reliability and preventing cold weather related generation outages. These lessons learned detail preventative and corrective actions for cold weather issues that that can affect generation facilities, such as unit design, freeze protection, fuel switching, required onsite materials and resources, and training personnel. Two lessons learned focused on transmission equipment during winter weather situations. These lessons learned addressed issues related to transmission equipment outages and recommend that transmission facilities be inspected for areas where water could collect and freeze. Pressurized gas and oil systems must be maintained at adequate parameters to safely operate during extreme cold, especially in geographic areas not accustomed to freezing temperatures. Four lessons learned focused on reliable BPS operation and situational awareness during cold weather events. Impacted entities must maintain an accurate and shared understanding of available and committed capacity resources on a real time basis. Improved coordination between gas and electric entities will ensure maximum generation with available firm gas supply and minimize non-firm gas supply generation with alternatives in place if gas becomes unavailable.

Page 15 of 18
Finally, in February 2013, the NERC Operating Committee drafted and published an extensive Reliability Guideline “Generating Unit Winter Weather Readiness – Current Industry Practices.” This guideline provided a comprehensive and detailed attachment that lists elements of a winter weather preparation procedure. These practices support all of the 26 recommendations of the report. Coupling these guidelines with the annual webinars reinforces industry action. In conclusion, while we are still in the preliminary stages of analysis, we have established a solid foundation to learn from events and disturbances, to identify reliability risks and, ultimately, to further enhance reliability efforts. It is too soon to draw detailed comparisons of performance in 2011 versus last week, or assess the extent to which entities avoided the particular mistakes of 2011, but in broad scope certainly the overall outcome was better, which suggests that the efforts made since 2011 have yielded a change for the better. In terms of next steps, NERC and the Regional Entities will continue the efforts already underway to get the details of what happened and why from transmission operators, generators and others, so that we can identify any aspects of performance still needing improvement. This will be an extensive effort, but we are confident that we can reach the goal of maintaining last week’s good performance while improving any shortcomings that may later be identified. I wish to thank FERC for their invitation and attention. I will now turn back to FERC staff for a brief look at market prices during the event.

Page 16 of 18
Natural Gas Markets Stressed
Source: ICE and Weather.com
Area Hub Prices ($/MMBtu) Low Temperatures
1/6/14 1/7/14 1/6/14 1/7/14Boston Algonquin Citygates $15.89 $34.14 29 12Chicago Chicago Citygates $13.97 $7.49 -15 -12New Jersey Tetco M3 $8.70 $31.86 19 4
New York City Transco Zone 6 NY $13.82 $56.59 21 4
Philadelphia Transco Zone 6 Non-NY $10.90 $70.66 13 4Richmond Transco Zone 5 $11.16 $72.43 10 7Rockies Cheyenne Hub $4.70 $5.91 -3 24Gulf Coast Henry Hub $4.31 $4.50
U.S. gas demand hit 137 Bcfd on Tuesday January 7, 11 Bcfd over the previous winter record set in the winter of 2008/9. Demand records were breached in the Midwest, the Northeast, and the Southeast, which added to constraints on pipelines delivering gas to the Mid-Atlantic and Northeast. Consequently, natural gas prices averaged over $70/MMBtu along the I-95 corridor, between Richmond and New Jersey, with some intraday trades close to $100/MMBtu. Although greater access to Marcellus shale gas via the New Jersey-New York pipeline expansion gave New York City some relief, prices there still reached $57/MMBtu. Boston gas prices spiked less than New York and Mid-Atlantic prices, to $34, helped by slightly higher temperatures, backup oil generation, and liquefied natural gas (LNG). Gas prices in Chicago spiked to nearly $14/MMBtu on Monday, the highest in 10 years. Many interstate natural gas pipelines issued operational flow orders. Two unplanned compressor station outages on Spectra Energy’s Texas Eastern Transmission pipeline contributed to constraints into New York City and gas generator outages in PJM. A number of Northeast and Midwest local distribution companies reported pressure drops on their systems, asking non-essential customers to voluntarily curtail gas use. Well freeze-offs in some major producing basins reduced natural gas supply, just as demand was peaking. Supply from the Marcellus formation dropped by 1 Bcfd, but has since recovered.

Page 17 of 18
Electric Prices Follow Fuel Prices and Demand Rise
Source: Derived from Genscape
$0
$200
$400
$600
$800
$1,000
Mass Hub N.Y.C. Zone J Western Hub Indiana Hub
$/MWH On-peak Real-time Prices
5-Jan-14 6-Jan-14 7-Jan-14 8-Jan-14
In the electricity markets, on-peak average real-time prices soared to as high as $765/MWh in PJM and $510 in the NYISO as natural gas prices and demand spiked upward. Among the most stressed areas, system conditions in PJM included under-forecast load and more than 30 GW of generator outages. Prices on Monday rose to as high as $1,200/MWh during the evening peak when PJM implemented the 5% voltage reduction mentioned earlier. Subsequently, on Tuesday morning prices reached the administratively set price of $1,800/MWh for approximately 4 hours as emergency demand response was called. The cold weather forced natural gas and power prices higher in New York, New England, and MISO. New York requested voluntary demand response but demand response was not activated or requested in New England. Fuel oil had a $37/MMBtu advantage over natural gas in New York and a $13/MMBtu advantage in New England. Thus, oil-fired and dual fuel units could run economically given the spread between the fuels. By the end of the week the price spreads had reverted to normal levels with a price spread of approximately $19 once again in favor of natural gas.

Page 18 of 18
Item No: A-4January 16, 2014
Recent Weather Impacts on the Bulk
Power System
This concludes our presentation and we are happy to answer any questions you may have.