Power Quality Impacts DG
108
Grid Reliability and Power Quality Impacts of Distributed Resources 1004473
Transcript of Power Quality Impacts DG
8/12/2019 Power Quality Impacts DG
http://slidepdf.com/reader/full/power-quality-impacts-dg 1/108
Grid Reliability and Power Quality Impacts ofDistributed Resources
1004473

8/12/2019 Power Quality Impacts DG
http://slidepdf.com/reader/full/power-quality-impacts-dg 2/108
8/12/2019 Power Quality Impacts DG
http://slidepdf.com/reader/full/power-quality-impacts-dg 3/108
Grid Reliability and Power Quality Impacts ofDistributed Resources
1004473
Technical Update, March 2003
EPRI Project Manager
W. Steely
EPRI 3412 Hillview Avenue, Palo Alto, California 94304 • PO Box 10412, Palo Alto, California 94303 • USA800.313.3774 • 650.855.2121 • [email protected] • www.epri.com
8/12/2019 Power Quality Impacts DG
http://slidepdf.com/reader/full/power-quality-impacts-dg 4/108
DISCLAIMER OF WARRANTIES AND LIMITATION OF LIABILITIES
THIS DOCUMENT WAS PREPARED BY THE ORGANIZATION(S) NAMED BELOW AS AN ACCOUNT OFWORK SPONSORED OR COSPONSORED BY THE ELECTRIC POWER RESEARCH INSTITUTE, INC. (EPRI).NEITHER EPRI, ANY MEMBER OF EPRI, ANY COSPONSOR, THE ORGANIZATION(S) BELOW, NOR ANYPERSON ACTING ON BEHALF OF ANY OF THEM:
(A) MAKES ANY WARRANTY OR REPRESENTATION WHATSOEVER, EXPRESS OR IMPLIED, (I) WITHRESPECT TO THE USE OF ANY INFORMATION, APPARATUS, METHOD, PROCESS, OR SIMILAR ITEMDISCLOSED IN THIS DOCUMENT, INCLUDING MERCHANTABILITY AND FITNESS FOR A PARTICULARPURPOSE, OR (II) THAT SUCH USE DOES NOT INFRINGE ON OR INTERFERE WITH PRIVATELY OWNEDRIGHTS, INCLUDING ANY PARTY'S INTELLECTUAL PROPERTY, OR (III) THAT THIS DOCUMENT ISSUITABLE TO ANY PARTICULAR USER'S CIRCUMSTANCE; OR
(B) ASSUMES RESPONSIBILITY FOR ANY DAMAGES OR OTHER LIABILITY WHATSOEVER (INCLUDINGANY CONSEQUENTIAL DAMAGES, EVEN IF EPRI OR ANY EPRI REPRESENTATIVE HAS BEEN ADVISEDOF THE POSSIBILITY OF SUCH DAMAGES) RESULTING FROM YOUR SELECTION OR USE OF THISDOCUMENT OR ANY INFORMATION, APPARATUS, METHOD, PROCESS, OR SIMILAR ITEM DISCLOSED INTHIS DOCUMENT.
ORGANIZATION(S) THAT PREPARED THIS DOCUMENT
EPRI PEAC Corporation
This is an EPRI Technical Update report. A Technical Update report is intended as an informal report ofcontinuing research, a meeting, or a topical study. It is not a final EPRI technical report.
ORDERING INFORMATIONRequests for copies of this report should be directed to EPRI Orders and Conferences, 1355 WillowWay, Suite 278, Concord, CA 94520. Toll-free number: 800.313.3774, press 2, or internally x5379;voice: 925.609.9169; fax: 925.609.1310.
Electric Power Research Institute and EPRI are registered service marks of the Electric PowerResearch Institute, Inc. EPRI. ELECTRIFY THE WORLD is a service mark of the Electric PowerResearch Institute, Inc.
Copyright © 2003 Electric Power Research Institute, Inc. All rights reserved.
8/12/2019 Power Quality Impacts DG
http://slidepdf.com/reader/full/power-quality-impacts-dg 5/108
iii
CITATIONSThis document was prepared by
EPRI PEAC Corporation
942 Corridor Park BlvdKnoxville, TN 37932
Principal InvestigatorD. DorrT. Key
This document describes research sponsored by EPRI.
The publication is a corporate document that should be cited in the literature in the followingmanner:
Grid Reliability and Power Quality Impacts of Distributed Resources, EPRI, Palo Alto, CA,2003.1004473.

8/12/2019 Power Quality Impacts DG
http://slidepdf.com/reader/full/power-quality-impacts-dg 6/108
iv
8/12/2019 Power Quality Impacts DG
http://slidepdf.com/reader/full/power-quality-impacts-dg 7/108
i
PRODUCT DESCRIPTION
Results & FindingsThis research addresses the potential for distributed resources (DR) to improve power quality(PQ) and reliability of electric power to end-user equipment. Information and guidelines on howDR impacts key measures of PQ and reliability enables the user to quickly identify and compareoptions for DR. In particular, for installations where PQ and reliability are part of the expectedvalue for the DR installation, this report will help in assessing that value. To facilitate this valueassessment, findings are provided both in terms of improved power delivery and in terms ofexpected impact on end-use equipment. A procedure and case examples are provided where
significant positive or negative impacts are anticipated.
Challenges & ObjectivesAs DR equipment begins to appear on the customer-side of the meter its impact on other nearbyend-user equipment will grow in importance. Usually the specific impacts on local gridreliability and PQ will be site and system dependant. To answer the question of how DR willeither improve or degrade the local PQ performance requires a defining of the system, as well asthe relative sizes and characteristics of the involved loads and DRs. In applications where PQand reliability are a premium, such as high-tech industrial processes or sensitive electronicequipment, this may be the main question to be answered regarding the value of the DRinstallation. Consequently there is a need for an effective assessment tool that predicts these
impacts for different installation and system scenarios, and various DR options. The objective ofthis project is to develop a simple pre-installation application guide that identifies relevantconcerns, as well as significant positive and negative local system impacts of DR.
Applications, Values & UseReliability and PQ are keys and, perhaps, essential market drivers for adoption of DR-capabletechnologies. As the costs of process interruptions increases (with advancing, modern industryand electronic commerce) and as the costs of DR-capable technologies declines, it is likely thatmore and more DR-capable technologies will be employed for mitigation of PQ and reliabilityproblems. Whether these equipment are also employed to actually provide DR benefits back tothe grid (voltage stability, load shedding, etc.) is less certain.
EPRI PerspectiveThe role of distributed resources in delivering PQ and reliability to the grid and for individualend users is an important area of research. On the one hand improving end-user PQ andreliability can be a significant value adder for DR applications. On the other, if DR detracts fromPQ or reliability, it is likely to create a significant barrier to deployment. By building on resultsfrom prior EPRI work in both the DR and PQ areas, this project takes a step forward inidentifying the full potential value of distributed generation and energy storage. With someadditional future work to automate assessment procedures we expect to provide another web-

8/12/2019 Power Quality Impacts DG
http://slidepdf.com/reader/full/power-quality-impacts-dg 8/108
ii
based tool brings in the form of a “DR Application Guide on Power Quality and Reliability.”This work compliments some of the other integration and troubleshooting tools previouslydeveloped such as the EPRI DR engineering guide, the DRIA Integration Assistant software, andthe new economic screening methodology for utility applications of DR in T&D.
ApproachThis project employs prior EPRI research related to integration of distributed resources, PQ,power service reliability and susceptibility on end use equipment. The approach was to build onthis work to assure a complete system view in evaluating the impacts of DR on electricalreliability and PQ. It required identifying the key measures of electrical performance anddescribing the expected role of DR from enhancing power delivery to end use equipment.Examples of related EPRI DR documents and tools are the DR engineering guide, 1000419, theDRIA Integration Assistant software, 1004472, and the new economic screening methodologyfor utility applications of DR in T&D, 1004475.
KeywordsDistributed energy resources
Distributed generationPremium powerPower qualityReliability
8/12/2019 Power Quality Impacts DG
http://slidepdf.com/reader/full/power-quality-impacts-dg 9/108
iii
ABSTRACT
Improved power quality (PQ) and reliability for end-user equipment can be a significant valueadder for distributed resources (DR). At the same time if DR detracts from PQ or reliability, it islikely to create a significant barrier to deployment. This research report addresses the potentialfor DR to enhance the local power. In particular, for installations where PQ and reliability arepart of the expected value for the DR installation, this report will help in assessing that value. Tofacilitate this value assessment, findings are provided both in terms of improved power deliveryand in terms of expected impact on end-use equipment. Information and guidelines on how DRimpacts key measures of PQ and reliability enables the user of this document to quickly identify
and compare options for DR installations near end-use equipment. A procedure and caseexamples are provided where significant positive or negative impacts are anticipated. The reportis an example of EPRI’s ongoing work to evaluate issues and opportunities related to integratingdistributed resources into utility distribution systems and into local end-user power systems.

8/12/2019 Power Quality Impacts DG
http://slidepdf.com/reader/full/power-quality-impacts-dg 10/108

8/12/2019 Power Quality Impacts DG
http://slidepdf.com/reader/full/power-quality-impacts-dg 11/108
v
CONTENTS
1 INTRODUCTION ....................................................................................................................1-2
Background ...........................................................................................................................1-2
Reliability Vs Power Quality ..................................................................................................1-3
Grid-Parallel or Standalone Operating Modes ......................................................................1-4
Characteristics of Utility Supply Compared With DR.............................................................1-5
How to Use This Report ........................................................................................................1-8
2 OVERVIEW OF ELECTRIC POWER SYSTEM RELIABILITY AND DISTRIBUTEDRESOURCES ............................................................................................................................2-1
Electric Power System Reliability..........................................................................................2-1
Conventional Measures of Reliability ...............................................................................2-1
Availability as a Measure of Reliability .............................................................................2-3
Reliability of Utility Electric Service .......................................................................................2-4
Frequency and Duration of Interruptions..........................................................................2-6
Utility System Reliability Indices.......................................................................................2-7
Reliability of Facility Power Distribution...............................................................................2-11
Availability of Local Generation ......................................................................................2-12
Using Multiple Generators to Enhance Reliability......................................................2-12
Backup Generation ....................................................................................................2-15
Transition From Grid-Parallel to Standalone Mode....................................................2-17
Grid-Connected Generation.......................................................................................2-18
Parallel Utility Connection in Lieu of Redundant Generators.....................................2-21
Reliability Issues Related to DR..........................................................................................2-22Impact of DR Out-of-Phase Reclosure on Rotating Machines .......................................2-22
Impact of DR Fault Current on Sympathetic Tripping of Circuit Breakers ......................2-24
Impact of DR Fault Current on Utility Fuse/Breaker Coordination..................................2-25
Reliability Summary.............................................................................................................2-27
Utility Vs On-Site Generation..........................................................................................2-27
8/12/2019 Power Quality Impacts DG
http://slidepdf.com/reader/full/power-quality-impacts-dg 12/108
vi
Service Entrance- Vs Equipment-Level Solutions ..........................................................2-27
3 OVERVIEW OF ELECTRIC POWER QUALITY AND DISTRIBUTED RESOURCES...........3-1
Power Quality Attributes........................................................................................................3-1
Power Quality in the Presence of DR....................................................................................3-2Transients (Voltages and Currents)..................................................................................3-2
Short-Duration Variations .................................................................................................3-3
Long-Duration Variations..................................................................................................3-5
Voltage Unbalance ...........................................................................................................3-6
Waveform Distortion .........................................................................................................3-7
Voltage Fluctuations (Flicker) ...........................................................................................3-8
Frequency Variations........................................................................................................3-9
Summary of Power Quality Issues Related to Distributed Generation..................................3-9
4 END-USE EQUIPMENT SUSCEPTIBILITY TO POWER QUALITY VARIATIONS...............4-1
Equipment Susceptibility Test Results ..................................................................................4-5
Positive and Negative PQ Impacts of Installed DR ...............................................................4-7
End-User Power Conditioning Solutions ...............................................................................4-8
Uninterruptible Power Supplies ........................................................................................4-8
Improving Load Ride-Through........................................................................................4-11
Power Conditioning Performance and Costs..................................................................4-13
5 GUIDELINES FOR POWER QUALITY AND RELIABILITY ASSESSMENT ........................5-1
Reliability Assessment Procedure.........................................................................................5-1
Background ......................................................................................................................5-1
Data Needed for Assessment......................................................................................5-2
Procedure .........................................................................................................................5-2
Step 1. Define a Service Interruption...........................................................................5-3
Step 2. Conduct a Failure Modes and Effects Analysis (FMEA)..................................5-3
Step 3. Calculate the Overall Service Availability ........................................................5-4
Accounting for Dependency Factors............................................................................5-6
Examples..........................................................................................................................5-7
Case 1: Long- and Short-Duration Events Calcuation.................................................5-7
Voltage Regulation Assessment Procedure........................................................................5-10
Background ....................................................................................................................5-10
8/12/2019 Power Quality Impacts DG
http://slidepdf.com/reader/full/power-quality-impacts-dg 13/108
Procedure .......................................................................................................................5-11
Example..........................................................................................................................5-13
Case 1: Food Processing Plant .................................................................................5-13
Sag Assessment Procedure................................................................................................5-14
Background ....................................................................................................................5-14
Procedure .......................................................................................................................5-16
Examples........................................................................................................................5-17
Case 1: Calculation Without Distributed Generation..................................................5-18
Case 2: Calculation With Distributed Generation.......................................................5-19
Swell Assessment Procedure..............................................................................................5-20
Background ....................................................................................................................5-20
Procedure .......................................................................................................................5-21
Examples........................................................................................................................5-21Case 1: Paper Mill A ..................................................................................................5-21
Case 2: Paper Mill B ..................................................................................................5-23
6 APPLYING DR TO ENHANCE EQUIPMENT PERFORMANCE ...........................................6-1

8/12/2019 Power Quality Impacts DG
http://slidepdf.com/reader/full/power-quality-impacts-dg 14/108

8/12/2019 Power Quality Impacts DG
http://slidepdf.com/reader/full/power-quality-impacts-dg 15/108
ix
LIST OF FIGURES
Figure 1-1 Two Types of DR: (a) Standalone and (b) Grid-Parallel...........................................1-5
Figure 2-1 Percentage of Companies Using Indices Reporting in 1995 Out of 78 Utilities......2-10
Figure 2-2 Results of Survey of MAIFI Index for Reliability .....................................................2-11
Figure 2-3 The More Generator Units are in Parallel, the Smaller the Amount of SurplusCapacity Needed for a Fixed Level of Contingency Design (in This Example, N-1) ........ 2-13
Figure 2-4 Starting Reliability for Backup Generators.,............................................................2-16
Figure 2-5 Grid-Parallel Connection Scheme to Allow “Local Island” During Utility
Interruptions and Isolation of DR Plant During DR Failures.............................................2-17 Figure 2-6 Availability of Generators Found in Various Studies
,,.............................................2-19
Figure 2-7 Parallel Generator Configuration Supplying Protection Against Short-Durationas Well as Long-Duration Interruptions............................................................................2-20
Figure 2-8 Series Generator Configuration Supplying Protection Against Short-Durationas Well as Long-Duration Interruptions............................................................................2-21
Figure 2-9 Sample Reclosing Sequence for Line Reclosers and Substation Breakers ...........2-23
Figure 2-10 Sympathetic Tripping Caused by a Large DR Unit Feeding Fault Current intoan Adjacent Feeder (REF: Integration of Distributed Resources in Electric UtilitySystems: Current Interconnection Practice and Unified Approach, EPRI TR111489).....2-25
Figure 2-11 Fault Contributions Due to DR Units 1, 2 and 3 May Increase the ShortCircuit Levels to the Point Where Fuse-Breaker Coordination is no Longer Achieved ....2-26
Figure 3-1 Waveform and RMS Voltage During Voltage Sag....................................................3-4
Figure 4-1 Uninterruptible Power Supply Configurations...........................................................4-9
Figure 5-1 Example System for Reliability Calculations ............................................................5-8
Figure 5-2 Screening Module and Tests for DR Impact on Voltage Regulation ......................5-12
Figure 5-3 Detailed One-Line Diagram of Feeder Serving Food-Processing Plant .................5-13
Figure 5-4 Impedance Model for an Example Substation........................................................5-14
Figure 5-5 One Line Diagram and Impedance Model for Substation With Customer DR........5-15
Figure 5-6 Sample One-Line Diagram With Varying Fault (Fx) Locations...............................5-17
Figure 5-7 Calculation of the Voltage at the Secondary of Transformer T1 Where theDistance From the Distribution Bus to FA Varies (No Generation) ..................................5-18
Figure 5-8 Calculation of the Voltage at the Secondary of Transformer T1 Where theDistance From the Distribution Bus to FA Varies. There is a Small Generator at T1......5-20
Figure 5-9 Voltage at the Secondary of Transformer T1 With and Without Generator forFaults as FA Distance Varies...........................................................................................5-20
Figure 5-10 Overvoltage Screening Tool for DR Installations..................................................5-22

8/12/2019 Power Quality Impacts DG
http://slidepdf.com/reader/full/power-quality-impacts-dg 16/108
x
Figure 5-11 Overvoltage Screening for Paper Mill Example 1 – “Failing” Conditions..............5-23
Figure 5-12 Overvoltage Screening for Paper Mill Example 2 – “Passing” Conditions............5-24

8/12/2019 Power Quality Impacts DG
http://slidepdf.com/reader/full/power-quality-impacts-dg 17/108
xi
LIST OF TABLES
Table 1-1 Performance Characteristics of a Standalone DR and a Utility ServiceConnection .........................................................................................................................1-6
Table 2-1 Relationship Between Number of Nines and “Minutes Off” Supply ...........................2-4
Table 2-2 Interruption Frequency (per Year) From EPRI DPQ and NPL Surveys.....................2-7
Table 2-3 Interruption Frequency (Per Year) from CEA Survey in Canada...............................2-7
Table 2-4 Interruption Frequency (Per Year) for Distribution and Low-Voltage Systems inNorway...............................................................................................................................2-7
Table 2-5 Reliability of Common Low-Voltage (<600 V) Equipment........................................2-12 Table 2-6 Surplus Generating Capacity Needed for an N-1 Design Decreases as the
Number of Generators Increases.....................................................................................2-13
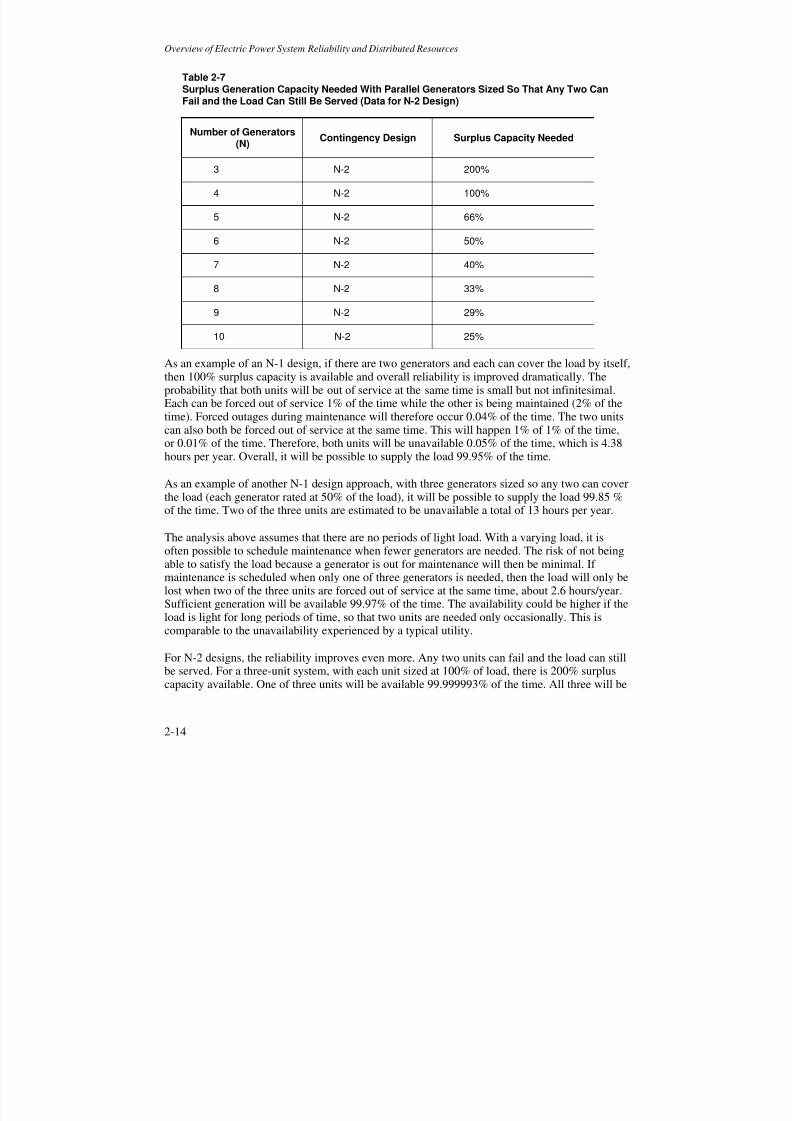
Table 2-7 Surplus Generation Capacity Needed With Parallel Generators Sized So ThatAny Two Can Fail and the Load Can Still Be Served (Data for N-2 Design)....................2-14
Table 2-8 Probability Calculation for Generator being Out of Service .....................................2-19
Table 2-9 Typical Fault Current Levels of DRs ........................................................................2-24
Table 3-1 IEEE Std. 1159-1995 Categories and Typical Characteristics of Power QualityAttributes (Electromagnetic Phenomena in Power Systems).............................................3-1
Table 3-2 Impact of Distributed Generation on Voltage Sags and Momentary
Interruptions .......................................................................................................................3-4 Table 3-3 Impact of Distributed Generation on Voltage Swells or Temporary
Overvoltages ......................................................................................................................3-5
Table 3-4 Impact of Distributed Generation on Steady State and Long Duration VoltageRegulation ..........................................................................................................................3-6
Table 3-5 Impact of Distributed Generation on Unbalance........................................................3-7
Table 3-6 Impact of Distributed Generation on Waveform Distortion ........................................3-8
Table 3-7 Impact of Distributed Generation on Flicker ..............................................................3-9
Table 3-8 Variations and Potential Impacts With Installed DR ................................................3-10
Table 4-1 Typical Equipment and Indication of Sensitivity to Various Disturbance Types.........4-6
Table 4-2 Reliability of Uninterruptible Power Supplies ...........................................................4-11 Table 4-3 Reliability of Static Switches
16..................................................................................4-11
Table 4-4 Various Load Ride-Through Devices.......................................................................4-12
Table 4-5 Default Facility Performance and Costs for Reliability and Availability Analysis......4-13
Table 6-1 Impact of Power Quality and Reliability Events With Installed DR.............................6-2

8/12/2019 Power Quality Impacts DG
http://slidepdf.com/reader/full/power-quality-impacts-dg 18/108

8/12/2019 Power Quality Impacts DG
http://slidepdf.com/reader/full/power-quality-impacts-dg 19/108
8/12/2019 Power Quality Impacts DG
http://slidepdf.com/reader/full/power-quality-impacts-dg 20/108
Introduction
1-3
The subject of power quality impacts of distributed generation has been addressed in severalrecent EPRI reports including:
• EPRI Technical Report 1000405: Power Quality Impacts of Distributed Generation, 2000.
• EPRI Technical Report 1005917: Distributed Generation Relay Impacts on Power Quality,
2001.
These studies detail a number of the concerns of electric distribution engineers and makerecommendations to avoid problems when DR is added to the power system. They address thequestion, when DR is interconnected with the power grid in relatively large quantities, how willthey affect the PQ? Will it improve it or make it worse, or have no effect at all? The resultsclearly show that there are areas where DR characteristics and PQ requirements may be inconflict.
This report focuses on the potential to not only avoid PQ and reliability related problems but toactually gain a performance advantage from DR. The report addresses the critical question ofhow a decentralized electric power system can perform better than the current vertically
integrated centralized generation and control. It offers analysis procedure and techniques toassess quality and reliability factors for DR installations. A future standalone software or web-based tool is envisioned and would be expected to simplify making assessment for specificapplications once these methods are applied and verified.
Reliability Vs Power Quality
A key concept in this report is connection between PQ and reliability from an end-userviewpoint. The electric utility transmission and distribution system is a complex networkintended to deliver the most reliable power to the majority of customers. Because of the way the
system is protected, momentary disturbances are common characteristic. Every time athunderstorm occurs, a tree or animal comes in contact with the power conductors, or some otherabnormal fault event occurs, a certain number of electricity customers will experience amomentary interruption in power while many other customers will experience a momentaryvoltage reduction called a “voltage sag.” This is simply a reduction in the voltage available onfrom the power source while the fault current is flowing. As soon as the fault is cleared, thepower goes back to normal. In the majority of cases, the entire event lasts less than a half second.Unfortunately for most customer process equipment, it doesn’t matter because production hasalready stopped and a costly reset and or cleanup effort is underway.
In terms of utility power-system performance, everything has worked as intended and hopefullypower is now back for all customers. Therefore, from a reliability standpoint (that is, long-term
interruption), no one was interrupted. This is good for the reliability indices that the electricutility reports annually, but is terrible from a customer standpoint because there may be literallymillions of dollars in losses if this event upsets process operations for a group of manufacturingor production facilities.
Typically, the motors, pumps, compressors, and other mission-critical process equipment are notsensitive to the momentary voltage sags, but the control circuitry is extremely sensitive andcauses the production equipment to trip offline. Even if the power-system fault is many miles
8/12/2019 Power Quality Impacts DG
http://slidepdf.com/reader/full/power-quality-impacts-dg 21/108
Introduction
1-4
away, a few of the more sensitive process controls will trip and while other may be unaffected. Ifthe fault is within a few miles of the substation bus, the resulting sag will be more severe andeverything in the plant is likely to trip offline. The bad news is that each event can cause costlyprocess downtime.
One of the methods of improving PQ performance and even longer-term reliability that is as ofyet relatively unproven is the strategic application of distributed generation. Much of the priorresearch into DR and PQ impacts has been from the standpoint of negative interactions, but thereare potential positive interactions that need to be evaluated. For example, properly installed andapplied DR can minimize the impact of voltage sags at the facility bus, can provide inherentsurge and lightning protection for downstream loads, can help regulate facility voltages at levelsvery close to the nameplate ratings of the sensitive equipment and can potentially improve threephase voltage unbalance. These positive PQ aspects of DR are detailed in the following chaptersalong with some useful information on equipment sensitivity levels, detailed power systemreliability assessments, and PQ screenings for DR installations.
Grid-Parallel or Standalone Operating Modes
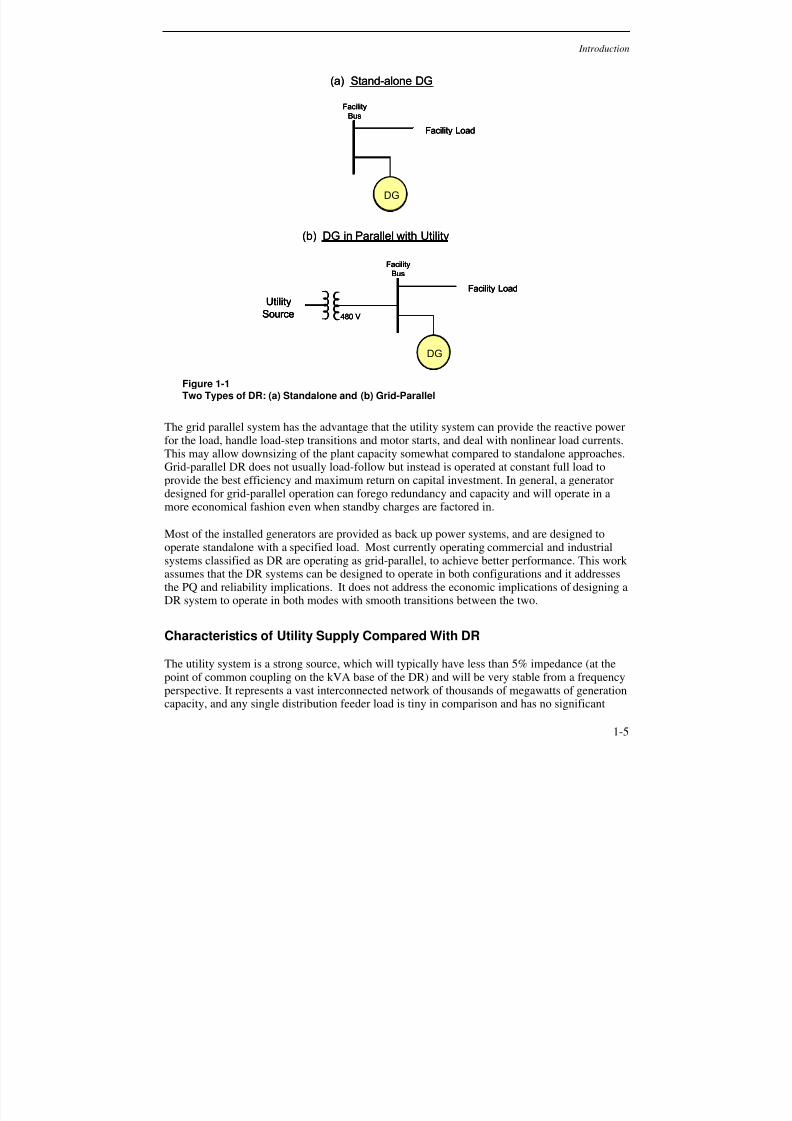
Two types of DR operating modes were considered to evaluate PQ and reliability impacts.These were standalone and grid-parallel DR. A standalone operating mode is an independentisland and as such must provide voltage and frequency regulation within the island (see Figure1-1a). Stand-alone DR must be able to follow and support various loading conditions whilemaintaining acceptable PQ. Loading conditions may include load steps, motor starts, inrushcurrent, load nonlinearity, reactive power needs, unbalances, and periodic load fluctuations. Thestandalone generator must be reliable because it is the only source of power available. Thestandalone application is usually more demanding and costly than grid-parallel because it isdesigned with greater redundancy and imposes more requirements on the generator. This usuallymeans that it is difficult to optimally size, from a capital investment perspective, and to optimallyoperate, from an efficiency perspective.
The other type of operating configuration is the grid-parallel system (see Figure 1-1b). DRconnected in parallel with the utility system operates as an additional source of energy, feedingthe grid. It is usually very small with respect to the total power system and has no significantimpact on power system frequency. It may supply most or all of the energy to the local customerload, but the customer site can rely upon the utility system source should the DR fail. This meansthat reliability of the DR is not so crucial as it would be for a standalone system. Grid-parallelDR is normally operated in a voltage-following mode, which means the machine operates atclose to unity power factor and does not attempt to directly regulate voltage with reactive power.
8/12/2019 Power Quality Impacts DG
http://slidepdf.com/reader/full/power-quality-impacts-dg 22/108
Introduction
1-5
UtilitySource
Facility Load
480 V
DG
Facility
Bus
Facility Load
DG
Facility
Bus
(a) Stand-alone DG
(b) DG in Parallel with Utility
UtilitySource
Facility Load
480 V
DG
Facility
Bus
UtilitySource
Facility Load
480 V
DGDG
Facility
Bus
Facility Load
DG
Facility
Bus
Facility Load
DGDG
Facility
Bus
(a) Stand-alone DG
(b) DG in Parallel with Utility
Figure 1-1Two Types of DR: (a) Standalone and (b) Grid-Parallel
The grid parallel system has the advantage that the utility system can provide the reactive powerfor the load, handle load-step transitions and motor starts, and deal with nonlinear load currents.
This may allow downsizing of the plant capacity somewhat compared to standalone approaches.Grid-parallel DR does not usually load-follow but instead is operated at constant full load toprovide the best efficiency and maximum return on capital investment. In general, a generatordesigned for grid-parallel operation can forego redundancy and capacity and will operate in amore economical fashion even when standby charges are factored in.
Most of the installed generators are provided as back up power systems, and are designed tooperate standalone with a specified load. Most currently operating commercial and industrialsystems classified as DR are operating as grid-parallel, to achieve better performance. This workassumes that the DR systems can be designed to operate in both configurations and it addressesthe PQ and reliability implications. It does not address the economic implications of designing a
DR system to operate in both modes with smooth transitions between the two.
Characteristics of Utility Supply Compared With DR
The utility system is a strong source, which will typically have less than 5% impedance (at thepoint of common coupling on the kVA base of the DR) and will be very stable from a frequencyperspective. It represents a vast interconnected network of thousands of megawatts of generationcapacity, and any single distribution feeder load is tiny in comparison and has no significant
8/12/2019 Power Quality Impacts DG
http://slidepdf.com/reader/full/power-quality-impacts-dg 23/108
Introduction
1-6
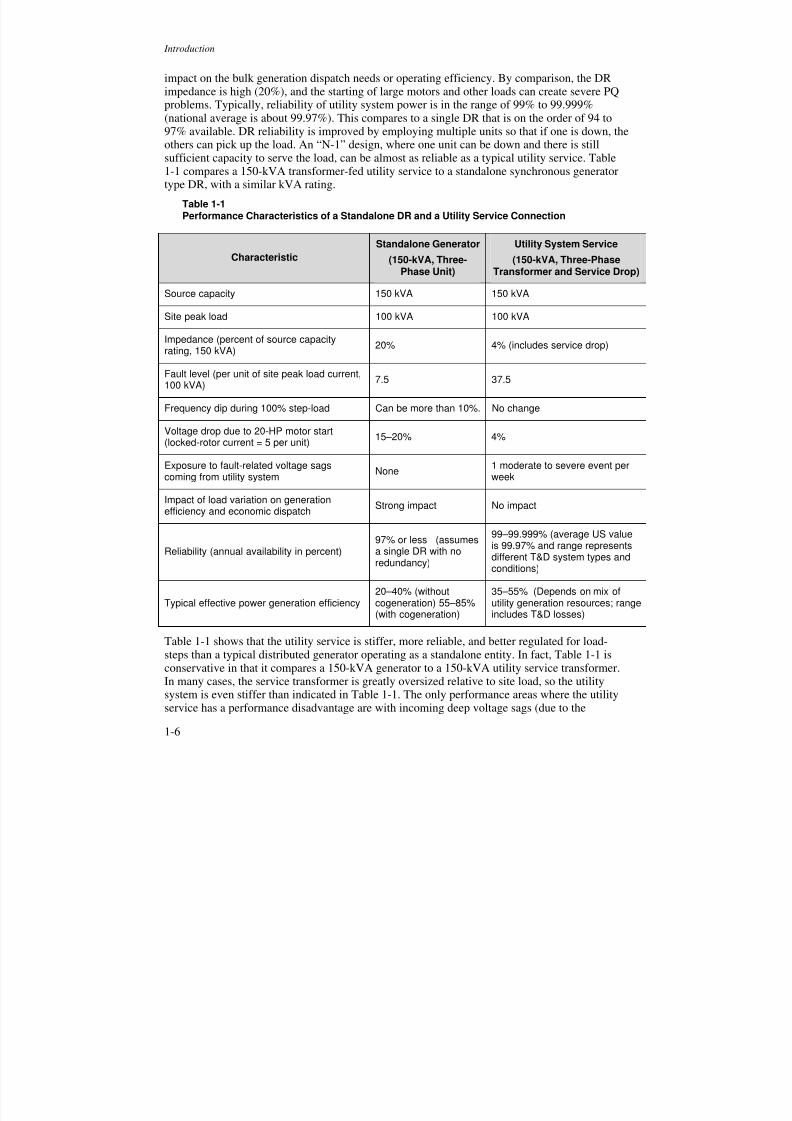
impact on the bulk generation dispatch needs or operating efficiency. By comparison, the DRimpedance is high (20%), and the starting of large motors and other loads can create severe PQproblems. Typically, reliability of utility system power is in the range of 99% to 99.999%(national average is about 99.97%). This compares to a single DR that is on the order of 94 to97% available. DR reliability is improved by employing multiple units so that if one is down, theothers can pick up the load. An “N-1” design, where one unit can be down and there is stillsufficient capacity to serve the load, can be almost as reliable as a typical utility service. Table1-1 compares a 150-kVA transformer-fed utility service to a standalone synchronous generatortype DR, with a similar kVA rating.
Table 1-1Performance Characteristics of a Standalone DR and a Utility Service Connection
Characteristic
Standalone Generator
(150-kVA, Three-Phase Unit)
Utility System Service
(150-kVA, Three-PhaseTransformer and Service Drop)
Source capacity 150 kVA 150 kVA
Site peak load 100 kVA 100 kVA
Impedance (percent of source capacityrating, 150 kVA)
20% 4% (includes service drop)
Fault level (per unit of site peak load current,100 kVA)
7.5 37.5
Frequency dip during 100% step-load Can be more than 10%. No change
Voltage drop due to 20-HP motor start(locked-rotor current = 5 per unit)
15–20% 4%
Exposure to fault-related voltage sagscoming from utility system
None1 moderate to severe event perweek
Impact of load variation on generationefficiency and economic dispatch
Strong impact No impact
Reliability (annual availability in percent)97% or less (assumesa single DR with noredundancy)
99–99.999% (average US valueis 99.97% and range representsdifferent T&D system types andconditions)
Typical effective power generation efficiency
20–40% (without
cogeneration) 55–85%(with cogeneration)
35–55% (Depends on mix of
utility generation resources; rangeincludes T&D losses)
Table 1-1 shows that the utility service is stiffer, more reliable, and better regulated for load-steps than a typical distributed generator operating as a standalone entity. In fact, Table 1-1 isconservative in that it compares a 150-kVA generator to a 150-kVA utility service transformer.In many cases, the service transformer is greatly oversized relative to site load, so the utilitysystem is even stiffer than indicated in Table 1-1. The only performance areas where the utilityservice has a performance disadvantage are with incoming deep voltage sags (due to the
8/12/2019 Power Quality Impacts DG
http://slidepdf.com/reader/full/power-quality-impacts-dg 24/108
Introduction
1-7
exposure of the power system) and in the efficiency of the generator if the DR is a co-generationunit (waste heat is recovered).
When DR is combined in parallel with the utility system, the attributes of both approaches areemphasized. A properly interfaced grid-parallel DR can offer better PQ, reliability, and
efficiency to the customer site than the standalone generator or the utility service alone. The keybenefits are as follows:
• Voltage regulation: The low impedance of the utility service (typically less than 5%) incombination with the DR means that load steps and motor starts have a far less perturbingimpact on the facility voltage level than they would for a standalone generator with 20%impedance. Furthermore, the combined impedance of the DR and utility system is slightlylower than the utility system alone, enabling better voltage regulation response during load-steps than with the utility system alone.
• Harmonic distortion: The lower impedance of the utility system with respect to harmonics incombination with the DR means that nonlinear loads result in far less voltage distortion thanif a standalone generator had to drive them. The utility system combined with the DR may
also result in less distortion than the utility system alone if the DR is not a significant sourceof harmonics
• Frequency regulation: The parallel utility connection should hold frequency to within
±0.5 Hz of 60 Hz in all but the most unusual utility system conditions, whereas the
standalone generator will be momentarily well outside ± 2 Hz of 60 Hz during large loadfluctuations.
• Efficiency: Operation of the DR in parallel with the utility system will enable heat enginedevices (internal combustion engines [ICEs] and combustion turbines) to operate at a pointon their loading curve that saves 10 to 20% in fuel per kilowatt-hour produced compared tothe standalone application. In cogeneration applications, the DR can also be sized and
operated to more appropriately match the site heat needs, which will significantly improveefficiency.
• Reactive power: Operation of the DR in parallel with the utility system may allow the DR tofocus purely on the site real power consumption and not provide reactive support, dependingon the interconnection requirements and agreement with local utility. Depending on thegenerator design, type, and loads at the site, this can lead to significant capacity cost savingsfor the DR.
• Reliability: A typical parallel utility connection can eliminate more than 99% of the potentialpower interruptions that an “N-0 designed” standalone DR installation would experience.Alternatively, it avoids the need to design for “N-1” or “N-2” and saves at least several
hundred dollars per kilowatt in marginal standby capacity costs.• Optimal sizing cost savings: The parallel connection with the utility system allows the DR
integrator to design less capacity margin into the DR plant, thereby saving significantly onDR capacity costs.
Most or all of the above benefits apply to any type of distributed generation, including internalcombustion engines and combustion turbine installations. This project focused on internalcombustion engines and combustion turbine prime movers with synchronous generators because
8/12/2019 Power Quality Impacts DG
http://slidepdf.com/reader/full/power-quality-impacts-dg 25/108
Introduction
1-8
these are the most common form of DR at industrial and commercial facilities that may bepaying standby charges and/or considering the pros and cons of standalone operation.
How to Use This Report
The report identifies and defines the specific areas where DR poses either a positive or a negativeimpact on end-use equipment. It then set out to develop guidelines for the assessment and ifrequired, resolution of these impacts. This is accomplished by first defining different measuresof electric reliability and PQ for conventional power systems. Then the likely reliability andquality impacts of adding a DR are also defined. By reviewing the typical susceptibility of end-use equipment the most important impact areas are determined. For these areas, an assessmentprocedure is proposed to insure the best application of DR at or close to industrial andcommercial facilities.
The chapter organization is as follows. Chapters 2 and 3 cover the different electric reliabilityand quality measures that can be positively or negatively impacted. In Chapter 4 an overview of
commercial and industrial equipment sensitivity to power variations is provided. Chapter 5follows up by describing four engineering assessment procedures that address the main PQ andreliability impacts of DR. Then in Chapter 6 these impacts with installed DR are described interms of their effects on the performance end-user equipment.
.

8/12/2019 Power Quality Impacts DG
http://slidepdf.com/reader/full/power-quality-impacts-dg 26/108
8/12/2019 Power Quality Impacts DG
http://slidepdf.com/reader/full/power-quality-impacts-dg 27/108
2-1
2OVERVIEW OF ELECTRIC POWER SYSTEM
RELIABILITY AND DISTRIBUTED RESOURCES
This chapter details power system reliability including definitions, design considerations,measurement, and the likely impacts, both positive and negative, related specifically to theapplication of DR. Necessarily, distinctions are made between point of service reliability and theinternal facility power distribution reliability, where on-site generation plays a significant role.Some aspects of reliability prediction and related probability methods used in reliability analysisare referenced. Finally, the role of end-use equipment susceptibility in determining overallsystem reliability is discussed.
Electric Power System Reliability
Planning for reliable power requires a total system viewpoint including consideration of theservice reliability, the local electrical distribution design, and the requirements of end-use loads.A prediction of reliability involves the individual reliability of all components required to deliverpower. Therefore reliability is reduced by distance and number of components between the mainpower source and the equipment to be served. Conversely, reliability is more likely increased byproviding alternate delivery paths and additional sources of generation or by simply placing thegenerator closer to the point of use. This is where DR can play a significant role in adding
reliability to an electric power system.
Fortunately a number of methods have been developed, and are generally accepted in the electricindustry, for measuring and predicting reliability. Reliability assessment and evaluation methodsbased on probability theory that allow the reliability of a proposed system to be predictedquantitatively are finding wide application today. Such methods permit consistent, defensible,and unbiased assessments of system reliability that are not otherwise possible. Fundamentalsnecessary for a quantitative reliability evaluation of electric power systems include definition ofbasic terms, practical measures of system performance, and the component reliability data.
Conventional Measures of Reliability
The term reliability in the context of electric power systems is generally used to indicate theability of a system to continue to perform its intended function. In its simplest form we considerthat power is either available or not. And the measurement indexes that have proven to be mostuseful and meaningful in power distribution system design from
1 2, are:
1 Billinton, R., and Allan, R. N., “Reliability Evaluation of Power Systems,” Plenum Publishing Corp., 1983.
8/12/2019 Power Quality Impacts DG
http://slidepdf.com/reader/full/power-quality-impacts-dg 28/108
Overview of Electric Power System Reliability and Distributed Resources
2-2
• Load interruption frequency (number/unit time)
• Expected duration of load interruption events (time)
These indexes can be computed and then used to compute other indexes that are useful:
• Total expected (average) interruption time per year (or other time period)• System availability or unavailability as measured at the load supply point in question
• Expected demanded, but unsupplied, energy per year
These measures become more complicated when different degrees of performance and failure areconsidered. The disruptive effect of power interruptions is often non-linearly related to numberof phases effected and duration of the interruption. Thus, it is often desirable to compute notonly an overall interruption frequency but also frequencies of interruptions categorized by theappropriate durations. This is particularly important in cases where no interruption occurs andthe issue is voltage quality, the varying degrees and the different effects of unbalance, sags orswells, to be discussed later.
From these fundamental concepts several measures of reliability have evolved in common useand are described in technical literature and standards. The following reliability measures,defined in the IEEE Gold Book
3, are most commonly used for power distribution and other
industrial and commercial electrical systems:
Availability As applied either to the performance of individual components or to that of a
system, it is the long-term average fraction of time that a component or system is in service andsatisfactorily performing its intended function. An alternative and equivalent definition for
availability is the steady-state probability that a component or system is in service. (IEEE Std493, 1997)
Unavailability The long-term average time, as a fraction of total time, that a component orsystem is out of service due to failures or scheduled outages. An alternative definition is thesteady-state probability that a component or system is out of service due to failures or scheduledoutages. Mathematically, unavailability = 1–availability (IEEE Std 493, 1997)
Interruption The loss of electric power supply to one or more loads. (IEEE Std 493, 1997)
Interruption frequency The expected (average) number of power interruptions to a load perunit time, usually expressed as interruptions per year. (IEEE Std 493, 1997)
Mean time between failures (MTBF) The mean exposure time between consecutive failures ofa component. It can be estimated by dividing the exposure time by the number of failures in that
2 Ayoub, A. K., and Patton, A. D., “A frequency and duration method for generating system reliability evaluation,”
IEEE Transactions on Power Apparatus and Systems, Nov. Dec. 1976, pp. 1929–1933.
3 IEEE Recommended Practice for the Design of Reliable Industrial and Commercial Power Systems, IEEE Gold
Book, IEEE Standard 493, 1997.
8/12/2019 Power Quality Impacts DG
http://slidepdf.com/reader/full/power-quality-impacts-dg 29/108
Overview of Electric Power System Reliability and Distributed Resources
2-3
period, provided that a sufficient number of failures have occurred in that period. (IEEE Std 493,1997)
Mean time to repair (MTTR) The mean time to repair or replace a failed component. It can beestimated by dividing the summation of repair times by the number of repairs, and, therefore, it
is practically the average repair time (IEEE Std 493, 1997). Also it might be referred to as“expected failure duration” referring to expected or long-term average duration of a single failureevent.
Frequency of system failure is an index of the mean number of system failures per unit time,and is also given as the reciprocal MTBF.
Availability as a Measure of Reliability
Availability is one measure of power system reliability that has gained popularity lately as theeconomy moves from the industrial age to the high-tech digital age. This “index of nines” has
been used to measure the uptime of a process and has been a commonly used metric to define theavailability requirement for mission-critical facilities. And it has been used for quite some timein MIL Standards and other component or system reliability standards to describe the probabilitythat a system or component will be available.
In this case availability (or up time) of a component or system is based on its mean time betweenfailure (MTBF) and mean time to repair (MTTR). For example, if the MTBF of a 480-V metal-
clad switchgear is 0.0012 failures per year (λ) and if the MTTR is 0.0108 hours per year (r), then
the total downtime you would expect from the component is a product of λ and r, or 0.0012 X0.0108 = 0.00001296 hours, an “unavailability” of 0.046656 seconds per year. The total uptimeor the availability of the component can now be described as a string of Nine’s as follows: (1-
0.00001296/8760) = 0.9999999985 or 99.99999985%.
Since it is awkward to read such a long number, it has become commonplace to count thenumber of nines, such as “six nines” for 99.9999% or “nine nines” for 99.9999999% availability.In the power-conditioning industry, this method of calculating availability has been used foryears to describe how reliable the different premium power systems such as UPS. The conceptthat was conveyed to the buyers was “the more nines, the more reliable the UPS system.”
Even in the digital world of server manufacturers, the metric of Nines was used to tout oneproduct against another. From Compaq to IBM to Hewlett Packard, the number of nines wasused as a simple way to convey the reliability of their systems to the user. For example, HewlettPackard N-Class servers were promoted this way, e.g., “The N-Class offers excellent highavailability (99.99% hardware availability, 99.95% across the entire solution stack) as HP movestowards its 5 nines: 5 minutes vision (99.999% data availability with only 5 minutes unplanneddowntime per year).”
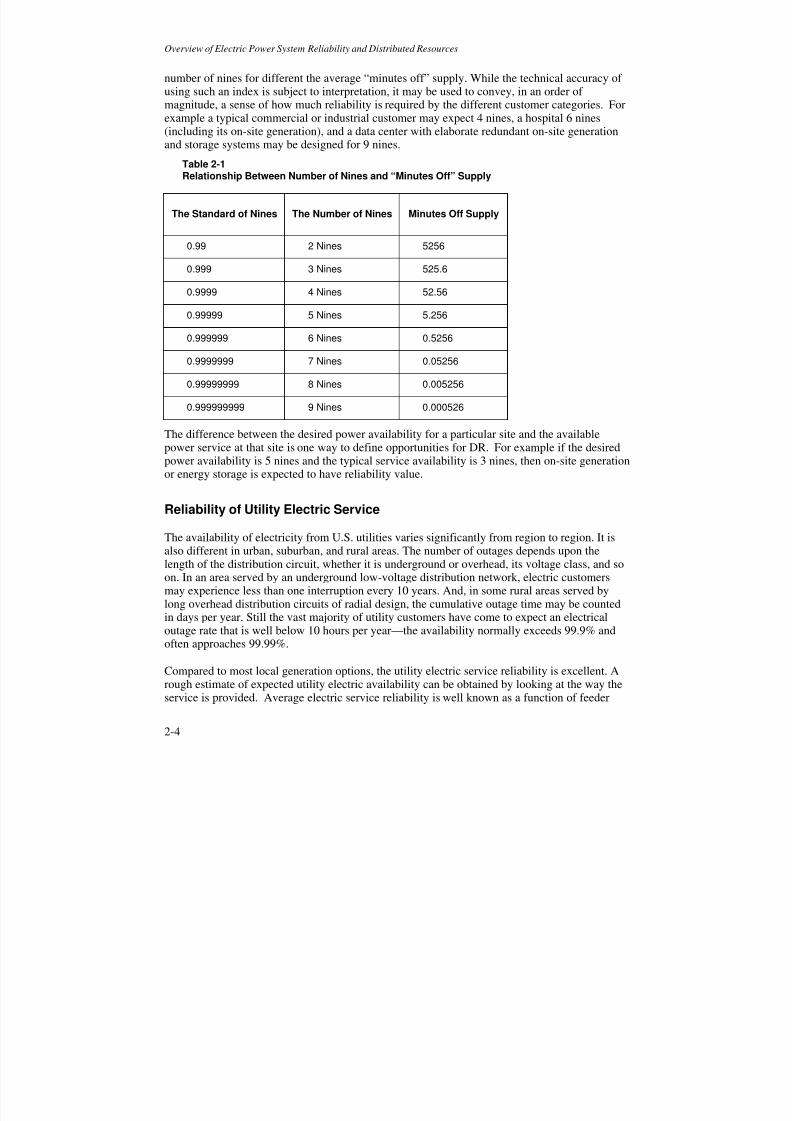
Recently there has been a trend of using the Nines as a metric for electric power systemavailability. Simply stated, the number of nines can be easily explained in terms of the percent oftime in a year that power is expected to be available, where the 9’s are calculated by setting totaltime as 1 and therefore availability is 1 – the time unavailable. Table 2-1 shows availability, and
8/12/2019 Power Quality Impacts DG
http://slidepdf.com/reader/full/power-quality-impacts-dg 30/108
8/12/2019 Power Quality Impacts DG
http://slidepdf.com/reader/full/power-quality-impacts-dg 31/108
Overview of Electric Power System Reliability and Distributed Resources
2-5
type. Based on the Nines method and using approximate values (because the difference inavailability demarcated between any two consecutive Nines can be large), the availability ofelectric supply for the different categories of feeders is typically:
• Commercial Business District: 99.999%
• Urban: 4 Nines or 99.99%• Rural: 3 to 4 Nines or 99.9% to 99.99%
• Remote: 3 Nines or 99.9%
Note that these are average numbers for a large number of feeders. Any particular customer onany given circuit may experience reliability that is higher or lower than the numbers shownabove. It is always best to look at feeder specific data when the location is known.
Also it is important to note that availability is only one measure of reliability. In some practicalcases a very high availability is not considered to be reliable service because the frequency ofoccurrence of events is relatively high. In this case availability can remain high if all events areof short duration, e.g. momentary. The unreliability comes in situations where brief powerinterruptions translate into longer down time of end use process or equipment. To bettercommunicate these differences in interruption duration several classifications have beenestablished in power system standards.
Depending on which standard is followed, power failures or interruptions have been classified aslong-term, short-term, momentary, temporary or sustained. Although impacts on the end usermay vary, depending on the nature of the load equipment, and critically of its function, the timesassociated with these terms are becoming more standardized, especially in the utility industry.These standard terms can be a big help in communicating power-related problems with endusers. The following overview shows IEEE and European power system standard terms for
various interruption or power failure times as well as the methods of restoration. Note that thesestandards cover generation to end-use and are arranged by publication date with the most recentreflecting latest practices:
• IEEE Std. 1366-1998, Trial-Use Guide for Electric Power Distribution Reliability Indices.
— Interruption, momentary. Single operation of an interrupting device, which resultsin a voltage zero. For example, two breaker or recloser operations equals twomomentary interruptions
— Interruption, sustained. Any interruption not classified as a momentary event. Anyinterruption longer than 5 minutes
• IEEE Std. 1250-1995, IEEE Guide for Service to Equipment Sensitive to MomentaryVoltage Disturbances.
— Instantaneous interruption: between 0.5 cycles and 30 cycles
— Momentary interruption: between 30 cycles and 2 seconds
— Temporary interruption: between 2 seconds to 2 minutes
— Sustained interruption: longer than 2 minutes
8/12/2019 Power Quality Impacts DG
http://slidepdf.com/reader/full/power-quality-impacts-dg 32/108
Overview of Electric Power System Reliability and Distributed Resources
2-6
• IEEE Std. 1159-1995, IEEE Recommended Practice for Monitoring Electric Power Quality(note this standard touches on reliability by defining interruptions of power and also definesother parameters for measuring quality of power)
— Momentary interruption: between 0.5 cycles and 3 seconds
— Temporary interruption: between 3 seconds and 1 minute — Sustained interruption: longer than one minute
• IEEE Std. 859-1987, IEEE Standard Terms for Reporting and Analyzing OutageOccurrences and Outage States of Electrical Transmission Facilities (withdrawn by IEEE butstill in the vocabulary of may utility power system engineers).
— Transient outages are restored automatically
— Temporary outages are restored by manual switching
— Permanent outages are restored through repair or replacement.
• European Norm EN 50160 (also being consider as an IEC standard) Voltage characteristics
of electricity supplied by public distribution systems.
— Short interruptions: up to three minutes
— Long interruption: longer than three minutes
Frequency and Duration of Interruptions
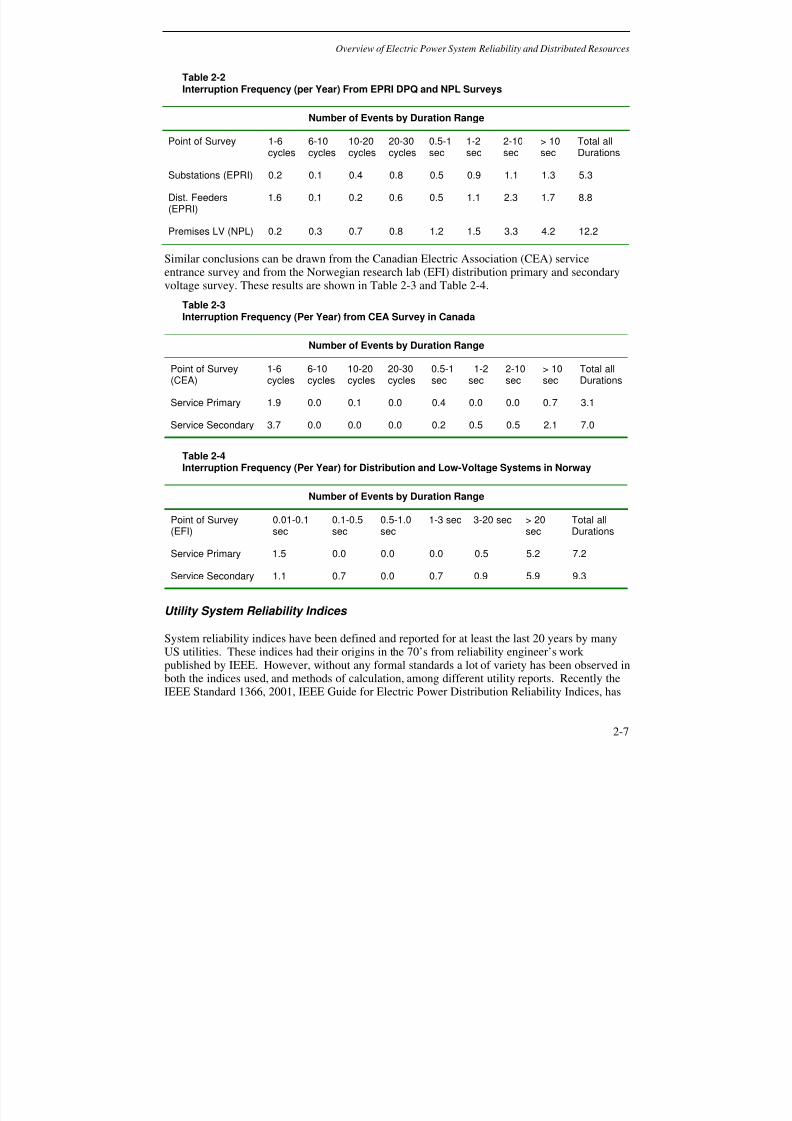
The frequency of short-duration interruptions has been quantified by various PQ surveys,including the EPRI Distribution Power Quality Project. These surveys, taken at different pointsin the distribution and end use systems, provide a good comparison on how events propagatethrough the power system. Such a comparison is made in Table 2-2 for two large North
American surveys, the EPRI Distribution Power Quality (DPQ) survey and the National PowerLab (NPL) survey. The EPRI survey monitored both distribution substations and distributionfeeders. The NPL survey monitored power receptacles inside an end user facility. This datashows that the overall trend is for the number of short interruptions to increase when movingfrom the power source to the load.
8/12/2019 Power Quality Impacts DG
http://slidepdf.com/reader/full/power-quality-impacts-dg 33/108
Overview of Electric Power System Reliability and Distributed Resources
2-7
Table 2-2Interruption Frequency (per Year) From EPRI DPQ and NPL Surveys
Number of Events by Duration Range
Point of Survey 1-6
cycles
6-10
cycles
10-20
cycles
20-30
cycles
0.5-1
sec
1-2
sec
2-10
sec
> 10
sec
Total all
Durations
Substations (EPRI) 0.2 0.1 0.4 0.8 0.5 0.9 1.1 1.3 5.3
Dist. Feeders(EPRI)
1.6 0.1 0.2 0.6 0.5 1.1 2.3 1.7 8.8
Premises LV (NPL) 0.2 0.3 0.7 0.8 1.2 1.5 3.3 4.2 12.2
Similar conclusions can be drawn from the Canadian Electric Association (CEA) serviceentrance survey and from the Norwegian research lab (EFI) distribution primary and secondaryvoltage survey. These results are shown in Table 2-3 and Table 2-4.
Table 2-3Interruption Frequency (Per Year) from CEA Survey in Canada
Number of Events by Duration Range
Point of Survey(CEA)
1-6cycles
6-10cycles
10-20cycles
20-30cycles
0.5-1sec
1-2sec
2-10sec
> 10sec
Total allDurations
Service Primary 1.9 0.0 0.1 0.0 0.4 0.0 0.0 0.7 3.1
Service Secondary 3.7 0.0 0.0 0.0 0.2 0.5 0.5 2.1 7.0
Table 2-4Interruption Frequency (Per Year) for Distribution and Low-Voltage Systems in Norway
Number of Events by Duration Range
Point of Survey(EFI)
0.01-0.1sec
0.1-0.5sec
0.5-1.0sec
1-3 sec 3-20 sec > 20sec
Total allDurations
Service Primary 1.5 0.0 0.0 0.0 0.5 5.2 7.2
Service Secondary 1.1 0.7 0.0 0.7 0.9 5.9 9.3
Utility System Reliability Indices
System reliability indices have been defined and reported for at least the last 20 years by manyUS utilities. These indices had their origins in the 70’s from reliability engineer’s workpublished by IEEE. However, without any formal standards a lot of variety has been observed inboth the indices used, and methods of calculation, among different utility reports. Recently theIEEE Standard 1366, 2001, IEEE Guide for Electric Power Distribution Reliability Indices, has
8/12/2019 Power Quality Impacts DG
http://slidepdf.com/reader/full/power-quality-impacts-dg 34/108
Overview of Electric Power System Reliability and Distributed Resources
2-8
gone a long way toward consistent definition of for these system indices and the methods forcalculating them.
Even with the new standard there are some aspects of reporting where more work is needed indefining and establishing consensus. For example there is not agreement on the definition of
major events and on a single way to calculate outage indices when major events occur.Consequently the IEEE working group on outage reporting practices continues itsstandardization activity in this area.
In IEEE 1366 nine indices are defined, however based on a survey of US utilities, only 4 are incommon use. The two most commonly used indices based on sustained interruptions are theService Average Interruption Frequency Index (SAIFI) and Service Average InterruptionDuration Index (SAIDI). Also popular for sustained interruptions are indices on CustomerAverage Interruption Duration (CAIDI) and Average Service Availability (ASAI) in Formomentary interruptions the most commonly used index is Momentary Average InterruptionFrequency Index (MAIFI). The following are the definitions of these indices from IEEE 1366.
SAIFI System average interruption frequency index (sustained interruptions). This index isdesigned to give information about the average frequency of sustained interruptions per customerover a predefined area. In words the definition is:
served customersof number Total
onsinterrupticustomer of number Total SAIFI = Eq. 2-1
To calculate the index use the following equation:
T
i
N
N SAIFI
∑= Eq. 2-2
SAIDI System average interruption duration index. This index is commonly referred to ascustomer minutes of interruption or customer hours, and is designed to provide informationabout the average time the customers are interrupted. In words, the definition is:
served customersof number Total
durationsoninterruptiCustomer SAIDI
∑= Eq. 2-3
To calculate the index, use the following equation:
T
ii N r
SAIDI
∑
= Eq. 2-4
CAIDI Customer average interruption duration index. CAIDI represents the average timerequired to restore service to the average customer per sustained interruption. In words, thedefinition is:
8/12/2019 Power Quality Impacts DG
http://slidepdf.com/reader/full/power-quality-impacts-dg 35/108
Overview of Electric Power System Reliability and Distributed Resources
2-9
onsinterrupticustomer of number Total
durationsoninterruptiCustomer CAIDI
∑= Eq. 2-5
To calculate the index use the following equation:
SAIFI SAIDI
N N r CAIDI T
ii=∑= Eq. 2-6
ASAI Average service availability index. This index represents the fraction of time (often inpercentage) that a customer has power provided during one year or the defined reporting period.In words, the definition is:
demand servicehoursCustomer
tyavailabili servicehoursCustomer ASAI = Eq. 2-7
To calculate the index use the following equation:
hours/year of (No. N
N r - )hours/year of (No. N ASAI
X T
ii X T ∑= Eq. 2-8
System indices for reporting momentary outages were also introduced in the IEEE Std 1366. Inthe past many short-term outage were not reported. These are of particular consequence whendetermining service reliability for digital or highly automated process industries, where a veryshort interruption has about the same impact on the process as a sustained outage. The most usedof the momentary outage indices is MAIFI.
MAIFI Momentary average interruption frequency index. This index is very similar to SAIFI,but it tracks the average frequency of momentary interruptions. In words, the definition is:
served customersof number Total
onsinterruptimomentarycustomer of number Total MAIFI = Eq. 2-9
To calculate the index, use the following equation:
T
ii
N
N ID MAIFI ∑
= Eq. 2-10
A survey by Edison Electric Institute (EEI), in 1995 has been useful in showing how utilities areusing indices. In this survey 160 utilities were survey and 78 responded. These results areshown in Figure 2-1.

8/12/2019 Power Quality Impacts DG
http://slidepdf.com/reader/full/power-quality-impacts-dg 36/108
Overview of Electric Power System Reliability and Distributed Resources
2-10
Figure 2-1Percentage of Companies Using Indices Reporting in 19954 Out of 78 Utilities
The most used index is SAIDI, followed by SAIDI and CAIDI. Many utilities also measureASAI, which represents the fraction of time (often in percentage) that an end-user has poweravailable during one year or other defined reporting period. For example, if an end-user does nothave power for a total of 2 hours in a given year (8,760 hours), the ASAI index for that customeris calculated as ASAI =(8760-2)/8760 = 0.99977. So ASAI can be described as the number ofnines or a percentage representing actual availability.
In the 1995 EIA survey, with 78 utilities reporting, the average feeder availability reported was
to be .9994 and the mean was .9998. Some exceptional feeders reported 5 and 6 ninesavailability. This was also true in an earlier survey in 1990 with 60 utilities responding. Forsome transmission-connected customers availability is reported at 100%, which means that thepower is available for all 8,760 hours a year.
However availability one, the number of 9s, is not always the best measure of perceivedreliability. This is the reason for the new momentary measures of reliability. It is certainlypossible to have many momentary interruptions and a 3 or 4 nines of availability. Figure 2-2shows the survey result for the momentary, MAIFI, index. It should be noted that a severevoltage sag, which may result in a end-user equipment interruption, is not counted in the MAIFIindex.
4 A Nationwide Survey of Distribution Reliability Measurement Practices" By IEEE/PES Working Group on System
Design, Paper No.98 WM 218

8/12/2019 Power Quality Impacts DG
http://slidepdf.com/reader/full/power-quality-impacts-dg 37/108
Overview of Electric Power System Reliability and Distributed Resources
2-11
Figure 2-2
Results of Survey of MAIFI Index for Reliability
Reliability of Facility Power Distribution
Reliability of the local power distribution system depends on the electrical components that arecritical to power delivery such as service the transformer, circuit breakers, cable, bus duct, andetc. Each component of the power distribution has an expected failure rate and repair time. The IEEE Gold Book is one of the most authoritative resources on reliability of electrical equipmentand electric power systems in commercial and industrial facilities. Table 2-5 shows a summaryof the failure rates of common equipment as cited in the Gold Book. This reliability data can be
used in an analysis to predict local power distribution reliability based on different series andparallel circuit configurations. This procedure is described in Chapter 5 of this report.

8/12/2019 Power Quality Impacts DG
http://slidepdf.com/reader/full/power-quality-impacts-dg 38/108
Overview of Electric Power System Reliability and Distributed Resources
2-12
Table 2-5Reliability of Common Low-Voltage (<600 V) Equipment5
EquipmentFailure Rate
(Events Per Year)Mean Time Between Failures
(Years)
Cable [per 1000 circuit feet] 0.00141 709
Bus duct [per 1 circuit foot] 0.000125 8000
Transformers 0.0062 161
Fixed circuit breakers 0.0042 238
Metalclad drawout circuit breakers 0.0027 370
Enclosed disconnect switches 0.0061 164
Availability of Local Generation
As discussed in the previous section the availability of the electric grid is typically 99.9 or 99.99.By comparison, ICE generators and gas turbine driven generators in continuous operation areavailable approximately 95 to 97% of the time. At 97% availability this means that the localgenerator is expected to be out of service 263 hours a year, which is about 11 days. Mostgenerator equipment manufactures cannot guarantee this level of availability.
Some downtime is for planned outages to perform maintenance; these outages may not impactPQ if they can be scheduled at non-critical times. However, ICE generators and gas turbinegenerators (taken on an individual basis) are also out of service because of unplanned eventsabout 1 to 2% of the time, or 88 hours per year, a little over three and a half days. Since this levelof reliability is less than that of typical utility-supplied power transfer or paralleling scheme arethe preferred approach. Of course, the reliability figures discussed are for a single localgenerator and can be improved with multiple units and redundant capacity.
Using Multiple Generators to Enhance Reliability
When planners develop designs for distributed generation power plants, these designs typicallyemploy multiple small generators with a combined capacity that is sufficient to satisfy the loadand reserve requirements. For a specified reliability goal (3 nines, 4 nines, and so on) thedesigner must take into account both forced outage rates and scheduled outage rates of the
generators selected for the project. Depending on this desired reliability level and characteristicsof the generator, an N-1, N-2, or N-3 design may be necessary. This refers to the level ofredundancy, where –1 or –2 indicated the number of generators that can be down and the load isstill served. An N-1 design can still serve the load if any single generator fails. An N-2 designcan serve the load if any two generators fail, an N-3 if three units fail, and so on. Rarely wouldgreater than N-2 be needed.
5 IEEE 493-1997 (Gold Book), IEEE Recommended Practice for the Design of Reliable Industrial and Commercial
Power Systems
8/12/2019 Power Quality Impacts DG
http://slidepdf.com/reader/full/power-quality-impacts-dg 39/108
Overview of Electric Power System Reliability and Distributed Resources
2-13
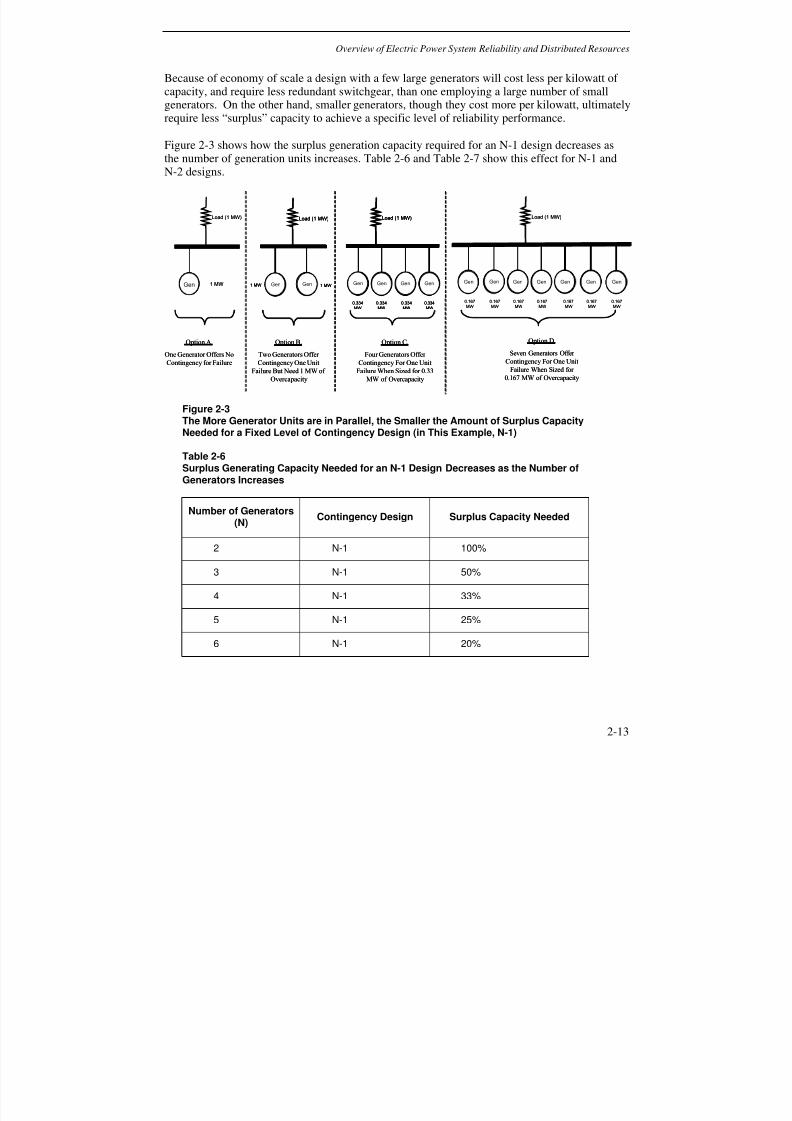
Because of economy of scale a design with a few large generators will cost less per kilowatt ofcapacity, and require less redundant switchgear, than one employing a large number of smallgenerators. On the other hand, smaller generators, though they cost more per kilowatt, ultimatelyrequire less “surplus” capacity to achieve a specific level of reliability performance.
Figure 2-3 shows how the surplus generation capacity required for an N-1 design decreases asthe number of generation units increases. Table 2-6 and Table 2-7 show this effect for N-1 andN-2 designs.
Gen
Load (1 MW)
1 MW Gen1 MW Gen 1 MW
Load (1 MW)
Gen
0.334MW
Gen
Load (1 MW)
Gen Gen
0.334MW
0.334MW
0.334MW
Gen Gen
Load (1 MW)
Gen Gen
0.167MW
Gen Gen Gen
0.167MW 0.167MW 0.167MW0.167MW0.167MW0.167MW
Option A.
One Generator Offers No
Contingency for Failure
Option B.
Two Generators Offer
Contingency One Unit
Failure But Need 1 MW of
Overcapacity
Option C.
Four Generators Offer
Contingency For One Unit
Failure When Sized for 0.33
MW of Overcapacity
Option D.
Seven Generators Offer
Contingency For One Unit
Failure When Sized for
0.167 MW of Overcapacity
Gen
Load (1 MW)
1 MW Gen1 MW Gen 1 MW
Load (1 MW)
GenGen1 MW GenGen 1 MW
Load (1 MW)
Gen
0.334MW
Gen
Load (1 MW)
Gen Gen
0.334MW
0.334MW
0.334MW
GenGen
0.334MW
GenGen
Load (1 MW)
GenGen GenGen
0.334MW
0.334MW
0.334MW
GenGen GenGen
Load (1 MW)
GenGen GenGen
0.167MW
GenGen GenGen GenGen
0.167MW 0.167MW 0.167MW0.167MW0.167MW0.167MW
Option A.
One Generator Offers No
Contingency for Failure
Option B.
Two Generators Offer
Contingency One Unit
Failure But Need 1 MW of
Overcapacity
Option C.
Four Generators Offer
Contingency For One Unit
Failure When Sized for 0.33
MW of Overcapacity
Option D.
Seven Generators Offer
Contingency For One Unit
Failure When Sized for
0.167 MW of Overcapacity
Figure 2-3The More Generator Units are in Parallel, the Smaller the Amount of Surplus CapacityNeeded for a Fixed Level of Contingency Design (in This Example, N-1)
Table 2-6Surplus Generating Capacity Needed for an N-1 Design Decreases as the Number ofGenerators Increases
Number of Generators(N)
Contingency Design Surplus Capacity Needed
2 N-1 100%
3 N-1 50%
4 N-1 33%
5 N-1 25%
6 N-1 20%
8/12/2019 Power Quality Impacts DG
http://slidepdf.com/reader/full/power-quality-impacts-dg 40/108
Overview of Electric Power System Reliability and Distributed Resources
2-14
Table 2-7Surplus Generation Capacity Needed With Parallel Generators Sized So That Any Two CanFail and the Load Can Still Be Served (Data for N-2 Design)
Number of Generators(N)
Contingency Design Surplus Capacity Needed
3 N-2 200%
4 N-2 100%
5 N-2 66%
6 N-2 50%
7 N-2 40%
8 N-2 33%
9 N-2 29%
10 N-2 25%
As an example of an N-1 design, if there are two generators and each can cover the load by itself,then 100% surplus capacity is available and overall reliability is improved dramatically. Theprobability that both units will be out of service at the same time is small but not infinitesimal.Each can be forced out of service 1% of the time while the other is being maintained (2% of thetime). Forced outages during maintenance will therefore occur 0.04% of the time. The two unitscan also both be forced out of service at the same time. This will happen 1% of 1% of the time,or 0.01% of the time. Therefore, both units will be unavailable 0.05% of the time, which is 4.38
hours per year. Overall, it will be possible to supply the load 99.95% of the time.
As an example of another N-1 design approach, with three generators sized so any two can coverthe load (each generator rated at 50% of the load), it will be possible to supply the load 99.85 %of the time. Two of the three units are estimated to be unavailable a total of 13 hours per year.
The analysis above assumes that there are no periods of light load. With a varying load, it isoften possible to schedule maintenance when fewer generators are needed. The risk of not beingable to satisfy the load because a generator is out for maintenance will then be minimal. Ifmaintenance is scheduled when only one of three generators is needed, then the load will only belost when two of the three units are forced out of service at the same time, about 2.6 hours/year.
Sufficient generation will be available 99.97% of the time. The availability could be higher if theload is light for long periods of time, so that two units are needed only occasionally. This iscomparable to the unavailability experienced by a typical utility.
For N-2 designs, the reliability improves even more. Any two units can fail and the load can stillbe served. For a three-unit system, with each unit sized at 100% of load, there is 200% surpluscapacity available. One of three units will be available 99.999993% of the time. All three will be
8/12/2019 Power Quality Impacts DG
http://slidepdf.com/reader/full/power-quality-impacts-dg 41/108
Overview of Electric Power System Reliability and Distributed Resources
2-15
out an average of 0.06 hours/year. This level of reliability is far better than the average radialpower distribution system and equivalent to the best network systems.
Backup Generation
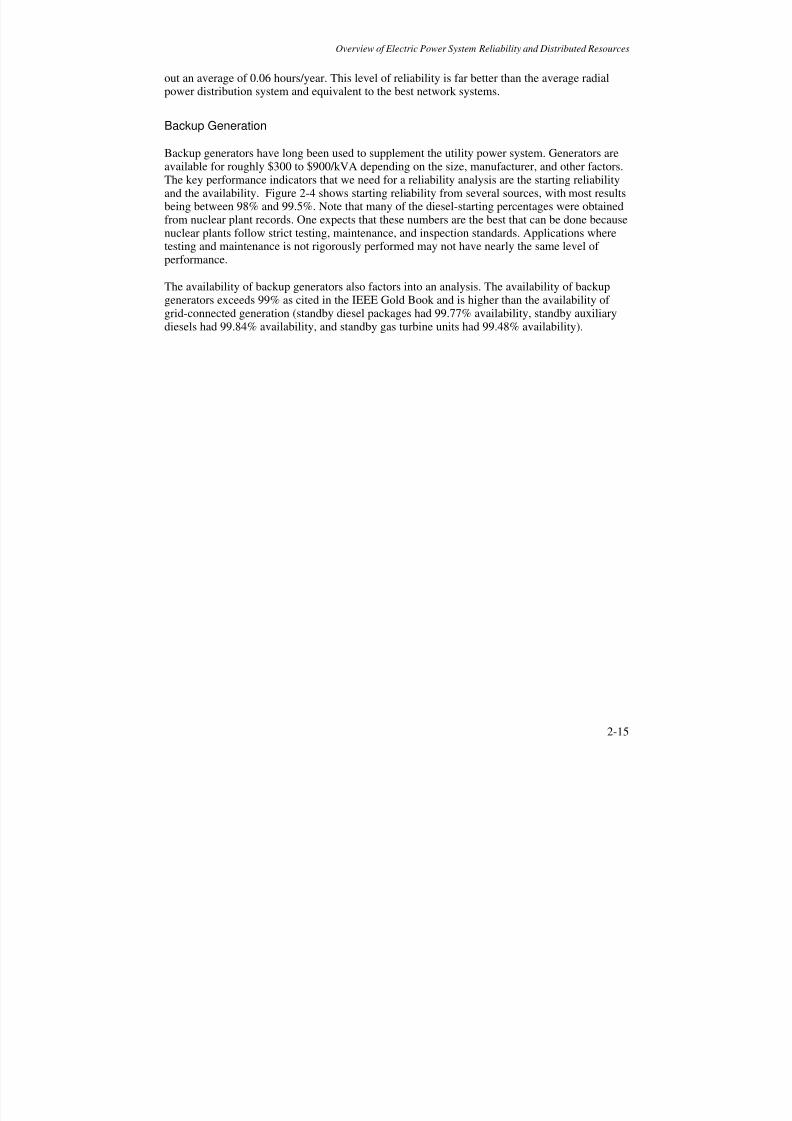
Backup generators have long been used to supplement the utility power system. Generators areavailable for roughly $300 to $900/kVA depending on the size, manufacturer, and other factors.The key performance indicators that we need for a reliability analysis are the starting reliabilityand the availability. Figure 2-4 shows starting reliability from several sources, with most resultsbeing between 98% and 99.5%. Note that many of the diesel-starting percentages were obtainedfrom nuclear plant records. One expects that these numbers are the best that can be done becausenuclear plants follow strict testing, maintenance, and inspection standards. Applications wheretesting and maintenance is not rigorously performed may not have nearly the same level ofperformance.
The availability of backup generators also factors into an analysis. The availability of backup
generators exceeds 99% as cited in the IEEE Gold Book and is higher than the availability ofgrid-connected generation (standby diesel packages had 99.77% availability, standby auxiliarydiesels had 99.84% availability, and standby gas turbine units had 99.48% availability).

8/12/2019 Power Quality Impacts DG
http://slidepdf.com/reader/full/power-quality-impacts-dg 42/108
Overview of Electric Power System Reliability and Distributed Resources
2-16
90 92 94 96 98 100
[ARINC:1988]
[Booz, et al.:1970]
[Kongsberg Dresser Power:1984]
[AT&T:1980]
[ARINC:1988]
Reliability of Emergency Diesel Generatorsat US Nuclear Plants [EPRI:1986]
Consumers Power, Big Rock Point [US NRC:1988]
Northeast Utilities, Millstone [US NRC:1988]
Northeast Utilities, Connecticut Yankee [US NRC:1988]
ComEd, Zion [US NRC:1988]
ConEd, Indian Point [US NRC:1988]
[Institute of Nuclear Power Operations:1983]
Telecommunications backup generators
Gas turbines [IEEE 493:1997]
Diesels [IEEE 493:1997]
[Bodi:1993]
Generator starting reliability, percent
Figure 2-4Starting Reliability for Backup Generators.6,7
6 IEEE 493-1997 (Gold Book), IEEE Recommended Practice for the Design of Reliable Industrial and Commercial
Power Systems, and the following references sited in the Gold Book:
ARINC Research Corporation, Final Report—RAM Study of Diesel and Gas-Turbine Generator Sets, Publication4219-03-01-4803.
Booz, Allen Applied Research, Small Gas Turbine Start Investigation, April 1970.
Kongsberg Dresser Power, Internal Study Comparing Diesels with Gas Turbine Engines (unpublished), 1984.AT&T, Internal Study for Gas-Turbine Reliability (unpublished), 1980.
Electric Power Research Institute (EPRI), Reliability of Emergency Diesel Generators at U.S. Nuclear PowerPlants, NSAC 108, Sept. 1986.
U.S. Nuclear Regulatory Commission (NRC), Nuclear Computerized Library for Assessing Reactor Reliability(NUCLARR), NUREG/CR-4639 EGG-2458, vol. 5, RX, June 1988.
Institute of Nuclear Power Operations (INPO), Nuclear Plant Reliability Data System, 1982 Annual Report, 1983.7 F. Bodi, “Practical Reliability Modeling of Complex Telecommunications Services,” 15
th International
Telecommunications Energy Conference, September 1993.
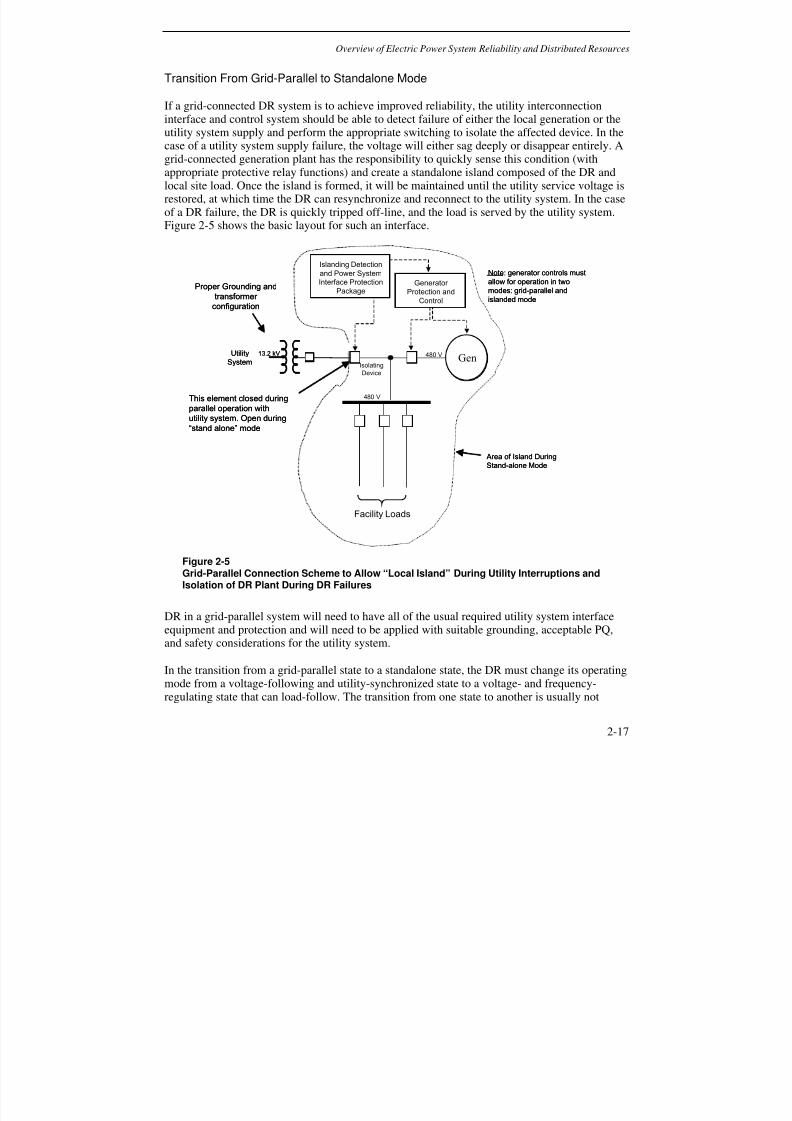
8/12/2019 Power Quality Impacts DG
http://slidepdf.com/reader/full/power-quality-impacts-dg 43/108
Overview of Electric Power System Reliability and Distributed Resources
2-17
Transition From Grid-Parallel to Standalone Mode
If a grid-connected DR system is to achieve improved reliability, the utility interconnectioninterface and control system should be able to detect failure of either the local generation or theutility system supply and perform the appropriate switching to isolate the affected device. In the
case of a utility system supply failure, the voltage will either sag deeply or disappear entirely. Agrid-connected generation plant has the responsibility to quickly sense this condition (withappropriate protective relay functions) and create a standalone island composed of the DR andlocal site load. Once the island is formed, it will be maintained until the utility service voltage isrestored, at which time the DR can resynchronize and reconnect to the utility system. In the caseof a DR failure, the DR is quickly tripped off-line, and the load is served by the utility system.Figure 2-5 shows the basic layout for such an interface.
Facility Loads
Gen
Generator
Protection and
Control
13.2 kV 480 V
480 V
Isolating
Device
Area of Island DuringStand-alone Mode
Utility
System
This element closed during
parallel operation with
utility system. Open during
“stand alone” mode
Note: generator controls must
allow for operation in two
modes: grid-parallel and
islanded mode
Islanding Detection
and Power System
Interface Protection
PackageProper Grounding and
transformer
configuration
Facility Loads
GenGen
Generator
Protection and
Control
13.2 kV 480 V
480 V
Isolating
Device
Area of Island DuringStand-alone Mode
Utility
System
This element closed during
parallel operation with
utility system. Open during
“stand alone” mode
Note: generator controls must
allow for operation in two
modes: grid-parallel and
islanded mode
Islanding Detection
and Power System
Interface Protection
PackageProper Grounding and
transformer
configuration
Figure 2-5Grid-Parallel Connection Scheme to Allow “Local Island” During Utility Interruptions andIsolation of DR Plant During DR Failures
DR in a grid-parallel system will need to have all of the usual required utility system interfaceequipment and protection and will need to be applied with suitable grounding, acceptable PQ,and safety considerations for the utility system.
In the transition from a grid-parallel state to a standalone state, the DR must change its operatingmode from a voltage-following and utility-synchronized state to a voltage- and frequency-regulating state that can load-follow. The transition from one state to another is usually not

8/12/2019 Power Quality Impacts DG
http://slidepdf.com/reader/full/power-quality-impacts-dg 44/108
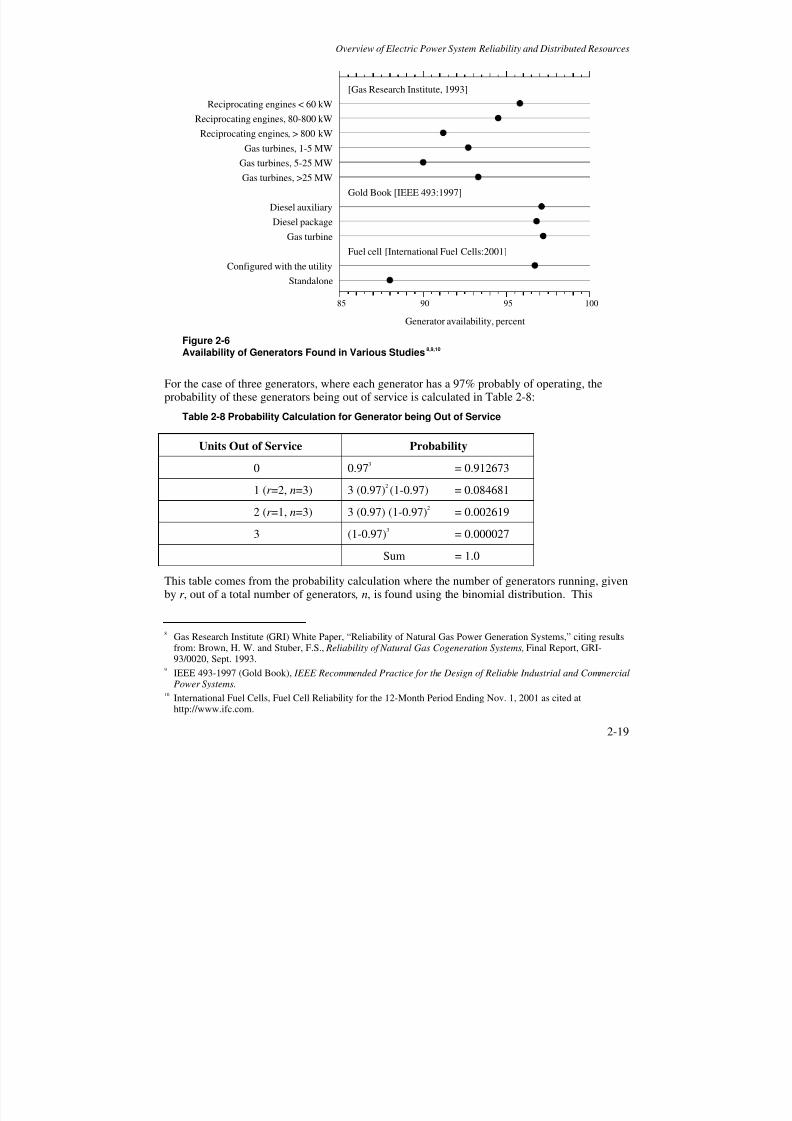
8/12/2019 Power Quality Impacts DG
http://slidepdf.com/reader/full/power-quality-impacts-dg 45/108
Overview of Electric Power System Reliability and Distributed Resources
2-19
85 90 95 100
Reciprocating engines < 60 kW
Reciprocating engines, 80-800 kW
Reciprocating engines, > 800 kW
Gas turbines, 1-5 MWGas turbines, 5-25 MW
Gas turbines, >25 MW
Diesel auxiliary
Diesel package
Gas turbine
Configured with the utility
Standalone
[Gas Research Institute, 1993]
Gold Book [IEEE 493:1997]
Fuel cell [International Fuel Cells:2001]
Generator availability, percent
Figure 2-6Availability of Generators Found in Various Studies 8,9,10
For the case of three generators, where each generator has a 97% probably of operating, theprobability of these generators being out of service is calculated in Table 2-8:
Table 2-8 Probability Calculation for Generator being Out of Service
Units Out of Service Probability
0 0.973 = 0.912673
1 (r =2, n=3) 3 (0.97)2(1-0.97) = 0.084681
2 (r =1, n=3) 3 (0.97) (1-0.97)2 = 0.002619
3 (1-0.97)3 = 0.000027
Sum = 1.0
This table comes from the probability calculation where the number of generators running, givenby r , out of a total number of generators , n, is found using the binomial distribution. This
8 Gas Research Institute (GRI) White Paper, “Reliability of Natural Gas Power Generation Systems,” citing results
from: Brown, H. W. and Stuber, F.S., Reliability of Natural Gas Cogeneration Systems, Final Report, GRI-93/0020, Sept. 1993.
9 IEEE 493-1997 (Gold Book), IEEE Recommended Practice for the Design of Reliable Industrial and Commercial
Power Systems. 10
International Fuel Cells, Fuel Cell Reliability for the 12-Month Period Ending Nov. 1, 2001 as cited athttp://www.ifc.com.
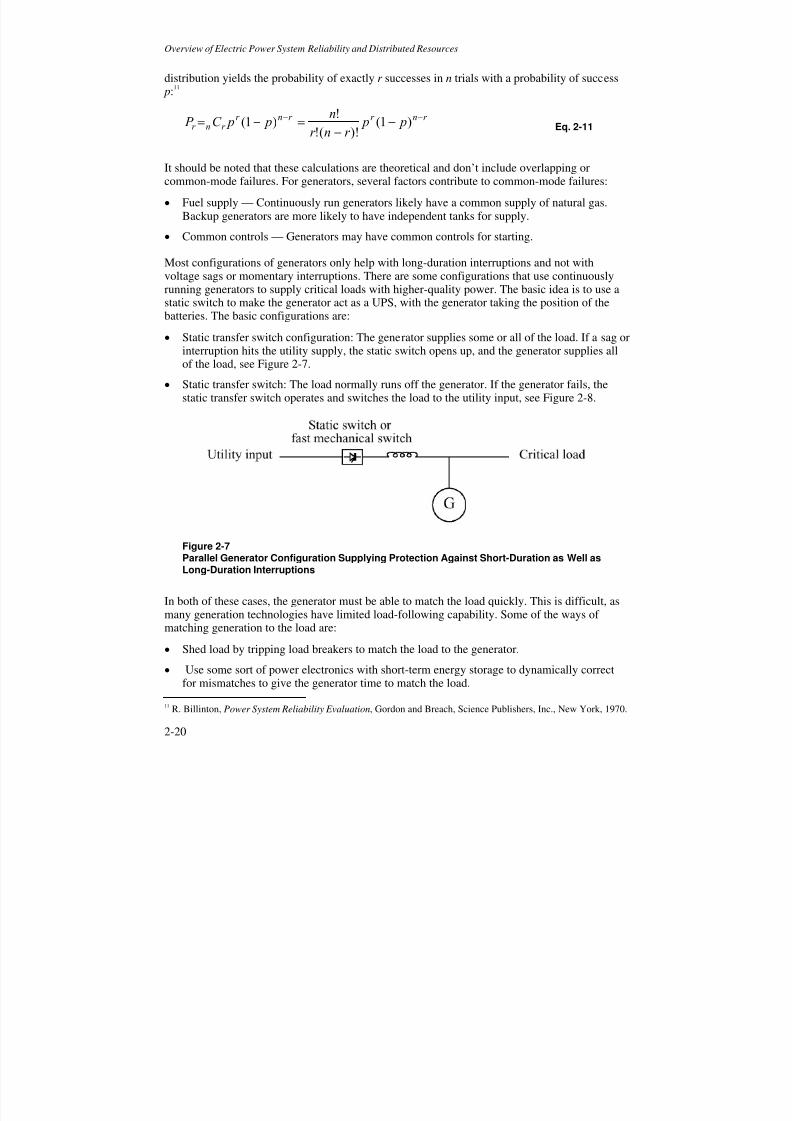
8/12/2019 Power Quality Impacts DG
http://slidepdf.com/reader/full/power-quality-impacts-dg 46/108
Overview of Electric Power System Reliability and Distributed Resources
2-20
distribution yields the probability of exactly r successes in n trials with a probability of success p:
11
r nr r nr r nr p p
r nr
n p pC P −− −
−=−= )1(
)!(!
!)1( Eq. 2-11
It should be noted that these calculations are theoretical and don’t include overlapping orcommon-mode failures. For generators, several factors contribute to common-mode failures:
• Fuel supply — Continuously run generators likely have a common supply of natural gas.Backup generators are more likely to have independent tanks for supply.
• Common controls — Generators may have common controls for starting.
Most configurations of generators only help with long-duration interruptions and not withvoltage sags or momentary interruptions. There are some configurations that use continuouslyrunning generators to supply critical loads with higher-quality power. The basic idea is to use a
static switch to make the generator act as a UPS, with the generator taking the position of thebatteries. The basic configurations are:
• Static transfer switch configuration: The generator supplies some or all of the load. If a sag orinterruption hits the utility supply, the static switch opens up, and the generator supplies allof the load, see Figure 2-7.
• Static transfer switch: The load normally runs off the generator. If the generator fails, thestatic transfer switch operates and switches the load to the utility input, see Figure 2-8.
Figure 2-7Parallel Generator Configuration Supplying Protection Against Short-Duration as Well asLong-Duration Interruptions
In both of these cases, the generator must be able to match the load quickly. This is difficult, asmany generation technologies have limited load-following capability. Some of the ways ofmatching generation to the load are:
• Shed load by tripping load breakers to match the load to the generator.
• Use some sort of power electronics with short-term energy storage to dynamically correctfor mismatches to give the generator time to match the load.
11 R. Billinton, Power System Reliability Evaluation, Gordon and Breach, Science Publishers, Inc., New York, 1970.
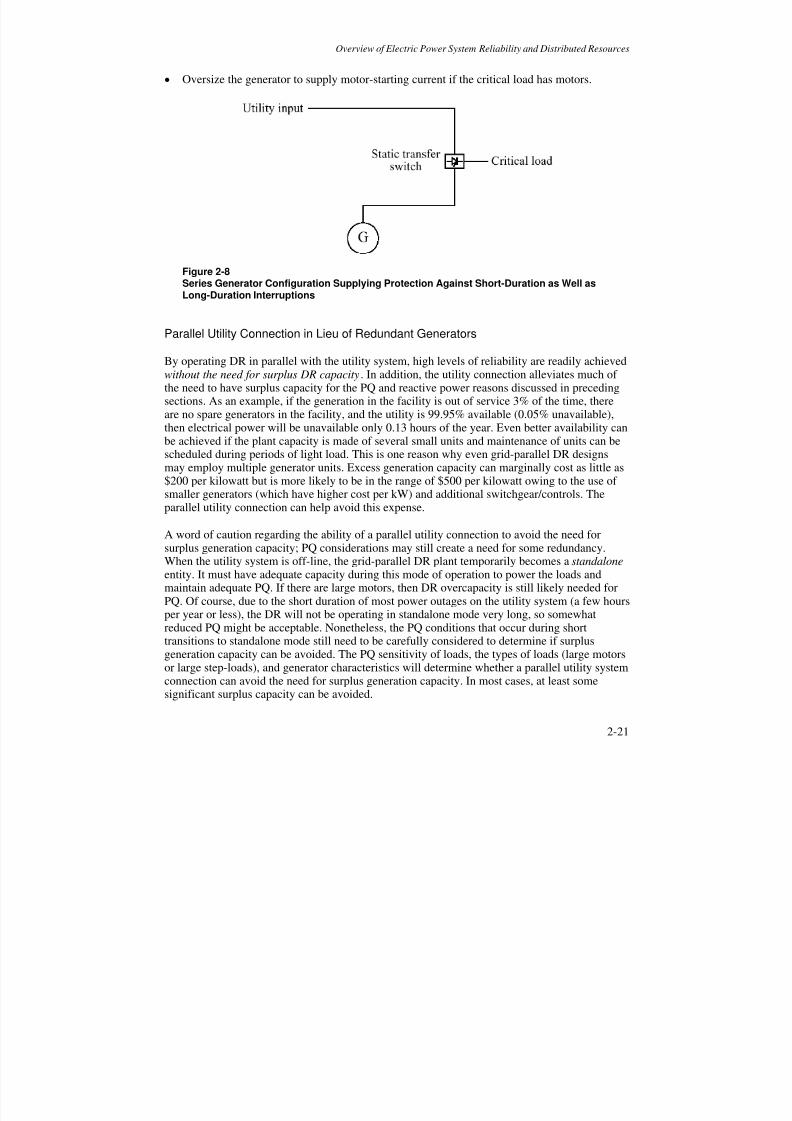
8/12/2019 Power Quality Impacts DG
http://slidepdf.com/reader/full/power-quality-impacts-dg 47/108
Overview of Electric Power System Reliability and Distributed Resources
2-21
• Oversize the generator to supply motor-starting current if the critical load has motors.
Figure 2-8Series Generator Configuration Supplying Protection Against Short-Duration as Well asLong-Duration Interruptions
Parallel Utility Connection in Lieu of Redundant Generators
By operating DR in parallel with the utility system, high levels of reliability are readily achievedwithout the need for surplus DR capacity. In addition, the utility connection alleviates much ofthe need to have surplus capacity for the PQ and reactive power reasons discussed in precedingsections. As an example, if the generation in the facility is out of service 3% of the time, thereare no spare generators in the facility, and the utility is 99.95% available (0.05% unavailable),then electrical power will be unavailable only 0.13 hours of the year. Even better availability canbe achieved if the plant capacity is made of several small units and maintenance of units can be
scheduled during periods of light load. This is one reason why even grid-parallel DR designsmay employ multiple generator units. Excess generation capacity can marginally cost as little as$200 per kilowatt but is more likely to be in the range of $500 per kilowatt owing to the use ofsmaller generators (which have higher cost per kW) and additional switchgear/controls. Theparallel utility connection can help avoid this expense.
A word of caution regarding the ability of a parallel utility connection to avoid the need forsurplus generation capacity; PQ considerations may still create a need for some redundancy.When the utility system is off-line, the grid-parallel DR plant temporarily becomes a standalone entity. It must have adequate capacity during this mode of operation to power the loads andmaintain adequate PQ. If there are large motors, then DR overcapacity is still likely needed for
PQ. Of course, due to the short duration of most power outages on the utility system (a few hoursper year or less), the DR will not be operating in standalone mode very long, so somewhatreduced PQ might be acceptable. Nonetheless, the PQ conditions that occur during shorttransitions to standalone mode still need to be carefully considered to determine if surplusgeneration capacity can be avoided. The PQ sensitivity of loads, the types of loads (large motorsor large step-loads), and generator characteristics will determine whether a parallel utility systemconnection can avoid the need for surplus generation capacity. In most cases, at least somesignificant surplus capacity can be avoided.
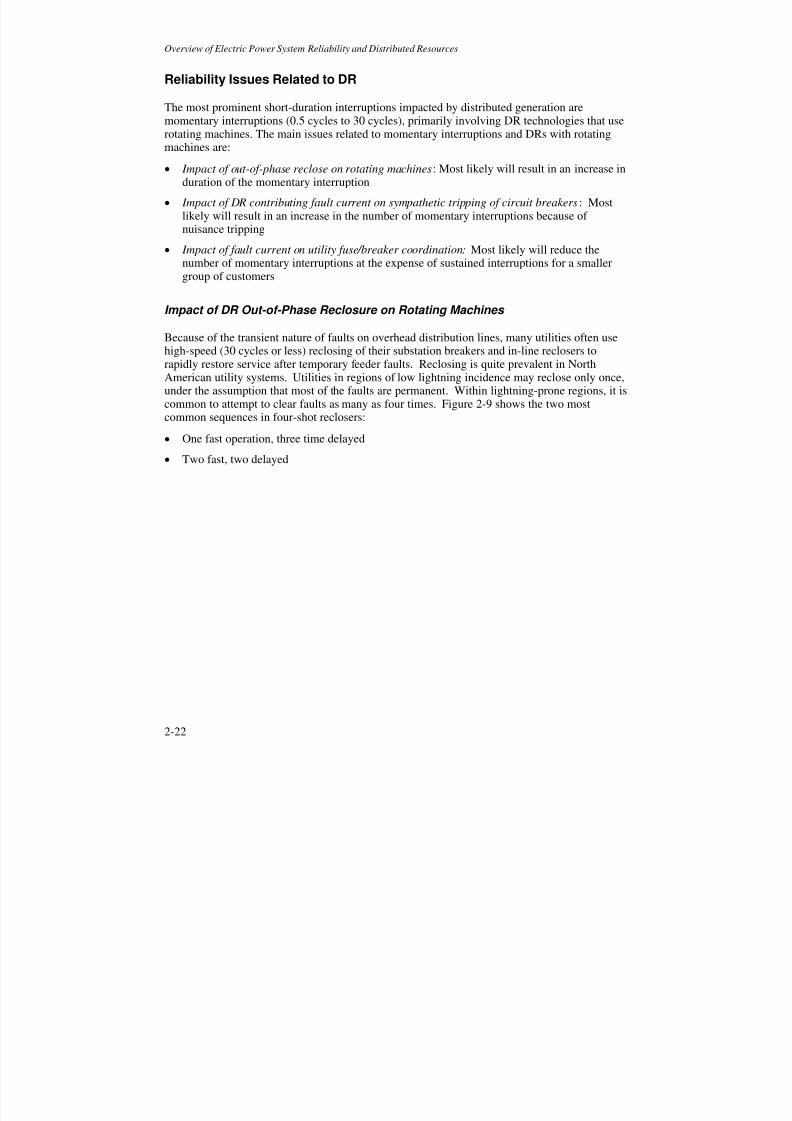
8/12/2019 Power Quality Impacts DG
http://slidepdf.com/reader/full/power-quality-impacts-dg 48/108
Overview of Electric Power System Reliability and Distributed Resources
2-22
Reliability Issues Related to DR
The most prominent short-duration interruptions impacted by distributed generation aremomentary interruptions (0.5 cycles to 30 cycles), primarily involving DR technologies that userotating machines. The main issues related to momentary interruptions and DRs with rotating
machines are:• Impact of out-of-phase reclose on rotating machines: Most likely will result in an increase in
duration of the momentary interruption
• Impact of DR contributing fault current on sympathetic tripping of circuit breakers: Mostlikely will result in an increase in the number of momentary interruptions because ofnuisance tripping
• Impact of fault current on utility fuse/breaker coordination: Most likely will reduce thenumber of momentary interruptions at the expense of sustained interruptions for a smallergroup of customers
Impact of DR Out-of-Phase Reclosure on Rotating Machines
Because of the transient nature of faults on overhead distribution lines, many utilities often usehigh-speed (30 cycles or less) reclosing of their substation breakers and in-line reclosers torapidly restore service after temporary feeder faults. Reclosing is quite prevalent in NorthAmerican utility systems. Utilities in regions of low lightning incidence may reclose only once,under the assumption that most of the faults are permanent. Within lightning-prone regions, it iscommon to attempt to clear faults as many as four times. Figure 2-9 shows the two mostcommon sequences in four-shot reclosers:
• One fast operation, three time delayed
• Two fast, two delayed
8/12/2019 Power Quality Impacts DG
http://slidepdf.com/reader/full/power-quality-impacts-dg 49/108
Overview of Electric Power System Reliability and Distributed Resources
2-23
Figure 2-9Sample Reclosing Sequence for Line Reclosers and Substation Breakers
The impact of instantaneous trip or fast reclose on DRs using rotating machines is similar to theissue of a motor reclosing out of phase, an issue which has been thoroughly explored in the past.The main concern for motors is that indiscriminate reclosing can produce inrush currents inexcess of normal locked rotor current and may also result in damaging torque transients that in
extreme cases can exceed the mechanical design limit of the machine and cause severemechanical damage.
The same concern exists for DRs using synchronous or induction generators that are downstreamof a recloser or a breaker with instantaneous trip enabled. When the power is restored after asuccessful fault clearing with the instantaneous trip, the utility system voltage and the generatorvoltage maybe out of phase, resulting in transient forces and torques which may be well beyondthe mechanical capabilities of the rotating machine. The generator shaft and stator end-turns aretypically the most vulnerable to damage due to the excessive torques and magnetic forces thatcan occur during an out-of-phase switching. Although experience shows that catastrophicdamage is not very common, nevertheless, it is essential for designers and operators of DR toknow the risks involved in fast reclosing.
In order to minimize the chances of this potentially damaging consequence, some utilitiesincrease the time delay to as much as 5 seconds on feeders with DR. The PQ impact of this willobviously be detrimental, resulting, for example, in clocks that have to be reset. Other end-useloads that could ride through an instantaneous operation could also be affected by such anincrease in time delay on feeders. Generally, at least a 1- to 2-second delay is recommended inthe absence of any specific information regarding the characteristic of the DR. Another solution
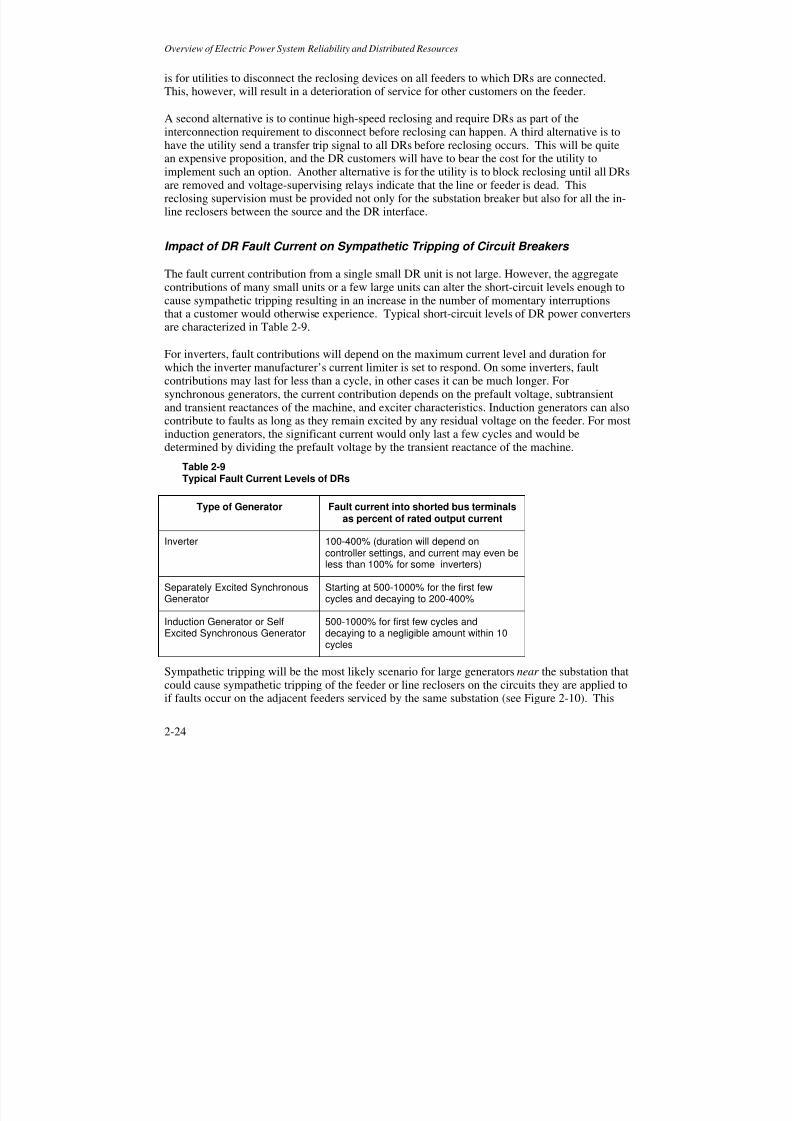
8/12/2019 Power Quality Impacts DG
http://slidepdf.com/reader/full/power-quality-impacts-dg 50/108
Overview of Electric Power System Reliability and Distributed Resources
2-24
is for utilities to disconnect the reclosing devices on all feeders to which DRs are connected.This, however, will result in a deterioration of service for other customers on the feeder.
A second alternative is to continue high-speed reclosing and require DRs as part of theinterconnection requirement to disconnect before reclosing can happen. A third alternative is to
have the utility send a transfer trip signal to all DRs before reclosing occurs. This will be quitean expensive proposition, and the DR customers will have to bear the cost for the utility toimplement such an option. Another alternative is for the utility is to block reclosing until all DRsare removed and voltage-supervising relays indicate that the line or feeder is dead. Thisreclosing supervision must be provided not only for the substation breaker but also for all the in-line reclosers between the source and the DR interface.
Impact of DR Fault Current on Sympathetic Tripping of Circuit Breakers
The fault current contribution from a single small DR unit is not large. However, the aggregatecontributions of many small units or a few large units can alter the short-circuit levels enough to
cause sympathetic tripping resulting in an increase in the number of momentary interruptionsthat a customer would otherwise experience. Typical short-circuit levels of DR power convertersare characterized in Table 2-9.
For inverters, fault contributions will depend on the maximum current level and duration forwhich the inverter manufacturer’s current limiter is set to respond. On some inverters, faultcontributions may last for less than a cycle, in other cases it can be much longer. Forsynchronous generators, the current contribution depends on the prefault voltage, subtransientand transient reactances of the machine, and exciter characteristics. Induction generators can alsocontribute to faults as long as they remain excited by any residual voltage on the feeder. For mostinduction generators, the significant current would only last a few cycles and would bedetermined by dividing the prefault voltage by the transient reactance of the machine.
Table 2-9Typical Fault Current Levels of DRs
Type of Generator Fault current into shorted bus terminalsas percent of rated output current
Inverter 100-400% (duration will depend oncontroller settings, and current may even beless than 100% for some inverters)
Separately Excited SynchronousGenerator
Starting at 500-1000% for the first fewcycles and decaying to 200-400%
Induction Generator or SelfExcited Synchronous Generator
500-1000% for first few cycles anddecaying to a negligible amount within 10cycles
Sympathetic tripping will be the most likely scenario for large generators near the substation thatcould cause sympathetic tripping of the feeder or line reclosers on the circuits they are applied toif faults occur on the adjacent feeders serviced by the same substation (see Figure 2-10). This
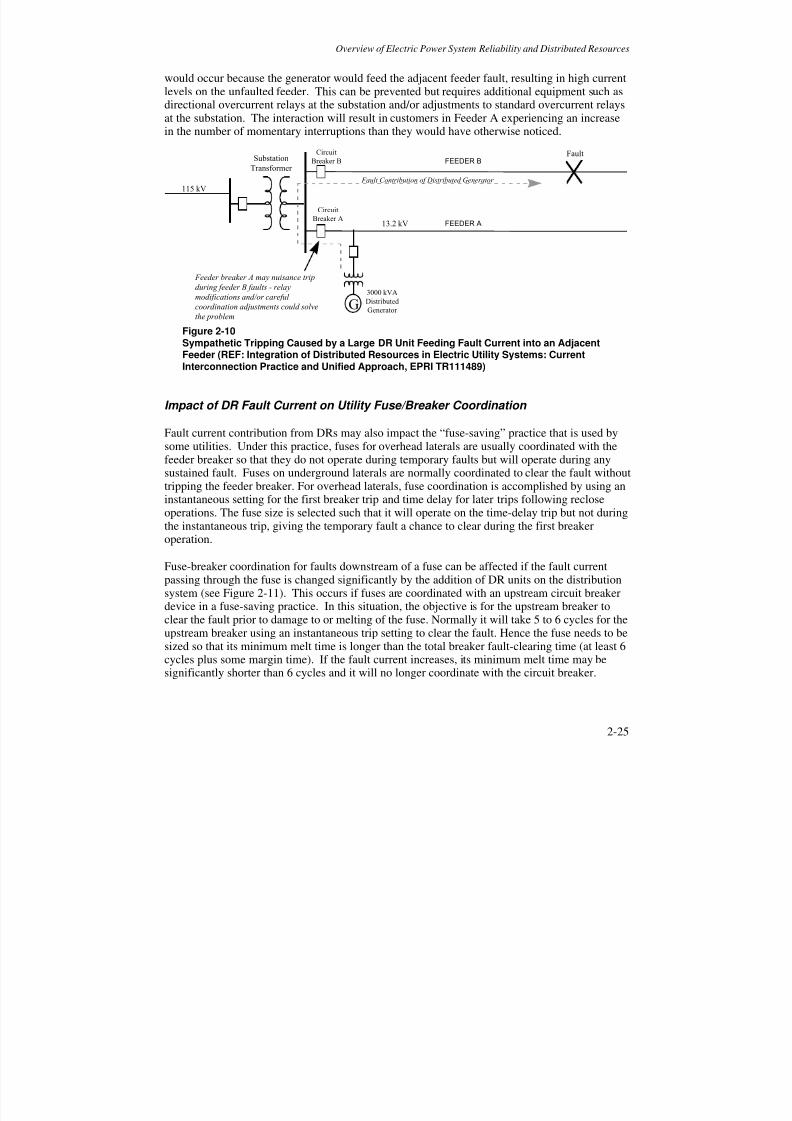
8/12/2019 Power Quality Impacts DG
http://slidepdf.com/reader/full/power-quality-impacts-dg 51/108
Overview of Electric Power System Reliability and Distributed Resources
2-25
would occur because the generator would feed the adjacent feeder fault, resulting in high currentlevels on the unfaulted feeder. This can be prevented but requires additional equipment such asdirectional overcurrent relays at the substation and/or adjustments to standard overcurrent relaysat the substation. The interaction will result in customers in Feeder A experiencing an increasein the number of momentary interruptions than they would have otherwise noticed.
FEEDER B
FEEDER A
Fault
115 kV
Substation
Transformer
CircuitBreaker B
Circuit
Breaker A
3000 kVA
DistributedGenerator
13.2 kV
G
Fault Contribution of Distributed Generator
Feeder breaker A may nuisance trip
during feeder B faults - relay
modifications and/or careful
coordination adjustments could solve
the problem
Figure 2-10Sympathetic Tripping Caused by a Large DR Unit Feeding Fault Current into an AdjacentFeeder (REF: Integration of Distributed Resources in Electric Utility Systems: CurrentInterconnection Practice and Unified Approach, EPRI TR111489)
Impact of DR Fault Current on Utility Fuse/Breaker Coordination
Fault current contribution from DRs may also impact the “fuse-saving” practice that is used bysome utilities. Under this practice, fuses for overhead laterals are usually coordinated with thefeeder breaker so that they do not operate during temporary faults but will operate during anysustained fault. Fuses on underground laterals are normally coordinated to clear the fault withouttripping the feeder breaker. For overhead laterals, fuse coordination is accomplished by using aninstantaneous setting for the first breaker trip and time delay for later trips following recloseoperations. The fuse size is selected such that it will operate on the time-delay trip but not duringthe instantaneous trip, giving the temporary fault a chance to clear during the first breakeroperation.
Fuse-breaker coordination for faults downstream of a fuse can be affected if the fault currentpassing through the fuse is changed significantly by the addition of DR units on the distributionsystem (see Figure 2-11). This occurs if fuses are coordinated with an upstream circuit breaker
device in a fuse-saving practice. In this situation, the objective is for the upstream breaker toclear the fault prior to damage to or melting of the fuse. Normally it will take 5 to 6 cycles for theupstream breaker using an instantaneous trip setting to clear the fault. Hence the fuse needs to besized so that its minimum melt time is longer than the total breaker fault-clearing time (at least 6cycles plus some margin time). If the fault current increases, its minimum melt time may besignificantly shorter than 6 cycles and it will no longer coordinate with the circuit breaker.
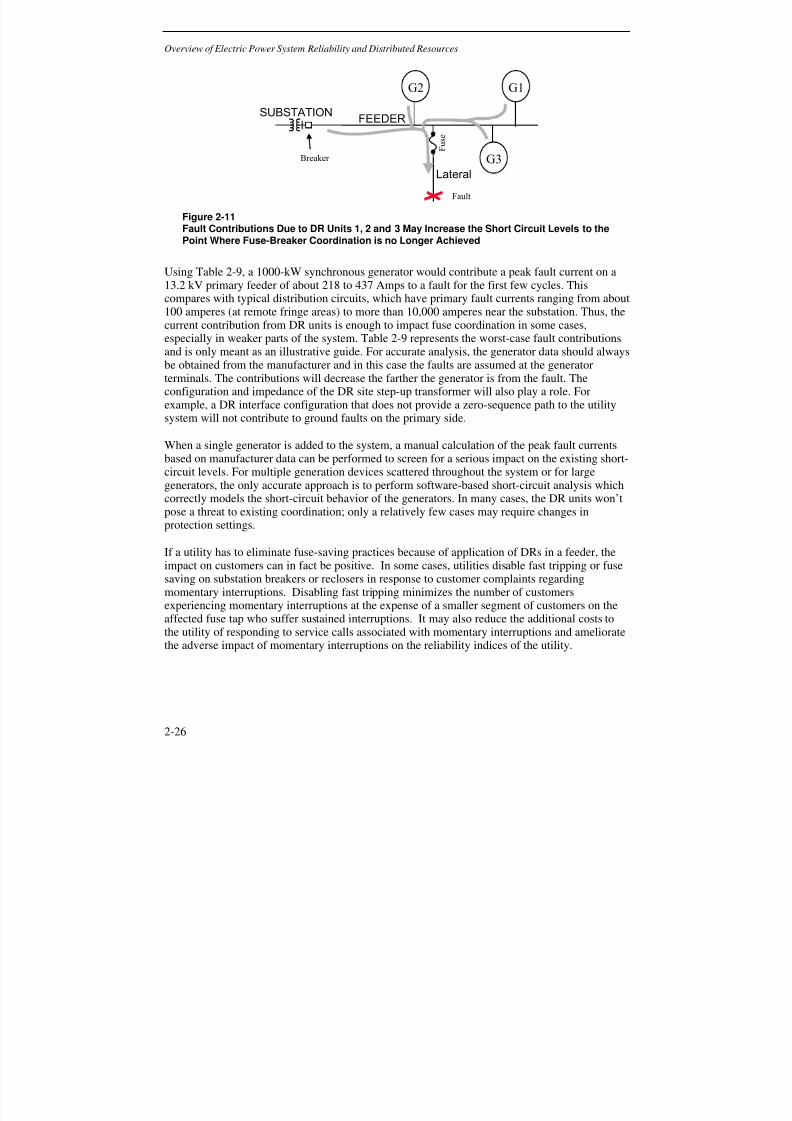
8/12/2019 Power Quality Impacts DG
http://slidepdf.com/reader/full/power-quality-impacts-dg 52/108
Overview of Electric Power System Reliability and Distributed Resources
2-26
G1G2
G3
SUBSTATIONFEEDER
Breaker F u s e
Lateral
Fault
Figure 2-11Fault Contributions Due to DR Units 1, 2 and 3 May Increase the Short Circuit Levels to thePoint Where Fuse-Breaker Coordination is no Longer Achieved
Using Table 2-9, a 1000-kW synchronous generator would contribute a peak fault current on a13.2 kV primary feeder of about 218 to 437 Amps to a fault for the first few cycles. This
compares with typical distribution circuits, which have primary fault currents ranging from about100 amperes (at remote fringe areas) to more than 10,000 amperes near the substation. Thus, thecurrent contribution from DR units is enough to impact fuse coordination in some cases,especially in weaker parts of the system. Table 2-9 represents the worst-case fault contributionsand is only meant as an illustrative guide. For accurate analysis, the generator data should alwaysbe obtained from the manufacturer and in this case the faults are assumed at the generatorterminals. The contributions will decrease the farther the generator is from the fault. Theconfiguration and impedance of the DR site step-up transformer will also play a role. Forexample, a DR interface configuration that does not provide a zero-sequence path to the utilitysystem will not contribute to ground faults on the primary side.
When a single generator is added to the system, a manual calculation of the peak fault currents
based on manufacturer data can be performed to screen for a serious impact on the existing short-circuit levels. For multiple generation devices scattered throughout the system or for largegenerators, the only accurate approach is to perform software-based short-circuit analysis whichcorrectly models the short-circuit behavior of the generators. In many cases, the DR units won’tpose a threat to existing coordination; only a relatively few cases may require changes inprotection settings.
If a utility has to eliminate fuse-saving practices because of application of DRs in a feeder, theimpact on customers can in fact be positive. In some cases, utilities disable fast tripping or fusesaving on substation breakers or reclosers in response to customer complaints regardingmomentary interruptions. Disabling fast tripping minimizes the number of customers
experiencing momentary interruptions at the expense of a smaller segment of customers on theaffected fuse tap who suffer sustained interruptions. It may also reduce the additional costs tothe utility of responding to service calls associated with momentary interruptions and amelioratethe adverse impact of momentary interruptions on the reliability indices of the utility.

8/12/2019 Power Quality Impacts DG
http://slidepdf.com/reader/full/power-quality-impacts-dg 53/108
Overview of Electric Power System Reliability and Distributed Resources
2-27
Reliability Summary
Utility Vs On-Site Generation
To obtain the level of reliability enjoyed by the average utility customer using standalonegeneration, the standalone facility must have at least enough surplus capacity at peak load toreplace the largest generator. Two redundant generators may be needed to match the availabilityof the best utility systems.
In a standalone facility, it is normally more economical to have a small redundant unit withseveral small units instead of a large redundant unit to back up a single large unit. This approach,however, cannot be taken to extremes because small units cost more per kilowatt of capacity andrequire additional switchgear. An installation with five generators, four plus a spare, is typical. Ifthe facility is connected to the utility, then better reliability can be obtained without the sparegenerator. The installation cost without a utility connection (five generators) will therefore beapproximately 25% more than the installation cost with a utility connection (four generators).
It is possible to have the best of both worlds by connecting a facility with its own generation tothe utility system. The utility system will then act as a highly reliable redundant generator.During normal operation, local distributed generators can supply the facility’s load. If one ofthese units is out of service for any reason, however, the utility will make up for any powerdeficit. If the utility experiences an outage, the distributed generation and load can temporarilyseparate and continue normal operation. This of course assumes that the interface between thefacility and utility is designed to permit suitable disconnection and reconnection for utilitydisturbances.
Service Entrance- Vs Equipment-Level Solutions
Both utility-side and customer-side solutions are possible for many end users; each approach hasadvantages. Utility-side solutions tend to have the following characteristics:
• Take advantage of the economy of larger scale
• Cover the whole facility without need to fully understand and segregate loads.
• Do not take up space within the facility.
Customer-side solutions tend to have different characteristics:
• Pinpoint only devices that are sensitive (and important) require protection.
• Are scalable from individual devices (watts) to megawatts.
• Require knowledge of the specific process and local expertise for success.
• Can be applied right at the load and thereby address disturbances caused within the facility.
It should be noted here that, even if a utility supplies perfect power (100% availability); localprotection right at the load may be needed. The most common internal problem is voltage sags

8/12/2019 Power Quality Impacts DG
http://slidepdf.com/reader/full/power-quality-impacts-dg 54/108
Overview of Electric Power System Reliability and Distributed Resources
2-28
caused by faults in the facility, but other PQ disturbances such as motor-starting voltage sags,harmonics, or noise could necessitate local power-conditioning and ride-through. Anothercustomer-side solution that is often overlooked is changes or add-ons to devices to give themmore ride-through capability.
8/12/2019 Power Quality Impacts DG
http://slidepdf.com/reader/full/power-quality-impacts-dg 55/108
3-1
3OVERVIEW OF ELECTRIC POWER QUALITY AND
DISTRIBUTED RESOURCES
This chapter describes the various PQ attributes that are important to performance of end-useequipment or systems. These are described in terms of voltage and frequency variations. Thevariations may be either event phenomena, with a defined duration, or continuous phenomena,designated at steady state. Installing DR in a power system has three possible outcomes withrespect to power-quality attributes, that is, to either improve, detract, or not effect. For each ofthe PQ attributes the positive and negative aspects of adding DR will be considered.
Power Quality Attributes
The “Recommended Practice on Monitoring Electric Power Quality,” IEEE Std. 1159-1995 isthe standard that defines PQ attributes. The purpose of this standard has been to define theattributes with enough detail so that categories and terms are meaningful, and facilitate bettercommunications and understanding between customers, manufacturers, and utilities. Table 3-1summarizes these PQ attributes of voltage and frequency. These are divided into seven maincategories of electromagnetic phenomena that occur in power systems and given descriptivenames such as impulsive transient or momentary sag. For each phenomena the typical spectralcontent, duration and magnitude are provided.
Table 3-1IEEE Std. 1159-1995 Categories and Typical Characteristics of Power Quality Attributes(Electromagnetic Phenomena in Power Systems)
Categories Typical SpectralContent
Typical Duration Typical VoltageMagnitude
1. TransientsImpulsive
Nanosecond 5 ns rise < 50 nsMicrosecond 1 •s rise 50 ns – 1 msMillisecond 0.1 ms rise > 1 ms
OscillatoryLow frequency < 5 kHz 0.3 – 50 ms 0 – 4 puMedium frequency 5 – 500 kHz 20 •s 0 – 8 puHigh frequency 0.5 – 5 MHz 5 •s 0 – 4 pu
2. Short Duration VariationsInstantaneous
Sag 0.5 – 30 cycles 0.1 – 0.9 puSwell 0.5 – 30 cycles 1.1 – 1.8 pu
Momentary
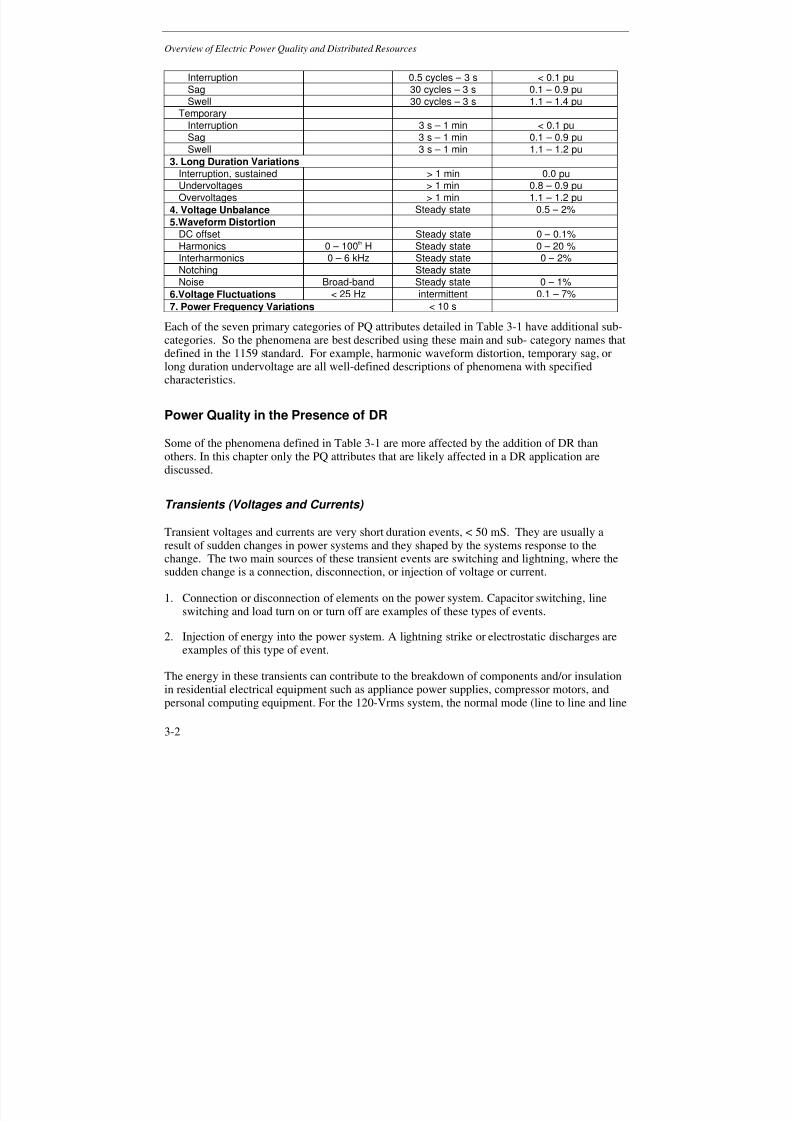
8/12/2019 Power Quality Impacts DG
http://slidepdf.com/reader/full/power-quality-impacts-dg 56/108
Overview of Electric Power Quality and Distributed Resources
3-2
Interruption 0.5 cycles – 3 s < 0.1 puSag 30 cycles – 3 s 0.1 – 0.9 puSwell 30 cycles – 3 s 1.1 – 1.4 pu
TemporaryInterruption 3 s – 1 min < 0.1 puSag 3 s – 1 min 0.1 – 0.9 pu
Swell 3 s – 1 min 1.1 – 1.2 pu3. Long Duration Variations
Interruption, sustained > 1 min 0.0 puUndervoltages > 1 min 0.8 – 0.9 puOvervoltages > 1 min 1.1 – 1.2 pu
4. Voltage Unbalance Steady state 0.5 – 2%
5.Waveform DistortionDC offset Steady state 0 – 0.1%Harmonics 0 – 100th H Steady state 0 – 20 %Interharmonics 0 – 6 kHz Steady state 0 – 2%Notching Steady stateNoise Broad-band Steady state 0 – 1%
6.Voltage Fluctuations < 25 Hz intermittent 0.1 – 7%
7. Power Frequency Variations < 10 s
Each of the seven primary categories of PQ attributes detailed in Table 3-1 have additional sub-categories. So the phenomena are best described using these main and sub- category names thatdefined in the 1159 standard. For example, harmonic waveform distortion, temporary sag, orlong duration undervoltage are all well-defined descriptions of phenomena with specifiedcharacteristics.
Power Quality in the Presence of DR
Some of the phenomena defined in Table 3-1 are more affected by the addition of DR than
others. In this chapter only the PQ attributes that are likely affected in a DR application arediscussed.
Transients (Voltages and Currents)
Transient voltages and currents are very short duration events, < 50 mS. They are usually aresult of sudden changes in power systems and they shaped by the systems response to thechange. The two main sources of these transient events are switching and lightning, where thesudden change is a connection, disconnection, or injection of voltage or current.
1. Connection or disconnection of elements on the power system. Capacitor switching, lineswitching and load turn on or turn off are examples of these types of events.
2. Injection of energy into the power system. A lightning strike or electrostatic discharges areexamples of this type of event.
The energy in these transients can contribute to the breakdown of components and/or insulationin residential electrical equipment such as appliance power supplies, compressor motors, andpersonal computing equipment. For the 120-Vrms system, the normal mode (line to line and line
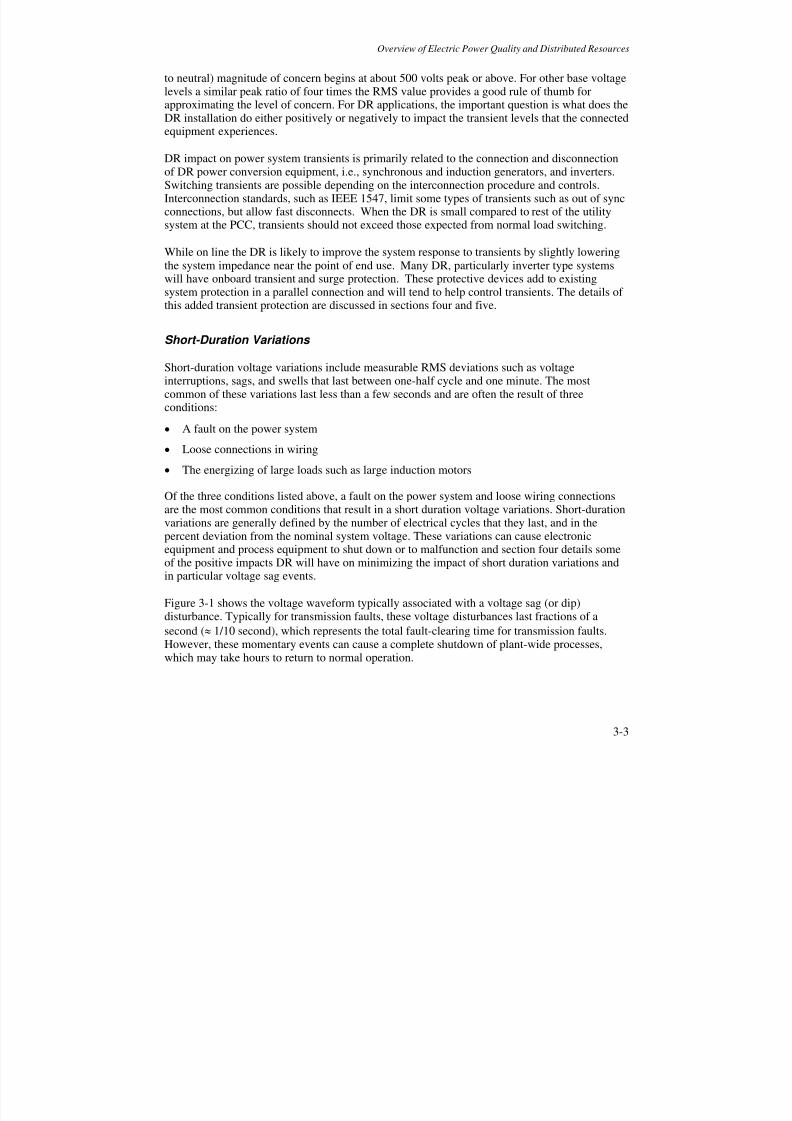
8/12/2019 Power Quality Impacts DG
http://slidepdf.com/reader/full/power-quality-impacts-dg 57/108
Overview of Electric Power Quality and Distributed Resources
3-3
to neutral) magnitude of concern begins at about 500 volts peak or above. For other base voltagelevels a similar peak ratio of four times the RMS value provides a good rule of thumb forapproximating the level of concern. For DR applications, the important question is what does theDR installation do either positively or negatively to impact the transient levels that the connectedequipment experiences.
DR impact on power system transients is primarily related to the connection and disconnectionof DR power conversion equipment, i.e., synchronous and induction generators, and inverters.Switching transients are possible depending on the interconnection procedure and controls.Interconnection standards, such as IEEE 1547, limit some types of transients such as out of syncconnections, but allow fast disconnects. When the DR is small compared to rest of the utilitysystem at the PCC, transients should not exceed those expected from normal load switching.
While on line the DR is likely to improve the system response to transients by slightly loweringthe system impedance near the point of end use. Many DR, particularly inverter type systemswill have onboard transient and surge protection. These protective devices add to existingsystem protection in a parallel connection and will tend to help control transients. The details of
this added transient protection are discussed in sections four and five.
Short-Duration Variations
Short-duration voltage variations include measurable RMS deviations such as voltageinterruptions, sags, and swells that last between one-half cycle and one minute. The mostcommon of these variations last less than a few seconds and are often the result of threeconditions:
• A fault on the power system
•Loose connections in wiring
• The energizing of large loads such as large induction motors
Of the three conditions listed above, a fault on the power system and loose wiring connectionsare the most common conditions that result in a short duration voltage variations. Short-durationvariations are generally defined by the number of electrical cycles that they last, and in thepercent deviation from the nominal system voltage. These variations can cause electronicequipment and process equipment to shut down or to malfunction and section four details someof the positive impacts DR will have on minimizing the impact of short duration variations andin particular voltage sag events.
Figure 3-1 shows the voltage waveform typically associated with a voltage sag (or dip)disturbance. Typically for transmission faults, these voltage disturbances last fractions of a
second (≈ 1/10 second), which represents the total fault-clearing time for transmission faults.However, these momentary events can cause a complete shutdown of plant-wide processes,which may take hours to return to normal operation.
8/12/2019 Power Quality Impacts DG
http://slidepdf.com/reader/full/power-quality-impacts-dg 58/108
Overview of Electric Power Quality and Distributed Resources
3-4
50.0A
25.0A
0.0A
17.0KV
8.5KV
0.0V
12.50 ms/div0sec 250.00ms
RMS Sag DisturbanceModel 7100
09/10/97 18:31:16.22
Three Phase Wye
1V70.0A
0.0A
-70.0A
21.5KV
0.0V
-21.5KV6.67 ms/div0sec 133.33ms
Waveshape DisturbanceModel 7100
09/10/97 18:31:16.22
Three Phase Wye
1V
Figure 3-1Waveform and RMS Voltage During Voltage Sag
Clearly, while the availability of power may have been 100% during a given period, the lack of
quality due to sags during that period may result in significant unreliability and losses to someend-user processes. By installing DR near end use equipment it may be possible to mitigate sagevents. This is most likely the case for DR with overload capability. On the other hand, in thecase were DR is also sensitive to the voltage sag event, and trips offline, this sudden loss ofgeneration is likely to worsen quality by increasing the depth of the sag. Table 3-2 provides arundown of different cases where DR impacts short-term voltage variations either positively ornegatively.
Table 3-2Impact of Distributed Generation on Voltage Sags and Momentary Interruptions
PQ
Category
Description of PQ Issue and Likely Positive or
Negative Impacts of DR
Power Conversion
Systems
Voltage Sag Negative - Starting of induction generators directlyfrom the line will cause voltage drop similar toinduction motor starting
Induction Generator
Voltage Sag Negative - DR will reduce the fault currentcontribution from the utility source and may increasethe duration of the fault clearing and thereforeincrease the sag duration
SynchronousGenerator or InductionGenerator
Voltage Sag Positive - Properly applied DR can provide voltagesupport and reduce the magnitude of voltage sags asseen by the load. Typically energy storage is required.
All, and protectiverelays need to be setto allow voltage sagride through
8/12/2019 Power Quality Impacts DG
http://slidepdf.com/reader/full/power-quality-impacts-dg 59/108
Overview of Electric Power Quality and Distributed Resources
3-5
Table 3-2 (cont.)Impact of Distributed Generation on Voltage Sags and Momentary Interruptions
PQCategory
Description of PQ Issue and Likely Positive orNegative Impacts of DR
Power ConversionSystems
MomentaryInterruption
Negative - Out of phase reclosing can damage theshaft of rotating machines; Utilities may have toincrease their reclosing time to accommodate fordownstream DRs which will result in an increasedduration of momentary interruption
SynchronousGenerator or InductionGenerator
MomentaryInterruption
Negative – DR fault contribution can cause nuisanceoperation of upstream sectionalizers, breakers, orreclosers. This will increase the number ofmomentary interruptions.
IG, SG, and especiallyall with grounded-wyedelta transformerconnections
Temporary overvoltage is another phenomena that can be caused by the presence of DR. InTable 3-3 three scenarios are described where the presence of DR combined with system faultsor the possibility to operate as an island may lead to voltage swells or temporary overvoltages.
Table 3-3Impact of Distributed Generation on Voltage Swells or Temporary Overvoltages
PQCategory
Description of PQ Issue and Likely Positive orNegative Impacts of DR
Power ConversionSystems
VoltageSwell
Negative - Certain transformer connections for DR cancause voltage swells on healthy phases during line-to-ground faults during islanding.
Wye/ungrounded wye,delta/ wye, delta/delta,wye/wye with anungrounded generator
VoltageSwell
Negative - Voltage swells and ferroresonantovervoltages can occur due to resonance between theDR impedance and distribution capacitors duringislanding.
All
VoltageSwell
Negative - Out-of-phase reclosing between the utilitysystem and an islanded DR may cause transientovervoltages.
All
Long-Duration Variations
Long duration variations can be classified as RMS events that last longer than one minute. Thereare two standards that address these events, “The American National Standard for Electric PowerSystems and Equipment Voltage Ratings” (ANSI C84.1), and IEEE Std. 1159-1995. The IEEE1159 has three subcategories for long-duration variations: overvoltages, undervoltages, andsustained interruptions.
In contrast to sags and swells, long-duration voltage variations typically are not caused bysystem faults. The most common causes of long-duration variations are switching operations,

8/12/2019 Power Quality Impacts DG
http://slidepdf.com/reader/full/power-quality-impacts-dg 60/108
Overview of Electric Power Quality and Distributed Resources
3-6
large load variations, power system voltage regulation problems, and improper transformer tapsettings. Depending on the design criteria for the equipment and its tolerances, a ten percentreduction in voltage may be sufficient to cause end use equipment to shut down. This isespecially true if the equipment already is being supplied at a lower than rated voltage due to thewrong transformer taps or voltage drop due to a long cable run. Section five includes adiscussion of the evaluation procedures and consideration for insuring a stable voltage to reducepossible impacts of long-duration variations. Table 3-4 describes both positive and negativeimpacts of DR on voltage regulation.
Table 3-4Impact of Distributed Generation on Steady State and Long Duration Voltage Regulation
PQ Category Description of PQ Issue and Likely Positive or NegativeImpacts of DR
Power ConversionSystems
Steady StateVoltageRegulation
Negative - A DR located just downstream of a voltageregulator can interfere with the line-drop compensation inthe regulator and cause low voltages downstream of the
generator.
All
Long-durationvoltage variations
Negative - A DR can cause a steady state increasedvoltage because the reverse power flow decreases voltagedrop on the circuit.
All
Long-durationvoltage variations
Negative - Improper coordination between a utility voltageregulator and a voltage regulating DR can cause bothregulators to “hunt”.
SynchronousGenerator or Self-CommutatedInverter
Long-durationvoltage variations
Positive - Properly applied distributed generators canimprove the voltage profile along a circuit because of the
voltage boost caused by the injection of real power.
All
Long-durationvoltage variations
Positive - Properly applied distributed generators canimprove regulation if they are operated in a voltage-regulating mode (by varying reactive power).
SynchronousGenerator or Self-CommutatedInverter
Voltage Unbalance
Voltage unbalance is defined as the percent deviation in the RMS value of the highest or lowestphase measured relative to the average RMS of the three-phase voltage. The calculation ofvoltage unbalance uses: (Maximum RMS voltage deviation from the average/average RMS
voltage) * 100. In general, utility supply voltage is maintained at a relatively low level of phaseunbalance since even a low level of unbalance can cause a significant power supply ripple andheating effects on the generation, transmission, and distribution system equipment. Utility supplyvoltages are typically maintained at less than two percent, and one percent is not uncommon.
Voltage unbalance more commonly emerges in individual customer loads due to phase loadunbalances, especially where large, single-phase power loads are used, such as single-phase arcfurnaces. Voltage unbalance of greater than two percent should be reduced, where possible, by

8/12/2019 Power Quality Impacts DG
http://slidepdf.com/reader/full/power-quality-impacts-dg 61/108
Overview of Electric Power Quality and Distributed Resources
3-7
balancing single-phase loads as phase current unbalance is usually the cause. A voltageunbalance can magnify the current unbalance in the stator windings of a motor by as much as 20times, thereby causing substantial heating. Voltage unbalance is treated separately fromunusually low or high voltage conditions that may occur during faults. Sections 4 and 5 of thisdocument provide more information on the sensitivity of end-use equipment to voltageunbalance and a procedure for assessment of possible unbalance problems related to DR. Table3-5 describes typical scenarios where DR may result in negative or positive impacts.
Table 3-5Impact of Distributed Generation on Unbalance
PQCategory
Description of PQ Issue and Likely Positive or NegativeImpacts of DR
Power ConversionSystems
VoltageUnbalance
Negative - Existing feeder voltage unbalance can causemachine connected DR to trip on current unbalance or causerotor heating due to high negative-sequence currents.
SynchronousGenerator or InductionGenerator
CurrentUnbalance Negative - Depending on the winding arrangement of the DRinterconnection transformer, feeder current unbalance will bereflected in the interconnection transformer causing overloadand possibly damage if the transformer is not protected.
grounded-wye/deltaand grounded-wye/grounded-wyetransformer (with thegenerator grounded).
VoltageUnbalance
Positive - In cases where the DR feeds a constant power intoutility distribution feeders, the lower phase voltage will see arelatively higher current and a consequently a tendency toraise the voltage.
SynchronousGenerator or Self-Commutated Inverter
Waveform Distortion
Waveform distortion is defined as a steady-state deviation from an ideal sine wave at the powerfrequency. IEEE Std. 1159-1995 defines five subsets of waveform distortion:
• DC offset
• Harmonics
• Interharmonics
• Notching
• Noise
Of these five distortions, the primary concern related to DR installations is harmonic distortionof the voltage or current. Harmonics are sinusoidal voltages or currents that are integer multiplesof the fundamental frequency of the power system. When harmonic currents flow through theimpedance of the power system, voltage distortion results. Likewise a distorted distributionfeeder voltage will usually cause current distortion in the DR output. Table 3-6 lists the caseswhere DR is likely to cause negative or positive impacts on distortion.

8/12/2019 Power Quality Impacts DG
http://slidepdf.com/reader/full/power-quality-impacts-dg 62/108
Overview of Electric Power Quality and Distributed Resources
3-8
Table 3-6Impact of Distributed Generation on Waveform Distortion
PQCategory
Description of PQ Issue and Likely Positive or NegativeImpacts of DR
PowerConversion
Systems
WaveformDistortion
Negative - Possibility of harmonic resonance at light load due tothe interaction of system reactance with the capacitor requiredfor reactive support for induction generator.
InductionGenerator
WaveformDistortion
Negative - Harmonic current injected by the DR inverter canincrease voltage distortion and cause resonance with utilitypower factor correction capacitors.
Line-CommutatedInverter
WaveformDistortion
Negative - High switching frequency of PQM type inverters cancause resonance (2-3 kHz) with cable fed-system.
Self-CommutatedInverter
WaveformDistortion
Negative - Voltage distortion from rotating generators can causeresonance with utility power factor correction capacitors
Induction orSynchronous
WaveformDistortion
Negative - When disconnected from the grid and supporting anisland with nonlinear loads the higher impedance of the DRsource will likely increase voltage distortion compared to gridconnected.
Synchronous orInductionGenerators
WaveformDistortion
Positive - Properly applied Inverters connected DR can injectcurrents that tend to reduce harmonic voltage distortions.
Self-CommutatedInverter
Voltage Fluctuations (Flicker)
Voltage fluctuations can cause lamps to flicker. Even a one percent voltage variation is capableof producing flicker that is perceptible to the human eye. The sensitivity of humans varies withthe frequency of the fluctuations. Time varying loads such as arc furnaces and welders can causeslow (sub 60Hz) voltage variations. In turn, these fluctuations can cause incandescent lamps to“flicker” or change in their intensity with time. Although these fluctuations typically do notcause any disturbance on the power system, the flickering lamps become quite a nuisance.
Sudden variations of voltage, which are caused by the starting or stopping a DR can also causelight flicker. IC engine generators misfiring or fluttering wind generators will sometimes causeflicker. This flicker will generally be worse near the fluctuating generator or when the generatoris relatively large compared to the electric power system at the point of common coupling. DRrelated flicker will be more pronounced when the fluctuating On distribution systems, long ruralfeeders with a large fluctuating generator near the end would be the most susceptible toflickering lights. Table 3-7 lists some cases where DR will impact voltage fluctuations andflicker.

8/12/2019 Power Quality Impacts DG
http://slidepdf.com/reader/full/power-quality-impacts-dg 63/108
Overview of Electric Power Quality and Distributed Resources
3-9
Table 3-7Impact of Distributed Generation on Flicker
PQCategory
Description of PQ Issue and Likely Positive or NegativeImpacts of DR
Energy Source/Prime Mover
Flicker Negative - Low RPM, low number of cylinder machinesapplications or misfiring engines can cause voltagefluctuation.
Reciprocating Engine
Flicker Negative - Cloud caused irradiance changes could produceflicker.
Photovoltaic
Flicker Negative - Fluctuations in the wind speed, pitching/yawerror in blades, wind shear, and tower shading can produceflicker.
WindTurbine/Generator
Frequency Variations
Frequency variations are variations from the base 60-Hz power frequency. Frequency variationsof the electric power system are extremely rare. Even slight variations could cause damage toelectric power generators and turbine shafts. Frequency variations are more common oncustomer-owned generation running off grid. In the case of off grid generator operation, loadturn on (or step loads) can cause frequency variations while the generator governor attempts tobring the machine back on the speed setting.
When utility frequency variation occurs the connected DR can provide a positive benefit bymomentarily increasing the real power output for a decreasing frequency and decreasing realpower output for an increasing frequency. On the other hand if a decreasing frequency variation
cause the DR to drop off line it will have a negative impact.
Summary of Power Quality Issues Related to Distributed Generation
The previous discussion of PQ attributes and how DR may contribute in either a positive or anegative way is summarized in Table 3-8. This table will be supplemented with the discussion inchapter four regarding the sensitivity of equipment commonly found in commercial andindustrial facilities.
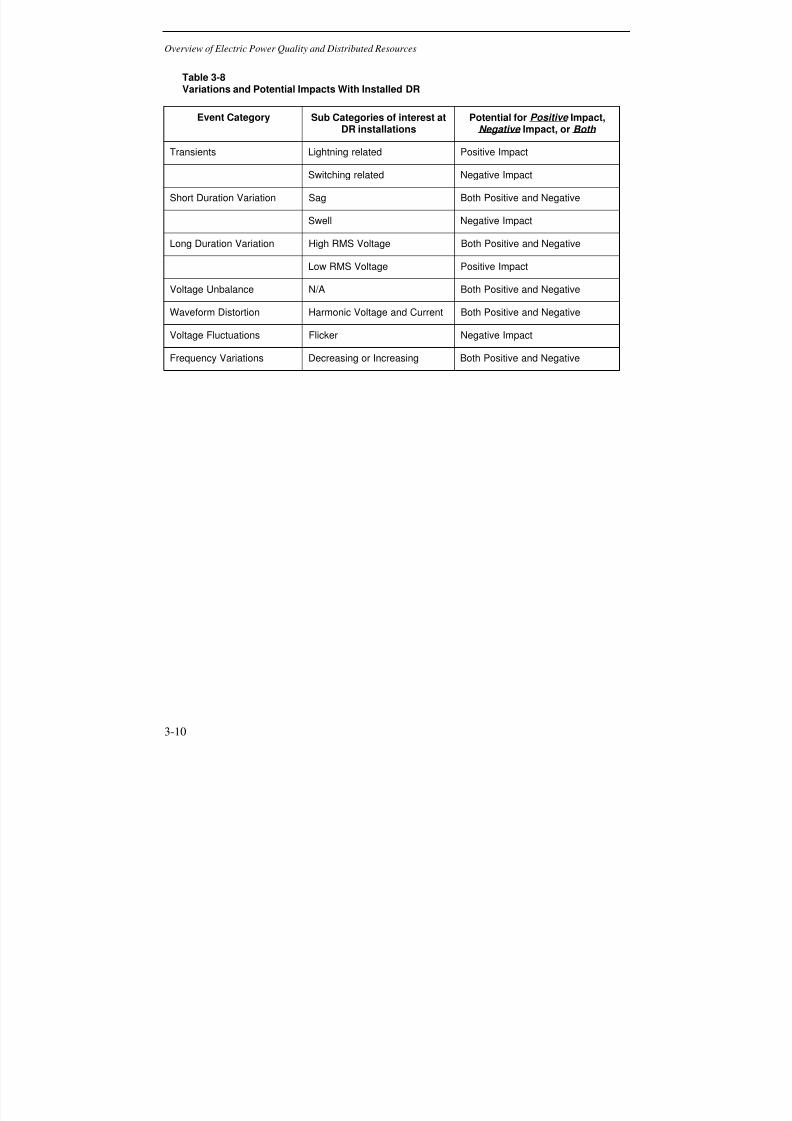
8/12/2019 Power Quality Impacts DG
http://slidepdf.com/reader/full/power-quality-impacts-dg 64/108
Overview of Electric Power Quality and Distributed Resources
3-10
Table 3-8Variations and Potential Impacts With Installed DR
Event Category Sub Categories of interest atDR installations
Potential for Positive Impact,Negative Impact, or Both
Transients Lightning related Positive Impact
Switching related Negative Impact
Short Duration Variation Sag Both Positive and Negative
Swell Negative Impact
Long Duration Variation High RMS Voltage Both Positive and Negative
Low RMS Voltage Positive Impact
Voltage Unbalance N/A Both Positive and Negative
Waveform Distortion Harmonic Voltage and Current Both Positive and Negative
Voltage Fluctuations Flicker Negative Impact
Frequency Variations Decreasing or Increasing Both Positive and Negative
8/12/2019 Power Quality Impacts DG
http://slidepdf.com/reader/full/power-quality-impacts-dg 65/108
4-1
4END-USE EQUIPMENT SUSCEPTIBILITY TO POWER
QUALITY VARIATIONS
To better understand the value of applying DR in ways that will have positive impact on electriccustomer equipment and processes, it is important to understand the existing levels ofsusceptibility of the equipment commonly found in industrial and commercial facilities. Thischapter details the various sensitivity levels of electronic equipment from a PQ perspective.Categories include industrial and commercial power electronics, process control devices, lightingand motor driven loads.
The first step in determining how DR may impact customer loads is to assess the powerconversion and power use requirements of the equipment. For example, a power supply for aprogrammable controller, a motor, and a start/stop relay are examples of three electricallypowered devices that have distinct differences in the way they utilize the voltage and currentsupplied by the power system. Each of these devices can have distinct differences in theirrespective sensitivity to electric power variations. The following paragraphs describe the mostprevalent equipment types found in commercial and industrial facilities and overview the PQsensitivity of these equipment types.
Relays, Starters and Contactors – These devices are typically found in the on/off controlcircuitry for most industrial processes as well as in the controls for HVAC systems, pumps,
blowers and emergency stop circuits. The basic design concept is to energize a wire coil tomagnetically change the state of (open or close) a set of contacts. The contacts act as the switchthat turns off or on the device being controlled. The applied input voltage determines whether ornot the coil will maintain enough magnetizing current to keep the contacts from changing state.Most coils can withstand steady state and momentary input voltage variations of plus/minus 20%of nominal. Depending on the design, these devices can withstand complete interruption inpower for only one or two electrical cycles. For momentary voltage sags, the sensitivity of thesedevices can be distinctly different. Testing at the EPRI Power Quality test facility shows that thesag sensitivity of relays and contactors can range from units that are susceptible if the voltagesags to 85% of the system nominal to units that are only susceptible if the voltage sags below40% of the system nominal.
Information Technology Equipment (ITE) – IT equipment includes personal computers,servers, routers, fax and copy machines, telephone switching equipment, and printers. Thesedevices are prevalent in both industrial and commercial office space. All of the mentioneddevices utilize some variation of the “single-phase” switch mode power supply SMPS for inputpower. The SMPS input has a bridge rectifier and capacitor as the primary power converter toconvert the AC line voltage to DC for power distribution at lower or higher DC levels asrequired. IT equipment is generally will be relatively immune to any line to neutral and line to
8/12/2019 Power Quality Impacts DG
http://slidepdf.com/reader/full/power-quality-impacts-dg 66/108
End-Use Equipment susceptibility to Power Quality Variations
4-2
line transients up to about 1000 volts peak, but may suffer from lockup or trip outs if a peakdetection circuit is used to sense input voltage. SMPS testing performed at the EPRI PEAC test facility indicates that these power supplies can withstand steady state input voltage variations of plus/minus 20% of nominal, can with stand variations of plus/minus 30% of nominal for a fewseconds and can withstand complete interruption in power for one to thirty electrical cycles(depending on the loading condition and the size of the bulk storage capacitors used in thedesign.
Programmable Logic Controllers (PLC’s) – Programmable controllers are found incommercial and industrial process control settings ranging from elevators, to wastewatertreatment, to automobile final assembly. The PLC is an industrial computer with capabilities toread input signals, make decisions based on a stored program and send corresponding signals tooutput devices. The power supply for the PLC is identical to that found in a computer (switchmode power supply), thus the electrical performance or susceptibility is similar. The PLC powersupply will be relatively immune to any line to neutral and line to line transients up to about1000 volts peak, but may suffer from lockup or trip outs if a peak detection circuit is used tosense input voltage. PLC testing performed at the EPRI PEAC test facility indicates that these
power supplies can withstand steady state input voltage variations of plus/minus 20% ofnominal, can withstand variations of plus/minus 30% of nominal for a few seconds and canwithstand complete interruption in power for five to thirty electrical cycles. When evaluatingPLC sag performance, it is important to look at more than just the power supply. Many PLC'smonitor input voltage and will shut down if the voltage peak is reduced more that 20 percentbelow the nameplate specification. All of the devices controlled by the PLC input and outputcards are potentially susceptible to voltage variations and most of them are at least as sensitiveor more sensitive than the PLC power supply.
Lighting – Keeping the lights on is a personnel safety objective as well as a required PQperformance objective. It does no good to improve the PQ immunity of a process if the lights
don’t stay on. Therefore lighting and other process support aspects such as compressed air,heating, cooling, steam etc. are the primary objectives. The susceptibility of the lights to powervariations is very different depending on the type of lighting used. The following discussioncategorizes the lighting by the four most common lighting types and describes the PQsusceptibility of each type of light.
• Incandescent Lighting: These are the most common of all lighting technologies. The bulbfilament heats up and glows to illuminate the immediate area surrounding the bulb. Theluminance of the filament is directly proportional to the voltage applied and even a 2 percentchange in voltage is perceptible. This makes the incandescent lamp extremely sensitive tovoltage flicker. In addition, these lights will prematurely fail if the steady state voltageexceeds 110 percent of the voltage rating of the bulb. Sensitivity to PQ variations are
primarily flicker and overvoltage related. • High Intensity Discharge (HID) Lighting: HID lighting includes both metal halide, as well
as high and low pressure sodium lamps. The HID light is an arc discharge technology wherea current arc is discharged across a gas filled tube very close to the peak voltage of every halfcycle of the AC sinewave. A magnetic ballast controls the current discharge and the arcextinguishes close to the zero crossing of each half cycle. Once the tube is heated up, the arcwill provide full light output but even a one half cycle drop in voltage to less than about 80 percent of the system nominal will cause the lamp to extinguish and a period of three to eight
8/12/2019 Power Quality Impacts DG
http://slidepdf.com/reader/full/power-quality-impacts-dg 67/108
8/12/2019 Power Quality Impacts DG
http://slidepdf.com/reader/full/power-quality-impacts-dg 68/108
End-Use Equipment susceptibility to Power Quality Variations
4-4
motor control circuit and the associated relays and contactors that cause any nuisance trippingproblems. In fact, holding induction motors in for ten to twenty electrical cycles during voltagesags and even during momentary interruptions is a process design objective for many petro-chemical facilities. To summarize the PQ concerns for induction motors, the AC inductionmotors are sensitive to voltage unbalance, single-phasing, and steady state over or undervoltage.
PWM Variable Frequency Drives – Pulse width modulated variable frequency drives comprisethe majority of motor control applications. The basic PWM drive utilizes a three-phase bridgerectifier and capacitor to convert the input AC to a DC value equal to the peak voltage of the ACpower source. The DC is then switched (or pulsed) to control the speed of an AC inductionmotor. Any time precision process control, variable motor speed or increased process efficiencyis desirable, the PWM drive is likely to be found. The power supply for a PWM drive isessentially a three-phase switch mode power supply. There are a number of PQ concerns withPWM drives from both an emissions and an immunity standpoint,. Regarding emissions, thePWM drives generate harmonic currents and high frequency switching transients that in turn,propagate back into the electric power system. Regarding PQ immunity, EPRI PQ test facilityresults indicate that the PWM drive is sensitive to, over and undervoltages as well as to short
duration sags, swells and momentary interruptions. Another common problem for these drives isthat utility capacitor switching can cause nuisance tripping of the drive due to DC busovervoltage conditions. There are differences in sensitivity levels dependent upon themanufacturer and the programmed setting of the drive. In addition the drive control circuit cansometimes be the weak link that causes process stoppage. To summarize the PQ concerns for ACvariable frequency drives, they are sensitive to virtually all PQ variation when the voltage goesoutside a plus/minus twenty percent window outside the drives nominal nameplate voltagerating. In addition, AC drives can generate transient noise and harmonic currents that propagate back into the power system.
DC drives – DC motor drives are used in a variety of commercial and industrial applications
ranging from rolling mills to printing presses to elevators. The primary considerations for usingDC drives center around those applications where there is a need for either high torque orprecision speed control. In addition, with many “mature” processes, the designers and systemintegrators are much more comfortable and familiar with the use of DC motors and theirattractive “first costs of implementation.” In terms of PQ performance, the DC drive presents aunique set of challenges that makes the technology one of the most difficult to protect againstelectrical variations. The most common version of the DC drive uses a silicon controlled rectifier(SCR) converter type input power supply and a DC field winding power supply. Both of thesesources must be able to ride-through electrical disturbances during normal operation as well asduring regenerative operation. In addition, many DC drives use a second SCR package to dumpenergy back into the power system in order to quickly slow down, or perform what is commonlyreferred to as “regenerative braking.” Overall, each of the PQ concerns described for the ACvariable frequency drive are also the same for the DC drive. The notable difference would be thatthe DC drive is usually a little more sensitive than a similarly sized AC drive. To summarize thePQ concerns for DC drives, they are sensitive to virtually all PQ variations when the voltagegoes outside a plus/minus ten percent window outside the drives nominal nameplate voltagerating. In addition, DC drives can generate transient noise and harmonic currents that propagate back into the power system.
8/12/2019 Power Quality Impacts DG
http://slidepdf.com/reader/full/power-quality-impacts-dg 69/108
End-Use Equipment susceptibility to Power Quality Variations
4-5
Sensor Control Units – Sensor control units are the power sources and watchdog or monitoringcircuits for various process parameters such as gas flow sensors, flame detectors, pressuretransducers, optical sensors and so on. The control unit usually supplies the power to the sensors,thus the PQ concerns are usually related to the control unit susceptibility to voltage variations. Most of these control units are immune to steady state PQ variations of plus/minus 20 percentand are immune to voltage sags and swells of plus/minus 30 percent of the nominal nameplatevoltage. Some units can withstand greater variations, but EPRI PQ test facility characterizationsindicate that the sensitivity thresholds vary with different manufacturers.
Resistance Heating and Drying – Many processes contain resistance heaters or dryers as acomponent of the process. Examples include laser printers, copiers, aluminum melting and so on.There are usually not to many immunity PQ concerns with the resistance process, but the controlcircuitry may contain relays and contactors that have extreme sensitivity to sags and momentaryinterruptions. Overall the resistance elements are not in need of power conditioning thus themajor challenge is separating this typically large portion of the electrical load from the moresensitive portions of the process. Occasionally when more precise temperature control isrequired, the heating components will be controlled by silicon controlled rectifiers or other semi
conductor control devices. When these control devices are used, harmonic emissions back intothe power system can become a concern.
Equipment Susceptibility Test Results
The previous section provided a brief summary of EPRI sponsored equipment testingaccomplished over the past ten years. These test projects are commonly referred to as “SystemCompatibility Research Testing” and EPRI has a substantial database of information on howdiffering types of equipment is affected by voltage variations. There are well over 500 individualdevice test results in more than twenty different equipment categories. The results of these testsprovide a useful means of comparing the different devices and their sensitivities to PQ variationsand enable a ranking that can be used as a checklist to determine how sensitive a given facilitywill be to PQ variations – based on the types of equipment and processes found in the facility.The following table summarizes the results of the equipment testing performed at the EPRIPEAC PQ test facility or by EPRI PEAC staff in some facility PQ site audits.

8/12/2019 Power Quality Impacts DG
http://slidepdf.com/reader/full/power-quality-impacts-dg 70/108
End-Use Equipment susceptibility to Power Quality Variations
4-6
Table 4-1Typical Equipment and Indication of Sensitivity to Various Disturbance Types
Equipment Category
Transients
Capacitor
Switching
Transients
Lightning
Related
Transients
Load
Switching
Sags
Duration
< 3Seconds
Swells
Duration
< 3Seconds
Interruption
Duration < 3
Seconds
Sags and
Undervoltage
Duration > 3Seconds
Swells and
0vervoltage
Duration >3seconds
Inter
Dura
sec
AC PWM Adjustable Speed Drive 2 1 0 2 1 2 2 2
DC Adjustable Speed Drive 0 1 0 2 1 2 2 2
CNC Machine 2 1 1 2 1 2 2 2
Personal Computers PC's 1 1 0 1 1 2 2 0
Programmable Logic Controllers 1 1 0 1 1 2 2 0
AC Relays (ice cube) 0 1 0 1 1 2 2 0
AC Contactors (master control) 0 1 0 1 1 2 2 0
Motor Starters (NEMA size 00 to 5) 0 1 0 1 1 2 2 0
DC Contactors 0 1 0 1 1 2 2 0
Fax Machine 0 1 0 0 0 0 2 0
Metal Halide Lighting 0 1 1 1 1 2 2 0
High Pressure Sodium Lighting 0 1 0 1 1 2 2 0
Telecom Switching Equipment 0 1 0 1 1 2 2 0 Electronic Ballast Fluorescent Lamp 0 1 1 0 0 0 0 0
Magnetic Ballast Fluorescent Lamp 0 1 0 0 0 0 0 0
AC Induction Motor 0 1 0 1 1 2 2 0
Air Compressors 0 1 0 1 1 2 2 0
Chillers 0 1 0 1 1 2 2 0
HVAC Systems 0 1 0 1 1 2 2 0
Resistance Heating and Drying 0 1 0 0 0 0 0 0
Sensor Controllers 0 1 0 1 0 2 2 0
Incandescent Lighting 0 1 0 0 1 0 0 0
0 - Indicates little or no sensitivity
1 - Indicates that some models will be sensitive
2 - Indicates majority of models will be sensitive
3 - Indicates the device generates the event

8/12/2019 Power Quality Impacts DG
http://slidepdf.com/reader/full/power-quality-impacts-dg 71/108
End-Use Equipment susceptibility to Power Quality Variations
4-7
Positive and Negative PQ Impacts of Installed DR
Installation of distributed generation has the potential to impact the sensitivity of customer loadequipment in both positive and negative ways. Previous EPRI reports have discussed primarily
the negative impacts of DR when proper considerations are not made prior to and during the DRinstallation. In this section we overview the both the positive and the negative impacts. To followthis up, section five of this report will describe procedures and methodologies that can be usedduring the application of DR to improve overall equipment performance in the presence of PQvariations.
Transients – Based on the information shown in Table 4-1, it is clear that transients and inparticular lightning related surge events are a concern for nearly every category of commercialand industrial equipment. In fact, the DR device itself should be concerned about possibledamage due to lightning related surge events. The installation of DR will not do anything toincrease the likelihood of these events occurring at a facility, however since the interconnectionhardware is typically designed with some type of transient mitigation or surge protection built in,the connected loads will benefit from this inherent surge protection as well. In the case oflightning related transients propagating into the facility on the power conductors, installation ofDR can have a positive impact on the load equipment. For capacitor switching and loadswitching transients, the installed DR will not have either a positive or a negative impact
Short Duration Variations – Table 4-1 indicates that short duration variations such as voltagesags and momentary interruptions are detrimental to the performance of most customer loadequipment. Overall, the installation of DR is not expected to resolve problems with shortduration PQ events, however there could be a 10 to 20 percent improvement in voltage sagmitigation if a properly sized DR device is installed. More detail on how this improvement maybe accomplished is supplied in Chapter 5. As far as voltage swells and momentary interruptions,
if the DR is installed properly with attention to proper grounding methods, the DR will haveminimal impact either positively or negatively on these variations.
Long Duration Variations – For long duration variations such as steady state low and highvoltage, installed DR can potentially have positive or negative impacts depending upon thespecific feeder type, the electrical installation configuration and whether or not steady statevoltage regulation was an objective of the engineering analysis for the installation. The priordiscussions on equipment susceptibility clearly indicate that equipment operated at a level veryclose to the nominal nameplate rating is less susceptible to PQ variations. In fact, installing DRin a manner that provides the facility with steady state voltage at or close to the equipmentnameplate voltage is an excellent way to gain added PQ value from a DR installation project.
More detail on how this improvement may be accomplished is supplied in Chapter 5.
Voltage Unbalance – Table 4-1 indicates that most three-phase motor controlled devices arehighly sensitive to voltage unbalance, in fact more than a one percent unbalance on a three phasesystem warrants de-rating of any type of motor driven system and a five percent unbalancerequires some type of remedial action before the motor can be operated. Installed DR may beable to remedy some load induced voltage unbalance and there are some unique configurationoptions to support critical load with DR that could be beneficial. Any unbalance of the utility
8/12/2019 Power Quality Impacts DG
http://slidepdf.com/reader/full/power-quality-impacts-dg 72/108
End-Use Equipment susceptibility to Power Quality Variations
4-8
source is likely to make the DR more prone to tripping off line during single-phase PQvariations, therefore the engineering analysis for the DR installation should take voltageunbalance into consideration.
Waveform Distortion – Table 4-1 indicates that the majority of load equipment is not overly
sensitive to harmonic voltage distortion, and in many cases, the rectifier power supply based loadequipment is actually a harmonic current generation source. While harmonic distortion of thevoltage and current is not a major performance factor for most facility loads, it is generallyunderstood that minimizing voltage distortion of the facility bus is a good design objective andwill reduce the possibilities of heating related problems for the electric power systemcomponents. Reducing distortion levels will also minimize the potential for fuse blowing andnuisance trip related problems with facility loads. Installed DR can increase the level of voltagedistortion of a facility if a low quality inverter is used to support the equipment in an isolatedmode, or is used to grid connect. Alternatively if the DR is configured to provide harmoniccurrent for some of the facilities harmonic generating loads, the voltage distortion on the facilitybus can be decreased.
Voltage Fluctuations – Table 4-1 indicates that many of the lighting technologies used inindustrial and commercial facilities can produce light flicker in the presence of voltagefluctuations. While flicker has been a documented concern with some early installations of DR itis unlikely that applications close to facilities and facility loads will results in notable flickerproblems.
Frequency Variations – Variations in the 60Hz power frequency are not common, however,there is a requirement that installed DR devices have the ability to synchronize with and followthe grid frequency during transitions from non-grid tie to grid tie mode. Unsynchronizedtransfers can result in nuisance tripping of controlled rectifier power supplies and may evenresult in fuse blowing or rectifier power supply damage. Beyond the grid synchronization
requirement, it is unlikely that frequency variation problems will result through the application ofDR devices.
End-User Power Conditioning Solutions
Facilities with a need for high reliability and PQ usually have a back up generator. In additionthey may also apply one or both of the following:
• Uninterruptible power supply (UPS)
• Improving load ride-through
Various options for redundancy are available for each of these. We’ll discuss each of these inaddition to other local options for increasing the availability of end-use equipment.
Uninterruptible Power Supplies
The UPS provides short-duration energy storage to enable equipment to ride through short-duration disturbances such as voltage sags and momentary interruptions (and also voltage swells
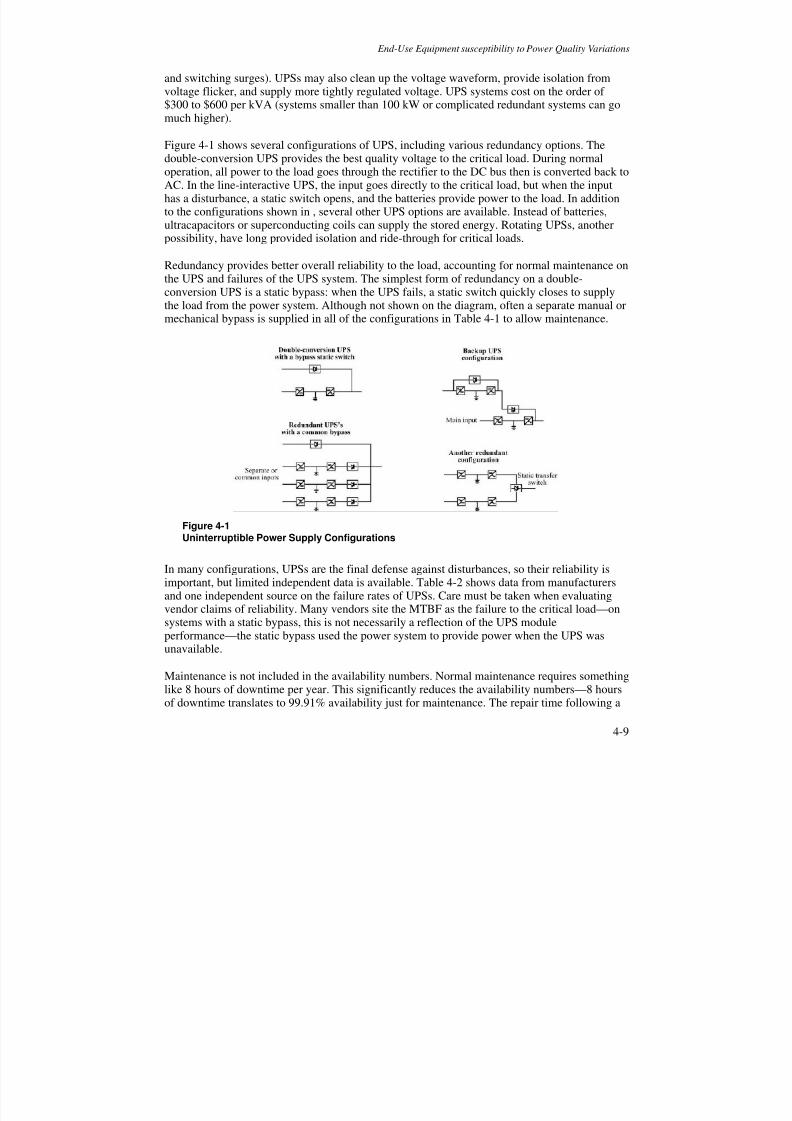
8/12/2019 Power Quality Impacts DG
http://slidepdf.com/reader/full/power-quality-impacts-dg 73/108
End-Use Equipment susceptibility to Power Quality Variations
4-9
and switching surges). UPSs may also clean up the voltage waveform, provide isolation fromvoltage flicker, and supply more tightly regulated voltage. UPS systems cost on the order of$300 to $600 per kVA (systems smaller than 100 kW or complicated redundant systems can gomuch higher).
Figure 4-1 shows several configurations of UPS, including various redundancy options. Thedouble-conversion UPS provides the best quality voltage to the critical load. During normaloperation, all power to the load goes through the rectifier to the DC bus then is converted back toAC. In the line-interactive UPS, the input goes directly to the critical load, but when the inputhas a disturbance, a static switch opens, and the batteries provide power to the load. In additionto the configurations shown in , several other UPS options are available. Instead of batteries,ultracapacitors or superconducting coils can supply the stored energy. Rotating UPSs, anotherpossibility, have long provided isolation and ride-through for critical loads.
Redundancy provides better overall reliability to the load, accounting for normal maintenance onthe UPS and failures of the UPS system. The simplest form of redundancy on a double-conversion UPS is a static bypass: when the UPS fails, a static switch quickly closes to supply
the load from the power system. Although not shown on the diagram, often a separate manual ormechanical bypass is supplied in all of the configurations in Table 4-1 to allow maintenance.
Figure 4-1Uninterruptible Power Supply Configurations
In many configurations, UPSs are the final defense against disturbances, so their reliability isimportant, but limited independent data is available. Table 4-2 shows data from manufacturersand one independent source on the failure rates of UPSs. Care must be taken when evaluating
vendor claims of reliability. Many vendors site the MTBF as the failure to the critical load—onsystems with a static bypass, this is not necessarily a reflection of the UPS moduleperformance—the static bypass used the power system to provide power when the UPS wasunavailable.
Maintenance is not included in the availability numbers. Normal maintenance requires somethinglike 8 hours of downtime per year. This significantly reduces the availability numbers—8 hoursof downtime translates to 99.91% availability just for maintenance. The repair time following a

8/12/2019 Power Quality Impacts DG
http://slidepdf.com/reader/full/power-quality-impacts-dg 74/108
End-Use Equipment susceptibility to Power Quality Variations
4-10
failure varies widely, depending on the type of failure, how quickly the failure is identified, howavailable are spare parts, and what type of service arrangements are available.
Individual hardware failures are not the only concern. With reliable hardware, and especially inredundant configurations, other failure modes not included in these numbers are important toconsider:
• Human error: Loss of critical loads from human error is a significant portion of failures inredundant configurations. Switching mistakes, incorrect installation, poor choice of settings,failure to perform maintenance, and failure to test systems properly can all lead to outrightfailure or introduction of hidden failure modes that show up later.
• Common-mode failures: If redundant UPSs share common designs or controls or batteries oreven if they are physically very close, simultaneous failures can wipe out much of thetheoretical reliability improvement that redundancy provides. We can take some steps toavoid common-mode failures—make sure redundant UPSs are independent (possibly evenusing different manufacturers), don’t perform maintenance during stormy weather (we aremuch more likely to get utility system disturbances during storms), keep adequate physical
separation between systems, and test systems periodically.
• Interaction with other equipment: Batteries are a major source of trouble with UPSs. Ifbatteries are not maintained and replaced as appropriate, they may not have enough reserveto allow the UPS to ride through interruptions as designed. Another common failure modefor critical load is that the UPS excessively switches to batteries. Excessive switching canprematurely wear batteries, so they don’t work when really needed. A UPS may use thebatteries excessively because of excess harmonics or noise on the input supply.
Accounting for these types of failures is very difficult in a reliability analysis. There is little datato quantify these effects.
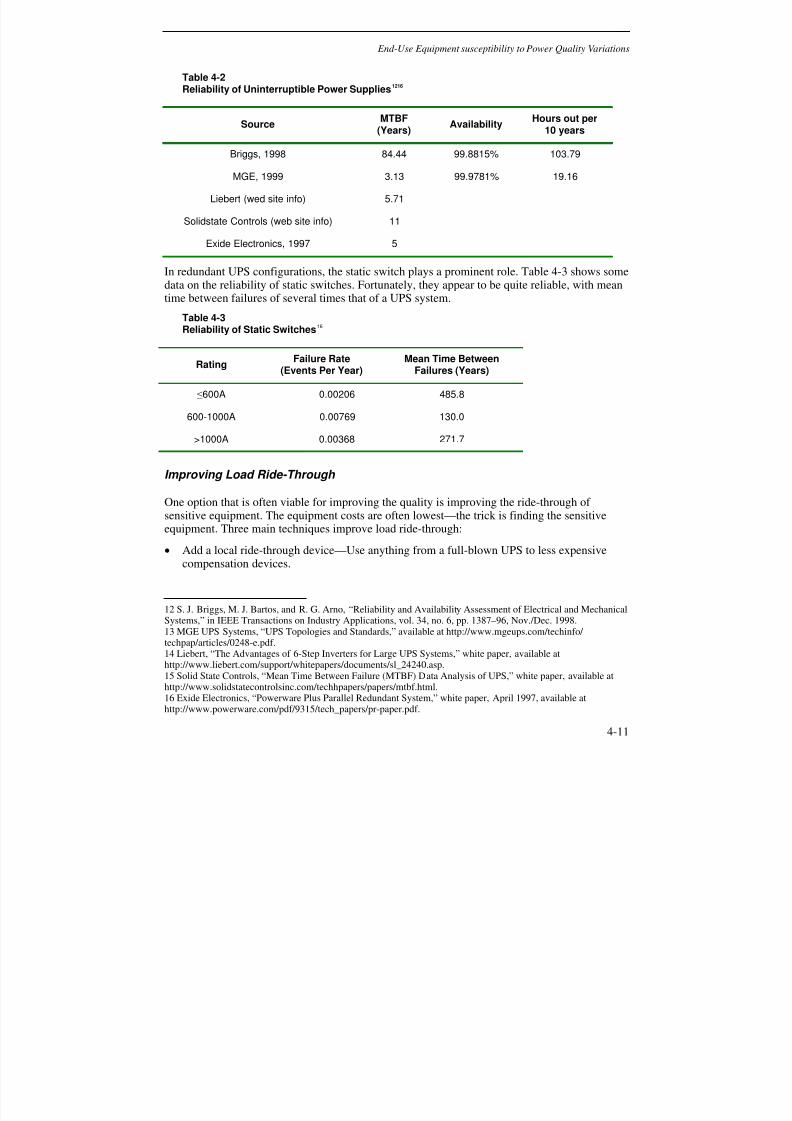
8/12/2019 Power Quality Impacts DG
http://slidepdf.com/reader/full/power-quality-impacts-dg 75/108
End-Use Equipment susceptibility to Power Quality Variations
4-11
Table 4-2Reliability of Uninterruptible Power Supplies1216
SourceMTBF
(Years)Availability
Hours out per10 years
Briggs, 1998 84.44 99.8815% 103.79
MGE, 1999 3.13 99.9781% 19.16
Liebert (wed site info) 5.71
Solidstate Controls (web site info) 11
Exide Electronics, 1997 5
In redundant UPS configurations, the static switch plays a prominent role. Table 4-3 shows somedata on the reliability of static switches. Fortunately, they appear to be quite reliable, with mean
time between failures of several times that of a UPS system.Table 4-3Reliability of Static Switches16
RatingFailure Rate
(Events Per Year)Mean Time Between
Failures (Years)
≤600A 0.00206 485.8
600-1000A 0.00769 130.0
>1000A 0.00368 271.7
Improving Load Ride-Through
One option that is often viable for improving the quality is improving the ride-through ofsensitive equipment. The equipment costs are often lowest—the trick is finding the sensitiveequipment. Three main techniques improve load ride-through:
• Add a local ride-through device—Use anything from a full-blown UPS to less expensivecompensation devices.
12 S. J. Briggs, M. J. Bartos, and R. G. Arno, “Reliability and Availability Assessment of Electrical and MechanicalSystems,” in IEEE Transactions on Industry Applications, vol. 34, no. 6, pp. 1387–96, Nov./Dec. 1998.13 MGE UPS Systems, “UPS Topologies and Standards,” available at http://www.mgeups.com/techinfo/techpap/articles/0248-e.pdf.14 Liebert, “The Advantages of 6-Step Inverters for Large UPS Systems,” white paper, available athttp://www.liebert.com/support/whitepapers/documents/sl_24240.asp.15 Solid State Controls, “Mean Time Between Failure (MTBF) Data Analysis of UPS,” white paper, available athttp://www.solidstatecontrolsinc.com/techhpapers/papers/mtbf.html.16 Exide Electronics, “Powerware Plus Parallel Redundant System,” white paper, April 1997, available athttp://www.powerware.com/pdf/9315/tech_papers/pr-paper.pdf.

8/12/2019 Power Quality Impacts DG
http://slidepdf.com/reader/full/power-quality-impacts-dg 76/108
End-Use Equipment susceptibility to Power Quality Variations
4-12
• Change settings/programming—Some devices have settings that can be changed, which willimprove their ride-through.
• Specify ride-through during equipment purchase—This is the approach semiconductormanufacturers have pushed with the development of the SEMI F47 standard,
17 which
specifies a test that semiconductor tools must pass.
Table 4-4 provides information on load ride-through devices. Load ride through is a very goodsolution for many facilities. Some of the devices are specific (such as the contactor hold-indevices for use with relays and contactors); others are more general. In an existing process in afacility, identifying the “weak links” is tricky. Testing with a voltage sag generator can identifythe performance of individual devices and help locate ride-through equipment.
Utilities and end-use facilities should push to improving the ride-through of equipment.Standards such as SEMI F47 are a move in the right direction. Establishing testable quality levels(either those defined in this report or other definitions) helps push manufacturers in the directionof providing more built in ride-through (with proper design, manufacturers can design extra ride-
through will little extra cost in many cases).Table 4-4Various Load Ride-Through Devices
Generic Name Device Model NamesTypical
MitigationLevel
Typical Cost(U.S. $)
TypicalSize
LV Static SeriesCompensation
-Dynamic Sag Corrector (Dysc)-Sag Ride Through Device (SRT)-Reactivar Electronic SagProtector (ESP)
Low Voltage/Panel/BranchCircuit Level
$150-$300/kVA 20 kVA to500 kVA
http://www.softswitch.com/http://www.ch.cutler-hammer.com/surge/products/srt.html
Battery-Less Ride-Through Device
-Constant Voltage Transformer-Dip Proofing Inverter-Mini Dynamic Sag Corrector
Low VoltageEquipmentControl Level
$200-$600/kVA 75 VA to3 KVA
http://www.sola-hevi-duty.com/http://www.dipproof.com/
Contactor Hold-InCircuit
-Coil Lock-KnowTrip
Contactors $50-$100 perunit
ContactorCoil
http://www.scrcontrols.com/Knowtrip/http://pqsi.com
17 SEMI F47-0200, Specification for Semiconductor Processing Equipment Voltage Sag Immunity, SemiconductorEquipment and Materials International, 2000.

8/12/2019 Power Quality Impacts DG
http://slidepdf.com/reader/full/power-quality-impacts-dg 77/108

8/12/2019 Power Quality Impacts DG
http://slidepdf.com/reader/full/power-quality-impacts-dg 78/108
8/12/2019 Power Quality Impacts DG
http://slidepdf.com/reader/full/power-quality-impacts-dg 79/108
5-1
5GUIDELINES FOR POWER QUALITY AND RELIABILITY
ASSESSMENT
The previous chapters provide a background on likely PQ and reliability impacts of DR, bothpositive and negative. This chapter will provide assessment procedures for the areas where DRpotential impacts are expected to be significant. Four assessment procedures are providedincluding:
• Reliability/Availability Assessment Procedure
•Long Duration Variation (Voltage Regulation) Assessment Procedure
• Short Duration Variations (Sag) Assessment Procedure
• Short Duration Variations (Swell) Assessment Procedure
Each procedure contains a section providing background on the topic, with an assessmentmethodology and procedure, followed by illustrative examples. In some cases step by stepscreening methods are provided. These will enable utility personnel and system integrators toassess potential impacts of DR on local power systems and the connected end-use equipmentbefore it is installed.
Reliability Assessment Procedure
Background
This procedure is based on the IEEE Gold Book, which has been accepted as a recommendpractice for industrial and commercial power systems by IEEE. The methodology has beenmodified to include both PQ-related equipment failures and outage-related failures. Thereforethe varying susceptibility of different end-use equipment is considered in the analysis.Unavailability is calculated using a “network reduction method,” which is analysis ofseries/parallel combinations of elements, rather than the more academic “minimum cut-set”theory described in the IEEE Gold Book. The method assumes series and parallel structures can
be reduced to equivalent components with predicted failure rates and average repair times.
In this method the equivalent component failure rates and repair times are calculated for variouspower sources and are then combined with the interconnecting circuit elements. This is asomewhat more intuitive approach than the cut-set theory and requires a good understanding ofthe electrical one–line diagram and of how the power system is operated. It allows for reliabilityestimates where no failure data is available. The goal is to provide a method that incorporatesthe most important aspects of redundant systems, while at the same time keeping is simple and

8/12/2019 Power Quality Impacts DG
http://slidepdf.com/reader/full/power-quality-impacts-dg 80/108
Guidelines for Power Quality and Reliability Assessment
5-2
not defeated by minor missing data. The basic approach is to reduce complex systems usingseries and parallel combinations of elements.
Data Needed for Assessment
Data needed for quantitative evaluations of system reliability depend to some extent on thenature of the system being studied and the detail of the study. In general, however, data on theperformance of individual components, times to repair together with the times required toperform various switching operations, are required. System component data are:
• Failure rates (forced outage rates) associated with different modes of component failure
• Expected (average) time to repair or replace failed component
• Scheduled (maintenance) outage rate of component
• Expected (average) duration of a scheduled outage event
If possible, component data should be based on historical performance of components in thesame environment as those in the proposed system being studied. For example the reliabilitysurveys conducted by the IEEE provide an excellent source of component data when suchspecific data is not available. Some of this data may be obtained from Chapter 3 of IEEE Std493-1997. For feeder performance it is always better to use actual data rather than average, e.g.use local utility statistics on a feeder rather an average for similar feeders from the EPRI DPQstudy. Also, switching times should be estimated for the system being studied based onexperience, engineering judgment, and anticipated operating practices. Switching time datagenerally required includes the following:
• Expected times to open and close a circuit breaker
• Expected times to open and close a disconnect or throw-over switch• Expected time to replace a fuse link
• Expected times to perform such emergency operations as cutting in clear, installing jumpers,etc.
• Expected times to transition a DR from one operating mode to another.
Procedure
The network reduction method is believed to be particularly well suited for electric power
distribution systems as found in industrial plants and commercial buildings. The method issystematic and straightforward and lends itself to either manual or computer computation. Animportant feature of the method is that system weak points can be readily identified, bothnumerically and non-numerically, thereby focusing design attention on those sections of thesystem that contribute most to service unreliability.
8/12/2019 Power Quality Impacts DG
http://slidepdf.com/reader/full/power-quality-impacts-dg 81/108
Guidelines for Power Quality and Reliability Assessment
5-3
The procedure for system reliability evaluation is outlined as follows:
1. Assess the service reliability requirements of the loads and processes that are to be suppliedand determine appropriate service interruption definition or definitions.
2. Perform a failure modes and effects analysis (FMEA), which consists of identifying and listingthose component failures and combinations of component failures that result in serviceinterruptions and that constitute minimal cut-sets of the system.
3. Compute interruption frequency contributions and expected interruption durations, forcombinations of series and parallel elements to the system availability. Combine the resultsfor different power sources with local bus work, cables, transformers, and other equipment tofind the overall reliability to the critical load.
Step 1. Define a Service Interruption
The first step in any electric power system reliability study should be a careful assessment of thepower supply quality (e.g., sags, surges, harmonics, etc.) and power continuity (momentaryinterruptions and outages). A further key step is to relate the quality and reliability torequirements of the loads that are to be served. This assessment should be summarized andexpressed in a definition of equipment interruption that can be used in the succeeding steps of thereliability evaluation procedure.
This equipment interruption definition specifies, in general, the reduced voltage level (voltagesag) together with the minimum duration of such reduced voltage period that results insubstantial degradation or complete loss of function of the load or process being served. Thisdefinition will depend on the susceptibility of equipment and the type of process that requires
reliability Frequently, reliability studies are conducted on a continuity basis, in which case,interruption definitions reduce to a minimum duration specification with voltage assumed to bezero during the interruption.
Step 2. Conduct a Failure Modes and Effects Analysis (FMEA)
The FMEA for power distribution systems amounts to determining and listing those componentoutage events, or combinations of component outages, that result in reduced quality orinterruption of power service at the load point being studied, and according to the equipmentinterruption definition that has been adopted in step 1. This analysis must be made inconsideration of the different types and modes of outages that components may exhibit and the
reaction of the system’s protection scheme to these events. Component outages are categorizedas follows:
• Forced outages or failures
• Scheduled or maintenance outages
• Overload outages
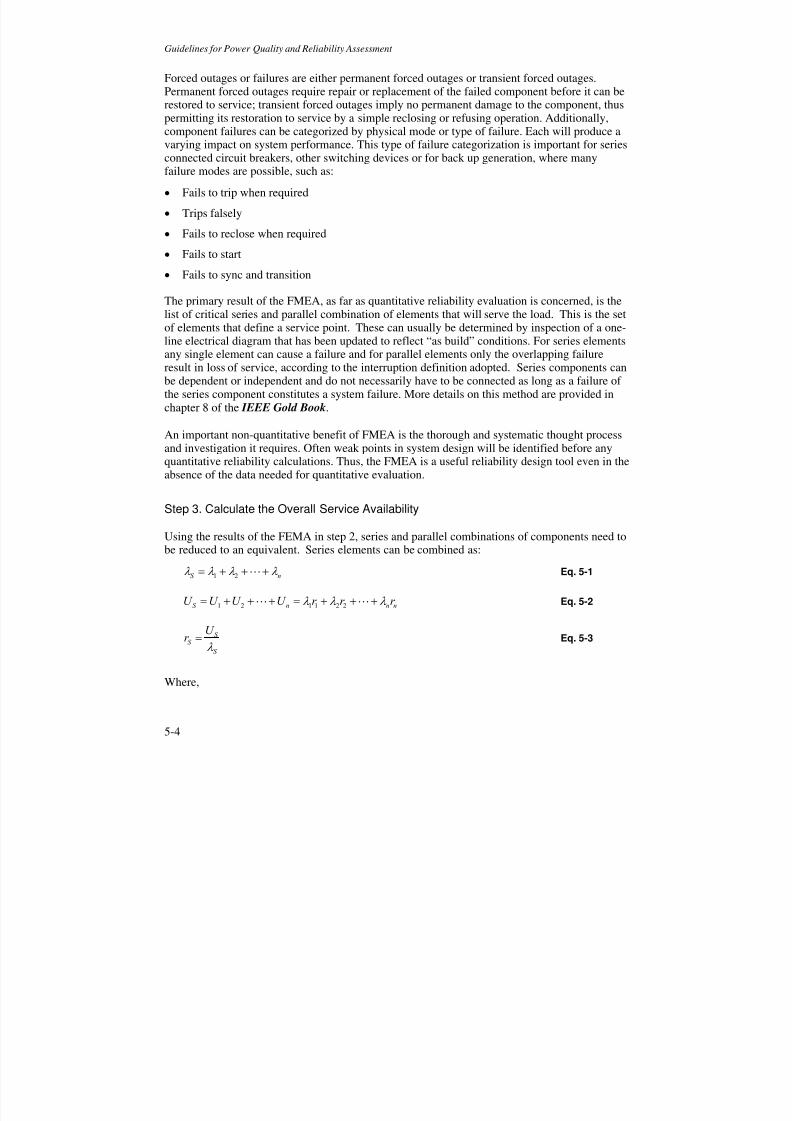
8/12/2019 Power Quality Impacts DG
http://slidepdf.com/reader/full/power-quality-impacts-dg 82/108
Guidelines for Power Quality and Reliability Assessment
5-4
Forced outages or failures are either permanent forced outages or transient forced outages.Permanent forced outages require repair or replacement of the failed component before it can berestored to service; transient forced outages imply no permanent damage to the component, thuspermitting its restoration to service by a simple reclosing or refusing operation. Additionally,component failures can be categorized by physical mode or type of failure. Each will produce avarying impact on system performance. This type of failure categorization is important for seriesconnected circuit breakers, other switching devices or for back up generation, where manyfailure modes are possible, such as:
• Fails to trip when required
• Trips falsely
• Fails to reclose when required
• Fails to start
• Fails to sync and transition
The primary result of the FMEA, as far as quantitative reliability evaluation is concerned, is thelist of critical series and parallel combination of elements that will serve the load. This is the setof elements that define a service point. These can usually be determined by inspection of a one-line electrical diagram that has been updated to reflect “as build” conditions. For series elementsany single element can cause a failure and for parallel elements only the overlapping failureresult in loss of service, according to the interruption definition adopted. Series components canbe dependent or independent and do not necessarily have to be connected as long as a failure ofthe series component constitutes a system failure. More details on this method are provided inchapter 8 of the IEEE Gold Book.
An important non-quantitative benefit of FMEA is the thorough and systematic thought processand investigation it requires. Often weak points in system design will be identified before anyquantitative reliability calculations. Thus, the FMEA is a useful reliability design tool even in theabsence of the data needed for quantitative evaluation.
Step 3. Calculate the Overall Service Availability
Using the results of the FEMA in step 2, series and parallel combinations of components need tobe reduced to an equivalent. Series elements can be combined as:
nS λ λ λ λ +++= L21 Eq. 5-1
nnnS r r r U U U U λ λ λ +++=+++= LL
221121 Eq. 5-2
S
S S
U r
λ = Eq. 5-3
Where,
8/12/2019 Power Quality Impacts DG
http://slidepdf.com/reader/full/power-quality-impacts-dg 83/108
Guidelines for Power Quality and Reliability Assessment
5-5
λ : failure rate, normally in interruptions per year
U : unavailability (total interruption time), normally in per unit, percent, or hours orminutes per year
r : average repair time per failure normally in per unit per year, percent per year, or hoursor minutes
The subscript S is the total of the series combination and the subscripts 1, 2, … n indicate theparameters of the individual elements.
Parallel elements can be combined with:
p
P P
r
U =λ Eq. 5-4
nnn P
r r r U U U U ×××××××=×××= LLL
212121
λ λ λ Eq. 5-5
n
P r r r
r /1/1/1
1
21 +++=
L
Eq. 5-6
for n=2,
)( 21211221 r r U U r
U
p
P P +=+== λ λ λ λ λ Eq. 5-7
The subscript P is the total of the parallel combination. Note that the units must be kept thesame: λ has units of 1/years, so the repair time, r , must be in units of years. Normally, this meansdividing r by 8760 if r is in hours. Also note that the above equations are approximations thatare valid only if the unavailability time is much less than the time of interest. IEEE recommendsa criterion that component unavailability of all series and parallel is less than 1% of the per-unittime, e.g. the annual time unavailable/8760 is less than .01. This is criterion is generally true indistribution reliability applications, and more so for high-reliability applications.
A more likely source of error is the assumption of independent sources used in the equationsrepresenting parallel combination of elements. In real-life electric supplies multiple feeders arevery seldom totally independent sources. A good illustration of this problem can be seen in thereliability data for utility supply found in from survey results and published in the IEEE Gold
Book. The average reliability of single-circuit supplies in the Gold Book has the followingfailure rate and repair time:
λ = 1.956 failures/year
r = 79 minutes

8/12/2019 Power Quality Impacts DG
http://slidepdf.com/reader/full/power-quality-impacts-dg 84/108
Guidelines for Power Quality and Reliability Assessment
5-6
If a system were supplied with two parallel sources with the above failure-rate characteristics,one would expect the following failure rates according to the ideal equations:
λP = (1.956)(1.956)(79+79)/525600 = 0.00115 failures/year
r = 1/(1/79 + 1/79) = 39.5 minutes
The actual surveyed reliability of circuits with multiple supplies is:
λ = 0.538 failures/year
r = 22 minutes
The failure rates when using multiple circuits or feeders are reduced, but they are typicallyseveral orders of magnitude lower than the predicted value. The reason the calculations arewrong is that the equations assume that the failures are totally independent. In reality, many
failures have some dependencies. The major factors are:• Facilities share common space (utilities run two circuits on one structure).
• Separate supplies contain a common point upstream.
• Failures bunch together or overlap during storms.
• Maintenance must be considered.
• Hidden failures can be present.
Also, parallel supplies in many cases contain endpoint equipment that is not paralleled, whichcan include transformers, bus work, breakers, and cables. It is possible to analytically model each
of these effects. The problem is that much of the necessary input data is unknown, so “educated”guesses are needed. For example, to analytically handle storm failures, one needs to find a stormfailure rate and the duration of storms (both of these numbers are hard to come by).
Accounting for Dependency Factors
Two of the major error factors, common-mode and hidden failures, can be accounted for byincluding a correction factor in the reliability calculation. This factor, m, includes utilityexperience and intends to account for the common-mode failures, hidden failures, and theoverlapping failures due to storms. More comprehensive methods are available, however thissimplified approach is warranted because increased accuracy requires better input data, that is
usually not available. The m factor is applied as follows:
)()( 21112122211221 −− +++=+== mr mr U U r
U
p
P P λ λ λ λ λ λ λ
# Eq. 5-8
# The term with m
2-1 should really be ])1([ 1222221 −−+ mr r λ λ λ . The term )1( 22r λ − is very close to one and can
just be assumed as part of m2-1
, which makes it reduce to )( 12221 −+ mr λ λ . The same is true of the m2-1
term.
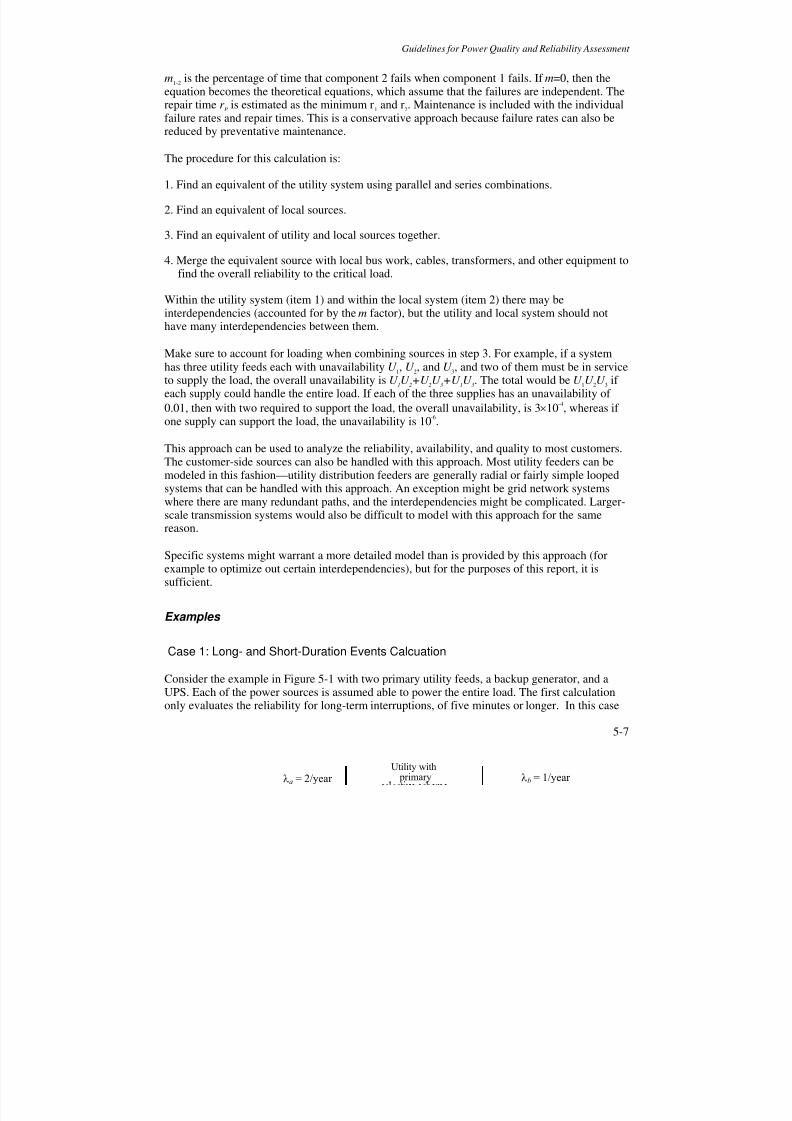
8/12/2019 Power Quality Impacts DG
http://slidepdf.com/reader/full/power-quality-impacts-dg 85/108
Guidelines for Power Quality and Reliability Assessment
5-7
m1-2
is the percentage of time that component 2 fails when component 1 fails. If m=0, then theequation becomes the theoretical equations, which assume that the failures are independent. Therepair time r
P is estimated as the minimum r
1 and r
2. Maintenance is included with the individual
failure rates and repair times. This is a conservative approach because failure rates can also bereduced by preventative maintenance.
The procedure for this calculation is:
1. Find an equivalent of the utility system using parallel and series combinations.
2. Find an equivalent of local sources.
3. Find an equivalent of utility and local sources together.
4. Merge the equivalent source with local bus work, cables, transformers, and other equipment tofind the overall reliability to the critical load.
Within the utility system (item 1) and within the local system (item 2) there may beinterdependencies (accounted for by the m factor), but the utility and local system should nothave many interdependencies between them.
Make sure to account for loading when combining sources in step 3. For example, if a systemhas three utility feeds each with unavailability U
1, U
2, and U
3, and two of them must be in service
to supply the load, the overall unavailability is U 1U
2+U
2U
3+U
1U
3. The total would be U
1U
2U
3 if
each supply could handle the entire load. If each of the three supplies has an unavailability of
0.01, then with two required to support the load, the overall unavailability, is 3×10⁻⁴, whereas if
one supply can support the load, the unavailability is 10-6.
This approach can be used to analyze the reliability, availability, and quality to most customers.The customer-side sources can also be handled with this approach. Most utility feeders can bemodeled in this fashion—utility distribution feeders are generally radial or fairly simple loopedsystems that can be handled with this approach. An exception might be grid network systemswhere there are many redundant paths, and the interdependencies might be complicated. Larger-scale transmission systems would also be difficult to model with this approach for the samereason.
Specific systems might warrant a more detailed model than is provided by this approach (forexample to optimize out certain interdependencies), but for the purposes of this report, it issufficient.
Examples
Case 1: Long- and Short-Duration Events Calcuation
Consider the example in Figure 5-1 with two primary utility feeds, a backup generator, and aUPS. Each of the power sources is assumed able to power the entire load. The first calculationonly evaluates the reliability for long-term interruptions, of five minutes or longer. In this case
Utility with primary λb = 1/yearλa = 2/year
8/12/2019 Power Quality Impacts DG
http://slidepdf.com/reader/full/power-quality-impacts-dg 86/108
Guidelines for Power Quality and Reliability Assessment
5-8
the contribution of the UPS is not included. Also, for now, the local transformer, bus work, andcables will be ignored.
Figure 5-1Example System for Reliability Calculations
To use equation 5-8 some educated guesses are required for the m factor. For the two utilityfeeds, it is likely that there will be a fairly significant portion of events that affect both circuits,so we will take m
1-2 = m
2-1 = 0.05. This factor mainly includes the possibility of upstream failures
(probably on the sub-transmission), simultaneous faults due to overlapping equipment, andfailures bunched together during storms. Hidden failures are not expected. And there shouldn’tbe much correlation between the utility feeders and the local generation, so we will take all m
factors between the generator and the utility to be zero. The reliability of the utility portion canbe found with:
year
hours year year
hours year year
mr mr
/1518.0
05.08760
4/2)/1(05.0
8760
4/1)/2(
)()( 211121222112
=
++
+=
+++= −− λ λ λ λ λ
Eq. 5-9
Note that the m factor dominates the equation (even if m=0.005). For simplification, we willassume that r
12= 4 hours.
The generator requires a different calculation because the backup generator is not operated verymuch. The factor m will primarily be hidden failures (what percentage of the time will thegenerator fail to start properly when the utility fails?). We will assume m=0.1. To find the overallfailure rate with the generator, we multiply the failure rate of the utility system by theunavailability time of the generator. The unavailability time of the generator includes the timeout for maintenance and the hidden failures (m). Also note that the failure rate and repair time for
the backup generator (λg and r
g) are actually its maintenance frequency and duration. It doesn’t
8/12/2019 Power Quality Impacts DG
http://slidepdf.com/reader/full/power-quality-impacts-dg 87/108
Guidelines for Power Quality and Reliability Assessment
5-9
make sense to use the second term, which would be λg(λ
12r
12+m
12-g), because the generator is not
continuously running, therefore the calculation is:
year /01539.0
1.0
8760
hours6year /2)year /1518.0(
)( 121212
=
+=
+= − g g g g mr λ λ λ
Eq. 5-10
This yields a MTBF of almost 65 years, and five nines of availability (making the simplifiedassumption that r
12g=4 hours). This result is good reliability, but it is nowhere near the MTBF that
would be calculated using ideal equations assuming independence.
A second reliability calculation now includes the shorter-duration events. If the previousexample is extended to analyze short duration events (including sags and momentaryinterruptions), some modifications to the analysis will be needed. The following assumptions
will be used:• All short duration disturbances originate on the utility system.
• The repair times for all such disturbances are zero (ignore overlapping events).
• The generator can be ignored, because it won’t start immediately.
• λ1 = 20 events/year, λ
2 = 10 events/year.
• The UPS is repaired 4 times per year 3 hours each time. The UPS has a failure rate of 0.5%annually.
The primary-selective scheme is a mechanical scheme that will transfer only for long-duration
interruptions. Therefore, the PQ events that get through will be those on the currently connectedfeeder. Because we may not know, which that is, we will take the average of the two feeder
failure rates. Without the UPS, this would be the failure rate: λ12 = (λ
1 + λ
2)/2 = 15/year.
The UPS requires special handling. The UPS is in series, so if a UPS failure occurs, the load willhave a failure (this was not included in the previous example because it was assumed that thefailed UPS could be bypassed). The m mainly reflects the possibility of hidden failures. An off-line UPS could have hidden failures. The m
u-12 is assumed to be 0.001. The overall failure rate is:
year /0405.0
001.0
8760
hours3year /4)year /15(year /005.0
)( 12::1212
=
++=
++= −umumuuu mr λ λ λ λ
Eq. 5-11
Roughly half of these are due to maintenance, and half are due to hidden failures, e.g. failure ofthe UPS to properly correct the disturbance. The frequency and repair time of the UPS indicated
by λu:m
and r u:m
are UPS maintenance (load interruptions may occur if the utility PQ disturbances
8/12/2019 Power Quality Impacts DG
http://slidepdf.com/reader/full/power-quality-impacts-dg 88/108
Guidelines for Power Quality and Reliability Assessment
5-10
happen when the UPS is bypassed for maintenance). This failure rate for short durationdisturbances is added to the failure rate long duration events, calculated previously to get:
year /0559.0year /01539.0year /0405.0412121 =+=+= Luu Lu λ λ λ Eq. 5-12
This is a MTBF of almost 18 years.
Voltage Regulation Assessment Procedure
Distributed resources can influence the voltage regulation of electric power systems. Thisinfluence will occur whether or not a DR is regulating voltage or whether it is operating in a“voltage following” mode. This is because any device that influences the flow of power on thedistribution system will have an impact on voltage drops occurring across impedances in thesystem, and this will result in changes in voltage at various points on the system. These changesmay be significant if the generator relatively large compared to the power system at the point ofapplication. Effect also depends on the way in which the generator is operated/controlled, and the
nature of the upstream voltage-regulation equipment (such as load tap changer [LTC]transformers, line voltage regulators, and switched capacitors). DR can provide “support” ofvoltage. It can also lead to “high” or “low” voltages that are outside the required normaloperating range.
Background
Power distribution systems are mainly limited in their capacity to serve a given load by, eitherthermal limits or voltage-drop limits. When a system is said to be thermally limited, it means thatas loading on the system increases, the lines and equipment (such as transformers) will reachtheir maximum allowable temperature before the voltage drop on the system causes the voltageto deviate outside the acceptable operating range. Thermal limits are determined by factors suchas annealing temperature or sag clearance limit for overhead conductors or the temperature riselimits of insulation in cables and transformers where significant loss of life or damage mayoccur.
Most urban distribution circuits or shorter suburban circuits are thermal rather than voltagelimited due to the relatively short feeder lengths and correspondingly smaller voltage drops onsuch systems. When a system is voltage-drop limited , it means that as loading increases, thevoltage eventually deviates outside of the normal range before the thermal limits of theconductors or other equipment are reached. Voltage limits are defined as the loading level atwhich the voltage deviates outside the ANSI C84.1 Range A limits. In contrast, many rural
distribution circuits are voltage-drop limited because they have long feeders with considerablevoltage drop.
Several screening modules were presented in EPRI’s Engineering Guide for Integration of Distributed Generation and Storage Into Power Distribution Systems (1000419). These describebasic checks to determine whether either a thermal or voltage limit is likely to be exceeded inany DR application. This is done through various aggregate capacity checks, stiffness ratio tests,comparison of DR output to existing load on the system, and other tests. A DR application that
8/12/2019 Power Quality Impacts DG
http://slidepdf.com/reader/full/power-quality-impacts-dg 89/108
Guidelines for Power Quality and Reliability Assessment
5-11
passes the screening should generally not cause a problem with either a voltage or a thermallimit. It should be noted that, unlike the typical case of loads on a distribution system, which leadto line-voltage drop, DR has the potential to raise voltage by injecting power back into thesystem. So the screening tests must address high-voltage concerns (voltage-rise limits) as well aslow-voltage concerns (voltage-drop limits) caused by DR.
Procedure
This screening provides a tool to check distributed generation (DR) installations forcharacteristics that are known to impact voltage regulation or interact with voltage-regulatingequipment. It should not be considered foolproof and is most certainly not a substitute for a loadflow study.
To determine whether distributed generation-caused voltage-regulation problems may resultfrom the installation under consideration, navigate the flowchart in Figure 5-2.
A result of “Pass” indicates that the installation does not possess any typical characteristics thatcan lead to voltage-regulation problems. However, it is possible that regulation problems maystill occur.
The decision to conduct a further system study is based on the presence of one or more systemcharacteristics that suggest voltage-regulation problems may result if the proposed generationssystem is placed into operation.
In preparation for using the flowchart, the following steps should be taken:
• Sketch a one-line diagram of the distribution feeder where the DR is to be placed.
• Note on the one-line diagram: – Location of all regulating devices and of the DR
– Location of the PCC for the DR as defined by IEEE 519
• At the PCC, determine:
– Available fault current
– Typical per-unit voltage levels
• Determine rated output current of the DR.
• Determine peak load current at nearest source-side regulating device.
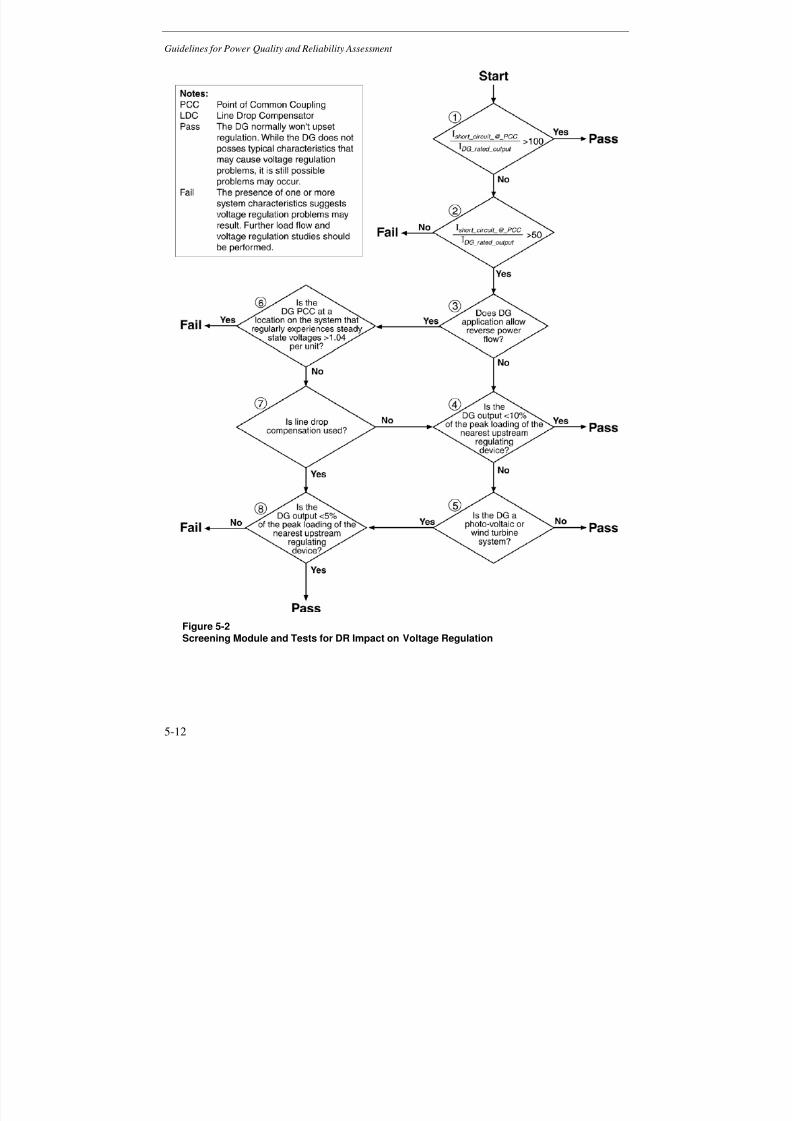
8/12/2019 Power Quality Impacts DG
http://slidepdf.com/reader/full/power-quality-impacts-dg 90/108
Guidelines for Power Quality and Reliability Assessment
5-12
Figure 5-2Screening Module and Tests for DR Impact on Voltage Regulation
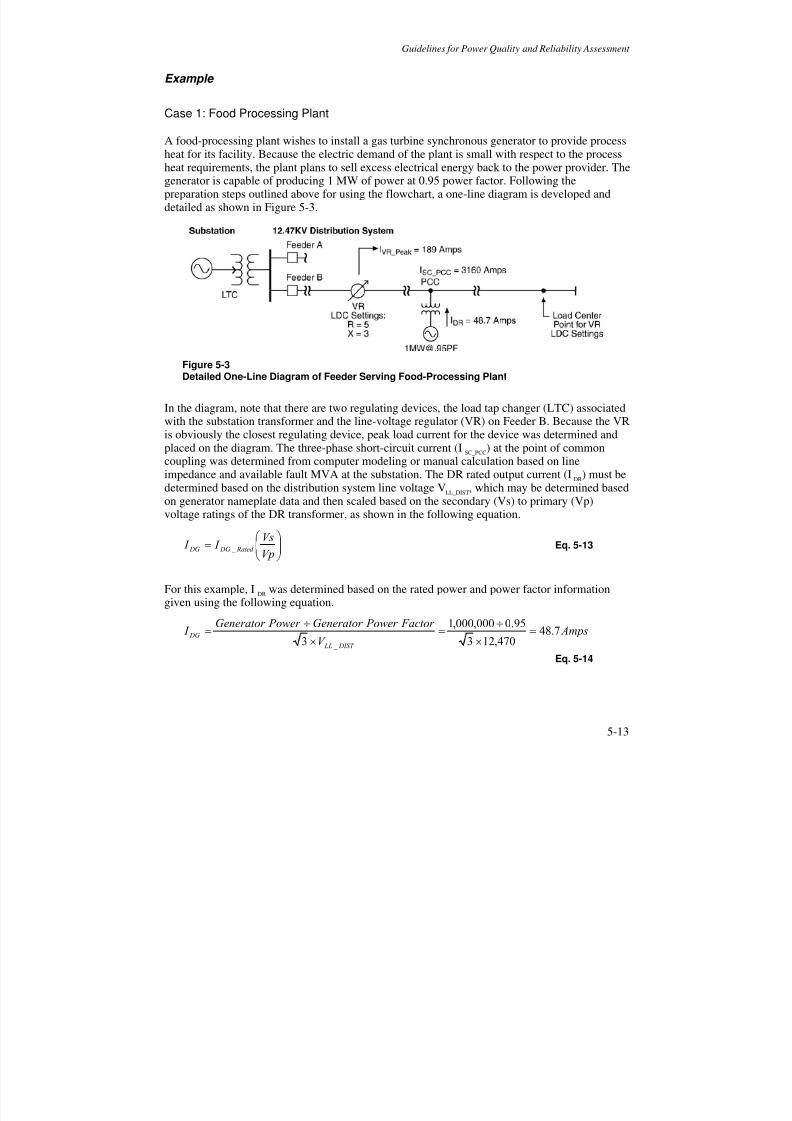
8/12/2019 Power Quality Impacts DG
http://slidepdf.com/reader/full/power-quality-impacts-dg 91/108
Guidelines for Power Quality and Reliability Assessment
5-13
Example
Case 1: Food Processing Plant
A food-processing plant wishes to install a gas turbine synchronous generator to provide process
heat for its facility. Because the electric demand of the plant is small with respect to the processheat requirements, the plant plans to sell excess electrical energy back to the power provider. Thegenerator is capable of producing 1 MW of power at 0.95 power factor. Following thepreparation steps outlined above for using the flowchart, a one-line diagram is developed anddetailed as shown in Figure 5-3.
Figure 5-3Detailed One-Line Diagram of Feeder Serving Food-Processing Plant
In the diagram, note that there are two regulating devices, the load tap changer (LTC) associatedwith the substation transformer and the line-voltage regulator (VR) on Feeder B. Because the VRis obviously the closest regulating device, peak load current for the device was determined andplaced on the diagram. The three-phase short-circuit current (I
SC_PCC
) at the point of commoncoupling was determined from computer modeling or manual calculation based on lineimpedance and available fault MVA at the substation. The DR rated output current (I
DR) must be
determined based on the distribution system line voltage VLL_DIST
, which may be determined basedon generator nameplate data and then scaled based on the secondary (Vs) to primary (Vp)voltage ratings of the DR transformer, as shown in the following equation.
=
Vp
Vs I I Rated DG DG _ Eq. 5-13
For this example, IDR
was determined based on the rated power and power factor information
given using the following equation.
AmpsV
Factor Power Generator Power Generator I
DIST LL
DG 7.48470,123
95.0000,000,1
3 _
=×
÷=
×
÷=
Eq. 5-14
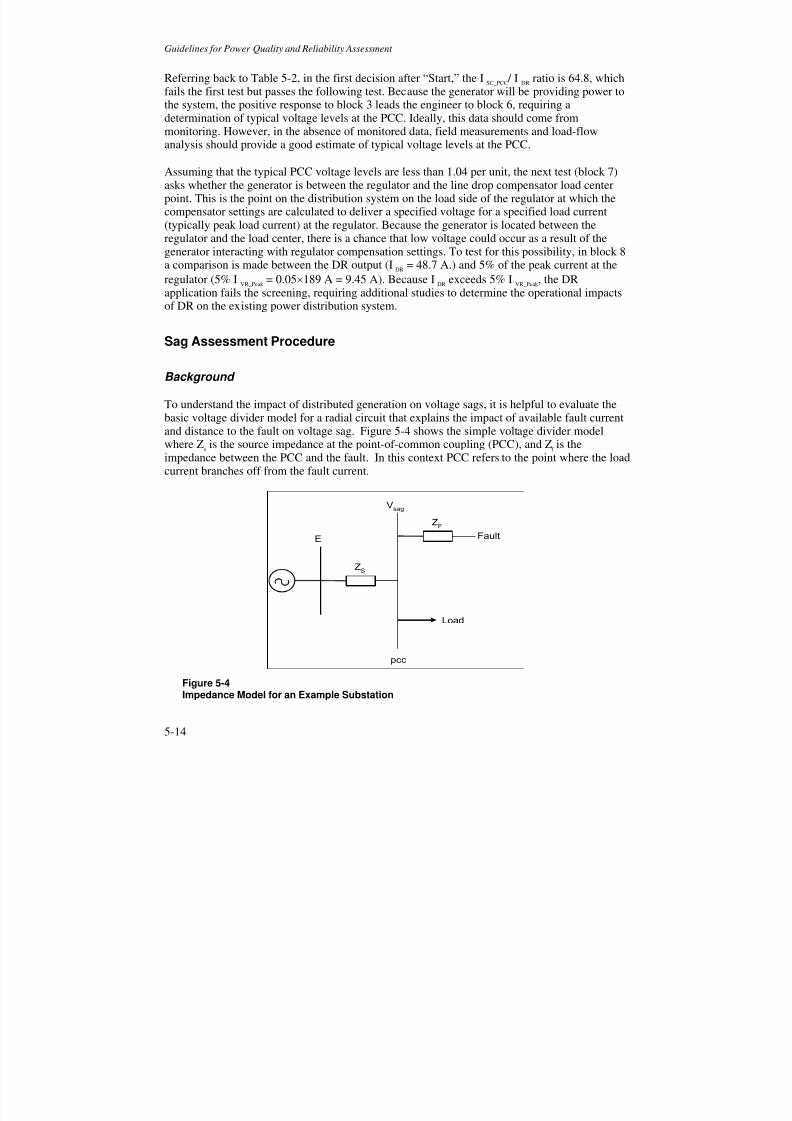
8/12/2019 Power Quality Impacts DG
http://slidepdf.com/reader/full/power-quality-impacts-dg 92/108
Guidelines for Power Quality and Reliability Assessment
5-14
Referring back to Table 5-2, in the first decision after “Start,” the ISC_PCC
/ IDR
ratio is 64.8, whichfails the first test but passes the following test. Because the generator will be providing power tothe system, the positive response to block 3 leads the engineer to block 6, requiring adetermination of typical voltage levels at the PCC. Ideally, this data should come frommonitoring. However, in the absence of monitored data, field measurements and load-flowanalysis should provide a good estimate of typical voltage levels at the PCC.
Assuming that the typical PCC voltage levels are less than 1.04 per unit, the next test (block 7)asks whether the generator is between the regulator and the line drop compensator load centerpoint. This is the point on the distribution system on the load side of the regulator at which thecompensator settings are calculated to deliver a specified voltage for a specified load current(typically peak load current) at the regulator. Because the generator is located between theregulator and the load center, there is a chance that low voltage could occur as a result of thegenerator interacting with regulator compensation settings. To test for this possibility, in block 8a comparison is made between the DR output (I
DR = 48.7 A.) and 5% of the peak current at the
regulator (5% IVR_Peak
= 0.05×189 A = 9.45 A). Because IDR
exceeds 5% IVR_Peak
, the DRapplication fails the screening, requiring additional studies to determine the operational impacts
of DR on the existing power distribution system.
Sag Assessment Procedure
Background
To understand the impact of distributed generation on voltage sags, it is helpful to evaluate thebasic voltage divider model for a radial circuit that explains the impact of available fault currentand distance to the fault on voltage sag. Figure 5-4 shows the simple voltage divider modelwhere Z
s is the source impedance at the point-of-common coupling (PCC), and Z
f is the
impedance between the PCC and the fault. In this context PCC refers to the point where the loadcurrent branches off from the fault current.
E
ZS
pcc
Vsag
ZF
Fault
Load
Figure 5-4Impedance Model for an Example Substation
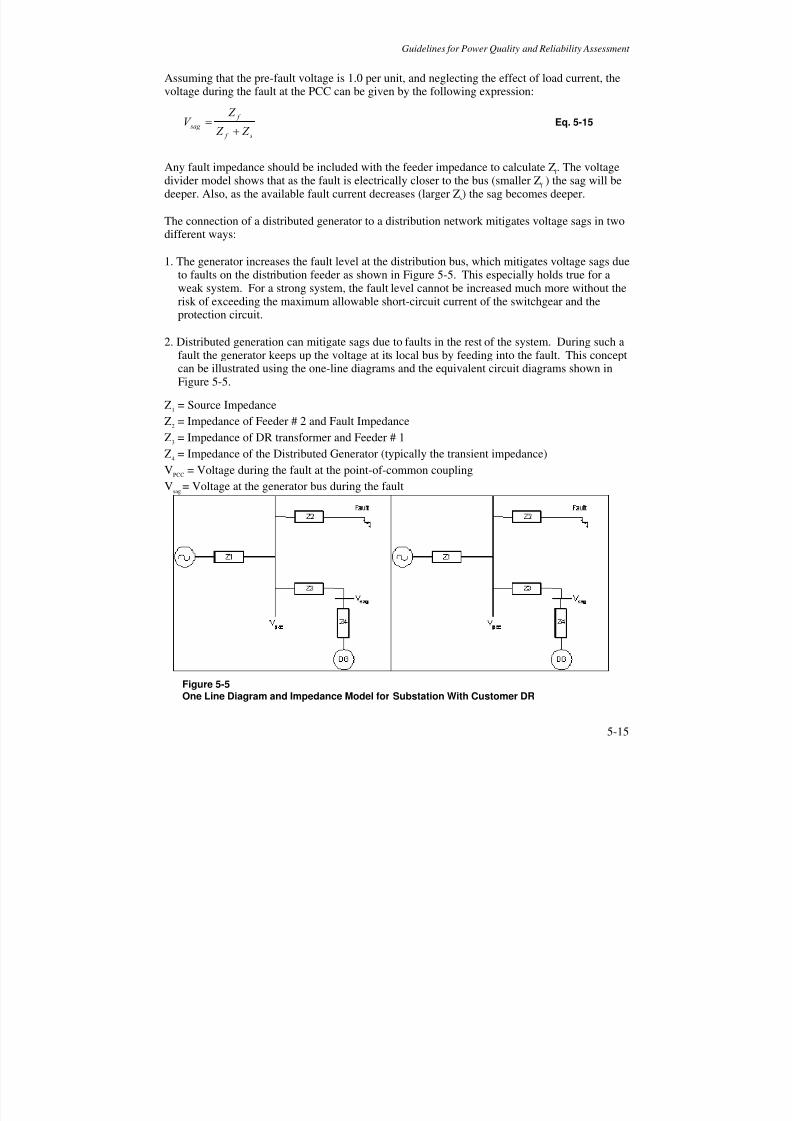
8/12/2019 Power Quality Impacts DG
http://slidepdf.com/reader/full/power-quality-impacts-dg 93/108
Guidelines for Power Quality and Reliability Assessment
5-15
Assuming that the pre-fault voltage is 1.0 per unit, and neglecting the effect of load current, thevoltage during the fault at the PCC can be given by the following expression:
s f
f
sag Z Z
Z V
+= Eq. 5-15
Any fault impedance should be included with the feeder impedance to calculate Zf . The voltage
divider model shows that as the fault is electrically closer to the bus (smaller Zf ) the sag will be
deeper. Also, as the available fault current decreases (larger Zs) the sag becomes deeper.
The connection of a distributed generator to a distribution network mitigates voltage sags in twodifferent ways:
1. The generator increases the fault level at the distribution bus, which mitigates voltage sags dueto faults on the distribution feeder as shown in Figure 5-5. This especially holds true for aweak system. For a strong system, the fault level cannot be increased much more without the
risk of exceeding the maximum allowable short-circuit current of the switchgear and theprotection circuit.
2. Distributed generation can mitigate sags due to faults in the rest of the system. During such afault the generator keeps up the voltage at its local bus by feeding into the fault. This conceptcan be illustrated using the one-line diagrams and the equivalent circuit diagrams shown inFigure 5-5.
Z1 = Source Impedance
Z2 = Impedance of Feeder # 2 and Fault Impedance
Z3 = Impedance of DR transformer and Feeder # 1
Z4 = Impedance of the Distributed Generator (typically the transient impedance)V
PCC = Voltage during the fault at the point-of-common coupling
Vsag
= Voltage at the generator bus during the fault
Figure 5-5One Line Diagram and Impedance Model for Substation With Customer DR
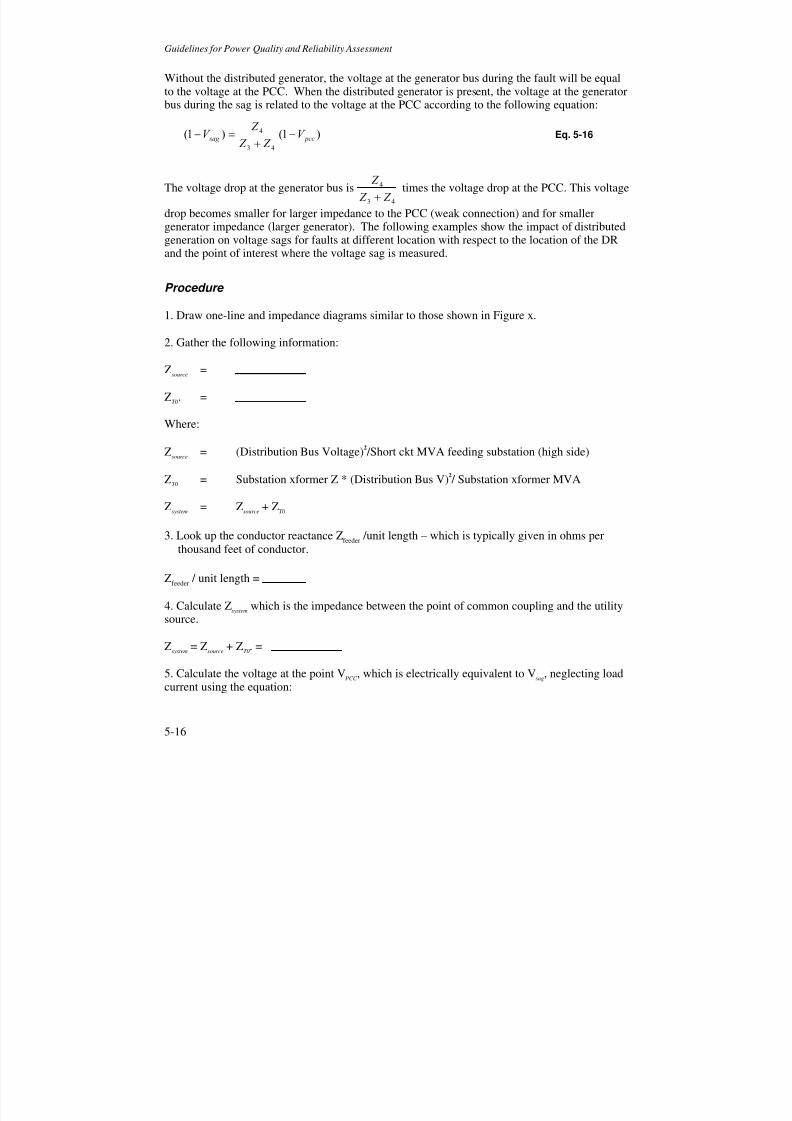
8/12/2019 Power Quality Impacts DG
http://slidepdf.com/reader/full/power-quality-impacts-dg 94/108
Guidelines for Power Quality and Reliability Assessment
5-16
Without the distributed generator, the voltage at the generator bus during the fault will be equalto the voltage at the PCC. When the distributed generator is present, the voltage at the generatorbus during the sag is related to the voltage at the PCC according to the following equation:
)1()1(
43
4 pcc sag V
Z Z
Z V −
+=− Eq. 5-16
The voltage drop at the generator bus is43
4
Z Z
Z
+ times the voltage drop at the PCC. This voltage
drop becomes smaller for larger impedance to the PCC (weak connection) and for smallergenerator impedance (larger generator). The following examples show the impact of distributedgeneration on voltage sags for faults at different location with respect to the location of the DRand the point of interest where the voltage sag is measured.
Procedure
1. Draw one-line and impedance diagrams similar to those shown in Figure x.
2. Gather the following information:
Zsource
=
ZT0
. =
Where:
Zsource = (Distribution Bus Voltage)2
/Short ckt MVA feeding substation (high side)
ZT0
= Substation xformer Z * (Distribution Bus V)2 / Substation xformer MVA
Zsystem
= Zsource
+ ZT0
3. Look up the conductor reactance Zfeeder
/unit length – which is typically given in ohms perthousand feet of conductor.
Zfeeder
/ unit length =
4. Calculate Zsystem which is the impedance between the point of common coupling and the utilitysource.
Zsystem
= Zsource
+ ZT0
. =
5. Calculate the voltage at the point VPCC
, which is electrically equivalent to Vsag
, neglecting loadcurrent using the equation:

8/12/2019 Power Quality Impacts DG
http://slidepdf.com/reader/full/power-quality-impacts-dg 95/108
Guidelines for Power Quality and Reliability Assessment
5-17
lengthunitlength Z Z
lengthunitlength Z V
feeder system
feeder
pcc*/
*/
+= Eq. 5-17
_______ __________ =Vpcc Eq. 5-18
Where length is the distance in thousands of feet to the applied fault point.
Examples
For the example case, the impedance will be assumed to be all reactive. It should be noted thatfor underground cable the resistance is much higher in comparison to the reactance. In thosecases, it is best to use complex impedance throughout.
The electrical system that the cases will be based on is shown in Figure 5-6. The transmissionsupply system is 138 kV. The short-circuit level on the transmission side at the transmission/
distribution interface is 200 MVA. Transformer T0 (10/12/15 MVA) steps the voltage down to12,470 volts, and its impedance is 7%. There are two distribution feeders whose circuit breakersare labeled CB1 and CB2. Additionally, CB1 has a 2 MVA step-down transformer to 480 voltwhere all of the measurements will be made. The impedance of the transformer T1 is 7.5%, andit is connected delta/grounded-wye.
10 MVA
138/12.47 kV
Z=7%
TRANSMISSION
SYSTEM
2 MVA
12.47/0.48 kV
Z=7.5%
DG
T1
138 kV
200 MVA S.C.12.47 kV
T0
CB1
CB2
XFC
XFB
X
FA
Vpcc
Vsag
Figure 5-6
Sample One-Line Diagram With Varying Fault (Fx) Locations
The conductors on the tap and on the load-side of transformer T1 can be ignored. Both feedersuse 397.5-kcmil ACSR conductors. All faults in these cases will be three-phase faults. Assumethe fault will be applied a point FA in Figure 5-7, and pre-fault voltage is 100% of nominal (1per-unit).
8/12/2019 Power Quality Impacts DG
http://slidepdf.com/reader/full/power-quality-impacts-dg 96/108
Guidelines for Power Quality and Reliability Assessment
5-18
Case 1: Calculation Without Distributed Generation
In this case the fault is assumed to be at FA and varies in distance from the substation. Referringto Figure 5-7, we will calculate the voltage at the point V
PCC , which is electrically equivalent to
Vsag
, neglecting load current. First, we will find the voltage at the point of common coupling
which is the distribution bus:
lengthunitlength Z Z
lengthunitlength Z V
feeder system
feeder
pcc*/
*/
+=
Eq. 5-19
Zsystem is the impedance between the point of common coupling and the utility source. It isZsource + ZT0.
Ω== 778.0200
12470)12470(
2
MVA
volts Z source
Eq. 5-20
Ω== 09.110
12470*07.0)12470(
2
0 MVA
volts Z T
Eq. 5-21
Ω=+=+= 868.109.1778.00T source system Z Z Z Eq. 5-22
Z feeder
is the impedance between the point of common coupling and the fault. Since it varies, wewill multiply the reactance of the conductor (397.5-kcmil ACSR), which is .1101 ohms/1000 feettimes the distance from the point of common coupling to the variable point of application of thefault. For example at a distance of 5 miles:
sag pcc V V ==+
= 609.4.26*1101.868.1
4.26*1101. Eq. 5-23
0
0.1
0.2
0.3
0.4
0.5
0.6
0.7
0 1 2 3 4 5 6
Distance to the fault in miles
S
a g M a g n i t u d e i n p e r - u n i t
Figure 5-7Calculation of the Voltage at the Secondary of Transformer T1 Where the Distance Fromthe Distribution Bus to FA Varies (No Generation)
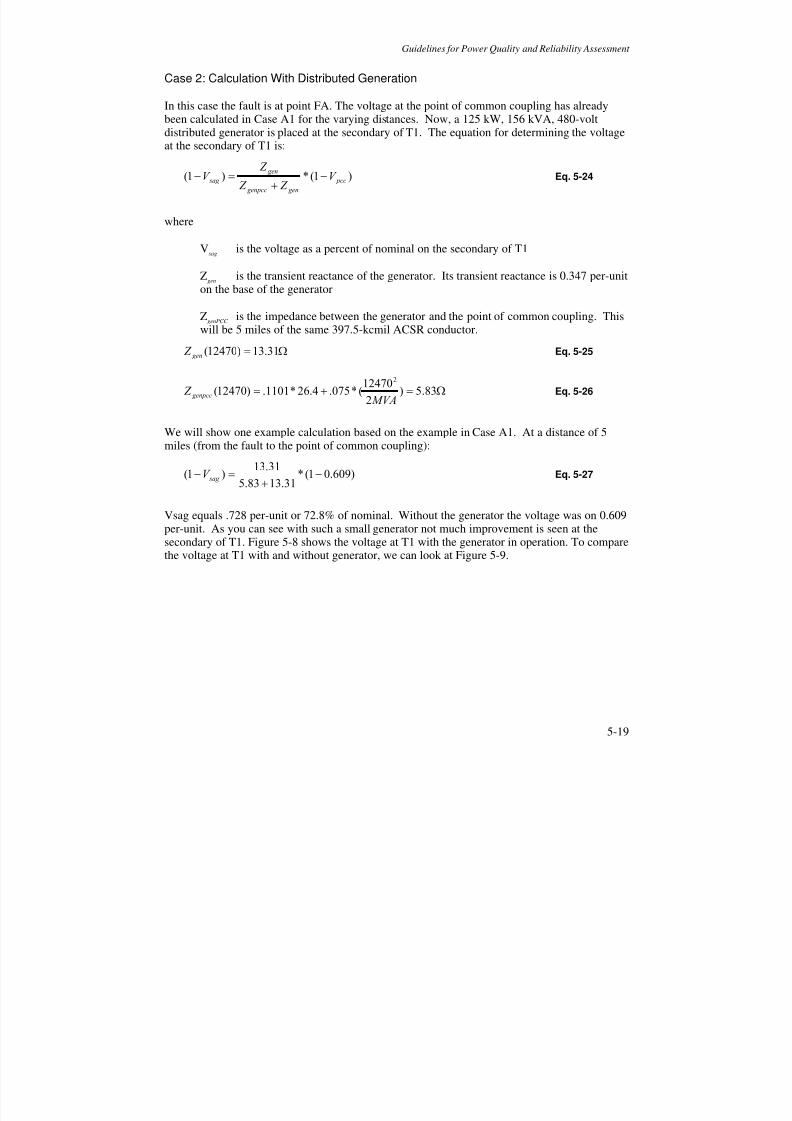
8/12/2019 Power Quality Impacts DG
http://slidepdf.com/reader/full/power-quality-impacts-dg 97/108
Guidelines for Power Quality and Reliability Assessment
5-19
Case 2: Calculation With Distributed Generation
In this case the fault is at point FA. The voltage at the point of common coupling has alreadybeen calculated in Case A1 for the varying distances. Now, a 125 kW, 156 kVA, 480-voltdistributed generator is placed at the secondary of T1. The equation for determining the voltage
at the secondary of T1 is:
)1(*)1( pcc
gen genpcc
gen
sag V Z Z
Z V −
+=− Eq. 5-24
where
Vsag
is the voltage as a percent of nominal on the secondary of T1
Zgen
is the transient reactance of the generator. Its transient reactance is 0.347 per-uniton the base of the generator
ZgenPCC
is the impedance between the generator and the point of common coupling. Thiswill be 5 miles of the same 397.5-kcmil ACSR conductor.
Ω= 31.13)12470( gen Z Eq. 5-25
Ω=+= 83.5)2
12470(*075.4.26*1101.)12470(
2
MVA Z genpcc Eq. 5-26
We will show one example calculation based on the example in Case A1. At a distance of 5miles (from the fault to the point of common coupling):
)609.01(*31.1383.5
31.13)1( −
+=− sag V Eq. 5-27
Vsag equals .728 per-unit or 72.8% of nominal. Without the generator the voltage was on 0.609per-unit. As you can see with such a small generator not much improvement is seen at thesecondary of T1. Figure 5-8 shows the voltage at T1 with the generator in operation. To comparethe voltage at T1 with and without generator, we can look at Figure 5-9.

8/12/2019 Power Quality Impacts DG
http://slidepdf.com/reader/full/power-quality-impacts-dg 98/108
Guidelines for Power Quality and Reliability Assessment
5-20
0
0.1
0.2
0.3
0.4
0.5
0.6
0.7
0.8
0 1 2 3 4 5 6
Distance (miles)
V o l t a g e i n p e r - u n i t o f n o m i n a l
Figure 5-8Calculation of the Voltage at the Secondary of Transformer T1 Where the Distance Fromthe Distribution Bus to FA Varies. There is a Small Generator at T1
0
0.1
0.2
0.3
0.4
0.5
0.6
0.7
0.8
0 1 2 3 4 5 6
Distance (miles)
V o l t a g e i n p e r - u n i t o f n o m i n a l
with generator
without generator
Figure 5-9Voltage at the Secondary of Transformer T1 With and Without Generator for Faults as FADistance Varies
Swell Assessment Procedure
Background
In the case of DR-caused temporary overvoltage or voltage swell conditions, some basicinformation about the type of distribution system, type of DR, the interconnection transformer,and the available protection schemes can help determine the likelihood of future problems.
8/12/2019 Power Quality Impacts DG
http://slidepdf.com/reader/full/power-quality-impacts-dg 99/108
Guidelines for Power Quality and Reliability Assessment
5-21
Therefore, navigating a flowchart with a few simple questions about the DR installation can helpscreen out configurations that may exhibit excessive voltage swell conditions.
Procedure
This screening provides a tool to check distributed generation installations forcharacteristics that are known to cause transient overvoltages. It is should not beconsidered foolproof and is most certainly not a substitute for an interconnectionstudy.
To determine if a distributed generation-caused overvoltage problems may resultfrom the installation under consideration, navigate the flowchart in Figure 5-10.
A result of “Pass” indicates that the installation does not possess any typicalcharacteristics that can lead to overvoltages. However, it is possible thatovervoltages will still occur.
The conclusion for further system study is based on the presence of one or moresystem characteristics that suggest transient overvoltages may be a problem atthe installation.
Distributed generation-related overvoltage considerations are directly related to the variousgrounding details of the installation. To that end, much of the information needed to navigate thefollowing flow chart involves the interconnection components that also affect the installation’sgrounding.
Examples
Case 1: Paper Mill A
A paper mill company decides to install a 4-MW gas-fired turbine to supply facility electricalpower and process steam. The installation will be connected in parallel with the utility grid inorder to sell excess capacity back to the grid. The utility circuit is a three-phase, four-wire multi-grounded neutral system. The interconnection transformer is a delta high side to delta low sideconfiguration, and there is not a 59G relay function or transfer trip protection scheme planned.
The flowchart for this configuration is shown in Figure 5-11. This example fails the screening,indicating that further study is needed. The primary reason why the system failed the screening isthat the system in not effectively grounded (the delta on the high side of the transformer is thegiveaway). More information on effective grounding can be found in EPRI report 1000419.
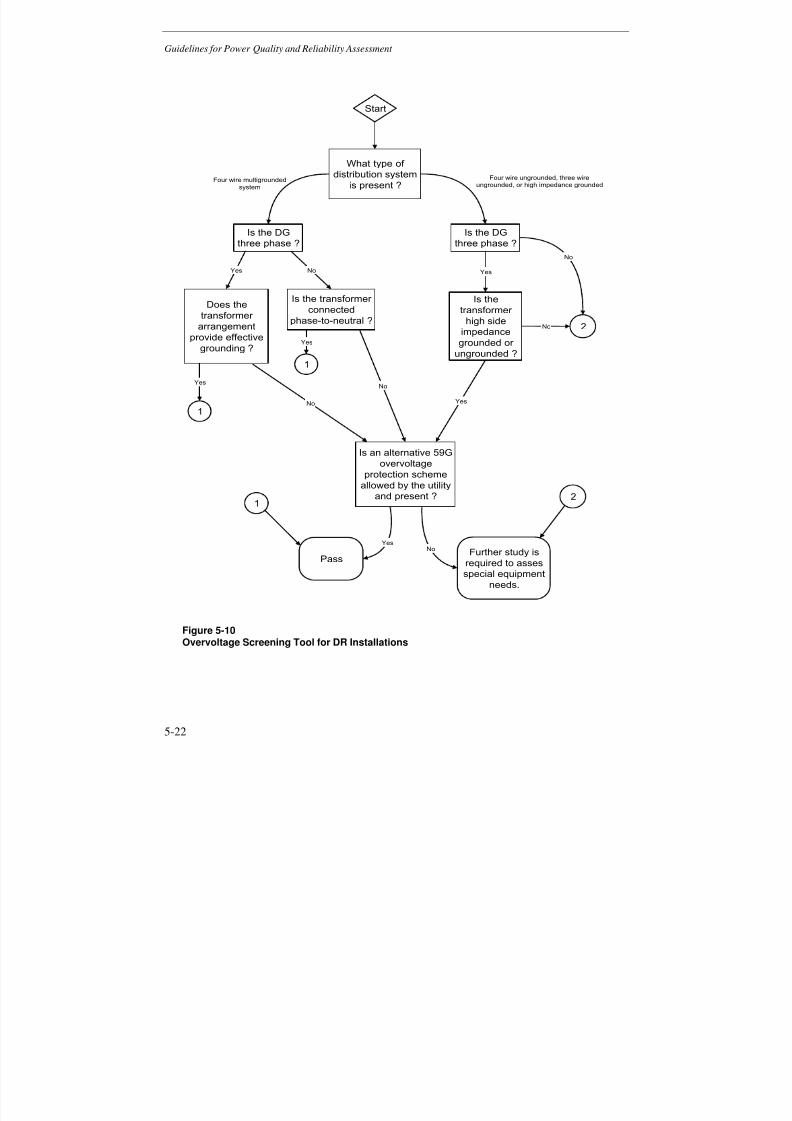
8/12/2019 Power Quality Impacts DG
http://slidepdf.com/reader/full/power-quality-impacts-dg 100/108
Guidelines for Power Quality and Reliability Assessment
5-22
What type of
distribution system
is present ?Four wire multigrounded
system
Four wire ungrounded, three wireungrounded, or high impedance grounded
Is the DG
three phase ?
Is the DG
three phase ?
Does thetransformer
arrangement
provide effective
grounding ?
Is the transformer connected
phase-to-neutral ?
NoYes
1
1
Is thetransformer
high side
impedance
grounded or
ungrounded ?
Yes
2
No
Yes
Yes
Is an alternative 59Govervoltage
protection scheme
allowed by the utility
and present ?
YesNo
No
Further study is
required to asses
special equipment
needs.
NoYes
Pass
1
Start
No
2
Figure 5-10Overvoltage Screening Tool for DR Installations
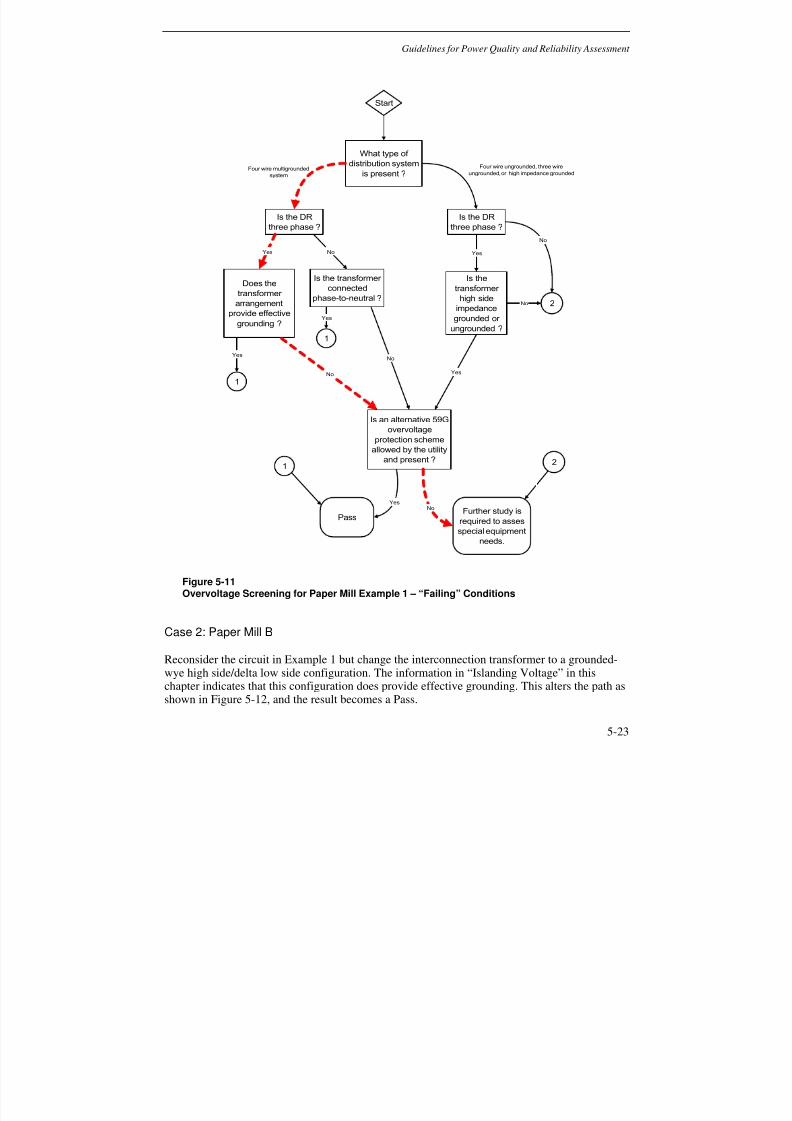
8/12/2019 Power Quality Impacts DG
http://slidepdf.com/reader/full/power-quality-impacts-dg 101/108
Guidelines for Power Quality and Reliability Assessment
5-23
What type of distribution system
is present ?Four wire multigrounded
system
Four wire ungrounded, three wire
ungrounded, or high impedance grounded
Is the DR
three phase ?
Is the DR
three phase ?
Does the
transformer
arrangementprovide effective
grounding ?
Is the transformer
connected
phase-to-neutral ?
NoYes
1
1
Is the
transformer
high side
impedance
grounded or
ungrounded ?
Yes
2
No
No
Yes
Yes
Is an alternative 59G
overvoltage
protection scheme
allowed by the utility
and present ?
YesNo
No
Further study is
required to asses
special equipment
needs.
NoYes
Pass
1
Start
2
Figure 5-11Overvoltage Screening for Paper Mill Example 1 – “Failing” Conditions
Case 2: Paper Mill B
Reconsider the circuit in Example 1 but change the interconnection transformer to a grounded-wye high side/delta low side configuration. The information in “Islanding Voltage” in thischapter indicates that this configuration does provide effective grounding. This alters the path asshown in Figure 5-12, and the result becomes a Pass.
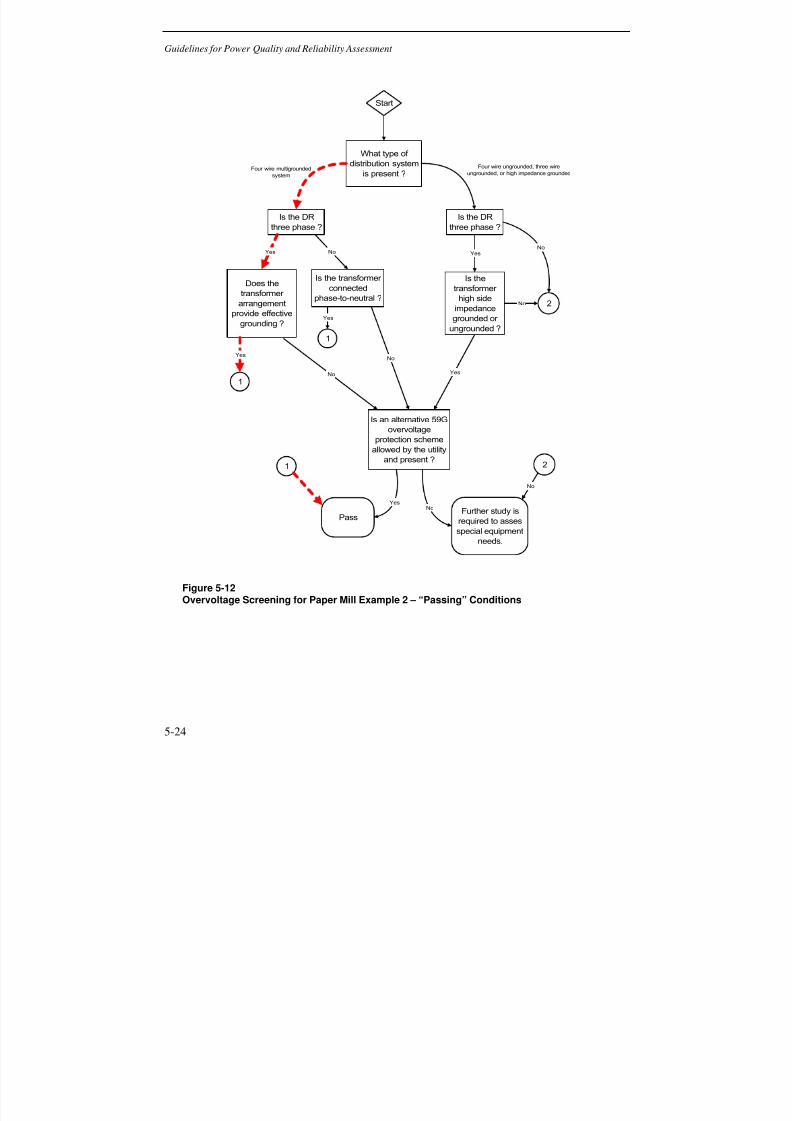
8/12/2019 Power Quality Impacts DG
http://slidepdf.com/reader/full/power-quality-impacts-dg 102/108
Guidelines for Power Quality and Reliability Assessment
5-24
What type of distribution system
is present ?Four wire multigrounded
system
Four wire ungrounded, three wire
ungrounded, or high impedance grounded
Is the DR
three phase ?
Is the DR
three phase ?
Does the
transformer
arrangementprovide effective
grounding ?
Is the transformer
connected
phase-to-neutral ?
NoYes
1
1
Is the
transformer
high side
impedance
grounded or
ungrounded ?
Yes
2
No
No
Yes
Yes
Is an alternative 59G
overvoltage
protection scheme
allowed by the utility
and present ?
YesNo
No
Further study is
required to asses
special equipment
needs.
NoYes
Pass
1
Start
2
No
Figure 5-12Overvoltage Screening for Paper Mill Example 2 – “Passing” Conditions

8/12/2019 Power Quality Impacts DG
http://slidepdf.com/reader/full/power-quality-impacts-dg 103/108
6-1
6APPLYING DR TO ENHANCE EQUIPMENT
PERFORMANCE
The previous sections overview measures of electric reliability and quality that can eitherpositively or negatively influenced by distributed generation and storage. Also covered are theexpected impacts of reduced PQ on end-use equipment, and procedures to assess quality andreliability when adding DR. In this section we will summarize the important aspects of eachsection and provide some conclusions ways to insure that a thoughtful engineering study(accomplished prior to the installation of a distributed generator), can result in an application thatactually improves the available uptime of the on site electrical equipment from a PQ andreliability standpoint.
In Chapters 2 and 3, the different electric reliability and quality measures that can be positivelyor negatively impacted by DR were described. The summaries of the PQ variations andreliability aspects that can be positively or negatively impacted are as follows:
• Positive Impacts of DR
- Transients (Lightning Related)- Momentary Voltage Sags (if DR has energy storage and trip time delay)- Power Service Availability
• Negative Impacts of DR- Momentary Voltage Swells- Voltage Fluctuations (Flicker)- Frequency Variations
• Possible Positive or Negative Impacts of DR
- Long Duration Variation (High and Low RMS)- Voltage Unbalance- Waveform Distortion (Harmonic Voltage and Current)
In Chapter 4 an overview of commercial and industrial equipment design and it’s sensitivity topower variations was detailed, while Chapter 5 followed with some engineering analysis
procedures to insure the best application of DR at or close to industrial and commercial facilities.The key tie in with respect to distributed generation is how the equipment performance may beeither improved or degraded by the installed DR. Table 6-1 was developed to summarize this tiein. The table lists quality and reliability measures, typical DR impacts, and the expectedperformance response of end-user equipment with DR installed.
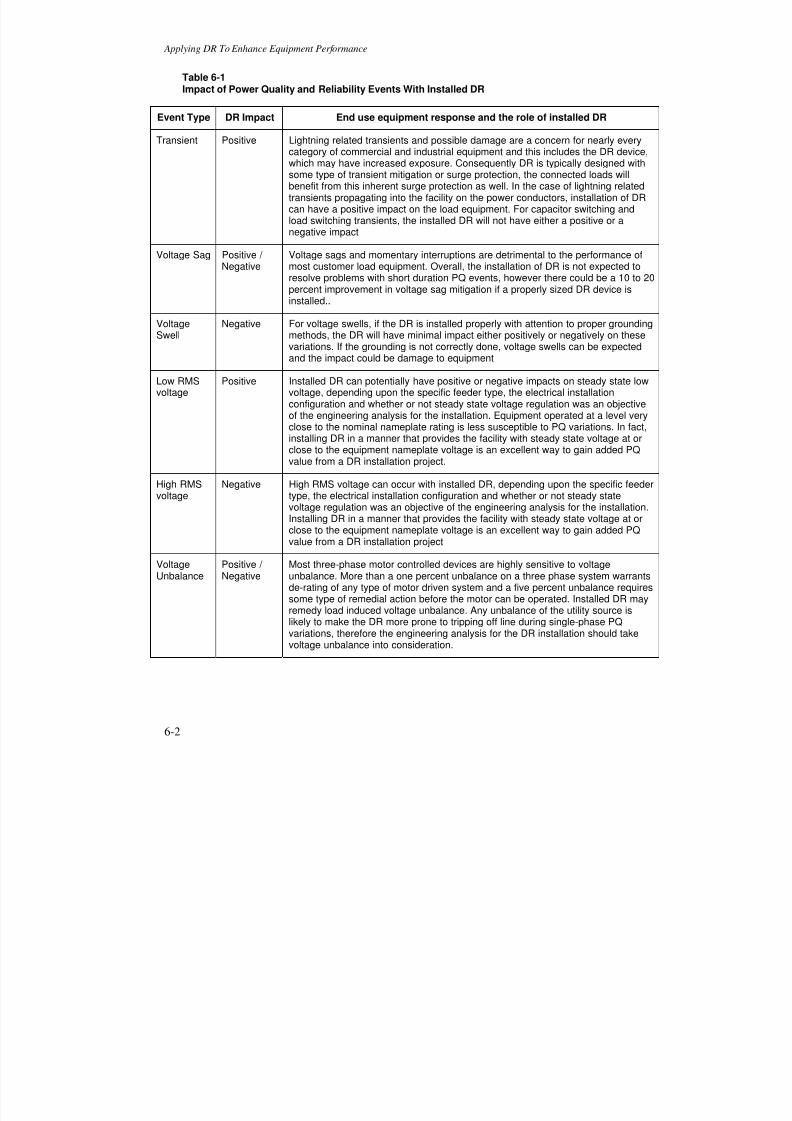
8/12/2019 Power Quality Impacts DG
http://slidepdf.com/reader/full/power-quality-impacts-dg 104/108
Applying DR To Enhance Equipment Performance
6-2
Table 6-1Impact of Power Quality and Reliability Events With Installed DR
Event Type DR Impact End use equipment response and the role of installed DR
Transient Positive Lightning related transients and possible damage are a concern for nearly every
category of commercial and industrial equipment and this includes the DR device,which may have increased exposure. Consequently DR is typically designed withsome type of transient mitigation or surge protection, the connected loads willbenefit from this inherent surge protection as well. In the case of lightning relatedtransients propagating into the facility on the power conductors, installation of DRcan have a positive impact on the load equipment. For capacitor switching andload switching transients, the installed DR will not have either a positive or anegative impact
Voltage Sag Positive /Negative
Voltage sags and momentary interruptions are detrimental to the performance ofmost customer load equipment. Overall, the installation of DR is not expected toresolve problems with short duration PQ events, however there could be a 10 to 20percent improvement in voltage sag mitigation if a properly sized DR device is
installed..
VoltageSwell
Negative For voltage swells, if the DR is installed properly with attention to proper groundingmethods, the DR will have minimal impact either positively or negatively on thesevariations. If the grounding is not correctly done, voltage swells can be expectedand the impact could be damage to equipment
Low RMSvoltage
Positive Installed DR can potentially have positive or negative impacts on steady state lowvoltage, depending upon the specific feeder type, the electrical installationconfiguration and whether or not steady state voltage regulation was an objectiveof the engineering analysis for the installation. Equipment operated at a level veryclose to the nominal nameplate rating is less susceptible to PQ variations. In fact,installing DR in a manner that provides the facility with steady state voltage at or
close to the equipment nameplate voltage is an excellent way to gain added PQvalue from a DR installation project.
High RMSvoltage
Negative High RMS voltage can occur with installed DR, depending upon the specific feedertype, the electrical installation configuration and whether or not steady statevoltage regulation was an objective of the engineering analysis for the installation.Installing DR in a manner that provides the facility with steady state voltage at orclose to the equipment nameplate voltage is an excellent way to gain added PQvalue from a DR installation project
VoltageUnbalance
Positive /Negative
Most three-phase motor controlled devices are highly sensitive to voltageunbalance. More than a one percent unbalance on a three phase system warrantsde-rating of any type of motor driven system and a five percent unbalance requiressome type of remedial action before the motor can be operated. Installed DR mayremedy load induced voltage unbalance. Any unbalance of the utility source islikely to make the DR more prone to tripping off line during single-phase PQvariations, therefore the engineering analysis for the DR installation should takevoltage unbalance into consideration.

8/12/2019 Power Quality Impacts DG
http://slidepdf.com/reader/full/power-quality-impacts-dg 105/108
Applying DR To Enhance Equipment Performance
6-3
Table 6-1 (cont.)Impact of Power Quality and Reliability Events With Installed DR
EventType
DR Impact End use equipment response and the role of installed DR
WaveformDistortion
Positive /Negative
The majority of load equipment is not overly sensitive to harmonic voltagedistortion, and in many cases, the rectifier power supply based load equipment isactually a harmonic current generation source. Installed DR can increase thelevel of voltage distortion of a facility if a low quality inverter is used to supportthe equipment in an isolated mode, or is used to grid connect. Alternatively if theDR is configured to provide harmonic current for some of the facilities harmonicgenerating loads, the voltage distortion on the facility bus can be decreased
Flicker Negative Many of the lighting technologies used in industrial and commercial facilities canproduce light flicker in the presence of voltage fluctuations. While flicker hasbeen a documented concern with some early installations of DR it is unlikely thatapplications close to facilities and facility loads will results in notable flickerproblems.
FrequencyVariation
Negative Variations in the 60Hz power frequency are not common, however, there is arequirement that installed DR devices have the ability to synchronize with andfollow the grid frequency during transitions from non-grid tie to grid tie mode.Unsynchronized transfers can result in nuisance tripping of controlled rectifierpower supplies and may even result in fuse blowing or rectifier power supplydamage. Beyond the grid synchronization requirement, it is unlikely thatfrequency variation problems will result through the application of DR devices.
Reliability Positive Installed DR will always improve power system reliability indices for the localfacility where it has been installed provided a comprehensive engineeringanalysis has been accomplished to insure distribution feeder and facilityprotective device coordination.

8/12/2019 Power Quality Impacts DG
http://slidepdf.com/reader/full/power-quality-impacts-dg 106/108

8/12/2019 Power Quality Impacts DG
http://slidepdf.com/reader/full/power-quality-impacts-dg 107/108

8/12/2019 Power Quality Impacts DG
http://slidepdf.com/reader/full/power-quality-impacts-dg 108/108