BODMIN AIR QUALITY MANAGEMENT AREA ACTION PLAN
81
BODMIN AIR QUALITY MANAGEMENT AREA ACTION PLAN DETAILED PLAN TO IMPROVE AIR QUALITY IN BODMIN FOLLOWING THE DECLARATION OF AN AIR QUALITY MANAGEMENT AREA September 2009 CORNWALL COUNCIL COMMUNITIES DIRECTORATE PUBLIC HEALTH AND PROTECTION SERVICE
Transcript of BODMIN AIR QUALITY MANAGEMENT AREA ACTION PLAN

BODMIN AIR QUALITY MANAGEMENT AREA
ACTION PLAN
DETAILED PLAN TO IMPROVE AIR QUALITY IN BODMIN
FOLLOWING THE DECLARATION OF AN AIR QUALITY MANAGEMENT AREA
September 2009
CORNWALL COUNCIL COMMUNITIES DIRECTORATE
PUBLIC HEALTH AND PROTECTION SERVICE
Bodmin AQMA Action Plan September 2009
The health of the population of Cornwall is of paramount importance to Cornwall Council; consequently the improvement of local air quality is a priority and is a key part of the Local Development Framework to reduce risks to health and advance the well being of the people of Cornwall. In July 2008 North Cornwall District Council declared an Air Quality Management Area (AQMA) in Bodmin; this declaration was based on the high levels of traffic-related nitrogen dioxide monitored in the town centre. This Action Plan has been produced in response to the AQMA declaration with the aim of reducing levels of nitrogen dioxide and other associated air pollutants through a variety of actions. This is an essential document for Cornwall Council, our community and our partners, as it gives a range of interventions which will contribute towards tackling poor air quality and ensure that future activities contribute to continually improve the quality of the air in our county for our residents and visitors. It is also important that the planned regeneration of Bodmin is used as an opportunity to examine ways to improve air quality at the same time as promoting the development of the town. Due to local authority re-organisation in Cornwall in April 2009 this work is being carried forward by the new Cornwall Council.
Lance Kennedy Cabinet Member for Stronger Communities

Bodmin AQMA Action Plan September 2009
Executive Summary 1 1.0 Policy context 3 2.0 Sources of air pollution in North Cornwall District 4 2.1 Health effects of air pollution 4
2.1.1 Nitrogen dioxide (NO2) 4 2.1.2 Particulate Matter (PM10) 4
3.0 The air quality action planning process in North Cornwall 5 3.1 Air quality monitoring 5 3.2 NCDC air quality assessment 6 3.3 Stage one and two – Update and Screening Assessments (1999, 2003) 6 3.4 Stage three – Detailed Assessment (2005) 6 3.5 4th Round Review and Assessment of Air Quality 6 3.6 Data summary 7 4.0 Air Quality Management Area (AQMA) 8 4.1 NCDC AQMA boundary consultation 9 4.2 NCDC AQMA Action Plan consultation 9 4.2.1 NCDC AQMA Action Plan on-line survey 10 4.3 The NCDC AQMA Steering Group 10 5.0 Pollution sources in North Cornwall 11 5.1 Local Issues in North Cornwall 11
5.1.1 Road traffic 11 5.1.2 Development 11 5.1.2.1The Bodmin Town Centre Framework Plan (BTCFP) 11
5.2 Pollution source apportionment 13 5.2.1 Dennison Rd, Bodmin 13 5.2.2 Vehicle flow rates 13 5.2.3 Traffic volume 14 5.2.4 Emission values and vehicle type source apportionment 14 5.2.5 Vehicle speed and emissions 16 5.2.6 Future reductions in emissions 17
5.3 NO2/traffic calculator – Dennison Rd 19 5.4 Source Apportionment Conclusions 20 6.0 Further work 21 7.0 Social Equity 22 7.1 Social and Economic Structure 22 7.2 Deprivation 22 7.2.1 Objective One/Convergence Funding 22
7.2.2 Index of Multiple Deprivation (IMD) 23 7.2.3 The link between social deprivation and air pollution 23 7.2.4 Social Exclusion Unit (SEU) 24 7.2.5 The Future of Transport White Paper 24 7.2.6 The Rogers Review 24
8.0 Associated local policies, programmes and strategies 25 8.1 Cornwall Air Quality Strategy 25 8.2 North Cornwall District Council Local Plan 25 8.3 Bodmin Town Centre Framework Plan 25 8.4 Bodmin Masterplan 26 8.5 North Cornwall Local Development Framework 26 8.6 North Cornwall Community Strategy 26
Bodmin AQMA Action Plan September 2009
8.7 Sustainable Community Strategy for Cornwall 26 8.8 Cornwall Local Transport Plan (LTP2) 2006 – 2011 27 8.9 Draft Regional Spatial Strategy 28 9.0 Proposed actions to reduce the level of traffic-related pollutants 29 Table 7. SMART Targets 30 Table 8. Continuous Measures 31 Table 9. Continuous Measures (cont) 32 Table 10. Investigative Actions 33 9.1 (a) Details of actions SMART Targets (Table 6) 34
Action 1: Prioritising the implementation of Safer Routes to School 34 Action 2: Support companies in developing Travel Plans 34 Action 3: Improvement of the walking environment 35 Action 4: Improvement of the cycling environment 35 Action 5: Traffic Signals (1) 36
9.1 (b) Details of actions Continuous Measures (Table 7) 36
Action 6: Improve the Emission Standards of the Council Fleet 36 Action 7: Minimise emissions from vehicle fleets in the AQMA 37
7. 1Reducing emissions by improvements in vehicle stock 37 7.2 Reducing emission factors (NOx) by vehicle and fuel improvements 38 7.3 Emission factors; nitrogen dioxide 38 7.4 Scrappage schemes 38 7.5 Climate change and health impacts 39 Action 7 Summary 40 Action 8: Ongoing monitoring of traffic and air pollutants 40 Action 9: Require TPs to be submitted with planning applications 40 Action 10: Promote TPs for existing businesses and transport awareness 41 Action 11: Promotion of walking – initiatives 41 Action 12: Promotion of cycling – initiatives 41 Action 13: Work with BTCFP 42 Action 14: Presumption in favour of mixed use development 42 Action 15: Promote awareness of traffic-related air quality issues 42 Action 16: Improve access to information regarding transport options 42 Action 17: Promote Sustainable Networks (Cycling & Walking) 43 9.1 (c) Details of actions Investigative Actions (Table 8) 43 Action 18: Roadside vehicle emission testing 43 Action 19: Examine the movement of HGVs in the area 44 Action 20: Junction Improvements 44 Action 21: Parking Controls 44 Action 22: Traffic Signals (2) 44 Action 23: Transportation Management 45 Action 24: Road changes/ improvements for consideration 45 Action 25: Road/rail timetable link 45 10.0 Summary 46 DEFRA Action planning requirements compliance checklist 47 References 48 Action Plan Project Milestones 50

Bodmin AQMA Action Plan September 2009
Tables Table 1. National Air Quality Strategy objective values 3 Table 2. Contribution by vehicle class to traffic volume and NO2 emissions at 40 km/h (24 mph) 15 Table 3. Sites exceeding NAQS objectives for NO2 and NETCEN background values 17 Table 4. Summary of Appendix 4, Table 2. NO2/traffic calculator traffic numbers 19 Table 5. Change in % of flow that relates to the reduction in NO2 concentrations shown in Table 5 19 Table 6. IMD ranking for Bodmin sub-wards in North Cornwall and England. 23 Table 7. Bodmin Transport Programme (CCC, LTP2, Table 6.8). 27 Table 11. Emission factors for Rigid HGVs (NAEI, 2007) 38 Tables: Section 9 Actions Table 8. Smart Targets 30 Table 9. Continuous Measures 31 Table 10. Investigative Actions 33 Plates Plate 1. Diffusion tube sites in the centre of Bodmin. 5 Plate 2. AirPointer continuous NO2 monitor, Dennison Rd 5 Plate 3. Bodmin AQMA area. Option Three 8 Plate 4. Proximity of residential properties to the roadside in Dennison Rd 11 Plate 5. Proposed developments detailed by the BTCFP 12 Plate 6. Reduction required in ambient NO2 concentrations – Dennison Rd 18 Plate 7. Reduction required in ambient NO2 concentrations – St Leonards 18 Figures Figure 1. Dennison Rd diffusion tube results, September 2004 – June 2008. 7 Figure 2 (a). Daily traffic flow averaged over 1 month periods 14 Figure 2 (b). Hourly traffic, averaged over the whole monitoring period 14 Figure 3. Contribution by vehicle class to traffic volume and NO2 emissions 15 Figure 4. Contributions of different vehicle categories to total NOx emissions 15 Figure 5 (a). Hourly averaged NOx emissions of different vehicle categories 16 Figure 5 (b). Hourly averaged NOx emissions Monday to Fridays only 16 Figure 6. North Cornwall population age distribution 22 Appendices Appendix 1. Bodmin AQMA Boundary Options Appendix 2. Bodmin Online Survey Report Appendix 3. Bodmin Steering Group Details Appendix 4. NO2-traffic calculator Appendix 5. HGV Survey Bodmin Appendix 6. North Cornwall School Travel Plan Status Appendix 7. Walk to School Survey Bodmin Appendix 8. Euro Standards Appendix 9. Glossary
Bodmin AQMA Action Plan September 2009 1
Executive Summary On 1st April 2009 Cornwall will become a Unitary Authority and the six Local Authority areas, including North Cornwall District Council (NCDC) will cease to exist. After this date the Review and Assessment of air quality in Cornwall will become the responsibility of Cornwall Council (CC) as will the actions detailed in this Action Plan. North Cornwall District Council’s Review and Assessment process (NCDC, 2005) identified areas in Bodmin where National Air Quality Strategy (NAQS) objective (DEFRA, 2007) values were exceeded and road traffic was identified as the sole source of pollution. The NCDC 2005 Detailed Assessment concluded that the NAQS annual objective for nitrogen dioxide (NO2) (40 µg m-3) would not be met in Dennison Road therefore, in accordance with its statutory duties, an Air Quality Management Area (AQMA) was declared (July 2008). The main aim of the Air Quality Management process is to bring about improvements in health and to this end, the Bodmin Action Plan aims to reduce the exposure of people within the AQMA below those levels of air pollution that are recognised by government experts to be potentially damaging to human health. Due to modernisation of the UK vehicle fleet, future traffic-related emissions should reduce. There is however, some uncertainty regarding the validity of the projected nitrogen oxides (NOx) emission rates for future years and emission control technologies. Nationally, whilst a steady reduction in NOx emissions (and therefore NO2 concentrations) would have been expected over the past decade, in practice they have generally remained static or increased. One possible cause could be an increase in direct (primary) NO2 emissions, as against nitrogen oxide (NO) which reacts with ozone (O3) to form NO2. Following the declaration of the AQMA work has continued to assess present and future concentrations of traffic-related pollutants in this area. This work includes monitoring and modelling and this indicates that NO2
concentrations in this area will rise further unless action is taken. The situation is further complicated as CC are supporting (through the Bodmin Town Centre Framework Plan (BTCFP Plan)) significant development of brownfield sites within the Bodmin AQMA area. Some of these development sites are within the AQMA area and may have an air quality impact. As part of the AQMA process NCDC had a statutory duty to produce an AQMA Action Plan (AQAP) which will set out the initial measures that will be taken to achieve a reduction in traffic-related NO2 concentrations in the Bodmin area. Reduction of NO2 concentrations is necessary in order to protect public health and to meet UK National Air Quality Strategy (NAQS) annual objectives for NO2. The costs and benefits of the measures considered in this plan are assessed, together with any wider environmental, social or economic impacts. It is worth noting that NO2 is a good proxy measure for all traffic-related pollutants (PM10s, PAHs etc). Therefore, where NO2 exceedences occur the presence of other, more health damaging traffic-related pollutants is implicit. The monitoring data in this report focuses mainly on NO2 and although the health effects of NO2 are not as significant as those associated with exposure to other traffic-related pollutants, as stated above, NO2 is considered to be a good proxy measure for the monitoring of other traffic-related pollutants. As well as reducing levels of NO2, these actions will also reduce airborne particulate matter (which has profound human health impacts) and carbon dioxide emissions (which have a climate forcing function). This AQAP has therefore been drawn up to investigate and assess the various options available to tackle pollution levels in and around the AQMA, in particular those from road traffic. The actions in this Action Plan are those which are currently considered to be the most cost effective and appropriate. They have been drawn up following a consultation process and have been reviewed by the Bodmin AQMA Steering Group. As the AQMA, or the area adjacent, has no significant industry that emits to air, traffic-related pollution has been assessed as being the sole source of air pollution and hence several key aims have been identified in this Action Plan which will lead to improvements in air quality:
Bodmin AQMA Action Plan September 2009 2
• Advising and informing the public about the air quality issues in North Cornwall • Advising and informing the public about more efficient energy use • Improving traffic management to reduce congestion • Reducing emissions from HGVs and buses • Encourage the increased use of cleaner vehicle technologies • Encourage the use of public transport systems • Encourage and supporting the implementation of Travel Plans • Encourage walking and cycling • Encourage those involved in the design and location of development to reduce/minimise the impacts to
air quality Other measures such as Travel Plans (TPs), raising awareness and home energy efficiency programmes will also have a positive impact on air quality. Still under consideration are the use of Local Authority (LA) powers for road side emission testing (Road Traffic (Vehicle Emissions) Regulations 2003) and the use of the new powers granted to ensure parked vehicles switch off engines. An in-depth study of this package of measures is made in this Action Plan, and it is concluded that the measures detailed in this Action Plan will result in a reduction in NO2 concentrations to a sufficient level to meet Government Objective levels by 2010. CC will continue to monitor pollution levels in the Bodmin area to confirm the target reductions and aims to be in a position to revoke the AQMA designation when appropriate.
Bodmin AQMA Action Plan September 2009 3
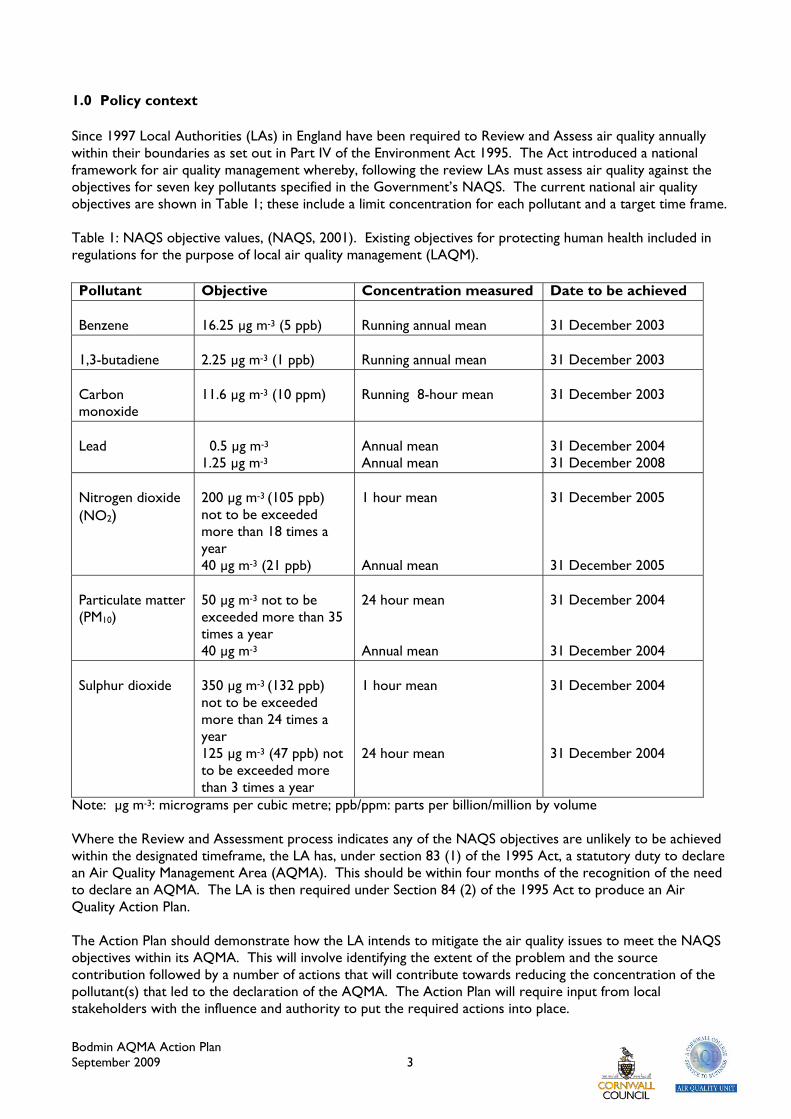
1.0 Policy context Since 1997 Local Authorities (LAs) in England have been required to Review and Assess air quality annually within their boundaries as set out in Part IV of the Environment Act 1995. The Act introduced a national framework for air quality management whereby, following the review LAs must assess air quality against the objectives for seven key pollutants specified in the Government’s NAQS. The current national air quality objectives are shown in Table 1; these include a limit concentration for each pollutant and a target time frame. Table 1: NAQS objective values, (NAQS, 2001). Existing objectives for protecting human health included in regulations for the purpose of local air quality management (LAQM).
Note: µg m-3: micrograms per cubic metre; ppb/ppm: parts per billion/million by volume Where the Review and Assessment process indicates any of the NAQS objectives are unlikely to be achieved within the designated timeframe, the LA has, under section 83 (1) of the 1995 Act, a statutory duty to declare an Air Quality Management Area (AQMA). This should be within four months of the recognition of the need to declare an AQMA. The LA is then required under Section 84 (2) of the 1995 Act to produce an Air Quality Action Plan. The Action Plan should demonstrate how the LA intends to mitigate the air quality issues to meet the NAQS objectives within its AQMA. This will involve identifying the extent of the problem and the source contribution followed by a number of actions that will contribute towards reducing the concentration of the pollutant(s) that led to the declaration of the AQMA. The Action Plan will require input from local stakeholders with the influence and authority to put the required actions into place.
Pollutant Objective Concentration measured Date to be achieved Benzene
16.25 µg m-3 (5 ppb)
Running annual mean
31 December 2003
1,3-butadiene
2.25 µg m-3 (1 ppb)
Running annual mean
31 December 2003
Carbon monoxide
11.6 µg m-3 (10 ppm)
Running 8-hour mean
31 December 2003
Lead
0.5 µg m-3
1.25 µg m-3
Annual mean Annual mean
31 December 2004 31 December 2008
Nitrogen dioxide (NO2)
200 µg m-3 (105 ppb) not to be exceeded more than 18 times a year 40 µg m-3 (21 ppb)
1 hour mean Annual mean
31 December 2005 31 December 2005
Particulate matter (PM10)
50 µg m-3 not to be exceeded more than 35 times a year 40 µg m-3
24 hour mean Annual mean
31 December 2004 31 December 2004
Sulphur dioxide
350 µg m-3 (132 ppb) not to be exceeded more than 24 times a year 125 µg m-3 (47 ppb) not to be exceeded more than 3 times a year
1 hour mean 24 hour mean
31 December 2004 31 December 2004

Bodmin AQMA Action Plan September 2009 4
2.0 Sources of air pollution in North Cornwall There are no significant emissions from primary industry in North Cornwall, and consequently the major source of air pollution is road vehicle emissions. The pollutants of most concern in North Cornwall are traffic-related fine airborne particulate matter below 10 microns in diameter (PM10) and nitrogen dioxide (NO2). Source apportionment was undertaken for the NCDC Air Quality Stage 4 Review and Assessment Technical Document and is fully addressed in Section 5.0 of this document. 2.1 Health effects of air pollution Whilst all traffic-related pollution has implications for health, NO2 and PM10 are the most commonly monitored. Although the health effects of NO2 are not as significant as those associated with exposure to PM10, NO2 is considered to be a good proxy measure for the monitoring of other traffic-related pollutants.
2.1.1 Nitrogen dioxide (NO2)
NO2 can cause damage to cell membranes and proteins and may also increase reactivity to natural allergens. At relatively high NO2 concentrations it can cause acute inflammation of the airways. Additionally, short-term exposures can have a detrimental effect on the immune cells of the airways and may cause predisposed people to suffer an increased risk of respiratory infections. Exposure to NO2 may put children at increased risk of respiratory infection and may lead to reduced lung function in later life.
2.1.2 Particulate Matter While healthy individuals are unlikely to experience acute effects at typical particulate matter air pollution concentrations, there is good evidence of associations of particulate matter pollution concentrations with advanced mortality, chronic illness and discomfort for sensitive groups (Brunekreef, et al., 2002). Recent research (Miller et al. 2007) has shown long-term exposure to fine particulate air pollution is associated with the incidence of cardiovascular disease and death among postmenopausal women. Peters (2007) found that among the 1,759 teenagers, those who had grown up in the most polluted areas had the worst lung function - less than 80% of the lung function expected for their age and that high levels of air pollution were found to increase the risk of retarded lung development five-fold. Particles < 10 microns in diameter (PM10) from any origin worsen heart and breathing problems in sensitive groups and can affect the quality of life for all.
Bodmin AQMA Action Plan September 2009 5
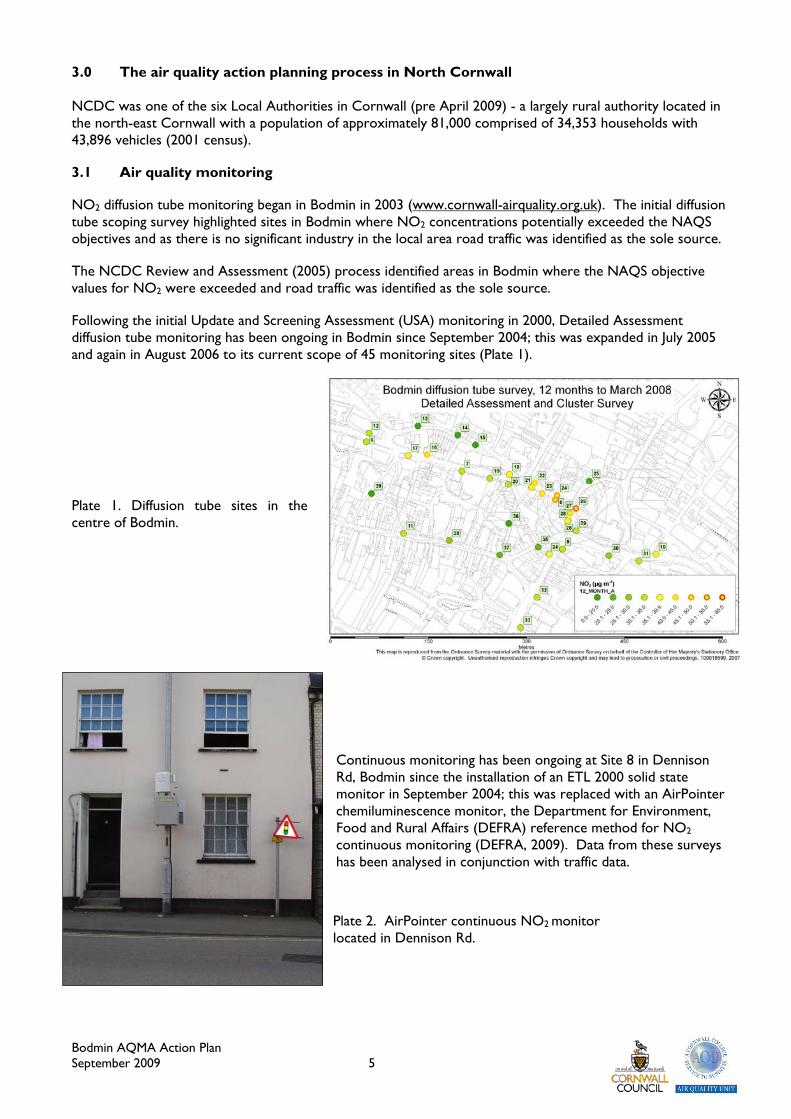
3.0 The air quality action planning process in North Cornwall NCDC was one of the six Local Authorities in Cornwall (pre April 2009) - a largely rural authority located in the north-east Cornwall with a population of approximately 81,000 comprised of 34,353 households with 43,896 vehicles (2001 census). 3.1 Air quality monitoring NO2 diffusion tube monitoring began in Bodmin in 2003 (www.cornwall-airquality.org.uk). The initial diffusion tube scoping survey highlighted sites in Bodmin where NO2 concentrations potentially exceeded the NAQS objectives and as there is no significant industry in the local area road traffic was identified as the sole source. The NCDC Review and Assessment (2005) process identified areas in Bodmin where the NAQS objective values for NO2 were exceeded and road traffic was identified as the sole source. Following the initial Update and Screening Assessment (USA) monitoring in 2000, Detailed Assessment diffusion tube monitoring has been ongoing in Bodmin since September 2004; this was expanded in July 2005 and again in August 2006 to its current scope of 45 monitoring sites (Plate 1). Plate 1. Diffusion tube sites in the centre of Bodmin.
Continuous monitoring has been ongoing at Site 8 in Dennison Rd, Bodmin since the installation of an ETL 2000 solid state monitor in September 2004; this was replaced with an AirPointer chemiluminescence monitor, the Department for Environment, Food and Rural Affairs (DEFRA) reference method for NO2 continuous monitoring (DEFRA, 2009). Data from these surveys has been analysed in conjunction with traffic data.
Plate 2. AirPointer continuous NO2 monitor located in Dennison Rd.

Bodmin AQMA Action Plan September 2009 6
3.2 NCDC air quality assessment As part of its statutory duty to assess ambient air quality, NCDC undertook Stage 1 of the Updating and Screening Assessment (USA) in 2000, Stage 2 USA in 2003, their Detailed Assessment in 2005 and the 4th Round Review and Assessment of Air Quality: Further Assessment (NCDC, 2008). 3.3 Stage one and two – Update and Screening Assessments (USA) (2003) Stage one of the USA was submitted to the DETR in January 2000 identifying areas that may require further assessment, it also acted as a benchmark for which further air quality assessments could be made. Stage two of the USA was completed and submitted to DEFRA inline with the Government timetable and requirements set out in the LAQM.TG(03) and LAQM.PG(03) in December 2003. The review and assessment included the seven pollutants of concern identified in the UK NAQS. The 2003 USA recommended proceeding to a further assessment as a result of NO2 concentrations potentially exceeding the NAQS annual objective value of 40 µg m-3 at a number of sites along the A389 Bodmin inner bypass (Dennison Rd, Pool St and St. Nicholas St).
3.4 Stage Three – Detailed Assessment (2005) A draft Detailed Assessment was due to be submitted to DEFRA by April 2005; however the Detailed Assessment did not begin until September 2005 so a later submission date was agreed between the two parties. After the Stage Two USA an 8-week diffusion tube scoping survey was carried out by the Air Quality Unit (AQU) at Cornwall College to identify the boundaries for the Further Assessment and pollution ‘hotspots’ suitable for continuous monitoring. From this survey 11 sites were identified along the A389 corridor as having NO2 concentrations that potentially exceed the NAQS objectives. A 12-month diffusion tube survey commenced in September 2004 and an ETL 2000 continuous monitor was installed in Dennison Rd at the site of highest recorded NO2 concentration. The monitoring revealed that concentrations of NO2 were consistently above the NAQS objective of 40 µg m-3 in Dennison Rd. Furthermore, a diurnal comparison of the ETL data and an automatic traffic counter reiterated the correlation between traffic flow and pollution episodes. 3.5 4th Round Review and Assessment of Air Quality: Further Assessment (August 2008) The 4th round of Review and Assessment of air quality in the AQMA in Bodmin, used guidance provided by DEFRA on the further (“Stage 4”) assessments of air quality required under section 84 of the Environment Act 1995. With reference to the DEFRA Further Assessment Guidance, this report assessed data collected since the North Cornwall District Council (NCDC) Detailed Assessment was submitted in 2005 and concluded that the declaration of the AQMA remained valid and did not require amendment. NCDC formally declared the Bodmin AQMA on the 2nd July 2008 on the basis of monitored exceedences of the NAQS annual objective for NO2, as reported in the 2005 Detailed Assessment. The declared AQMA extent includes all areas of NAQS exceedence (Dennison Rd and Higher Bore St) as well as areas of proposed redevelopment outlined in the Bodmin Town Centre Framework Plan (BTCFP). The proposed redevelopment of Bodmin town centre may alter traffic flow dynamics and create new pollution hotspots; therefore CC are working closely with planners, consultants and developers to maintain that air quality and related public health issues remain a high priority.

Bodmin AQMA Action Plan September 2009 7
3.6 Data Summary Figure 1 shows a summary of 47 months diffusion tube data recorded at Site 8 Dennison Rd, Bodmin. The average NO2 concentration recorded over this period was 47.18 µg m-3; the line shows the NAQS objective value of 40 µg m-3 as an annual average, thus illustrating the consistent exceedence of the NAQS annual objective at this site. Figure 1. Dennison Rd diffusion tube results, September 2004 – July 2008. As a result of the conclusions of the Detailed Assessment, an AQMA was declared for the Dennison Rd site in July 2008.
Bodmin AQMA Action Plan September 2009 8
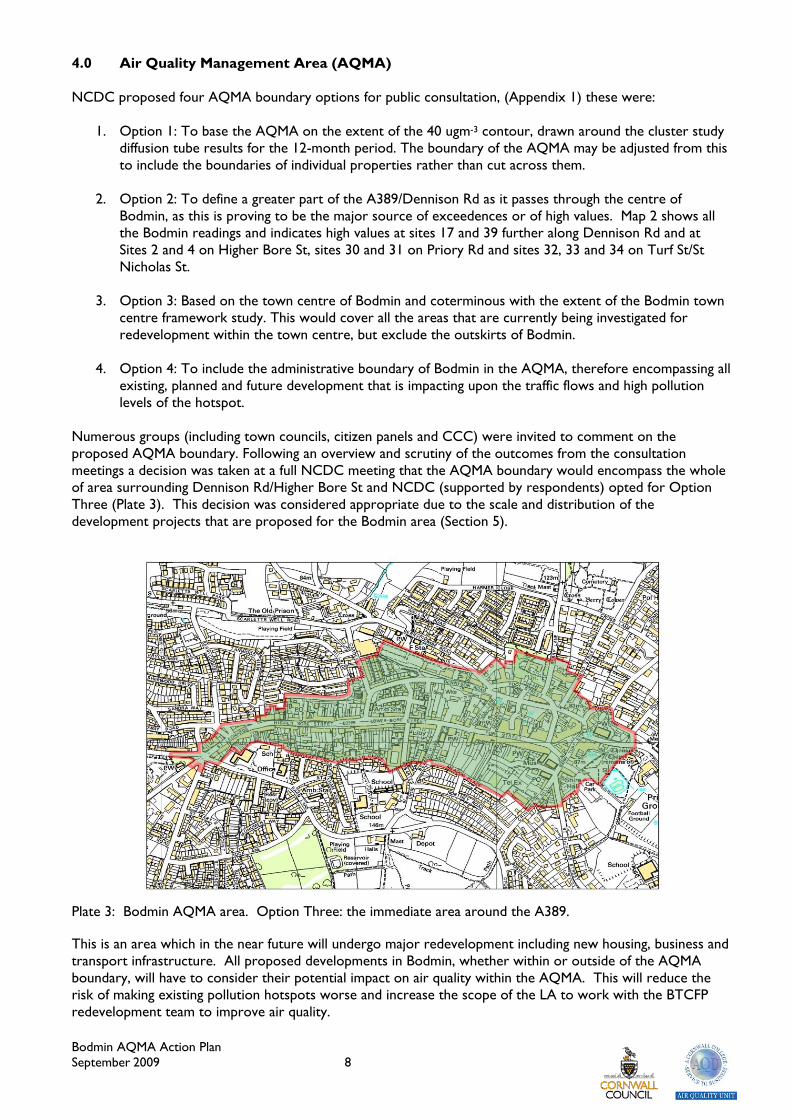
4.0 Air Quality Management Area (AQMA) NCDC proposed four AQMA boundary options for public consultation, (Appendix 1) these were:
1. Option 1: To base the AQMA on the extent of the 40 ugm-3 contour, drawn around the cluster study diffusion tube results for the 12-month period. The boundary of the AQMA may be adjusted from this to include the boundaries of individual properties rather than cut across them.
2. Option 2: To define a greater part of the A389/Dennison Rd as it passes through the centre of
Bodmin, as this is proving to be the major source of exceedences or of high values. Map 2 shows all the Bodmin readings and indicates high values at sites 17 and 39 further along Dennison Rd and at Sites 2 and 4 on Higher Bore St, sites 30 and 31 on Priory Rd and sites 32, 33 and 34 on Turf St/St Nicholas St.
3. Option 3: Based on the town centre of Bodmin and coterminous with the extent of the Bodmin town
centre framework study. This would cover all the areas that are currently being investigated for redevelopment within the town centre, but exclude the outskirts of Bodmin.
4. Option 4: To include the administrative boundary of Bodmin in the AQMA, therefore encompassing all
existing, planned and future development that is impacting upon the traffic flows and high pollution levels of the hotspot.
Numerous groups (including town councils, citizen panels and CCC) were invited to comment on the proposed AQMA boundary. Following an overview and scrutiny of the outcomes from the consultation meetings a decision was taken at a full NCDC meeting that the AQMA boundary would encompass the whole of area surrounding Dennison Rd/Higher Bore St and NCDC (supported by respondents) opted for Option Three (Plate 3). This decision was considered appropriate due to the scale and distribution of the development projects that are proposed for the Bodmin area (Section 5). Plate 3: Bodmin AQMA area. Option Three: the immediate area around the A389. This is an area which in the near future will undergo major redevelopment including new housing, business and transport infrastructure. All proposed developments in Bodmin, whether within or outside of the AQMA boundary, will have to consider their potential impact on air quality within the AQMA. This will reduce the risk of making existing pollution hotspots worse and increase the scope of the LA to work with the BTCFP redevelopment team to improve air quality.

Bodmin AQMA Action Plan September 2009 9
The selected AQMA boundary was submitted to DEFRA and formally declared on 2nd July 2008. The declaration was announced in the “This is Cornwall” newspaper and website (www.thisiscornwall.co.uk), on the NCDC website and the NETCEN LAQM website (http://www.airquality.co.uk/archive/laqm/list.php). Copies of the AQMA declaration were sent to:
• DEFRA • Bodmin AQMA stakeholders • CCC Transportation Department • NCDC Head of Development Control • Bodmin Town Council • Cornwall College AQU
4.1 AQMA boundary consultation The outcomes from the consultations were incorporated into the NCDC Detailed Assessment which was accepted by DEFRA in December 2005. Prior to the declaration of the AQMA NCDC undertook a series of consultation exercises. The following groups and organisations were invited to contribute towards a decision on the AQMA boundary size:
• NCDC management team • Bodmin Town Council • NCDC Planning • NCDC Strategy and Regeneration • NCDC Head of Environmental Health • CCC Highways and Transportation • CCC Planning • AQU Cornwall College • Environment Agency • Cornwall & Isles of Scilly PCT • Restormel Borough Council • Caradon District Council • Local Councillors, Chair and Vice Chair of Community Services Committee • Chair and Vice Chair of NCDC
4.2 AQMA AP consultation In the production of this Action Plan NCDC attempted to involve all relevant parties as outlined in the Environment Act 1995 and consultation with these groups and individuals occurred throughout the process. The public have been kept informed and their comments and suggestions sought through the use of the local media, the production of an information leaflet and an online survey. Residents within the Bodmin AQMA and local businesses were targeted directly. However, publicity campaigns prior to the declaration of the Bodmin AQMA received little response from these sectors. Local businesses and the bodies responsible for the local strategies detailed in Section 5 have all been informed of the aims and proposed actions of the Bodmin AQMA AP and have been canvassed for their comments and opinions. The population of North Cornwall district has been notified of the aims and proposed actions of the Bodmin AQMA AP via a newspaper publicity campaign and their views and comments sought via an on-line survey during December 2008 - February 2009. The results from the survey are given in Appendix 2 and have been used to assess the impact of specific actions.
Bodmin AQMA Action Plan September 2009 10
Since the declaration of the Bodmin AQMA, news concerning the AQMA and the Action Plan has been disseminated consultatively to the general public in a variety of ways;
• NCDC Environmental Health News Bulletin • NCDC website • CAQF meetings • CAQF website (www.cornwall-airquality.org.uk) • CCC website and Intranet site • Publication of AQMA AP progress in The West Briton newspaper • Public meetings • On-line survey - AQU and NCDC websites.
All specified documents about air quality are available from CC for inspection or (at a charge) to take away.
4.2.1 Bodmin AQMA AP on-line survey
The Environmental Protection Section of NCDC (in partnership with the AQU at Cornwall College and CCC) undertook an on-line survey to determine the transport and travel habits of people within the community. The survey was designed to aid the development of this Action Plan. A press release in relation to the on-line survey was issued to all local media by NCDC, and staff members within NCDC, CCC and Cornwall College were made aware of the survey through internal communication methods. The survey was also publicised at BTCFP meetings. The survey which ran from 1st December – 28th February 2009 was made available on the North Cornwall website, the CAQF website and paper copies were available on request. The survey was considered to have been a limited success (136 responses) and respondents highlighted a number of issues that the Action Plan will need to address. Briefly these included the need to:
• Encourage use of Public Transport, particularly through the integration of bus/rail timetables • Discourage use of petrol/diesel vehicles for short journeys • Encourage car sharing
Results of the survey showed that respondents overwhelmingly used their cars for local journeys, and of those who commuted into the town, many expressed dissatisfaction with the lack of an integrated bus and rail timetable. Results of the survey are given in Appendix 2. 4.3 The Bodmin AQMA Steering Group The Bodmin AQMA Steering Group is comprised of a core group that directs the work closely and an advisory steering group with a wider representation. A number of working sub-groups were formed to undertake specific tasks such as organising publicity and arranging consultation exercises. Details of the structure of the Bodmin AQMA Steering Group, its representative bodies and members, and the justification for their inclusion are given in Appendix 3. The Steering Group has held regular meetings during the Action Plan process in order to get feedback from each party and enable their contributions to be reflected in the document. The Action Plan project milestones are set out in Section 10.
Bodmin AQMA Action Plan September 2009 11
5.0 Pollution sources in North Cornwall 5.1 Local issues in North Cornwall
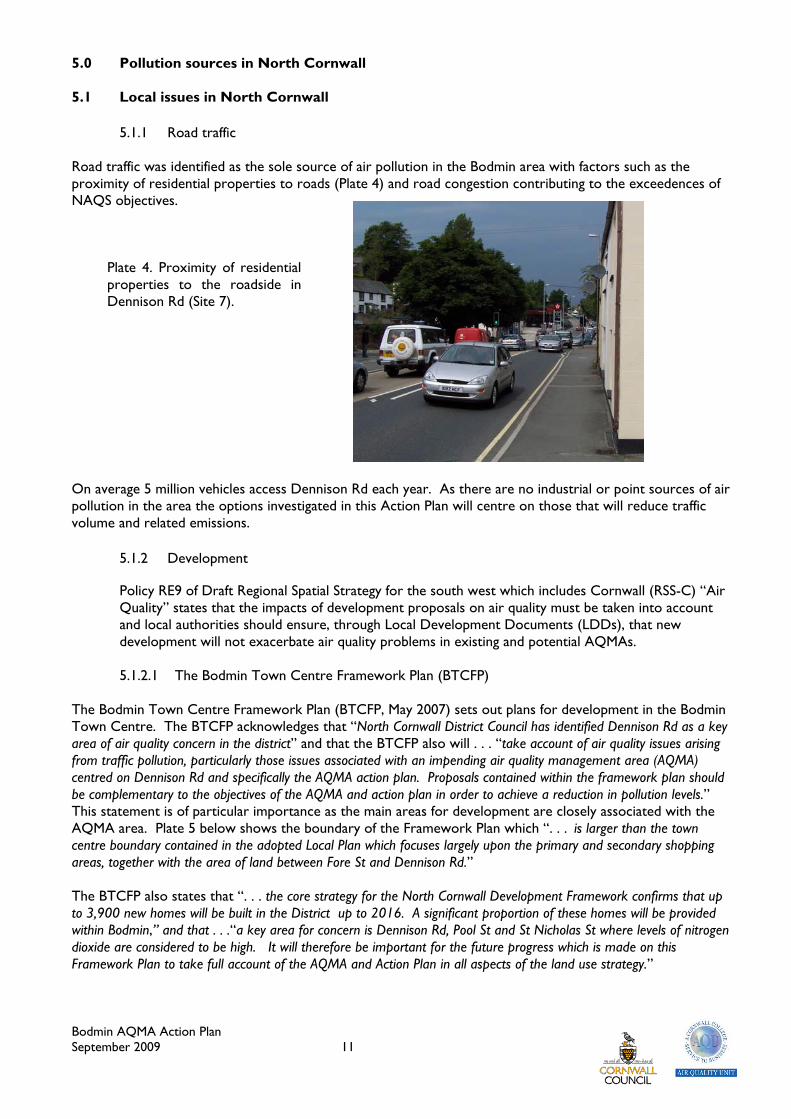
5.1.1 Road traffic Road traffic was identified as the sole source of air pollution in the Bodmin area with factors such as the proximity of residential properties to roads (Plate 4) and road congestion contributing to the exceedences of NAQS objectives. On average 5 million vehicles access Dennison Rd each year. As there are no industrial or point sources of air pollution in the area the options investigated in this Action Plan will centre on those that will reduce traffic volume and related emissions.
5.1.2 Development
Policy RE9 of Draft Regional Spatial Strategy for the south west which includes Cornwall (RSS-C) “Air Quality” states that the impacts of development proposals on air quality must be taken into account and local authorities should ensure, through Local Development Documents (LDDs), that new development will not exacerbate air quality problems in existing and potential AQMAs.
5.1.2.1 The Bodmin Town Centre Framework Plan (BTCFP)
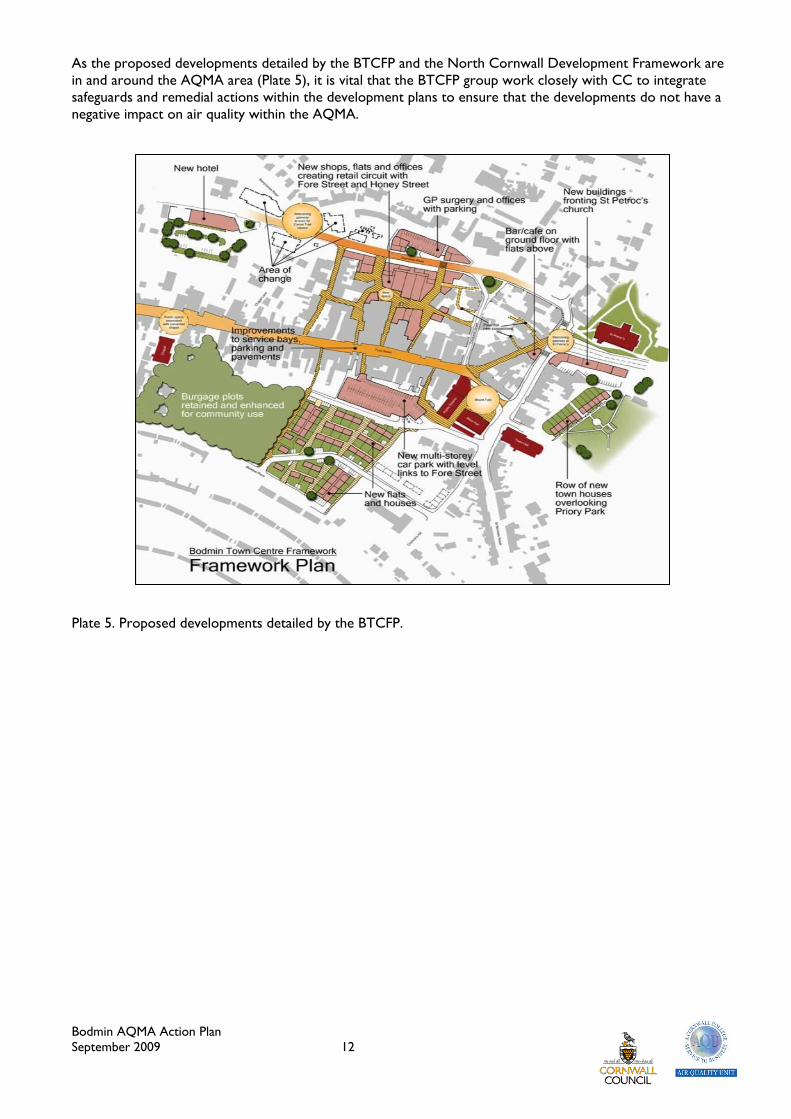
The Bodmin Town Centre Framework Plan (BTCFP, May 2007) sets out plans for development in the Bodmin Town Centre. The BTCFP acknowledges that “North Cornwall District Council has identified Dennison Rd as a key area of air quality concern in the district” and that the BTCFP also will . . . “take account of air quality issues arising from traffic pollution, particularly those issues associated with an impending air quality management area (AQMA) centred on Dennison Rd and specifically the AQMA action plan. Proposals contained within the framework plan should be complementary to the objectives of the AQMA and action plan in order to achieve a reduction in pollution levels.” This statement is of particular importance as the main areas for development are closely associated with the AQMA area. Plate 5 below shows the boundary of the Framework Plan which “. . . is larger than the town centre boundary contained in the adopted Local Plan which focuses largely upon the primary and secondary shopping areas, together with the area of land between Fore St and Dennison Rd.” The BTCFP also states that “. . . the core strategy for the North Cornwall Development Framework confirms that up to 3,900 new homes will be built in the District up to 2016. A significant proportion of these homes will be provided within Bodmin,” and that . . .“a key area for concern is Dennison Rd, Pool St and St Nicholas St where levels of nitrogen dioxide are considered to be high. It will therefore be important for the future progress which is made on this Framework Plan to take full account of the AQMA and Action Plan in all aspects of the land use strategy.”
Plate 4. Proximity of residential properties to the roadside in Dennison Rd (Site 7).
Bodmin AQMA Action Plan September 2009 12
As the proposed developments detailed by the BTCFP and the North Cornwall Development Framework are in and around the AQMA area (Plate 5), it is vital that the BTCFP group work closely with CC to integrate safeguards and remedial actions within the development plans to ensure that the developments do not have a negative impact on air quality within the AQMA. Plate 5. Proposed developments detailed by the BTCFP.

Bodmin AQMA Action Plan September 2009 13
5.2 Pollution source apportionment An integral part of the NCDC Air Quality Stage 4th Round Review and Assessment Technical Document was the pollution source apportionment, which attempted to identify the air pollution source(s) and their respective contributions. The results from the source apportionment are used to focus actions for pollution remediation and assist the cost benefit analysis of proposed work. The AQU, commissioned by NCDC, identified high concentrations of NO2 in Dennison Rd that were thought to be traffic related. Therefore the source apportionment study, conducted by the Centre for Energy and the Environment (CEE) was commissioned by CCC for Dennison Rd. To complete the source apportionment study, data from an automatic traffic counter sited between the crossings with Turf St and Crockwell St was supplied by CCC to CEE for the period February 2006 and March 2007. The source apportionment study focused on Dennison Rd, Bodmin; however the results are also applicable to St. Leonards, an area also exceeding the NAQS objectives, which is essentially an extension of Dennison Rd.
5.2.1 Dennison Rd, Bodmin Dennison Rd forms part of the A389 and the A391 and skirts the northern edge of Bodmin town centre. The A389 links the towns of Wadebridge and Padstow to Cornwall’s main arterial roads, the A30 (to the east of Bodmin) and the A38. The A391 branches away from the A389 near the western edge of Bodmin and connects to the A30 to the west of Bodmin. The A391 has (at least between Bodmin and the junction with the A30) only minor importance for long distance traffic which bypasses Bodmin on the A30 trunk road. Wadebridge and Padstow, as well as Bodmin itself, are popular destinations for day trips and holidaymakers. Visitors to the town centre of Bodmin can choose between three car parks. One of them, the Dennison Rd car park, is accessed via Dennison Rd for vehicles arriving from the A30 or A38, while visitors arriving from the west will use Dennison Rd in order to access the other two car parks, Mt Folly and Priory car park.
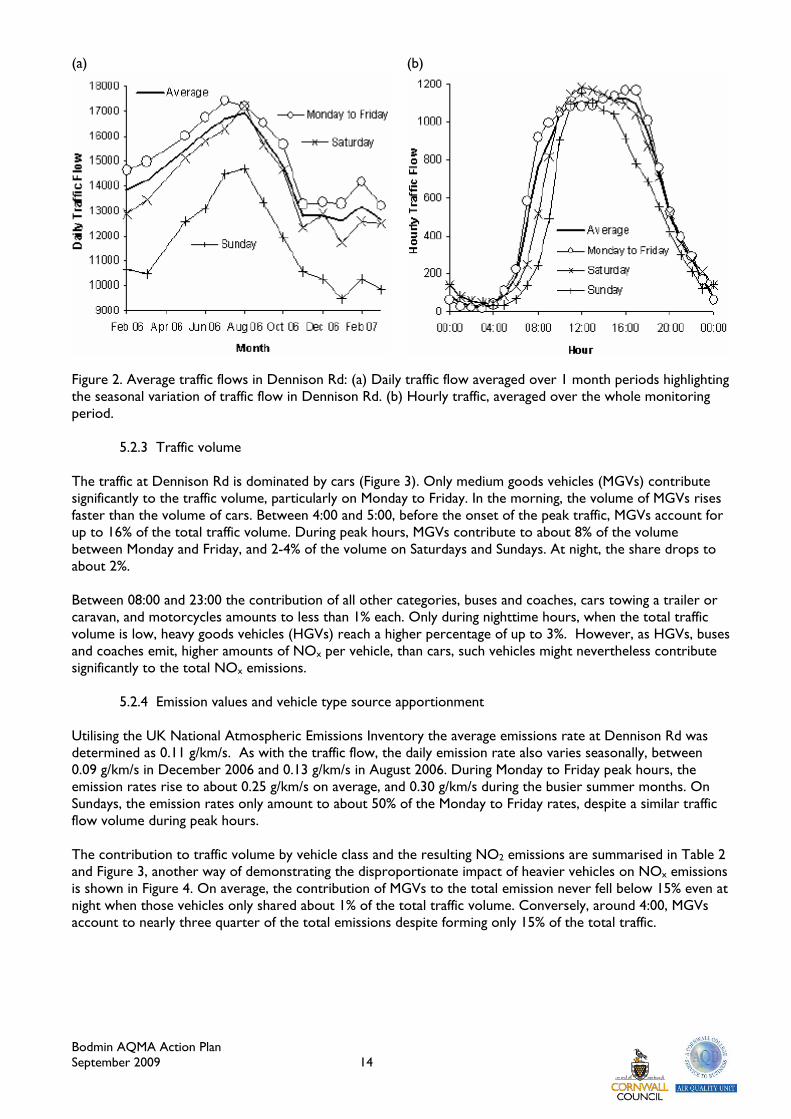
5.2.2 Vehicle flow rates Examination of the traffic data reveals a distinct seasonal variation of the traffic flow (Figure 2a). During Summer 2006, Dennison Rd was passed by approximately 17,000 vehicles per day between Monday and Saturday. Towards winter 2007, the daily traffic count dropped by approximately 4000 vehicles, or slightly less than a quarter. The Sunday traffic count is about 2000-3000 cars less than the Monday to Friday count. The average hourly flow (Figure 2b), particularly on Saturdays and Sundays, shows a typical bell form peaking around noon. The noon plateau also appears on weekdays, however, the traffic volume during those days increases further during the afternoon, peaks after 17:00 and declines rapidly afterwards. During peak hours, the average traffic volume amounts to approximately 1000-1200 vehicles per hour on any day of the week. However, as the peak traffic on Sundays commences about 2 hours later and ceases about 2 hours earlier than between Monday and Friday, a lower daily volume results during Sundays.
Bodmin AQMA Action Plan September 2009 14
(a) (b)
Figure 2. Average traffic flows in Dennison Rd: (a) Daily traffic flow averaged over 1 month periods highlighting the seasonal variation of traffic flow in Dennison Rd. (b) Hourly traffic, averaged over the whole monitoring period.
5.2.3 Traffic volume The traffic at Dennison Rd is dominated by cars (Figure 3). Only medium goods vehicles (MGVs) contribute significantly to the traffic volume, particularly on Monday to Friday. In the morning, the volume of MGVs rises faster than the volume of cars. Between 4:00 and 5:00, before the onset of the peak traffic, MGVs account for up to 16% of the total traffic volume. During peak hours, MGVs contribute to about 8% of the volume between Monday and Friday, and 2-4% of the volume on Saturdays and Sundays. At night, the share drops to about 2%. Between 08:00 and 23:00 the contribution of all other categories, buses and coaches, cars towing a trailer or caravan, and motorcycles amounts to less than 1% each. Only during nighttime hours, when the total traffic volume is low, heavy goods vehicles (HGVs) reach a higher percentage of up to 3%. However, as HGVs, buses and coaches emit, higher amounts of NOx per vehicle, than cars, such vehicles might nevertheless contribute significantly to the total NOx emissions.
5.2.4 Emission values and vehicle type source apportionment Utilising the UK National Atmospheric Emissions Inventory the average emissions rate at Dennison Rd was determined as 0.11 g/km/s. As with the traffic flow, the daily emission rate also varies seasonally, between 0.09 g/km/s in December 2006 and 0.13 g/km/s in August 2006. During Monday to Friday peak hours, the emission rates rise to about 0.25 g/km/s on average, and 0.30 g/km/s during the busier summer months. On Sundays, the emission rates only amount to about 50% of the Monday to Friday rates, despite a similar traffic flow volume during peak hours. The contribution to traffic volume by vehicle class and the resulting NO2 emissions are summarised in Table 2 and Figure 3, another way of demonstrating the disproportionate impact of heavier vehicles on NOx emissions is shown in Figure 4. On average, the contribution of MGVs to the total emission never fell below 15% even at night when those vehicles only shared about 1% of the total traffic volume. Conversely, around 4:00, MGVs account to nearly three quarter of the total emissions despite forming only 15% of the total traffic.

Bodmin AQMA Action Plan September 2009 15
Table 2. Contribution by vehicle class to traffic volume and NO2 emissions at 40 km/h (24 mph).
Class Vehicle Type %Volume % NO2 emissions 1 Motorbikes 0.1 negligible 2 Cars 92.6 42 3 Cars with trailers 0.7 negligible 4 Medium goods 5.5 45 5 Heavy Goods 0.6 9 6 Buses and Coaches 0.5 4 Total (%) 100 100
0
10
20
30
40
50
60
70
80
90
100
1 2 3 4 5 6Vehicle class
%
%Contribution to volum e
%Contribution to NO2em iss ions
Figure 3. Contribution by vehicle class to traffic volume and NO2 emissions.
Figure 4. Contributions of different vehicle categories to total NOx emissions and total traffic volume correlated. Filled symbols denote the daily and open symbols (only for cars and MGVs) the hourly averages (both daily and hourly averages are determined as averages over all days of the week, and over the whole traffic count period, February 2006 to March 2007).

Bodmin AQMA Action Plan September 2009 16
The significant differences between the Monday to Friday and Sunday emission rates are first and foremost a result of the higher contribution of MGVs and HGVs to the total traffic volume during weekdays. During peak hours, the emissions contribution of MGVs is about one quarter higher than those from cars (Figure 5a), despite the number of cars passing through Dennison Rd being about 15 times greater than the number of MGVs. (a) (b)
Figure 5. Hourly averaged NOx emissions of different vehicle categories, estimated from the traffic flow counter at Dennison Rd for (a) all days of the week. (b) Mondays to Fridays only. HGVs, busses and coaches together contribute to about one fifth the total emissions, despite only forming about 2% of the total traffic flow. The contribution of the two other categories contained within the traffic data, motorcycles and cars with trailers, turned out to be negligible. The disproportionately large contribution of heavier vehicles to the total emission is particularly highlighted if Mondays to Fridays are considered in isolation (Figure 5b). Here the emissions of MGVs and cars are related to each other (during peak hours) in the ratio 3:2, and the vehicle numbers as 1:10.
5.2.5 Vehicle speed and emissions The traffic speed is expectedly inversely correlated with the traffic volume, and shows accordingly both daily and seasonal variations, with the lowest average speeds during peak hours in the summer. At night, vehicles on Dennison Rd travel at an average speed of about 34 mph. Between 09:00 and 17:00 on week days and between 10:00 and 12:00 on Saturdays peak hours, the average speed drops to below 24 mph, while on Sundays the average speed remains above 26 mph even at noon, despite a traffic flow comparable to the Monday to Saturday flow around the same time. In order to estimate the impact of different speeds on NO2 emissions a constant traffic volume and vehicle split are assumed. An increase from the slowest recorded hourly average (22 mph) to the fastest (34 mph) recorded hourly average would equate to a 0.02 g/km/s reduction in NO2 emissions for Dennison Rd during the Monday – Friday peak traffic flow, the differences in emissions for Saturdays and Sundays between both speed scenarios are insignificant. This finding is explained by the fact that emission rates of HGVs are far more speed dependent within the given speed range than emission rates of cars or MGVs.

Bodmin AQMA Action Plan September 2009 17
5.2.6 Future reductions in emissions
NO2 diffusion tube monitoring has been undertaken by the AQU, 12 sites in Bodmin have been identified where long-term average NO2 concentrations are consistently above the NAQS objective (40 µg m-3). The exceeding sites are all along the A389 corridor. The long-term average and required reduction to conform to the NAQS objective are listed in Table 3. Table 3. Sites (refer to Plates 6 and 7) exceeding the NAQS objectives for NO2 concentration (July 2006 – June 2007) and the NETCEN calculated background concentrations.
Site Location Long-term Average (µg mg-3)
Required Reduction
NETCEN Background Conc. (µg mg-3)
µg mg-3 % 2005 2010 41 St Leonards 40 1 3
7.72 6.22 42 St Leonards 44 5 11 43 St Leonards 43 4 9 2 St Leonards 40 1 3 16 Dennison Rd 41 2 5
8.36 6.74
22 Dennison /Pool 42 3 7 23 Dennison /Pool 43 4 9 8 Dennison Rd 48 9 19 24 Dennison /Pool 48 9 19 28 Turf St 48 9 19 27 Turf St 44 5 11 26 Turf St 55 16 29 Continuous Monitor (0) Dennison Rd 42 3 7
Plate 6 highlights the monitoring sites around the Dennison/Turf St bottle neck that require the greatest reduction in NO2 concentration to comply with the NAQS annual objectives. The highest long-term average concentration of 55 µmg-3 was recorded at site 26, a reduction of 16 µmg-3 (29%) is required to comply with the NAQS objectives, as distance increases from the bottleneck so do NO2 concentrations. The area around St Leonards (Plate 7) also exceeds the NAQS objective and a reduction of between 3 and 11% is required for compliance. There are reasons to believe that the NOx emissions will be reduced in the future even without any measures being taken. NETCEN predict background concentrations will drop along the A389 corridor by between 1.5 – 1.62 µg m-3 by 2010, this would bring site 16 in Dennison Rd and sites 41 and 2 in St Leonards below the NAQS annual objective assuming that emissions from vehicles do not increase. Every year, a certain number of older, highly emitting vehicles are decommissioned by their owners, and most of them are replaced by vehicles complying with the most recent emission norms. The ongoing modernisation of the UK vehicle fleet should have a huge improving impact on the air quality. Peak time NOx emissions in 1996 would have been 2.5 times higher than the 2006 input, in 2010, peak-time emissions (compared to 2006) will have fallen by about one quarter and in 2015 by one half. After about 2016, only marginal improvements are to be expected and peak time NOx emissions will stabilise at about 40% of the 2006 values, provided that the total traffic volume does remain constant. There is, however, some uncertainty regarding the validity of the projected NOx emission rates for future years and emission control technologies. Nationally, whilst a steady reduction in NOx emissions (and therefore NO2 concentrations) would have been expected over the past decade, in practice they have generally remained static or increased. One possible cause could be an increase in direct (primary) NO2 emissions, as against NO which reacts with O3 to form NO2.

Bodmin AQMA Action Plan September 2009 18
Plate 6. Reduction required in ambient NO2 concentrations to comply with the NAQS objectives for the Dennison Rd area.
Plate 7. Reduction required in ambient NO2 concentrations to comply with the NAQS objectives for the St Leonards area.
Bodmin AQMA Action Plan September 2009 19
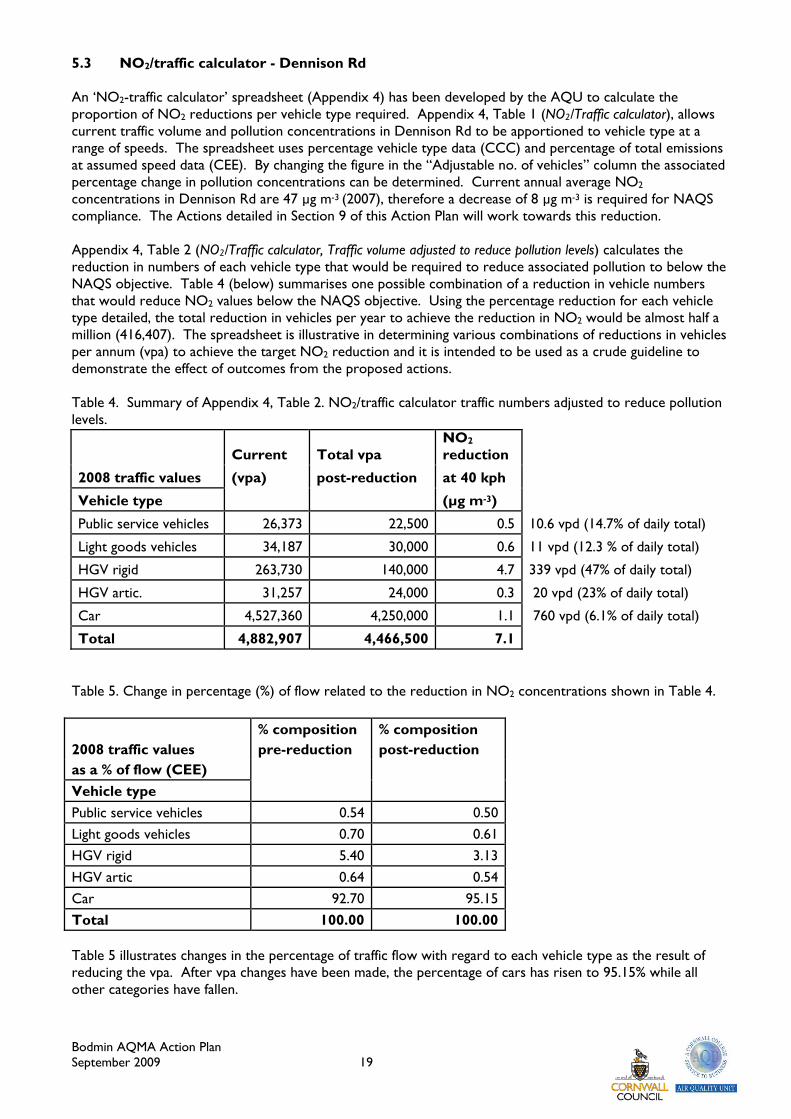
5.3 NO2/traffic calculator - Dennison Rd An ‘NO2-traffic calculator’ spreadsheet (Appendix 4) has been developed by the AQU to calculate the proportion of NO2 reductions per vehicle type required. Appendix 4, Table 1 (NO2/Traffic calculator), allows current traffic volume and pollution concentrations in Dennison Rd to be apportioned to vehicle type at a range of speeds. The spreadsheet uses percentage vehicle type data (CCC) and percentage of total emissions at assumed speed data (CEE). By changing the figure in the “Adjustable no. of vehicles” column the associated percentage change in pollution concentrations can be determined. Current annual average NO2 concentrations in Dennison Rd are 47 µg m-3 (2007), therefore a decrease of 8 µg m-3 is required for NAQS compliance. The Actions detailed in Section 9 of this Action Plan will work towards this reduction. Appendix 4, Table 2 (NO2/Traffic calculator, Traffic volume adjusted to reduce pollution levels) calculates the reduction in numbers of each vehicle type that would be required to reduce associated pollution to below the NAQS objective. Table 4 (below) summarises one possible combination of a reduction in vehicle numbers that would reduce NO2 values below the NAQS objective. Using the percentage reduction for each vehicle type detailed, the total reduction in vehicles per year to achieve the reduction in NO2 would be almost half a million (416,407). The spreadsheet is illustrative in determining various combinations of reductions in vehicles per annum (vpa) to achieve the target NO2 reduction and it is intended to be used as a crude guideline to demonstrate the effect of outcomes from the proposed actions. Table 4. Summary of Appendix 4, Table 2. NO2/traffic calculator traffic numbers adjusted to reduce pollution levels.
2008 traffic values
Current Total vpa NO2 reduction
(vpa) post-reduction at 40 kph
Vehicle type (µg m-3)
Public service vehicles 26,373 22,500 0.5 10.6 vpd (14.7% of daily total)
Light goods vehicles 34,187 30,000 0.6 11 vpd (12.3 % of daily total)
HGV rigid 263,730 140,000 4.7 339 vpd (47% of daily total)
HGV artic. 31,257 24,000 0.3 20 vpd (23% of daily total)
Car 4,527,360 4,250,000 1.1 760 vpd (6.1% of daily total)
Total 4,882,907 4,466,500 7.1 Table 5. Change in percentage (%) of flow related to the reduction in NO2 concentrations shown in Table 4.
% composition % composition 2008 traffic values pre-reduction post-reduction as a % of flow (CEE) Vehicle type Public service vehicles 0.54 0.50 Light goods vehicles 0.70 0.61 HGV rigid 5.40 3.13 HGV artic 0.64 0.54 Car 92.70 95.15 Total 100.00 100.00
Table 5 illustrates changes in the percentage of traffic flow with regard to each vehicle type as the result of reducing the vpa. After vpa changes have been made, the percentage of cars has risen to 95.15% while all other categories have fallen.
Bodmin AQMA Action Plan September 2009 20
Cars contribute a smaller proportion of traffic-related pollution per vehicle than all other categories, e.g., HGV arctic contribute 8.8 x 10⁻⁵ µg m-3 NO2 per vehicle against 0.3 x 10⁻⁵ µg m-3 NO2 per car. A larger NO2
reduction is therefore possible if the percentage for categories other than cars is decreased. 5.4 Source Apportionment conclusions Analyses of traffic data for Dennison Rd, Bodmin has enabled NOx emissions to be apportioned between different types of vehicle. Although cars account for over 92% of traffic throughput, they only account for 42% of total vehicle NOx arising. Conversely, MGVs account for approximately 6% of vehicle throughput but give rise to 45% of total NOx emissions. This disproportion between the contribution to traffic volume and emissions is particularly emphasized during Monday to Friday peak hours. At 11:00, when emissions reach their maximum values, medium goods vehicle contribute more than 50% of the total NOx emissions, despite their number being about one tenth of the number of cars passing through Dennison Rd. Also HGVs, busses and coaches contribute disproportionately to total emissions. HGVs share 0.6% of the traffic volume but 9% of total emissions. For busses and coaches, the respective figures amount to 0.6% and 4%. Both traffic volume and NOx emissions show a distinct seasonal variation, with the peak summer values being about one third above the average winter values. Principally, the figures suggest that measures to control the relatively low number of medium or HGVs passing through Dennison Rd could easily be as significant, in terms of NOx emissions, as actions taken to control a considerable number of cars. However, the topographic situation of Bodmin and the character of the traffic flow do not suggest a simple financially and/or politically acceptable solution. In particular, measures taken to enable traffic to flow more freely are not expected to have a significant impact. Major improvements are expected however, due to the ongoing conversion of the UK vehicle fleet towards low emitting vehicles. This development principally proceeds also without any measures being taken by either the district or Cornwall Council. However, these predictions should be treated with caution since over the past decade such predicted reductions have not been realised nationally.
Bodmin AQMA Action Plan September 2009 21
6.0 Further work Ongoing monitoring using the AirPointer continuous monitor and diffusion tube monitoring will continue at sites of known exceedence along Dennison Rd and Higher Bore St. In order to develop a local diffusion tube bias adjustment factor, triplicate tubes have been collocated with the continuous monitor in Dennison Rd, to date, three-month’s worth of diffusion tube data has been acquired for 2009. In order to develop a local bias adjustment factor, nine-month’s worth of diffusion tube data and verified, collocated continuous monitoring data is required within a 12 calendar-month period (January – December). In order to examine the levels of PM10 in relation to NAQS objective and NO2 and traffic values, a PM10 particulate monitor will be located with the AirPointer NO2 monitor in Dennison Rd.

Bodmin AQMA Action Plan September 2009 22
7.0 Social Equity 7.1 Social and Economic Structure NCDC was one of the six district council areas in Cornwall. The District encompassed the north east corner of the county with an area of 1,195 km2, which incorporates many unique landscapes from open moorland to rocky cliffs. The area has a population of 82,000 (NCDC, 2008a) spread between rural communities and towns and villages. Figure 6 illustrates the ageing population characteristic of the North Cornwall population compared to the national average. The principle economic and population centres of North Cornwall include Bodmin, Launceston, Bude and Wadebridge and the social structure is comprised over a mainly white-British population (>97%) with the remainder (<2000 people) made up of other ethnicities (NSO, 2008). Approximately 12,000 people live in the area’s principle economic centre of Bodmin, of which 2,000 are considered to be in the vulnerable age groups of below 4 or over 65 years of age (NSO, 2008). Figure 6. North Cornwall population age distribution (Office of National Statistics, 2008). 7.2 Deprivation
7.2.1 Objective One /Convergence Fund Objective One was one of three programmes set up to help reduce differences in social and economic conditions within the European Union. Of the three, Objective One had the highest priority designation for European aid and was targeted at areas where prosperity (measured in Gross Value Added (GVA) per head of population) was 75% or less of the European average. Cornwall is one of four areas in the UK which had Objective One status; it is the poorest area in the United Kingdom with the lowest contribution to the national economy and was the only area in the south of England to qualify for Objective One funding. Cornwall and the Isles of Scilly are now eligible for support from the Convergence structural fund programmes – these are the EU economic regeneration programmes which will follow on from the Objective One Programme.
Bodmin AQMA Action Plan September 2009 23
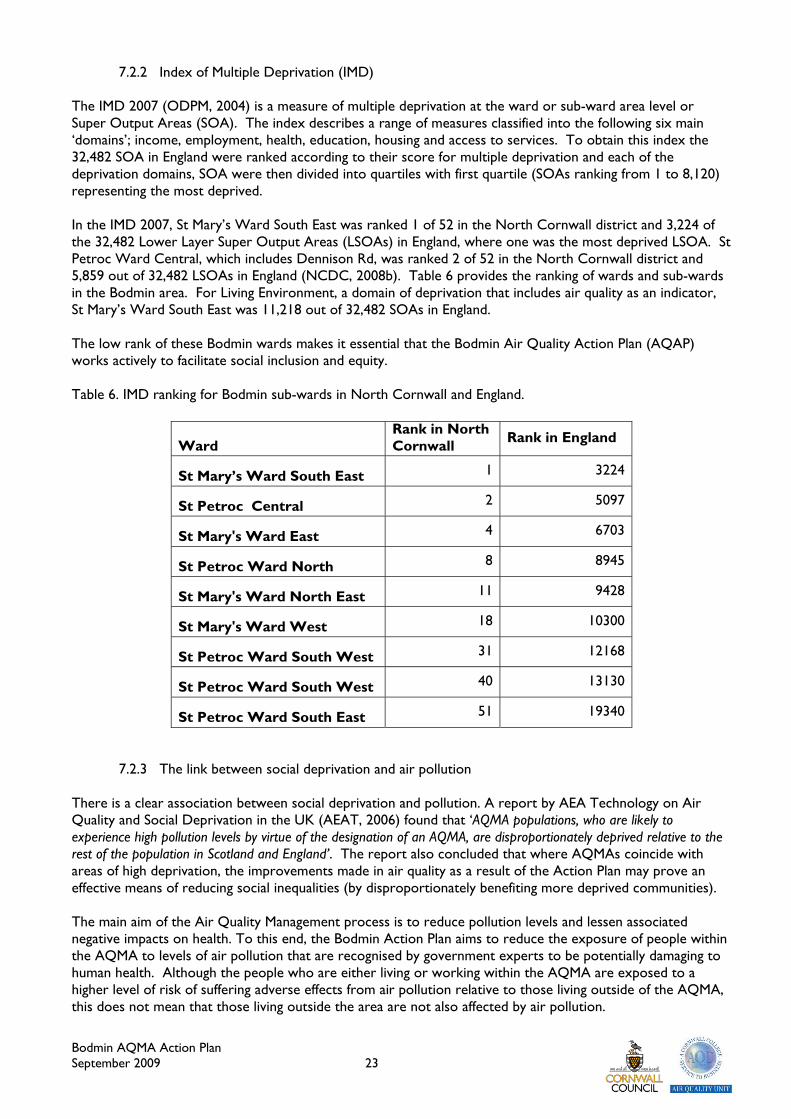
7.2.2 Index of Multiple Deprivation (IMD) The IMD 2007 (ODPM, 2004) is a measure of multiple deprivation at the ward or sub-ward area level or Super Output Areas (SOA). The index describes a range of measures classified into the following six main ‘domains’; income, employment, health, education, housing and access to services. To obtain this index the 32,482 SOA in England were ranked according to their score for multiple deprivation and each of the deprivation domains, SOA were then divided into quartiles with first quartile (SOAs ranking from 1 to 8,120) representing the most deprived. In the IMD 2007, St Mary’s Ward South East was ranked 1 of 52 in the North Cornwall district and 3,224 of the 32,482 Lower Layer Super Output Areas (LSOAs) in England, where one was the most deprived LSOA. St Petroc Ward Central, which includes Dennison Rd, was ranked 2 of 52 in the North Cornwall district and 5,859 out of 32,482 LSOAs in England (NCDC, 2008b). Table 6 provides the ranking of wards and sub-wards in the Bodmin area. For Living Environment, a domain of deprivation that includes air quality as an indicator, St Mary’s Ward South East was 11,218 out of 32,482 SOAs in England. The low rank of these Bodmin wards makes it essential that the Bodmin Air Quality Action Plan (AQAP) works actively to facilitate social inclusion and equity. Table 6. IMD ranking for Bodmin sub-wards in North Cornwall and England.
Ward
Rank in North Cornwall Rank in England
St Mary’s Ward South East 1 3224 St Petroc Central 2 5097 St Mary's Ward East 4 6703 St Petroc Ward North 8 8945 St Mary's Ward North East 11 9428 St Mary's Ward West 18 10300 St Petroc Ward South West 31 12168 St Petroc Ward South West 40 13130 St Petroc Ward South East 51 19340
7.2.3 The link between social deprivation and air pollution There is a clear association between social deprivation and pollution. A report by AEA Technology on Air Quality and Social Deprivation in the UK (AEAT, 2006) found that ‘AQMA populations, who are likely to experience high pollution levels by virtue of the designation of an AQMA, are disproportionately deprived relative to the rest of the population in Scotland and England’. The report also concluded that where AQMAs coincide with areas of high deprivation, the improvements made in air quality as a result of the Action Plan may prove an effective means of reducing social inequalities (by disproportionately benefiting more deprived communities). The main aim of the Air Quality Management process is to reduce pollution levels and lessen associated negative impacts on health. To this end, the Bodmin Action Plan aims to reduce the exposure of people within the AQMA to levels of air pollution that are recognised by government experts to be potentially damaging to human health. Although the people who are either living or working within the AQMA are exposed to a higher level of risk of suffering adverse effects from air pollution relative to those living outside of the AQMA, this does not mean that those living outside the area are not also affected by air pollution.
Bodmin AQMA Action Plan September 2009 24
Due to traffic-related pollution being assessed as the sole source of air pollution in the Bodmin area, the actions detailed in this Action Plan are specifically aimed at reducing pollution concentrations by making changes to traffic volume and transport issues. However, it is important to realise that unless careful foresight is used, some actions aimed at reducing pollution concentrations within the AQMA may have a detrimental effect on the population both within and outside of the AQMA. The national and local policies, programmes and strategies outlined below seek to address this concern.
7.2.4 Social Exclusion Unit In 2003 the Social Exclusion Unit (SEU) report ‘Making the Connections: Transport and Social Exclusion,’ (SEU, 2003) highlighted transport as an important source of empowerment in facilitating social inclusion and equality. The SEU stated that
“. . . different people have different transport needs so local authorities should consider how their policies address the transport requirements of different groups, including disabled people, women, older people, younger people, carers, people from ethnic communities and people on low incomes. Improving access to jobs and services is the key means of helping to meet these requirements through transport planning, but authorities should also take opportunities to ensure local transport policies across the board contribute towards social inclusion objectives.”
The SEU report reiterated the conclusions of the Acheson Report (Acheson, 1998) that deprived communities suffer the worst traffic pollution. Research for the DEFRA has also provided “tentative evidence” for a positive correlation of social deprivation against air quality (Pye et al., 2001) and Friends of the Earth also found a positive correlation between levels of deprivation and traffic in a study of Bradford (Pennycook et al., 2001). With the findings of the SEU and Acheson reports in mind it is vital that whilst the Bodmin AQMA AP addresses the causes of pollution, it keeps in mind the need to address the social equity issues in this area of Cornwall.
7.2.5 The Future of Transport White Paper The Future of Transport White Paper (DfT, 2004) makes extensive reference to social inclusion and highlights the necessity of making the improvement of bus services integral to Local Transport Plans in order to help tackle social exclusion, enhance mobility, and increase the accessibility of jobs and services. The White Paper reflects the findings of the SEU paper (SEU, 2003) in stating that bus services must be good value, frequent, well integrated, safe, well designed and maintained. However the paper also reiterates that although decisions affecting the social fabric of an area should be made at local level in the context of those whose lives will be affected, it is essential not to view transport decisions in isolation but integrate different forms of transport and attain co-ordination of both policies and services from the local to national level.
7.2.6 The Rogers Review on national enforcement priorities for local authority regulatory services The Rogers Review puts air quality at the top of the five main national enforcement priorities. Rogers states that . . .
“Air quality is a national enforcement priority because it impacts on whole populations, particularly the elderly and those more susceptible to air pollution. It is politically important to emphasise the role that local authorities can play in reducing its impacts, and its trans-boundary nature means that local action contributes to national outcomes.” (Rogers, 2007).
Rogers highlights the fact that air pollution damages health, quality of life and shortens life expectancy and that health impacts from particulate matter alone costs the UK cost £9.1-£21 billion in 2005. His report also focuses on the contribution that improvements to local air quality can have on tackling national and global issues such as climate change.
Bodmin AQMA Action Plan September 2009 25
8.0 Associated local policies, programmes and strategies At the time of writing the policies detailed in this section are in force. After April 1st 2009, when Cornwall becomes a unitary authority, all NCDC policies detailed below will transfer to Cornwall Council (CC). Since September 2007, in accordance with the requirements of Planning Policy Statement 12 (PPS12) which sets out the Government's policy on local spatial planning, only specific policies have been saved. Most policies were saved but not all, only those that did not comply with the most up to date national guidance were discontinued. A list of the save policies is available from CC. The Bodmin Action Plan will be integrated into, and inform, other local and national strategies. This process will strengthen the co-ordination of these policies, programmes and strategies at the local level. The local policies, programmes and strategies detailed below acknowledge air quality and transport issues and all contain commitments which seek to address these issues.
8.1 Cornwall Air Quality Strategy (http://www.cornwall-airquality.org.uk/PDF/Cornwall%20Air%20Quality%20Strategy.pdf) The Cornwall Air Quality Forum (of which NCDC was a member) jointly produced a Cornwall Air Quality Strategy (CAQS), which was published and launched in December 2004. The aim of the CAQS is to achieve excellent air quality across Cornwall to protect public health and the environment. It includes a comprehensive action plan to address the issues raised in the strategy, such as addressing the air quality hotspots identified in many of the towns of Cornwall (Barnes, 2005) and linking with the Local Transport Plan and Community Strategy. The CAQS consulted stakeholders extensively in order to assess the economic, environmental and social impacts of proposed actions, and the Bodmin AQMA AP will help to address the aims of the CAQS.
8.2 NCDC Local Plan The current Local Plan was adopted in April 1999 and covered the period up to 2006. Whilst the end date for the Local Plan has now passed, its contents have been saved under the provisions of the Planning and Compulsory Purchase Act 2004 whilst North Cornwall District Council prepares the Local Development Framework for the district. The Local Plan provides site specific guidance on development opportunities identified in the Local Plan. Policies of specific relevance are set out in Chapters 3-6 in Part 1 of the Plan, plus Chapter 2 within Part 2 of the Plan (which specifically relates to Bodmin).
8.3 Bodmin Town Centre Framework Plan (BTCFP) The initial consultation draft BTCFP recognised that Bodmin has particular problems with regard to air quality and the impact that future development in the area may have. It also recognised that there are localised air quality problems within some parts of the urban area resulting mostly from vehicular transport emissions and that the NCDC had an AQMA AP in preparation. New development and schemes for traffic management should not add to these localised problems or be significantly harmful to the wider urban environment and should, where there is the opportunity, contribute to resolving identified air quality problems. The BTCFP also sought to promote the growth of the economy, improvement of education and the social inclusion of the people of North Cornwall. Since the finalization of the BTCFP, a Development Brief for the Fore Street North & South sites has been prepared and adopted by NCDC. The Brief provides additional detailed analysis and guidance in relation to the redevelopment of these areas which will act as a guide for future planning applications in these areas. The AQMA - AP formed part of the evidence base for the BTCFP and also informed the assessment as to the appropriateness of proposed sites for development.

Bodmin AQMA Action Plan September 2009 26
8.4 Bodmin Masterplan
The BTCFP was developed as part of the original set of Local Development Framework (LDF) plans, and will therefore will be saved. Its main aim was to provide a planning framework to aid the regenerate the town. In recognition of the substantial growth planned for Bodmin over the next 20 years a Masterplan is currently being prepared to guide this anticipated growth, which should result in an overall physical, social and economic revival of the town. Work commenced in April 2009 on the Masterplan and is expected to be completed early in 2010. The Master Plan is essentially a new and overarching document that will use the principles of the BTCFP but within the new planning context of Cornwall Council (in absence of an AAP) Amongst the overall objectives, the project aims to:
• Provide sustainable transport links within the town and achieve a reduction in the need to travel • Improve air quality in the centre of the town
It is therefore anticipated that the Bodmin AQMA Action Plan will feed into and help to address the aims of the Bodmin Masterplan and that the Bodmin Masterplan will assist in fulfilling the aims and objectives of the Bodmin AQMA Action Plan.
8.5 North Cornwall Local Development Framework (LDF) - Core Strategy Development Plan Document, October 2007
Under the new Unitary Cornwall Council the progress of the NCDC LDF has been discontinued in favour of a new Cornwall LDF. It is however the intention that the contents of the North Cornwall LDF and the consultation responses received on it will help inform the Cornwall LDF. Work on the Cornwall LDF has already started. The Core Strategy for Development Management Policies is the principle development plan document and forms part of the suite of development plan documents in the North Cornwall Local Development Framework. It “. . . establishes the context for future growth and development within the district and sets the framework for all subsequent development plan document. The Core Strategy sets out the Council's preferred vision for the future of North Cornwall. It outlines the broad scale and distribution for strategic needs such as housing and employment. It also contains core policies that convey the Council's favoured approach to development within the District for the next twenty years.” The Core Strategy for Development Management Policies also acknowledges that there are areas within Bodmin where air quality “persistently falls below the acceptable standard” and that this is due to traffic-related pollution. At the time of the publication of the Core Strategy the current AQMA was not in force, however the Core Strategy is aware of the need to fully integrate air quality issues with development proposals. Section E.7.21 in the NCDC Core Strategy Preferred Options states that “Ensuring service accessibility and permeability across the town is a key challenge. Improving the local transport network is vital to gain social and economic advantage from existing and proposed development. Reducing congestion, improving air quality and providing improved accessibility within and beyond Bodmin will be pursued through targeted highway improvements and new development.
8.6 North Cornwall Community Strategy (NCCS)
The NCCS complements the new Cornwall-wide Sustainable Community Strategy, using the same broad themes of Individual Well Being, Strong Communities and a Quality Living Environment (http://www.ncdc.gov.uk/index.cfm?articleid=1267).
8.7 Sustainable Community Strategy for Cornwall (SCS, CC, 2008)
The SCS which, while not as explicit in linking a Quality Living Environment to air quality as the previous Cornwall County Council Community Strategy (2003) does still seek to address air quality and traffic-related issues in Cornwall.

Bodmin AQMA Action Plan September 2009 27
One of the challenges outlined in the Strategy is to “Reverse the increase in greenhouse gas emissions - transport and connectivity is and will continue to be the most difficult area for Cornwall to tackle with predictions for traffic growth between 2007 and 2021 from 16% to 27%”. Principle 1: Prevention and a focus on the individual has, as a basic physical need for the population of Cornwall, “Access to healthy food, quality air and water and suitable climate and adequate shelter”.
8.8 Cornwall Local Transport Plan 2 (LTP2) 2006 – 2011 (http://db.cornwall.gov.uk/ltp/ltp20062011/index.html)
The guidance on Local Transport Plans (DfT, 2006) identifies LTPs as being a key element in promoting social inclusion and in tackling barriers to transport experienced by specific sectors of the community. The LTP guidance recognises that . . .“transport is, ultimately, one of a combination of factors contributing to sustainable economic growth and social inclusion: it is not an end in itself.” The LTP guidance also states that LTPs should be prepared “. . . in the context of wider objectives and policies for developing the economic, social and environmental wellbeing of their region.” With regard to air pollution, CCC LTP2 includes aims to:
• Reduce the growth of traffic congestion and transport related air pollution and improve public transport in Cornwall
• Reduce the impact of transport on Cornwall’s natural, historic and built environment • Reduce traffic related air and noise pollution • Manage traffic related climate changing emissions
The CCC LTP2 states that “The overall transport strategy approach within LTP2 will play an important role in improving air quality and managing climate change by seeking a reduction in congestion and the promotion of public transport, walking and cycling. There is also a need to consider the role that alternative fuels can play and ways in which this can be taken forward in wider partnership.” The actions detailed in the Bodmin Action Plan are closely linked to those detailed in the Cornwall LTP2 (Chapter 6 & 9), specifically with regard to North Cornwall. Chapter 6 “Addressing Regeneration and Congestion in Cornwall” details the issues affecting Cornwall as a whole. Section 6.6.1.7 focuses specifically on Bodmin and outlines the research, projects and investments involved in addressing the transport-related issues inherent in the area. Chapter 9 “Improving Air Quality in Cornwall” recognises that “. . .identified sites where air quality problems exist need to be addressed. This will focus on locations in,…Bodmin where solutions will be developed to overcome the particular local air quality problems.” The targets detailed in Section 12.4 (Performance Indicators and Targets) state that there should be “…no increase in concentrations of NO2 above baseline values at identified locations in…Bodmin.” Table 7 below reproduces Table 6.8 of the CCC LTP2 which details the substantial projected expenditure for the Bodmin Transport Programme. For the Major Scheme Bid element - refer to Chapter 13 of LTP2. Table 7. Bodmin Transport Programme (CCC, LTP2, Table 6.8).
Schemes 5 Year Expenditure Profile £'000s 2006/07 2007/08 2008/09 2009/10 2010/11 Totals Bodmin Torpoint National Cycle Network extension 700 938 1,638 Public Transport 151 151 Walking and Cycling 18 18 Traffic Management 200 17 217 Safer Routes to Schools 10 10 11 12 12 55 Total 910 948 11 180 30 2079
Bodmin AQMA Action Plan September 2009 28
The Transport Programme detailed above will directly feed into the actions detailed in Section 9 of this Action Plan, specifically actions 16 and 25 (Public Transport), actions 3, 4, 11, 12 and 17 (Walking and Cycling), actions 21 - 25 (Traffic Management) and action 1 (Safer Routes to Schools). The CCC LTP 2 also recognises the importance of the role of transport in remedying social exclusion issues and its policies actively work towards this goal. The Cornwall LTP2 was assessed by DfT and given an “excellent” status. Therefore the NCDC AP and the CCC LTP2 have aims and actions in common which reflect and support each other.
8.9 Draft Regional Spatial Strategy for the south west which includes Cornwall (RSS-C) (http://www.southwest-ra.gov.uk/nqcontent.cfm?a_id=836) The Draft Regional Spatial Strategy which includes Cornwall (RSS - C), recognises the need to secure “…fundamental improvements to public transport, traffic management and use of road space to tackle congestion and poor air quality in many urban areas.” The actions detailed in this plan will directly address these concerns. As stated in Section Policy RE9 of the RSS-C - Air Quality, ‘The impacts of development proposals on air quality must be taken into account and LAs should ensure, through Local Development Documents (LDDs), that new development will not exacerbate air quality problems in existing and potential AQMAs’. Within the Secretary of State's proposed changes to the draft RSS, the North Cornwall area is proposed to provide 13,400 new homes over the period up 2026. It is anticipated that Bodmin will provide a significant proportion of these new homes and this will be informed by the emerging Bodmin Masterplan and Cornwall LDF. The RSS-C is a key document for planning, monitoring and managing future development in the South West and, in 2008, will replace Regional Planning Guidance and the county structure plan for Cornwall. The Draft RSS will guide the production of local planning strategies produced by local councils, known as Local Development Frameworks or LDFs.
Bodmin AQMA Action Plan 29 September 2009
9.0 Proposed actions to reduce the level of traffic-related pollutants
In order to reduce traffic-related pollution concentrations below the NAQS objective levels, the following list of actions has been developed. The lists of options outlined in this document and their subsequent impacts, are not exhaustive but illustrate some of the options available to CC. Numbers in brackets denotes other actions which are linked. As part of the Action Plan process, CC is required to consider the cost effectiveness and feasibility of different abatement options. Each action has been considered with regard to its feasibility and with regard to its likely social and economic impact and the ease of implementation within CC. Direct and indirect costs for CC of each action have been assessed and the cost effectiveness of each action considered. The likely air quality improvement has been considered for each action and rank order has then been given after considering all the variables with each option. Cost effectiveness The cost effectiveness of actions considered will be undertaken through a simple examination of the overall costs to CC (and the community) of the option being implemented. Specific costs, and a detailed cost benefit analysis is not required as part of the Action Planning process. Instead, cost effectiveness provides a further mechanism for prioritising the available options. For cost, the matrix relates to the following cost boundaries:
• Low - up to £10,000
• Medium - up to £20,000 • High - above £20,000
Benefit An improvement in air quality will obviously lead to an improvement in health, therefore the benefit from each action has been assessed on a scale from less positive to most positive with regard to the benefit the action will have on improving air quality and hence the health of the local population. Ranking The aim of the Action Plan is to identify the “most preferable” options; these will be undertaken first and the “least preferable” last. Therefore, each action has been assigned an estimated cost and benefit that is expected to accrue from it. Where the completion date for the action is ongoing the cost/benefit calculation is an annual estimation. Where the completion date is finite, the cost/benefit calculation is for that period. In order to separate out those actions that are specific and achievable from long-term ongoing Actions and those that are in the investigative stage, the structure of the Actions table has been divided into three: SMART (Specific, Measurable, Agreed upon, Realistic and Time-based) targets; continuous measures and investigative actions. A ‘Key Performance Indicator’ column has been added where appropriate as a check against targets and the ‘Target Dates’ set.
High - Most Positive
Medium
Low - Less Positive

DRAFT
Bodmin AQMA Action Plan September 2009 30
Section 9.0: Table 8. SMART Targets
No. ACTION DETAILS STAKEHOLDER TARGET COST/BENEFIT KEY PERFORMANCE INDICATOR TARGET DATE
1 (2, 10)
Prioritising implementation of safer routes to school and school Travel Plan (TP) development.
Work with local schools to raise awareness of traffic-related pollution. Offer assistance to schools with the development and implementation of TPs.
CC School Travel Plan Dept
All schools within North Cornwall to have implemented TPs.
Low/High
% of schools with TP. Reduction in traffic related accidents.
2013
2 (1, 10)
Support companies In developing Travel Plans (TPs).
CC will continue to work with partners to support TPs.
CC Transportation CC Planning
Largest employers to have TPs.
Low/Low
Reduction in single car use.
2013
3 (4, 11,12 & 17)
Improvement of walking: Environment.
CC will continue to take steps to improve the pedestrian environment with improved priorities.
CC Travel Awareness Team CC PT&E
Public realm improvements Improved number of walkers.
Low/Low
5% increase in walkers (supported by LTP2).
2013
4 (3,11,12 & 17)
Improvement of cycling: Environment.
CC will work towards the development of improved cycle routes and support the provision of facilities i.e. secure cycle parking.
Connecting Cornwall CC Travel Awareness Team
Increase cycle paths Increased number of cyclists.
Low/Low
12% increase in cyclists (supported by LTP2 and LTP3).
2013
5 (22)
Traffic Signals (1).
Effective linking of traffic signals to ensure smooth flow of traffic using MOVA.
CC
Install MOVA.
Low/Med
Average queue length.
May 2009
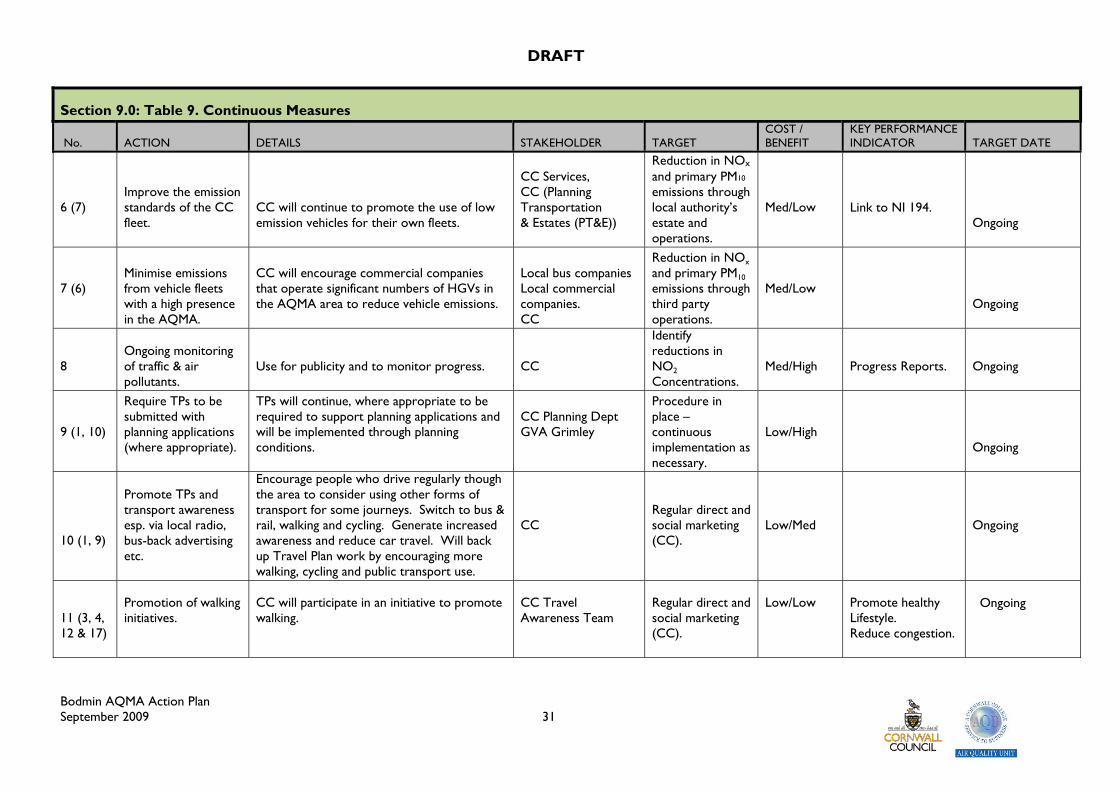
DRAFT
Bodmin AQMA Action Plan September 2009 31
Section 9.0: Table 9. Continuous Measures
No. ACTION DETAILS STAKEHOLDER TARGET COST / BENEFIT
KEY PERFORMANCE INDICATOR TARGET DATE
6 (7)
Improve the emission standards of the CC fleet.
CC will continue to promote the use of low emission vehicles for their own fleets.
CC Services, CC (Planning Transportation & Estates (PT&E))
Reduction in NOx and primary PM10
emissions through local authority’s estate and operations.
Med/Low
Link to NI 194.
Ongoing
7 (6)
Minimise emissions from vehicle fleets with a high presence in the AQMA.
CC will encourage commercial companies that operate significant numbers of HGVs in the AQMA area to reduce vehicle emissions.
Local bus companies Local commercial companies. CC
Reduction in NOx and primary PM10
emissions through third party operations.
Med/Low
Ongoing
8
Ongoing monitoring of traffic & air pollutants.
Use for publicity and to monitor progress.
CC
Identify reductions in NO2 Concentrations.
Med/High
Progress Reports.
Ongoing
9 (1, 10)
Require TPs to be submitted with planning applications (where appropriate).
TPs will continue, where appropriate to be required to support planning applications and will be implemented through planning conditions.
CC Planning Dept GVA Grimley
Procedure in place – continuous implementation as necessary.
Low/High
Ongoing
10 (1, 9)
Promote TPs and transport awareness esp. via local radio, bus-back advertising etc.
Encourage people who drive regularly though the area to consider using other forms of transport for some journeys. Switch to bus & rail, walking and cycling. Generate increased awareness and reduce car travel. Will back up Travel Plan work by encouraging more walking, cycling and public transport use.
CC
Regular direct and social marketing (CC).
Low/Med
Ongoing
11 (3, 4, 12 & 17)
Promotion of walking initiatives.
CC will participate in an initiative to promote walking.
CC Travel Awareness Team
Regular direct and social marketing (CC).
Low/Low
Promote healthy Lifestyle. Reduce congestion.
Ongoing
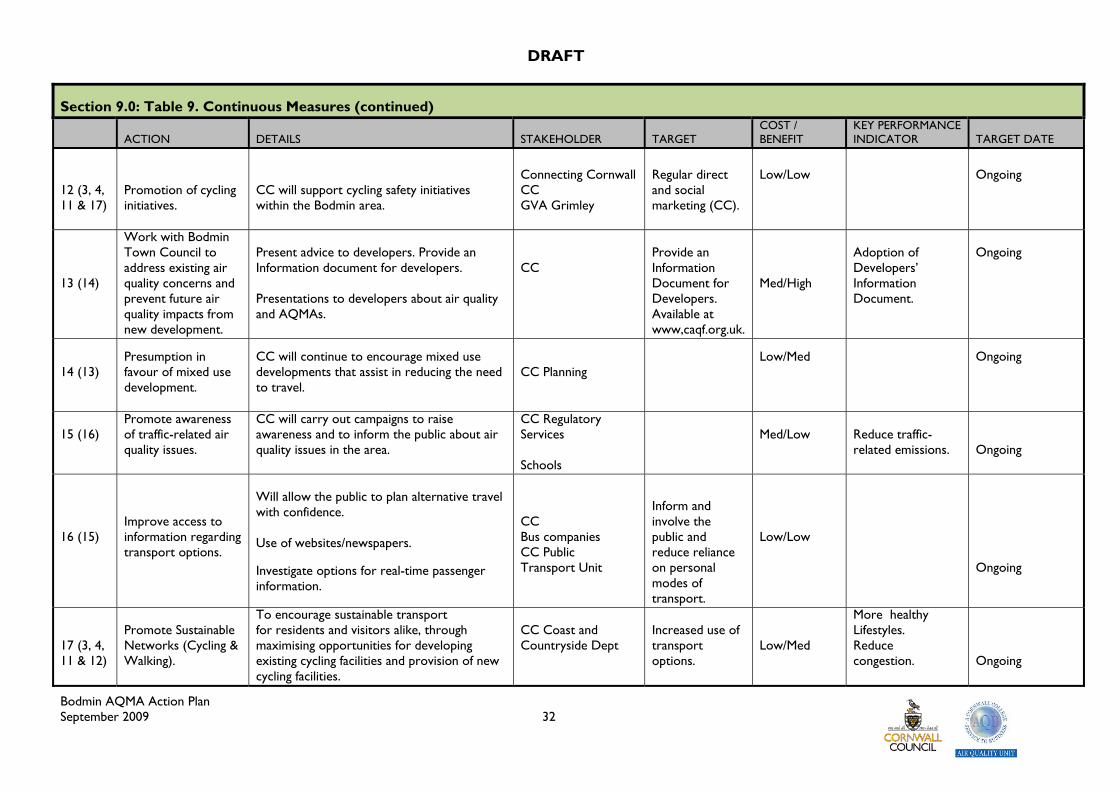
DRAFT
Bodmin AQMA Action Plan September 2009 32
Section 9.0: Table 9. Continuous Measures (continued)
ACTION DETAILS STAKEHOLDER TARGET COST / BENEFIT
KEY PERFORMANCE INDICATOR TARGET DATE
12 (3, 4, 11 & 17)
Promotion of cycling initiatives.
CC will support cycling safety initiatives within the Bodmin area.
Connecting Cornwall CC GVA Grimley
Regular direct and social marketing (CC).
Low/Low
Ongoing
13 (14)
Work with Bodmin Town Council to address existing air quality concerns and prevent future air quality impacts from new development.
Present advice to developers. Provide an Information document for developers. Presentations to developers about air quality and AQMAs.
CC
Provide an Information Document for Developers. Available at www,caqf.org.uk.
Med/High
Adoption of Developers’ Information Document.
Ongoing
14 (13)
Presumption in favour of mixed use development.
CC will continue to encourage mixed use developments that assist in reducing the need to travel.
CC Planning
Low/Med
Ongoing
15 (16)
Promote awareness of traffic-related air quality issues.
CC will carry out campaigns to raise awareness and to inform the public about air quality issues in the area.
CC Regulatory Services Schools
Med/Low
Reduce traffic-related emissions.
Ongoing
16 (15)
Improve access to information regarding transport options.
Will allow the public to plan alternative travel with confidence. Use of websites/newspapers. Investigate options for real-time passenger information.
CC Bus companies CC Public Transport Unit
Inform and involve the public and reduce reliance on personal modes of transport.
Low/Low
Ongoing
17 (3, 4, 11 & 12)
Promote Sustainable Networks (Cycling & Walking).
To encourage sustainable transport for residents and visitors alike, through maximising opportunities for developing existing cycling facilities and provision of new cycling facilities.
CC Coast and Countryside Dept
Increased use of transport options.
Low/Med
More healthy Lifestyles. Reduce congestion.
Ongoing
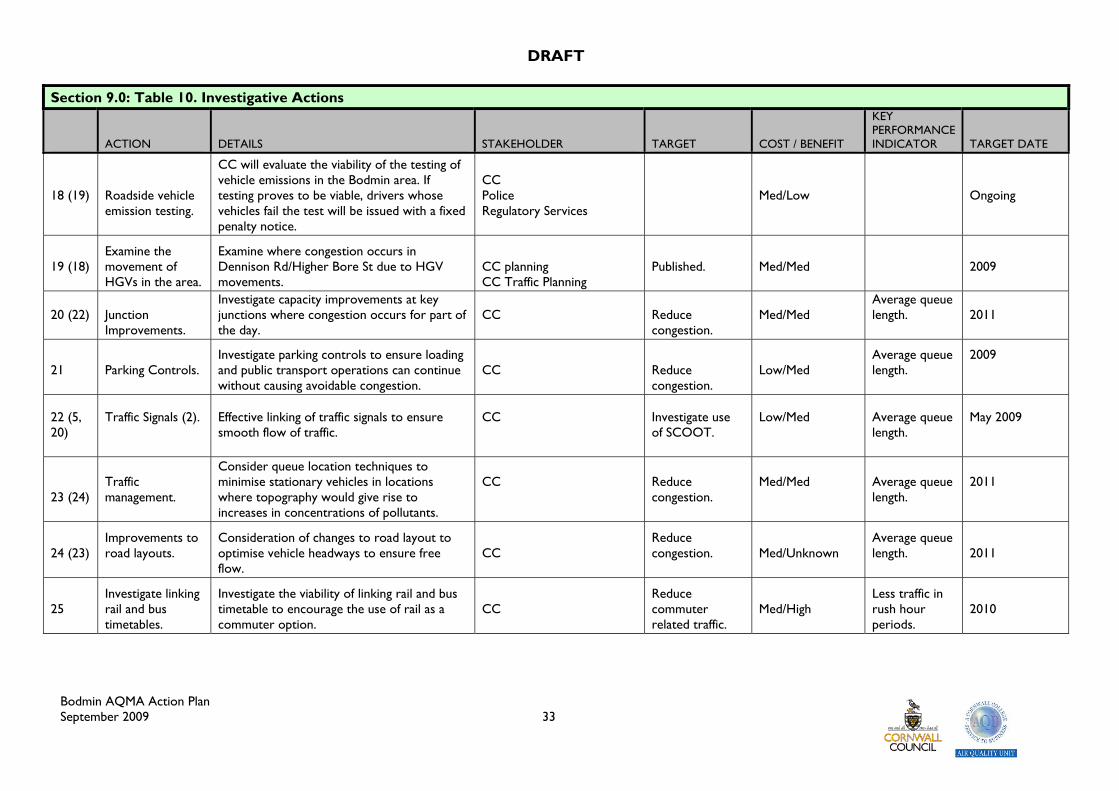
DRAFT
Bodmin AQMA Action Plan September 2009 33
Section 9.0: Table 10. Investigative Actions
ACTION DETAILS STAKEHOLDER TARGET COST / BENEFIT
KEY PERFORMANCE INDICATOR TARGET DATE
18 (19)
Roadside vehicle emission testing.
CC will evaluate the viability of the testing of vehicle emissions in the Bodmin area. If testing proves to be viable, drivers whose vehicles fail the test will be issued with a fixed penalty notice.
CC Police Regulatory Services
Med/Low
Ongoing
19 (18)
Examine the movement of HGVs in the area.
Examine where congestion occurs in Dennison Rd/Higher Bore St due to HGV movements.
CC planning CC Traffic Planning
Published.
Med/Med
2009
20 (22)
Junction Improvements.
Investigate capacity improvements at key junctions where congestion occurs for part of the day.
CC
Reduce congestion.
Med/Med
Average queue length.
2011
21
Parking Controls.
Investigate parking controls to ensure loading and public transport operations can continue without causing avoidable congestion.
CC
Reduce congestion.
Low/Med
Average queue length.
2009
22 (5, 20)
Traffic Signals (2).
Effective linking of traffic signals to ensure smooth flow of traffic.
CC
Investigate use of SCOOT.
Low/Med
Average queue length.
May 2009
23 (24)
Traffic management.
Consider queue location techniques to minimise stationary vehicles in locations where topography would give rise to increases in concentrations of pollutants.
CC
Reduce congestion.
Med/Med
Average queue length.
2011
24 (23)
Improvements to road layouts.
Consideration of changes to road layout to optimise vehicle headways to ensure free flow.
CC
Reduce congestion.
Med/Unknown
Average queue length.
2011
25
Investigate linking rail and bus timetables.
Investigate the viability of linking rail and bus timetable to encourage the use of rail as a commuter option.
CC
Reduce commuter related traffic.
Med/High
Less traffic in rush hour periods.
2010
Bodmin AQMA Action Plan Septembrer 2009
34
Section 9.0. Actions 9 (a) Smart Targets. (Table 8) Action 1: Prioritising the implementation of Safer Routes to School (SRS) and School Travel Plans (STPs) Cost/benefit / CC will work with local schools to raise awareness of traffic-related pollution and offer assistance to schools with the development and implementation of Travel Plans. The Bodmin AQMA Action Plan will inform CC’s School Travel Strategy “Safer Routes to School in Cornwall” initiative which is aimed at alleviating the problems caused to primary and secondary schools by increasing traffic levels and subsequent congestion (http://db.cornwall.gov.uk/ltp/school-travel-survey/section_182395554371.html). The CCC LTP2 (Section 8.6, Table 7 above) has committed significant resources to the Safer Routes to Schools initiative. The AQMA Action Plan will be promoted at the CC Annual Travel Plan Training Day for schools (April 2009). The AQU at Cornwall College actively works with local school to disseminate information about air quality and transport issues; this is done by a combination of presentations, workshops and field trips. Of the 55 schools in the North Cornwall district, 35 have an approved STP. There are a further 12 currently writing a their STP which will be submitted by the end of the March 2009. When these are approved it will mean that 85% of the schools in the district have an STP (Appendix 6). This is a very good uptake of the STP and reflects the successful work done by CC’s Safer Schools Initiative programme. In March and October 2006 CCC Travel Awareness Team undertook a Walk to School Week (WTSW) initiative. The initiative resulted in a small increase in both months in the number of people walking to school during WTSW compared to their normal mode of travel (Appendix 7). In the Bodmin AQMA AP on-line survey, of the respondents who gave their reasons for accessing Dennison Rd only four out those surveyed (3%) said that they were on the school run, although all of these journeys were also logged as a commuter journey. While Dennison Rd is not a major route for accessing schools in Bodmin it is anticipated that implementation of the STPs for all schools in the area may reduce vehicle numbers and result in a consequent reduction in pollution concentrations. The vehicle stock used for the schools bus service is old; CC will continue to lobby bus companies to improve the vehicle stock. CC will also continue to work with schools to ensure that their TPs are implemented. Costs associated with the above initiative are low as CC staff time for the CC “Safer Routes to School” initiative is already allocated. Benefits include improved health for children who will get more exercise and who will understand the air quality issues involved at an early age. Action 2: Support companies in developing Travel Plans (TPs) Cost/benefit / CC will continue to promote development and implementation of TPs. The NCDC online survey (Appendix 2) showed that 40% of respondents use Dennison Rd as a commuter route. With regard to car sharing, only 7% of respondents car-shared on a daily basis, 12% on a weekly basis, 10% on a monthly basis, 16% less than monthly and 56% never car-shared. The online survey also showed that 50% of respondents never used public transport and only 6% used it on a weekly basis. Comments showed that one of the main reasons for poor use of public transport is the lack of an integrated bus/rail timetable.

Bodmin AQMA Action Plan Septembrer 2009
35
Improvements in the integration of bus and rail timetables would be beneficial in encouraging commuters to Bodmin to use public transport. The Department for Transport (DfT) website offers support for companies in the preparation of TPs (DfT, 2009) for employers. The DfT website provides a “Workplace Travel Plan Evaluation Tool' and a “Travel Plan Resources Pack for Employers' and also offers guidance for residential and personal TPs. Details of these links will be made available on the CC website AQMA area and the Bodmin AQMA section of the CAQF website (www.cornwall-airquality.org.uk). The implementation of a TP for Derriford Hospital in Plymouth (Plymouth Hospitals NHS Trust, 2004) led to a 24% reduction in car use (1995 - 2001). The successful implementation of TPs by a significant number of businesses in the Bodmin area could result in a similar reduction in vehicle numbers and an associated reduction in traffic-related pollution. In order to assist developers, CCC developed a Travel Plan - Advice for Developers document (http://db.cornwall.gov.uk/documents/download.aspx?doc=129999). The document seeks to provide clarity for developers with regard to what is required in terms of a TP as well as providing a tool for CC Development Control Officers, CC Highways Development Control Officers and Planning Committees. Costs to CC in supporting companies in the development of TPs will be minimal as the implementation of TPs will be a condition of planning applications, the benefits to air quality from the implementation of TPs will be significant. There are no negative social equity issues associated with this action. Action 3: Improvement of the walking environment Cost/benefit / CC will continue to take steps to improve the pedestrian environment with improved priorities. As stated above, funding was specifically allocated by the NCDC Transport Programme for the improvement of the cycling and walking environment in the NCDC area. Results from the NCDC online survey (Appendix 2) show that 37% of respondents will use their car for journeys of less than one mile and 85% will use their car for journeys of 1 – 5 miles. As CC already promotes walking initiatives in the area future costs will be minimal and health benefits will be significant. There are no perceived negative social equity issues associated with this action. Action 4: Improvement of the cycling environment Cost/benefit / CC will support cycling safety initiatives within the Bodmin area. Responses to the online survey indicate that although the area is popular with recreational cyclists, cycling is not seen as a viable option for journeys through the town centre. CC has been successful in developing long sections of the Cornish Way network, which forms part of the National Cycle Network and around 300 km of on-road and off-road routes have been completed. Approximately 500,000 users per year access the Camel Trail and a lower number use less well known sections such as the St Piran Trail between Padstow and Newquay. Additionally, more localised, schemes have continued to be delivered through the first LTP. One such scheme is St Guron's Way which links east and west Bodmin (to the south of the town) using the railway corridor as a level link through open countryside. It provides a direct link between residential neighbourhoods and the industrial estates, schools, and leisure centre, all of which are accessible for all abilities in a safe, multi use corridor.

Bodmin AQMA Action Plan Septembrer 2009
36
Designed and built to a high standard the route is suitable for use round the clock and has become a popular alternative to traffic congestion on the town’s pressurised roads. The route is used by up to 100 school pupils per day in addition to work journeys and a good percentage of leisure trips. The greenway also links through to the Cornish Way (cycle route) enabling residents in east Bodmin to gain access to Lanhydrock almost entirely ‘off road’ or along quiet lanes. Issues raised by the Cycle Forum for Cornwall and the English Regions Cycling Development Team (ERCDT) assessment led, in 2004, to the launch of a revised cycle strategy for Cornwall. The ‘Delivering Cycling in Cornwall to 2011’ cycling strategy aims to address the areas where Cornwall could improve cycle delivery and is available as a supporting document to the LTP2 (http://db.cornwall.gov.uk/ltp/Cycle_Strategy/ ). The Visit Cornwall (ex Cornwall Tourist Board) site http://www.visitcornwall.com/site/activities/cycling-in-cornwall provides information on cycle routes in Cornwall. It is anticipated that the expansion of the cycle ways in and around Bodmin will lead to an increase in the number of people using the pathways for short journeys instead of their cars. Costs associated with this action are low as CC already promotes cycling initiatives in the area. There are no perceived negative social equity issues associated with this action. Action 5: Traffic Signals (1) Cost/benefit / Effective linking of traffic signals to ensure smooth flow of traffic using MOVA A MOVA (Microprocessor Optimised Vehicle Actuation) system will be installed at the pedestrian crossing in Dennison Rd. Via loop detectors the MOVA is able to detect gaps in the traffic at distance, thereby identifying approaching vehicles sooner and reducing vehicle waiting times. It will provide better optimisation of vehicle stops and delays and therefore have a positive impact on emissions. The Transport Research Laboratory (TRL) is keen to work with CC trialling the MOVA software for air quality improvements, in exchange for information about the pollution levels. The scheme is due to start on site summer 2009 and the effect of this installation on traffic flow will be evaluated. The costs of adjusting traffic signals will not be excessive but the benefits could be significant. There are no negative social equity issues associated with this action. 9 (b) Continuous Measures (Table 9) Action 6: Improve the Emission Standards of the Council Fleet Cost/benefit / CC will continue to promote the use of low emission vehicles for their own fleet. At present the CC fleet (including equipment e.g. mowers etc.) runs on a biodiesel/diesel blend. There are no costs savings to be made to CC but the use of biofuel helps to reduce the increase in atmospheric carbon dioxide levels and does not add any toxic materials or heavy metals to the environment. All CC HGVs are Euro 3 standard and CC has a commitment to replace vehicles as and when required with the latest Euro standard (Appendix 8). There would be localised benefits to air quality over an extended period. As the CC fleet already uses biofuels and has a policy of ensuring that all new equipment purchased conforms to the latest EU standard, cost will be minimal. There are no negative social equity issues associated with this action.

Bodmin AQMA Action Plan Septembrer 2009
37
Action 7: Minimise emissions from vehicle fleets in the AQMA Cost/benefit / CC will encourage commercial companies that operate significant numbers of HGVs in the AQMA area to reduce vehicle emissions. In order to investigate ways to minimise emissions from vehicles accessing the AQMA and their impact on reducing traffic-related pollution several possibilities have been considered, e.g. vehicle data and associated emission factors (NOx and NO2), the effect of scrappage schemes (see section 7.4 below) on reducing vehicle age and the impact of emissions on climate change and health. The minimisation of traffic-related emissions for some pollutants will occur as the result of old vehicles being replaced with newer ones and as improvements are made to fuels. However, research by the Air Quality Expert Group (AQEG) suggests that although reductions in total NOx emissions are expected to reduce the number of exceedences of NOx by 2010, this will not be the case with primary NO2 emissions which are predicted to increase (AQEG, 2007). Bearing this in mind, it will not be sufficient to rely on reductions to pollutant concentrations occurring solely as a result of newer vehicles and fuel improvements even though all new diesel vehicles have to comply with stringent Euro 5 standards, (Class I ≤1305 kg; Euro 5 by 2009: Class II 1305-1760 kg and Class III >1760 kg, by 2010, Appendix 8). Action 7. 1 Reducing emissions by improvements in vehicle stock Analysis of vehicle type data for Dennison Rd Annual Traffic Count (ATC) gave the following breakdown
• Motor bikes 0.1% • Cars 92.6% • Cars/light goods with trailer 0.7% • Medium Goods 5.4%, • HGVs 0.6% • Public Service Vehicles (PSVs) 0.5%
As stated above, the largest portion of traffic on Dennison Rd is cars, with a combined total of 92.6% (ATC). However, the disproportionately high contribution to the nitrogen dioxide levels experienced in this area from the Public Service Vehicles (PSVs) and HGVs means that the options considered will aim to concentrate on these modes which are the most polluting as well as modes with the highest volume. In order to assess the condition of business vehicles that access the AQMA, NCDC wrote to bus companies and businesses in the area which operate a significant vehicle fleet. NCDC apprised them of the aims and actions of the Action Plan and requested details concerning the age of the vehicles and operating procedures (e.g. the use of biofuels). Companies were also requested to participate in the consultation process. The response from companies was disappointing. However, Summercourt Bus Company did respond and stated that bio-diesel is used in all its vehicles and those vehicles which operate in the Bodmin area are Euro 2 or Euro 3. All HGVs in the CC fleet will be replaced with the latest Euro standard as and when they are replaced. CC will continue to lobby companies that operate significant HGV and PSVs in the area in order to ensure that they are aware of their responsibilities with regard to reducing emissions and conforming to European standards. From September 2009, all new diesel LGVs Class I ≤ 1305 kg have to comply with stringent Euro 5 standards and all Class II (1305-1760 kg) and Class III (>1760 kg) by September 2010.
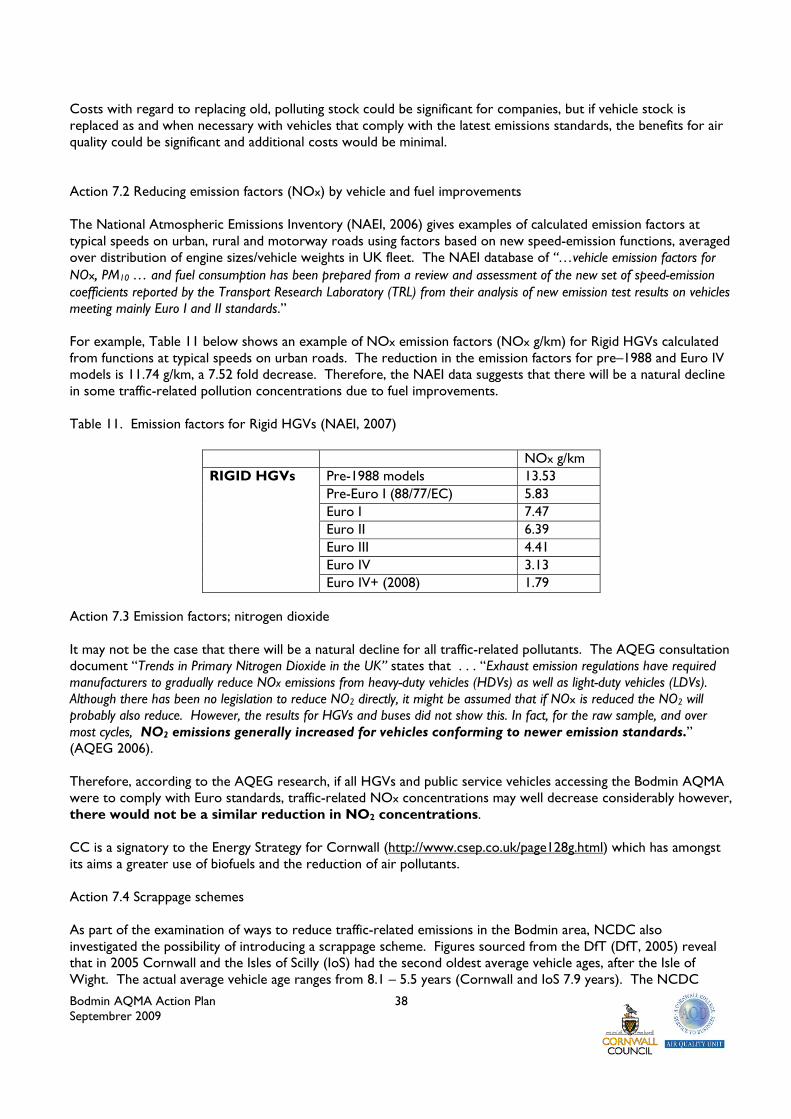
Bodmin AQMA Action Plan Septembrer 2009
38
Costs with regard to replacing old, polluting stock could be significant for companies, but if vehicle stock is replaced as and when necessary with vehicles that comply with the latest emissions standards, the benefits for air quality could be significant and additional costs would be minimal. Action 7.2 Reducing emission factors (NOx) by vehicle and fuel improvements The National Atmospheric Emissions Inventory (NAEI, 2006) gives examples of calculated emission factors at typical speeds on urban, rural and motorway roads using factors based on new speed-emission functions, averaged over distribution of engine sizes/vehicle weights in UK fleet. The NAEI database of “…vehicle emission factors for NOx, PM10 … and fuel consumption has been prepared from a review and assessment of the new set of speed-emission coefficients reported by the Transport Research Laboratory (TRL) from their analysis of new emission test results on vehicles meeting mainly Euro I and II standards.” For example, Table 11 below shows an example of NOx emission factors (NOx g/km) for Rigid HGVs calculated from functions at typical speeds on urban roads. The reduction in the emission factors for pre–1988 and Euro IV models is 11.74 g/km, a 7.52 fold decrease. Therefore, the NAEI data suggests that there will be a natural decline in some traffic-related pollution concentrations due to fuel improvements. Table 11. Emission factors for Rigid HGVs (NAEI, 2007)
NOx g/km RIGID HGVs Pre-1988 models 13.53 Pre-Euro I (88/77/EC) 5.83 Euro I 7.47 Euro II 6.39 Euro III 4.41 Euro IV 3.13 Euro IV+ (2008) 1.79
Action 7.3 Emission factors; nitrogen dioxide It may not be the case that there will be a natural decline for all traffic-related pollutants. The AQEG consultation document “Trends in Primary Nitrogen Dioxide in the UK” states that . . . “Exhaust emission regulations have required manufacturers to gradually reduce NOx emissions from heavy-duty vehicles (HDVs) as well as light-duty vehicles (LDVs). Although there has been no legislation to reduce NO2 directly, it might be assumed that if NOx is reduced the NO2 will probably also reduce. However, the results for HGVs and buses did not show this. In fact, for the raw sample, and over most cycles, NO2 emissions generally increased for vehicles conforming to newer emission standards.” (AQEG 2006). Therefore, according to the AQEG research, if all HGVs and public service vehicles accessing the Bodmin AQMA were to comply with Euro standards, traffic-related NOx concentrations may well decrease considerably however, there would not be a similar reduction in NO2 concentrations. CC is a signatory to the Energy Strategy for Cornwall (http://www.csep.co.uk/page128g.html) which has amongst its aims a greater use of biofuels and the reduction of air pollutants. Action 7.4 Scrappage schemes As part of the examination of ways to reduce traffic-related emissions in the Bodmin area, NCDC also investigated the possibility of introducing a scrappage scheme. Figures sourced from the DfT (DfT, 2005) reveal that in 2005 Cornwall and the Isles of Scilly (IoS) had the second oldest average vehicle ages, after the Isle of Wight. The actual average vehicle age ranges from 8.1 – 5.5 years (Cornwall and IoS 7.9 years). The NCDC

Bodmin AQMA Action Plan Septembrer 2009
39
online survey results show that for the 136 respondents to question 5, (age of vehicle) 29% have vehicles that are nine or more years old. The average age of vehicles is increasing and older vehicles pollute more than newer ones particularly those manufactured before 1993 (pre Euro 1 standard). However, financial incentives aimed at encouraging drivers to replace older vehicles would need to be provided at a national and not local level. Schemes to exclude older, more polluting vehicles from the AQMA may lead to some small reductions in NOx emissions. A scrappage scheme would be an incentive to owners of older vehicles to replace with newer car or a public transport pass thus forcing older cars off the road by either restricting their use from environmentally sensitive areas or banning their use completely. This would however require a Government backed vehicle scrappage scheme and this has not been used yet in the UK. As a result of the recent economic downturn, the UK government has offered consumers a "scrappage" premium of up to £2000 to get rid of old cars and buy new, eco-friendly models in a move to revitalise the market. Under the plans owners of older cars - those more than 10 years old - would receive £2000 discount on new models. This would only apply to brand-new cars and would constitute £1000 from Government and £1000 from car dealers The Commission for Integrated Transport (CfIT, 2006) highlights the fact that while a scrappage scheme may be effective in improving the average emissions performance of the vehicle fleet which may lead to a slight reduction in overall traffic-related emissions (some people will choose not to replace their vehicle whilst others will switch to newer, less polluting ones) there are some real disadvantages to such a scheme, “. . . i.e. insignificant reductions in traffic-related pollution, environmental issues (increased use of energy and resources to produce new vehicles), social equity issues (46% of cars owned by those in the lowest income quintile are more than 10 years old), enforcement issues (recognition cameras would be required) and cost implications” (CfIT, 2006). It is difficult to assess the reduction in NOx emissions in the AQMA that might result from a vehicle scrappage scheme but it could be about 1%. Although the benefits would extend beyond the AQMA, CC will not be implementing a scrappage scheme as the costs involved would be prohibitive.
Action 7.5 Climate change and health impacts With regard to climate change and health impacts, in January 2007 the European Commission (EU, 2007) introduced new requirements for all new vehicles to comply with Euro standards for transport fuels that will reduce their contribution to climate change and air pollution, including through a greater use of biofuels.
“The proposed standards will not only make the fuels themselves 'cleaner' but will also allow the introduction of vehicles and machinery that pollute less. A key measure foreseen is that, to encourage the development of lower-carbon fuels and biofuels, suppliers will have to reduce the greenhouse gas emissions caused by the production, transport and use of their fuels by 10% between 2011 and 2020. This will cut emissions by 500 million tonnes of carbon dioxide by 2020 - equivalent to the total combined emissions of Spain and Sweden today. A new petrol blend will be established allowing higher content of the biofuel ethanol, and sulphur levels in diesel and gasoil will be cut to reduce emissions of dangerous dust particles” (European Commission, 2007).
In April 2008 the Renewable Transport Fuels Obligation (RTFO) measure came into force under the 2004 Energy Act. This is one of the most important measures currently in place to force transport fuel producers to move towards alternatives to fossil fuels. The RTFO requires transport fuel suppliers to ensure that a proportion of their total fuel sales are from renewable sources. The target for the first year of the RTFO - 2008/09 - has been set at 2.5% by volume and 3.75% the following year. By 2010/11 the Obligation will require 5% of all fuel sold on UK forecourts to be produced from renewable sources. From 1 January 2009 all diesel fuel marketed has to have an ultra-low sulphur content (no more than 10 ppm). This will cut pollutant emissions, primarily of dust particles ('particulate matter'), the air pollutant most dangerous for human health.
Bodmin AQMA Action Plan Septembrer 2009
40
In the Bodmin AQMA online survey 85% of respondents said that they would be willing to consider using biofuels if they were more readily available. Action 7: Summary: Although reductions to some traffic-related pollutants will occur naturally as the result of improvements to the vehicle stock and fuel, it does not necessarily follow that concentrations of nitrogen dioxide will decrease sufficiently. Changes to diesel fuels will also have beneficial effects with regard to climate change impacts but a “do nothing” policy will not be sufficient to reduce emissions. With regard to specific actions that CC can take to reduce emissions, it is not considered practical to initiate a scrappage scheme for the Bodmin AQMA due to the costs involved. CC will continue to lobby local companies and will actively promote the use of Euro compliant vehicles that access the area. The aims of the CCC LTP2 and of the NCDC Transport Programme detailed above (8.6 Cornwall Local Transport Plan (LTP2) 2006 – 2011) will directly feed in to Action 7. The costs of minimising emissions from vehicle fleets have been estimated as being moderate. With regard to social equity issues, it is not considered that the reduction in emissions through the measures outlined in Action 7 will have any negative impacts although, the costs involved in upgrading vehicles (if mandatory) would impact on the poorer members of society. Action 8: Ongoing monitoring of traffic and air pollutants Cost/benefit / Use to publicise air quality in the area and to monitor the impact of actions. The monitoring of traffic-related pollutants in the Bodmin AQMA by both continuous monitoring and diffusion tube monitoring will continue. The monitoring in Dennison Rd of traffic flow speed and vehicle type will also continue. To date, a significant database of pollution and traffic data for the Bodmin area has been compiled. Continuing monitoring will allow the impact on air quality of future changes and developments in the area to be assessed and will identify any changes in pollution concentrations which may occur as the result of the actions. Costs associated with continuing monitoring are moderate (the monitoring equipment has already been purchased). Therefore, future costs will be for maintenance and data analysis. The benefits from ongoing monitoring will be significant with regard to measuring the effectiveness of implementing actions. Action 9: Require TPs to be submitted with planning applications Cost/benefit / CC will continue, where appropriate to attach planning conditions relating TPs to planning consents. By using the information supplied by the “Development Control: Planning for Air Quality” document (NSCA, 2006) and the “Cornwall District and County Councils’ Air Quality and Land Use Planning Information Document” (CAQF, 2007) CC planning department is aware of the air quality issues involved with development planning and the role of the TP in this process. All new development in Bodmin will be required to develop a TP. Both CC and the Highways Agency will look for TPs to be implemented through the planning process using either planning conditions or S106 Agreements. Section 106 (S106) of the Town and Country Planning Act 1990 allows a Local Planning Authority (LPA) to enter into a legally binding agreement or planning obligation with a landowner in association with the grant of planning permission. The obligation is termed a Section 106 Agreement.

Bodmin AQMA Action Plan Septembrer 2009
41
Costs to CC will be minimal but the benefits will be significant. There are no negative social equity issues associated with this action. Action 10: Promote TPs for existing businesses and transport awareness Cost/benefit / CC will encourage people who drive regularly though the area to consider using other forms of transport for some journeys such as switching to bus & rail or walking and cycling. This will generate increased awareness and reduce car travel. As a part of LTP2 CC identified major employers in Cornwall and has developed a set of “Tools” that can be applied to Workplace Travel Plans in Cornwall (CCC, 2006). The LTP2 has also developed a range of public transport improvements which will feed into the Actions within this Action Plan and also play a significant role in the delivery of TPs. Costs to CC would be minimal and the benefits of promoting TPs and of raising people’s awareness of transport issues and options could be significant. There are no social equity issues associated with this action. Action 11: Promotion of walking – initiatives Cost/benefit / CC will participate in initiatives to promote walking. There are many existing initiatives in the North Cornwall area which promote walking; these can be accessed via the LEAPActive site www.leapactive.org and the Walk Cornwall site http://www.walkcornwall.com. As stated above, 85% of respondents to the online survey chose to use their cars for journeys of 1-5 miles and 37% would use their cars for journeys of less than one mile. Walking as a recreational activity is popular but when accessing Bodmin town centre people choose to use their cars. Improvements to the walking environment within the town centre may encourage more people to walk rather than drive. CC already promotes walking initiatives in the area. There are no perceived negative social equity issues associated with this action. Action 12: Promotion of cycling - initiatives Cost/benefit / CC will work towards the development of improved cycle routes and to support the provision of facilities i.e. secure cycle parking. There are existing initiatives in the North Cornwall area such as “Pedal Back the Years” which promote cycling; these can be accessed via the LEAPActive site www.leapactive.org. The Sustrans site also promotes cycling in Cornwall (http://www.sustrans.org.uk/default.asp?sID=1092667884046). Cycling as a recreational activity in the Bodmin area is also very popular and many people choose to drive to the area with their bicycles to access the recreational facilities. Cycling is not seen as a viable mode of transport within the town centre (Appendix 2 sections 12 – 14). By improving cycling facilities within the town centre this situation may be changed and people may be encouraged to use cycles for local journeys. To this end the St Gurons Way cycle/walk route has been opened to the south of Bodmin. Designed and built to a high standard the route is suitable for use round the clock and is a popular alternative to the traffic congestion on the town’s pressurised roads. The route is used by up to 100 school pupils per day in addition to work journeys and leisure trips. St Gurons Way also links through to the Cornish Way (cycle route) enabling residents in east Bodmin to gain access to Lanhydrock almost entirely ‘off road’ or along quiet lanes.
Bodmin AQMA Action Plan Septembrer 2009
42
CC already promotes cycling initiatives in the area. There are no perceived negative social equity issues associated with this action. Action 13: Work with BTCFP, developers and stakeholders with regard to air quality. Cost/benefit / Provide advice to developers throughout Bodmin area; provide an information document for developers; give presentations to developers about air quality and AQMAs. An “Information for Developers” document (CAQF 2007) has been developed by the AQU which gives specific information with regard to the requirements for air quality assessments related to development in the Bodmin town centre area. Further guidance may also be obtained from the National http://www.environmental-protection.org.uk/assets/library/documents/Development_Control_planning_for_air_quality.pdf Air quality and transport issues are actively being highlighted with regard to development in the Bodmin area, costs therefore will be minimal and the benefits will be high. There are no social equity issues associated with this action. Action 14: Presumption in favour of mixed use development Cost/benefit / CC will continue to encourage mixed use developments that assist in reducing the need to travel. Mixed use development is specifically promoted in the BTCFP. The aim of promoting mixed use developments is to ensure that quality employment is available alongside residential development within the Bodmin area and thus the need to commute out of the area to work will be reduced. CCC LTP2 also makes specific reference to the need for mixed use developments which are supported by an Integrated Transport Strategy. CC is therefore actively promoting new developments which contain good quality local facilities in close proximity to residential and employment areas, thus reducing the need to travel. Costs to CC are low and benefits, both social and environmental could be significant. Action 15: Promote awareness of traffic-related air quality issues Cost/benefit / CC will carry out campaigns to raise awareness and to inform the public about air quality issues in the area. CC will promote awareness of air quality issues, specifically related to traffic and traffic congestion. Costs to CC are low and benefits, both social and environmental could be significant. Action 16: Improve access to information regarding transport options To allow the public to plan alternative travel with confidence. Public Transport and Travel website (http://www.cornwall.gov.uk/default.aspx?page=4470). CC maintains a Public Transport and Travel website which provides users with information on timetables, prices and other information on current services. Often there are more than one company running services in the area, the links to Traveline

Bodmin AQMA Action Plan Septembrer 2009
43
and UK Public transport information gives information and timetables for all types of services for the whole of the UK and allows the public access to integrated travel information. The site also provides links to Cornwall Council road works reports for Cornwall and to Corlink for information on Cornwall's first demand responsive public transport. Cornwall Council operates Rural Transport Partnerships. The Partnership is funded by Cornwall Council and it split into East and West Cornwall (including the Isles of Scilly). The East Cornwall Rural Transport Partnership (ECRTP) (established 1999) was one of the first of its kind in the UK and “. . . aims to support the rural communities of north and east Cornwall to access employment, training and essential services and facilities through community based transport projects.” The Partnership Office works with local community groups to identify transport needs in rural areas and give advice and help to implement projects to address those needs and offers part finance for small local transport schemes, such as information boards, surveys and volunteer driver training. (http://www.cornwall.gov.uk/default.aspx?page=6017). Costs of promoting existing initiatives through the CC websites and local press are minimal. Benefits of promoting sustainable transport will be moderate and indirect. There are no negative social equity issues. Action 17: Promote Sustainable Networks (cycling & walking) To encourage sustainable transport for residents and visitors alike, through maximising opportunities for developing existing cycling facilities and the provision of new cycling facilities. The high prevalence of physical inactivity in the general population and the strong association with increased risk of illness makes trying to get more people to do exercise a public priority (DoH, 2005). According to the NCDC online survey 23% of people would use their cars for journeys of less than one mile. Walking and cycling both offer advantages over many other forms of exercise in that they can be conducted almost anywhere and for the most part can be undertaken without specialist supervision. The financial gross costs of increasing physical activity via walking and cycling programmes, to both CC and to the individual should therefore be minimal. Although CC does not operate a Healthy Workplaces initiative (whereby members of staff are encouraged to participate in more physical activity), it is anticipated that this initiative will implemented. This will include the promotion of walking (including the hire of pedometers) and cycling (by providing pool bikes and other cycle facilities). Cornwall Council are investigating the implementation of a salary sacrifice scheme to enable members of staff to purchase new bikes. The aims of the CCC LTP2 and of the NCDC Transport Programme detailed above (5.1.6 Cornwall Local Transport Plan (LTP2) 2006 – 2011) will directly feed in to Actions 4, 5, 11 and 12 and £74,000 has been specifically allocated to cycling and walking initiatives in the Bodmin area (Table 7, p 28).
Action 18: Roadside vehicle emission testing CC will evaluate the viability of the testing of vehicle emissions in the Bodmin area. If testing proves to be viable, drivers whose vehicles fail the test will be issued with a fixed penalty notice. As stated above (section 7.4), vehicles in Cornwall have the second oldest average vehicle age in the UK. Older vehicles contribute disproportionately to total emissions from road transport in comparison to their numbers. Under the Road Traffic Vehicle Emissions Regulations (2002) LAs that have designated an AQMA can apply to the Secretary of State for powers to conduct roadside testing of vehicle emissions and issue fixed penalty notices to drivers whose vehicles fail. There would be a revenue cost for enforcement and the estimated reduction in NOx
9 (c) Investigative Actions (Table 10)

Bodmin AQMA Action Plan Septembrer 2009
44
emissions in the AQMA would be small. There could be a benefit in some streets where cars are the largest single contributor but again the reduction would be small probably no more than 0.5% (NAEI, 2006). Although emission testing would only have a small impact on NOx emissions in the AQMA, it might be seen as a statement of CC’s intent to tackle the problem across the District generally. A better option might be to exclude older more polluting vehicles from the AQMA (see scrappage schemes). It is considered that it will be costly to implement and have relatively little beneficial impact. With regard to social equity, emission testing would probably impact more significantly on the poorer members of society who have older, more polluting vehicles. However, this would not exclude them from having to conform to emissions standards. Action 19: Examine the movement of HGVs in the area Cost/benefit / Examine where congestion occurs in Dennison Rd and Higher Bore St due to HGV movements. The traffic counter which is located in Dennison Rd, allows traffic data to be analysed for traffic type and speed. There are no associated costs for CC as the analysis of data will be ongoing as part of their Review and Assessment process. A survey of HGV movements was undertaken by CCC in order to determine the numbers of HGVs that access the area on the 20th September 2007 for the period 07.00 – 19.00. Results showed that a total of 1191 HGVs entered the survey area, the majority of which accessed the A38R and the A38 at the eastern side of Bodmin. However a significant proportion of HGVs were matched (in a 15 minute period) traversing Bodmin via the main route (Dennison Rd) through the town (Appendix 5). The results of the HGV survey will inform traffic management decisions. Costs associated with this action are low but direct benefits will be moderate and there are no associated negative social equity issues. Action 20: Junction improvements CC will investigate capacity improvements at key junctions where congestion occurs for part of the day. As surveys are already being undertaken by CC and experimental traffic management at specific junctions is underway, future costs are therefore moderate and benefits from the reduction of congestion will be significant. No social equity issues have been identified. Action 21: Parking Controls Investigate parking controls to ensure loading and public transport operations can continue without causing avoidable congestion. Improved kerbside management: with the introduction of Civil Parking Enforcement (CPE), enforcement of parking restrictions is now regular although days of the week and times are varied in order to ensure that people do not become accustomed to the times the Civil Enforcement Officers visit. Different types of restrictions are dealt with in the same way throughout the entire county so enforcement is more consistent. Surveys have shown that the number of vehicles contravening restrictions has reduced. Costs will be moderate but the benefits to air quality from reducing congestion will be significant. Action 22: Traffic Signals (2) Effective linking of traffic signals to ensure smooth flow of traffic. The aim is to provide a smooth flow of traffic by careful linking of traffic signals and allowing traffic to queue in places which do not have an air quality problem. Technology is constantly providing advancements in traffic signal
Bodmin AQMA Action Plan Septembrer 2009
45
control systems and potential exists to improve traffic flow through closely structured traffic signals by use of “SCOOT” (Split Cycle Offset Optimisation Technique) systems. These improvements should give smoother flow through existing traffic signals, reducing queuing and thereby congestion and pollution. The costs of adjusting traffic signals will not be excessive but the benefits could be significant. There are no negative social equity issues associated with this action. Action 23: Transportation Management Transport measures will aim to achieve Transport Aim 3 and 5 which are outlined in the CCC LTP2. Initial research established the average speed along Dennison Rd is 15-25 km/h. For 10% of the day the road suffers saturated conditions, particularly for eastbound traffic flows. It is considered that this could be reduced by 2-3% if heavy vehicles are kept moving through Dennison Rd, this would also help to prevent stop-start conditions.
• Queuing currently takes place in the morning before 09.00 on Turf St as far as the traffic lights. This may be attributed to parents dropping off school children in the Priory car park.
• Traffic entering Fore St is either seeking a parking space, dropping off passengers just following a convenient route. It is thought probable that any further restriction on Fore St may impact on Dennison Rd.
• The HGV component has a greater contribution to pollution at peak times than other types of vehicle. • The Puffin Crossing adjacent to Rhind St significantly slows traffic flow.
The following four approaches to transportation management should be adopted when investigating transport improvements to help improve air quality:
• Divert traffic away on alternative routes o Review signing of primary route destinations avoiding the need to travel through Bodmin. o Ensure signing is consistent at Innis Downs, Carminow and Wadebridge. o Ensure that signing is consistent at A30 Cookland and A38 Carminow.
• Ease congestion o The effects of the removal of restrictions in the flow of traffic will be explored. o Lay-by places for buses will be considered. o The timing and position of the Puffin crossing on Rhind St will be investigated.
• Queue management o Locations where queuing traffic can be relocated away from sensitive areas will be identified.
• Time restriction o The opportunity for time restrictions on Dennison Rd particularly for heavy commercial
vehicles (not buses) will be explored. o An HGV survey has been undertaken, results will inform future decisions.
Action 24: Road changes/ improvements for consideration Land needs to be made available at Church Square for there to be any long-term plans for meaningful road layout changes.

Bodmin AQMA Action Plan Septembrer 2009
46
Action 25: Road/rail timetable link Investigate the viability of linking rail and bus timetables to encourage the use of rail as a commuter option. The online survey highlighted the lack of an integrated rail/bus timetable. Several respondents stated that they would be willing to use the railway to commute if a suitable bus link was available. Previous bus services which were linked to rail timetables proved unviable due to a lack of passenger numbers. CC will investigate the viability of reintroducing a linked bus/rail timetable 10.0 Summary This Action Plan intends to address air quality problems which exist due to the present situation within the Bodmin AQMA. Due to the extensive number of developments which are proposed for the Bodmin area this may change significantly, therefore this action plan is, by necessity, a fluid and dynamic document. It will form the basis of actions which will be required to address present air quality issues in the AQMA and will be subject to future revisions as necessary. Development sites that are identified as having a potential air quality impact will be addressed via the planning process. The actions outlined in this plan come under four headings as follows;
• Behavioural measures and modal shift - reducing the amount of traffic overall; • Traffic management - modifying traffic behaviour to control where emissions are generated; • Road improvements; • Emissions reduction at source - reducing the emissions level per vehicle.
Due to the road layout in and around Bodmin it may prove difficult to make sufficient changes to traffic flow to provide a reduction in pollution levels. This is particularly relevant as MGVs, HGVs and PSVs are disproportionately responsible for inputs to air pollution levels. The investigative actions in this AP are intended to allow the development of alternative transport methods, soft transport policy measures (workplace travel plans, personalised travel planning, public transport marketing, travel awareness etc) and to encourage behavioural change for local residents and commuters. These measures will mainly be aimed at car users. Other actions, such as transport management measures outlined in this action plan will be aimed at reducing numbers of the more polluting vehicles (MGVs, HGVs etc) which access the area. Not all the actions proposed will have a direct impact on the reduction of traffic-related pollution concentrations but through, for example, the development of TPs, behavioural changes will be made which will lead to a reduction of vehicle numbers.
Bodmin AQMA Action Plan Septembrer 2009
47
DEFRA Action Planning requirements compliance checklist This checklist has been introduced to indicate where the work expected by DEFRA has been undertaken in relation to this Action Plan. Work area included Location within the report or considered? and comments Process Adherence to Guidelines and Consideration of Policies Have Statutory Consultees been consulted? Yes Section 4.1/4.2/4.2.1 Have other LA departments been consulted? Yes Section 4.2/Appendix 3 Statement of problem causing AQMA Yes Section 2/3/5 Have the principle sources of pollutants causing the exceedence been identified? Yes Section2/5 Have other LA plans/policies been considered? Yes Sections 7/8 Has an options timescale been included? Yes Section 9 Have cost of options/plan been set out? Yes Section 9 Have impacts been assessed? Yes Section 9 Process - Checklist of Measures Have options been considered? Yes Throughout & Section 9 How many options have been considered? 25 Section 9 Have transport impacts been assessed? Yes Throughout Have air quality impacts been assessed? modelled or measured? both Throughout & Sections 2 & 5 Have socio-economic impacts been assessed/considered Yes Section 7/9 Have other environmental impacts been assessed? Yes Section 9 Have costs been considered? Yes Section 9 Appropriateness and Proportionality Do measures seem appropriate to the problem? Yes Throughout Have the measures been assessed? Yes Section 9 Are the measures likely to achieve the stated goal? in some areas Have the wider impacts been appraised appropriately? Yes Section 9 Was the method of assessing costs appropriate? Yes As outlined in EPUK Guidance Is it likely for LAQM objectives to be met? in some areas
Do the chosen measures comply with wider Government Policies? Yes Support and comply with
wider policies. Sections 7/8 Implementation Are measures realistic in light of the objective deadlines? Yes Each action has a target Have responsibilities been assigned to the relevant party? Yes Throughout Does the assigned party have the necessary powers? Yes Yes for decided actions. Has financing been secured and who will pay? Yes Section 9
Bodmin AQMA Action Plan Septembrer 2009
48
References Acheson, D. (1998) Independent Inquiry into Inequalities in Health. The Stationery Office ISBN 0 11 322173 8. AEAT (AEA Technology) (2006) Air Quality and Social Deprivation in the UK: an environmental inequalities analysis: Final Report to Department of Environment, Food and Rural Affairs: AEAT/ENV/R/2170 AQEG (Air Quality Expert Group) (2007) Trends in Primary Nitrogen Dioxide in the UK: http://www.defra.gov.uk/environment/airquality/publications/primaryno2-trends/pdf/primary-no-trends.pdf. Accessed 08/04/09. Barnes, J. (2005) GIS mapping of nitrogen dioxide diffusion tube monitoring in Cornwall, UK. In: Brebbia C.A. (ed.), (2005). Air Pollution XIII, WIT Transactions on Ecology and the Environment, 82: 157-166. Brunekreef, B. and Holgate, S.T. (2002) Air pollution and health. The Lancet, 360: 1233-1242. CAQF (Cornwall Air Quality Forum) (2007) Cornwall District and County Councils’ Air Quality and Land Use Planning Information Document. http://www.cornwall-airquality.org.uk/Developers_Guidance.html. Accessed 08/04/09. CAQS (Cornwall Air Quality Strategy) http://www.cornwall-airquality.org.uk/pdf/finalstrategyreport.pdf. Accessed 05/04/09. CC (Cornwall Council (2008) Sustainable Community Strategy for Cornwall http://www.cornwallstrategicpartnership.gov.uk/media/adobe/n/d/Sustainable_Community_Strategy_for_Cornwall.pdf. Accessed 15/04/09.
CCC (Cornwall County Council) (2006) Cornwall Local Transport Plan (LTP2) 2006 - 2011. http://db.cornwall.gov.uk/ltp/ltp20062011/index.html. Accessed 08/04/09. CfIT (Commission for Integrated Transport) (2006) http://www.cfit.gov.uk/docs/2005/ccdefra/04.htm. Accessed 08/04/09. DEFRA (Department for the Environment, Food and Rural Affairs) (2009) Technical Guidance LAQM.TG(09) http://www.defra.gov.uk/environment/airquality/local/guidance/pdf/tech-guidance-laqm-tg-09.pdf. Accessed 08/04/09. DEFRA (Department for the Environment, Food and Rural Affairs) (2007) The Air Quality Strategy for England, Scotland, Wales and Northern Ireland. http://www.defra.gov.uk/environment/airquality/strategy/pdf/air-qualitystrategy-vol1.pdf. Accessed 08/04/09. DfT (Department for Transport) (2004) The Future of Transport - White Paper. CM6234 http://www.dft.gov.uk/about/strategy/whitepapers/previous/fot/. Accessed 08/04/09. DfT (Department for Transport) (2006) Full guidance on Local Transport Plans: Second Edition. http://www.dft.gov.uk/pgr/regional/ltp/guidance/fltp/ . Accessed 08/04/09. DfT (Department for Transport) (2005) Vehicle Licensing Statistics: 2005. http://www.dft.gov.uk/pgr/statistics/datatablespublications/vehicles/licensing/vehiclelicensingstatistics2005b. Accessed 08/04/09. DfT (Department for Transport) (2009) Travel plans. http://webarchive.nationalarchives.gov.uk/+/http://www.dft.gov.uk/pgr/sustainable/travelplans/work/publications/travelplans. Accessed 08/04/09.

Bodmin AQMA Action Plan Septembrer 2009
49
DoH (Department of Health) (2005) Choosing Activity: a physical activity action plan. http://www.dh.gov.uk/PublicationsAndStatistics/Publications/PublicationsPolicyAndGuidance/PublicationsPolicyAndGuidanceArticle/fs/en?CONTENT_ID=4105354&chk=ixYz2B. Accessed 08/04/09. EU (European Commission) (2007) Stricter fuel standards to combat climate change and reduce air pollution. IP/07/120 http://europa.eu/rapid/pressReleasesAction.do?reference=IP/07/120&format=PDF&aged=1&language=EN&guiLanguage=fr. Accessed 08/04/09. Miller, K. A (MA) Siscovick, D.S., (M.D., M.P.H. ), Sheppard, L., (Ph.D.), Shepherd, K., (M.S.), Sullivan, J. H., (M.D., M.H.S.), Anderson, G.L. (Ph.D.), and Kaufman, J.D., (M.D., M.P.H). (2007) Long-Term Exposure to Air Pollution and Incidence of Cardiovascular Events in Women. NCDC (North Cornwall District Council) (2008) 4th Round Review and Assessment of Air Quality: Further Assessment. http://www.cornwall-airquality.org.uk/Reports/North_Cornwall/NCDC_Further_Assessment_2008.pdf. Accessed 08/04/09. NAEI (National Atmospheric Emissions Inventory) (2006) Vehicle Speed Emission Factors Spreadsheet (Version 02/2). Http://www.naei.org.uk/other/uk_fleet_composition_projections_v2.xls. Accessed 08/04/09. NAEI (National Atmospheric Emissions Inventory) (2007) Road Transport FAQs http://www.naei.org.uk/faqs.php. Accessed 08/04/09. NSCA (National Society for Clean Air) (2006) Development Control: Planning for Air Quality. NSCA, Brighton. National Statistics (2008) Neighbourhood Statistics. http://neighbourhood.statistics.gov.uk/dissemination/AreaProfile1.do?tab=1. Accessed 08/04/09. ODPM (Office of the Deputy Prime Minister) (2004) Indices of Deprivation 2004 http://www.communities.gov.uk/archived/general-content/communities/indicesofdeprivation/216309/. Accessed 08/04/09 Pennycook, F., Barrington-Craggs, R., Smith, D. and Bullock, S. (2001) Environmental justice: mapping transport and social exclusion in Bradford. Friends of the Earth, www.foe.co.uk/resource/reports/env_justice_bradford.pdf. Accessed 08/04/09. Peters, J. (2007) Pollution harms developing lungs. http://news.bbc.co.uk/1/hi/health/3637856.stm. Accessed 08/04/09. Plymouth Hospitals NHS Trust (2004) Derriford Hospital Travel Plan www.dft.gov.uk/stellent/groups/dft_susttravel/documents/page/dft_susttravel_027710.pdf. Accessed 08/04/09. Pye, S., Stedman, J., Adams, M. and King, K. (2001) Further Analysis of NO2 and PM10 Air Pollution and Social Deprivation. A report produced for the DEFRA, The National Assembly for Wales and Department of the Environment in Northern Ireland. AEAT/ENV/R/0865. AEA Technology, Oxfordshire. http://www.airquality.co.uk/archive/reports/empire/2001socialdeprivation_v4.pdf. Accessed 08/04/09. Rogers, P. (2007). National enforcement priorities for local authority regulatory services. Cabinet Office. http://archive.cabinetoffice.gov.uk/rogersreview/upload/assets/rogersreview/rogers_review_2007.pdf. Accessed 08/04/09. SEU (Social Exclusion Unit) (2003) Making the Connections: Transport and Social Exclusion http://www.cabinetoffice.gov.uk/media/cabinetoffice/social_exclusion_task_force/assets/publications_1997_to_2006/making_transport_interim.pdf. Accessed 08/04/09.
UK Air Quality Archive (NETCEN 2007) http://www.airquality.co.uk/archive/laqm/tools.php?tool=background04. Accessed 08/04/09.
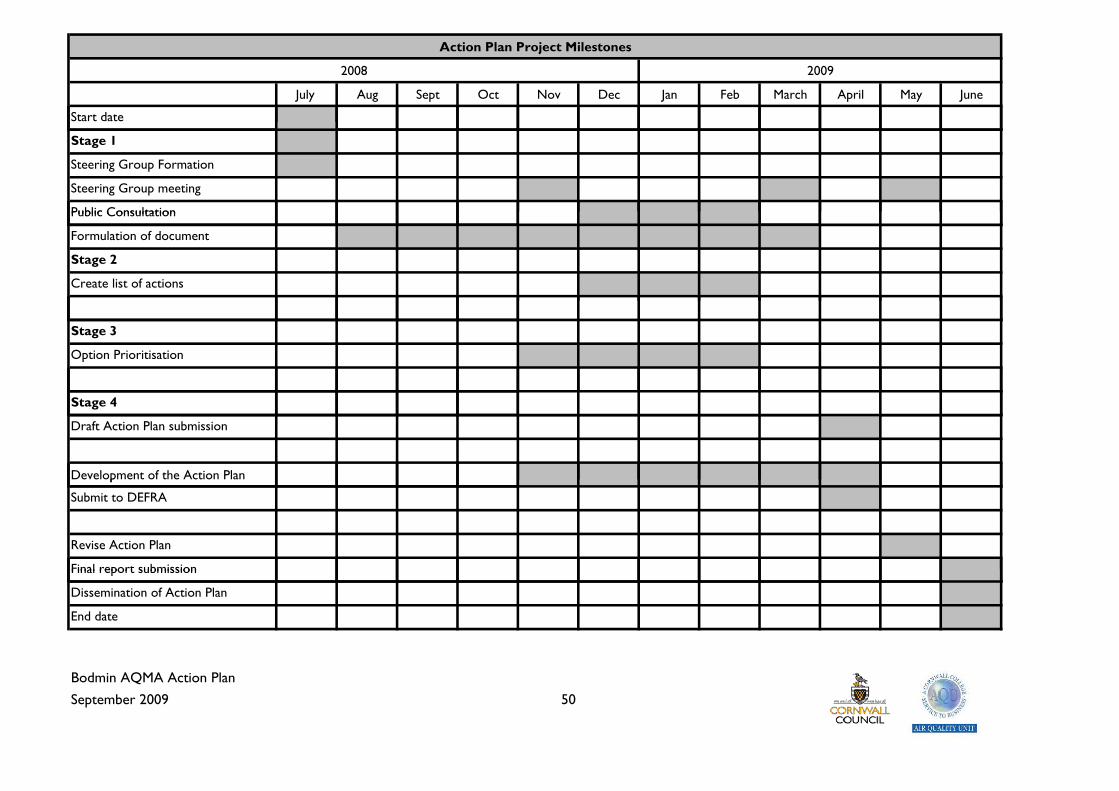
July Aug Sept Oct Nov Dec Jan Feb March April May June
Start date
2008
Action Plan Project Milestones
2009
Stage 1
Steering Group Formation
Steering Group meeting
Public ConsultationPublic Consultation
Formulation of document
Stage 2
Create list of actions
Stage 3
Option Prioritisation
Stage 4
Draft Action Plan submission
Development of the Action Planp
Submit to DEFRA
Revise Action Plan
Final report submissionFinal report submission
Dissemination of Action Plan
End date
Bodmin AQMA Action PlanSeptember 2009 50
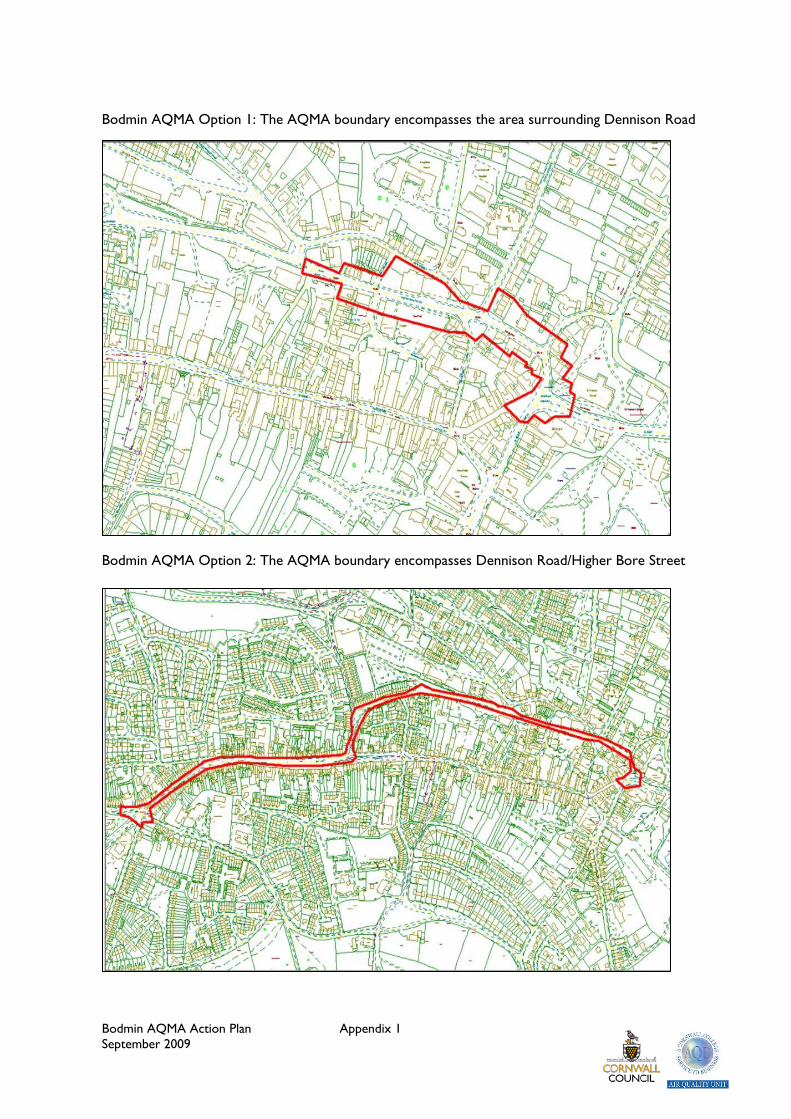
Bodmin AQMA Action Plan Appendix 1 September 2009
Bodmin AQMA Option 1: The AQMA boundary encompasses the area surrounding Dennison Road
Bodmin AQMA Option 2: The AQMA boundary encompasses Dennison Road/Higher Bore Street
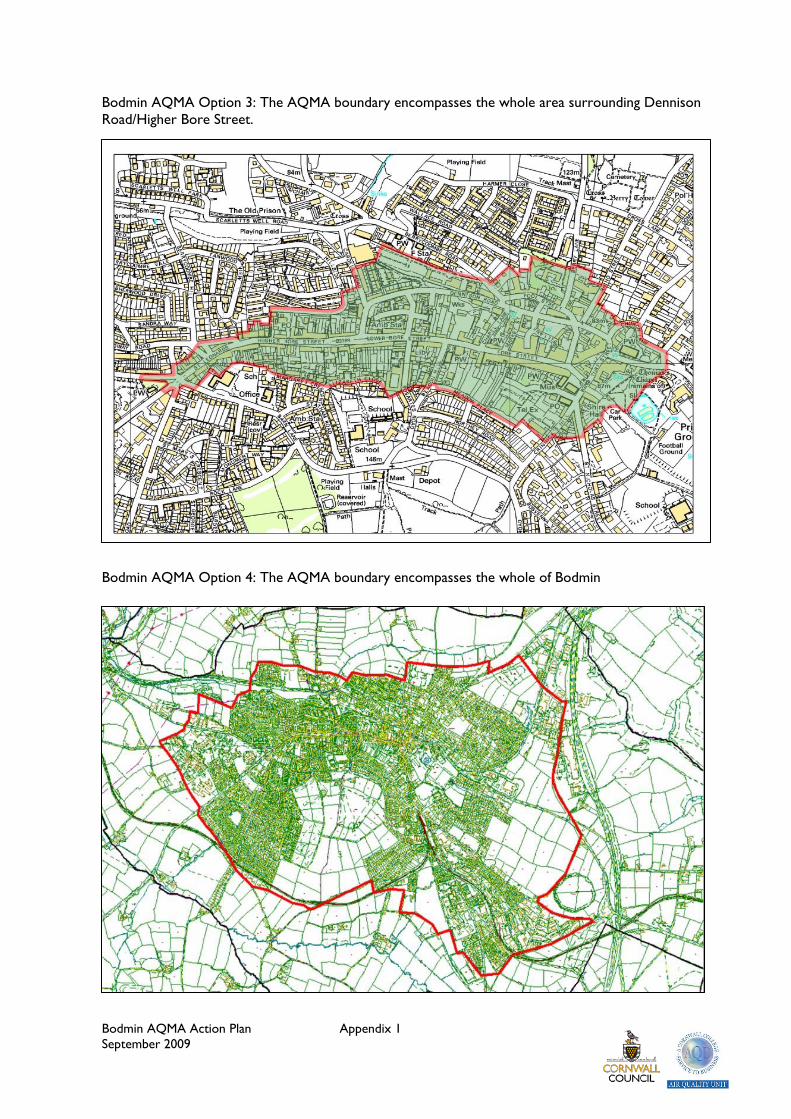
Bodmin AQMA Action Plan Appendix 1 September 2009
Bodmin AQMA Option 3: The AQMA boundary encompasses the whole area surrounding Dennison Road/Higher Bore Street.
Bodmin AQMA Option 4: The AQMA boundary encompasses the whole of Bodmin
Bodmin AQMA Action Plan Appendix 2 September 2009
Bodmin on-line transport survey. 1st December – 28th February 2009 One hundred and thirty six people responded to the NCDC online survey. Results are given below. Survey questions
1. How did you hear about this survey?
2. Please enter the first four characters of your post code.
3. Do you own a private vehicle?
4. What type of vehicle do you own?
5. What is the age of your vehicle?
6. What is the engine size of your vehicle?
7. Would you be interested in learning about driver efficiency e.g. driving techniques to reduce fuel consumption and lower emissions?
8. If Bio-fuel was more readily available would you consider using it?
9. How frequently do you use public transport?
10. If you use public transport frequently (daily, weekly) what improvements to the service you would like to
see?
11. Please specify what would encourage you to use the service.
12. When travelling within Bodmin, what is your most common mode of transport if your journey is less than 1 mile?
13. When travelling within Bodmin, what is your most common mode of transport if your journey is 1-5 miles?
14. When travelling within Bodmin, what is your most common mode of transport if your journey is 5+ miles?
15. How often do you access this road?
16. What are your reasons for accessing this road?
17. How often do you car share?

Bodmin AQMA Action Plan Appendix 2 September 2009
1. How did you hear of the survey?
Number % Citizen panel member 1 1 CAQF website 5 4 NCDC website 57 42 Press 5 4 Other 68 50 2. Postcode. Most respondents were from the Bodmin area and used Dennison Road for commuting and shopping
Greater than 100 miles 1 Plymouth 2 Looe 1 Bude 3 Liskeard 5 Launceston 3 Callington 1 Lostwithial 2 Par 3 St Austell 13 Padstow 16 Bodmin 75 Tintagel 1 Truro 4 Helston 1 Hayle 2 Newquay 2
3. Do you own a private vehicle? Number %
yes 132 97 no 4 3

Bodmin AQMA Action Plan Appendix 2 September 2009
4. What type of vehicle Number
% Car 129 94 Van 0 0 Lorry 0 0 Motor bike 4 3 Other 4 3
motor home 3 x bicycle
5. What is the age of your vehicle?
Number % 1997 or older 16 12 1998 - 2001 22 17 2002 - 2005 50 38 2006 to present 44 33
7. Would you be interested in learning about driver efficiency
Number % Yes 71 54 No 61 46
6. What is the engine size of your vehicle?
Number %
1 litre – 1.5 litres 37 28
1.5 litres – 2 litres 84 64
Bigger than 2 litres 9 7
Less then 1 litre 2 1
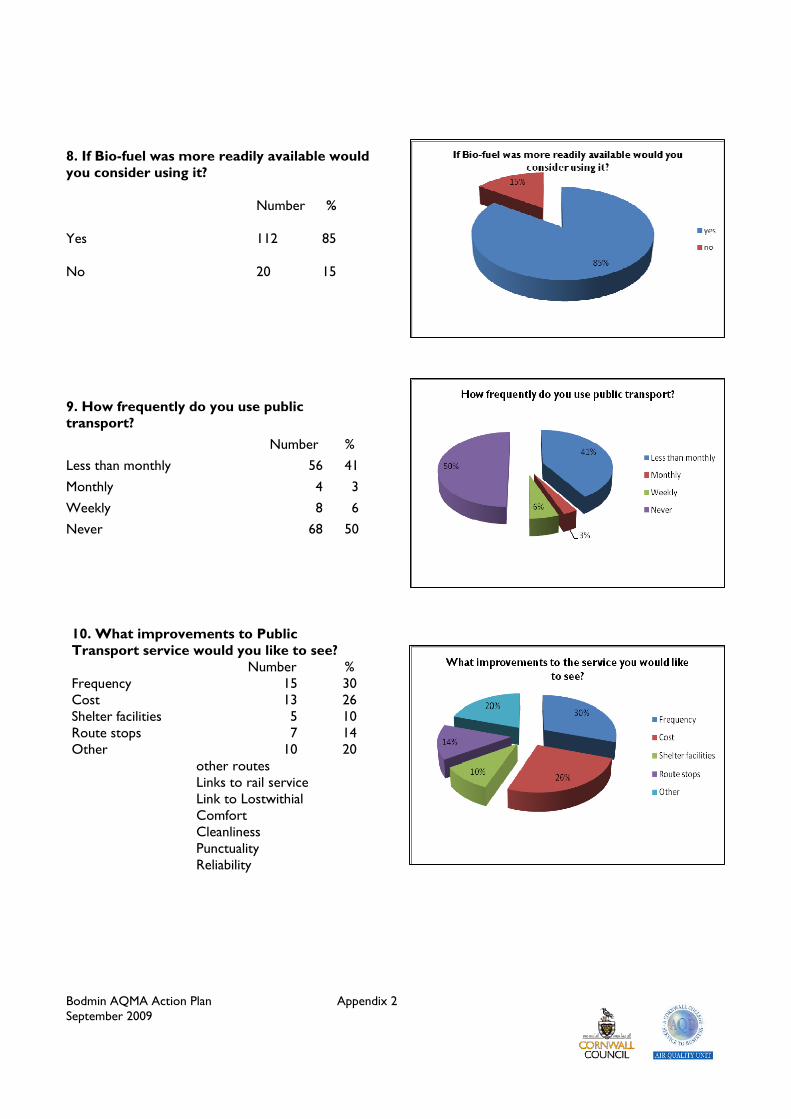
Bodmin AQMA Action Plan Appendix 2 September 2009
10. What improvements to Public Transport service would you like to see?
Number % Frequency 15 30 Cost 13 26 Shelter facilities 5 10 Route stops 7 14 Other 10 20
other routes Links to rail service Link to Lostwithial Comfort Cleanliness Punctuality Reliability
8. If Bio-fuel was more readily available would you consider using it?
Number %
Yes 112 85
No 20 15
9. How frequently do you use public transport?
Number % Less than monthly 56 41 Monthly 4 3 Weekly 8 6 Never 68 50
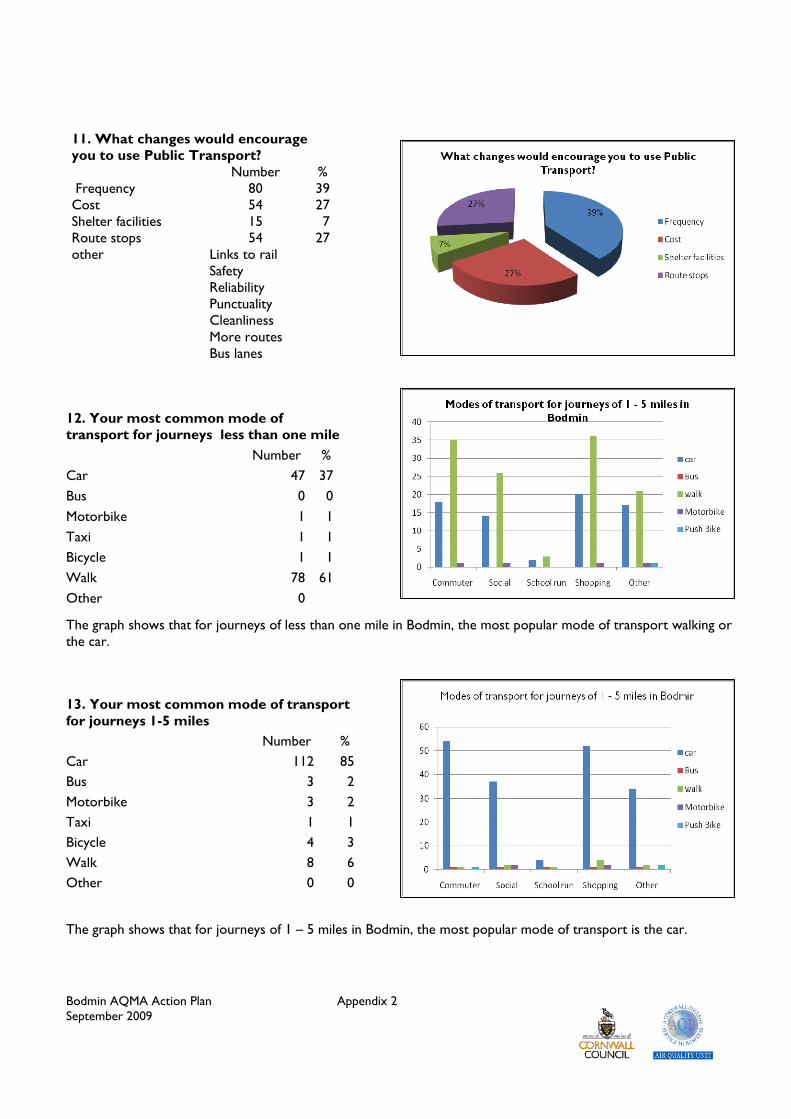
Bodmin AQMA Action Plan Appendix 2 September 2009
11. What changes would encourage you to use Public Transport?
Number % Frequency 80 39 Cost 54 27 Shelter facilities 15 7 Route stops 54 27 other Links to rail
Safety Reliability Punctuality Cleanliness More routes Bus lanes
The graph shows that for journeys of less than one mile in Bodmin, the most popular mode of transport walking or the car. 13. Your most common mode of transport for journeys 1-5 miles
Number % Car 112 85 Bus 3 2 Motorbike 3 2 Taxi 1 1 Bicycle 4 3 Walk 8 6 Other 0 0 The graph shows that for journeys of 1 – 5 miles in Bodmin, the most popular mode of transport is the car.
12. Your most common mode of transport for journeys less than one mile
Number % Car 47 37 Bus 0 0 Motorbike 1 1 Taxi 1 1 Bicycle 1 1 Walk 78 61 Other 0
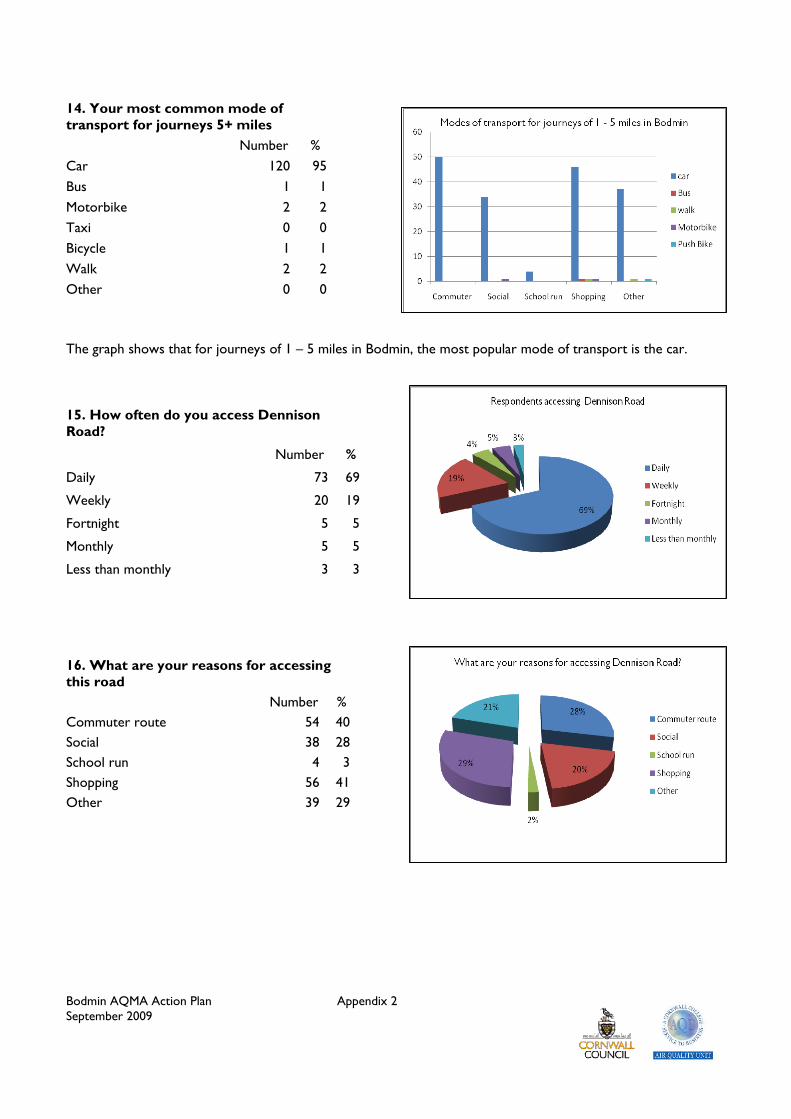
Bodmin AQMA Action Plan Appendix 2 September 2009
The graph shows that for journeys of 1 – 5 miles in Bodmin, the most popular mode of transport is the car.
16. What are your reasons for accessing this road
Number % Commuter route 54 40 Social 38 28 School run 4 3 Shopping 56 41 Other 39 29
14. Your most common mode of transport for journeys 5+ miles
Number % Car 120 95 Bus 1 1 Motorbike 2 2 Taxi 0 0 Bicycle 1 1 Walk 2 2 Other 0 0
15. How often do you access Dennison Road?
Number %
Daily 73 69
Weekly 20 19
Fortnight 5 5
Monthly 5 5
Less than monthly 3 3
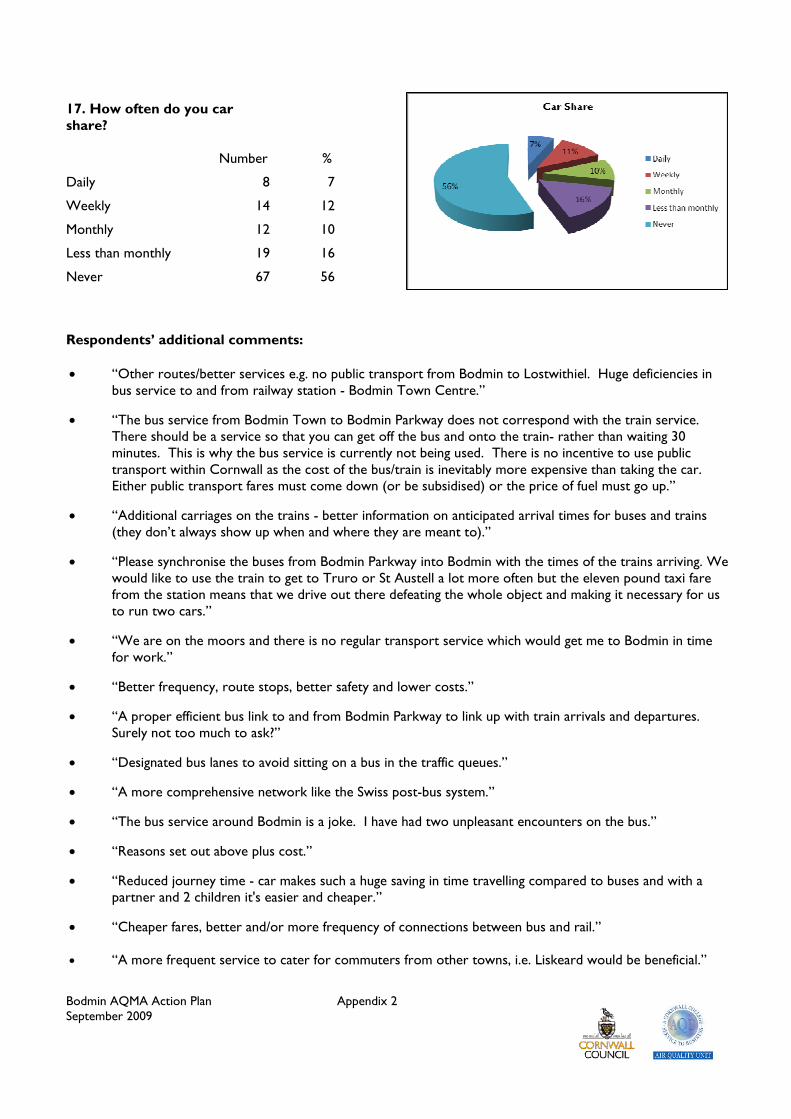
Bodmin AQMA Action Plan Appendix 2 September 2009
17. How often do you car share?
Number %
Daily 8 7
Weekly 14 12
Monthly 12 10
Less than monthly 19 16
Never 67 56 Respondents’ additional comments: • “Other routes/better services e.g. no public transport from Bodmin to Lostwithiel. Huge deficiencies in
bus service to and from railway station - Bodmin Town Centre.”
• “The bus service from Bodmin Town to Bodmin Parkway does not correspond with the train service. There should be a service so that you can get off the bus and onto the train- rather than waiting 30 minutes. This is why the bus service is currently not being used. There is no incentive to use public transport within Cornwall as the cost of the bus/train is inevitably more expensive than taking the car. Either public transport fares must come down (or be subsidised) or the price of fuel must go up.”
• “Additional carriages on the trains - better information on anticipated arrival times for buses and trains (they don’t always show up when and where they are meant to).”
• “Please synchronise the buses from Bodmin Parkway into Bodmin with the times of the trains arriving. We would like to use the train to get to Truro or St Austell a lot more often but the eleven pound taxi fare from the station means that we drive out there defeating the whole object and making it necessary for us to run two cars.”
• “We are on the moors and there is no regular transport service which would get me to Bodmin in time for work.”
• “Better frequency, route stops, better safety and lower costs.”
• “A proper efficient bus link to and from Bodmin Parkway to link up with train arrivals and departures. Surely not too much to ask?”
• “Designated bus lanes to avoid sitting on a bus in the traffic queues.”
• “A more comprehensive network like the Swiss post-bus system.”
• “The bus service around Bodmin is a joke. I have had two unpleasant encounters on the bus.”
• “Reasons set out above plus cost.”
• “Reduced journey time - car makes such a huge saving in time travelling compared to buses and with a partner and 2 children it's easier and cheaper.”
• “Cheaper fares, better and/or more frequency of connections between bus and rail.” • “A more frequent service to cater for commuters from other towns, i.e. Liskeard would be beneficial.”
Bodmin AQMA Action Plan September 2009 Appendix 3
Steering Group Rationale 1. North Cornwall District Council Under Part IV of the Environment Act 1995, local authorities have a duty to review and assess the local air quality in their district against air quality objectives for seven pollutants as set out in the Air Quality Strategy and Regulations. Where a local authority considers that one or more of the air quality objectives, as prescribed in Regulations, is unlikely to be met by the required date, it must declare an air quality management area, covering the area where the problem is expected. It must then draw up an Action Plan setting out the measures it intends to take in pursuit of the air quality objectives in the area. Authorities have number of functions which relate to the development of the action plan. Environmental Health • Monitoring of air pollution levels throughout the district • Investigate and take action where levels exceed national objectives • Respond to concerns from members of the public re air pollution and nuisance • Carry out an air quality review and assessment and detailed assessment under section 82 of the
Environment Act • Submit reports, including annual updates, to DEFRA, on progress dealing with air pollution • Designate an AQMA where necessary • Prepare and implement an Action Plan • Consider health and well-being implications of air pollution Planning and Economic Development • Consider the planning and development implications of high levels or air pollution and/or declaration of an
AQMA • Plan future development in district taking into account the impacts on air quality • Ensuring a balance between promoting development and the impact this may have on air quality 2 Cornwall Council
• Manage and coordinate the air quality schemes in the Local Transport Plan implementation programme.
• Offer expertise and knowledge in traffic engineering. • Work with the AQU in the development, monitoring and implementation of the air quality
programme, including research into potential techniques. • Responsible for the maintenance and development of Cornwall’s Air Quality Strategy. • Contribute to the Cornwall Air Quality Forum and to the action plans of various Air Quality
Management Plans in Cornwall.
CC’s Transportation Department are on the Bodmin AQMA Steering Group as they have worked with and assisted NCDC diffusion tube monitoring. CC transportation have a big role to play in the Action Plan, with engineers carrying out detailed studies to see what is possible in terms of physical changes on the ground to improve air quality. The Cornwall Local Transport Plan can contribute by providing generic measures to help reduce poor air quality.
Bodmin AQMA Action Plan September 2009 Appendix 3
3. Cornwall Council Planning Authority (Spatial Planning) The County Planning Authority has responsibility for Minerals and Waste Planning in Cornwall through the preparation the Local Development Framework. The County Planning Authority are also advisors to the Regional Planning Body on Local Development Frameworks and major planning proposals in Cornwall. CC also provides a specialist historic and natural environment advisory service. Spatial Planning is represented on the Steering Group in order to provide a strategic context and to provide a link with the Natural and Historic Environment advisory service. 4. Air Quality Unit, Cornwall College The Air Quality Unit (AQU) is the academic/technical arm of the Cornwall Air Quality Forum (CAQF), a body which from 1996 to April 2009 included representatives from five of the District Councils in Cornwall, Cornwall County Council, the Environment Agency and Cornwall College (www.cornwall-airquality.org.uk). The AQU provides expertise, technical advice and practical assistance concerning local authorities’ statutory Local Air Quality Management (LAQM) duties, in particular monitoring airborne particulate matter (ambient dust), traffic pollution (nitrogen dioxide), transboundary ozone, pollutant mapping and health effects. The AQU assisted NCDC throughout their LAQM Review and Assessment process. In their capacity as air quality consultants the AQU have been commissioned to produce the Air Quality Action Plan. The deadline for the completion of the Action Plan is June 2009 and will include a list of prescribed Actions designed to remedy the air quality issues in Bodmin. 5. Bodmin Town Council Bodmin Town Council serves a town population of approximately 14,500. It liaises with the two principal authorities for the area (Cornwall County Council and North Cornwall District Council) and apart from the local community, provides services for thousands of tourists who visit the town every year. Bodmin Town Council’s vision is to create a sustainable and vibrant community for Bodmin. Bodmin Town Council aims to deliver this vision by;
o Supporting the continued preservation and revitalisation of leisure, heritage, tourism, culture, social and educational needs of Bodmin.
o Developing partnerships for shared priorities with the public and private sector for the direct benefit of the community.
o Providing a democratic representation of the people of Bodmin. o Working in partnership with other statutory bodies and agencies to pursue a joint approach in the
delivery of best value providing a safer and healthier community. o Contributing towards a socially inclusive and caring community. o Encouraging economical development in a planned and appropriate way. o Ensuring that the services provided by Bodmin Town Council are delivered as effectively, efficiently
and economically as possible whilst being sensitive to the environment. • The development of an Air Quality Action Plan for Dennison Rd is supported by the Town Council and
links with the Bodmin Town Centre Framework Plan (BTCFP). The BTCFP will take account of air quality issues arising from traffic pollution, particularly those issues associated with the Air Quality Management Area (AQMA) centred on Dennison Road and specifically the AQMA action plan. Proposals contained within the Framework Plan should be complementary to the objectives of the AQMA and action plan in order to achieve a reduction in pollution levels. We hope that by tackling the poor air quality we can improve the environment of the town centre for residents and visitors alike.

Bodmin AQMA Action Plan September 2009 Appendix 3
Structure of the Bodmin Air Quality Action Plan Steering Group
Represented bodies
NCDC: Environmental Health Department NCDC: Planning Department Cornwall Council: Highways Department Cornwall Council: Transportation & Estates Cornwall Council: Planning Department Air Quality Unit (Cornwall College)
GVA Grimley
Members NCDC
Cornwall Council Paul Williams - Principal EHO (Chair) AQU
Judith Hawke – Planning Corinne Dyke – Senior Forward Planner Barbara Parsons
Ian Pearne – Transport Jane Barlow – Housing Benjamin Harris
Jodie Cleave – Transport Paul O’Callaghan – Bodmin Town Council Clerk Dr Victoria Collins
Peter Moore – Transport Luke Marsh
David Groves – Highways Bob Merriman – Transport Engineer

Dennison Rd 2008Annual
Total vehicles 4,882,907
Table 1. NO2 /Traffic calculator
Nitrogen dioxideAverage NO2 in Dennison Rd 47
Background NO2 (2010) 7.12
NO2 attributable to traffic 39.88
Annual % No. of % of total emissions at assumed speed NO2 per vehicle type NO2 (µg m-3) per vehicle Annual % No. ofVehicle type of flow vehicles 5km/h 20km/h 40km/h 5km/h 20km/h 40km/h 5km/h 20km/h 40km/h
Public service vehicles 0.54 26373 23 19 17 9.17 7.58 6.60 0.000348 0.000287 0.000250Light goods vehicles 0.7 34187 8.1 12 13 3.23 4.79 4.99 0.000094 0.000140 0.000146HGV rigid 5.4 263730 34 28 25 13.56 11.17 9.97 0.000051 0.000042 0.000038HGV artic 0.6 31257 4.1 3.4 3 1.64 1.36 1.20 0.000052 0.000043 0.000038
% of total emissions at assumed speed NO2 per vehicle type NO2 (µg m ) per vehicle
HGV artic 0.6 31257 4.1 3.4 3 1.64 1.36 1.20 0.000052 0.000043 0.000038Car 92.7 4527360 31 38 43 12.36 15.15 17.15 0.000003 0.000003 0.000004Total 100 4882907 100 100 100 40 40 40
% No. of Adjustable NO2 per vehicle NO2 per vehicle typejVehicle type of flow vehicles No. of vehicles 5km/h 20km/h 40km/h 5km/h 20km/h 40km/h
Public service vehicles 0.54 26373 24429 0.000375 0.000310 0.000270 9.2 7.6 6.6Light goods vehicles 0.7 34187 34201 0.000094 0.000140 0.000146 3.2 4.8 5.0HGV rigid 5.4 263730 263835 0.000051 0.000042 0.000038 13.6 11.2 10.0HGV artic 0.6 31257 31269 0.000052 0.000043 0.000038 1.6 1.4 1.2
2 p 2 p yp
Car 92.7 4527360 4529172 0.000003 0.000003 0.000004 12.4 15.2 17.1Total 100 4882907 4882907 47.1 47.2 47.0
B d i AQMA A i PlBodmin AQMA Action PlanSeptember 2009 Appendix 4
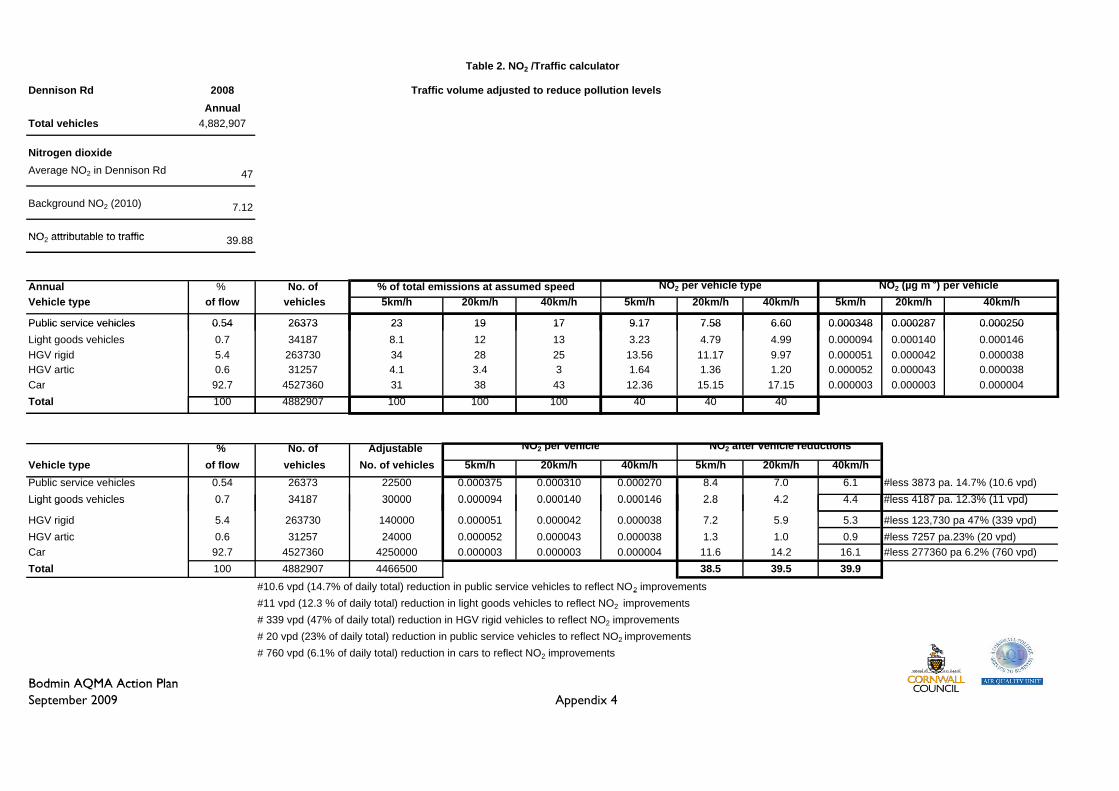
Dennison Rd 2008Annual
Total vehicles 4,882,907
Traffic volume adjusted to reduce pollution levels
Table 2. NO2 /Traffic calculator
Nitrogen dioxideAverage NO2 in Dennison Rd 47
Background NO2 (2010) 7.12
NO attributable to traffic 39 88NO2 attributable to traffic 39.88
Annual % No. ofVehicle type of flow vehicles 5km/h 20km/h 40km/h 5km/h 20km/h 40km/h 5km/h 20km/h 40km/h
Public service vehicles 0.54 26373 23 19 17 9.17 7.58 6.60 0.000348 0.000287 0.000250
% of total emissions at assumed speed NO2 per vehicle type NO2 (µg m-3) per vehicle
Public service vehicles 0.54 26373 23 19 17 9.17 7.58 6.60 0.000348 0.000287 0.000250Light goods vehicles 0.7 34187 8.1 12 13 3.23 4.79 4.99 0.000094 0.000140 0.000146HGV rigid 5.4 263730 34 28 25 13.56 11.17 9.97 0.000051 0.000042 0.000038HGV artic 0.6 31257 4.1 3.4 3 1.64 1.36 1.20 0.000052 0.000043 0.000038Car 92.7 4527360 31 38 43 12.36 15.15 17.15 0.000003 0.000003 0.000004Total 100 4882907 100 100 100 40 40 40
% No. of Adjustable Vehicle type of flow vehicles No. of vehicles 5km/h 20km/h 40km/h 5km/h 20km/h 40km/hPublic service vehicles 0.54 26373 22500 0.000375 0.000310 0.000270 8.4 7.0 6.1Light goods vehicles 0.7 34187 30000 0.000094 0.000140 0.000146 2.8 4.2 4.4 #less 4187 pa. 12.3% (11 vpd)
NO2 per vehicle NO2 after vehicle reductions
#less 3873 pa. 14.7% (10.6 vpd)Light goods vehicles 0.7 34187 30000 0.000094 0.000140 0.000146 2.8 4.2 4.4
HGV rigid 5.4 263730 140000 0.000051 0.000042 0.000038 7.2 5.9 5.3HGV artic 0.6 31257 24000 0.000052 0.000043 0.000038 1.3 1.0 0.9Car 92.7 4527360 4250000 0.000003 0.000003 0.000004 11.6 14.2 16.1Total 100 4882907 4466500 38.5 39.5 39.9
#10.6 vpd (14.7% of daily total) reduction in public service vehicles to reflect NO2 improvements
#less 7257 pa.23% (20 vpd)#less 277360 pa 6.2% (760 vpd)
#less 4187 pa. 12.3% (11 vpd)
#less 123,730 pa 47% (339 vpd)
p ( y ) p 2 p#11 vpd (12.3 % of daily total) reduction in light goods vehicles to reflect NO2 improvements# 339 vpd (47% of daily total) reduction in HGV rigid vehicles to reflect NO2 improvements# 20 vpd (23% of daily total) reduction in public service vehicles to reflect NO2 improvements# 760 vpd (6.1% of daily total) reduction in cars to reflect NO2 improvements
Bodmin AQMA Action PlanBodmin AQMA Action PlanSeptember 2009 Appendix 4

BodminSeptem
AQMA Action Plaber 2009
an
Apppendix 5

Bodmin HGV Survey - 20th September 2007
Site Details1 A389 Dunmere Road1 A389 Dunmere Road2 A389 Westheath Avenue3 A38R Launceston Road4 A38 Carminow Cross5 A389 Higher Bore Street6 A389 P i R d6 A389 Priory Road7 B3268 St Nicholas Street8 B3268 Lostwithiel Road
Total No of Total No of HGVs excl missed and
1 To Bodmin In 150 94
1 To Wadebridge Out 142 120
2 To Bodmin In 145 145
2 To Lanlivet Out 159 153
HGVs recordedSite Direction incorrectly recorded plates
2 To Lanlivet Out 159 153
3 To Bodmin In 356 342
3 To Launceston (A30) Out 424 419
4 To Bodmin In 461 457
4 To Carminow Cross Out 450 441
5 To Town Centre In 200 199
5 To triple mini rdbt Out 213 208
6 To Town Centre In 214 213
6 To A30 Out 228 226
7 T T C t I 79 797 To Town Centre In 79 79
7 To Lostwithiel Out 58 56
8 To Bodmin In 40 38
8 To Lostwithiel Out 34 31
Bodmin AQMA Action Plan
September 2009 Appendix 5September 2009 Appendix 5
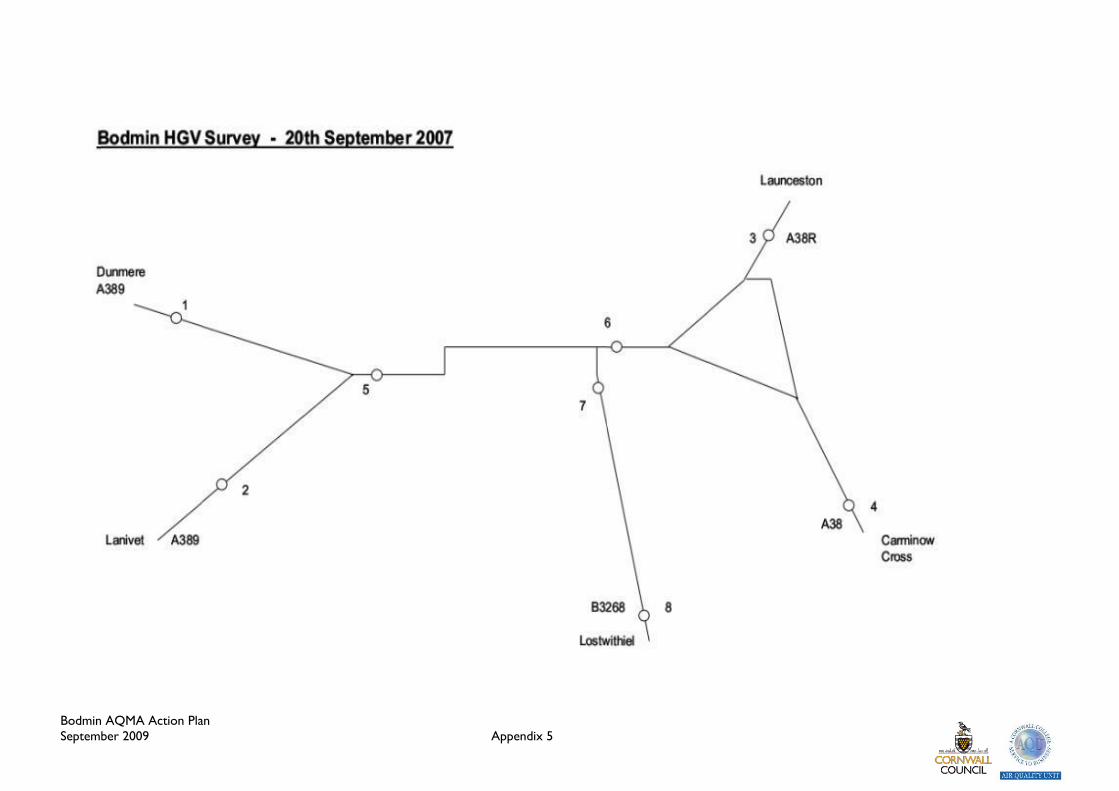
BodminSeptem
AQMA Action Plaber 2009
an Apppendix 5

Bodmin HGV Survey - 20th September 2007
B3268 St Nicholas Street
(Site 7 in)Year
A389 Higher Bore Street
(Site 5 in)
A389 Higher Bore Street
(Site 5 out)
A389 Priory Road
(Site 6 in)
A389 Priory Road
(Site 6 out)
B3268 St Nicholas Street
(Site 7 in)1979 0 1 0 0 0 01980 0 0 0 0 0 01981 0 0 0 0 0 01982 0 0 0 0 0 01983 0 0 0 0 0 0
( )( ) ( ) ( ) ( ) ( )
1983 0 0 0 0 0 01984 0 0 2 1 0 01985 0 0 1 0 0 01986 0 1 1 0 0 01987 1 1 1 1 0 01988 2 2 2 2 0 01988 2 2 2 2 0 01989 0 0 1 0 0 01990 1 3 2 1 0 01991 1 0 0 1 0 01992 1 1 1 0 0 11993 3 4 4 3 0 01994 0 0 0 0 1 01995 5 4 5 5 0 01996 2 4 0 2 4 31997 10 9 7 7 5 11997 10 9 7 7 5 11998 4 5 7 4 1 21999 11 13 15 13 4 22000 12 7 9 14 4 32001 7 8 11 9 0 0
2001+ 137 142 141 159 58 422001+ 137 142 141 159 58 42Unknown 2 3 3 4 2 2Total 199 208 213 226 79 56
Bodmin AQMA Action Plan
September 2009 Appendix 5September 2009 Appendix 5
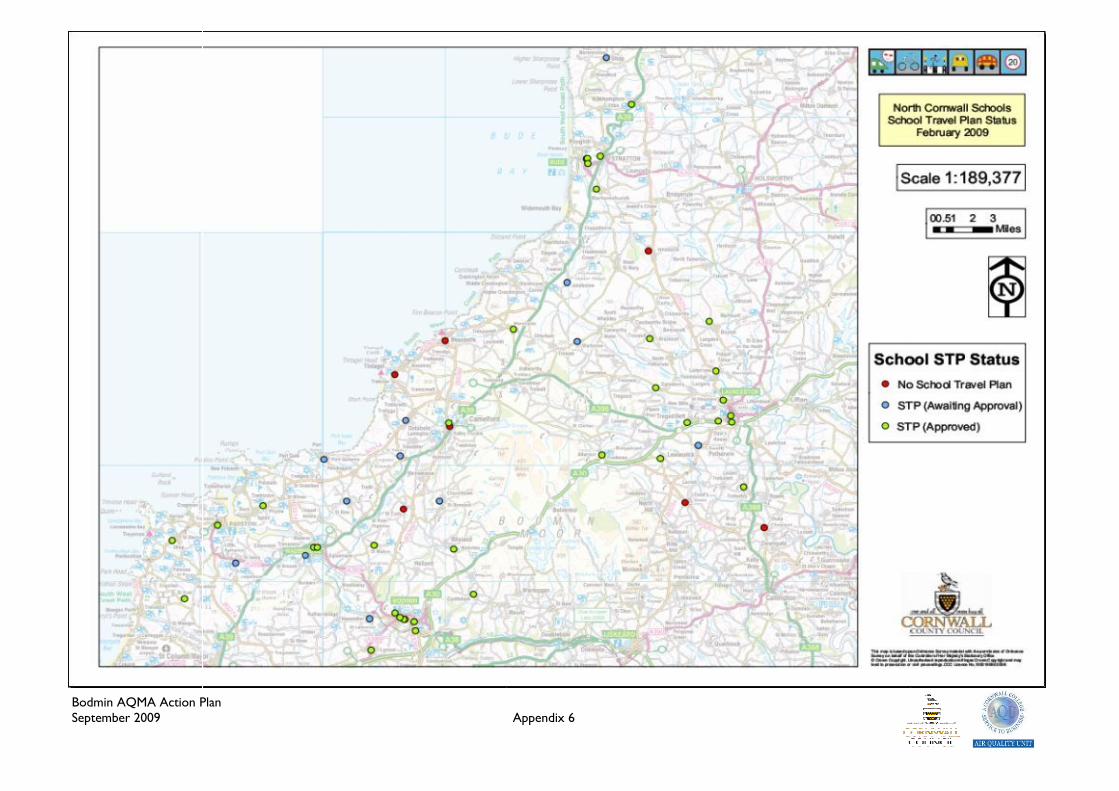
BodmSepte
min AQMA Action Pmber 2009
Plan
Appendix 6

May 2005. CCC Transport Awareness Department Walk to School Week (WTSW) initiative.
Beacon Infant School P 130 26 11 17 23.1%Robartes Junior School P 221 0 0 0 0.0%St Mary's RC (Bodmin) Jnr & Inf P 280 0 0 0 0.0%St Mabyn Church of England School P 80 57 24 38 24.6%St Tudy C of E VA Primary School P 50 42 18 25 16.6%St Wenn School P 40 29 1 16 51.8%Berrycoombe School PBlisland Community Primary School PBodmin Community College SCardinham School PLanivet Community Primary School P
Lanlivery Community Primary School P
% CHANGE
MAY
SCHOOL STATUSNUMBER OF PUPILS IN
SCHOOLTOTAL SURVEYED
MAYUSUALLY
WALKWALK ON
WTSW
Lanlivery Community Primary School PLuxulyan School PNanstallon Community Primary School PSt Breward Primary School PSt Kew Community Primary School P
St Teath Community Primary School P
St Petroc's C of E VA Primary School P
Bodmin AQMA Action Plan
September 2009 Appendix 7

October 2005. CCC Transport Awareness Department Walk to School Week (WTSW) initiative.
Beacon Infant School P 130 0 0 0 0.0%Robartes Junior School P 221 196 106 121 7.6%St Mary's RC (Bodmin) Jnr & Inf P 280 90 40 43 3.4%St Mabyn Church of England School P 80 65 13 26 20.0%St Tudy C of E VA Primary School P 50 0 0 0 0.0%St Wenn School P 40 31 6 15 29.0%Berrycoombe School PBlisland Community Primary School PBodmin Community College SCardinham School PLanivet Community Primary School P
Lanlivery Community Primary School P
% CHANGE
OCTOBER
SCHOOL STATUS NUMBER OF PUPILS IN SCHOOLTOTAL SURVEYED
OCTUSUALLY
WALKWALK ON
WTSW
Lanlivery Community Primary School PLuxulyan School P
Nanstallon Community Primary School PSt Breward Primary School PSt Kew Community Primary School PSt Teath Community Primary School P
St Petroc's C of E VA Primary School P
Bodmin AQMA Action Plan
September 2009 Appendix 7
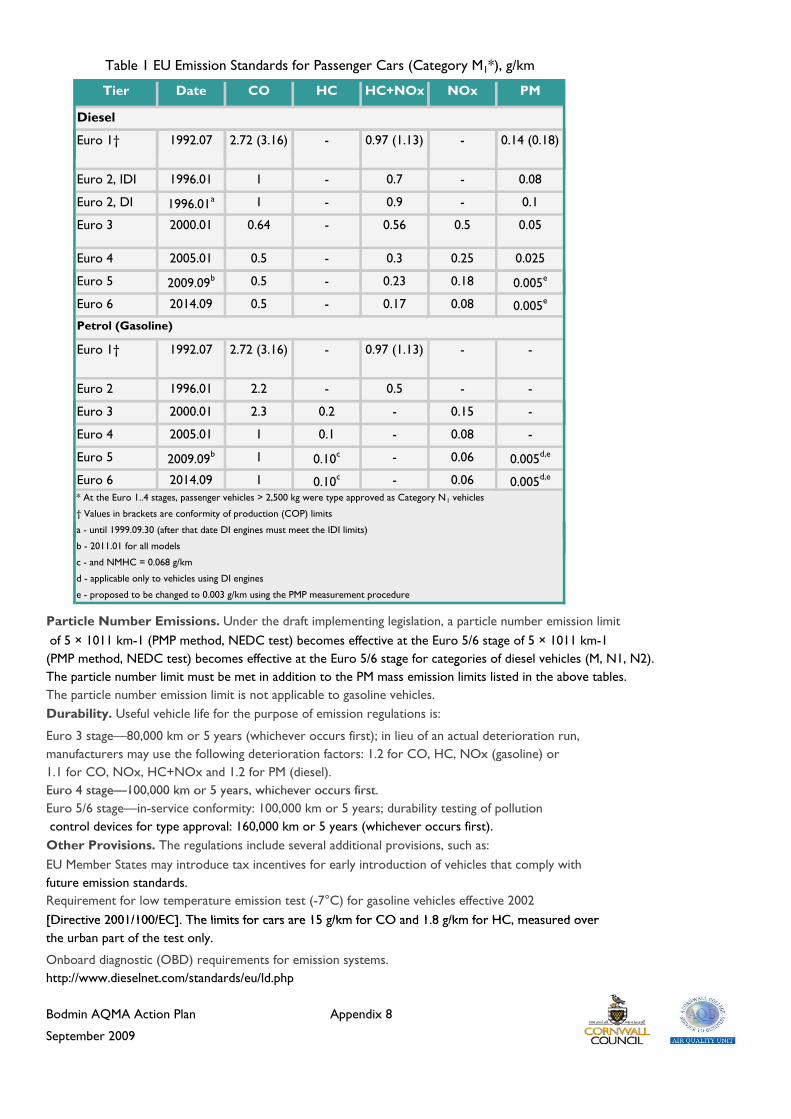
Tier Date CO HC HC+NOx NOx PM
Euro 1† 1992.07 2.72 (3.16) - 0.97 (1.13) - 0.14 (0.18)
Table 1 EU Emission Standards for Passenger Cars (Category M1*), g/km
Diesel
Euro 2, IDI 1996.01 1 - 0.7 - 0.08
Euro 2, DI 1996.01a 1 - 0.9 - 0.1
Euro 3 2000.01 0.64 - 0.56 0.5 0.05
Euro 4 2005.01 0.5 - 0.3 0.25 0.025
Euro 5 2009.09b 0.5 - 0.23 0.18 0.005eEuro 5 2009.09 0.5 0.23 0.18 0.005
Euro 6 2014.09 0.5 - 0.17 0.08 0.005e
Euro 1† 1992.07 2.72 (3.16) - 0.97 (1.13) - -
Euro 2 1996.01 2.2 - 0.5 - -
Euro 3 2000 01 2 3 0 2 - 0 15 -
Petrol (Gasoline)
Euro 3 2000.01 2.3 0.2 - 0.15 -
Euro 4 2005.01 1 0.1 - 0.08 -
Euro 5 2009.09b 1 0.10c - 0.06 0.005d,e
Euro 6 2014.09 1 0.10c - 0.06 0.005d,e
* At the Euro 1..4 stages, passenger vehicles > 2,500 kg were type approved as Category N1 vehicles
† Values in brackets are conformity of production (COP) limits
a - until 1999.09.30 (after that date DI engines must meet the IDI limits)
Particle Number Emissions. Under the draft implementing legislation, a particle number emission limit of 5 × 10¹¹ km-1 (PMP method, NEDC test) becomes effective at the Euro 5/6 stage of 5 × 10¹¹ km-1(PMP method, NEDC test) becomes effective at the Euro 5/6 stage for categories of diesel vehicles (M, N1, N2).
e - proposed to be changed to 0.003 g/km using the PMP measurement procedure
b - 2011.01 for all models
c - and NMHC = 0.068 g/km
d - applicable only to vehicles using DI engines
( ) g g ( )The particle number limit must be met in addition to the PM mass emission limits listed in the above tables.The particle number emission limit is not applicable to gasoline vehicles.Durability. Useful vehicle life for the purpose of emission regulations is:
Euro 3 stage—80,000 km or 5 years (whichever occurs first); in lieu of an actual deterioration run, manufacturers may use the following deterioration factors: 1.2 for CO, HC, NOx (gasoline) or 1.1 for CO, NOx, HC+NOx and 1.2 for PM (diesel).Euro 4 stage—100,000 km or 5 years, whichever occurs first.Euro 4 stage—100,000 km or 5 years, whichever occurs first.Euro 5/6 stage—in-service conformity: 100,000 km or 5 years; durability testing of pollution control devices for type approval: 160,000 km or 5 years (whichever occurs first).Other Provisions. The regulations include several additional provisions, such as:EU Member States may introduce tax incentives for early introduction of vehicles that comply with future emission standards.Requirement for low temperature emission test (-7°C) for gasoline vehicles effective 2002 [Directive 2001/100/EC] The limits for cars are 15 g/km for CO and 1 8 g/km for HC measured over [Directive 2001/100/EC]. The limits for cars are 15 g/km for CO and 1.8 g/km for HC, measured over the urban part of the test only.
Onboard diagnostic (OBD) requirements for emission systems.http://www.dieselnet.com/standards/eu/ld.php
Bodmin AQMA Action Plan
September 2009
Appendix 8

Category† Tier Date CO HC HC+NOx NOx PM
N1, Class I Euro 1 1994.1 2.72 - 0.97 - 0.14
≤1305 kg Euro 2, IDI 1998.01 1 - 0.7 - 0.08
Euro 2, DI 1998.01a 1 - 0.9 - 0.1
Euro 3 2000.01 0.64 - 0.56 0.5 0.05
Table 2 EU Emission Standards for Light Commercial Vehicles, g/km
Diesel
Euro 3 2000.01 0.64 0.56 0.5 0.05
Euro 4 2005.01 0.5 - 0.3 0.25 0.025
Euro 5 2009.09b 0.5 - 0.23 0.18 0.005e
Euro 6 2014.09 0.5 - 0.17 0.08 0.005e
N1, Class II Euro 1 1994.1 5.17 - 1.4 - 0.19
1305-1760 kg Euro 2, IDI 1998.01 1.25 - 1 - 0.12
Euro 2, DI 1998.01a 1.25 - 1.3 - 0.14
Euro 3 2001.01 0.8 - 0.72 0.65 0.07Euro 3 2001.01 0.8 0.72 0.65 0.07
Euro 4 2006.01 0.63 - 0.39 0.33 0.04
Euro 5 2010.09c 0.63 - 0.295 0.235 0.005e
Euro 6 2015.09 0.63 - 0.195 0.105 0.005e
N1, Class III Euro 1 1994.1 6.9 - 1.7 - 0.25
>1760 kg Euro 2, IDI 1998.01 1.5 - 1.2 - 0.17
Euro 2, DI 1998.01a 1.5 - 1.6 - 0.2
Euro 3 2001.01 0.95 - 0.86 0.78 0.1Euro 3 2001.01 0.95 0.86 0.78 0.1
Euro 4 2006.01 0.74 - 0.46 0.39 0.06
Euro 5 2010.09c 0.74 - 0.35 0.28 0.005e
Euro 6 2015.09 0.74 - 0.215 0.125 0.005e
N1, Class I Euro 1 1994.1 2.72 - 0.97 - -
≤1305 kg Euro 2 1998.01 2.2 - 0.5 - -
Euro 3 2000.01 2.3 0.2 - 0.15 -
Petrol (Gasoline)
Euro 3 2000.01 2.3 0.2 - 0.15 -
Euro 4 2005.01 1 0.1 - 0.08 -
Euro 5 2009.09b 1 0.10f - 0.06 0.005d,e
Euro 6 2014.09 1 0.10f - 0.06 0.005d,e
N1, Class II Euro 1 1994.1 5.17 - 1.4 - -
1305-1760 kg Euro 2 1998.01 4 - 0.65 - -
E 3 2001 01 4 17 0 25 0 18Euro 3 2001.01 4.17 0.25 - 0.18 -
Euro 4 2006.01 1.81 0.13 - 0.1 -
Euro 5 2010.09c 1.81 0.13g - 0.075 0.005d,e
Euro 6 2015.09 1.81 0.13g - 0.075 0.005d,e
N1, Class III Euro 1 1994.1 6.9 - 1.7 - -
>1760 kg Euro 2 1998.01 5 - 0.8 - -
3 200 0 22 0 29 0 2Euro 3 2001.01 5.22 0.29 - 0.21 -
Euro 4 2006.01 2.27 0.16 - 0.11 -
Euro 5 2010.09c 2.27 0.16h - 0.082 0.005d,e
Euro 6 2015.09 2.27 0.16h - 0.082 0.005d,e
† For Euro 1/2 the Category N1 reference mass classes were Class I ≤ 1250 kg, Class II 1250-1700 kg, Class III > 1700 kg.
a - until 1999.09.30 (after that date DI engines must meet the IDI limits)
b - 2011.01 for all models
2012 01 f ll d l
http://www.dieselnet.com/standards/eu/ld.php
B d AQMA A Pl
f - and NMHC = 0.068 g/km
g - and NMHC = 0.090 g/km
h - and NMHC = 0.108 g/km
A d 8
c - 2012.01 for all models
d - applicable only to vehicles using DI engines
e - proposed to be changed to 0.003 g/km using the PMP measurement procedure
Bodmin AQMA Action Plan
September 2009
Appendix 8
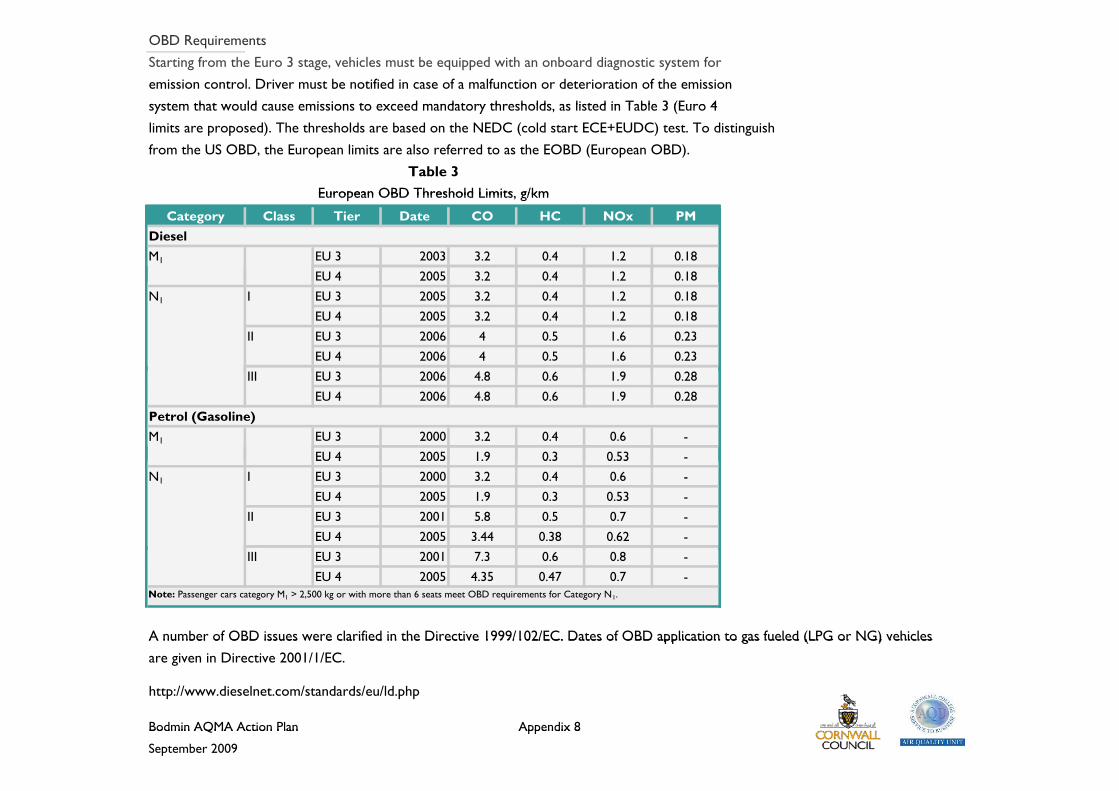
OBD RequirementsStarting from the Euro 3 stage, vehicles must be equipped with an onboard diagnostic system for emission control. Driver must be notified in case of a malfunction or deterioration of the emission system that would cause emissions to exceed mandatory thresholds as listed in Table 3 (Euro 4 system that would cause emissions to exceed mandatory thresholds, as listed in Table 3 (Euro 4 limits are proposed). The thresholds are based on the NEDC (cold start ECE+EUDC) test. To distinguish from the US OBD, the European limits are also referred to as the EOBD (European OBD).
Table 3European OBD Threshold Limits g/km
Category Class Tier Date CO HC NOx PM
EU 3 2003 3.2 0.4 1.2 0.18
EU 4 2005 3.2 0.4 1.2 0.18
European OBD Threshold Limits, g/km
DieselM1
EU 3 2005 3.2 0.4 1.2 0.18
EU 4 2005 3.2 0.4 1.2 0.18
EU 3 2006 4 0.5 1.6 0.23
EU 4 2006 4 0.5 1.6 0.23
EU 3 2006 4 8 0 6 1 9 0 28
N1 I
II
III EU 3 2006 4.8 0.6 1.9 0.28
EU 4 2006 4.8 0.6 1.9 0.28
EU 3 2000 3.2 0.4 0.6 -
EU 4 2005 1.9 0.3 0.53 -
III
Petrol (Gasoline)M1
EU 4 2005 1.9 0.3 0.53
EU 3 2000 3.2 0.4 0.6 -
EU 4 2005 1.9 0.3 0.53 -
EU 3 2001 5.8 0.5 0.7 -
EU 4 2005 3.44 0.38 0.62 -
EU 3 2001 7 3 0 6 0 8
N1 I
II
III EU 3 2001 7.3 0.6 0.8 -
EU 4 2005 4.35 0.47 0.7 -
A number of OBD issues were clarified in the Directive 1999/102/EC. Dates of OBD application to gas fueled (LPG or NG) vehicles
Note: Passenger cars category M1 > 2,500 kg or with more than 6 seats meet OBD requirements for Category N1.
III
A number of OBD issues were clarified in the Directive 1999/102/EC. Dates of OBD application to gas fueled (LPG or NG) vehicles are given in Directive 2001/1/EC.
http://www.dieselnet.com/standards/eu/ld.php
Bodmin AQMA Action Plan Appendix 8Bodmin AQMA Action Plan Appendix 8
September 2009
Bodmin AQMSeptember 2
Glossary Air Quality M
AQAP
AQU
AirPointer
Air Quality O
ATC
Best Availabl
BTCFP
CAQF
CAQS
CCC
CC
DEFRA
DfT
ECRTP
EU
EURO V/VI
Exceedence
HGV
IMD
LDD
LA
LAQM. TG(0
Limit Values/
LSOA
LTP2
MA Action Pla2009
y of Term
Management A
Objectives
le Techniques
03)
/EU limit value
an
minology
Areas (AQMA
s (BAT)
es
Ap
y
As)
A
ppendix 9
Areas where Section 83(1)
Air Quality Ac
Air Quality U
A Single and mLtd.
National policObjectives arexposure perpublic may be
Annual Traffic
The basis forpollution und
Bodmin Tow
Cornwall Air
Cornwall Air
Cornwall Co
Cornwall Co
Department f
Department
The East Cor
European Un
Vehicle emiss
Concentratiothan the appr
Heavy Goodsgoods vehicleover 3.5 tonn12 t. This tercategory).
Index of Multthe ward or sand LSOA).
Local Develo
Local Author
Local Air Qudocument proassess air qua
The maximumon Air Qualitnational air qachieving.
Lower Layer
Local TranspoAuthorities athe local trantransport imp2005.
the air quality) of the Enviro
ction Plan.
Unit (Cornwal
multiple gas p
cy targets setre expressed ariods. Objective exposed to
c Count.
determining tder the Preven
n Centre Fram
Quality Foru
Quality Strat
unty Council:
uncil – Unitar
for Environme
for Transport
rnwall Rural T
nion.
sion standards
ons of a particropriate Air Q
s Vehicle. Cates (i.e. lorries)nes. Categorym LGV (Large
tiple Deprivatsub-ward area
pment Docum
rity.
ality Managemovides nationaality.
m pollutant levty. In some cauality objectiv
Super Output
ort Policy 2: Are required tosport policies
provements. L
y objectives aonment Act 19
l College).
pollutant moni
out in the Aias pollution coves only applypollution ove
the appropriantion and Con
mework Plan.
m.
tegy: Launched
pre 1st April
ry Authority p
ent, Food and
t.
Transport Part
s.
ular air pollutQuality Object
tegory N2 and) with a maximy N2 is up to e Goods Vehi
ion. A measua level or Supe
ments.
ment Technicaal advice on h
vels set out inses the limit vve but may allo
t Areas.
As a result of o produce Los and outline tLTP2 was subm
re likely to be995.
itor supplied b
r Quality Regoncentrationsy where a memr the relevant
ate technique ntrol of Pollut
d December 2
2009.
post 1st April 2
d Rural Affairs
tnership.
tant is expectetive.
d N3, is the fomum allowed 12 t, categorycle may also b
ure of multipleer Output Ar
al Guidance (2how local auth
n the EU Daugvalues are theow a longer p
the Transporcal Transporttheir programmitted to Gov
e exceeded.
by Air Monito
gulations 2000s over certainmber of the t averaging tim
for reducing tion Regulatio
2004.
2009.
s.
ed to be great
ormal term formass (MAM)
y N3 greater tbe used for th
e deprivation reas (see SOA
2003). This horities should
ghter Directiv same as the
period for
rt Act 2000, Lt Plans to iden
mme of local vernment in
ors
0.
me.
ns.
ter
r than his
at A
d
ves
ocal ntify

Bodmin AQMSeptember 2
Microgramm
MOVA
MGV
National Air
National Air
NAEI.
NCDC
NETCEN
NO
NO2
NOx
NSO
ODPM
PAH
PCT
PM
PM10
ppb
ppm
PSVs
SEU
SOA
S 106
TPs
Vpa
Vpd
MA Action Pla2009
mes per metre
Quality Obje
Quality Strat
an
cubed (µg m
ectives
tegy (NAQS)
Ap
m-3)
ppendix 9
A measure ofconcentrationone microgra
Motorway O
Medium Goovehicle or a h
See Air Quali
The Air QualIreland. The Document wstrategy for imimportance o
UK National
North CornwCouncil (post
UK Air Quali
Nitrogen mo
Nitrogen diox
Nitrogen oxid
National Stat
Office of the
Polycyclic arodeposits, andfossil fuel or bcompounds h
Primary Care
Particulate m
Airborne partefficiency cut-particles of be
Parts per billi
Parts per mil
Public Service
Social Exclusi
Super Output
Section 106 (allows a Locaagreement orthe grant of p
Travel Plans: that aim to re
Vehicles per
Vehicles per
f concentration of 1 µg/m3 mamme (million
nline Advisor
ods Vehicle: anheavy goods v
ity Objectives
lity Strategy fo current versi
was January 200mproving air q
of the planning
Atmospheric
wall District Ct 1st April 200
ity Archive.
onoxide.
xide, a compo
de plus nitrog
istics Office.
Deputy Prime
omatic hydroc are producedbiomass). As ahave been iden
e Trust. PCTs
atter.
ticulate matte-off at 10µm aelow this size
ion.
lion.
e Vehicles (bu
ion Unit.
t Areas (see L
(S106) of the Tal Planning Autr planning oblplanning perm
A Travel Plaeduce the num
annum.
day.
on in terms ofmeans that onnth of a gramm
System.
ny goods carriehicle.
s.
or England, Scon at the time03. This sets quality in the g process.
Emissions Inv
Council. Now09).
onent of nitro
gen dioxide.
e Minister.
carbons. PAHsd as byproduca pollutant, thntified as carc
s have contro
er passing a saaerodynamic d.
usses etc).
LSOA and IMD
Town and Cothority (LPA)igation with a
mission.
n is a packagember of car jo
f mass per unine cubic metreme) of pollutan
iage other tha
cotland, Walese of producing out the GoveUK. It makes
ventory.
w part of Corn
ogen oxide.
s occur in oil,cts of fuel burhey are of concinogenic.
l of local healt
ampling inlet wdiameter and
D).
ountry Plannin to enter into
a landowner in
e of measures ourneys made
it volume. A e of air containt.
an a light moto
s and Northeg this Informaernment’s reference to
nwall Unitary
coal and tar ning (whether
ncern; some
th care.
with a 50% which transm
ng Act 1990 o a legally bindn association w
and initiatives.
ins
or
rn ation
the
r
mits
ding with
s