
CRT Proposed Action Urbemis Summer - Const Area Name: CRT Proposed Action - Construction and Area...
143
Page: 1 3/31/2010 11:27:26 AM Urbemis 2007 Version 9.2.4 Combined Summer Emissions Reports (Pounds/Day) File Name: Z:\Alan Sako\924.06 CRT\Emissions\CRT Proposed Action - Const Area.urb924 Project Name: CRT Proposed Action - Construction and Area Source Project Location: Bay Area Air District On-Road Vehicle Emissions Based on: Version : Emfac2007 V2.3 Nov 1 2006 Off-Road Vehicle Emissions Based on: OFFROAD2007 Summary Report: CONSTRUCTION EMISSION ESTIMATES ROG NOx CO SO2 PM10 Dust PM10 Exhaust PM10 PM2.5 Dust PM2.5 Exhaust PM2.5 2010 TOTALS (lbs/day unmitigated) 5.32 45.81 23.95 0.01 55.87 2.24 58.11 11.67 2.06 13.73 2010 TOTALS (lbs/day mitigated) 5.32 45.81 23.95 0.01 22.83 2.24 25.07 4.77 2.06 6.83 2011 TOTALS (lbs/day unmitigated) 1.46 9.90 14.07 0.01 0.05 0.60 0.65 0.02 0.55 0.56 2011 TOTALS (lbs/day mitigated) 1.46 9.90 14.07 0.01 0.05 0.60 0.65 0.02 0.55 0.56 2012 TOTALS (lbs/day unmitigated) 1.35 9.12 13.24 0.01 0.05 0.54 0.58 0.02 0.49 0.51 2012 TOTALS (lbs/day mitigated) 1.35 9.12 13.24 0.01 0.05 0.54 0.58 0.02 0.49 0.51 2013 TOTALS (lbs/day unmitigated) 45.09 22.26 23.70 0.01 0.06 1.63 1.69 0.02 1.50 1.52 0.06 1.63 1.69 2013 TOTALS (lbs/day mitigated) 45.09 22.26 23.70 0.02 1.50 1.52 AREA SOURCE EMISSION ESTIMATES 0.01 ROG NOx CO SO2 PM10 PM2.5 TOTALS (lbs/day, unmitigated) 0.92 0.86 2.26 0.00 0.01 0.01 SUM OF AREA SOURCE AND OPERATIONAL EMISSION ESTIMATES ROG NOx CO SO2 PM10 PM2.5 0.00 0.01 0.01 TOTALS (lbs/day, unmitigated) 0.92 0.86 2.26
Transcript of CRT Proposed Action Urbemis Summer - Const Area Name: CRT Proposed Action - Construction and Area...

Page: 13/31/2010 11:27:26 AM
Urbemis 2007 Version 9.2.4
Combined Summer Emissions Reports (Pounds/Day)
File Name: Z:\Alan Sako\924.06 CRT\Emissions\CRT Proposed Action - Const Area.urb924
Project Name: CRT Proposed Action - Construction and Area Source
Project Location: Bay Area Air District
On-Road Vehicle Emissions Based on: Version : Emfac2007 V2.3 Nov 1 2006
Off-Road Vehicle Emissions Based on: OFFROAD2007
Summary Report:
CONSTRUCTION EMISSION ESTIMATES
ROG NOx CO SO2 PM10 Dust PM10 Exhaust PM10 PM2.5 Dust PM2.5 Exhaust PM2.5
2010 TOTALS (lbs/day unmitigated) 5.32 45.81 23.95 0.01 55.87 2.24 58.11 11.67 2.06 13.73
2010 TOTALS (lbs/day mitigated) 5.32 45.81 23.95 0.01 22.83 2.24 25.07 4.77 2.06 6.83
2011 TOTALS (lbs/day unmitigated) 1.46 9.90 14.07 0.01 0.05 0.60 0.65 0.02 0.55 0.56
2011 TOTALS (lbs/day mitigated) 1.46 9.90 14.07 0.01 0.05 0.60 0.65 0.02 0.55 0.56
2012 TOTALS (lbs/day unmitigated) 1.35 9.12 13.24 0.01 0.05 0.54 0.58 0.02 0.49 0.51
2012 TOTALS (lbs/day mitigated) 1.35 9.12 13.24 0.01 0.05 0.54 0.58 0.02 0.49 0.51
2013 TOTALS (lbs/day unmitigated) 45.09 22.26 23.70 0.01 0.06 1.63 1.69 0.02 1.50 1.52
0.06 1.63 1.692013 TOTALS (lbs/day mitigated) 45.09 22.26 23.70 0.02 1.50 1.52
AREA SOURCE EMISSION ESTIMATES
0.01
ROG NOx CO SO2 PM10 PM2.5
TOTALS (lbs/day, unmitigated) 0.92 0.86 2.26 0.00 0.01 0.01
SUM OF AREA SOURCE AND OPERATIONAL EMISSION ESTIMATES
ROG NOx CO SO2 PM10 PM2.5
0.00 0.01 0.01TOTALS (lbs/day, unmitigated) 0.92 0.86 2.26

Page: 13/31/2010 11:27:26 AM
Construction Unmitigated Detail Report:
CONSTRUCTION EMISSION ESTIMATES Summer Pounds Per Day, Unmitigated
ROG NOx CO SO2 PM10 Dust PM10 Exhaust PM10 PM2.5 Dust PM2.5 Exhaust PM2.5
Time Slice 10/1/2010-12/31/2010 Active Days: 66 5.32 45.81 23.95 0.01 55.87 2.24 58.11 11.67 2.06 13.73
Mass Grading 10/01/2010-12/31/2010 3.23 28.05 14.57 0.00 55.86 1.36 57.22 11.67 1.25 12.92
Mass Grading Dust 0.00 0.00 0.00 0.00 55.84 0.00 55.84 11.66 0.00 11.66
Mass Grading Off Road Diesel 3.00 24.99 12.46 0.00 0.00 1.25 1.25 0.00 1.15 1.15
Mass Grading On Road Diesel 0.19 3.00 0.95 0.00 0.01 0.11 0.12 0.00 0.10 0.11
Mass Grading Worker Trips 0.04 0.07 1.16 0.00 0.00 0.00 0.01 0.00 0.00 0.00
Trenching 10/01/2010-12/31/2010 2.10 17.75 9.37 0.00 0.00 0.88 0.88 0.00 0.81 0.81
Trenching Off Road Diesel 2.06 17.69 8.22 0.00 0.00 0.88 0.88 0.00 0.81 0.81
Trenching Worker Trips 0.04 0.07 1.16 0.00 0.00 0.00 0.01 0.00 0.00 0.00
Time Slice 1/3/2011-12/30/2011 Active Days: 260 1.46 9.90 14.07 0.01 0.05 0.60 0.65 0.02 0.55 0.56
Building 01/01/2011-06/30/2013 1.46 9.90 14.07 0.01 0.05 0.60 0.65 0.02 0.55 0.56
Building Off Road Diesel 1.11 8.51 4.68 0.00 0.00 0.54 0.54 0.00 0.50 0.50
Building Vendor Trips 0.07 0.91 0.77 0.00 0.01 0.03 0.04 0.00 0.03 0.03
Building Worker Trips 0.28 0.48 8.63 0.01 0.04 0.02 0.06 0.01 0.02 0.03
Time Slice 1/2/2012-12/31/2012 Active Days: 261 1.35 9.12 13.24 0.01 0.05 0.54 0.58 0.02 0.49 0.51
Building 01/01/2011-06/30/2013 1.35 9.12 13.24 0.01 0.05 0.54 0.58 0.02 0.49 0.51
Building Off Road Diesel 1.03 7.87 4.56 0.00 0.00 0.49 0.49 0.00 0.45 0.45
Building Vendor Trips 0.06 0.81 0.72 0.00 0.01 0.03 0.04 0.00 0.03 0.03
Building Worker Trips 0.25 0.44 7.96 0.01 0.04 0.02 0.06 0.01 0.02 0.03
Time Slice 1/1/2013-3/29/2013 Active Days: 64 1.24 8.41 12.48 0.01 0.05 0.48 0.52 0.02 0.43 0.45
Building 01/01/2011-06/30/2013 1.24 8.41 12.48 0.01 0.05 0.48 0.52 0.02 0.43 0.45
Building Off Road Diesel 0.95 7.29 4.48 0.00 0.00 0.43 0.43 0.00 0.39 0.39
Building Vendor Trips 0.06 0.72 0.67 0.00 0.01 0.03 0.03 0.00 0.02 0.03
Building Worker Trips 0.23 0.40 7.33 0.01 0.04 0.02 0.06 0.01 0.02 0.03
Time Slice 4/1/2013-6/28/2013 Active Days: 65 45.09 22.26 23.70 0.01 0.06 1.63 1.69 0.02 1.50 1.52
Asphalt 04/01/2013-06/30/2013 2.31 13.82 10.78 0.00 0.01 1.16 1.17 0.00 1.06 1.07
Paving Off-Gas 0.05 0.00 0.00 0.00 0.00 0.00 0.00 0.00 0.00 0.00
Paving Off Road Diesel 2.19 13.60 8.91 0.00 0.00 1.15 1.15 0.00 1.05 1.05
Paving On Road Diesel 0.01 0.12 0.04 0.00 0.00 0.00 0.01 0.00 0.00 0.00
Paving Worker Trips 0.06 0.10 1.82 0.00 0.01 0.01 0.02 0.00 0.00 0.01

Page: 13/31/2010 11:27:26 AM
Building 01/01/2011-06/30/2013 1.24 8.41 12.48 0.01 0.05 0.48 0.52 0.02 0.43 0.45
Building Off Road Diesel 0.95 7.29 4.48 0.00 0.00 0.43 0.43 0.00 0.39 0.39
Building Vendor Trips 0.06 0.72 0.67 0.00 0.01 0.03 0.03 0.00 0.02 0.03
Building Worker Trips 0.23 0.40 7.33 0.01 0.04 0.02 0.06 0.01 0.02 0.03
Coating 04/01/2013-06/30/2013 41.54 0.02 0.44 0.00 0.00 0.00 0.00
Architectural Coating 41.52 0.00 0.00 0.00 0.00
0.00 0.00 0.00
0.02 0.44
0.00 0.000.00 0.00 0.00
0.00 0.00 0.00
Phase Assumptions
0.00 0.00 0.00 0.00Coating Worker Trips 0.01
Phase: Mass Grading 10/1/2010 - 12/31/2010 - Default Fine Site Grading Description
Total Acres Disturbed: 2.25
Maximum Daily Acreage Disturbed: 0.56
Fugitive Dust Level of Detail: Low
Onsite Cut/Fill: 30.3 cubic yards/day; Offsite Cut/Fill: 106.06 cubic yards/day
On Road Truck Travel (VMT): 106.06
Off-Road Equipment:
1 Graders (174 hp) operating at a 0.61 load factor for 6 hours per day
1 Rubber Tired Dozers (357 hp) operating at a 0.59 load factor for 6 hours per day
1 Tractors/Loaders/Backhoes (108 hp) operating at a 0.55 load factor for 7 hours per day
1 Water Trucks (189 hp) operating at a 0.5 load factor for 8 hours per day
Phase: Trenching 10/1/2010 - 12/31/2010 - Type Your Description Here
Off-Road Equipment:
2 Excavators (168 hp) operating at a 0.57 load factor for 8 hours per day
1 Other General Industrial Equipment (238 hp) operating at a 0.51 load factor for 8 hours per day
1 Tractors/Loaders/Backhoes (108 hp) operating at a 0.55 load factor for 0 hours per day
Phase: Paving 4/1/2013 - 6/30/2013 - Default Paving Description
Acres to be Paved: 1.36
Off-Road Equipment:
4 Cement and Mortar Mixers (10 hp) operating at a 0.56 load factor for 6 hours per day
1 Pavers (100 hp) operating at a 0.62 load factor for 7 hours per day
1 Paving Equipment (104 hp) operating at a 0.53 load factor for 8 hours per day
1 Rollers (95 hp) operating at a 0.56 load factor for 7 hours per day
1 Tractors/Loaders/Backhoes (108 hp) operating at a 0.55 load factor for 7 hours per day

Page: 13/31/2010 11:27:26 AM
Phase: Building Construction 1/1/2011 - 6/30/2013 - Default Building Construction Description
Off-Road Equipment:
1 Cranes (399 hp) operating at a 0.43 load factor for 4 hours per day
2 Forklifts (145 hp) operating at a 0.3 load factor for 6 hours per day
1 Tractors/Loaders/Backhoes (108 hp) operating at a 0.55 load factor for 8 hours per day
Phase: Architectural Coating 4/1/2013 - 6/30/2013 - Default Architectural Coating Description
Rule: Residential Interior Coatings begins 1/1/2005 ends 12/31/2040 specifies a VOC of 250
Rule: Residential Exterior Coatings begins 1/1/2005 ends 12/31/2040 specifies a VOC of 250
Rule: Nonresidential Interior Coatings begins 1/1/2005 ends 12/31/2040 specifies a VOC of 250
Rule: Nonresidential Exterior Coatings begins 1/1/2005 ends 12/31/2040 specifies a VOC of 250
Construction Mitigated Detail Report:
CONSTRUCTION EMISSION ESTIMATES Summer Pounds Per Day, Mitigated
ROG NOx CO SO2 PM10 Dust PM10 Exhaust PM10 PM2.5 Dust PM2.5 Exhaust PM2.5
Time Slice 10/1/2010-12/31/2010 Active Days: 66 5.32 45.81 23.95 0.01 22.83 2.24 25.07 4.77 2.06 6.83
Mass Grading 10/01/2010-12/31/2010 3.23 28.05 14.57 0.00 22.83 1.36 24.19 4.77 1.25 6.02
Mass Grading Dust 0.00 0.00 0.00 0.00 22.81 0.00 22.81 4.76 0.00 4.76
Mass Grading Off Road Diesel 3.00 24.99 12.46 0.00 0.00 1.25 1.25 0.00 1.15 1.15
Mass Grading On Road Diesel 0.19 3.00 0.95 0.00 0.01 0.11 0.12 0.00 0.10 0.11
Mass Grading Worker Trips 0.04 0.07 1.16 0.00 0.00 0.00 0.01 0.00 0.00 0.00
Trenching 10/01/2010-12/31/2010 2.10 17.75 9.37 0.00 0.00 0.88 0.88 0.00 0.81 0.81
Trenching Off Road Diesel 2.06 17.69 8.22 0.00 0.00 0.88 0.88 0.00 0.81 0.81
Trenching Worker Trips 0.04 0.07 1.16 0.00 0.00 0.00 0.01 0.00 0.00 0.00
Time Slice 1/3/2011-12/30/2011 Active Days: 260 1.46 9.90 14.07 0.01 0.05 0.60 0.65 0.02 0.55 0.56
Building 01/01/2011-06/30/2013 1.46 9.90 14.07 0.01 0.05 0.60 0.65 0.02 0.55 0.56
Building Off Road Diesel 1.11 8.51 4.68 0.00 0.00 0.54 0.54 0.00 0.50 0.50
Building Vendor Trips 0.07 0.91 0.77 0.00 0.01 0.03 0.04 0.00 0.03 0.03
Building Worker Trips 0.28 0.48 8.63 0.01 0.04 0.02 0.06 0.01 0.02 0.03
Time Slice 1/2/2012-12/31/2012 Active Days: 261 1.35 9.12 13.24 0.01 0.05 0.54 0.58 0.02 0.49 0.51
Building 01/01/2011-06/30/2013 1.35 9.12 13.24 0.01 0.05 0.54 0.58 0.02 0.49 0.51
Building Off Road Diesel 1.03 7.87 4.56 0.00 0.00 0.49 0.49 0.00 0.45 0.45
Building Vendor Trips 0.06 0.81 0.72 0.00 0.01 0.03 0.04 0.00 0.03 0.03
Building Worker Trips 0.25 0.44 7.96 0.01 0.04 0.02 0.06 0.01 0.02 0.03

Page: 13/31/2010 11:27:26 AM
Time Slice 1/1/2013-3/29/2013 Active Days: 64 1.24 8.41 12.48 0.01 0.05 0.48 0.52 0.02 0.43 0.45
Building 01/01/2011-06/30/2013 1.24 8.41 12.48 0.01 0.05 0.48 0.52 0.02 0.43 0.45
Building Off Road Diesel 0.95 7.29 4.48 0.00 0.00 0.43 0.43 0.00 0.39 0.39
Building Vendor Trips 0.06 0.72 0.67 0.00 0.01 0.03 0.03 0.00 0.02 0.03
Building Worker Trips 0.23 0.40 7.33 0.01 0.04 0.02 0.06 0.01 0.02 0.03
Time Slice 4/1/2013-6/28/2013 Active Days: 65 45.09 22.26 23.70 0.01 0.06 1.63 1.69 0.02 1.50 1.52
Asphalt 04/01/2013-06/30/2013 2.31 13.82 10.78 0.00 0.01 1.16 1.17 0.00 1.06 1.07
Paving Off-Gas 0.05 0.00 0.00 0.00 0.00 0.00 0.00 0.00 0.00 0.00
Paving Off Road Diesel 2.19 13.60 8.91 0.00 0.00 1.15 1.15 0.00 1.05 1.05
Paving On Road Diesel 0.01 0.12 0.04 0.00 0.00 0.00 0.01 0.00 0.00 0.00
Paving Worker Trips 0.06 0.10 1.82 0.00 0.01 0.01 0.02 0.00 0.00 0.01
Building 01/01/2011-06/30/2013 1.24 8.41 12.48 0.01 0.05 0.48 0.52 0.02 0.43 0.45
Building Off Road Diesel 0.95 7.29 4.48 0.00 0.00 0.43 0.43 0.00 0.39 0.39
Building Vendor Trips 0.06 0.72 0.67 0.00 0.01 0.03 0.03 0.00 0.02 0.03
Building Worker Trips 0.23 0.40 7.33 0.01 0.04 0.02 0.06 0.01 0.02 0.03
Coating 04/01/2013-06/30/2013 41.54 0.02 0.44 0.00 0.00 0.00 0.00
Architectural Coating 41.52 0.00 0.00 0.00 0.00
0.00 0.00 0.00
0.02 0.44
0.00 0.000.00 0.00 0.00
0.00 0.00 0.00
Construction Related Mitigation Measures
0.00 0.00 0.00 0.00Coating Worker Trips 0.01
The following mitigation measures apply to Phase: Mass Grading 10/1/2010 - 12/31/2010 - Default Fine Site Grading Description
For Soil Stablizing Measures, the Water exposed surfaces 2x daily watering mitigation reduces emissions by:
PM10: 55% PM25: 55%
For Unpaved Roads Measures, the Reduce speed on unpaved roads to less than 15 mph mitigation reduces emissions by:
PM10: 44% PM25: 44%
For Unpaved Roads Measures, the Manage haul road dust 2x daily watering mitigation reduces emissions by:
PM10: 55% PM25: 55%
Area Source Unmitigated Detail Report:
AREA SOURCE EMISSION ESTIMATES Summer Pounds Per Day, Unmitigated
Source ROG NOx CO SO2 PM10 PM2.5
Natural Gas 0.06 0.84 0.71 0.00 0.00 0.00
Hearth
Landscape 0.12 0.02 1.55 0.00 0.01 0.01
Consumer Products 0.00
0.01 0.01
Architectural Coatings 0.74
Area Source Changes to Defaults
TOTALS (lbs/day, unmitigated) 0.92 0.86 2.26 0.00

Page: 12/23/2010 01:24:49 PM
0.03 4.60 0.88
TOTALS (lbs/day, unmitigated) 3.13 2.33 24.87 0.03 4.60 0.88
R&D Center 3.13 2.33 24.87
OPERATIONAL EMISSION ESTIMATES Summer Pounds Per Day, Unmitigated
Source ROG NOX CO SO2 PM10 PM25
0.03 4.60 0.88
Operational Unmitigated Detail Report:
TOTALS (lbs/day, unmitigated) 3.13 2.33 24.87
SUM OF AREA SOURCE AND OPERATIONAL EMISSION ESTIMATES
ROG NOx CO SO2 PM10 PM2.5
SO2 PM10 PM2.5
TOTALS (lbs/day, unmitigated) 3.13 2.33 24.87 0.03 4.60 0.88
ROG NOx CO
OPERATIONAL (VEHICLE) EMISSION ESTIMATES
Project Location: Bay Area Air District
On-Road Vehicle Emissions Based on: Version : Emfac2007 V2.3 Nov 1 2006
Off-Road Vehicle Emissions Based on: OFFROAD2007
Summary Report:
Urbemis 2007 Version 9.2.4
Combined Summer Emissions Reports (Pounds/Day)
File Name: Z:\Alan Sako\924.06 CRT\Emissions\CRT Proposed Action - Operational.urb924
Project Name: CRT Proposed Action - Operations

Page: 12/23/2010 01:24:49 PM
16.7Motor Home 0.6 0.0 83.3
0.0
School Bus 0.1 0.0 0.0 100.0
Motorcycle 3.2 56.2 43.8
100.0
Urban Bus 0.1 0.0 0.0 100.0
Other Bus 0.1 0.0 0.0
80.0
Heavy-Heavy Truck 33,001-60,000 lbs 0.4 0.0 0.0 100.0
Med-Heavy Truck 14,001-33,000 lbs 1.0 0.0 20.0
22.2
Lite-Heavy Truck 10,001-14,000 lbs 0.6 0.0 50.0 50.0
Lite-Heavy Truck 8501-10,000 lbs 0.9 0.0 77.8
0.0
Med Truck 5751-8500 lbs 6.6 0.0 100.0 0.0
Light Truck 3751-5750 lbs 19.9 0.5 99.5
0.2
Light Truck < 3750 lbs 12.8 0.8 96.9 2.3
Light Auto 53.7 0.6 99.2
Vehicle Fleet Mix
Vehicle Type Percent Type Non-Catalyst Catalyst Diesel
135.00 373.95 2,677.95
373.95 2,677.95
R&D Center 2.77 unknown
Emfac: Version : Emfac2007 V2.3 Nov 1 2006
Summary of Land Uses
Land Use Type Acreage Trip Rate Unit Type No. Units Total Trips Total VMT
Operational Settings:
Includes correction for passby trips
Does not include double counting adjustment for internal trips
Analysis Year: 2013 Temperature (F): 85 Season: Summer

Page: 12/23/2010 01:24:49 PM
R&D Center 50.0 25.0 25.0
% of Trips - Commercial (by land use)
% of Trips - Residential 32.9 18.0 49.1
14.7 6.6 6.6
Trip speeds (mph) 35.0 35.0 35.0 35.0 35.0 35.0
Rural Trip Length (miles) 16.8 7.1 7.9
Commute Non-Work Customer
Urban Trip Length (miles) 10.8 7.3 7.5 9.5 7.4 7.4
Home-Work Home-Shop Home-Other
Travel Conditions
Residential Commercial

0.00 0.00 0.00TOTALS (lbs/day, unmitigated) 0.80 0.84 0.71
SUM OF AREA SOURCE AND OPERATIONAL EMISSION ESTIMATES
ROG NOx CO SO2 PM10 PM2.5
SO2 PM10 PM2.5
TOTALS (lbs/day, unmitigated) 0.80 0.84 0.71 0.00 0.00 0.00
ROG NOx CO
0.02 1.50 1.52
AREA SOURCE EMISSION ESTIMATES
0.01 0.06 1.63 1.692013 TOTALS (lbs/day mitigated) 45.09 22.26 23.70
1.69 0.02 1.50 1.522013 TOTALS (lbs/day unmitigated) 45.09 22.26 23.70 0.01 0.06 1.63
0.58 0.02 0.49 0.51
0.02 0.49 0.51
2012 TOTALS (lbs/day mitigated) 1.35 9.12 13.24 0.01 0.05 0.54
0.01 0.05 0.54 0.582012 TOTALS (lbs/day unmitigated) 1.35 9.12 13.24
0.02 0.55 0.560.01 0.05 0.60 0.652011 TOTALS (lbs/day mitigated) 1.46 9.90 14.07
0.65 0.02 0.55 0.562011 TOTALS (lbs/day unmitigated) 1.46 9.90 14.07 0.01 0.05 0.60
25.07 4.77 2.06 6.83
11.67 2.06 13.73
2010 TOTALS (lbs/day mitigated) 5.32 45.81 23.95 0.01 22.83 2.24
0.01 55.87 2.24 58.112010 TOTALS (lbs/day unmitigated) 5.32 45.81 23.95
PM10 PM2.5 Dust PM2.5 Exhaust PM2.5
Off-Road Vehicle Emissions Based on: OFFROAD2007
Summary Report:
CONSTRUCTION EMISSION ESTIMATES
ROG NOx CO SO2 PM10 Dust PM10 Exhaust
File Name: Z:\Alan Sako\924.06 CRT\Emissions\CRT Proposed Action - Const Area.urb924
Project Name: CRT Proposed Action - Construction and Area Source
Project Location: Bay Area Air District
On-Road Vehicle Emissions Based on: Version : Emfac2007 V2.3 Nov 1 2006
Page: 1
3/31/2010 11:27:49 AM
Urbemis 2007 Version 9.2.4
Combined Winter Emissions Reports (Pounds/Day)

Page: 1
3/31/2010 11:27:49 AM
0.02 0.00 0.00 0.01
0.00 0.00 0.00
Paving Worker Trips 0.06 0.10 1.82 0.00 0.01 0.01
0.00 0.00 0.00 0.01Paving On Road Diesel 0.01 0.12 0.04
1.15 0.00 1.05 1.05
0.00 0.00 0.00
Paving Off Road Diesel 2.19 13.60 8.91 0.00 0.00 1.15
0.00 0.00 0.00 0.00Paving Off-Gas 0.05 0.00 0.00
1.17 0.00 1.06 1.07
0.02 1.50 1.52
Asphalt 04/01/2013-06/30/2013 2.31 13.82 10.78 0.00 0.01 1.16
0.01 0.06 1.63 1.69Time Slice 4/1/2013-6/28/2013 Active
Days: 65
45.09 22.26 23.70
0.06 0.01 0.02 0.03
0.00 0.02 0.03
Building Worker Trips 0.23 0.40 7.33 0.01 0.04 0.02
0.00 0.01 0.03 0.03Building Vendor Trips 0.06 0.72 0.67
0.43 0.00 0.39 0.39
0.02 0.43 0.45
Building Off Road Diesel 0.95 7.29 4.48 0.00 0.00 0.43
0.01 0.05 0.48 0.52Building 01/01/2011-06/30/2013 1.24 8.41 12.48
0.52 0.02 0.43 0.45
0.01 0.02 0.03
Time Slice 1/1/2013-3/29/2013 Active
Days: 64
1.24 8.41 12.48 0.01 0.05 0.48
0.01 0.04 0.02 0.06Building Worker Trips 0.25 0.44 7.96
0.04 0.00 0.03 0.03
0.00 0.45 0.45
Building Vendor Trips 0.06 0.81 0.72 0.00 0.01 0.03
0.00 0.00 0.49 0.49Building Off Road Diesel 1.03 7.87 4.56
0.58 0.02 0.49 0.51
0.02 0.49 0.51
Building 01/01/2011-06/30/2013 1.35 9.12 13.24 0.01 0.05 0.54
0.01 0.05 0.54 0.58Time Slice 1/2/2012-12/31/2012 Active
Days: 261
1.35 9.12 13.24
0.06 0.01 0.02 0.03
0.00 0.03 0.03
Building Worker Trips 0.28 0.48 8.63 0.01 0.04 0.02
0.00 0.01 0.03 0.04Building Vendor Trips 0.07 0.91 0.77
0.54 0.00 0.50 0.50
0.02 0.55 0.56
Building Off Road Diesel 1.11 8.51 4.68 0.00 0.00 0.54
0.01 0.05 0.60 0.65Building 01/01/2011-06/30/2013 1.46 9.90 14.07
0.65 0.02 0.55 0.56
0.00 0.00 0.00
Time Slice 1/3/2011-12/30/2011 Active
Days: 260
1.46 9.90 14.07 0.01 0.05 0.60
0.00 0.00 0.00 0.01Trenching Worker Trips 0.04 0.07 1.16
0.88 0.00 0.81 0.81
0.00 0.81 0.81
Trenching Off Road Diesel 2.06 17.69 8.22 0.00 0.00 0.88
0.00 0.00 0.88 0.88Trenching 10/01/2010-12/31/2010 2.10 17.75 9.37
0.01 0.00 0.00 0.00
0.00 0.10 0.11
Mass Grading Worker Trips 0.04 0.07 1.16 0.00 0.00 0.00
0.00 0.01 0.11 0.12Mass Grading On Road Diesel 0.19 3.00 0.95
1.25 0.00 1.15 1.15
11.66 0.00 11.66
Mass Grading Off Road Diesel 3.00 24.99 12.46 0.00 0.00 1.25
0.00 55.84 0.00 55.84Mass Grading Dust 0.00 0.00 0.00
57.22 11.67 1.25 12.92
11.67 2.06 13.73
Mass Grading 10/01/2010-
12/31/2010
3.23 28.05 14.57 0.00 55.86 1.36
PM2.5 Exhaust PM2.5
Time Slice 10/1/2010-12/31/2010
Active Days: 66
5.32 45.81 23.95 0.01 55.87 2.24 58.11
CONSTRUCTION EMISSION ESTIMATES Winter Pounds Per Day, Unmitigated
ROG NOx CO SO2 PM10 Dust PM10 Exhaust PM10 PM2.5 Dust
Construction Unmitigated Detail Report:

Page: 1
3/31/2010 11:27:49 AM
Off-Road Equipment:
1 Cranes (399 hp) operating at a 0.43 load factor for 4 hours per day
2 Forklifts (145 hp) operating at a 0.3 load factor for 6 hours per day
1 Tractors/Loaders/Backhoes (108 hp) operating at a 0.55 load factor for 8 hours per day
1 Rollers (95 hp) operating at a 0.56 load factor for 7 hours per day
1 Tractors/Loaders/Backhoes (108 hp) operating at a 0.55 load factor for 7 hours per day
Phase: Building Construction 1/1/2011 - 6/30/2013 - Default Building Construction Description
Off-Road Equipment:
4 Cement and Mortar Mixers (10 hp) operating at a 0.56 load factor for 6 hours per day
1 Pavers (100 hp) operating at a 0.62 load factor for 7 hours per day
1 Paving Equipment (104 hp) operating at a 0.53 load factor for 8 hours per day
1 Tractors/Loaders/Backhoes (108 hp) operating at a 0.55 load factor for 0 hours per day
Phase: Paving 4/1/2013 - 6/30/2013 - Default Paving Description
Acres to be Paved: 1.36
Phase: Trenching 10/1/2010 - 12/31/2010 - Type Your Description Here
Off-Road Equipment:
2 Excavators (168 hp) operating at a 0.57 load factor for 8 hours per day
1 Other General Industrial Equipment (238 hp) operating at a 0.51 load factor for 8 hours per day
1 Rubber Tired Dozers (357 hp) operating at a 0.59 load factor for 6 hours per day
1 Tractors/Loaders/Backhoes (108 hp) operating at a 0.55 load factor for 7 hours per day
1 Water Trucks (189 hp) operating at a 0.5 load factor for 8 hours per day
Onsite Cut/Fill: 30.3 cubic yards/day; Offsite Cut/Fill: 106.06 cubic yards/day
On Road Truck Travel (VMT): 106.06
Off-Road Equipment:
1 Graders (174 hp) operating at a 0.61 load factor for 6 hours per day
Phase: Mass Grading 10/1/2010 - 12/31/2010 - Default Fine Site Grading Description
Total Acres Disturbed: 2.25
Maximum Daily Acreage Disturbed: 0.56
Fugitive Dust Level of Detail: Low
0.00 0.00 0.00
Phase Assumptions
0.00 0.00 0.00 0.00Coating Worker Trips 0.01 0.02 0.44
0.00 0.00 0.00 0.00
0.00 0.00 0.00
Architectural Coating 41.52 0.00 0.00 0.00 0.00 0.00
0.00 0.00 0.00 0.00Coating 04/01/2013-06/30/2013 41.54 0.02 0.44
0.06 0.01 0.02 0.03
0.00 0.02 0.03
Building Worker Trips 0.23 0.40 7.33 0.01 0.04 0.02
0.00 0.01 0.03 0.03Building Vendor Trips 0.06 0.72 0.67
0.43 0.00 0.39 0.39
0.02 0.43 0.45
Building Off Road Diesel 0.95 7.29 4.48 0.00 0.00 0.43
0.01 0.05 0.48 0.52Building 01/01/2011-06/30/2013 1.24 8.41 12.48

Page: 1
3/31/2010 11:27:49 AM
0.06 0.01 0.02 0.03
0.00 0.02 0.03
Building Worker Trips 0.23 0.40 7.33 0.01 0.04 0.02
0.00 0.01 0.03 0.03Building Vendor Trips 0.06 0.72 0.67
0.43 0.00 0.39 0.39
0.02 0.43 0.45
Building Off Road Diesel 0.95 7.29 4.48 0.00 0.00 0.43
0.01 0.05 0.48 0.52Building 01/01/2011-06/30/2013 1.24 8.41 12.48
0.52 0.02 0.43 0.45
0.01 0.02 0.03
Time Slice 1/1/2013-3/29/2013 Active
Days: 64
1.24 8.41 12.48 0.01 0.05 0.48
0.01 0.04 0.02 0.06Building Worker Trips 0.25 0.44 7.96
0.04 0.00 0.03 0.03
0.00 0.45 0.45
Building Vendor Trips 0.06 0.81 0.72 0.00 0.01 0.03
0.00 0.00 0.49 0.49Building Off Road Diesel 1.03 7.87 4.56
0.58 0.02 0.49 0.51
0.02 0.49 0.51
Building 01/01/2011-06/30/2013 1.35 9.12 13.24 0.01 0.05 0.54
0.01 0.05 0.54 0.58Time Slice 1/2/2012-12/31/2012 Active
Days: 261
1.35 9.12 13.24
0.06 0.01 0.02 0.03
0.00 0.03 0.03
Building Worker Trips 0.28 0.48 8.63 0.01 0.04 0.02
0.00 0.01 0.03 0.04Building Vendor Trips 0.07 0.91 0.77
0.54 0.00 0.50 0.50
0.02 0.55 0.56
Building Off Road Diesel 1.11 8.51 4.68 0.00 0.00 0.54
0.01 0.05 0.60 0.65Building 01/01/2011-06/30/2013 1.46 9.90 14.07
0.65 0.02 0.55 0.56
0.00 0.00 0.00
Time Slice 1/3/2011-12/30/2011 Active
Days: 260
1.46 9.90 14.07 0.01 0.05 0.60
0.00 0.00 0.00 0.01Trenching Worker Trips 0.04 0.07 1.16
0.88 0.00 0.81 0.81
0.00 0.81 0.81
Trenching Off Road Diesel 2.06 17.69 8.22 0.00 0.00 0.88
0.00 0.00 0.88 0.88Trenching 10/01/2010-12/31/2010 2.10 17.75 9.37
0.01 0.00 0.00 0.00
0.00 0.10 0.11
Mass Grading Worker Trips 0.04 0.07 1.16 0.00 0.00 0.00
0.00 0.01 0.11 0.12Mass Grading On Road Diesel 0.19 3.00 0.95
1.25 0.00 1.15 1.15
4.76 0.00 4.76
Mass Grading Off Road Diesel 3.00 24.99 12.46 0.00 0.00 1.25
0.00 22.81 0.00 22.81Mass Grading Dust 0.00 0.00 0.00
24.19 4.77 1.25 6.02
4.77 2.06 6.83
Mass Grading 10/01/2010-
12/31/2010
3.23 28.05 14.57 0.00 22.83 1.36
PM2.5 Exhaust PM2.5
Time Slice 10/1/2010-12/31/2010
Active Days: 66
5.32 45.81 23.95 0.01 22.83 2.24 25.07
CONSTRUCTION EMISSION ESTIMATES Winter Pounds Per Day, Mitigated
ROG NOx CO SO2 PM10 Dust PM10 Exhaust PM10 PM2.5 Dust
Rule: Nonresidential Interior Coatings begins 1/1/2005 ends 12/31/2040 specifies a VOC of 250
Rule: Nonresidential Exterior Coatings begins 1/1/2005 ends 12/31/2040 specifies a VOC of 250
Construction Mitigated Detail Report:
Phase: Architectural Coating 4/1/2013 - 6/30/2013 - Default Architectural Coating Description
Rule: Residential Interior Coatings begins 1/1/2005 ends 12/31/2040 specifies a VOC of 250
Rule: Residential Exterior Coatings begins 1/1/2005 ends 12/31/2040 specifies a VOC of 250

Page: 1
3/31/2010 11:27:49 AM
Area Source Changes to Defaults
TOTALS (lbs/day, unmitigated) 0.80 0.84 0.71 0.00 0.00 0.00
Architectural Coatings 0.74
Consumer Products 0.00
Landscaping - No Winter Emissions
0.00 0.00 0.00
Hearth
Natural Gas 0.06 0.84 0.71
AREA SOURCE EMISSION ESTIMATES Winter Pounds Per Day, Unmitigated
Source ROG NOx CO SO2 PM10 PM2.5
PM10: 44% PM25: 44%
For Unpaved Roads Measures, the Manage haul road dust 2x daily watering mitigation reduces emissions by:
PM10: 55% PM25: 55%
Area Source Unmitigated Detail Report:
The following mitigation measures apply to Phase: Mass Grading 10/1/2010 - 12/31/2010 - Default Fine Site Grading Description
For Soil Stablizing Measures, the Water exposed surfaces 2x daily watering mitigation reduces emissions by:
PM10: 55% PM25: 55%
For Unpaved Roads Measures, the Reduce speed on unpaved roads to less than 15 mph mitigation reduces emissions by:
0.00 0.00 0.00
Construction Related Mitigation Measures
0.00 0.00 0.00 0.00Coating Worker Trips 0.01 0.02 0.44
0.00 0.00 0.00 0.00
0.00 0.00 0.00
Architectural Coating 41.52 0.00 0.00 0.00 0.00 0.00
0.00 0.00 0.00 0.00Coating 04/01/2013-06/30/2013 41.54 0.02 0.44
0.06 0.01 0.02 0.03
0.00 0.02 0.03
Building Worker Trips 0.23 0.40 7.33 0.01 0.04 0.02
0.00 0.01 0.03 0.03Building Vendor Trips 0.06 0.72 0.67
0.43 0.00 0.39 0.39
0.02 0.43 0.45
Building Off Road Diesel 0.95 7.29 4.48 0.00 0.00 0.43
0.01 0.05 0.48 0.52Building 01/01/2011-06/30/2013 1.24 8.41 12.48
0.02 0.00 0.00 0.01
0.00 0.00 0.00
Paving Worker Trips 0.06 0.10 1.82 0.00 0.01 0.01
0.00 0.00 0.00 0.01Paving On Road Diesel 0.01 0.12 0.04
1.15 0.00 1.05 1.05
0.00 0.00 0.00
Paving Off Road Diesel 2.19 13.60 8.91 0.00 0.00 1.15
0.00 0.00 0.00 0.00Paving Off-Gas 0.05 0.00 0.00
1.17 0.00 1.06 1.07
0.02 1.50 1.52
Asphalt 04/01/2013-06/30/2013 2.31 13.82 10.78 0.00 0.01 1.16
0.01 0.06 1.63 1.69Time Slice 4/1/2013-6/28/2013 Active
Days: 65
45.09 22.26 23.70

Page: 12/23/2010 01:25:01 PM
0.02 4.60 0.88
TOTALS (lbs/day, unmitigated) 2.33 3.47 26.37 0.02 4.60 0.88
R&D Center 2.33 3.47 26.37
OPERATIONAL EMISSION ESTIMATES Winter Pounds Per Day, Unmitigated
Source ROG NOX CO SO2 PM10 PM25
0.02 4.60 0.88
Operational Unmitigated Detail Report:
TOTALS (lbs/day, unmitigated) 2.33 3.47 26.37
SUM OF AREA SOURCE AND OPERATIONAL EMISSION ESTIMATES
ROG NOx CO SO2 PM10 PM2.5
SO2 PM10 PM2.5
TOTALS (lbs/day, unmitigated) 2.33 3.47 26.37 0.02 4.60 0.88
ROG NOx CO
OPERATIONAL (VEHICLE) EMISSION ESTIMATES
Project Location: Bay Area Air District
On-Road Vehicle Emissions Based on: Version : Emfac2007 V2.3 Nov 1 2006
Off-Road Vehicle Emissions Based on: OFFROAD2007
Summary Report:
Urbemis 2007 Version 9.2.4
Combined Winter Emissions Reports (Pounds/Day)
File Name: Z:\Alan Sako\924.06 CRT\Emissions\CRT Proposed Action - Operational.urb924
Project Name: CRT Proposed Action - Operations

Page: 12/23/2010 01:25:01 PM
16.7Motor Home 0.6 0.0 83.3
0.0
School Bus 0.1 0.0 0.0 100.0
Motorcycle 3.2 56.2 43.8
100.0
Urban Bus 0.1 0.0 0.0 100.0
Other Bus 0.1 0.0 0.0
80.0
Heavy-Heavy Truck 33,001-60,000 lbs 0.4 0.0 0.0 100.0
Med-Heavy Truck 14,001-33,000 lbs 1.0 0.0 20.0
22.2
Lite-Heavy Truck 10,001-14,000 lbs 0.6 0.0 50.0 50.0
Lite-Heavy Truck 8501-10,000 lbs 0.9 0.0 77.8
0.0
Med Truck 5751-8500 lbs 6.6 0.0 100.0 0.0
Light Truck 3751-5750 lbs 19.9 0.5 99.5
0.2
Light Truck < 3750 lbs 12.8 0.8 96.9 2.3
Light Auto 53.7 0.6 99.2
Vehicle Fleet Mix
Vehicle Type Percent Type Non-Catalyst Catalyst Diesel
135.00 373.95 2,677.95
373.95 2,677.95
R&D Center 2.77 unknown
Emfac: Version : Emfac2007 V2.3 Nov 1 2006
Summary of Land Uses
Land Use Type Acreage Trip Rate Unit Type No. Units Total Trips Total VMT
Operational Settings:
Includes correction for passby trips
Does not include double counting adjustment for internal trips
Analysis Year: 2013 Temperature (F): 40 Season: Winter

Page: 12/23/2010 01:25:01 PM
R&D Center 50.0 25.0 25.0
% of Trips - Commercial (by land use)
% of Trips - Residential 32.9 18.0 49.1
14.7 6.6 6.6
Trip speeds (mph) 35.0 35.0 35.0 35.0 35.0 35.0
Rural Trip Length (miles) 16.8 7.1 7.9
Commute Non-Work Customer
Urban Trip Length (miles) 10.8 7.3 7.5 9.5 7.4 7.4
Home-Work Home-Shop Home-Other
Travel Conditions
Residential Commercial

Page: 1
3/31/2010 11:28:07 AM
Urbemis 2007 Version 9.2.4
Combined Annual Emissions Reports (Tons/Year)
File Name: Z:\Alan Sako\924.06 CRT\Emissions\CRT Proposed Action - Const Area.urb924
Project Name: CRT Proposed Action - Construction and Area Source
Project Location: Bay Area Air District
On-Road Vehicle Emissions Based on: Version : Emfac2007 V2.3 Nov 1 2006
Off-Road Vehicle Emissions Based on: OFFROAD2007
Summary Report:
CONSTRUCTION EMISSION ESTIMATES
ROG NOx CO SO2 PM10 Dust PM10 Exhaust PM10 PM2.5 Dust PM2.5 Exhaust PM2.5 CO2
2010 TOTALS (tons/year unmitigated) 0.18 1.51 0.79 0.00 1.84 0.07 1.92 0.39 0.07 0.45 151.56
2010 TOTALS (tons/year mitigated) 0.18 1.51 0.79 0.00 0.75 0.07 0.83 0.16 0.07 0.23 151.56
Percent Reduction 0.00 0.00 0.00 0.00 59.13 0.00 56.85 59.11 0.00 50.25 0.00
2011 TOTALS (tons/year unmitigated) 0.19 1.29 1.83 0.00 0.01 0.08 0.08 0.00 0.07 0.07 249.49
2011 TOTALS (tons/year mitigated) 0.19 1.29 1.83 0.00 0.01 0.08 0.08 0.00 0.07 0.07 249.49
Percent Reduction 0.00 0.00 0.00 0.00 0.00 0.00 0.00 0.00 0.00 0.00 0.00
2012 TOTALS (tons/year unmitigated) 0.18 1.19 1.73 0.00 0.01 0.07 0.08 0.00 0.06 0.07 250.51
2012 TOTALS (tons/year mitigated) 0.18 1.19 1.73 0.00 0.01 0.07 0.08 0.00 0.06 0.07 250.51
Percent Reduction 0.00 0.00 0.00 0.00 0.00 0.00 0.00 0.00 0.00 0.00 0.00
2013 TOTALS (tons/year unmitigated) 1.51 0.99 1.17 0.00 0.00 0.07 0.07 0.00 0.06 0.06 174.24
2013 TOTALS (tons/year mitigated) 1.51 0.99 1.17 0.00 0.00 0.07 0.07 0.00 0.06 0.06 174.24
Percent Reduction 0.00 0.00 0.00 0.00 0.00 0.00 0.00 0.00 0.00 0.00 0.00
AREA SOURCE EMISSION ESTIMATES
ROG NOx CO SO2 PM10 PM2.5 CO2
TOTALS (tons/year, unmitigated) 0.15 0.15 0.27 0.00 0.00 0.00 184.21

Page: 1
3/31/2010 11:28:07 AM
SUM OF AREA SOURCE AND OPERATIONAL EMISSION ESTIMATES
ROG NOx CO SO2 PM10 PM2.5 CO2
TOTALS (tons/year, unmitigated) 0.15 0.15 0.27 0.00 0.00 0.00 184.21
Construction Unmitigated Detail Report:
CONSTRUCTION EMISSION ESTIMATES Annual Tons Per Year, Unmitigated
ROG NOx CO SO2 PM10 Dust PM10 Exhaust PM10 PM2.5 Dust PM2.5 Exhaust PM2.5 CO2
2010 0.18 1.51 0.79 0.00 1.84 0.07 1.92 0.39 0.07 0.45 151.56
Mass Grading 10/01/2010-
12/31/2010
0.11 0.93 0.48 0.00 1.84 0.04 1.89 0.39 0.04 0.43 91.62
Mass Grading Dust 0.00 0.00 0.00 0.00 1.84 0.00 1.84 0.38 0.00 0.38 0.00
Mass Grading Off Road Diesel 0.10 0.82 0.41 0.00 0.00 0.04 0.04 0.00 0.04 0.04 74.16
Mass Grading On Road Diesel 0.01 0.10 0.03 0.00 0.00 0.00 0.00 0.00 0.00 0.00 14.09
Mass Grading Worker Trips 0.00 0.00 0.04 0.00 0.00 0.00 0.00 0.00 0.00 0.00 3.36
Trenching 10/01/2010-12/31/2010 0.07 0.59 0.31 0.00 0.00 0.03 0.03 0.00 0.03 0.03 59.95
Trenching Off Road Diesel 0.07 0.58 0.27 0.00 0.00 0.03 0.03 0.00 0.03 0.03 56.58
Trenching Worker Trips 0.00 0.00 0.04 0.00 0.00 0.00 0.00 0.00 0.00 0.00 3.36
2011 0.19 1.29 1.83 0.00 0.01 0.08 0.08 0.00 0.07 0.07 249.49
Building 01/01/2011-06/30/2013 0.19 1.29 1.83 0.00 0.01 0.08 0.08 0.00 0.07 0.07 249.49
Building Off Road Diesel 0.14 1.11 0.61 0.00 0.00 0.07 0.07 0.00 0.06 0.06 116.14
Building Vendor Trips 0.01 0.12 0.10 0.00 0.00 0.00 0.01 0.00 0.00 0.00 26.45
Building Worker Trips 0.04 0.06 1.12 0.00 0.01 0.00 0.01 0.00 0.00 0.00 106.90
2012 0.18 1.19 1.73 0.00 0.01 0.07 0.08 0.00 0.06 0.07 250.51
Building 01/01/2011-06/30/2013 0.18 1.19 1.73 0.00 0.01 0.07 0.08 0.00 0.06 0.07 250.51
Building Off Road Diesel 0.13 1.03 0.60 0.00 0.00 0.06 0.06 0.00 0.06 0.06 116.59
Building Vendor Trips 0.01 0.11 0.09 0.00 0.00 0.00 0.00 0.00 0.00 0.00 26.55
Building Worker Trips 0.03 0.06 1.04 0.00 0.01 0.00 0.01 0.00 0.00 0.00 107.38
2013 1.51 0.99 1.17 0.00 0.00 0.07 0.07 0.00 0.06 0.06 174.24
Building 01/01/2011-06/30/2013 0.08 0.54 0.81 0.00 0.00 0.03 0.03 0.00 0.03 0.03 123.85
Building Off Road Diesel 0.06 0.47 0.29 0.00 0.00 0.03 0.03 0.00 0.03 0.03 57.62
Building Vendor Trips 0.00 0.05 0.04 0.00 0.00 0.00 0.00 0.00 0.00 0.00 13.12
Building Worker Trips 0.01 0.03 0.47 0.00 0.00 0.00 0.00 0.00 0.00 0.00 53.10

Page: 1
3/31/2010 11:28:07 AM
Asphalt 04/01/2013-06/30/2013 0.08 0.45 0.35 0.00 0.00 0.04 0.04 0.00 0.03 0.03 48.79
Paving Off-Gas 0.00 0.00 0.00 0.00 0.00 0.00 0.00 0.00 0.00 0.00 0.00
Paving Off Road Diesel 0.07 0.44 0.29 0.00 0.00 0.04 0.04 0.00 0.03 0.03 41.34
Paving On Road Diesel 0.00 0.00 0.00 0.00 0.00 0.00 0.00 0.00 0.00 0.00 0.81
Paving Worker Trips 0.00 0.00 0.06 0.00 0.00 0.00 0.00 0.00 0.00 0.00 6.64
Coating 04/01/2013-06/30/2013 1.35 0.00 0.01 0.00 0.00 0.00 0.00 0.00 0.00 0.00 1.61
Architectural Coating 1.35 0.00 0.00 0.00 0.00 0.00 0.00 0.00 0.00 0.00 0.00
Coating Worker Trips 0.00 0.00 0.01 0.00 0.00 0.00 0.00 0.00 0.00 0.00 1.61
Phase Assumptions
Phase: Mass Grading 10/1/2010 - 12/31/2010 - Default Fine Site Grading Description
Total Acres Disturbed: 2.25
Maximum Daily Acreage Disturbed: 0.56
Fugitive Dust Level of Detail: Low
Onsite Cut/Fill: 30.3 cubic yards/day; Offsite Cut/Fill: 106.06 cubic yards/day
On Road Truck Travel (VMT): 106.06
Off-Road Equipment:
1 Graders (174 hp) operating at a 0.61 load factor for 6 hours per day
1 Rubber Tired Dozers (357 hp) operating at a 0.59 load factor for 6 hours per day
1 Tractors/Loaders/Backhoes (108 hp) operating at a 0.55 load factor for 7 hours per day
1 Water Trucks (189 hp) operating at a 0.5 load factor for 8 hours per day
Phase: Trenching 10/1/2010 - 12/31/2010 - Type Your Description Here
Off-Road Equipment:
2 Excavators (168 hp) operating at a 0.57 load factor for 8 hours per day
1 Other General Industrial Equipment (238 hp) operating at a 0.51 load factor for 8 hours per day
1 Tractors/Loaders/Backhoes (108 hp) operating at a 0.55 load factor for 0 hours per day
Phase: Paving 4/1/2013 - 6/30/2013 - Default Paving Description
Acres to be Paved: 1.36
Off-Road Equipment:
4 Cement and Mortar Mixers (10 hp) operating at a 0.56 load factor for 6 hours per day
1 Pavers (100 hp) operating at a 0.62 load factor for 7 hours per day
1 Paving Equipment (104 hp) operating at a 0.53 load factor for 8 hours per day
1 Rollers (95 hp) operating at a 0.56 load factor for 7 hours per day
1 Tractors/Loaders/Backhoes (108 hp) operating at a 0.55 load factor for 7 hours per day

Page: 1
3/31/2010 11:28:07 AM
Phase: Building Construction 1/1/2011 - 6/30/2013 - Default Building Construction Description
Off-Road Equipment:
1 Cranes (399 hp) operating at a 0.43 load factor for 4 hours per day
2 Forklifts (145 hp) operating at a 0.3 load factor for 6 hours per day
1 Tractors/Loaders/Backhoes (108 hp) operating at a 0.55 load factor for 8 hours per day
Phase: Architectural Coating 4/1/2013 - 6/30/2013 - Default Architectural Coating Description
Rule: Residential Interior Coatings begins 1/1/2005 ends 12/31/2040 specifies a VOC of 250
Rule: Residential Exterior Coatings begins 1/1/2005 ends 12/31/2040 specifies a VOC of 250
Rule: Nonresidential Interior Coatings begins 1/1/2005 ends 12/31/2040 specifies a VOC of 250
Rule: Nonresidential Exterior Coatings begins 1/1/2005 ends 12/31/2040 specifies a VOC of 250
Construction Mitigated Detail Report:
CONSTRUCTION EMISSION ESTIMATES Annual Tons Per Year, Mitigated
ROG NOx CO SO2 PM10 Dust PM10 Exhaust PM10 PM2.5 Dust PM2.5 Exhaust PM2.5 CO2
2010 0.18 1.51 0.79 0.00 0.75 0.07 0.83 0.16 0.07 0.23 151.56
Mass Grading 10/01/2010-
12/31/2010
0.11 0.93 0.48 0.00 0.75 0.04 0.80 0.16 0.04 0.20 91.62
Mass Grading Dust 0.00 0.00 0.00 0.00 0.75 0.00 0.75 0.16 0.00 0.16 0.00
Mass Grading Off Road Diesel 0.10 0.82 0.41 0.00 0.00 0.04 0.04 0.00 0.04 0.04 74.16
Mass Grading On Road Diesel 0.01 0.10 0.03 0.00 0.00 0.00 0.00 0.00 0.00 0.00 14.09
Mass Grading Worker Trips 0.00 0.00 0.04 0.00 0.00 0.00 0.00 0.00 0.00 0.00 3.36
Trenching 10/01/2010-12/31/2010 0.07 0.59 0.31 0.00 0.00 0.03 0.03 0.00 0.03 0.03 59.95
Trenching Off Road Diesel 0.07 0.58 0.27 0.00 0.00 0.03 0.03 0.00 0.03 0.03 56.58
Trenching Worker Trips 0.00 0.00 0.04 0.00 0.00 0.00 0.00 0.00 0.00 0.00 3.36
2011 0.19 1.29 1.83 0.00 0.01 0.08 0.08 0.00 0.07 0.07 249.49
Building 01/01/2011-06/30/2013 0.19 1.29 1.83 0.00 0.01 0.08 0.08 0.00 0.07 0.07 249.49
Building Off Road Diesel 0.14 1.11 0.61 0.00 0.00 0.07 0.07 0.00 0.06 0.06 116.14
Building Vendor Trips 0.01 0.12 0.10 0.00 0.00 0.00 0.01 0.00 0.00 0.00 26.45
Building Worker Trips 0.04 0.06 1.12 0.00 0.01 0.00 0.01 0.00 0.00 0.00 106.90
2012 0.18 1.19 1.73 0.00 0.01 0.07 0.08 0.00 0.06 0.07 250.51
Building 01/01/2011-06/30/2013 0.18 1.19 1.73 0.00 0.01 0.07 0.08 0.00 0.06 0.07 250.51
Building Off Road Diesel 0.13 1.03 0.60 0.00 0.00 0.06 0.06 0.00 0.06 0.06 116.59
Building Vendor Trips 0.01 0.11 0.09 0.00 0.00 0.00 0.00 0.00 0.00 0.00 26.55

Page: 1
3/31/2010 11:28:07 AM
Building Worker Trips 0.03 0.06 1.04 0.00 0.01 0.00 0.01 0.00 0.00 0.00 107.38

Page: 1
3/31/2010 11:28:07 AM
2013 1.51 0.99 1.17 0.00 0.00 0.07 0.07 0.00 0.06 0.06 174.24
Building 01/01/2011-06/30/2013 0.08 0.54 0.81 0.00 0.00 0.03 0.03 0.00 0.03 0.03 123.85
Building Off Road Diesel 0.06 0.47 0.29 0.00 0.00 0.03 0.03 0.00 0.03 0.03 57.62
Building Vendor Trips 0.00 0.05 0.04 0.00 0.00 0.00 0.00 0.00 0.00 0.00 13.12
Building Worker Trips 0.01 0.03 0.47 0.00 0.00 0.00 0.00 0.00 0.00 0.00 53.10
Asphalt 04/01/2013-06/30/2013 0.08 0.45 0.35 0.00 0.00 0.04 0.04 0.00 0.03 0.03 48.79
Paving Off-Gas 0.00 0.00 0.00 0.00 0.00 0.00 0.00 0.00 0.00 0.00 0.00
Paving Off Road Diesel 0.07 0.44 0.29 0.00 0.00 0.04 0.04 0.00 0.03 0.03 41.34
Paving On Road Diesel 0.00 0.00 0.00 0.00 0.00 0.00 0.00 0.00 0.00 0.00 0.81
Paving Worker Trips 0.00 0.00 0.06 0.00 0.00 0.00 0.00 0.00 0.00 0.00 6.64
Coating 04/01/2013-06/30/2013 1.35 0.00 0.01 0.00 0.00 0.00 0.00 0.00 0.00 0.00 1.61
Architectural Coating 1.35 0.00 0.00 0.00 0.00 0.00 0.00 0.00 0.00 0.00 0.00
Coating Worker Trips 0.00 0.00 0.01 0.00 0.00 0.00 0.00 0.00 0.00 0.00 1.61
Construction Related Mitigation Measures
The following mitigation measures apply to Phase: Mass Grading 10/1/2010 - 12/31/2010 - Default Fine Site Grading Description
For Soil Stablizing Measures, the Water exposed surfaces 2x daily watering mitigation reduces emissions by:
PM10: 55% PM25: 55%
For Unpaved Roads Measures, the Reduce speed on unpaved roads to less than 15 mph mitigation reduces emissions by:
PM10: 44% PM25: 44%
For Unpaved Roads Measures, the Manage haul road dust 2x daily watering mitigation reduces emissions by:
PM10: 55% PM25: 55%
Area Source Unmitigated Detail Report:
AREA SOURCE EMISSION ESTIMATES Annual Tons Per Year, Unmitigated
Source ROG NOx CO SO2 PM10 PM2.5 CO2
Natural Gas 0.01 0.15 0.13 0.00 0.00 0.00 183.96
Hearth
Landscape 0.01 0.00 0.14 0.00 0.00 0.00 0.25
Consumer Products 0.00
Architectural Coatings 0.13
Area Source Changes to Defaults
0.00 0.00 0.00 184.21TOTALS (tons/year, unmitigated) 0.15 0.15 0.27

Page: 12/23/2010 01:25:11 PM
0.00 0.84 0.16 456.03TOTALS (tons/year, unmitigated) 0.52 0.49 4.63
0.00 0.84 0.16 456.03R&D Center 0.52 0.49 4.63
Operational Unmitigated Detail Report:
OPERATIONAL EMISSION ESTIMATES Annual Tons Per Year, Unmitigated
Source ROG NOX CO SO2 PM10 PM25 CO2
0.00 0.84 0.16 456.03TOTALS (tons/year, unmitigated) 0.52 0.49 4.63
SUM OF AREA SOURCE AND OPERATIONAL EMISSION ESTIMATES
ROG NOx CO SO2 PM10 PM2.5 CO2
0.00 0.84 0.16 456.03TOTALS (tons/year, unmitigated) 0.52 0.49 4.63
ROG NOx CO SO2 PM10 PM2.5 CO2
OPERATIONAL (VEHICLE) EMISSION ESTIMATES
Project Location: Bay Area Air District
On-Road Vehicle Emissions Based on: Version : Emfac2007 V2.3 Nov 1 2006
Off-Road Vehicle Emissions Based on: OFFROAD2007
Summary Report:
Urbemis 2007 Version 9.2.4
Combined Annual Emissions Reports (Tons/Year)
File Name: Z:\Alan Sako\924.06 CRT\Emissions\CRT Proposed Action - Operational.urb924
Project Name: CRT Proposed Action - Operations

Page: 12/23/2010 01:25:11 PM
16.7Motor Home 0.6 0.0 83.3
0.0
School Bus 0.1 0.0 0.0 100.0
Motorcycle 3.2 56.2 43.8
100.0
Urban Bus 0.1 0.0 0.0 100.0
Other Bus 0.1 0.0 0.0
80.0
Heavy-Heavy Truck 33,001-60,000 lbs 0.4 0.0 0.0 100.0
Med-Heavy Truck 14,001-33,000 lbs 1.0 0.0 20.0
22.2
Lite-Heavy Truck 10,001-14,000 lbs 0.6 0.0 50.0 50.0
Lite-Heavy Truck 8501-10,000 lbs 0.9 0.0 77.8
0.0
Med Truck 5751-8500 lbs 6.6 0.0 100.0 0.0
Light Truck 3751-5750 lbs 19.9 0.5 99.5
0.2
Light Truck < 3750 lbs 12.8 0.8 96.9 2.3
Light Auto 53.7 0.6 99.2
Vehicle Fleet Mix
Vehicle Type Percent Type Non-Catalyst Catalyst Diesel
135.00 373.95 2,677.95
373.95 2,677.95
R&D Center 2.77 unknown
Emfac: Version : Emfac2007 V2.3 Nov 1 2006
Summary of Land Uses
Land Use Type Acreage Trip Rate Unit Type No. Units Total Trips Total VMT
Operational Settings:
Includes correction for passby trips
Does not include double counting adjustment for internal trips
Analysis Year: 2013 Season: Annual

Page: 12/23/2010 01:25:11 PM
R&D Center 50.0 25.0 25.0
% of Trips - Commercial (by land use)
% of Trips - Residential 32.9 18.0 49.1
14.7 6.6 6.6
Trip speeds (mph) 35.0 35.0 35.0 35.0 35.0 35.0
Rural Trip Length (miles) 16.8 7.1 7.9
Commute Non-Work Customer
Urban Trip Length (miles) 10.8 7.3 7.5 9.5 7.4 7.4
Home-Work Home-Shop Home-Other
Travel Conditions
Residential Commercial

Computational Research and Theory Facility
Stationary Source Emissions
Proposed Action & Alternatives 1-4
Table STA-1
Summary of Stationary Source Emissions
Equipment Criteria Pollutants Greenhouse Gases
(pounds per day) (metric tons per year)
Emission Source ROG NOX CO SO2 PM10 PM2.5 CO2 CO2e
New Boiler 0.12 0.78 1.78 0.01 0.16 0.16 418.33 419.40
New Cooling Towers — — — — 2.36 2.36 — —
750 kW Generator 0.07 11.80 0.53 0.01 0.05 0.05 26.24 26.50
600 kW Generator 0.05 9.44 0.43 0.01 0.04 0.04 21.00 21.21
Total New Stationary Sources 0.18 12.58 2.31 0.02 2.57 2.57 465.56 467.11
(tons per year)
New Boiler 0.02 0.14 0.32 0.00 0.03 0.03
New Cooling Towers — — — — 0.05 0.05
750 kW Generator 0.00 0.29 0.01 0.00 0.00 0.00
600 kW Generator 0.00 0.24 0.01 0.00 0.00 0.00
Total New Stationary Sources 0.02 0.67 0.35 0.00 0.08 0.08

Computational Research and Theory Facility
Boilers
Proposed Action & Alternatives 1-4
Boilers
Nominal Rating per Boiler: 0.9 MMBtu/hr
Number of New Boilers: 1
Operational hours: 24 hr/day
8,760 hr/yr
Capacity Factor: 100%
Standard Temp 60 deg F
Molar Volume 379.70 scf/mole
Heat Content of Natural Gas 1,020 Btu/scf
Table STA-2
Boiler Emissions
Units Criteria Pollutants Greenhouse Gases
ROG NOX CO SOX PM10 PM2.5 CO2 CH4 N2O CO2e
ppm @ 3% O2 30.00
lbs/MMBtu 0.0054 0.0360 0.0824 0.0006 0.0075 0.0075 116.98 0.0110 0.0002 117.28
lbs/hr 0.00 0.03 0.07 0.00 0.01 0.01 105.28 0.01 0.00 105.55
lbs/day 0.12 0.78 1.78 0.01 0.16 0.16 2,526.71 0.24 0.00 4,906.07
lbs/yr 42.51 283.82 649.27 4.64 58.74 58.74 922,248.79 86.91 1.74 924,612.63
tons/yr 0.02 0.14 0.32 0.00 0.03 0.03 461.12 0.04 0.00 462.31
metric tons/yr 418.33 0.04 0.00 419.40
Notes:
1.
2.
3.
4.
5. Emissions of CO2e assumes the following global warming potentials: CO2 = 1, CH4 = 21, N2O = 310.
Emission Factors for ROG, CO, PM10, and SOX: U.S. Environmental Protection Agency, AP-42 Compilation of Air Pollutant Emission Factors , Chapter 1.4, Table 1.4-1 and 1.4-
2.
Emission factor for PM2.5 assumes all PM is less than 1 micron in diameter.
Concentration limit for NOX: Lochinvar Manufacturer Specifications.
Emission factors for CO2, CH4, and N2O: California Climate Action Registry, General Reporting Protocol , Version 3.1, (2009) 101, 103.

Computational Research and Theory Facility
Cooling Towers
Proposed Action & Alternatives 1-4
Cooling Towers Daily Emissions Cooling Towers Annual Emissions
High Flow Rate: 1,465 Gallons per Minute Standard Flow Rate: 735 Gallons per Minute
Maximum Drift: 0.005% Percent Maximum Drift: 0.005% Percent
Water Density: 8.34 Pounds per gallon Water Density: 8.34 Pounds per gallon
Number of Units: 5 Cooling Towers Operating Hours: 24 hr/day
Operating Hours: 24 hr/day 90 day/yr
Table STA-3
Cooling Tower Emissions
Untis PM10 PM2.5 ROG Units PM10 PM2.5 ROG
TDS ppm 536 536 — TDS ppm 536 536 —
lbs/hr 0.10 0.10 — lbs/yr 106.45 106.45 —
lbs/day 2.36 2.36 — tons/yr 0.05 0.05 —
Notes:
1.
2.
Total dissolved solids (TDS) is based on a maximum electrical conductivity of 800 micromhos per centimeter, which is a TDS of
approximately 536 ppm.
Cooling towers are assumed to operate up to 90 days per year.

Computational Research and Theory Facility
Emergency Generators
Proposed Action & Alternatives 1-4
Standby Emergency Generator
Rating: 750 kW
1,006 HP
Number of Units: 1
Operating Hours per Unit: 1 hours/day
50 hours/year
Table STA-4
Standby Emergency Generator Emissions
Units Criteria Pollutants Greenhouse Gases
ROG NOX CO SOX PM10 PM2.5 CO2 CO2e
g/HP-hr 0.03 5.32 0.24 0.0055 0.022 0.022 521.64 526.91
lbs/hr 0.07 11.80 0.53 0.01 0.05 0.05 1,156.92 1,168.61
lbs/day 0.07 11.80 0.53 0.01 0.05 0.05 1,156.92 1,168.61
lbs/yr 3.33 589.95 26.61 0.61 2.44 2.44 57,845.97 58,430.27
tons/yr 0.00 0.29 0.01 0.00 0.00 0.00 28.92 29.22
metric tons/yr — — — — — — 26.24 26.50
Notes:
1.
2.
3.
4. Emissions of CO2e assume 99% of the greenhouse emissions occur as CO2. This is consistent with off-road diesel engines.
Emission factors for all pollutants (except SOX and CO2): Caterpillar C27 ATAAC Standby Diesel Generator Set 750 ekW 938 kVA (U.S. EPA Tier 2
emission standards). All particulate matter is assumed to be PM2.5.
Emission factor for SOX: U.S. Environmental Protection Agency, AP-42 Compilation of Air Pollutant Emission Factors , Fifth Edition, Section 3.4, Table 3.4-
1. Emission Factor for SOX is based on 15 ppm (0.0015%) S1 and assumes complete conversion to SO2.
Emission factor for CO2: U.S. Environmental Protection Agency, AP-42 Compilation of Air Pollutant Emission Factors , Fifth Edition, Section 3.3, Table
3.3-1.

Computational Research and Theory Facility
Emergency Generators
Proposed Action & Alternatives 1-4
Standby Emergency Generator
Rating: 600 kW
805 HP
Number of Units: 1
Operating Hours per Unit: 1 hours/day
50 hours/year
Table STA-4
Standby Emergency Generator Emissions
Units Criteria Pollutants Greenhouse Gases
ROG NOX CO SOX PM10 PM2.5 CO2 CO2e
g/HP-hr 0.03 5.32 0.24 0.0055 0.022 0.022 521.64 526.91
lbs/hr 0.05 9.44 0.43 0.01 0.04 0.04 925.77 935.12
lbs/day 0.05 9.44 0.43 0.01 0.04 0.04 925.77 935.12
lbs/yr 2.66 472.08 21.30 0.49 1.95 1.95 46,288.28 46,755.83
tons/yr 0.00 0.24 0.01 0.00 0.00 0.00 23.14 23.38
metric tons/yr — — — — — — 21.00 21.21
Notes:
1.
2.
3.
4. Emissions of CO2e assume 99% of the greenhouse emissions occur as CO2. This is consistent with off-road diesel engines.
Emission factors for all pollutants (except SOX and CO2): Caterpillar C27 ATAAC Standby Diesel Generator Set 750 ekW 938 kVA (U.S. EPA Tier 2
emission standards). All particulate matter is assumed to be PM2.5.
Emission factor for SOX: U.S. Environmental Protection Agency, AP-42 Compilation of Air Pollutant Emission Factors , Fifth Edition, Section 3.4, Table 3.4-
1. Emission Factor for SOX is based on 15 ppm (0.0015%) S1 and assumes complete conversion to SO2.
Emission factor for CO2: U.S. Environmental Protection Agency, AP-42 Compilation of Air Pollutant Emission Factors , Fifth Edition, Section 3.3, Table
3.3-1.

Computational Research and Theory FacilityAERMOD - Model Emission Rate Inputs
BAAQMD PM2.5 Modeling
Table AER-1AERMOD Source Characteristics
Emission Source Source Release Length Initial Vertical Exit Inside Exit FlowType Height of Side Vertical Dimention Temperature Diameter Rate
(m) (m) (m) (m) (F) (ft) (ft3/s)Construction Off-Road Volume 3.00 20.00 1.40 Construction On-Road Line 24.00 6.00 Operation Area Area 0 1.00 Operation Boiler Point 16.00 949.80 0.67 93.93 Operation Cooling Tower Point 16.00 -10 7.50 1,428.67 Operation Emergency Generator Point 16.00 949.80 0.67 93.93

Computational Research and Theory FacilityAERMOD - Model Emission Rate Inputs
BAAQMD PM2.5 Modeling
Table AER-2Calculated AERMOD Source Emission Rates - Proposed Action
Emissions Model Source Source Number Time Time Averaging Modeled Emission RateSource Source ID Type of Slice Slice Period
Group Sources Begin End (hours/day) (lbs/day) (g/s)Proposed Action
Construction (2010)Grading/Trenching Off-Road CONS1 VOL01-15 Volume 15 10/1/2010 12/31/2010 8 1.96 2.06E-03Grading/Trenching On-Road CONS1 LIN01 Line 1 10/1/2010 12/31/2010 8 0.10 1.58E-03
Construction (2011)Building Off-Road CONS2 VOL16-30 Volume 15 1/1/2011 12/31/2011 8 0.50 5.25E-04Building On-Road CONS2 LIN02 Line 1 1/1/2011 12/31/2011 8 0.03 4.73E-04
OperationArea OPER ARE01 Area 1 24 0.01 5.25E-05Boiler OPER PNT01 Point 1 24 0.16 8.40E-04Cooling Tower 1 OPER PNT02 Point 1 24 0.06 3.06E-04Cooling Tower 2 OPER PNT03 Point 1 24 0.06 3.06E-04Cooling Tower 3 OPER PNT04 Point 1 24 0.06 3.06E-04Cooling Tower 4 OPER PNT05 Point 1 24 0.06 3.06E-04Cooling Tower 5 OPER PNT06 Point 1 24 0.06 3.06E-04Emergency Generator 1 OPER PNT07 Point 1 24 0.01 3.51E-05Emergency Generator 2 OPER PNT08 Point 1 24 0.01 2.80E-05
Note: Cooling tower and emergency generator emission rates were calculated based on the estimated annual emissions.
PM2.5 (DPM)

Computational Research and Theory FacilityEvaluation of Health Impacts from Off-Road Construction Equipment and On-Road Haul/Vendor Trucks
Table HRA-1Maximum Individual Cancer Risk (MICR) at Maximally Exposed Individual (MEI)
Model Run Pollutant CPF CAIR,ANN DBR A EF ED AT MICR Threshold Over?
Construction (2010) DPM 1.10E+00 2.17E-02 302 1 350 9 25550 0.9 10 NOConstruction (2011) DPM 1.10E+00 1.79E-02 302 1 350 9 25550 0.7 10 NO
Exposure factors used to calculate cancer risk:CPF Cancer Potency Factor (mg/kg-day)-1.CAIR,ANN Modeled annual concentration (µg/m3).DBR Daily breathing rate (L/kg (body weight) per day).
A Inhalation absorption factor (default = 1).EF Exposure frequency (days/year).ED Exposure duration (years).AT Average time period over which exposure is averaged in days (days).Mult Factor Multiplying Factor = CPF × (DBR × A × EF × ED × 10-6 / AT) × 106.
Mult Factor
40.96
DBR Sources: 1. California Air Resources Board and Office of Environmental Health Hazard Assessment, Recommended Interim Risk Management Policy for Inhalation-Based Residential Cancer Risk , (2003).2. California Environmental Protection Agency, Office of Environmental Health Hazard Assessment, Air Toxics Hot Spots Program Guidance Manual for Preparation of Health Risk Assessments , (2003).
40.96

Computational Research and Theory FacilityEvaluation of Health Impacts from Off-Road Construction Equipment and On-Road Haul/Vendor Trucks
Table HRA-2Non-carcinogenic (Chronic) Hazards / Toxicological Endpoints*
Model Run Pollutant CREL CAIR,ANN HI RESP CNS/PNS CV/BL IMMUN KIDN GI/LV REPRO EYES Threshold Over?
Construction (2010) DPM 5.00E+00 2.17E-02 4.33E-03 4.33E-03 - - - - - - - 1 NOConstruction (2011) DPM 5.00E+00 1.79E-02 3.57E-03 3.57E-03 - - - - - - - 1 NO
Where:CREL Chronic Reference Exposure LevelHI Hazard Index
* Key to Toxicological EndpointsRESP Respiratory System.CNS/PNS Central/Peripheral Nervous System.CV/BL Cardiovascular/Blood System.IMMUN Immune System.KIDN Kidney.GI/LV Gastrointestinal System/Liver.REPRO Reproductive System.EYES Eye irritation and/or other effects.

Construction (2010) * AERMOD (07026): C:\ISC-AERMOD\924.06\MODEL021710\PM25\PM25.ISC * MODELING OPTIONS USED: * CONC DFAULT ELEV * PLOT FILE OF ANNUAL VALUES FOR SOURCE GROUP: CONS1 * FOR A TOTAL OF 2837 RECEPTORS. * FORMAT: (3(1X,F13.5),3(1X,F8.2),2X,A6,2X,A8,2X,I8.8,2X,A8) * X Y AVERAGE CONC ZELEV ZHILL ZFLAG AVE GRP NUM YRS NET ID * ____________ ____________ ____________ ______ ______ ______ ______ ________ ________ ________ 567211.06250 4192470.25000 0.00046 339.14 532.00 0.00 ANNUAL CONS1 00000002 567198.18750 4192424.00000 0.00049 331.20 532.00 0.00 ANNUAL CONS1 00000002 567185.25000 4192377.50000 0.00053 310.33 532.00 0.00 ANNUAL CONS1 00000002 567172.37500 4192331.00000 0.00060 279.08 532.00 0.00 ANNUAL CONS1 00000002 567114.31250 4192290.50000 0.00069 262.53 532.00 0.00 ANNUAL CONS1 00000002 567069.18750 4192296.50000 0.00072 267.23 532.00 0.00 ANNUAL CONS1 00000002 566989.43750 4192335.75000 0.00085 248.74 532.00 0.00 ANNUAL CONS1 00000002 566954.81250 4192368.75000 0.00088 246.74 532.00 0.00 ANNUAL CONS1 00000002 566879.62500 4192376.25000 0.00096 250.61 532.00 0.00 ANNUAL CONS1 00000002 566839.00000 4192350.75000 0.00107 246.63 532.00 0.00 ANNUAL CONS1 00000002 566784.81250 4192284.50000 0.00123 247.42 532.00 0.00 ANNUAL CONS1 00000002 566771.25000 4192244.00000 0.00130 241.98 532.00 0.00 ANNUAL CONS1 00000002 566787.06250 4192171.75000 0.00124 220.99 532.00 0.00 ANNUAL CONS1 00000002 566850.25000 4192083.75000 0.00103 208.97 532.00 0.00 ANNUAL CONS1 00000002 566802.87500 4192016.75000 0.00100 198.83 532.00 0.00 ANNUAL CONS1 00000002 566762.25000 4191997.25000 0.00101 197.25 532.00 0.00 ANNUAL CONS1 00000002 566686.75000 4192003.50000 0.00113 206.29 532.00 0.00 ANNUAL CONS1 00000002 566651.93750 4192029.50000 0.00127 212.43 532.00 0.00 ANNUAL CONS1 00000002 566621.93750 4192100.00000 0.00155 222.80 532.00 0.00 ANNUAL CONS1 00000002 566586.18750 4192156.75000 0.00180 215.49 532.00 0.00 ANNUAL CONS1 00000002 566545.56250 4192168.75000 0.00200 213.09 532.00 0.00 ANNUAL CONS1 00000002 566457.56250 4192176.25000 0.00249 208.60 532.00 0.00 ANNUAL CONS1 00000002 566410.18750 4192171.75000 0.00282 220.42 532.00 0.00 ANNUAL CONS1 00000002 566362.75000 4192167.25000 0.00322 232.53 532.00 0.00 ANNUAL CONS1 00000002 566317.62500 4192131.00000 0.00313 213.02 532.00 0.00 ANNUAL CONS1 00000002 566277.00000 4192124.25000 0.00332 208.19 532.00 0.00 ANNUAL CONS1 00000002 566222.81250 4192140.25000 0.00422 232.89 532.00 0.00 ANNUAL CONS1 00000002 566136.56250 4192134.50000 0.00489 222.40 532.00 0.00 ANNUAL CONS1 00000002 566064.06250 4192169.25000 0.00626 255.51 532.00 0.00 ANNUAL CONS1 00000002 565997.25000 4192185.75000 0.00797 256.40 532.00 0.00 ANNUAL CONS1 00000002 565955.00000 4192180.00000 0.00959 243.37 532.00 0.00 ANNUAL CONS1 00000002 565867.25000 4192155.25000 0.00931 207.62 532.00 0.00 ANNUAL CONS1 00000002 565806.12500 4192195.00000 0.01353 186.77 532.00 0.00 ANNUAL CONS1 00000002 565772.56250 4192223.25000 0.01850 185.50 532.00 0.00 ANNUAL CONS1 00000002 565739.00000 4192251.25000 0.02167 194.37 532.00 0.00 ANNUAL CONS1 00000002 565705.50000 4192279.25000 0.02020 191.57 532.00 0.00 ANNUAL CONS1 00000002 565671.93750 4192307.25000 0.01614 190.44 532.00 0.00 ANNUAL CONS1 00000002 565638.37500 4192335.25000 0.01184 180.83 532.00 0.00 ANNUAL CONS1 00000002 565600.12500 4192407.50000 0.00797 187.46 532.00 0.00 ANNUAL CONS1 00000002 565595.50000 4192451.75000 0.00687 183.26 532.00 0.00 ANNUAL CONS1 00000002 565590.81250 4192496.00000 0.00562 166.91 532.00 0.00 ANNUAL CONS1 00000002 565586.18750 4192540.50000 0.00486 180.32 532.00 0.00 ANNUAL CONS1 00000002 565581.50000 4192584.75000 0.00450 205.65 532.00 0.00 ANNUAL CONS1 00000002 565615.62500 4192654.75000 0.00427 231.76 532.00 0.00 ANNUAL CONS1 00000002 565649.37500 4192723.50000 0.00333 244.97 532.00 0.00 ANNUAL CONS1 00000002 565644.37500 4192766.25000 0.00232 257.98 532.00 0.00 ANNUAL CONS1 00000002 565639.31250 4192809.25000 0.00191 258.79 532.00 0.00 ANNUAL CONS1 00000002 565634.31250 4192852.25000 0.00145 269.05 532.00 0.00 ANNUAL CONS1 00000002 565914.75000 4192891.25000 0.00070 305.87 532.00 0.00 ANNUAL CONS1 00000002 565983.25000 4192793.50000 0.00089 300.92 532.00 0.00 ANNUAL CONS1 00000002 566097.37500 4192816.25000 0.00064 316.63 532.00 0.00 ANNUAL CONS1 00000002 566123.50000 4192705.50000 0.00103 302.96 532.00 0.00 ANNUAL CONS1 00000002 566192.00000 4192650.00000 0.00112 332.16 532.00 0.00 ANNUAL CONS1 00000002 566257.18750 4192653.25000 0.00098 344.65 532.00 0.00 ANNUAL CONS1 00000002 566335.50000 4192565.25000 0.00128 318.13 532.00 0.00 ANNUAL CONS1 00000002 566397.43750 4192552.25000 0.00125 302.59 532.00 0.00 ANNUAL CONS1 00000002 566446.37500 4192659.75000 0.00071 354.75 532.00 0.00 ANNUAL CONS1 00000002 566557.25000 4192578.25000 0.00082 334.92 532.00 0.00 ANNUAL CONS1 00000002 566850.75000 4192813.00000 0.00031 368.12 532.00 0.00 ANNUAL CONS1 00000002 567006.00000 4192636.75000 0.00045 315.00 532.00 0.00 ANNUAL CONS1 00000002 567132.37500 4192659.25000 0.00037 348.92 532.00 0.00 ANNUAL CONS1 00000002 567249.75000 4192609.50000 0.00037 357.00 532.00 0.00 ANNUAL CONS1 00000002 567159.50000 4192284.50000 0.00068 254.71 532.00 0.00 ANNUAL CONS1 00000002 567024.06250 4192302.75000 0.00081 251.87 532.00 0.00 ANNUAL CONS1 00000002 566920.25000 4192402.00000 0.00088 251.46 532.00 0.00 ANNUAL CONS1 00000002 566798.37500 4192325.25000 0.00116 249.96 532.00 0.00 ANNUAL CONS1 00000002

Construction (2011) * AERMOD (07026): C:\ISC-AERMOD\924.06\MODEL021710\PM25\PM25.ISC * MODELING OPTIONS USED: * CONC DFAULT ELEV * PLOT FILE OF ANNUAL VALUES FOR SOURCE GROUP: CONS2 * FOR A TOTAL OF 2837 RECEPTORS. * FORMAT: (3(1X,F13.5),3(1X,F8.2),2X,A6,2X,A8,2X,I8.8,2X,A8) * X Y AVERAGE CONC ZELEV ZHILL ZFLAG AVE GRP NUM YRS NET ID * ____________ ____________ ____________ ______ ______ ______ ______ ________ ________ ________ 567223.93750 4192516.75000 0.00040 350.38 532.00 0.00 ANNUAL CONS2 00000002 567211.06250 4192470.25000 0.00042 339.14 532.00 0.00 ANNUAL CONS2 00000002 567198.18750 4192424.00000 0.00044 331.20 532.00 0.00 ANNUAL CONS2 00000002 567185.25000 4192377.50000 0.00047 310.33 532.00 0.00 ANNUAL CONS2 00000002 567172.37500 4192331.00000 0.00051 279.08 532.00 0.00 ANNUAL CONS2 00000002 567114.31250 4192290.50000 0.00057 262.53 532.00 0.00 ANNUAL CONS2 00000002 567069.18750 4192296.50000 0.00060 267.23 532.00 0.00 ANNUAL CONS2 00000002 566989.43750 4192335.75000 0.00071 248.74 532.00 0.00 ANNUAL CONS2 00000002 566954.81250 4192368.75000 0.00074 246.74 532.00 0.00 ANNUAL CONS2 00000002 566879.62500 4192376.25000 0.00082 250.61 532.00 0.00 ANNUAL CONS2 00000002 566839.00000 4192350.75000 0.00091 246.63 532.00 0.00 ANNUAL CONS2 00000002 566784.81250 4192284.50000 0.00103 247.42 532.00 0.00 ANNUAL CONS2 00000002 566771.25000 4192244.00000 0.00108 241.98 532.00 0.00 ANNUAL CONS2 00000002 566787.06250 4192171.75000 0.00105 220.99 532.00 0.00 ANNUAL CONS2 00000002 566850.25000 4192083.75000 0.00087 208.97 532.00 0.00 ANNUAL CONS2 00000002 566802.87500 4192016.75000 0.00084 198.83 532.00 0.00 ANNUAL CONS2 00000002 566762.25000 4191997.25000 0.00085 197.25 532.00 0.00 ANNUAL CONS2 00000002 566686.75000 4192003.50000 0.00095 206.29 532.00 0.00 ANNUAL CONS2 00000002 566651.93750 4192029.50000 0.00106 212.43 532.00 0.00 ANNUAL CONS2 00000002 566621.93750 4192100.00000 0.00131 222.80 532.00 0.00 ANNUAL CONS2 00000002 566586.18750 4192156.75000 0.00154 215.49 532.00 0.00 ANNUAL CONS2 00000002 566545.56250 4192168.75000 0.00172 213.09 532.00 0.00 ANNUAL CONS2 00000002 566457.56250 4192176.25000 0.00217 208.60 532.00 0.00 ANNUAL CONS2 00000002 566410.18750 4192171.75000 0.00244 220.42 532.00 0.00 ANNUAL CONS2 00000002 566362.75000 4192167.25000 0.00275 232.53 532.00 0.00 ANNUAL CONS2 00000002 566317.62500 4192131.00000 0.00271 213.02 532.00 0.00 ANNUAL CONS2 00000002 566277.00000 4192124.25000 0.00288 208.19 532.00 0.00 ANNUAL CONS2 00000002 566222.81250 4192140.25000 0.00357 232.89 532.00 0.00 ANNUAL CONS2 00000002 566136.56250 4192134.50000 0.00420 222.40 532.00 0.00 ANNUAL CONS2 00000002 566064.06250 4192169.25000 0.00535 255.51 532.00 0.00 ANNUAL CONS2 00000002 565997.25000 4192185.75000 0.00690 256.40 532.00 0.00 ANNUAL CONS2 00000002 565955.00000 4192180.00000 0.00774 243.37 532.00 0.00 ANNUAL CONS2 00000002 565867.25000 4192155.25000 0.00705 207.62 532.00 0.00 ANNUAL CONS2 00000002 565806.12500 4192195.00000 0.01067 186.77 532.00 0.00 ANNUAL CONS2 00000002 565772.56250 4192223.25000 0.01516 185.50 532.00 0.00 ANNUAL CONS2 00000002 565739.00000 4192251.25000 0.01787 194.37 532.00 0.00 ANNUAL CONS2 00000002 565705.50000 4192279.25000 0.01631 191.57 532.00 0.00 ANNUAL CONS2 00000002 565671.93750 4192307.25000 0.01271 190.44 532.00 0.00 ANNUAL CONS2 00000002 565638.37500 4192335.25000 0.00919 180.83 532.00 0.00 ANNUAL CONS2 00000002 565600.12500 4192407.50000 0.00646 187.46 532.00 0.00 ANNUAL CONS2 00000002 565595.50000 4192451.75000 0.00577 183.26 532.00 0.00 ANNUAL CONS2 00000002 565590.81250 4192496.00000 0.00487 166.91 532.00 0.00 ANNUAL CONS2 00000002 565586.18750 4192540.50000 0.00432 180.32 532.00 0.00 ANNUAL CONS2 00000002 565581.50000 4192584.75000 0.00413 205.65 532.00 0.00 ANNUAL CONS2 00000002 565615.62500 4192654.75000 0.00401 231.76 532.00 0.00 ANNUAL CONS2 00000002 565649.37500 4192723.50000 0.00314 244.97 532.00 0.00 ANNUAL CONS2 00000002 565644.37500 4192766.25000 0.00231 257.98 532.00 0.00 ANNUAL CONS2 00000002 565639.31250 4192809.25000 0.00190 258.79 532.00 0.00 ANNUAL CONS2 00000002 565634.31250 4192852.25000 0.00150 269.05 532.00 0.00 ANNUAL CONS2 00000002 565914.75000 4192891.25000 0.00098 305.87 532.00 0.00 ANNUAL CONS2 00000002 565983.25000 4192793.50000 0.00119 300.92 532.00 0.00 ANNUAL CONS2 00000002 566097.37500 4192816.25000 0.00082 316.63 532.00 0.00 ANNUAL CONS2 00000002 566123.50000 4192705.50000 0.00125 302.96 532.00 0.00 ANNUAL CONS2 00000002 566192.00000 4192650.00000 0.00135 332.16 532.00 0.00 ANNUAL CONS2 00000002 566257.18750 4192653.25000 0.00118 344.65 532.00 0.00 ANNUAL CONS2 00000002 566335.50000 4192565.25000 0.00154 318.13 532.00 0.00 ANNUAL CONS2 00000002 566397.43750 4192552.25000 0.00146 302.59 532.00 0.00 ANNUAL CONS2 00000002 566446.37500 4192659.75000 0.00086 354.75 532.00 0.00 ANNUAL CONS2 00000002 566557.25000 4192578.25000 0.00093 334.92 532.00 0.00 ANNUAL CONS2 00000002 566850.75000 4192813.00000 0.00038 368.12 532.00 0.00 ANNUAL CONS2 00000002 567006.00000 4192636.75000 0.00046 315.00 532.00 0.00 ANNUAL CONS2 00000002 567132.37500 4192659.25000 0.00038 348.92 532.00 0.00 ANNUAL CONS2 00000002 567249.75000 4192609.50000 0.00036 357.00 532.00 0.00 ANNUAL CONS2 00000002 567159.50000 4192284.50000 0.00055 254.71 532.00 0.00 ANNUAL CONS2 00000002 567024.06250 4192302.75000 0.00067 251.87 532.00 0.00 ANNUAL CONS2 00000002 566920.25000 4192402.00000 0.00075 251.46 532.00 0.00 ANNUAL CONS2 00000002

Operational * AERMOD (07026): C:\ISC-AERMOD\924.06\MODEL021710\PM25\PM25.ISC * MODELING OPTIONS USED: * CONC DFAULT ELEV * PLOT FILE OF ANNUAL VALUES FOR SOURCE GROUP: ALL * FOR A TOTAL OF 1959 RECEPTORS. * FORMAT: (3(1X,F13.5),3(1X,F8.2),2X,A6,2X,A8,2X,I8.8,2X,A8) * X Y AVERAGE CONC ZELEV ZHILL ZFLAG AVE GRP NUM YRS NET ID * ____________ ____________ ____________ ______ ______ ______ ______ ________ ________ ________ 566787.06250 4192171.75000 0.00172 220.99 532.00 0.00 ANNUAL ALL 00000002 566850.25000 4192083.75000 0.00144 208.97 532.00 0.00 ANNUAL ALL 00000002 566802.87500 4192016.75000 0.00150 198.83 532.00 0.00 ANNUAL ALL 00000002 566762.25000 4191997.25000 0.00158 197.25 532.00 0.00 ANNUAL ALL 00000002 566686.75000 4192003.50000 0.00182 206.29 532.00 0.00 ANNUAL ALL 00000002 566651.93750 4192029.50000 0.00201 212.43 532.00 0.00 ANNUAL ALL 00000002 566621.93750 4192100.00000 0.00231 222.80 532.00 0.00 ANNUAL ALL 00000002 566586.18750 4192156.75000 0.00239 215.49 532.00 0.00 ANNUAL ALL 00000002 566545.56250 4192168.75000 0.00258 213.09 532.00 0.00 ANNUAL ALL 00000002 566457.56250 4192176.25000 0.00309 208.60 532.00 0.00 ANNUAL ALL 00000002 566410.18750 4192171.75000 0.00368 220.42 532.00 0.00 ANNUAL ALL 00000002 566362.75000 4192167.25000 0.00445 232.53 532.00 0.00 ANNUAL ALL 00000002 566317.62500 4192131.00000 0.00416 213.02 532.00 0.00 ANNUAL ALL 00000002 566277.00000 4192124.25000 0.00435 208.19 532.00 0.00 ANNUAL ALL 00000002 566222.81250 4192140.25000 0.00596 232.89 532.00 0.00 ANNUAL ALL 00000002 566136.56250 4192134.50000 0.00637 222.40 532.00 0.00 ANNUAL ALL 00000002 566064.06250 4192169.25000 0.00832 255.50 532.00 0.00 ANNUAL ALL 00000002 565997.25000 4192185.75000 0.01016 256.40 532.00 0.00 ANNUAL ALL 00000002 565955.00000 4192180.00000 0.01242 243.37 532.00 0.00 ANNUAL ALL 00000002 565867.25000 4192155.25000 0.00979 207.62 532.00 0.00 ANNUAL ALL 00000002 565806.12500 4192195.00000 0.00726 186.77 532.00 0.00 ANNUAL ALL 00000002 565772.56250 4192223.25000 0.00567 185.50 532.00 0.00 ANNUAL ALL 00000002 565739.00000 4192251.25000 0.00442 194.37 532.00 0.00 ANNUAL ALL 00000002 565705.50000 4192279.25000 0.00460 191.57 532.00 0.00 ANNUAL ALL 00000002 565671.93750 4192307.25000 0.00622 190.44 532.00 0.00 ANNUAL ALL 00000002 565638.37500 4192335.25000 0.00786 180.83 532.00 0.00 ANNUAL ALL 00000002 565600.12500 4192407.50000 0.01293 187.46 532.00 0.00 ANNUAL ALL 00000002 565595.50000 4192451.75000 0.01565 183.26 532.00 0.00 ANNUAL ALL 00000002 565590.81250 4192496.00000 0.01574 166.91 532.00 0.00 ANNUAL ALL 00000002 565586.18750 4192540.50000 0.01360 180.32 532.00 0.00 ANNUAL ALL 00000002 565581.50000 4192584.75000 0.01147 205.65 532.00 0.00 ANNUAL ALL 00000002 565615.62500 4192654.75000 0.00900 231.76 532.00 0.00 ANNUAL ALL 00000002 565649.37500 4192723.50000 0.00533 244.97 532.00 0.00 ANNUAL ALL 00000002 565644.37500 4192766.25000 0.00413 257.98 532.00 0.00 ANNUAL ALL 00000002 565639.31250 4192809.25000 0.00346 258.79 532.00 0.00 ANNUAL ALL 00000002 565634.31250 4192852.25000 0.00316 269.05 532.00 0.00 ANNUAL ALL 00000002 565914.75000 4192891.25000 0.00165 305.87 532.00 0.00 ANNUAL ALL 00000002 565983.25000 4192793.50000 0.00198 300.92 532.00 0.00 ANNUAL ALL 00000002 566097.37500 4192816.25000 0.00138 316.63 532.00 0.00 ANNUAL ALL 00000002 566123.50000 4192705.50000 0.00206 302.96 532.00 0.00 ANNUAL ALL 00000002 566192.00000 4192650.00000 0.00186 332.16 532.00 0.00 ANNUAL ALL 00000002 566257.18750 4192653.25000 0.00164 344.65 532.00 0.00 ANNUAL ALL 00000002 566335.50000 4192565.25000 0.00231 318.13 532.00 0.00 ANNUAL ALL 00000002 566397.43750 4192552.25000 0.00241 302.59 532.00 0.00 ANNUAL ALL 00000002 566446.37500 4192659.75000 0.00127 354.75 532.00 0.00 ANNUAL ALL 00000002 566557.25000 4192578.25000 0.00139 334.92 532.00 0.00 ANNUAL ALL 00000002 566850.75000 4192813.00000 0.00058 368.12 532.00 0.00 ANNUAL ALL 00000002 567006.00000 4192636.75000 0.00077 315.00 532.00 0.00 ANNUAL ALL 00000002 567132.37500 4192659.25000 0.00052 348.92 532.00 0.00 ANNUAL ALL 00000002 567249.75000 4192609.50000 0.00046 357.00 532.00 0.00 ANNUAL ALL 00000002 567159.50000 4192284.50000 0.00108 254.71 532.00 0.00 ANNUAL ALL 00000002 567024.06250 4192302.75000 0.00128 251.87 532.00 0.00 ANNUAL ALL 00000002 566920.25000 4192402.00000 0.00146 251.46 532.00 0.00 ANNUAL ALL 00000002 566798.37500 4192325.25000 0.00180 249.96 532.00 0.00 ANNUAL ALL 00000002 566757.75000 4192203.25000 0.00196 233.57 532.00 0.00 ANNUAL ALL 00000002 566816.43750 4192140.25000 0.00153 209.15 532.00 0.00 ANNUAL ALL 00000002 566857.06250 4192131.00000 0.00143 208.30 532.00 0.00 ANNUAL ALL 00000002 566843.50000 4192036.25000 0.00143 206.01 532.00 0.00 ANNUAL ALL 00000002 566721.62500 4191977.75000 0.00164 190.85 532.00 0.00 ANNUAL ALL 00000002 566617.12500 4192055.50000 0.00220 214.74 532.00 0.00 ANNUAL ALL 00000002 566626.81250 4192144.75000 0.00237 227.10 532.00 0.00 ANNUAL ALL 00000002 566504.93750 4192180.75000 0.00283 211.80 532.00 0.00 ANNUAL ALL 00000002 566315.37500 4192162.75000 0.00484 228.02 532.00 0.00 ANNUAL ALL 00000002 566319.87500 4192099.50000 0.00368 199.66 532.00 0.00 ANNUAL ALL 00000002 566292.81250 4192090.50000 0.00376 195.98 532.00 0.00 ANNUAL ALL 00000002 566261.18750 4192158.25000 0.00533 224.06 532.00 0.00 ANNUAL ALL 00000002

Demolition Calculations
Dimensions of Building are Known with Additional Pavement
Demolition Schedule
Months 0.6 months entered
Days/Month 22 days/mo URBEMIS default
Actual Building Dimensions
Length 1 feet entered
Width 1 feet entered
Height 1 feet entered
Building Volume 1 cubic feet calculated
Pavement Removed
Area 52,500 square feet entered
Depth 0.3 foot assumed
Revised Building Volume with Pavement
Length 263.25 feet calculated
Width 263.25 feet calculated
Height 1 feet same as building
Volume 69,301 cubic feet calculated
Daily Building Volume
Length 70.36 feet calculated
Width 70.36 feet calculated
Height 1 feet same as building
Volume 4,950 cubic feet calculated
Demolition Debris
% of Bldg. Volume 25% URBEMIS default
Daily Debris Volume 45.8 cubic yards calculated
Haul Trucks
Capacity 20 cubic yards URBEMIS default
Number of Trips 2.3 trips/day calculated
Round Trip Length 30 miles URBEMIS default
VMT 69.00 miles/day calculated

0.00 0.01 0.01TOTALS (lbs/day, unmitigated) 0.92 0.86 2.26
SUM OF AREA SOURCE AND OPERATIONAL EMISSION ESTIMATES
ROG NOx CO SO2 PM10 PM2.5
SO2 PM10 PM2.5
TOTALS (lbs/day, unmitigated) 0.92 0.86 2.26 0.00 0.01 0.01
ROG NOx CO
0.02 1.50 1.52
AREA SOURCE EMISSION ESTIMATES
0.01 0.06 1.63 1.692013 TOTALS (lbs/day mitigated) 45.09 22.26 23.70
1.69 0.02 1.50 1.522013 TOTALS (lbs/day unmitigated) 45.09 22.26 23.70 0.01 0.06 1.63
0.58 0.02 0.49 0.51
0.02 0.49 0.51
2012 TOTALS (lbs/day mitigated) 1.35 9.12 13.24 0.01 0.05 0.54
0.01 0.05 0.54 0.582012 TOTALS (lbs/day unmitigated) 1.35 9.12 13.24
0.02 0.55 0.560.01 0.05 0.60 0.652011 TOTALS (lbs/day mitigated) 1.46 9.90 14.07
0.65 0.02 0.55 0.562011 TOTALS (lbs/day unmitigated) 1.46 9.90 14.07 0.01 0.05 0.60
6.87 0.97 2.08 3.05
2.35 2.08 4.43
2010 TOTALS (lbs/day mitigated) 5.37 46.54 24.18 0.01 4.60 2.27
0.01 11.23 2.27 13.502010 TOTALS (lbs/day unmitigated) 5.37 46.54 24.18
PM10 PM2.5 Dust PM2.5 Exhaust PM2.5
Off-Road Vehicle Emissions Based on: OFFROAD2007
Summary Report:
CONSTRUCTION EMISSION ESTIMATES
ROG NOx CO SO2 PM10 Dust PM10 Exhaust
File Name: Z:\Alan Sako\924.06 CRT\Emissions\Alt 1\CRT Alt 1 - Const Area.urb924
Project Name: CRT Alternative 1 - Construction and Area Source
Project Location: Bay Area Air District
On-Road Vehicle Emissions Based on: Version : Emfac2007 V2.3 Nov 1 2006
Page: 1
3/31/2010 11:56:08 AM
Urbemis 2007 Version 9.2.4
Combined Summer Emissions Reports (Pounds/Day)

Page: 1
3/31/2010 11:56:08 AM
0.01 0.02 0.030.01 0.04 0.02 0.06Building Worker Trips 0.25 0.44 7.96
0.04 0.00 0.03 0.03
0.00 0.45 0.45
Building Vendor Trips 0.06 0.81 0.72 0.00 0.01 0.03
0.00 0.00 0.49 0.49Building Off Road Diesel 1.03 7.87 4.56
0.58 0.02 0.49 0.51
0.02 0.49 0.51
Building 01/01/2011-06/30/2013 1.35 9.12 13.24 0.01 0.05 0.54
0.01 0.05 0.54 0.58Time Slice 1/2/2012-12/31/2012 Active
Days: 261
1.35 9.12 13.24
0.06 0.01 0.02 0.03
0.00 0.03 0.03
Building Worker Trips 0.28 0.48 8.63 0.01 0.04 0.02
0.00 0.01 0.03 0.04Building Vendor Trips 0.07 0.91 0.77
0.54 0.00 0.50 0.50
0.02 0.55 0.56
Building Off Road Diesel 1.11 8.51 4.68 0.00 0.00 0.54
0.01 0.05 0.60 0.65Building 01/01/2011-06/30/2013 1.46 9.90 14.07
0.65 0.02 0.55 0.56
0.00 0.00 0.00
Time Slice 1/3/2011-12/30/2011 Active
Days: 260
1.46 9.90 14.07 0.01 0.05 0.60
0.00 0.00 0.00 0.01Trenching Worker Trips 0.04 0.07 1.16
0.88 0.00 0.81 0.81
0.00 0.81 0.81
Trenching Off Road Diesel 2.06 17.69 8.22 0.00 0.00 0.88
0.00 0.00 0.88 0.88Trenching 10/20/2010-12/31/2010 2.10 17.75 9.37
0.01 0.00 0.00 0.00
0.01 0.13 0.13
Mass Grading Worker Trips 0.04 0.07 1.16 0.00 0.00 0.00
0.00 0.02 0.14 0.15Mass Grading On Road Diesel 0.23 3.73 1.19
1.25 0.00 1.15 1.15
2.34 0.00 2.34
Mass Grading Off Road Diesel 3.00 24.99 12.46 0.00 0.00 1.25
0.00 11.20 0.00 11.20Mass Grading Dust 0.00 0.00 0.00
12.61 2.35 1.28 3.62
2.35 2.08 4.43
Mass Grading 10/20/2010-
12/31/2010
3.27 28.79 14.81 0.01 11.22 1.39
0.01 11.23 2.27 13.50Time Slice 10/20/2010-12/31/2010
Active Days: 53
5.37 46.54 24.18
0.01 0.00 0.00 0.00
0.00 0.07 0.07
Demo Worker Trips 0.04 0.07 1.16 0.00 0.00 0.00
0.00 0.01 0.07 0.08Demo On Road Diesel 0.12 1.95 0.62
0.59 0.00 0.54 0.54
0.43 0.00 0.43
Demo Off Road Diesel 1.14 7.68 4.68 0.00 0.00 0.59
0.00 2.08 0.00 2.08Fugitive Dust 0.00 0.00 0.00
2.76 0.44 0.61 1.04
0.44 0.61 1.04
Demolition 10/01/2010-10/19/2010 1.30 9.69 6.46 0.00 2.10 0.66
PM2.5 Exhaust PM2.5
Time Slice 10/1/2010-10/19/2010
Active Days: 13
1.30 9.69 6.46 0.00 2.10 0.66 2.76
CONSTRUCTION EMISSION ESTIMATES Summer Pounds Per Day, Unmitigated
ROG NOx CO SO2 PM10 Dust PM10 Exhaust PM10 PM2.5 Dust
Construction Unmitigated Detail Report:

Page: 1
3/31/2010 11:56:08 AM
Off-Road Equipment:
1 Concrete/Industrial Saws (10 hp) operating at a 0.73 load factor for 8 hours per day
1 Rubber Tired Dozers (357 hp) operating at a 0.59 load factor for 1 hours per day
2 Tractors/Loaders/Backhoes (108 hp) operating at a 0.55 load factor for 6 hours per day
Phase: Demolition 10/1/2010 - 10/19/2010 - Type Your Description Here
Building Volume Total (cubic feet): 69326.88
Building Volume Daily (cubic feet): 4956.16
On Road Truck Travel (VMT): 68.84
0.00 0.00 0.00
Phase Assumptions
0.00 0.00 0.00 0.00Coating Worker Trips 0.01 0.02 0.44
0.00 0.00 0.00 0.00
0.00 0.00 0.00
Architectural Coating 41.52 0.00 0.00 0.00 0.00 0.00
0.00 0.00 0.00 0.00Coating 04/01/2013-06/30/2013 41.54 0.02 0.44
0.06 0.01 0.02 0.03
0.00 0.02 0.03
Building Worker Trips 0.23 0.40 7.33 0.01 0.04 0.02
0.00 0.01 0.03 0.03Building Vendor Trips 0.06 0.72 0.67
0.43 0.00 0.39 0.39
0.02 0.43 0.45
Building Off Road Diesel 0.95 7.29 4.48 0.00 0.00 0.43
0.01 0.05 0.48 0.52Building 01/01/2011-06/30/2013 1.24 8.41 12.48
0.02 0.00 0.00 0.01
0.00 0.00 0.00
Paving Worker Trips 0.06 0.10 1.82 0.00 0.01 0.01
0.00 0.00 0.00 0.01Paving On Road Diesel 0.01 0.12 0.04
1.15 0.00 1.05 1.05
0.00 0.00 0.00
Paving Off Road Diesel 2.19 13.60 8.91 0.00 0.00 1.15
0.00 0.00 0.00 0.00Paving Off-Gas 0.05 0.00 0.00
1.17 0.00 1.06 1.07
0.02 1.50 1.52
Asphalt 04/01/2013-06/30/2013 2.31 13.82 10.78 0.00 0.01 1.16
0.01 0.06 1.63 1.69Time Slice 4/1/2013-6/28/2013 Active
Days: 65
45.09 22.26 23.70
0.06 0.01 0.02 0.03
0.00 0.02 0.03
Building Worker Trips 0.23 0.40 7.33 0.01 0.04 0.02
0.00 0.01 0.03 0.03Building Vendor Trips 0.06 0.72 0.67
0.43 0.00 0.39 0.39
0.02 0.43 0.45
Building Off Road Diesel 0.95 7.29 4.48 0.00 0.00 0.43
0.01 0.05 0.48 0.52Building 01/01/2011-06/30/2013 1.24 8.41 12.48
0.52 0.02 0.43 0.45Time Slice 1/1/2013-3/29/2013 Active
Days: 64
1.24 8.41 12.48 0.01 0.05 0.48

Page: 1
3/31/2010 11:56:08 AM
Rule: Residential Exterior Coatings begins 1/1/2005 ends 12/31/2040 specifies a VOC of 250
Rule: Nonresidential Interior Coatings begins 1/1/2005 ends 12/31/2040 specifies a VOC of 250
Rule: Nonresidential Exterior Coatings begins 1/1/2005 ends 12/31/2040 specifies a VOC of 250
1 Tractors/Loaders/Backhoes (108 hp) operating at a 0.55 load factor for 8 hours per day
Phase: Architectural Coating 4/1/2013 - 6/30/2013 - Default Architectural Coating Description
Rule: Residential Interior Coatings begins 1/1/2005 ends 12/31/2040 specifies a VOC of 250
Phase: Building Construction 1/1/2011 - 6/30/2013 - Default Building Construction Description
Off-Road Equipment:
1 Cranes (399 hp) operating at a 0.43 load factor for 4 hours per day
2 Forklifts (145 hp) operating at a 0.3 load factor for 6 hours per day
1 Paving Equipment (104 hp) operating at a 0.53 load factor for 8 hours per day
1 Rollers (95 hp) operating at a 0.56 load factor for 7 hours per day
1 Tractors/Loaders/Backhoes (108 hp) operating at a 0.55 load factor for 7 hours per day
Acres to be Paved: 1.36
Off-Road Equipment:
4 Cement and Mortar Mixers (10 hp) operating at a 0.56 load factor for 6 hours per day
1 Pavers (100 hp) operating at a 0.62 load factor for 7 hours per day
1 Other General Industrial Equipment (238 hp) operating at a 0.51 load factor for 8 hours per day
1 Tractors/Loaders/Backhoes (108 hp) operating at a 0.55 load factor for 0 hours per day
Phase: Paving 4/1/2013 - 6/30/2013 - Default Paving Description
Phase: Trenching 10/20/2010 - 12/31/2010 - Type Your Description Here
Off-Road Equipment:
2 Excavators (168 hp) operating at a 0.57 load factor for 8 hours per day
1 Graders (174 hp) operating at a 0.61 load factor for 6 hours per day
1 Rubber Tired Dozers (357 hp) operating at a 0.59 load factor for 6 hours per day
1 Tractors/Loaders/Backhoes (108 hp) operating at a 0.55 load factor for 7 hours per day
1 Water Trucks (189 hp) operating at a 0.5 load factor for 8 hours per day
Fugitive Dust Level of Detail: Default
20 lbs per acre-day
On Road Truck Travel (VMT): 132.08
Off-Road Equipment:
Phase: Mass Grading 10/20/2010 - 12/31/2010 - Default Fine Site Grading Description
Total Acres Disturbed: 2.25
Maximum Daily Acreage Disturbed: 0.56

Page: 1
3/31/2010 11:56:08 AM
0.06 0.01 0.02 0.03
0.00 0.03 0.03
Building Worker Trips 0.25 0.44 7.96 0.01 0.04 0.02
0.00 0.01 0.03 0.04Building Vendor Trips 0.06 0.81 0.72
0.49 0.00 0.45 0.45
0.02 0.49 0.51
Building Off Road Diesel 1.03 7.87 4.56 0.00 0.00 0.49
0.01 0.05 0.54 0.58Building 01/01/2011-06/30/2013 1.35 9.12 13.24
0.58 0.02 0.49 0.51
0.01 0.02 0.03
Time Slice 1/2/2012-12/31/2012 Active
Days: 261
1.35 9.12 13.24 0.01 0.05 0.54
0.01 0.04 0.02 0.06Building Worker Trips 0.28 0.48 8.63
0.04 0.00 0.03 0.03
0.00 0.50 0.50
Building Vendor Trips 0.07 0.91 0.77 0.00 0.01 0.03
0.00 0.00 0.54 0.54Building Off Road Diesel 1.11 8.51 4.68
0.65 0.02 0.55 0.56
0.02 0.55 0.56
Building 01/01/2011-06/30/2013 1.46 9.90 14.07 0.01 0.05 0.60
0.01 0.05 0.60 0.65Time Slice 1/3/2011-12/30/2011 Active
Days: 260
1.46 9.90 14.07
0.01 0.00 0.00 0.00
0.00 0.81 0.81
Trenching Worker Trips 0.04 0.07 1.16 0.00 0.00 0.00
0.00 0.00 0.88 0.88Trenching Off Road Diesel 2.06 17.69 8.22
0.88 0.00 0.81 0.81
0.00 0.00 0.00
Trenching 10/20/2010-12/31/2010 2.10 17.75 9.37 0.00 0.00 0.88
0.00 0.00 0.00 0.01Mass Grading Worker Trips 0.04 0.07 1.16
0.15 0.01 0.13 0.13
0.00 1.15 1.15
Mass Grading On Road Diesel 0.23 3.73 1.19 0.00 0.02 0.14
0.00 0.00 1.25 1.25Mass Grading Off Road Diesel 3.00 24.99 12.46
4.57 0.96 0.00 0.96
0.96 1.28 2.24
Mass Grading Dust 0.00 0.00 0.00 0.00 4.57 0.00
0.01 4.60 1.39 5.99Mass Grading 10/20/2010-
12/31/2010
3.27 28.79 14.81
6.87 0.97 2.08 3.05
0.00 0.00 0.00
Time Slice 10/20/2010-12/31/2010
Active Days: 53
5.37 46.54 24.18 0.01 4.60 2.27
0.00 0.00 0.00 0.01Demo Worker Trips 0.04 0.07 1.16
0.08 0.00 0.07 0.07
0.00 0.54 0.54
Demo On Road Diesel 0.12 1.95 0.62 0.00 0.01 0.07
0.00 0.00 0.59 0.59Demo Off Road Diesel 1.14 7.68 4.68
2.08 0.43 0.00 0.43
0.44 0.61 1.04
Fugitive Dust 0.00 0.00 0.00 0.00 2.08 0.00
0.00 2.10 0.66 2.76Demolition 10/01/2010-10/19/2010 1.30 9.69 6.46
2.76 0.44 0.61 1.04
PM2.5 Dust PM2.5 Exhaust PM2.5
Time Slice 10/1/2010-10/19/2010
Active Days: 13
1.30 9.69 6.46 0.00 2.10 0.66
Construction Mitigated Detail Report:
CONSTRUCTION EMISSION ESTIMATES Summer Pounds Per Day, Mitigated
ROG NOx CO SO2 PM10 Dust PM10 Exhaust PM10

Page: 1
3/31/2010 11:56:08 AM
For Unpaved Roads Measures, the Reduce speed on unpaved roads to less than 15 mph mitigation reduces emissions by:
PM10: 44% PM25: 44%
For Unpaved Roads Measures, the Manage haul road dust 2x daily watering mitigation reduces emissions by:
PM10: 55% PM25: 55%
Construction Related Mitigation Measures
The following mitigation measures apply to Phase: Mass Grading 10/20/2010 - 12/31/2010 - Default Fine Site Grading Description
For Soil Stablizing Measures, the Water exposed surfaces 2x daily watering mitigation reduces emissions by:
PM10: 55% PM25: 55%
0.00 0.00 0.00 0.00
0.00 0.00 0.00
Coating Worker Trips 0.01 0.02 0.44 0.00 0.00 0.00
0.00 0.00 0.00 0.00Architectural Coating 41.52 0.00 0.00
0.00 0.00 0.00 0.00
0.01 0.02 0.03
Coating 04/01/2013-06/30/2013 41.54 0.02 0.44 0.00 0.00 0.00
0.01 0.04 0.02 0.06Building Worker Trips 0.23 0.40 7.33
0.03 0.00 0.02 0.03
0.00 0.39 0.39
Building Vendor Trips 0.06 0.72 0.67 0.00 0.01 0.03
0.00 0.00 0.43 0.43Building Off Road Diesel 0.95 7.29 4.48
0.52 0.02 0.43 0.45
0.00 0.00 0.01
Building 01/01/2011-06/30/2013 1.24 8.41 12.48 0.01 0.05 0.48
0.00 0.01 0.01 0.02Paving Worker Trips 0.06 0.10 1.82
0.01 0.00 0.00 0.00
0.00 1.05 1.05
Paving On Road Diesel 0.01 0.12 0.04 0.00 0.00 0.00
0.00 0.00 1.15 1.15Paving Off Road Diesel 2.19 13.60 8.91
0.00 0.00 0.00 0.00
0.00 1.06 1.07
Paving Off-Gas 0.05 0.00 0.00 0.00 0.00 0.00
0.00 0.01 1.16 1.17Asphalt 04/01/2013-06/30/2013 2.31 13.82 10.78
1.69 0.02 1.50 1.52
0.01 0.02 0.03
Time Slice 4/1/2013-6/28/2013 Active
Days: 65
45.09 22.26 23.70 0.01 0.06 1.63
0.01 0.04 0.02 0.06Building Worker Trips 0.23 0.40 7.33
0.03 0.00 0.02 0.03
0.00 0.39 0.39
Building Vendor Trips 0.06 0.72 0.67 0.00 0.01 0.03
0.00 0.00 0.43 0.43Building Off Road Diesel 0.95 7.29 4.48
0.52 0.02 0.43 0.45
0.02 0.43 0.45
Building 01/01/2011-06/30/2013 1.24 8.41 12.48 0.01 0.05 0.48
0.01 0.05 0.48 0.52Time Slice 1/1/2013-3/29/2013 Active
Days: 64
1.24 8.41 12.48

Page: 1
3/31/2010 11:56:08 AM
Area Source Changes to Defaults
TOTALS (lbs/day, unmitigated) 0.92 0.86 2.26 0.00 0.01 0.01
Architectural Coatings 0.74
0.00 0.01 0.01
Consumer Products 0.00
Landscape 0.12 0.02 1.55
0.00 0.00 0.00
Hearth
Natural Gas 0.06 0.84 0.71
Area Source Unmitigated Detail Report:
AREA SOURCE EMISSION ESTIMATES Summer Pounds Per Day, Unmitigated
Source ROG NOx CO SO2 PM10 PM2.5

Page: 12/23/2010 01:27:16 PM
0.03 4.60 0.88
TOTALS (lbs/day, unmitigated) 3.13 2.33 24.87 0.03 4.60 0.88
R&D Center 3.13 2.33 24.87
OPERATIONAL EMISSION ESTIMATES Summer Pounds Per Day, Unmitigated
Source ROG NOX CO SO2 PM10 PM25
0.03 4.60 0.88
Operational Unmitigated Detail Report:
TOTALS (lbs/day, unmitigated) 3.13 2.33 24.87
SUM OF AREA SOURCE AND OPERATIONAL EMISSION ESTIMATES
ROG NOx CO SO2 PM10 PM2.5
SO2 PM10 PM2.5
TOTALS (lbs/day, unmitigated) 3.13 2.33 24.87 0.03 4.60 0.88
ROG NOx CO
OPERATIONAL (VEHICLE) EMISSION ESTIMATES
Project Location: Bay Area Air District
On-Road Vehicle Emissions Based on: Version : Emfac2007 V2.3 Nov 1 2006
Off-Road Vehicle Emissions Based on: OFFROAD2007
Summary Report:
Urbemis 2007 Version 9.2.4
Combined Summer Emissions Reports (Pounds/Day)
File Name: Z:\Alan Sako\924.06 CRT\Emissions\Alt 1\CRT Alt 1 - Operational.urb924
Project Name: CRT Alternative 1 - Operations

Page: 12/23/2010 01:27:16 PM
16.7Motor Home 0.6 0.0 83.3
0.0
School Bus 0.1 0.0 0.0 100.0
Motorcycle 3.2 56.2 43.8
100.0
Urban Bus 0.1 0.0 0.0 100.0
Other Bus 0.1 0.0 0.0
80.0
Heavy-Heavy Truck 33,001-60,000 lbs 0.4 0.0 0.0 100.0
Med-Heavy Truck 14,001-33,000 lbs 1.0 0.0 20.0
22.2
Lite-Heavy Truck 10,001-14,000 lbs 0.6 0.0 50.0 50.0
Lite-Heavy Truck 8501-10,000 lbs 0.9 0.0 77.8
0.0
Med Truck 5751-8500 lbs 6.6 0.0 100.0 0.0
Light Truck 3751-5750 lbs 19.9 0.5 99.5
0.2
Light Truck < 3750 lbs 12.8 0.8 96.9 2.3
Light Auto 53.7 0.6 99.2
Vehicle Fleet Mix
Vehicle Type Percent Type Non-Catalyst Catalyst Diesel
135.00 373.95 2,677.95
373.95 2,677.95
R&D Center 2.77 unknown
Emfac: Version : Emfac2007 V2.3 Nov 1 2006
Summary of Land Uses
Land Use Type Acreage Trip Rate Unit Type No. Units Total Trips Total VMT
Operational Settings:
Includes correction for passby trips
Does not include double counting adjustment for internal trips
Analysis Year: 2013 Temperature (F): 85 Season: Summer

Page: 12/23/2010 01:27:16 PM
R&D Center 50.0 25.0 25.0
% of Trips - Commercial (by land use)
% of Trips - Residential 32.9 18.0 49.1
14.7 6.6 6.6
Trip speeds (mph) 35.0 35.0 35.0 35.0 35.0 35.0
Rural Trip Length (miles) 16.8 7.1 7.9
Commute Non-Work Customer
Urban Trip Length (miles) 10.8 7.3 7.5 9.5 7.4 7.4
Home-Work Home-Shop Home-Other
Travel Conditions
Residential Commercial

0.00 0.00 0.00TOTALS (lbs/day, unmitigated) 0.80 0.84 0.71
SUM OF AREA SOURCE AND OPERATIONAL EMISSION ESTIMATES
ROG NOx CO SO2 PM10 PM2.5
SO2 PM10 PM2.5
TOTALS (lbs/day, unmitigated) 0.80 0.84 0.71 0.00 0.00 0.00
ROG NOx CO
0.02 1.50 1.52
AREA SOURCE EMISSION ESTIMATES
0.01 0.06 1.63 1.692013 TOTALS (lbs/day mitigated) 45.09 22.26 23.70
1.69 0.02 1.50 1.522013 TOTALS (lbs/day unmitigated) 45.09 22.26 23.70 0.01 0.06 1.63
0.58 0.02 0.49 0.51
0.02 0.49 0.51
2012 TOTALS (lbs/day mitigated) 1.35 9.12 13.24 0.01 0.05 0.54
0.01 0.05 0.54 0.582012 TOTALS (lbs/day unmitigated) 1.35 9.12 13.24
0.02 0.55 0.560.01 0.05 0.60 0.652011 TOTALS (lbs/day mitigated) 1.46 9.90 14.07
0.65 0.02 0.55 0.562011 TOTALS (lbs/day unmitigated) 1.46 9.90 14.07 0.01 0.05 0.60
6.87 0.97 2.08 3.05
2.35 2.08 4.43
2010 TOTALS (lbs/day mitigated) 5.37 46.54 24.18 0.01 4.60 2.27
0.01 11.23 2.27 13.502010 TOTALS (lbs/day unmitigated) 5.37 46.54 24.18
PM10 PM2.5 Dust PM2.5 Exhaust PM2.5
Off-Road Vehicle Emissions Based on: OFFROAD2007
Summary Report:
CONSTRUCTION EMISSION ESTIMATES
ROG NOx CO SO2 PM10 Dust PM10 Exhaust
File Name: Z:\Alan Sako\924.06 CRT\Emissions\Alt 1\CRT Alt 1 - Const Area.urb924
Project Name: CRT Alternative 1 - Construction and Area Source
Project Location: Bay Area Air District
On-Road Vehicle Emissions Based on: Version : Emfac2007 V2.3 Nov 1 2006
Page: 1
3/31/2010 11:56:37 AM
Urbemis 2007 Version 9.2.4
Combined Winter Emissions Reports (Pounds/Day)

Page: 1
3/31/2010 11:56:37 AM
0.01 0.02 0.030.01 0.04 0.02 0.06Building Worker Trips 0.25 0.44 7.96
0.04 0.00 0.03 0.03
0.00 0.45 0.45
Building Vendor Trips 0.06 0.81 0.72 0.00 0.01 0.03
0.00 0.00 0.49 0.49Building Off Road Diesel 1.03 7.87 4.56
0.58 0.02 0.49 0.51
0.02 0.49 0.51
Building 01/01/2011-06/30/2013 1.35 9.12 13.24 0.01 0.05 0.54
0.01 0.05 0.54 0.58Time Slice 1/2/2012-12/31/2012 Active
Days: 261
1.35 9.12 13.24
0.06 0.01 0.02 0.03
0.00 0.03 0.03
Building Worker Trips 0.28 0.48 8.63 0.01 0.04 0.02
0.00 0.01 0.03 0.04Building Vendor Trips 0.07 0.91 0.77
0.54 0.00 0.50 0.50
0.02 0.55 0.56
Building Off Road Diesel 1.11 8.51 4.68 0.00 0.00 0.54
0.01 0.05 0.60 0.65Building 01/01/2011-06/30/2013 1.46 9.90 14.07
0.65 0.02 0.55 0.56
0.00 0.00 0.00
Time Slice 1/3/2011-12/30/2011 Active
Days: 260
1.46 9.90 14.07 0.01 0.05 0.60
0.00 0.00 0.00 0.01Trenching Worker Trips 0.04 0.07 1.16
0.88 0.00 0.81 0.81
0.00 0.81 0.81
Trenching Off Road Diesel 2.06 17.69 8.22 0.00 0.00 0.88
0.00 0.00 0.88 0.88Trenching 10/20/2010-12/31/2010 2.10 17.75 9.37
0.01 0.00 0.00 0.00
0.01 0.13 0.13
Mass Grading Worker Trips 0.04 0.07 1.16 0.00 0.00 0.00
0.00 0.02 0.14 0.15Mass Grading On Road Diesel 0.23 3.73 1.19
1.25 0.00 1.15 1.15
2.34 0.00 2.34
Mass Grading Off Road Diesel 3.00 24.99 12.46 0.00 0.00 1.25
0.00 11.20 0.00 11.20Mass Grading Dust 0.00 0.00 0.00
12.61 2.35 1.28 3.62
2.35 2.08 4.43
Mass Grading 10/20/2010-
12/31/2010
3.27 28.79 14.81 0.01 11.22 1.39
0.01 11.23 2.27 13.50Time Slice 10/20/2010-12/31/2010
Active Days: 53
5.37 46.54 24.18
0.01 0.00 0.00 0.00
0.00 0.07 0.07
Demo Worker Trips 0.04 0.07 1.16 0.00 0.00 0.00
0.00 0.01 0.07 0.08Demo On Road Diesel 0.12 1.95 0.62
0.59 0.00 0.54 0.54
0.43 0.00 0.43
Demo Off Road Diesel 1.14 7.68 4.68 0.00 0.00 0.59
0.00 2.08 0.00 2.08Fugitive Dust 0.00 0.00 0.00
2.76 0.44 0.61 1.04
0.44 0.61 1.04
Demolition 10/01/2010-10/19/2010 1.30 9.69 6.46 0.00 2.10 0.66
PM2.5 Exhaust PM2.5
Time Slice 10/1/2010-10/19/2010
Active Days: 13
1.30 9.69 6.46 0.00 2.10 0.66 2.76
CONSTRUCTION EMISSION ESTIMATES Winter Pounds Per Day, Unmitigated
ROG NOx CO SO2 PM10 Dust PM10 Exhaust PM10 PM2.5 Dust
Construction Unmitigated Detail Report:

Page: 1
3/31/2010 11:56:37 AM
Fugitive Dust Level of Detail: Default
20 lbs per acre-day
Phase: Mass Grading 10/20/2010 - 12/31/2010 - Default Fine Site Grading Description
Total Acres Disturbed: 2.25
Maximum Daily Acreage Disturbed: 0.56
Off-Road Equipment:
1 Concrete/Industrial Saws (10 hp) operating at a 0.73 load factor for 8 hours per day
1 Rubber Tired Dozers (357 hp) operating at a 0.59 load factor for 1 hours per day
2 Tractors/Loaders/Backhoes (108 hp) operating at a 0.55 load factor for 6 hours per day
Phase: Demolition 10/1/2010 - 10/19/2010 - Type Your Description Here
Building Volume Total (cubic feet): 69326.88
Building Volume Daily (cubic feet): 4956.16
On Road Truck Travel (VMT): 68.84
0.00 0.00 0.00
Phase Assumptions
0.00 0.00 0.00 0.00Coating Worker Trips 0.01 0.02 0.44
0.00 0.00 0.00 0.00
0.00 0.00 0.00
Architectural Coating 41.52 0.00 0.00 0.00 0.00 0.00
0.00 0.00 0.00 0.00Coating 04/01/2013-06/30/2013 41.54 0.02 0.44
0.06 0.01 0.02 0.03
0.00 0.02 0.03
Building Worker Trips 0.23 0.40 7.33 0.01 0.04 0.02
0.00 0.01 0.03 0.03Building Vendor Trips 0.06 0.72 0.67
0.43 0.00 0.39 0.39
0.02 0.43 0.45
Building Off Road Diesel 0.95 7.29 4.48 0.00 0.00 0.43
0.01 0.05 0.48 0.52Building 01/01/2011-06/30/2013 1.24 8.41 12.48
0.02 0.00 0.00 0.01
0.00 0.00 0.00
Paving Worker Trips 0.06 0.10 1.82 0.00 0.01 0.01
0.00 0.00 0.00 0.01Paving On Road Diesel 0.01 0.12 0.04
1.15 0.00 1.05 1.05
0.00 0.00 0.00
Paving Off Road Diesel 2.19 13.60 8.91 0.00 0.00 1.15
0.00 0.00 0.00 0.00Paving Off-Gas 0.05 0.00 0.00
1.17 0.00 1.06 1.07
0.02 1.50 1.52
Asphalt 04/01/2013-06/30/2013 2.31 13.82 10.78 0.00 0.01 1.16
0.01 0.06 1.63 1.69Time Slice 4/1/2013-6/28/2013 Active
Days: 65
45.09 22.26 23.70
0.06 0.01 0.02 0.03
0.00 0.02 0.03
Building Worker Trips 0.23 0.40 7.33 0.01 0.04 0.02
0.00 0.01 0.03 0.03Building Vendor Trips 0.06 0.72 0.67
0.43 0.00 0.39 0.39
0.02 0.43 0.45
Building Off Road Diesel 0.95 7.29 4.48 0.00 0.00 0.43
0.01 0.05 0.48 0.52Building 01/01/2011-06/30/2013 1.24 8.41 12.48
0.52 0.02 0.43 0.45Time Slice 1/1/2013-3/29/2013 Active
Days: 64
1.24 8.41 12.48 0.01 0.05 0.48

Page: 1
3/31/2010 11:56:37 AM
Rule: Residential Exterior Coatings begins 1/1/2005 ends 12/31/2040 specifies a VOC of 250
Rule: Nonresidential Interior Coatings begins 1/1/2005 ends 12/31/2040 specifies a VOC of 250
Rule: Nonresidential Exterior Coatings begins 1/1/2005 ends 12/31/2040 specifies a VOC of 250
1 Tractors/Loaders/Backhoes (108 hp) operating at a 0.55 load factor for 8 hours per day
Phase: Architectural Coating 4/1/2013 - 6/30/2013 - Default Architectural Coating Description
Rule: Residential Interior Coatings begins 1/1/2005 ends 12/31/2040 specifies a VOC of 250
Phase: Building Construction 1/1/2011 - 6/30/2013 - Default Building Construction Description
Off-Road Equipment:
1 Cranes (399 hp) operating at a 0.43 load factor for 4 hours per day
2 Forklifts (145 hp) operating at a 0.3 load factor for 6 hours per day
1 Paving Equipment (104 hp) operating at a 0.53 load factor for 8 hours per day
1 Rollers (95 hp) operating at a 0.56 load factor for 7 hours per day
1 Tractors/Loaders/Backhoes (108 hp) operating at a 0.55 load factor for 7 hours per day
Acres to be Paved: 1.36
Off-Road Equipment:
4 Cement and Mortar Mixers (10 hp) operating at a 0.56 load factor for 6 hours per day
1 Pavers (100 hp) operating at a 0.62 load factor for 7 hours per day
1 Other General Industrial Equipment (238 hp) operating at a 0.51 load factor for 8 hours per day
1 Tractors/Loaders/Backhoes (108 hp) operating at a 0.55 load factor for 0 hours per day
Phase: Paving 4/1/2013 - 6/30/2013 - Default Paving Description
Phase: Trenching 10/20/2010 - 12/31/2010 - Type Your Description Here
Off-Road Equipment:
2 Excavators (168 hp) operating at a 0.57 load factor for 8 hours per day
1 Graders (174 hp) operating at a 0.61 load factor for 6 hours per day
1 Rubber Tired Dozers (357 hp) operating at a 0.59 load factor for 6 hours per day
1 Tractors/Loaders/Backhoes (108 hp) operating at a 0.55 load factor for 7 hours per day
1 Water Trucks (189 hp) operating at a 0.5 load factor for 8 hours per day
On Road Truck Travel (VMT): 132.08
Off-Road Equipment:

Page: 1
3/31/2010 11:56:37 AM
0.06 0.01 0.02 0.03
0.00 0.03 0.03
Building Worker Trips 0.25 0.44 7.96 0.01 0.04 0.02
0.00 0.01 0.03 0.04Building Vendor Trips 0.06 0.81 0.72
0.49 0.00 0.45 0.45
0.02 0.49 0.51
Building Off Road Diesel 1.03 7.87 4.56 0.00 0.00 0.49
0.01 0.05 0.54 0.58Building 01/01/2011-06/30/2013 1.35 9.12 13.24
0.58 0.02 0.49 0.51
0.01 0.02 0.03
Time Slice 1/2/2012-12/31/2012 Active
Days: 261
1.35 9.12 13.24 0.01 0.05 0.54
0.01 0.04 0.02 0.06Building Worker Trips 0.28 0.48 8.63
0.04 0.00 0.03 0.03
0.00 0.50 0.50
Building Vendor Trips 0.07 0.91 0.77 0.00 0.01 0.03
0.00 0.00 0.54 0.54Building Off Road Diesel 1.11 8.51 4.68
0.65 0.02 0.55 0.56
0.02 0.55 0.56
Building 01/01/2011-06/30/2013 1.46 9.90 14.07 0.01 0.05 0.60
0.01 0.05 0.60 0.65Time Slice 1/3/2011-12/30/2011 Active
Days: 260
1.46 9.90 14.07
0.01 0.00 0.00 0.00
0.00 0.81 0.81
Trenching Worker Trips 0.04 0.07 1.16 0.00 0.00 0.00
0.00 0.00 0.88 0.88Trenching Off Road Diesel 2.06 17.69 8.22
0.88 0.00 0.81 0.81
0.00 0.00 0.00
Trenching 10/20/2010-12/31/2010 2.10 17.75 9.37 0.00 0.00 0.88
0.00 0.00 0.00 0.01Mass Grading Worker Trips 0.04 0.07 1.16
0.15 0.01 0.13 0.13
0.00 1.15 1.15
Mass Grading On Road Diesel 0.23 3.73 1.19 0.00 0.02 0.14
0.00 0.00 1.25 1.25Mass Grading Off Road Diesel 3.00 24.99 12.46
4.57 0.96 0.00 0.96
0.96 1.28 2.24
Mass Grading Dust 0.00 0.00 0.00 0.00 4.57 0.00
0.01 4.60 1.39 5.99Mass Grading 10/20/2010-
12/31/2010
3.27 28.79 14.81
6.87 0.97 2.08 3.05
0.00 0.00 0.00
Time Slice 10/20/2010-12/31/2010
Active Days: 53
5.37 46.54 24.18 0.01 4.60 2.27
0.00 0.00 0.00 0.01Demo Worker Trips 0.04 0.07 1.16
0.08 0.00 0.07 0.07
0.00 0.54 0.54
Demo On Road Diesel 0.12 1.95 0.62 0.00 0.01 0.07
0.00 0.00 0.59 0.59Demo Off Road Diesel 1.14 7.68 4.68
2.08 0.43 0.00 0.43
0.44 0.61 1.04
Fugitive Dust 0.00 0.00 0.00 0.00 2.08 0.00
0.00 2.10 0.66 2.76Demolition 10/01/2010-10/19/2010 1.30 9.69 6.46
2.76 0.44 0.61 1.04
PM2.5 Dust PM2.5 Exhaust PM2.5
Time Slice 10/1/2010-10/19/2010
Active Days: 13
1.30 9.69 6.46 0.00 2.10 0.66
Construction Mitigated Detail Report:
CONSTRUCTION EMISSION ESTIMATES Winter Pounds Per Day, Mitigated
ROG NOx CO SO2 PM10 Dust PM10 Exhaust PM10

Page: 1
3/31/2010 11:56:37 AM
For Unpaved Roads Measures, the Reduce speed on unpaved roads to less than 15 mph mitigation reduces emissions by:
PM10: 44% PM25: 44%
For Unpaved Roads Measures, the Manage haul road dust 2x daily watering mitigation reduces emissions by:
PM10: 55% PM25: 55%
Construction Related Mitigation Measures
The following mitigation measures apply to Phase: Mass Grading 10/20/2010 - 12/31/2010 - Default Fine Site Grading Description
For Soil Stablizing Measures, the Water exposed surfaces 2x daily watering mitigation reduces emissions by:
PM10: 55% PM25: 55%
0.00 0.00 0.00 0.00
0.00 0.00 0.00
Coating Worker Trips 0.01 0.02 0.44 0.00 0.00 0.00
0.00 0.00 0.00 0.00Architectural Coating 41.52 0.00 0.00
0.00 0.00 0.00 0.00
0.01 0.02 0.03
Coating 04/01/2013-06/30/2013 41.54 0.02 0.44 0.00 0.00 0.00
0.01 0.04 0.02 0.06Building Worker Trips 0.23 0.40 7.33
0.03 0.00 0.02 0.03
0.00 0.39 0.39
Building Vendor Trips 0.06 0.72 0.67 0.00 0.01 0.03
0.00 0.00 0.43 0.43Building Off Road Diesel 0.95 7.29 4.48
0.52 0.02 0.43 0.45
0.00 0.00 0.01
Building 01/01/2011-06/30/2013 1.24 8.41 12.48 0.01 0.05 0.48
0.00 0.01 0.01 0.02Paving Worker Trips 0.06 0.10 1.82
0.01 0.00 0.00 0.00
0.00 1.05 1.05
Paving On Road Diesel 0.01 0.12 0.04 0.00 0.00 0.00
0.00 0.00 1.15 1.15Paving Off Road Diesel 2.19 13.60 8.91
0.00 0.00 0.00 0.00
0.00 1.06 1.07
Paving Off-Gas 0.05 0.00 0.00 0.00 0.00 0.00
0.00 0.01 1.16 1.17Asphalt 04/01/2013-06/30/2013 2.31 13.82 10.78
1.69 0.02 1.50 1.52
0.01 0.02 0.03
Time Slice 4/1/2013-6/28/2013 Active
Days: 65
45.09 22.26 23.70 0.01 0.06 1.63
0.01 0.04 0.02 0.06Building Worker Trips 0.23 0.40 7.33
0.03 0.00 0.02 0.03
0.00 0.39 0.39
Building Vendor Trips 0.06 0.72 0.67 0.00 0.01 0.03
0.00 0.00 0.43 0.43Building Off Road Diesel 0.95 7.29 4.48
0.52 0.02 0.43 0.45
0.02 0.43 0.45
Building 01/01/2011-06/30/2013 1.24 8.41 12.48 0.01 0.05 0.48
0.01 0.05 0.48 0.52Time Slice 1/1/2013-3/29/2013 Active
Days: 64
1.24 8.41 12.48

Page: 1
3/31/2010 11:56:37 AM
Area Source Changes to Defaults
TOTALS (lbs/day, unmitigated) 0.80 0.84 0.71 0.00 0.00 0.00
Architectural Coatings 0.74
Consumer Products 0.00
Landscaping - No Winter Emissions
0.00 0.00 0.00
Hearth
Natural Gas 0.06 0.84 0.71
Area Source Unmitigated Detail Report:
AREA SOURCE EMISSION ESTIMATES Winter Pounds Per Day, Unmitigated
Source ROG NOx CO SO2 PM10 PM2.5
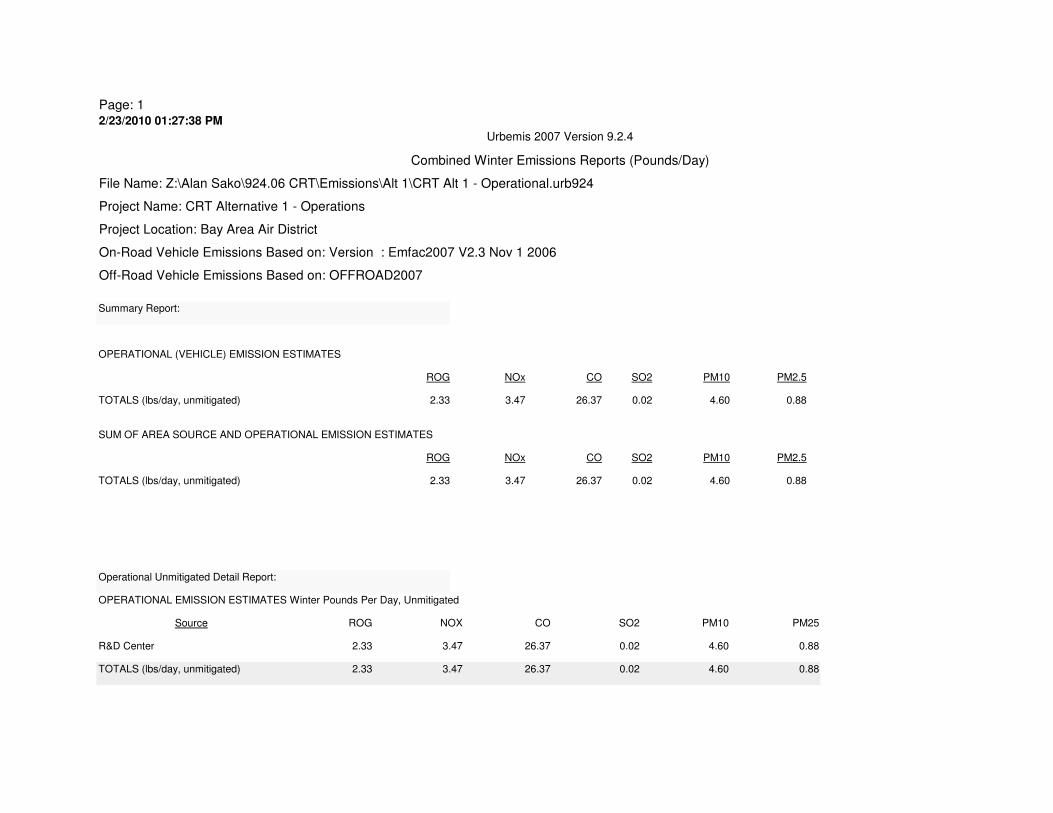
Page: 12/23/2010 01:27:38 PM
0.02 4.60 0.88
TOTALS (lbs/day, unmitigated) 2.33 3.47 26.37 0.02 4.60 0.88
R&D Center 2.33 3.47 26.37
OPERATIONAL EMISSION ESTIMATES Winter Pounds Per Day, Unmitigated
Source ROG NOX CO SO2 PM10 PM25
0.02 4.60 0.88
Operational Unmitigated Detail Report:
TOTALS (lbs/day, unmitigated) 2.33 3.47 26.37
SUM OF AREA SOURCE AND OPERATIONAL EMISSION ESTIMATES
ROG NOx CO SO2 PM10 PM2.5
SO2 PM10 PM2.5
TOTALS (lbs/day, unmitigated) 2.33 3.47 26.37 0.02 4.60 0.88
ROG NOx CO
OPERATIONAL (VEHICLE) EMISSION ESTIMATES
Project Location: Bay Area Air District
On-Road Vehicle Emissions Based on: Version : Emfac2007 V2.3 Nov 1 2006
Off-Road Vehicle Emissions Based on: OFFROAD2007
Summary Report:
Urbemis 2007 Version 9.2.4
Combined Winter Emissions Reports (Pounds/Day)
File Name: Z:\Alan Sako\924.06 CRT\Emissions\Alt 1\CRT Alt 1 - Operational.urb924
Project Name: CRT Alternative 1 - Operations

Page: 12/23/2010 01:27:38 PM
16.7Motor Home 0.6 0.0 83.3
0.0
School Bus 0.1 0.0 0.0 100.0
Motorcycle 3.2 56.2 43.8
100.0
Urban Bus 0.1 0.0 0.0 100.0
Other Bus 0.1 0.0 0.0
80.0
Heavy-Heavy Truck 33,001-60,000 lbs 0.4 0.0 0.0 100.0
Med-Heavy Truck 14,001-33,000 lbs 1.0 0.0 20.0
22.2
Lite-Heavy Truck 10,001-14,000 lbs 0.6 0.0 50.0 50.0
Lite-Heavy Truck 8501-10,000 lbs 0.9 0.0 77.8
0.0
Med Truck 5751-8500 lbs 6.6 0.0 100.0 0.0
Light Truck 3751-5750 lbs 19.9 0.5 99.5
0.2
Light Truck < 3750 lbs 12.8 0.8 96.9 2.3
Light Auto 53.7 0.6 99.2
Vehicle Fleet Mix
Vehicle Type Percent Type Non-Catalyst Catalyst Diesel
135.00 373.95 2,677.95
373.95 2,677.95
R&D Center 2.77 unknown
Emfac: Version : Emfac2007 V2.3 Nov 1 2006
Summary of Land Uses
Land Use Type Acreage Trip Rate Unit Type No. Units Total Trips Total VMT
Operational Settings:
Includes correction for passby trips
Does not include double counting adjustment for internal trips
Analysis Year: 2013 Temperature (F): 40 Season: Winter

Page: 12/23/2010 01:27:38 PM
R&D Center 50.0 25.0 25.0
% of Trips - Commercial (by land use)
% of Trips - Residential 32.9 18.0 49.1
14.7 6.6 6.6
Trip speeds (mph) 35.0 35.0 35.0 35.0 35.0 35.0
Rural Trip Length (miles) 16.8 7.1 7.9
Commute Non-Work Customer
Urban Trip Length (miles) 10.8 7.3 7.5 9.5 7.4 7.4
Home-Work Home-Shop Home-Other
Travel Conditions
Residential Commercial

Page: 1
3/31/2010 11:56:52 AM
Urbemis 2007 Version 9.2.4
Combined Annual Emissions Reports (Tons/Year)
File Name: Z:\Alan Sako\924.06 CRT\Emissions\Alt 1\CRT Alt 1 - Const Area.urb924
Project Name: CRT Alternative 1 - Construction and Area Source
Project Location: Bay Area Air District
On-Road Vehicle Emissions Based on: Version : Emfac2007 V2.3 Nov 1 2006
Off-Road Vehicle Emissions Based on: OFFROAD2007
Summary Report:
CONSTRUCTION EMISSION ESTIMATES
ROG NOx CO SO2 PM10 Dust PM10 Exhaust PM10 PM2.5 Dust PM2.5 Exhaust PM2.5 CO2
2010 TOTALS (tons/year unmitigated) 0.15 1.30 0.68 0.00 0.31 0.06 0.38 0.07 0.06 0.12 131.50
2010 TOTALS (tons/year mitigated) 0.15 1.30 0.68 0.00 0.14 0.06 0.20 0.03 0.06 0.09 131.50
Percent Reduction 0.00 0.00 0.00 0.00 56.42 0.00 46.75 56.34 0.00 29.50 0.00
2011 TOTALS (tons/year unmitigated) 0.19 1.29 1.83 0.00 0.01 0.08 0.08 0.00 0.07 0.07 249.49
2011 TOTALS (tons/year mitigated) 0.19 1.29 1.83 0.00 0.01 0.08 0.08 0.00 0.07 0.07 249.49
Percent Reduction 0.00 0.00 0.00 0.00 0.00 0.00 0.00 0.00 0.00 0.00 0.00
2012 TOTALS (tons/year unmitigated) 0.18 1.19 1.73 0.00 0.01 0.07 0.08 0.00 0.06 0.07 250.51
2012 TOTALS (tons/year mitigated) 0.18 1.19 1.73 0.00 0.01 0.07 0.08 0.00 0.06 0.07 250.51
Percent Reduction 0.00 0.00 0.00 0.00 0.00 0.00 0.00 0.00 0.00 0.00 0.00
2013 TOTALS (tons/year unmitigated) 1.51 0.99 1.17 0.00 0.00 0.07 0.07 0.00 0.06 0.06 174.24
2013 TOTALS (tons/year mitigated) 1.51 0.99 1.17 0.00 0.00 0.07 0.07 0.00 0.06 0.06 174.24
Percent Reduction 0.00 0.00 0.00 0.00 0.00 0.00 0.00 0.00 0.00 0.00 0.00
AREA SOURCE EMISSION ESTIMATES
ROG NOx CO SO2 PM10 PM2.5 CO2
TOTALS (tons/year, unmitigated) 0.15 0.15 0.27 0.00 0.00 0.00 184.21

Page: 1
3/31/2010 11:56:52 AM
SUM OF AREA SOURCE AND OPERATIONAL EMISSION ESTIMATES
ROG NOx CO SO2 PM10 PM2.5 CO2
TOTALS (tons/year, unmitigated) 0.15 0.15 0.27 0.00 0.00 0.00 184.21
Construction Unmitigated Detail Report:
CONSTRUCTION EMISSION ESTIMATES Annual Tons Per Year, Unmitigated
ROG NOx CO SO2 PM10 Dust PM10 Exhaust PM10 PM2.5 Dust PM2.5 Exhaust PM2.5 CO2
2010 0.15 1.30 0.68 0.00 0.31 0.06 0.38 0.07 0.06 0.12 131.50
Demolition 10/01/2010-10/19/2010 0.01 0.06 0.04 0.00 0.01 0.00 0.02 0.00 0.00 0.01 7.02
Fugitive Dust 0.00 0.00 0.00 0.00 0.01 0.00 0.01 0.00 0.00 0.00 0.00
Demo Off Road Diesel 0.01 0.05 0.03 0.00 0.00 0.00 0.00 0.00 0.00 0.00 4.55
Demo On Road Diesel 0.00 0.01 0.00 0.00 0.00 0.00 0.00 0.00 0.00 0.00 1.80
Demo Worker Trips 0.00 0.00 0.01 0.00 0.00 0.00 0.00 0.00 0.00 0.00 0.66
Mass Grading 10/20/2010-
12/31/2010
0.09 0.76 0.39 0.00 0.30 0.04 0.33 0.06 0.03 0.10 76.35
Mass Grading Dust 0.00 0.00 0.00 0.00 0.30 0.00 0.30 0.06 0.00 0.06 0.00
Mass Grading Off Road Diesel 0.08 0.66 0.33 0.00 0.00 0.03 0.03 0.00 0.03 0.03 59.55
Mass Grading On Road Diesel 0.01 0.10 0.03 0.00 0.00 0.00 0.00 0.00 0.00 0.00 14.09
Mass Grading Worker Trips 0.00 0.00 0.03 0.00 0.00 0.00 0.00 0.00 0.00 0.00 2.70
Trenching 10/20/2010-12/31/2010 0.06 0.47 0.25 0.00 0.00 0.02 0.02 0.00 0.02 0.02 48.14
Trenching Off Road Diesel 0.05 0.47 0.22 0.00 0.00 0.02 0.02 0.00 0.02 0.02 45.44
Trenching Worker Trips 0.00 0.00 0.03 0.00 0.00 0.00 0.00 0.00 0.00 0.00 2.70
2011 0.19 1.29 1.83 0.00 0.01 0.08 0.08 0.00 0.07 0.07 249.49
Building 01/01/2011-06/30/2013 0.19 1.29 1.83 0.00 0.01 0.08 0.08 0.00 0.07 0.07 249.49
Building Off Road Diesel 0.14 1.11 0.61 0.00 0.00 0.07 0.07 0.00 0.06 0.06 116.14
Building Vendor Trips 0.01 0.12 0.10 0.00 0.00 0.00 0.01 0.00 0.00 0.00 26.45
Building Worker Trips 0.04 0.06 1.12 0.00 0.01 0.00 0.01 0.00 0.00 0.00 106.90
2012 0.18 1.19 1.73 0.00 0.01 0.07 0.08 0.00 0.06 0.07 250.51
Building 01/01/2011-06/30/2013 0.18 1.19 1.73 0.00 0.01 0.07 0.08 0.00 0.06 0.07 250.51
Building Off Road Diesel 0.13 1.03 0.60 0.00 0.00 0.06 0.06 0.00 0.06 0.06 116.59
Building Vendor Trips 0.01 0.11 0.09 0.00 0.00 0.00 0.00 0.00 0.00 0.00 26.55
Building Worker Trips 0.03 0.06 1.04 0.00 0.01 0.00 0.01 0.00 0.00 0.00 107.38

Page: 1
3/31/2010 11:56:52 AM
2013 1.51 0.99 1.17 0.00 0.00 0.07 0.07 0.00 0.06 0.06 174.24
Building 01/01/2011-06/30/2013 0.08 0.54 0.81 0.00 0.00 0.03 0.03 0.00 0.03 0.03 123.85
Building Off Road Diesel 0.06 0.47 0.29 0.00 0.00 0.03 0.03 0.00 0.03 0.03 57.62
Building Vendor Trips 0.00 0.05 0.04 0.00 0.00 0.00 0.00 0.00 0.00 0.00 13.12
Building Worker Trips 0.01 0.03 0.47 0.00 0.00 0.00 0.00 0.00 0.00 0.00 53.10
Asphalt 04/01/2013-06/30/2013 0.08 0.45 0.35 0.00 0.00 0.04 0.04 0.00 0.03 0.03 48.79
Paving Off-Gas 0.00 0.00 0.00 0.00 0.00 0.00 0.00 0.00 0.00 0.00 0.00
Paving Off Road Diesel 0.07 0.44 0.29 0.00 0.00 0.04 0.04 0.00 0.03 0.03 41.34
Paving On Road Diesel 0.00 0.00 0.00 0.00 0.00 0.00 0.00 0.00 0.00 0.00 0.81
Paving Worker Trips 0.00 0.00 0.06 0.00 0.00 0.00 0.00 0.00 0.00 0.00 6.64
Coating 04/01/2013-06/30/2013 1.35 0.00 0.01 0.00 0.00 0.00 0.00 0.00 0.00 0.00 1.61
Architectural Coating 1.35 0.00 0.00 0.00 0.00 0.00 0.00 0.00 0.00 0.00 0.00
Coating Worker Trips 0.00 0.00 0.01 0.00 0.00 0.00 0.00 0.00 0.00 0.00 1.61
Phase Assumptions
Phase: Demolition 10/1/2010 - 10/19/2010 - Type Your Description Here
Building Volume Total (cubic feet): 69326.88
Building Volume Daily (cubic feet): 4956.16
On Road Truck Travel (VMT): 68.84
Off-Road Equipment:
1 Concrete/Industrial Saws (10 hp) operating at a 0.73 load factor for 8 hours per day
1 Rubber Tired Dozers (357 hp) operating at a 0.59 load factor for 1 hours per day
2 Tractors/Loaders/Backhoes (108 hp) operating at a 0.55 load factor for 6 hours per day
Phase: Mass Grading 10/20/2010 - 12/31/2010 - Default Fine Site Grading Description
Total Acres Disturbed: 2.25
Maximum Daily Acreage Disturbed: 0.56
Fugitive Dust Level of Detail: Default
20 lbs per acre-day
On Road Truck Travel (VMT): 132.08
Off-Road Equipment:
1 Graders (174 hp) operating at a 0.61 load factor for 6 hours per day
1 Rubber Tired Dozers (357 hp) operating at a 0.59 load factor for 6 hours per day
1 Tractors/Loaders/Backhoes (108 hp) operating at a 0.55 load factor for 7 hours per day
1 Water Trucks (189 hp) operating at a 0.5 load factor for 8 hours per day

Page: 1
3/31/2010 11:56:52 AM
Phase: Trenching 10/20/2010 - 12/31/2010 - Type Your Description Here
Off-Road Equipment:
2 Excavators (168 hp) operating at a 0.57 load factor for 8 hours per day
1 Other General Industrial Equipment (238 hp) operating at a 0.51 load factor for 8 hours per day
1 Tractors/Loaders/Backhoes (108 hp) operating at a 0.55 load factor for 0 hours per day
Phase: Paving 4/1/2013 - 6/30/2013 - Default Paving Description
Acres to be Paved: 1.36
Off-Road Equipment:
4 Cement and Mortar Mixers (10 hp) operating at a 0.56 load factor for 6 hours per day
1 Pavers (100 hp) operating at a 0.62 load factor for 7 hours per day
1 Paving Equipment (104 hp) operating at a 0.53 load factor for 8 hours per day
1 Rollers (95 hp) operating at a 0.56 load factor for 7 hours per day
1 Tractors/Loaders/Backhoes (108 hp) operating at a 0.55 load factor for 7 hours per day
Phase: Building Construction 1/1/2011 - 6/30/2013 - Default Building Construction Description
Off-Road Equipment:
1 Cranes (399 hp) operating at a 0.43 load factor for 4 hours per day
2 Forklifts (145 hp) operating at a 0.3 load factor for 6 hours per day
1 Tractors/Loaders/Backhoes (108 hp) operating at a 0.55 load factor for 8 hours per day
Phase: Architectural Coating 4/1/2013 - 6/30/2013 - Default Architectural Coating Description
Rule: Residential Interior Coatings begins 1/1/2005 ends 12/31/2040 specifies a VOC of 250
Rule: Residential Exterior Coatings begins 1/1/2005 ends 12/31/2040 specifies a VOC of 250
Rule: Nonresidential Interior Coatings begins 1/1/2005 ends 12/31/2040 specifies a VOC of 250
Rule: Nonresidential Exterior Coatings begins 1/1/2005 ends 12/31/2040 specifies a VOC of 250

Page: 1
3/31/2010 11:56:52 AM
Construction Mitigated Detail Report:
CONSTRUCTION EMISSION ESTIMATES Annual Tons Per Year, Mitigated
ROG NOx CO SO2 PM10 Dust PM10 Exhaust PM10 PM2.5 Dust PM2.5 Exhaust PM2.5 CO2
2010 0.15 1.30 0.68 0.00 0.14 0.06 0.20 0.03 0.06 0.09 131.50
Demolition 10/01/2010-10/19/2010 0.01 0.06 0.04 0.00 0.01 0.00 0.02 0.00 0.00 0.01 7.02
Fugitive Dust 0.00 0.00 0.00 0.00 0.01 0.00 0.01 0.00 0.00 0.00 0.00
Demo Off Road Diesel 0.01 0.05 0.03 0.00 0.00 0.00 0.00 0.00 0.00 0.00 4.55
Demo On Road Diesel 0.00 0.01 0.00 0.00 0.00 0.00 0.00 0.00 0.00 0.00 1.80
Demo Worker Trips 0.00 0.00 0.01 0.00 0.00 0.00 0.00 0.00 0.00 0.00 0.66
Mass Grading 10/20/2010-
12/31/2010
0.09 0.76 0.39 0.00 0.12 0.04 0.16 0.03 0.03 0.06 76.35
Mass Grading Dust 0.00 0.00 0.00 0.00 0.12 0.00 0.12 0.03 0.00 0.03 0.00
Mass Grading Off Road Diesel 0.08 0.66 0.33 0.00 0.00 0.03 0.03 0.00 0.03 0.03 59.55
Mass Grading On Road Diesel 0.01 0.10 0.03 0.00 0.00 0.00 0.00 0.00 0.00 0.00 14.09
Mass Grading Worker Trips 0.00 0.00 0.03 0.00 0.00 0.00 0.00 0.00 0.00 0.00 2.70
Trenching 10/20/2010-12/31/2010 0.06 0.47 0.25 0.00 0.00 0.02 0.02 0.00 0.02 0.02 48.14
Trenching Off Road Diesel 0.05 0.47 0.22 0.00 0.00 0.02 0.02 0.00 0.02 0.02 45.44
Trenching Worker Trips 0.00 0.00 0.03 0.00 0.00 0.00 0.00 0.00 0.00 0.00 2.70
2011 0.19 1.29 1.83 0.00 0.01 0.08 0.08 0.00 0.07 0.07 249.49
Building 01/01/2011-06/30/2013 0.19 1.29 1.83 0.00 0.01 0.08 0.08 0.00 0.07 0.07 249.49
Building Off Road Diesel 0.14 1.11 0.61 0.00 0.00 0.07 0.07 0.00 0.06 0.06 116.14
Building Vendor Trips 0.01 0.12 0.10 0.00 0.00 0.00 0.01 0.00 0.00 0.00 26.45
Building Worker Trips 0.04 0.06 1.12 0.00 0.01 0.00 0.01 0.00 0.00 0.00 106.90
2012 0.18 1.19 1.73 0.00 0.01 0.07 0.08 0.00 0.06 0.07 250.51
Building 01/01/2011-06/30/2013 0.18 1.19 1.73 0.00 0.01 0.07 0.08 0.00 0.06 0.07 250.51
Building Off Road Diesel 0.13 1.03 0.60 0.00 0.00 0.06 0.06 0.00 0.06 0.06 116.59
Building Vendor Trips 0.01 0.11 0.09 0.00 0.00 0.00 0.00 0.00 0.00 0.00 26.55
Building Worker Trips 0.03 0.06 1.04 0.00 0.01 0.00 0.01 0.00 0.00 0.00 107.38

Page: 1
3/31/2010 11:56:52 AM
2013 1.51 0.99 1.17 0.00 0.00 0.07 0.07 0.00 0.06 0.06 174.24
Building 01/01/2011-06/30/2013 0.08 0.54 0.81 0.00 0.00 0.03 0.03 0.00 0.03 0.03 123.85
Building Off Road Diesel 0.06 0.47 0.29 0.00 0.00 0.03 0.03 0.00 0.03 0.03 57.62
Building Vendor Trips 0.00 0.05 0.04 0.00 0.00 0.00 0.00 0.00 0.00 0.00 13.12
Building Worker Trips 0.01 0.03 0.47 0.00 0.00 0.00 0.00 0.00 0.00 0.00 53.10
Asphalt 04/01/2013-06/30/2013 0.08 0.45 0.35 0.00 0.00 0.04 0.04 0.00 0.03 0.03 48.79
Paving Off-Gas 0.00 0.00 0.00 0.00 0.00 0.00 0.00 0.00 0.00 0.00 0.00
Paving Off Road Diesel 0.07 0.44 0.29 0.00 0.00 0.04 0.04 0.00 0.03 0.03 41.34
Paving On Road Diesel 0.00 0.00 0.00 0.00 0.00 0.00 0.00 0.00 0.00 0.00 0.81
Paving Worker Trips 0.00 0.00 0.06 0.00 0.00 0.00 0.00 0.00 0.00 0.00 6.64
Coating 04/01/2013-06/30/2013 1.35 0.00 0.01 0.00 0.00 0.00 0.00 0.00 0.00 0.00 1.61
Architectural Coating 1.35 0.00 0.00 0.00 0.00 0.00 0.00 0.00 0.00 0.00 0.00
Coating Worker Trips 0.00 0.00 0.01 0.00 0.00 0.00 0.00 0.00 0.00 0.00 1.61
Construction Related Mitigation Measures
The following mitigation measures apply to Phase: Mass Grading 10/20/2010 - 12/31/2010 - Default Fine Site Grading Description
For Soil Stablizing Measures, the Water exposed surfaces 2x daily watering mitigation reduces emissions by:
PM10: 55% PM25: 55%
For Unpaved Roads Measures, the Reduce speed on unpaved roads to less than 15 mph mitigation reduces emissions by:
PM10: 44% PM25: 44%
For Unpaved Roads Measures, the Manage haul road dust 2x daily watering mitigation reduces emissions by:
PM10: 55% PM25: 55%
Area Source Unmitigated Detail Report:
AREA SOURCE EMISSION ESTIMATES Annual Tons Per Year, Unmitigated
Source ROG NOx CO SO2 PM10 PM2.5 CO2
Natural Gas 0.01 0.15 0.13 0.00 0.00 0.00 183.96
Hearth
Landscape 0.01 0.00 0.14 0.00 0.00 0.00 0.25
Consumer Products 0.00
Architectural Coatings 0.13
Area Source Changes to Defaults
0.00 0.00 0.00 184.21TOTALS (tons/year, unmitigated) 0.15 0.15 0.27

Page: 12/23/2010 01:27:50 PM
0.00 0.84 0.16 456.03TOTALS (tons/year, unmitigated) 0.52 0.49 4.63
0.00 0.84 0.16 456.03R&D Center 0.52 0.49 4.63
Operational Unmitigated Detail Report:
OPERATIONAL EMISSION ESTIMATES Annual Tons Per Year, Unmitigated
Source ROG NOX CO SO2 PM10 PM25 CO2
0.00 0.84 0.16 456.03TOTALS (tons/year, unmitigated) 0.52 0.49 4.63
SUM OF AREA SOURCE AND OPERATIONAL EMISSION ESTIMATES
ROG NOx CO SO2 PM10 PM2.5 CO2
0.00 0.84 0.16 456.03TOTALS (tons/year, unmitigated) 0.52 0.49 4.63
ROG NOx CO SO2 PM10 PM2.5 CO2
OPERATIONAL (VEHICLE) EMISSION ESTIMATES
Project Location: Bay Area Air District
On-Road Vehicle Emissions Based on: Version : Emfac2007 V2.3 Nov 1 2006
Off-Road Vehicle Emissions Based on: OFFROAD2007
Summary Report:
Urbemis 2007 Version 9.2.4
Combined Annual Emissions Reports (Tons/Year)
File Name: Z:\Alan Sako\924.06 CRT\Emissions\Alt 1\CRT Alt 1 - Operational.urb924
Project Name: CRT Alternative 1 - Operations

Page: 12/23/2010 01:27:50 PM
16.7Motor Home 0.6 0.0 83.3
0.0
School Bus 0.1 0.0 0.0 100.0
Motorcycle 3.2 56.2 43.8
100.0
Urban Bus 0.1 0.0 0.0 100.0
Other Bus 0.1 0.0 0.0
80.0
Heavy-Heavy Truck 33,001-60,000 lbs 0.4 0.0 0.0 100.0
Med-Heavy Truck 14,001-33,000 lbs 1.0 0.0 20.0
22.2
Lite-Heavy Truck 10,001-14,000 lbs 0.6 0.0 50.0 50.0
Lite-Heavy Truck 8501-10,000 lbs 0.9 0.0 77.8
0.0
Med Truck 5751-8500 lbs 6.6 0.0 100.0 0.0
Light Truck 3751-5750 lbs 19.9 0.5 99.5
0.2
Light Truck < 3750 lbs 12.8 0.8 96.9 2.3
Light Auto 53.7 0.6 99.2
Vehicle Fleet Mix
Vehicle Type Percent Type Non-Catalyst Catalyst Diesel
135.00 373.95 2,677.95
373.95 2,677.95
R&D Center 2.77 unknown
Emfac: Version : Emfac2007 V2.3 Nov 1 2006
Summary of Land Uses
Land Use Type Acreage Trip Rate Unit Type No. Units Total Trips Total VMT
Operational Settings:
Includes correction for passby trips
Does not include double counting adjustment for internal trips
Analysis Year: 2013 Season: Annual

Page: 12/23/2010 01:27:50 PM
R&D Center 50.0 25.0 25.0
% of Trips - Commercial (by land use)
% of Trips - Residential 32.9 18.0 49.1
14.7 6.6 6.6
Trip speeds (mph) 35.0 35.0 35.0 35.0 35.0 35.0
Rural Trip Length (miles) 16.8 7.1 7.9
Commute Non-Work Customer
Urban Trip Length (miles) 10.8 7.3 7.5 9.5 7.4 7.4
Home-Work Home-Shop Home-Other
Travel Conditions
Residential Commercial

0.00 0.01 0.01TOTALS (lbs/day, unmitigated) 0.92 0.86 2.26
SUM OF AREA SOURCE AND OPERATIONAL EMISSION ESTIMATES
ROG NOx CO SO2 PM10 PM2.5
SO2 PM10 PM2.5
TOTALS (lbs/day, unmitigated) 0.92 0.86 2.26 0.00 0.01 0.01
ROG NOx CO
0.02 1.50 1.52
AREA SOURCE EMISSION ESTIMATES
0.01 0.06 1.63 1.692013 TOTALS (lbs/day mitigated) 45.09 22.26 23.70
1.69 0.02 1.50 1.522013 TOTALS (lbs/day unmitigated) 45.09 22.26 23.70 0.01 0.06 1.63
0.58 0.02 0.49 0.51
0.02 0.49 0.51
2012 TOTALS (lbs/day mitigated) 1.35 9.12 13.24 0.01 0.05 0.54
0.01 0.05 0.54 0.582012 TOTALS (lbs/day unmitigated) 1.35 9.12 13.24
0.02 0.55 0.560.01 0.05 0.60 0.652011 TOTALS (lbs/day mitigated) 1.46 9.90 14.07
0.65 0.02 0.55 0.562011 TOTALS (lbs/day unmitigated) 1.46 9.90 14.07 0.01 0.05 0.60
8.80 1.37 2.06 3.43
3.35 2.06 5.41
2010 TOTALS (lbs/day mitigated) 5.32 45.81 23.95 0.01 6.56 2.24
0.01 16.02 2.24 18.262010 TOTALS (lbs/day unmitigated) 5.32 45.81 23.95
PM10 PM2.5 Dust PM2.5 Exhaust PM2.5
Off-Road Vehicle Emissions Based on: OFFROAD2007
Summary Report:
CONSTRUCTION EMISSION ESTIMATES
ROG NOx CO SO2 PM10 Dust PM10 Exhaust
File Name: Z:\Alan Sako\924.06 CRT\Emissions\Alt 2\CRT Alt 2 - Const Area.urb924
Project Name: CRT Alternative 2 - Construction and Area Source
Project Location: Bay Area Air District
On-Road Vehicle Emissions Based on: Version : Emfac2007 V2.3 Nov 1 2006
Page: 1
3/31/2010 11:59:10 AM
Urbemis 2007 Version 9.2.4
Combined Summer Emissions Reports (Pounds/Day)

Page: 1
3/31/2010 11:59:10 AM
0.06 0.01 0.02 0.03
0.00 0.02 0.03
Building Worker Trips 0.23 0.40 7.33 0.01 0.04 0.02
0.00 0.01 0.03 0.03Building Vendor Trips 0.06 0.72 0.67
0.43 0.00 0.39 0.39
0.02 0.43 0.45
Building Off Road Diesel 0.95 7.29 4.48 0.00 0.00 0.43
0.01 0.05 0.48 0.52Building 01/01/2011-06/30/2013 1.24 8.41 12.48
0.52 0.02 0.43 0.45
0.01 0.02 0.03
Time Slice 1/1/2013-3/29/2013 Active
Days: 64
1.24 8.41 12.48 0.01 0.05 0.48
0.01 0.04 0.02 0.06Building Worker Trips 0.25 0.44 7.96
0.04 0.00 0.03 0.03
0.00 0.45 0.45
Building Vendor Trips 0.06 0.81 0.72 0.00 0.01 0.03
0.00 0.00 0.49 0.49Building Off Road Diesel 1.03 7.87 4.56
0.58 0.02 0.49 0.51
0.02 0.49 0.51
Building 01/01/2011-06/30/2013 1.35 9.12 13.24 0.01 0.05 0.54
0.01 0.05 0.54 0.58Time Slice 1/2/2012-12/31/2012 Active
Days: 261
1.35 9.12 13.24
0.06 0.01 0.02 0.03
0.00 0.03 0.03
Building Worker Trips 0.28 0.48 8.63 0.01 0.04 0.02
0.00 0.01 0.03 0.04Building Vendor Trips 0.07 0.91 0.77
0.54 0.00 0.50 0.50
0.02 0.55 0.56
Building Off Road Diesel 1.11 8.51 4.68 0.00 0.00 0.54
0.01 0.05 0.60 0.65Building 01/01/2011-06/30/2013 1.46 9.90 14.07
0.65 0.02 0.55 0.56
0.00 0.00 0.00
Time Slice 1/3/2011-12/30/2011 Active
Days: 260
1.46 9.90 14.07 0.01 0.05 0.60
0.00 0.00 0.00 0.01Trenching Worker Trips 0.04 0.07 1.16
0.88 0.00 0.81 0.81
0.00 0.81 0.81
Trenching Off Road Diesel 2.06 17.69 8.22 0.00 0.00 0.88
0.00 0.00 0.88 0.88Trenching 10/01/2010-12/31/2010 2.10 17.75 9.37
0.01 0.00 0.00 0.00
0.00 0.10 0.11
Mass Grading Worker Trips 0.04 0.07 1.16 0.00 0.00 0.00
0.00 0.01 0.11 0.12Mass Grading On Road Diesel 0.19 3.00 0.95
1.25 0.00 1.15 1.15
3.34 0.00 3.34
Mass Grading Off Road Diesel 3.00 24.99 12.46 0.00 0.00 1.25
0.00 16.00 0.00 16.00Mass Grading Dust 0.00 0.00 0.00
17.38 3.35 1.25 4.60
3.35 2.06 5.41
Mass Grading 10/01/2010-
12/31/2010
3.23 28.05 14.57 0.00 16.02 1.36
PM2.5 Exhaust PM2.5
Time Slice 10/1/2010-12/31/2010
Active Days: 66
5.32 45.81 23.95 0.01 16.02 2.24 18.26
CONSTRUCTION EMISSION ESTIMATES Summer Pounds Per Day, Unmitigated
ROG NOx CO SO2 PM10 Dust PM10 Exhaust PM10 PM2.5 Dust
Construction Unmitigated Detail Report:

Page: 1
3/31/2010 11:59:10 AM
1 Tractors/Loaders/Backhoes (108 hp) operating at a 0.55 load factor for 0 hours per day
Phase: Trenching 10/1/2010 - 12/31/2010 - Type Your Description Here
Off-Road Equipment:
2 Excavators (168 hp) operating at a 0.57 load factor for 8 hours per day
1 Other General Industrial Equipment (238 hp) operating at a 0.51 load factor for 8 hours per day
1 Rubber Tired Dozers (357 hp) operating at a 0.59 load factor for 6 hours per day
1 Tractors/Loaders/Backhoes (108 hp) operating at a 0.55 load factor for 7 hours per day
1 Water Trucks (189 hp) operating at a 0.5 load factor for 8 hours per day
20 lbs per acre-day
On Road Truck Travel (VMT): 106.06
Off-Road Equipment:
1 Graders (174 hp) operating at a 0.61 load factor for 6 hours per day
Phase: Mass Grading 10/1/2010 - 12/31/2010 - Default Fine Site Grading Description
Total Acres Disturbed: 3.2
Maximum Daily Acreage Disturbed: 0.8
Fugitive Dust Level of Detail: Default
0.00 0.00 0.00
Phase Assumptions
0.00 0.00 0.00 0.00Coating Worker Trips 0.01 0.02 0.44
0.00 0.00 0.00 0.00
0.00 0.00 0.00
Architectural Coating 41.52 0.00 0.00 0.00 0.00 0.00
0.00 0.00 0.00 0.00Coating 04/01/2013-06/30/2013 41.54 0.02 0.44
0.06 0.01 0.02 0.03
0.00 0.02 0.03
Building Worker Trips 0.23 0.40 7.33 0.01 0.04 0.02
0.00 0.01 0.03 0.03Building Vendor Trips 0.06 0.72 0.67
0.43 0.00 0.39 0.39
0.02 0.43 0.45
Building Off Road Diesel 0.95 7.29 4.48 0.00 0.00 0.43
0.01 0.05 0.48 0.52Building 01/01/2011-06/30/2013 1.24 8.41 12.48
0.02 0.00 0.00 0.01
0.00 0.00 0.00
Paving Worker Trips 0.06 0.10 1.82 0.00 0.01 0.01
0.00 0.00 0.00 0.01Paving On Road Diesel 0.01 0.12 0.04
1.15 0.00 1.05 1.05
0.00 0.00 0.00
Paving Off Road Diesel 2.19 13.60 8.91 0.00 0.00 1.15
0.00 0.00 0.00 0.00Paving Off-Gas 0.05 0.00 0.00
1.17 0.00 1.06 1.07
0.02 1.50 1.52
Asphalt 04/01/2013-06/30/2013 2.31 13.82 10.78 0.00 0.01 1.16
0.01 0.06 1.63 1.69Time Slice 4/1/2013-6/28/2013 Active
Days: 65
45.09 22.26 23.70

Page: 1
3/31/2010 11:59:10 AM
0.00 0.00 0.000.00 0.00 0.00 0.01Trenching Worker Trips 0.04 0.07 1.16
0.88 0.00 0.81 0.81
0.00 0.81 0.81
Trenching Off Road Diesel 2.06 17.69 8.22 0.00 0.00 0.88
0.00 0.00 0.88 0.88Trenching 10/01/2010-12/31/2010 2.10 17.75 9.37
0.01 0.00 0.00 0.00
0.00 0.10 0.11
Mass Grading Worker Trips 0.04 0.07 1.16 0.00 0.00 0.00
0.00 0.01 0.11 0.12Mass Grading On Road Diesel 0.19 3.00 0.95
1.25 0.00 1.15 1.15
1.36 0.00 1.36
Mass Grading Off Road Diesel 3.00 24.99 12.46 0.00 0.00 1.25
0.00 6.53 0.00 6.53Mass Grading Dust 0.00 0.00 0.00
7.92 1.37 1.25 2.62
1.37 2.06 3.43
Mass Grading 10/01/2010-
12/31/2010
3.23 28.05 14.57 0.00 6.55 1.36
PM2.5 Exhaust PM2.5
Time Slice 10/1/2010-12/31/2010
Active Days: 66
5.32 45.81 23.95 0.01 6.56 2.24 8.80
CONSTRUCTION EMISSION ESTIMATES Summer Pounds Per Day, Mitigated
ROG NOx CO SO2 PM10 Dust PM10 Exhaust PM10 PM2.5 Dust
Rule: Nonresidential Interior Coatings begins 1/1/2005 ends 12/31/2040 specifies a VOC of 250
Rule: Nonresidential Exterior Coatings begins 1/1/2005 ends 12/31/2040 specifies a VOC of 250
Construction Mitigated Detail Report:
Phase: Architectural Coating 4/1/2013 - 6/30/2013 - Default Architectural Coating Description
Rule: Residential Interior Coatings begins 1/1/2005 ends 12/31/2040 specifies a VOC of 250
Rule: Residential Exterior Coatings begins 1/1/2005 ends 12/31/2040 specifies a VOC of 250
Off-Road Equipment:
1 Cranes (399 hp) operating at a 0.43 load factor for 4 hours per day
2 Forklifts (145 hp) operating at a 0.3 load factor for 6 hours per day
1 Tractors/Loaders/Backhoes (108 hp) operating at a 0.55 load factor for 8 hours per day
1 Rollers (95 hp) operating at a 0.56 load factor for 7 hours per day
1 Tractors/Loaders/Backhoes (108 hp) operating at a 0.55 load factor for 7 hours per day
Phase: Building Construction 1/1/2011 - 6/30/2013 - Default Building Construction Description
Off-Road Equipment:
4 Cement and Mortar Mixers (10 hp) operating at a 0.56 load factor for 6 hours per day
1 Pavers (100 hp) operating at a 0.62 load factor for 7 hours per day
1 Paving Equipment (104 hp) operating at a 0.53 load factor for 8 hours per day
Phase: Paving 4/1/2013 - 6/30/2013 - Default Paving Description
Acres to be Paved: 1.36

Page: 1
3/31/2010 11:59:10 AM
0.00 0.00 0.000.00 0.00 0.00 0.00Coating Worker Trips 0.01 0.02 0.44
0.00 0.00 0.00 0.00
0.00 0.00 0.00
Architectural Coating 41.52 0.00 0.00 0.00 0.00 0.00
0.00 0.00 0.00 0.00Coating 04/01/2013-06/30/2013 41.54 0.02 0.44
0.06 0.01 0.02 0.03
0.00 0.02 0.03
Building Worker Trips 0.23 0.40 7.33 0.01 0.04 0.02
0.00 0.01 0.03 0.03Building Vendor Trips 0.06 0.72 0.67
0.43 0.00 0.39 0.39
0.02 0.43 0.45
Building Off Road Diesel 0.95 7.29 4.48 0.00 0.00 0.43
0.01 0.05 0.48 0.52Building 01/01/2011-06/30/2013 1.24 8.41 12.48
0.02 0.00 0.00 0.01
0.00 0.00 0.00
Paving Worker Trips 0.06 0.10 1.82 0.00 0.01 0.01
0.00 0.00 0.00 0.01Paving On Road Diesel 0.01 0.12 0.04
1.15 0.00 1.05 1.05
0.00 0.00 0.00
Paving Off Road Diesel 2.19 13.60 8.91 0.00 0.00 1.15
0.00 0.00 0.00 0.00Paving Off-Gas 0.05 0.00 0.00
1.17 0.00 1.06 1.07
0.02 1.50 1.52
Asphalt 04/01/2013-06/30/2013 2.31 13.82 10.78 0.00 0.01 1.16
0.01 0.06 1.63 1.69Time Slice 4/1/2013-6/28/2013 Active
Days: 65
45.09 22.26 23.70
0.06 0.01 0.02 0.03
0.00 0.02 0.03
Building Worker Trips 0.23 0.40 7.33 0.01 0.04 0.02
0.00 0.01 0.03 0.03Building Vendor Trips 0.06 0.72 0.67
0.43 0.00 0.39 0.39
0.02 0.43 0.45
Building Off Road Diesel 0.95 7.29 4.48 0.00 0.00 0.43
0.01 0.05 0.48 0.52Building 01/01/2011-06/30/2013 1.24 8.41 12.48
0.52 0.02 0.43 0.45
0.01 0.02 0.03
Time Slice 1/1/2013-3/29/2013 Active
Days: 64
1.24 8.41 12.48 0.01 0.05 0.48
0.01 0.04 0.02 0.06Building Worker Trips 0.25 0.44 7.96
0.04 0.00 0.03 0.03
0.00 0.45 0.45
Building Vendor Trips 0.06 0.81 0.72 0.00 0.01 0.03
0.00 0.00 0.49 0.49Building Off Road Diesel 1.03 7.87 4.56
0.58 0.02 0.49 0.51
0.02 0.49 0.51
Building 01/01/2011-06/30/2013 1.35 9.12 13.24 0.01 0.05 0.54
0.01 0.05 0.54 0.58Time Slice 1/2/2012-12/31/2012 Active
Days: 261
1.35 9.12 13.24
0.06 0.01 0.02 0.03
0.00 0.03 0.03
Building Worker Trips 0.28 0.48 8.63 0.01 0.04 0.02
0.00 0.01 0.03 0.04Building Vendor Trips 0.07 0.91 0.77
0.54 0.00 0.50 0.50
0.02 0.55 0.56
Building Off Road Diesel 1.11 8.51 4.68 0.00 0.00 0.54
0.01 0.05 0.60 0.65Building 01/01/2011-06/30/2013 1.46 9.90 14.07
0.65 0.02 0.55 0.56Time Slice 1/3/2011-12/30/2011 Active
Days: 260
1.46 9.90 14.07 0.01 0.05 0.60

Page: 1
3/31/2010 11:59:10 AM
Area Source Changes to Defaults
TOTALS (lbs/day, unmitigated) 0.92 0.86 2.26 0.00 0.01 0.01
Architectural Coatings 0.74
0.00 0.01 0.01
Consumer Products 0.00
Landscape 0.12 0.02 1.55
0.00 0.00 0.00
Hearth
Natural Gas 0.06 0.84 0.71
AREA SOURCE EMISSION ESTIMATES Summer Pounds Per Day, Unmitigated
Source ROG NOx CO SO2 PM10 PM2.5
PM10: 44% PM25: 44%
For Unpaved Roads Measures, the Manage haul road dust 2x daily watering mitigation reduces emissions by:
PM10: 55% PM25: 55%
Area Source Unmitigated Detail Report:
The following mitigation measures apply to Phase: Mass Grading 10/1/2010 - 12/31/2010 - Default Fine Site Grading Description
For Soil Stablizing Measures, the Water exposed surfaces 2x daily watering mitigation reduces emissions by:
PM10: 55% PM25: 55%
For Unpaved Roads Measures, the Reduce speed on unpaved roads to less than 15 mph mitigation reduces emissions by:
Construction Related Mitigation Measures

Page: 12/23/2010 01:47:26 PM
0.06 10.22 1.95
TOTALS (lbs/day, unmitigated) 6.96 5.18 55.27 0.06 10.22 1.95
R&D Center 6.96 5.18 55.27
OPERATIONAL EMISSION ESTIMATES Summer Pounds Per Day, Unmitigated
Source ROG NOX CO SO2 PM10 PM25
0.06 10.22 1.95
Operational Unmitigated Detail Report:
TOTALS (lbs/day, unmitigated) 6.96 5.18 55.27
SUM OF AREA SOURCE AND OPERATIONAL EMISSION ESTIMATES
ROG NOx CO SO2 PM10 PM2.5
SO2 PM10 PM2.5
TOTALS (lbs/day, unmitigated) 6.96 5.18 55.27 0.06 10.22 1.95
ROG NOx CO
OPERATIONAL (VEHICLE) EMISSION ESTIMATES
Project Location: Bay Area Air District
On-Road Vehicle Emissions Based on: Version : Emfac2007 V2.3 Nov 1 2006
Off-Road Vehicle Emissions Based on: OFFROAD2007
Summary Report:
Urbemis 2007 Version 9.2.4
Combined Summer Emissions Reports (Pounds/Day)
File Name: Z:\Alan Sako\924.06 CRT\Emissions\Alt 2\CRT Alt 2 - Operational.urb924
Project Name: CRT Alternative 2 - Operations

Page: 12/23/2010 01:47:26 PM
16.7Motor Home 0.6 0.0 83.3
0.0
School Bus 0.1 0.0 0.0 100.0
Motorcycle 3.2 56.2 43.8
100.0
Urban Bus 0.1 0.0 0.0 100.0
Other Bus 0.1 0.0 0.0
80.0
Heavy-Heavy Truck 33,001-60,000 lbs 0.4 0.0 0.0 100.0
Med-Heavy Truck 14,001-33,000 lbs 1.0 0.0 20.0
22.2
Lite-Heavy Truck 10,001-14,000 lbs 0.6 0.0 50.0 50.0
Lite-Heavy Truck 8501-10,000 lbs 0.9 0.0 77.8
0.0
Med Truck 5751-8500 lbs 6.6 0.0 100.0 0.0
Light Truck 3751-5750 lbs 19.9 0.5 99.5
0.2
Light Truck < 3750 lbs 12.8 0.8 96.9 2.3
Light Auto 53.7 0.6 99.2
Vehicle Fleet Mix
Vehicle Type Percent Type Non-Catalyst Catalyst Diesel
300.00 831.00 5,951.00
831.00 5,951.00
R&D Center 2.77 unknown
Emfac: Version : Emfac2007 V2.3 Nov 1 2006
Summary of Land Uses
Land Use Type Acreage Trip Rate Unit Type No. Units Total Trips Total VMT
Operational Settings:
Includes correction for passby trips
Does not include double counting adjustment for internal trips
Analysis Year: 2013 Temperature (F): 85 Season: Summer

Page: 12/23/2010 01:47:26 PM
R&D Center 50.0 25.0 25.0
% of Trips - Commercial (by land use)
% of Trips - Residential 32.9 18.0 49.1
14.7 6.6 6.6
Trip speeds (mph) 35.0 35.0 35.0 35.0 35.0 35.0
Rural Trip Length (miles) 16.8 7.1 7.9
Commute Non-Work Customer
Urban Trip Length (miles) 10.8 7.3 7.5 9.5 7.4 7.4
Home-Work Home-Shop Home-Other
Travel Conditions
Residential Commercial

0.00 0.00 0.00TOTALS (lbs/day, unmitigated) 0.80 0.84 0.71
SUM OF AREA SOURCE AND OPERATIONAL EMISSION ESTIMATES
ROG NOx CO SO2 PM10 PM2.5
SO2 PM10 PM2.5
TOTALS (lbs/day, unmitigated) 0.80 0.84 0.71 0.00 0.00 0.00
ROG NOx CO
0.02 1.50 1.52
AREA SOURCE EMISSION ESTIMATES
0.01 0.06 1.63 1.692013 TOTALS (lbs/day mitigated) 45.09 22.26 23.70
1.69 0.02 1.50 1.522013 TOTALS (lbs/day unmitigated) 45.09 22.26 23.70 0.01 0.06 1.63
0.58 0.02 0.49 0.51
0.02 0.49 0.51
2012 TOTALS (lbs/day mitigated) 1.35 9.12 13.24 0.01 0.05 0.54
0.01 0.05 0.54 0.582012 TOTALS (lbs/day unmitigated) 1.35 9.12 13.24
0.02 0.55 0.560.01 0.05 0.60 0.652011 TOTALS (lbs/day mitigated) 1.46 9.90 14.07
0.65 0.02 0.55 0.562011 TOTALS (lbs/day unmitigated) 1.46 9.90 14.07 0.01 0.05 0.60
8.80 1.37 2.06 3.43
3.35 2.06 5.41
2010 TOTALS (lbs/day mitigated) 5.32 45.81 23.95 0.01 6.56 2.24
0.01 16.02 2.24 18.262010 TOTALS (lbs/day unmitigated) 5.32 45.81 23.95
PM10 PM2.5 Dust PM2.5 Exhaust PM2.5
Off-Road Vehicle Emissions Based on: OFFROAD2007
Summary Report:
CONSTRUCTION EMISSION ESTIMATES
ROG NOx CO SO2 PM10 Dust PM10 Exhaust
File Name: Z:\Alan Sako\924.06 CRT\Emissions\Alt 2\CRT Alt 2 - Const Area.urb924
Project Name: CRT Alternative 2 - Construction and Area Source
Project Location: Bay Area Air District
On-Road Vehicle Emissions Based on: Version : Emfac2007 V2.3 Nov 1 2006
Page: 1
3/31/2010 11:59:37 AM
Urbemis 2007 Version 9.2.4
Combined Winter Emissions Reports (Pounds/Day)

Page: 1
3/31/2010 11:59:37 AM
0.02 0.00 0.00 0.01
0.00 0.00 0.00
Paving Worker Trips 0.06 0.10 1.82 0.00 0.01 0.01
0.00 0.00 0.00 0.01Paving On Road Diesel 0.01 0.12 0.04
1.15 0.00 1.05 1.05
0.00 0.00 0.00
Paving Off Road Diesel 2.19 13.60 8.91 0.00 0.00 1.15
0.00 0.00 0.00 0.00Paving Off-Gas 0.05 0.00 0.00
1.17 0.00 1.06 1.07
0.02 1.50 1.52
Asphalt 04/01/2013-06/30/2013 2.31 13.82 10.78 0.00 0.01 1.16
0.01 0.06 1.63 1.69Time Slice 4/1/2013-6/28/2013 Active
Days: 65
45.09 22.26 23.70
0.06 0.01 0.02 0.03
0.00 0.02 0.03
Building Worker Trips 0.23 0.40 7.33 0.01 0.04 0.02
0.00 0.01 0.03 0.03Building Vendor Trips 0.06 0.72 0.67
0.43 0.00 0.39 0.39
0.02 0.43 0.45
Building Off Road Diesel 0.95 7.29 4.48 0.00 0.00 0.43
0.01 0.05 0.48 0.52Building 01/01/2011-06/30/2013 1.24 8.41 12.48
0.52 0.02 0.43 0.45
0.01 0.02 0.03
Time Slice 1/1/2013-3/29/2013 Active
Days: 64
1.24 8.41 12.48 0.01 0.05 0.48
0.01 0.04 0.02 0.06Building Worker Trips 0.25 0.44 7.96
0.04 0.00 0.03 0.03
0.00 0.45 0.45
Building Vendor Trips 0.06 0.81 0.72 0.00 0.01 0.03
0.00 0.00 0.49 0.49Building Off Road Diesel 1.03 7.87 4.56
0.58 0.02 0.49 0.51
0.02 0.49 0.51
Building 01/01/2011-06/30/2013 1.35 9.12 13.24 0.01 0.05 0.54
0.01 0.05 0.54 0.58Time Slice 1/2/2012-12/31/2012 Active
Days: 261
1.35 9.12 13.24
0.06 0.01 0.02 0.03
0.00 0.03 0.03
Building Worker Trips 0.28 0.48 8.63 0.01 0.04 0.02
0.00 0.01 0.03 0.04Building Vendor Trips 0.07 0.91 0.77
0.54 0.00 0.50 0.50
0.02 0.55 0.56
Building Off Road Diesel 1.11 8.51 4.68 0.00 0.00 0.54
0.01 0.05 0.60 0.65Building 01/01/2011-06/30/2013 1.46 9.90 14.07
0.65 0.02 0.55 0.56
0.00 0.00 0.00
Time Slice 1/3/2011-12/30/2011 Active
Days: 260
1.46 9.90 14.07 0.01 0.05 0.60
0.00 0.00 0.00 0.01Trenching Worker Trips 0.04 0.07 1.16
0.88 0.00 0.81 0.81
0.00 0.81 0.81
Trenching Off Road Diesel 2.06 17.69 8.22 0.00 0.00 0.88
0.00 0.00 0.88 0.88Trenching 10/01/2010-12/31/2010 2.10 17.75 9.37
0.01 0.00 0.00 0.00
0.00 0.10 0.11
Mass Grading Worker Trips 0.04 0.07 1.16 0.00 0.00 0.00
0.00 0.01 0.11 0.12Mass Grading On Road Diesel 0.19 3.00 0.95
1.25 0.00 1.15 1.15
3.34 0.00 3.34
Mass Grading Off Road Diesel 3.00 24.99 12.46 0.00 0.00 1.25
0.00 16.00 0.00 16.00Mass Grading Dust 0.00 0.00 0.00
17.38 3.35 1.25 4.60
3.35 2.06 5.41
Mass Grading 10/01/2010-
12/31/2010
3.23 28.05 14.57 0.00 16.02 1.36
PM2.5 Exhaust PM2.5
Time Slice 10/1/2010-12/31/2010
Active Days: 66
5.32 45.81 23.95 0.01 16.02 2.24 18.26
CONSTRUCTION EMISSION ESTIMATES Winter Pounds Per Day, Unmitigated
ROG NOx CO SO2 PM10 Dust PM10 Exhaust PM10 PM2.5 Dust
Construction Unmitigated Detail Report:

Page: 1
3/31/2010 11:59:37 AM
Off-Road Equipment:
1 Cranes (399 hp) operating at a 0.43 load factor for 4 hours per day
2 Forklifts (145 hp) operating at a 0.3 load factor for 6 hours per day
1 Tractors/Loaders/Backhoes (108 hp) operating at a 0.55 load factor for 8 hours per day
1 Rollers (95 hp) operating at a 0.56 load factor for 7 hours per day
1 Tractors/Loaders/Backhoes (108 hp) operating at a 0.55 load factor for 7 hours per day
Phase: Building Construction 1/1/2011 - 6/30/2013 - Default Building Construction Description
Off-Road Equipment:
4 Cement and Mortar Mixers (10 hp) operating at a 0.56 load factor for 6 hours per day
1 Pavers (100 hp) operating at a 0.62 load factor for 7 hours per day
1 Paving Equipment (104 hp) operating at a 0.53 load factor for 8 hours per day
1 Tractors/Loaders/Backhoes (108 hp) operating at a 0.55 load factor for 0 hours per day
Phase: Paving 4/1/2013 - 6/30/2013 - Default Paving Description
Acres to be Paved: 1.36
Phase: Trenching 10/1/2010 - 12/31/2010 - Type Your Description Here
Off-Road Equipment:
2 Excavators (168 hp) operating at a 0.57 load factor for 8 hours per day
1 Other General Industrial Equipment (238 hp) operating at a 0.51 load factor for 8 hours per day
1 Rubber Tired Dozers (357 hp) operating at a 0.59 load factor for 6 hours per day
1 Tractors/Loaders/Backhoes (108 hp) operating at a 0.55 load factor for 7 hours per day
1 Water Trucks (189 hp) operating at a 0.5 load factor for 8 hours per day
20 lbs per acre-day
On Road Truck Travel (VMT): 106.06
Off-Road Equipment:
1 Graders (174 hp) operating at a 0.61 load factor for 6 hours per day
Phase: Mass Grading 10/1/2010 - 12/31/2010 - Default Fine Site Grading Description
Total Acres Disturbed: 3.2
Maximum Daily Acreage Disturbed: 0.8
Fugitive Dust Level of Detail: Default
0.00 0.00 0.00
Phase Assumptions
0.00 0.00 0.00 0.00Coating Worker Trips 0.01 0.02 0.44
0.00 0.00 0.00 0.00
0.00 0.00 0.00
Architectural Coating 41.52 0.00 0.00 0.00 0.00 0.00
0.00 0.00 0.00 0.00Coating 04/01/2013-06/30/2013 41.54 0.02 0.44
0.06 0.01 0.02 0.03
0.00 0.02 0.03
Building Worker Trips 0.23 0.40 7.33 0.01 0.04 0.02
0.00 0.01 0.03 0.03Building Vendor Trips 0.06 0.72 0.67
0.43 0.00 0.39 0.39
0.02 0.43 0.45
Building Off Road Diesel 0.95 7.29 4.48 0.00 0.00 0.43
0.01 0.05 0.48 0.52Building 01/01/2011-06/30/2013 1.24 8.41 12.48

Page: 1
3/31/2010 11:59:37 AM
0.06 0.01 0.02 0.03
0.00 0.02 0.03
Building Worker Trips 0.23 0.40 7.33 0.01 0.04 0.02
0.00 0.01 0.03 0.03Building Vendor Trips 0.06 0.72 0.67
0.43 0.00 0.39 0.39
0.02 0.43 0.45
Building Off Road Diesel 0.95 7.29 4.48 0.00 0.00 0.43
0.01 0.05 0.48 0.52Building 01/01/2011-06/30/2013 1.24 8.41 12.48
0.52 0.02 0.43 0.45
0.01 0.02 0.03
Time Slice 1/1/2013-3/29/2013 Active
Days: 64
1.24 8.41 12.48 0.01 0.05 0.48
0.01 0.04 0.02 0.06Building Worker Trips 0.25 0.44 7.96
0.04 0.00 0.03 0.03
0.00 0.45 0.45
Building Vendor Trips 0.06 0.81 0.72 0.00 0.01 0.03
0.00 0.00 0.49 0.49Building Off Road Diesel 1.03 7.87 4.56
0.58 0.02 0.49 0.51
0.02 0.49 0.51
Building 01/01/2011-06/30/2013 1.35 9.12 13.24 0.01 0.05 0.54
0.01 0.05 0.54 0.58Time Slice 1/2/2012-12/31/2012 Active
Days: 261
1.35 9.12 13.24
0.06 0.01 0.02 0.03
0.00 0.03 0.03
Building Worker Trips 0.28 0.48 8.63 0.01 0.04 0.02
0.00 0.01 0.03 0.04Building Vendor Trips 0.07 0.91 0.77
0.54 0.00 0.50 0.50
0.02 0.55 0.56
Building Off Road Diesel 1.11 8.51 4.68 0.00 0.00 0.54
0.01 0.05 0.60 0.65Building 01/01/2011-06/30/2013 1.46 9.90 14.07
0.65 0.02 0.55 0.56
0.00 0.00 0.00
Time Slice 1/3/2011-12/30/2011 Active
Days: 260
1.46 9.90 14.07 0.01 0.05 0.60
0.00 0.00 0.00 0.01Trenching Worker Trips 0.04 0.07 1.16
0.88 0.00 0.81 0.81
0.00 0.81 0.81
Trenching Off Road Diesel 2.06 17.69 8.22 0.00 0.00 0.88
0.00 0.00 0.88 0.88Trenching 10/01/2010-12/31/2010 2.10 17.75 9.37
0.01 0.00 0.00 0.00
0.00 0.10 0.11
Mass Grading Worker Trips 0.04 0.07 1.16 0.00 0.00 0.00
0.00 0.01 0.11 0.12Mass Grading On Road Diesel 0.19 3.00 0.95
1.25 0.00 1.15 1.15
1.36 0.00 1.36
Mass Grading Off Road Diesel 3.00 24.99 12.46 0.00 0.00 1.25
0.00 6.53 0.00 6.53Mass Grading Dust 0.00 0.00 0.00
7.92 1.37 1.25 2.62
1.37 2.06 3.43
Mass Grading 10/01/2010-
12/31/2010
3.23 28.05 14.57 0.00 6.55 1.36
PM2.5 Exhaust PM2.5
Time Slice 10/1/2010-12/31/2010
Active Days: 66
5.32 45.81 23.95 0.01 6.56 2.24 8.80
CONSTRUCTION EMISSION ESTIMATES Winter Pounds Per Day, Mitigated
ROG NOx CO SO2 PM10 Dust PM10 Exhaust PM10 PM2.5 Dust
Rule: Nonresidential Interior Coatings begins 1/1/2005 ends 12/31/2040 specifies a VOC of 250
Rule: Nonresidential Exterior Coatings begins 1/1/2005 ends 12/31/2040 specifies a VOC of 250
Construction Mitigated Detail Report:
Phase: Architectural Coating 4/1/2013 - 6/30/2013 - Default Architectural Coating Description
Rule: Residential Interior Coatings begins 1/1/2005 ends 12/31/2040 specifies a VOC of 250
Rule: Residential Exterior Coatings begins 1/1/2005 ends 12/31/2040 specifies a VOC of 250

Page: 1
3/31/2010 11:59:37 AM
Area Source Changes to Defaults
TOTALS (lbs/day, unmitigated) 0.80 0.84 0.71 0.00 0.00 0.00
Architectural Coatings 0.74
Consumer Products 0.00
Landscaping - No Winter Emissions
0.00 0.00 0.00
Hearth
Natural Gas 0.06 0.84 0.71
AREA SOURCE EMISSION ESTIMATES Winter Pounds Per Day, Unmitigated
Source ROG NOx CO SO2 PM10 PM2.5
PM10: 44% PM25: 44%
For Unpaved Roads Measures, the Manage haul road dust 2x daily watering mitigation reduces emissions by:
PM10: 55% PM25: 55%
Area Source Unmitigated Detail Report:
The following mitigation measures apply to Phase: Mass Grading 10/1/2010 - 12/31/2010 - Default Fine Site Grading Description
For Soil Stablizing Measures, the Water exposed surfaces 2x daily watering mitigation reduces emissions by:
PM10: 55% PM25: 55%
For Unpaved Roads Measures, the Reduce speed on unpaved roads to less than 15 mph mitigation reduces emissions by:
0.00 0.00 0.00
Construction Related Mitigation Measures
0.00 0.00 0.00 0.00Coating Worker Trips 0.01 0.02 0.44
0.00 0.00 0.00 0.00
0.00 0.00 0.00
Architectural Coating 41.52 0.00 0.00 0.00 0.00 0.00
0.00 0.00 0.00 0.00Coating 04/01/2013-06/30/2013 41.54 0.02 0.44
0.06 0.01 0.02 0.03
0.00 0.02 0.03
Building Worker Trips 0.23 0.40 7.33 0.01 0.04 0.02
0.00 0.01 0.03 0.03Building Vendor Trips 0.06 0.72 0.67
0.43 0.00 0.39 0.39
0.02 0.43 0.45
Building Off Road Diesel 0.95 7.29 4.48 0.00 0.00 0.43
0.01 0.05 0.48 0.52Building 01/01/2011-06/30/2013 1.24 8.41 12.48
0.02 0.00 0.00 0.01
0.00 0.00 0.00
Paving Worker Trips 0.06 0.10 1.82 0.00 0.01 0.01
0.00 0.00 0.00 0.01Paving On Road Diesel 0.01 0.12 0.04
1.15 0.00 1.05 1.05
0.00 0.00 0.00
Paving Off Road Diesel 2.19 13.60 8.91 0.00 0.00 1.15
0.00 0.00 0.00 0.00Paving Off-Gas 0.05 0.00 0.00
1.17 0.00 1.06 1.07
0.02 1.50 1.52
Asphalt 04/01/2013-06/30/2013 2.31 13.82 10.78 0.00 0.01 1.16
0.01 0.06 1.63 1.69Time Slice 4/1/2013-6/28/2013 Active
Days: 65
45.09 22.26 23.70

Page: 12/23/2010 01:47:41 PM
0.05 10.22 1.95
TOTALS (lbs/day, unmitigated) 5.17 7.72 58.59 0.05 10.22 1.95
R&D Center 5.17 7.72 58.59
OPERATIONAL EMISSION ESTIMATES Winter Pounds Per Day, Unmitigated
Source ROG NOX CO SO2 PM10 PM25
0.05 10.22 1.95
Operational Unmitigated Detail Report:
TOTALS (lbs/day, unmitigated) 5.17 7.72 58.59
SUM OF AREA SOURCE AND OPERATIONAL EMISSION ESTIMATES
ROG NOx CO SO2 PM10 PM2.5
SO2 PM10 PM2.5
TOTALS (lbs/day, unmitigated) 5.17 7.72 58.59 0.05 10.22 1.95
ROG NOx CO
OPERATIONAL (VEHICLE) EMISSION ESTIMATES
Project Location: Bay Area Air District
On-Road Vehicle Emissions Based on: Version : Emfac2007 V2.3 Nov 1 2006
Off-Road Vehicle Emissions Based on: OFFROAD2007
Summary Report:
Urbemis 2007 Version 9.2.4
Combined Winter Emissions Reports (Pounds/Day)
File Name: Z:\Alan Sako\924.06 CRT\Emissions\Alt 2\CRT Alt 2 - Operational.urb924
Project Name: CRT Alternative 2 - Operations

Page: 12/23/2010 01:47:41 PM
16.7Motor Home 0.6 0.0 83.3
0.0
School Bus 0.1 0.0 0.0 100.0
Motorcycle 3.2 56.2 43.8
100.0
Urban Bus 0.1 0.0 0.0 100.0
Other Bus 0.1 0.0 0.0
80.0
Heavy-Heavy Truck 33,001-60,000 lbs 0.4 0.0 0.0 100.0
Med-Heavy Truck 14,001-33,000 lbs 1.0 0.0 20.0
22.2
Lite-Heavy Truck 10,001-14,000 lbs 0.6 0.0 50.0 50.0
Lite-Heavy Truck 8501-10,000 lbs 0.9 0.0 77.8
0.0
Med Truck 5751-8500 lbs 6.6 0.0 100.0 0.0
Light Truck 3751-5750 lbs 19.9 0.5 99.5
0.2
Light Truck < 3750 lbs 12.8 0.8 96.9 2.3
Light Auto 53.7 0.6 99.2
Vehicle Fleet Mix
Vehicle Type Percent Type Non-Catalyst Catalyst Diesel
300.00 831.00 5,951.00
831.00 5,951.00
R&D Center 2.77 unknown
Emfac: Version : Emfac2007 V2.3 Nov 1 2006
Summary of Land Uses
Land Use Type Acreage Trip Rate Unit Type No. Units Total Trips Total VMT
Operational Settings:
Includes correction for passby trips
Does not include double counting adjustment for internal trips
Analysis Year: 2013 Temperature (F): 40 Season: Winter

Page: 12/23/2010 01:47:41 PM
R&D Center 50.0 25.0 25.0
% of Trips - Commercial (by land use)
% of Trips - Residential 32.9 18.0 49.1
14.7 6.6 6.6
Trip speeds (mph) 35.0 35.0 35.0 35.0 35.0 35.0
Rural Trip Length (miles) 16.8 7.1 7.9
Commute Non-Work Customer
Urban Trip Length (miles) 10.8 7.3 7.5 9.5 7.4 7.4
Home-Work Home-Shop Home-Other
Travel Conditions
Residential Commercial

Page: 1
3/31/2010 11:59:53 AM
Urbemis 2007 Version 9.2.4
Combined Annual Emissions Reports (Tons/Year)
File Name: Z:\Alan Sako\924.06 CRT\Emissions\Alt 2\CRT Alt 2 - Const Area.urb924
Project Name: CRT Alternative 2 - Construction and Area Source
Project Location: Bay Area Air District
On-Road Vehicle Emissions Based on: Version : Emfac2007 V2.3 Nov 1 2006
Off-Road Vehicle Emissions Based on: OFFROAD2007
Summary Report:
CONSTRUCTION EMISSION ESTIMATES
ROG NOx CO SO2 PM10 Dust PM10 Exhaust PM10 PM2.5 Dust PM2.5 Exhaust PM2.5 CO2
2010 TOTALS (tons/year unmitigated) 0.18 1.51 0.79 0.00 0.53 0.07 0.60 0.11 0.07 0.18 151.56
2010 TOTALS (tons/year mitigated) 0.18 1.51 0.79 0.00 0.22 0.07 0.29 0.05 0.07 0.11 151.56
Percent Reduction 0.00 0.00 0.00 0.00 59.07 0.00 51.82 59.01 0.00 36.54 0.00
2011 TOTALS (tons/year unmitigated) 0.19 1.29 1.83 0.00 0.01 0.08 0.08 0.00 0.07 0.07 249.49
2011 TOTALS (tons/year mitigated) 0.19 1.29 1.83 0.00 0.01 0.08 0.08 0.00 0.07 0.07 249.49
Percent Reduction 0.00 0.00 0.00 0.00 0.00 0.00 0.00 0.00 0.00 0.00 0.00
2012 TOTALS (tons/year unmitigated) 0.18 1.19 1.73 0.00 0.01 0.07 0.08 0.00 0.06 0.07 250.51
2012 TOTALS (tons/year mitigated) 0.18 1.19 1.73 0.00 0.01 0.07 0.08 0.00 0.06 0.07 250.51
Percent Reduction 0.00 0.00 0.00 0.00 0.00 0.00 0.00 0.00 0.00 0.00 0.00
2013 TOTALS (tons/year unmitigated) 1.51 0.99 1.17 0.00 0.00 0.07 0.07 0.00 0.06 0.06 174.24
2013 TOTALS (tons/year mitigated) 1.51 0.99 1.17 0.00 0.00 0.07 0.07 0.00 0.06 0.06 174.24
Percent Reduction 0.00 0.00 0.00 0.00 0.00 0.00 0.00 0.00 0.00 0.00 0.00
AREA SOURCE EMISSION ESTIMATES
ROG NOx CO SO2 PM10 PM2.5 CO2
TOTALS (tons/year, unmitigated) 0.15 0.15 0.27 0.00 0.00 0.00 184.21

Page: 1
3/31/2010 11:59:53 AM
SUM OF AREA SOURCE AND OPERATIONAL EMISSION ESTIMATES
ROG NOx CO SO2 PM10 PM2.5 CO2
TOTALS (tons/year, unmitigated) 0.15 0.15 0.27 0.00 0.00 0.00 184.21
Construction Unmitigated Detail Report:
CONSTRUCTION EMISSION ESTIMATES Annual Tons Per Year, Unmitigated
ROG NOx CO SO2 PM10 Dust PM10 Exhaust PM10 PM2.5 Dust PM2.5 Exhaust PM2.5 CO2
2010 0.18 1.51 0.79 0.00 0.53 0.07 0.60 0.11 0.07 0.18 151.56
Mass Grading 10/01/2010-
12/31/2010
0.11 0.93 0.48 0.00 0.53 0.04 0.57 0.11 0.04 0.15 91.62
Mass Grading Dust 0.00 0.00 0.00 0.00 0.53 0.00 0.53 0.11 0.00 0.11 0.00
Mass Grading Off Road Diesel 0.10 0.82 0.41 0.00 0.00 0.04 0.04 0.00 0.04 0.04 74.16
Mass Grading On Road Diesel 0.01 0.10 0.03 0.00 0.00 0.00 0.00 0.00 0.00 0.00 14.09
Mass Grading Worker Trips 0.00 0.00 0.04 0.00 0.00 0.00 0.00 0.00 0.00 0.00 3.36
Trenching 10/01/2010-12/31/2010 0.07 0.59 0.31 0.00 0.00 0.03 0.03 0.00 0.03 0.03 59.95
Trenching Off Road Diesel 0.07 0.58 0.27 0.00 0.00 0.03 0.03 0.00 0.03 0.03 56.58
Trenching Worker Trips 0.00 0.00 0.04 0.00 0.00 0.00 0.00 0.00 0.00 0.00 3.36
2011 0.19 1.29 1.83 0.00 0.01 0.08 0.08 0.00 0.07 0.07 249.49
Building 01/01/2011-06/30/2013 0.19 1.29 1.83 0.00 0.01 0.08 0.08 0.00 0.07 0.07 249.49
Building Off Road Diesel 0.14 1.11 0.61 0.00 0.00 0.07 0.07 0.00 0.06 0.06 116.14
Building Vendor Trips 0.01 0.12 0.10 0.00 0.00 0.00 0.01 0.00 0.00 0.00 26.45
Building Worker Trips 0.04 0.06 1.12 0.00 0.01 0.00 0.01 0.00 0.00 0.00 106.90
2012 0.18 1.19 1.73 0.00 0.01 0.07 0.08 0.00 0.06 0.07 250.51
Building 01/01/2011-06/30/2013 0.18 1.19 1.73 0.00 0.01 0.07 0.08 0.00 0.06 0.07 250.51
Building Off Road Diesel 0.13 1.03 0.60 0.00 0.00 0.06 0.06 0.00 0.06 0.06 116.59
Building Vendor Trips 0.01 0.11 0.09 0.00 0.00 0.00 0.00 0.00 0.00 0.00 26.55
Building Worker Trips 0.03 0.06 1.04 0.00 0.01 0.00 0.01 0.00 0.00 0.00 107.38
2013 1.51 0.99 1.17 0.00 0.00 0.07 0.07 0.00 0.06 0.06 174.24
Building 01/01/2011-06/30/2013 0.08 0.54 0.81 0.00 0.00 0.03 0.03 0.00 0.03 0.03 123.85
Building Off Road Diesel 0.06 0.47 0.29 0.00 0.00 0.03 0.03 0.00 0.03 0.03 57.62
Building Vendor Trips 0.00 0.05 0.04 0.00 0.00 0.00 0.00 0.00 0.00 0.00 13.12
Building Worker Trips 0.01 0.03 0.47 0.00 0.00 0.00 0.00 0.00 0.00 0.00 53.10

Page: 1
3/31/2010 11:59:53 AM
Asphalt 04/01/2013-06/30/2013 0.08 0.45 0.35 0.00 0.00 0.04 0.04 0.00 0.03 0.03 48.79
Paving Off-Gas 0.00 0.00 0.00 0.00 0.00 0.00 0.00 0.00 0.00 0.00 0.00
Paving Off Road Diesel 0.07 0.44 0.29 0.00 0.00 0.04 0.04 0.00 0.03 0.03 41.34
Paving On Road Diesel 0.00 0.00 0.00 0.00 0.00 0.00 0.00 0.00 0.00 0.00 0.81
Paving Worker Trips 0.00 0.00 0.06 0.00 0.00 0.00 0.00 0.00 0.00 0.00 6.64
Coating 04/01/2013-06/30/2013 1.35 0.00 0.01 0.00 0.00 0.00 0.00 0.00 0.00 0.00 1.61
Architectural Coating 1.35 0.00 0.00 0.00 0.00 0.00 0.00 0.00 0.00 0.00 0.00
Coating Worker Trips 0.00 0.00 0.01 0.00 0.00 0.00 0.00 0.00 0.00 0.00 1.61
Phase Assumptions
Phase: Mass Grading 10/1/2010 - 12/31/2010 - Default Fine Site Grading Description
Total Acres Disturbed: 3.2
Maximum Daily Acreage Disturbed: 0.8
Fugitive Dust Level of Detail: Default
20 lbs per acre-day
On Road Truck Travel (VMT): 106.06
Off-Road Equipment:
1 Graders (174 hp) operating at a 0.61 load factor for 6 hours per day
1 Rubber Tired Dozers (357 hp) operating at a 0.59 load factor for 6 hours per day
1 Tractors/Loaders/Backhoes (108 hp) operating at a 0.55 load factor for 7 hours per day
1 Water Trucks (189 hp) operating at a 0.5 load factor for 8 hours per day
Phase: Trenching 10/1/2010 - 12/31/2010 - Type Your Description Here
Off-Road Equipment:
2 Excavators (168 hp) operating at a 0.57 load factor for 8 hours per day
1 Other General Industrial Equipment (238 hp) operating at a 0.51 load factor for 8 hours per day
1 Tractors/Loaders/Backhoes (108 hp) operating at a 0.55 load factor for 0 hours per day
Phase: Paving 4/1/2013 - 6/30/2013 - Default Paving Description
Acres to be Paved: 1.36
Off-Road Equipment:
4 Cement and Mortar Mixers (10 hp) operating at a 0.56 load factor for 6 hours per day
1 Pavers (100 hp) operating at a 0.62 load factor for 7 hours per day
1 Paving Equipment (104 hp) operating at a 0.53 load factor for 8 hours per day
1 Rollers (95 hp) operating at a 0.56 load factor for 7 hours per day
1 Tractors/Loaders/Backhoes (108 hp) operating at a 0.55 load factor for 7 hours per day

Page: 1
3/31/2010 11:59:53 AM
Phase: Building Construction 1/1/2011 - 6/30/2013 - Default Building Construction Description
Off-Road Equipment:
1 Cranes (399 hp) operating at a 0.43 load factor for 4 hours per day
2 Forklifts (145 hp) operating at a 0.3 load factor for 6 hours per day
1 Tractors/Loaders/Backhoes (108 hp) operating at a 0.55 load factor for 8 hours per day
Phase: Architectural Coating 4/1/2013 - 6/30/2013 - Default Architectural Coating Description
Rule: Residential Interior Coatings begins 1/1/2005 ends 12/31/2040 specifies a VOC of 250
Rule: Residential Exterior Coatings begins 1/1/2005 ends 12/31/2040 specifies a VOC of 250
Rule: Nonresidential Interior Coatings begins 1/1/2005 ends 12/31/2040 specifies a VOC of 250
Rule: Nonresidential Exterior Coatings begins 1/1/2005 ends 12/31/2040 specifies a VOC of 250
Construction Mitigated Detail Report:
CONSTRUCTION EMISSION ESTIMATES Annual Tons Per Year, Mitigated
ROG NOx CO SO2 PM10 Dust PM10 Exhaust PM10 PM2.5 Dust PM2.5 Exhaust PM2.5 CO2
2010 0.18 1.51 0.79 0.00 0.22 0.07 0.29 0.05 0.07 0.11 151.56
Mass Grading 10/01/2010-
12/31/2010
0.11 0.93 0.48 0.00 0.22 0.04 0.26 0.05 0.04 0.09 91.62
Mass Grading Dust 0.00 0.00 0.00 0.00 0.22 0.00 0.22 0.05 0.00 0.05 0.00
Mass Grading Off Road Diesel 0.10 0.82 0.41 0.00 0.00 0.04 0.04 0.00 0.04 0.04 74.16
Mass Grading On Road Diesel 0.01 0.10 0.03 0.00 0.00 0.00 0.00 0.00 0.00 0.00 14.09
Mass Grading Worker Trips 0.00 0.00 0.04 0.00 0.00 0.00 0.00 0.00 0.00 0.00 3.36
Trenching 10/01/2010-12/31/2010 0.07 0.59 0.31 0.00 0.00 0.03 0.03 0.00 0.03 0.03 59.95
Trenching Off Road Diesel 0.07 0.58 0.27 0.00 0.00 0.03 0.03 0.00 0.03 0.03 56.58
Trenching Worker Trips 0.00 0.00 0.04 0.00 0.00 0.00 0.00 0.00 0.00 0.00 3.36
2011 0.19 1.29 1.83 0.00 0.01 0.08 0.08 0.00 0.07 0.07 249.49
Building 01/01/2011-06/30/2013 0.19 1.29 1.83 0.00 0.01 0.08 0.08 0.00 0.07 0.07 249.49
Building Off Road Diesel 0.14 1.11 0.61 0.00 0.00 0.07 0.07 0.00 0.06 0.06 116.14
Building Vendor Trips 0.01 0.12 0.10 0.00 0.00 0.00 0.01 0.00 0.00 0.00 26.45
Building Worker Trips 0.04 0.06 1.12 0.00 0.01 0.00 0.01 0.00 0.00 0.00 106.90
2012 0.18 1.19 1.73 0.00 0.01 0.07 0.08 0.00 0.06 0.07 250.51
Building 01/01/2011-06/30/2013 0.18 1.19 1.73 0.00 0.01 0.07 0.08 0.00 0.06 0.07 250.51
Building Off Road Diesel 0.13 1.03 0.60 0.00 0.00 0.06 0.06 0.00 0.06 0.06 116.59
Building Vendor Trips 0.01 0.11 0.09 0.00 0.00 0.00 0.00 0.00 0.00 0.00 26.55
Building Worker Trips 0.03 0.06 1.04 0.00 0.01 0.00 0.01 0.00 0.00 0.00 107.38

Page: 1
3/31/2010 11:59:53 AM
2013 1.51 0.99 1.17 0.00 0.00 0.07 0.07 0.00 0.06 0.06 174.24
Building 01/01/2011-06/30/2013 0.08 0.54 0.81 0.00 0.00 0.03 0.03 0.00 0.03 0.03 123.85
Building Off Road Diesel 0.06 0.47 0.29 0.00 0.00 0.03 0.03 0.00 0.03 0.03 57.62
Building Vendor Trips 0.00 0.05 0.04 0.00 0.00 0.00 0.00 0.00 0.00 0.00 13.12
Building Worker Trips 0.01 0.03 0.47 0.00 0.00 0.00 0.00 0.00 0.00 0.00 53.10
Asphalt 04/01/2013-06/30/2013 0.08 0.45 0.35 0.00 0.00 0.04 0.04 0.00 0.03 0.03 48.79
Paving Off-Gas 0.00 0.00 0.00 0.00 0.00 0.00 0.00 0.00 0.00 0.00 0.00
Paving Off Road Diesel 0.07 0.44 0.29 0.00 0.00 0.04 0.04 0.00 0.03 0.03 41.34
Paving On Road Diesel 0.00 0.00 0.00 0.00 0.00 0.00 0.00 0.00 0.00 0.00 0.81
Paving Worker Trips 0.00 0.00 0.06 0.00 0.00 0.00 0.00 0.00 0.00 0.00 6.64
Coating 04/01/2013-06/30/2013 1.35 0.00 0.01 0.00 0.00 0.00 0.00 0.00 0.00 0.00 1.61
Architectural Coating 1.35 0.00 0.00 0.00 0.00 0.00 0.00 0.00 0.00 0.00 0.00
Coating Worker Trips 0.00 0.00 0.01 0.00 0.00 0.00 0.00 0.00 0.00 0.00 1.61
Construction Related Mitigation Measures
The following mitigation measures apply to Phase: Mass Grading 10/1/2010 - 12/31/2010 - Default Fine Site Grading Description
For Soil Stablizing Measures, the Water exposed surfaces 2x daily watering mitigation reduces emissions by:
PM10: 55% PM25: 55%
For Unpaved Roads Measures, the Reduce speed on unpaved roads to less than 15 mph mitigation reduces emissions by:
PM10: 44% PM25: 44%
For Unpaved Roads Measures, the Manage haul road dust 2x daily watering mitigation reduces emissions by:
PM10: 55% PM25: 55%
Area Source Unmitigated Detail Report:
AREA SOURCE EMISSION ESTIMATES Annual Tons Per Year, Unmitigated
Source ROG NOx CO SO2 PM10 PM2.5 CO2
Natural Gas 0.01 0.15 0.13 0.00 0.00 0.00 183.96
Hearth
Landscape 0.01 0.00 0.14 0.00 0.00 0.00 0.25
Consumer Products 0.00
Architectural Coatings 0.13
Area Source Changes to Defaults
0.00 0.00 0.00 184.21TOTALS (tons/year, unmitigated) 0.15 0.15 0.27

Page: 12/23/2010 01:47:55 PM
0.01 1.87 0.36 1,013.41TOTALS (tons/year, unmitigated) 1.16 1.10 10.29
0.01 1.87 0.36 1,013.41R&D Center 1.16 1.10 10.29
Operational Unmitigated Detail Report:
OPERATIONAL EMISSION ESTIMATES Annual Tons Per Year, Unmitigated
Source ROG NOX CO SO2 PM10 PM25 CO2
0.01 1.87 0.36 1,013.41TOTALS (tons/year, unmitigated) 1.16 1.10 10.29
SUM OF AREA SOURCE AND OPERATIONAL EMISSION ESTIMATES
ROG NOx CO SO2 PM10 PM2.5 CO2
0.01 1.87 0.36 1,013.41TOTALS (tons/year, unmitigated) 1.16 1.10 10.29
ROG NOx CO SO2 PM10 PM2.5 CO2
OPERATIONAL (VEHICLE) EMISSION ESTIMATES
Project Location: Bay Area Air District
On-Road Vehicle Emissions Based on: Version : Emfac2007 V2.3 Nov 1 2006
Off-Road Vehicle Emissions Based on: OFFROAD2007
Summary Report:
Urbemis 2007 Version 9.2.4
Combined Annual Emissions Reports (Tons/Year)
File Name: Z:\Alan Sako\924.06 CRT\Emissions\Alt 2\CRT Alt 2 - Operational.urb924
Project Name: CRT Alternative 2 - Operations

Page: 12/23/2010 01:47:55 PM
16.7Motor Home 0.6 0.0 83.3
0.0
School Bus 0.1 0.0 0.0 100.0
Motorcycle 3.2 56.2 43.8
100.0
Urban Bus 0.1 0.0 0.0 100.0
Other Bus 0.1 0.0 0.0
80.0
Heavy-Heavy Truck 33,001-60,000 lbs 0.4 0.0 0.0 100.0
Med-Heavy Truck 14,001-33,000 lbs 1.0 0.0 20.0
22.2
Lite-Heavy Truck 10,001-14,000 lbs 0.6 0.0 50.0 50.0
Lite-Heavy Truck 8501-10,000 lbs 0.9 0.0 77.8
0.0
Med Truck 5751-8500 lbs 6.6 0.0 100.0 0.0
Light Truck 3751-5750 lbs 19.9 0.5 99.5
0.2
Light Truck < 3750 lbs 12.8 0.8 96.9 2.3
Light Auto 53.7 0.6 99.2
Vehicle Fleet Mix
Vehicle Type Percent Type Non-Catalyst Catalyst Diesel
300.00 831.00 5,951.00
831.00 5,951.00
R&D Center 2.77 unknown
Emfac: Version : Emfac2007 V2.3 Nov 1 2006
Summary of Land Uses
Land Use Type Acreage Trip Rate Unit Type No. Units Total Trips Total VMT
Operational Settings:
Includes correction for passby trips
Does not include double counting adjustment for internal trips
Analysis Year: 2013 Season: Annual

Page: 12/23/2010 01:47:55 PM
R&D Center 50.0 25.0 25.0
% of Trips - Commercial (by land use)
% of Trips - Residential 32.9 18.0 49.1
14.7 6.6 6.6
Trip speeds (mph) 35.0 35.0 35.0 35.0 35.0 35.0
Rural Trip Length (miles) 16.8 7.1 7.9
Commute Non-Work Customer
Urban Trip Length (miles) 10.8 7.3 7.5 9.5 7.4 7.4
Home-Work Home-Shop Home-Other
Travel Conditions
Residential Commercial

0.00 0.01 0.01TOTALS (lbs/day, unmitigated) 0.92 0.86 2.26
SUM OF AREA SOURCE AND OPERATIONAL EMISSION ESTIMATES
ROG NOx CO SO2 PM10 PM2.5
SO2 PM10 PM2.5
TOTALS (lbs/day, unmitigated) 0.92 0.86 2.26 0.00 0.01 0.01
ROG NOx CO
0.02 1.50 1.52
AREA SOURCE EMISSION ESTIMATES
0.01 0.06 1.63 1.692013 TOTALS (lbs/day mitigated) 45.09 22.26 23.70
1.69 0.02 1.50 1.522013 TOTALS (lbs/day unmitigated) 45.09 22.26 23.70 0.01 0.06 1.63
0.58 0.02 0.49 0.51
0.02 0.49 0.51
2012 TOTALS (lbs/day mitigated) 1.35 9.12 13.24 0.01 0.05 0.54
0.01 0.05 0.54 0.582012 TOTALS (lbs/day unmitigated) 1.35 9.12 13.24
0.02 0.55 0.560.01 0.05 0.60 0.652011 TOTALS (lbs/day mitigated) 1.46 9.90 14.07
0.65 0.02 0.55 0.562011 TOTALS (lbs/day unmitigated) 1.46 9.90 14.07 0.01 0.05 0.60
8.80 1.37 2.06 3.43
3.35 2.06 5.41
2010 TOTALS (lbs/day mitigated) 5.32 45.81 23.95 0.01 6.56 2.24
0.01 16.02 2.24 18.262010 TOTALS (lbs/day unmitigated) 5.32 45.81 23.95
PM10 PM2.5 Dust PM2.5 Exhaust PM2.5
Off-Road Vehicle Emissions Based on: OFFROAD2007
Summary Report:
CONSTRUCTION EMISSION ESTIMATES
ROG NOx CO SO2 PM10 Dust PM10 Exhaust
File Name: Z:\Alan Sako\924.06 CRT\Emissions\Alt 2\CRT Alt 2 - Const Area.urb924
Project Name: CRT Alternative 2 - Construction and Area Source
Project Location: Bay Area Air District
On-Road Vehicle Emissions Based on: Version : Emfac2007 V2.3 Nov 1 2006
Page: 1
3/31/2010 11:59:10 AM
Urbemis 2007 Version 9.2.4
Combined Summer Emissions Reports (Pounds/Day)

0.00 0.01 0.01TOTALS (lbs/day, unmitigated) 0.92 0.86 2.26
SUM OF AREA SOURCE AND OPERATIONAL EMISSION ESTIMATES
ROG NOx CO SO2 PM10 PM2.5
SO2 PM10 PM2.5
TOTALS (lbs/day, unmitigated) 0.92 0.86 2.26 0.00 0.01 0.01
ROG NOx CO
0.02 1.50 1.52
AREA SOURCE EMISSION ESTIMATES
0.01 0.06 1.63 1.692013 TOTALS (lbs/day mitigated) 45.09 22.26 23.70
1.69 0.02 1.50 1.522013 TOTALS (lbs/day unmitigated) 45.09 22.26 23.70 0.01 0.06 1.63
0.58 0.02 0.49 0.51
0.02 0.49 0.51
2012 TOTALS (lbs/day mitigated) 1.35 9.12 13.24 0.01 0.05 0.54
0.01 0.05 0.54 0.582012 TOTALS (lbs/day unmitigated) 1.35 9.12 13.24
0.02 0.55 0.560.01 0.05 0.60 0.652011 TOTALS (lbs/day mitigated) 1.46 9.90 14.07
0.65 0.02 0.55 0.562011 TOTALS (lbs/day unmitigated) 1.46 9.90 14.07 0.01 0.05 0.60
4.72 0.52 2.06 2.58
1.26 2.06 3.32
2010 TOTALS (lbs/day mitigated) 5.32 45.81 23.95 0.01 2.48 2.24
0.01 6.02 2.24 8.262010 TOTALS (lbs/day unmitigated) 5.32 45.81 23.95
PM10 PM2.5 Dust PM2.5 Exhaust PM2.5
Off-Road Vehicle Emissions Based on: OFFROAD2007
Summary Report:
CONSTRUCTION EMISSION ESTIMATES
ROG NOx CO SO2 PM10 Dust PM10 Exhaust
File Name: Z:\Alan Sako\924.06 CRT\Emissions\Alt 3\CRT Alt 3 - Const Area.urb924
Project Name: CRT Alternative 3 - Construction and Area Source
Project Location: Bay Area Air District
On-Road Vehicle Emissions Based on: Version : Emfac2007 V2.3 Nov 1 2006
Page: 1
3/31/2010 12:02:54 PM
Urbemis 2007 Version 9.2.4
Combined Summer Emissions Reports (Pounds/Day)

Page: 1
3/31/2010 12:02:54 PM
0.06 0.01 0.02 0.03
0.00 0.02 0.03
Building Worker Trips 0.23 0.40 7.33 0.01 0.04 0.02
0.00 0.01 0.03 0.03Building Vendor Trips 0.06 0.72 0.67
0.43 0.00 0.39 0.39
0.02 0.43 0.45
Building Off Road Diesel 0.95 7.29 4.48 0.00 0.00 0.43
0.01 0.05 0.48 0.52Building 01/01/2011-06/30/2013 1.24 8.41 12.48
0.52 0.02 0.43 0.45
0.01 0.02 0.03
Time Slice 1/1/2013-3/29/2013 Active
Days: 64
1.24 8.41 12.48 0.01 0.05 0.48
0.01 0.04 0.02 0.06Building Worker Trips 0.25 0.44 7.96
0.04 0.00 0.03 0.03
0.00 0.45 0.45
Building Vendor Trips 0.06 0.81 0.72 0.00 0.01 0.03
0.00 0.00 0.49 0.49Building Off Road Diesel 1.03 7.87 4.56
0.58 0.02 0.49 0.51
0.02 0.49 0.51
Building 01/01/2011-06/30/2013 1.35 9.12 13.24 0.01 0.05 0.54
0.01 0.05 0.54 0.58Time Slice 1/2/2012-12/31/2012 Active
Days: 261
1.35 9.12 13.24
0.06 0.01 0.02 0.03
0.00 0.03 0.03
Building Worker Trips 0.28 0.48 8.63 0.01 0.04 0.02
0.00 0.01 0.03 0.04Building Vendor Trips 0.07 0.91 0.77
0.54 0.00 0.50 0.50
0.02 0.55 0.56
Building Off Road Diesel 1.11 8.51 4.68 0.00 0.00 0.54
0.01 0.05 0.60 0.65Building 01/01/2011-06/30/2013 1.46 9.90 14.07
0.65 0.02 0.55 0.56
0.00 0.00 0.00
Time Slice 1/3/2011-12/30/2011 Active
Days: 260
1.46 9.90 14.07 0.01 0.05 0.60
0.00 0.00 0.00 0.01Trenching Worker Trips 0.04 0.07 1.16
0.88 0.00 0.81 0.81
0.00 0.81 0.81
Trenching Off Road Diesel 2.06 17.69 8.22 0.00 0.00 0.88
0.00 0.00 0.88 0.88Trenching 10/01/2010-12/31/2010 2.10 17.75 9.37
0.01 0.00 0.00 0.00
0.00 0.10 0.11
Mass Grading Worker Trips 0.04 0.07 1.16 0.00 0.00 0.00
0.00 0.01 0.11 0.12Mass Grading On Road Diesel 0.19 3.00 0.95
1.25 0.00 1.15 1.15
1.25 0.00 1.25
Mass Grading Off Road Diesel 3.00 24.99 12.46 0.00 0.00 1.25
0.00 6.00 0.00 6.00Mass Grading Dust 0.00 0.00 0.00
7.38 1.26 1.25 2.51
1.26 2.06 3.32
Mass Grading 10/01/2010-
12/31/2010
3.23 28.05 14.57 0.00 6.02 1.36
PM2.5 Exhaust PM2.5
Time Slice 10/1/2010-12/31/2010
Active Days: 66
5.32 45.81 23.95 0.01 6.02 2.24 8.26
CONSTRUCTION EMISSION ESTIMATES Summer Pounds Per Day, Unmitigated
ROG NOx CO SO2 PM10 Dust PM10 Exhaust PM10 PM2.5 Dust
Construction Unmitigated Detail Report:

Page: 1
3/31/2010 12:02:54 PM
1 Tractors/Loaders/Backhoes (108 hp) operating at a 0.55 load factor for 0 hours per day
Phase: Trenching 10/1/2010 - 12/31/2010 - Type Your Description Here
Off-Road Equipment:
2 Excavators (168 hp) operating at a 0.57 load factor for 8 hours per day
1 Other General Industrial Equipment (238 hp) operating at a 0.51 load factor for 8 hours per day
1 Rubber Tired Dozers (357 hp) operating at a 0.59 load factor for 6 hours per day
1 Tractors/Loaders/Backhoes (108 hp) operating at a 0.55 load factor for 7 hours per day
1 Water Trucks (189 hp) operating at a 0.5 load factor for 8 hours per day
20 lbs per acre-day
On Road Truck Travel (VMT): 106.06
Off-Road Equipment:
1 Graders (174 hp) operating at a 0.61 load factor for 6 hours per day
Phase: Mass Grading 10/1/2010 - 12/31/2010 - Default Fine Site Grading Description
Total Acres Disturbed: 1.2
Maximum Daily Acreage Disturbed: 0.3
Fugitive Dust Level of Detail: Default
0.00 0.00 0.00
Phase Assumptions
0.00 0.00 0.00 0.00Coating Worker Trips 0.01 0.02 0.44
0.00 0.00 0.00 0.00
0.00 0.00 0.00
Architectural Coating 41.52 0.00 0.00 0.00 0.00 0.00
0.00 0.00 0.00 0.00Coating 04/01/2013-06/30/2013 41.54 0.02 0.44
0.06 0.01 0.02 0.03
0.00 0.02 0.03
Building Worker Trips 0.23 0.40 7.33 0.01 0.04 0.02
0.00 0.01 0.03 0.03Building Vendor Trips 0.06 0.72 0.67
0.43 0.00 0.39 0.39
0.02 0.43 0.45
Building Off Road Diesel 0.95 7.29 4.48 0.00 0.00 0.43
0.01 0.05 0.48 0.52Building 01/01/2011-06/30/2013 1.24 8.41 12.48
0.02 0.00 0.00 0.01
0.00 0.00 0.00
Paving Worker Trips 0.06 0.10 1.82 0.00 0.01 0.01
0.00 0.00 0.00 0.01Paving On Road Diesel 0.01 0.12 0.04
1.15 0.00 1.05 1.05
0.00 0.00 0.00
Paving Off Road Diesel 2.19 13.60 8.91 0.00 0.00 1.15
0.00 0.00 0.00 0.00Paving Off-Gas 0.05 0.00 0.00
1.17 0.00 1.06 1.07
0.02 1.50 1.52
Asphalt 04/01/2013-06/30/2013 2.31 13.82 10.78 0.00 0.01 1.16
0.01 0.06 1.63 1.69Time Slice 4/1/2013-6/28/2013 Active
Days: 65
45.09 22.26 23.70

Page: 1
3/31/2010 12:02:54 PM
0.00 0.00 0.000.00 0.00 0.00 0.01Trenching Worker Trips 0.04 0.07 1.16
0.88 0.00 0.81 0.81
0.00 0.81 0.81
Trenching Off Road Diesel 2.06 17.69 8.22 0.00 0.00 0.88
0.00 0.00 0.88 0.88Trenching 10/01/2010-12/31/2010 2.10 17.75 9.37
0.01 0.00 0.00 0.00
0.00 0.10 0.11
Mass Grading Worker Trips 0.04 0.07 1.16 0.00 0.00 0.00
0.00 0.01 0.11 0.12Mass Grading On Road Diesel 0.19 3.00 0.95
1.25 0.00 1.15 1.15
0.51 0.00 0.51
Mass Grading Off Road Diesel 3.00 24.99 12.46 0.00 0.00 1.25
0.00 2.45 0.00 2.45Mass Grading Dust 0.00 0.00 0.00
3.83 0.52 1.25 1.77
0.52 2.06 2.58
Mass Grading 10/01/2010-
12/31/2010
3.23 28.05 14.57 0.00 2.47 1.36
PM2.5 Exhaust PM2.5
Time Slice 10/1/2010-12/31/2010
Active Days: 66
5.32 45.81 23.95 0.01 2.48 2.24 4.72
CONSTRUCTION EMISSION ESTIMATES Summer Pounds Per Day, Mitigated
ROG NOx CO SO2 PM10 Dust PM10 Exhaust PM10 PM2.5 Dust
Rule: Nonresidential Interior Coatings begins 1/1/2005 ends 12/31/2040 specifies a VOC of 250
Rule: Nonresidential Exterior Coatings begins 1/1/2005 ends 12/31/2040 specifies a VOC of 250
Construction Mitigated Detail Report:
Phase: Architectural Coating 4/1/2013 - 6/30/2013 - Default Architectural Coating Description
Rule: Residential Interior Coatings begins 1/1/2005 ends 12/31/2040 specifies a VOC of 250
Rule: Residential Exterior Coatings begins 1/1/2005 ends 12/31/2040 specifies a VOC of 250
Off-Road Equipment:
1 Cranes (399 hp) operating at a 0.43 load factor for 4 hours per day
2 Forklifts (145 hp) operating at a 0.3 load factor for 6 hours per day
1 Tractors/Loaders/Backhoes (108 hp) operating at a 0.55 load factor for 8 hours per day
1 Rollers (95 hp) operating at a 0.56 load factor for 7 hours per day
1 Tractors/Loaders/Backhoes (108 hp) operating at a 0.55 load factor for 7 hours per day
Phase: Building Construction 1/1/2011 - 6/30/2013 - Default Building Construction Description
Off-Road Equipment:
4 Cement and Mortar Mixers (10 hp) operating at a 0.56 load factor for 6 hours per day
1 Pavers (100 hp) operating at a 0.62 load factor for 7 hours per day
1 Paving Equipment (104 hp) operating at a 0.53 load factor for 8 hours per day
Phase: Paving 4/1/2013 - 6/30/2013 - Default Paving Description
Acres to be Paved: 1.36

Page: 1
3/31/2010 12:02:54 PM
0.00 0.00 0.000.00 0.00 0.00 0.00Coating Worker Trips 0.01 0.02 0.44
0.00 0.00 0.00 0.00
0.00 0.00 0.00
Architectural Coating 41.52 0.00 0.00 0.00 0.00 0.00
0.00 0.00 0.00 0.00Coating 04/01/2013-06/30/2013 41.54 0.02 0.44
0.06 0.01 0.02 0.03
0.00 0.02 0.03
Building Worker Trips 0.23 0.40 7.33 0.01 0.04 0.02
0.00 0.01 0.03 0.03Building Vendor Trips 0.06 0.72 0.67
0.43 0.00 0.39 0.39
0.02 0.43 0.45
Building Off Road Diesel 0.95 7.29 4.48 0.00 0.00 0.43
0.01 0.05 0.48 0.52Building 01/01/2011-06/30/2013 1.24 8.41 12.48
0.02 0.00 0.00 0.01
0.00 0.00 0.00
Paving Worker Trips 0.06 0.10 1.82 0.00 0.01 0.01
0.00 0.00 0.00 0.01Paving On Road Diesel 0.01 0.12 0.04
1.15 0.00 1.05 1.05
0.00 0.00 0.00
Paving Off Road Diesel 2.19 13.60 8.91 0.00 0.00 1.15
0.00 0.00 0.00 0.00Paving Off-Gas 0.05 0.00 0.00
1.17 0.00 1.06 1.07
0.02 1.50 1.52
Asphalt 04/01/2013-06/30/2013 2.31 13.82 10.78 0.00 0.01 1.16
0.01 0.06 1.63 1.69Time Slice 4/1/2013-6/28/2013 Active
Days: 65
45.09 22.26 23.70
0.06 0.01 0.02 0.03
0.00 0.02 0.03
Building Worker Trips 0.23 0.40 7.33 0.01 0.04 0.02
0.00 0.01 0.03 0.03Building Vendor Trips 0.06 0.72 0.67
0.43 0.00 0.39 0.39
0.02 0.43 0.45
Building Off Road Diesel 0.95 7.29 4.48 0.00 0.00 0.43
0.01 0.05 0.48 0.52Building 01/01/2011-06/30/2013 1.24 8.41 12.48
0.52 0.02 0.43 0.45
0.01 0.02 0.03
Time Slice 1/1/2013-3/29/2013 Active
Days: 64
1.24 8.41 12.48 0.01 0.05 0.48
0.01 0.04 0.02 0.06Building Worker Trips 0.25 0.44 7.96
0.04 0.00 0.03 0.03
0.00 0.45 0.45
Building Vendor Trips 0.06 0.81 0.72 0.00 0.01 0.03
0.00 0.00 0.49 0.49Building Off Road Diesel 1.03 7.87 4.56
0.58 0.02 0.49 0.51
0.02 0.49 0.51
Building 01/01/2011-06/30/2013 1.35 9.12 13.24 0.01 0.05 0.54
0.01 0.05 0.54 0.58Time Slice 1/2/2012-12/31/2012 Active
Days: 261
1.35 9.12 13.24
0.06 0.01 0.02 0.03
0.00 0.03 0.03
Building Worker Trips 0.28 0.48 8.63 0.01 0.04 0.02
0.00 0.01 0.03 0.04Building Vendor Trips 0.07 0.91 0.77
0.54 0.00 0.50 0.50
0.02 0.55 0.56
Building Off Road Diesel 1.11 8.51 4.68 0.00 0.00 0.54
0.01 0.05 0.60 0.65Building 01/01/2011-06/30/2013 1.46 9.90 14.07
0.65 0.02 0.55 0.56Time Slice 1/3/2011-12/30/2011 Active
Days: 260
1.46 9.90 14.07 0.01 0.05 0.60

Page: 1
3/31/2010 12:02:54 PM
Area Source Changes to Defaults
TOTALS (lbs/day, unmitigated) 0.92 0.86 2.26 0.00 0.01 0.01
Architectural Coatings 0.74
0.00 0.01 0.01
Consumer Products 0.00
Landscape 0.12 0.02 1.55
0.00 0.00 0.00
Hearth
Natural Gas 0.06 0.84 0.71
AREA SOURCE EMISSION ESTIMATES Summer Pounds Per Day, Unmitigated
Source ROG NOx CO SO2 PM10 PM2.5
PM10: 44% PM25: 44%
For Unpaved Roads Measures, the Manage haul road dust 2x daily watering mitigation reduces emissions by:
PM10: 55% PM25: 55%
Area Source Unmitigated Detail Report:
The following mitigation measures apply to Phase: Mass Grading 10/1/2010 - 12/31/2010 - Default Fine Site Grading Description
For Soil Stablizing Measures, the Water exposed surfaces 2x daily watering mitigation reduces emissions by:
PM10: 55% PM25: 55%
For Unpaved Roads Measures, the Reduce speed on unpaved roads to less than 15 mph mitigation reduces emissions by:
Construction Related Mitigation Measures

Page: 13/25/2010 05:39:52 PM
0.03 6.13 1.17
TOTALS (lbs/day, unmitigated) 5.28 3.10 33.12 0.03 6.13 1.17
R&D Center 5.28 3.10 33.12
OPERATIONAL EMISSION ESTIMATES Summer Pounds Per Day, Unmitigated
Source ROG NOX CO SO2 PM10 PM25
0.03 6.13 1.17
Operational Unmitigated Detail Report:
TOTALS (lbs/day, unmitigated) 5.28 3.10 33.12
SUM OF AREA SOURCE AND OPERATIONAL EMISSION ESTIMATES
ROG NOx CO SO2 PM10 PM2.5
SO2 PM10 PM2.5
TOTALS (lbs/day, unmitigated) 5.28 3.10 33.12 0.03 6.13 1.17
ROG NOx CO
OPERATIONAL (VEHICLE) EMISSION ESTIMATES
Project Location: Bay Area Air District
On-Road Vehicle Emissions Based on: Version : Emfac2007 V2.3 Nov 1 2006
Off-Road Vehicle Emissions Based on: OFFROAD2007
Summary Report:
Urbemis 2007 Version 9.2.4
Combined Summer Emissions Reports (Pounds/Day)
File Name: Z:\Alan Sako\924.06 CRT\Emissions\Alt 3\CRT Alt 3 - Operational.urb924
Project Name: CRT Alternative 3 - Operations

Page: 13/25/2010 05:39:52 PM
16.7Motor Home 0.6 0.0 83.3
0.0
School Bus 0.1 0.0 0.0 100.0
Motorcycle 3.2 56.2 43.8
100.0
Urban Bus 0.1 0.0 0.0 100.0
Other Bus 0.1 0.0 0.0
80.0
Heavy-Heavy Truck 33,001-60,000 lbs 0.4 0.0 0.0 100.0
Med-Heavy Truck 14,001-33,000 lbs 1.0 0.0 20.0
22.2
Lite-Heavy Truck 10,001-14,000 lbs 0.6 0.0 50.0 50.0
Lite-Heavy Truck 8501-10,000 lbs 0.9 0.0 77.8
0.0
Med Truck 5751-8500 lbs 6.6 0.0 100.0 0.0
Light Truck 3751-5750 lbs 19.9 0.5 99.5
0.2
Light Truck < 3750 lbs 12.8 0.8 96.9 2.3
Light Auto 53.7 0.6 99.2
Vehicle Fleet Mix
Vehicle Type Percent Type Non-Catalyst Catalyst Diesel
300.00 498.00 3,566.30
498.00 3,566.30
R&D Center 1.66 unknown
Emfac: Version : Emfac2007 V2.3 Nov 1 2006
Summary of Land Uses
Land Use Type Acreage Trip Rate Unit Type No. Units Total Trips Total VMT
Operational Settings:
Includes correction for passby trips
Does not include double counting adjustment for internal trips
Analysis Year: 2013 Temperature (F): 85 Season: Summer

Page: 13/25/2010 05:39:52 PM
R&D Center 50.0 25.0 25.0
% of Trips - Commercial (by land use)
% of Trips - Residential 32.9 18.0 49.1
14.7 6.6 6.6
Trip speeds (mph) 35.0 35.0 35.0 35.0 35.0 35.0
Rural Trip Length (miles) 16.8 7.1 7.9
Commute Non-Work Customer
Urban Trip Length (miles) 10.8 7.3 7.5 9.5 7.4 7.4
Home-Work Home-Shop Home-Other
Travel Conditions
Residential Commercial

0.00 0.00 0.00TOTALS (lbs/day, unmitigated) 0.80 0.84 0.71
SUM OF AREA SOURCE AND OPERATIONAL EMISSION ESTIMATES
ROG NOx CO SO2 PM10 PM2.5
SO2 PM10 PM2.5
TOTALS (lbs/day, unmitigated) 0.80 0.84 0.71 0.00 0.00 0.00
ROG NOx CO
0.02 1.50 1.52
AREA SOURCE EMISSION ESTIMATES
0.01 0.06 1.63 1.692013 TOTALS (lbs/day mitigated) 45.09 22.26 23.70
1.69 0.02 1.50 1.522013 TOTALS (lbs/day unmitigated) 45.09 22.26 23.70 0.01 0.06 1.63
0.58 0.02 0.49 0.51
0.02 0.49 0.51
2012 TOTALS (lbs/day mitigated) 1.35 9.12 13.24 0.01 0.05 0.54
0.01 0.05 0.54 0.582012 TOTALS (lbs/day unmitigated) 1.35 9.12 13.24
0.02 0.55 0.560.01 0.05 0.60 0.652011 TOTALS (lbs/day mitigated) 1.46 9.90 14.07
0.65 0.02 0.55 0.562011 TOTALS (lbs/day unmitigated) 1.46 9.90 14.07 0.01 0.05 0.60
4.72 0.52 2.06 2.58
1.26 2.06 3.32
2010 TOTALS (lbs/day mitigated) 5.32 45.81 23.95 0.01 2.48 2.24
0.01 6.02 2.24 8.262010 TOTALS (lbs/day unmitigated) 5.32 45.81 23.95
PM10 PM2.5 Dust PM2.5 Exhaust PM2.5
Off-Road Vehicle Emissions Based on: OFFROAD2007
Summary Report:
CONSTRUCTION EMISSION ESTIMATES
ROG NOx CO SO2 PM10 Dust PM10 Exhaust
File Name: Z:\Alan Sako\924.06 CRT\Emissions\Alt 3\CRT Alt 3 - Const Area.urb924
Project Name: CRT Alternative 3 - Construction and Area Source
Project Location: Bay Area Air District
On-Road Vehicle Emissions Based on: Version : Emfac2007 V2.3 Nov 1 2006
Page: 1
3/31/2010 12:03:28 PM
Urbemis 2007 Version 9.2.4
Combined Winter Emissions Reports (Pounds/Day)

Page: 1
3/31/2010 12:03:28 PM
0.06 0.01 0.02 0.03
0.00 0.02 0.03
Building Worker Trips 0.23 0.40 7.33 0.01 0.04 0.02
0.00 0.01 0.03 0.03Building Vendor Trips 0.06 0.72 0.67
0.43 0.00 0.39 0.39
0.02 0.43 0.45
Building Off Road Diesel 0.95 7.29 4.48 0.00 0.00 0.43
0.01 0.05 0.48 0.52Building 01/01/2011-06/30/2013 1.24 8.41 12.48
0.52 0.02 0.43 0.45
0.01 0.02 0.03
Time Slice 1/1/2013-3/29/2013 Active
Days: 64
1.24 8.41 12.48 0.01 0.05 0.48
0.01 0.04 0.02 0.06Building Worker Trips 0.25 0.44 7.96
0.04 0.00 0.03 0.03
0.00 0.45 0.45
Building Vendor Trips 0.06 0.81 0.72 0.00 0.01 0.03
0.00 0.00 0.49 0.49Building Off Road Diesel 1.03 7.87 4.56
0.58 0.02 0.49 0.51
0.02 0.49 0.51
Building 01/01/2011-06/30/2013 1.35 9.12 13.24 0.01 0.05 0.54
0.01 0.05 0.54 0.58Time Slice 1/2/2012-12/31/2012 Active
Days: 261
1.35 9.12 13.24
0.06 0.01 0.02 0.03
0.00 0.03 0.03
Building Worker Trips 0.28 0.48 8.63 0.01 0.04 0.02
0.00 0.01 0.03 0.04Building Vendor Trips 0.07 0.91 0.77
0.54 0.00 0.50 0.50
0.02 0.55 0.56
Building Off Road Diesel 1.11 8.51 4.68 0.00 0.00 0.54
0.01 0.05 0.60 0.65Building 01/01/2011-06/30/2013 1.46 9.90 14.07
0.65 0.02 0.55 0.56
0.00 0.00 0.00
Time Slice 1/3/2011-12/30/2011 Active
Days: 260
1.46 9.90 14.07 0.01 0.05 0.60
0.00 0.00 0.00 0.01Trenching Worker Trips 0.04 0.07 1.16
0.88 0.00 0.81 0.81
0.00 0.81 0.81
Trenching Off Road Diesel 2.06 17.69 8.22 0.00 0.00 0.88
0.00 0.00 0.88 0.88Trenching 10/01/2010-12/31/2010 2.10 17.75 9.37
0.01 0.00 0.00 0.00
0.00 0.10 0.11
Mass Grading Worker Trips 0.04 0.07 1.16 0.00 0.00 0.00
0.00 0.01 0.11 0.12Mass Grading On Road Diesel 0.19 3.00 0.95
1.25 0.00 1.15 1.15
1.25 0.00 1.25
Mass Grading Off Road Diesel 3.00 24.99 12.46 0.00 0.00 1.25
0.00 6.00 0.00 6.00Mass Grading Dust 0.00 0.00 0.00
7.38 1.26 1.25 2.51
1.26 2.06 3.32
Mass Grading 10/01/2010-
12/31/2010
3.23 28.05 14.57 0.00 6.02 1.36
PM2.5 Exhaust PM2.5
Time Slice 10/1/2010-12/31/2010
Active Days: 66
5.32 45.81 23.95 0.01 6.02 2.24 8.26
CONSTRUCTION EMISSION ESTIMATES Winter Pounds Per Day, Unmitigated
ROG NOx CO SO2 PM10 Dust PM10 Exhaust PM10 PM2.5 Dust
Construction Unmitigated Detail Report:

Page: 1
3/31/2010 12:03:28 PM
1 Tractors/Loaders/Backhoes (108 hp) operating at a 0.55 load factor for 0 hours per day
Phase: Trenching 10/1/2010 - 12/31/2010 - Type Your Description Here
Off-Road Equipment:
2 Excavators (168 hp) operating at a 0.57 load factor for 8 hours per day
1 Other General Industrial Equipment (238 hp) operating at a 0.51 load factor for 8 hours per day
1 Rubber Tired Dozers (357 hp) operating at a 0.59 load factor for 6 hours per day
1 Tractors/Loaders/Backhoes (108 hp) operating at a 0.55 load factor for 7 hours per day
1 Water Trucks (189 hp) operating at a 0.5 load factor for 8 hours per day
20 lbs per acre-day
On Road Truck Travel (VMT): 106.06
Off-Road Equipment:
1 Graders (174 hp) operating at a 0.61 load factor for 6 hours per day
Phase: Mass Grading 10/1/2010 - 12/31/2010 - Default Fine Site Grading Description
Total Acres Disturbed: 1.2
Maximum Daily Acreage Disturbed: 0.3
Fugitive Dust Level of Detail: Default
0.00 0.00 0.00
Phase Assumptions
0.00 0.00 0.00 0.00Coating Worker Trips 0.01 0.02 0.44
0.00 0.00 0.00 0.00
0.00 0.00 0.00
Architectural Coating 41.52 0.00 0.00 0.00 0.00 0.00
0.00 0.00 0.00 0.00Coating 04/01/2013-06/30/2013 41.54 0.02 0.44
0.06 0.01 0.02 0.03
0.00 0.02 0.03
Building Worker Trips 0.23 0.40 7.33 0.01 0.04 0.02
0.00 0.01 0.03 0.03Building Vendor Trips 0.06 0.72 0.67
0.43 0.00 0.39 0.39
0.02 0.43 0.45
Building Off Road Diesel 0.95 7.29 4.48 0.00 0.00 0.43
0.01 0.05 0.48 0.52Building 01/01/2011-06/30/2013 1.24 8.41 12.48
0.02 0.00 0.00 0.01
0.00 0.00 0.00
Paving Worker Trips 0.06 0.10 1.82 0.00 0.01 0.01
0.00 0.00 0.00 0.01Paving On Road Diesel 0.01 0.12 0.04
1.15 0.00 1.05 1.05
0.00 0.00 0.00
Paving Off Road Diesel 2.19 13.60 8.91 0.00 0.00 1.15
0.00 0.00 0.00 0.00Paving Off-Gas 0.05 0.00 0.00
1.17 0.00 1.06 1.07
0.02 1.50 1.52
Asphalt 04/01/2013-06/30/2013 2.31 13.82 10.78 0.00 0.01 1.16
0.01 0.06 1.63 1.69Time Slice 4/1/2013-6/28/2013 Active
Days: 65
45.09 22.26 23.70

Page: 1
3/31/2010 12:03:28 PM
0.00 0.00 0.000.00 0.00 0.00 0.01Trenching Worker Trips 0.04 0.07 1.16
0.88 0.00 0.81 0.81
0.00 0.81 0.81
Trenching Off Road Diesel 2.06 17.69 8.22 0.00 0.00 0.88
0.00 0.00 0.88 0.88Trenching 10/01/2010-12/31/2010 2.10 17.75 9.37
0.01 0.00 0.00 0.00
0.00 0.10 0.11
Mass Grading Worker Trips 0.04 0.07 1.16 0.00 0.00 0.00
0.00 0.01 0.11 0.12Mass Grading On Road Diesel 0.19 3.00 0.95
1.25 0.00 1.15 1.15
0.51 0.00 0.51
Mass Grading Off Road Diesel 3.00 24.99 12.46 0.00 0.00 1.25
0.00 2.45 0.00 2.45Mass Grading Dust 0.00 0.00 0.00
3.83 0.52 1.25 1.77
0.52 2.06 2.58
Mass Grading 10/01/2010-
12/31/2010
3.23 28.05 14.57 0.00 2.47 1.36
PM2.5 Exhaust PM2.5
Time Slice 10/1/2010-12/31/2010
Active Days: 66
5.32 45.81 23.95 0.01 2.48 2.24 4.72
CONSTRUCTION EMISSION ESTIMATES Winter Pounds Per Day, Mitigated
ROG NOx CO SO2 PM10 Dust PM10 Exhaust PM10 PM2.5 Dust
Rule: Nonresidential Interior Coatings begins 1/1/2005 ends 12/31/2040 specifies a VOC of 250
Rule: Nonresidential Exterior Coatings begins 1/1/2005 ends 12/31/2040 specifies a VOC of 250
Construction Mitigated Detail Report:
Phase: Architectural Coating 4/1/2013 - 6/30/2013 - Default Architectural Coating Description
Rule: Residential Interior Coatings begins 1/1/2005 ends 12/31/2040 specifies a VOC of 250
Rule: Residential Exterior Coatings begins 1/1/2005 ends 12/31/2040 specifies a VOC of 250
Off-Road Equipment:
1 Cranes (399 hp) operating at a 0.43 load factor for 4 hours per day
2 Forklifts (145 hp) operating at a 0.3 load factor for 6 hours per day
1 Tractors/Loaders/Backhoes (108 hp) operating at a 0.55 load factor for 8 hours per day
1 Rollers (95 hp) operating at a 0.56 load factor for 7 hours per day
1 Tractors/Loaders/Backhoes (108 hp) operating at a 0.55 load factor for 7 hours per day
Phase: Building Construction 1/1/2011 - 6/30/2013 - Default Building Construction Description
Off-Road Equipment:
4 Cement and Mortar Mixers (10 hp) operating at a 0.56 load factor for 6 hours per day
1 Pavers (100 hp) operating at a 0.62 load factor for 7 hours per day
1 Paving Equipment (104 hp) operating at a 0.53 load factor for 8 hours per day
Phase: Paving 4/1/2013 - 6/30/2013 - Default Paving Description
Acres to be Paved: 1.36

Page: 1
3/31/2010 12:03:28 PM
0.00 0.00 0.000.00 0.00 0.00 0.00Coating Worker Trips 0.01 0.02 0.44
0.00 0.00 0.00 0.00
0.00 0.00 0.00
Architectural Coating 41.52 0.00 0.00 0.00 0.00 0.00
0.00 0.00 0.00 0.00Coating 04/01/2013-06/30/2013 41.54 0.02 0.44
0.06 0.01 0.02 0.03
0.00 0.02 0.03
Building Worker Trips 0.23 0.40 7.33 0.01 0.04 0.02
0.00 0.01 0.03 0.03Building Vendor Trips 0.06 0.72 0.67
0.43 0.00 0.39 0.39
0.02 0.43 0.45
Building Off Road Diesel 0.95 7.29 4.48 0.00 0.00 0.43
0.01 0.05 0.48 0.52Building 01/01/2011-06/30/2013 1.24 8.41 12.48
0.02 0.00 0.00 0.01
0.00 0.00 0.00
Paving Worker Trips 0.06 0.10 1.82 0.00 0.01 0.01
0.00 0.00 0.00 0.01Paving On Road Diesel 0.01 0.12 0.04
1.15 0.00 1.05 1.05
0.00 0.00 0.00
Paving Off Road Diesel 2.19 13.60 8.91 0.00 0.00 1.15
0.00 0.00 0.00 0.00Paving Off-Gas 0.05 0.00 0.00
1.17 0.00 1.06 1.07
0.02 1.50 1.52
Asphalt 04/01/2013-06/30/2013 2.31 13.82 10.78 0.00 0.01 1.16
0.01 0.06 1.63 1.69Time Slice 4/1/2013-6/28/2013 Active
Days: 65
45.09 22.26 23.70
0.06 0.01 0.02 0.03
0.00 0.02 0.03
Building Worker Trips 0.23 0.40 7.33 0.01 0.04 0.02
0.00 0.01 0.03 0.03Building Vendor Trips 0.06 0.72 0.67
0.43 0.00 0.39 0.39
0.02 0.43 0.45
Building Off Road Diesel 0.95 7.29 4.48 0.00 0.00 0.43
0.01 0.05 0.48 0.52Building 01/01/2011-06/30/2013 1.24 8.41 12.48
0.52 0.02 0.43 0.45
0.01 0.02 0.03
Time Slice 1/1/2013-3/29/2013 Active
Days: 64
1.24 8.41 12.48 0.01 0.05 0.48
0.01 0.04 0.02 0.06Building Worker Trips 0.25 0.44 7.96
0.04 0.00 0.03 0.03
0.00 0.45 0.45
Building Vendor Trips 0.06 0.81 0.72 0.00 0.01 0.03
0.00 0.00 0.49 0.49Building Off Road Diesel 1.03 7.87 4.56
0.58 0.02 0.49 0.51
0.02 0.49 0.51
Building 01/01/2011-06/30/2013 1.35 9.12 13.24 0.01 0.05 0.54
0.01 0.05 0.54 0.58Time Slice 1/2/2012-12/31/2012 Active
Days: 261
1.35 9.12 13.24
0.06 0.01 0.02 0.03
0.00 0.03 0.03
Building Worker Trips 0.28 0.48 8.63 0.01 0.04 0.02
0.00 0.01 0.03 0.04Building Vendor Trips 0.07 0.91 0.77
0.54 0.00 0.50 0.50
0.02 0.55 0.56
Building Off Road Diesel 1.11 8.51 4.68 0.00 0.00 0.54
0.01 0.05 0.60 0.65Building 01/01/2011-06/30/2013 1.46 9.90 14.07
0.65 0.02 0.55 0.56Time Slice 1/3/2011-12/30/2011 Active
Days: 260
1.46 9.90 14.07 0.01 0.05 0.60

Page: 1
3/31/2010 12:03:28 PM
Area Source Changes to Defaults
TOTALS (lbs/day, unmitigated) 0.80 0.84 0.71 0.00 0.00 0.00
Architectural Coatings 0.74
Consumer Products 0.00
Landscaping - No Winter Emissions
0.00 0.00 0.00
Hearth
Natural Gas 0.06 0.84 0.71
AREA SOURCE EMISSION ESTIMATES Winter Pounds Per Day, Unmitigated
Source ROG NOx CO SO2 PM10 PM2.5
PM10: 44% PM25: 44%
For Unpaved Roads Measures, the Manage haul road dust 2x daily watering mitigation reduces emissions by:
PM10: 55% PM25: 55%
Area Source Unmitigated Detail Report:
The following mitigation measures apply to Phase: Mass Grading 10/1/2010 - 12/31/2010 - Default Fine Site Grading Description
For Soil Stablizing Measures, the Water exposed surfaces 2x daily watering mitigation reduces emissions by:
PM10: 55% PM25: 55%
For Unpaved Roads Measures, the Reduce speed on unpaved roads to less than 15 mph mitigation reduces emissions by:
Construction Related Mitigation Measures

Page: 13/25/2010 05:40:15 PM
0.03 6.13 1.17
TOTALS (lbs/day, unmitigated) 3.10 4.63 35.11 0.03 6.13 1.17
R&D Center 3.10 4.63 35.11
OPERATIONAL EMISSION ESTIMATES Winter Pounds Per Day, Unmitigated
Source ROG NOX CO SO2 PM10 PM25
0.03 6.13 1.17
Operational Unmitigated Detail Report:
TOTALS (lbs/day, unmitigated) 3.10 4.63 35.11
SUM OF AREA SOURCE AND OPERATIONAL EMISSION ESTIMATES
ROG NOx CO SO2 PM10 PM2.5
SO2 PM10 PM2.5
TOTALS (lbs/day, unmitigated) 3.10 4.63 35.11 0.03 6.13 1.17
ROG NOx CO
OPERATIONAL (VEHICLE) EMISSION ESTIMATES
Project Location: Bay Area Air District
On-Road Vehicle Emissions Based on: Version : Emfac2007 V2.3 Nov 1 2006
Off-Road Vehicle Emissions Based on: OFFROAD2007
Summary Report:
Urbemis 2007 Version 9.2.4
Combined Winter Emissions Reports (Pounds/Day)
File Name: Z:\Alan Sako\924.06 CRT\Emissions\Alt 3\CRT Alt 3 - Operational.urb924
Project Name: CRT Alternative 3 - Operations

Page: 13/25/2010 05:40:15 PM
16.7Motor Home 0.6 0.0 83.3
0.0
School Bus 0.1 0.0 0.0 100.0
Motorcycle 3.2 56.2 43.8
100.0
Urban Bus 0.1 0.0 0.0 100.0
Other Bus 0.1 0.0 0.0
80.0
Heavy-Heavy Truck 33,001-60,000 lbs 0.4 0.0 0.0 100.0
Med-Heavy Truck 14,001-33,000 lbs 1.0 0.0 20.0
22.2
Lite-Heavy Truck 10,001-14,000 lbs 0.6 0.0 50.0 50.0
Lite-Heavy Truck 8501-10,000 lbs 0.9 0.0 77.8
0.0
Med Truck 5751-8500 lbs 6.6 0.0 100.0 0.0
Light Truck 3751-5750 lbs 19.9 0.5 99.5
0.2
Light Truck < 3750 lbs 12.8 0.8 96.9 2.3
Light Auto 53.7 0.6 99.2
Vehicle Fleet Mix
Vehicle Type Percent Type Non-Catalyst Catalyst Diesel
300.00 498.00 3,566.30
498.00 3,566.30
R&D Center 1.66 unknown
Emfac: Version : Emfac2007 V2.3 Nov 1 2006
Summary of Land Uses
Land Use Type Acreage Trip Rate Unit Type No. Units Total Trips Total VMT
Operational Settings:
Includes correction for passby trips
Does not include double counting adjustment for internal trips
Analysis Year: 2013 Temperature (F): 40 Season: Winter

Page: 13/25/2010 05:40:15 PM
R&D Center 50.0 25.0 25.0
% of Trips - Commercial (by land use)
% of Trips - Residential 32.9 18.0 49.1
14.7 6.6 6.6
Trip speeds (mph) 35.0 35.0 35.0 35.0 35.0 35.0
Rural Trip Length (miles) 16.8 7.1 7.9
Commute Non-Work Customer
Urban Trip Length (miles) 10.8 7.3 7.5 9.5 7.4 7.4
Home-Work Home-Shop Home-Other
Travel Conditions
Residential Commercial

Page: 1
3/31/2010 12:03:45 PM
Urbemis 2007 Version 9.2.4
Combined Annual Emissions Reports (Tons/Year)
File Name: Z:\Alan Sako\924.06 CRT\Emissions\Alt 3\CRT Alt 3 - Const Area.urb924
Project Name: CRT Alternative 3 - Construction and Area Source
Project Location: Bay Area Air District
On-Road Vehicle Emissions Based on: Version : Emfac2007 V2.3 Nov 1 2006
Off-Road Vehicle Emissions Based on: OFFROAD2007
Summary Report:
CONSTRUCTION EMISSION ESTIMATES
ROG NOx CO SO2 PM10 Dust PM10 Exhaust PM10 PM2.5 Dust PM2.5 Exhaust PM2.5 CO2
2010 TOTALS (tons/year unmitigated) 0.18 1.51 0.79 0.00 0.20 0.07 0.27 0.04 0.07 0.11 151.56
2010 TOTALS (tons/year mitigated) 0.18 1.51 0.79 0.00 0.08 0.07 0.16 0.02 0.07 0.09 151.56
Percent Reduction 0.00 0.00 0.00 0.00 58.91 0.00 42.95 58.76 0.00 22.32 0.00
2011 TOTALS (tons/year unmitigated) 0.19 1.29 1.83 0.00 0.01 0.08 0.08 0.00 0.07 0.07 249.49
2011 TOTALS (tons/year mitigated) 0.19 1.29 1.83 0.00 0.01 0.08 0.08 0.00 0.07 0.07 249.49
Percent Reduction 0.00 0.00 0.00 0.00 0.00 0.00 0.00 0.00 0.00 0.00 0.00
2012 TOTALS (tons/year unmitigated) 0.18 1.19 1.73 0.00 0.01 0.07 0.08 0.00 0.06 0.07 250.51
2012 TOTALS (tons/year mitigated) 0.18 1.19 1.73 0.00 0.01 0.07 0.08 0.00 0.06 0.07 250.51
Percent Reduction 0.00 0.00 0.00 0.00 0.00 0.00 0.00 0.00 0.00 0.00 0.00
2013 TOTALS (tons/year unmitigated) 1.51 0.99 1.17 0.00 0.00 0.07 0.07 0.00 0.06 0.06 174.24
2013 TOTALS (tons/year mitigated) 1.51 0.99 1.17 0.00 0.00 0.07 0.07 0.00 0.06 0.06 174.24
Percent Reduction 0.00 0.00 0.00 0.00 0.00 0.00 0.00 0.00 0.00 0.00 0.00
AREA SOURCE EMISSION ESTIMATES
ROG NOx CO SO2 PM10 PM2.5 CO2
TOTALS (tons/year, unmitigated) 0.15 0.15 0.27 0.00 0.00 0.00 184.21

Page: 1
3/31/2010 12:03:45 PM
SUM OF AREA SOURCE AND OPERATIONAL EMISSION ESTIMATES
ROG NOx CO SO2 PM10 PM2.5 CO2
TOTALS (tons/year, unmitigated) 0.15 0.15 0.27 0.00 0.00 0.00 184.21
Construction Unmitigated Detail Report:
CONSTRUCTION EMISSION ESTIMATES Annual Tons Per Year, Unmitigated
ROG NOx CO SO2 PM10 Dust PM10 Exhaust PM10 PM2.5 Dust PM2.5 Exhaust PM2.5 CO2
2010 0.18 1.51 0.79 0.00 0.20 0.07 0.27 0.04 0.07 0.11 151.56
Mass Grading 10/01/2010-
12/31/2010
0.11 0.93 0.48 0.00 0.20 0.04 0.24 0.04 0.04 0.08 91.62
Mass Grading Dust 0.00 0.00 0.00 0.00 0.20 0.00 0.20 0.04 0.00 0.04 0.00
Mass Grading Off Road Diesel 0.10 0.82 0.41 0.00 0.00 0.04 0.04 0.00 0.04 0.04 74.16
Mass Grading On Road Diesel 0.01 0.10 0.03 0.00 0.00 0.00 0.00 0.00 0.00 0.00 14.09
Mass Grading Worker Trips 0.00 0.00 0.04 0.00 0.00 0.00 0.00 0.00 0.00 0.00 3.36
Trenching 10/01/2010-12/31/2010 0.07 0.59 0.31 0.00 0.00 0.03 0.03 0.00 0.03 0.03 59.95
Trenching Off Road Diesel 0.07 0.58 0.27 0.00 0.00 0.03 0.03 0.00 0.03 0.03 56.58
Trenching Worker Trips 0.00 0.00 0.04 0.00 0.00 0.00 0.00 0.00 0.00 0.00 3.36
2011 0.19 1.29 1.83 0.00 0.01 0.08 0.08 0.00 0.07 0.07 249.49
Building 01/01/2011-06/30/2013 0.19 1.29 1.83 0.00 0.01 0.08 0.08 0.00 0.07 0.07 249.49
Building Off Road Diesel 0.14 1.11 0.61 0.00 0.00 0.07 0.07 0.00 0.06 0.06 116.14
Building Vendor Trips 0.01 0.12 0.10 0.00 0.00 0.00 0.01 0.00 0.00 0.00 26.45
Building Worker Trips 0.04 0.06 1.12 0.00 0.01 0.00 0.01 0.00 0.00 0.00 106.90
2012 0.18 1.19 1.73 0.00 0.01 0.07 0.08 0.00 0.06 0.07 250.51
Building 01/01/2011-06/30/2013 0.18 1.19 1.73 0.00 0.01 0.07 0.08 0.00 0.06 0.07 250.51
Building Off Road Diesel 0.13 1.03 0.60 0.00 0.00 0.06 0.06 0.00 0.06 0.06 116.59
Building Vendor Trips 0.01 0.11 0.09 0.00 0.00 0.00 0.00 0.00 0.00 0.00 26.55
Building Worker Trips 0.03 0.06 1.04 0.00 0.01 0.00 0.01 0.00 0.00 0.00 107.38
2013 1.51 0.99 1.17 0.00 0.00 0.07 0.07 0.00 0.06 0.06 174.24
Building 01/01/2011-06/30/2013 0.08 0.54 0.81 0.00 0.00 0.03 0.03 0.00 0.03 0.03 123.85
Building Off Road Diesel 0.06 0.47 0.29 0.00 0.00 0.03 0.03 0.00 0.03 0.03 57.62
Building Vendor Trips 0.00 0.05 0.04 0.00 0.00 0.00 0.00 0.00 0.00 0.00 13.12
Building Worker Trips 0.01 0.03 0.47 0.00 0.00 0.00 0.00 0.00 0.00 0.00 53.10

Page: 1
3/31/2010 12:03:45 PM
Asphalt 04/01/2013-06/30/2013 0.08 0.45 0.35 0.00 0.00 0.04 0.04 0.00 0.03 0.03 48.79
Paving Off-Gas 0.00 0.00 0.00 0.00 0.00 0.00 0.00 0.00 0.00 0.00 0.00
Paving Off Road Diesel 0.07 0.44 0.29 0.00 0.00 0.04 0.04 0.00 0.03 0.03 41.34
Paving On Road Diesel 0.00 0.00 0.00 0.00 0.00 0.00 0.00 0.00 0.00 0.00 0.81
Paving Worker Trips 0.00 0.00 0.06 0.00 0.00 0.00 0.00 0.00 0.00 0.00 6.64
Coating 04/01/2013-06/30/2013 1.35 0.00 0.01 0.00 0.00 0.00 0.00 0.00 0.00 0.00 1.61
Architectural Coating 1.35 0.00 0.00 0.00 0.00 0.00 0.00 0.00 0.00 0.00 0.00
Coating Worker Trips 0.00 0.00 0.01 0.00 0.00 0.00 0.00 0.00 0.00 0.00 1.61
Phase Assumptions
Phase: Mass Grading 10/1/2010 - 12/31/2010 - Default Fine Site Grading Description
Total Acres Disturbed: 1.2
Maximum Daily Acreage Disturbed: 0.3
Fugitive Dust Level of Detail: Default
20 lbs per acre-day
On Road Truck Travel (VMT): 106.06
Off-Road Equipment:
1 Graders (174 hp) operating at a 0.61 load factor for 6 hours per day
1 Rubber Tired Dozers (357 hp) operating at a 0.59 load factor for 6 hours per day
1 Tractors/Loaders/Backhoes (108 hp) operating at a 0.55 load factor for 7 hours per day
1 Water Trucks (189 hp) operating at a 0.5 load factor for 8 hours per day
Phase: Trenching 10/1/2010 - 12/31/2010 - Type Your Description Here
Off-Road Equipment:
2 Excavators (168 hp) operating at a 0.57 load factor for 8 hours per day
1 Other General Industrial Equipment (238 hp) operating at a 0.51 load factor for 8 hours per day
1 Tractors/Loaders/Backhoes (108 hp) operating at a 0.55 load factor for 0 hours per day
Phase: Paving 4/1/2013 - 6/30/2013 - Default Paving Description
Acres to be Paved: 1.36
Off-Road Equipment:
4 Cement and Mortar Mixers (10 hp) operating at a 0.56 load factor for 6 hours per day
1 Pavers (100 hp) operating at a 0.62 load factor for 7 hours per day
1 Paving Equipment (104 hp) operating at a 0.53 load factor for 8 hours per day
1 Rollers (95 hp) operating at a 0.56 load factor for 7 hours per day
1 Tractors/Loaders/Backhoes (108 hp) operating at a 0.55 load factor for 7 hours per day

Page: 1
3/31/2010 12:03:45 PM
Phase: Building Construction 1/1/2011 - 6/30/2013 - Default Building Construction Description
Off-Road Equipment:
1 Cranes (399 hp) operating at a 0.43 load factor for 4 hours per day
2 Forklifts (145 hp) operating at a 0.3 load factor for 6 hours per day
1 Tractors/Loaders/Backhoes (108 hp) operating at a 0.55 load factor for 8 hours per day
Phase: Architectural Coating 4/1/2013 - 6/30/2013 - Default Architectural Coating Description
Rule: Residential Interior Coatings begins 1/1/2005 ends 12/31/2040 specifies a VOC of 250
Rule: Residential Exterior Coatings begins 1/1/2005 ends 12/31/2040 specifies a VOC of 250
Rule: Nonresidential Interior Coatings begins 1/1/2005 ends 12/31/2040 specifies a VOC of 250
Rule: Nonresidential Exterior Coatings begins 1/1/2005 ends 12/31/2040 specifies a VOC of 250
Construction Mitigated Detail Report:
CONSTRUCTION EMISSION ESTIMATES Annual Tons Per Year, Mitigated
ROG NOx CO SO2 PM10 Dust PM10 Exhaust PM10 PM2.5 Dust PM2.5 Exhaust PM2.5 CO2
2010 0.18 1.51 0.79 0.00 0.08 0.07 0.16 0.02 0.07 0.09 151.56
Mass Grading 10/01/2010-
12/31/2010
0.11 0.93 0.48 0.00 0.08 0.04 0.13 0.02 0.04 0.06 91.62
Mass Grading Dust 0.00 0.00 0.00 0.00 0.08 0.00 0.08 0.02 0.00 0.02 0.00
Mass Grading Off Road Diesel 0.10 0.82 0.41 0.00 0.00 0.04 0.04 0.00 0.04 0.04 74.16
Mass Grading On Road Diesel 0.01 0.10 0.03 0.00 0.00 0.00 0.00 0.00 0.00 0.00 14.09
Mass Grading Worker Trips 0.00 0.00 0.04 0.00 0.00 0.00 0.00 0.00 0.00 0.00 3.36
Trenching 10/01/2010-12/31/2010 0.07 0.59 0.31 0.00 0.00 0.03 0.03 0.00 0.03 0.03 59.95
Trenching Off Road Diesel 0.07 0.58 0.27 0.00 0.00 0.03 0.03 0.00 0.03 0.03 56.58
Trenching Worker Trips 0.00 0.00 0.04 0.00 0.00 0.00 0.00 0.00 0.00 0.00 3.36
2011 0.19 1.29 1.83 0.00 0.01 0.08 0.08 0.00 0.07 0.07 249.49
Building 01/01/2011-06/30/2013 0.19 1.29 1.83 0.00 0.01 0.08 0.08 0.00 0.07 0.07 249.49
Building Off Road Diesel 0.14 1.11 0.61 0.00 0.00 0.07 0.07 0.00 0.06 0.06 116.14
Building Vendor Trips 0.01 0.12 0.10 0.00 0.00 0.00 0.01 0.00 0.00 0.00 26.45
Building Worker Trips 0.04 0.06 1.12 0.00 0.01 0.00 0.01 0.00 0.00 0.00 106.90
2012 0.18 1.19 1.73 0.00 0.01 0.07 0.08 0.00 0.06 0.07 250.51
Building 01/01/2011-06/30/2013 0.18 1.19 1.73 0.00 0.01 0.07 0.08 0.00 0.06 0.07 250.51
Building Off Road Diesel 0.13 1.03 0.60 0.00 0.00 0.06 0.06 0.00 0.06 0.06 116.59
Building Vendor Trips 0.01 0.11 0.09 0.00 0.00 0.00 0.00 0.00 0.00 0.00 26.55
Building Worker Trips 0.03 0.06 1.04 0.00 0.01 0.00 0.01 0.00 0.00 0.00 107.38

Page: 1
3/31/2010 12:03:45 PM
2013 1.51 0.99 1.17 0.00 0.00 0.07 0.07 0.00 0.06 0.06 174.24
Building 01/01/2011-06/30/2013 0.08 0.54 0.81 0.00 0.00 0.03 0.03 0.00 0.03 0.03 123.85
Building Off Road Diesel 0.06 0.47 0.29 0.00 0.00 0.03 0.03 0.00 0.03 0.03 57.62
Building Vendor Trips 0.00 0.05 0.04 0.00 0.00 0.00 0.00 0.00 0.00 0.00 13.12
Building Worker Trips 0.01 0.03 0.47 0.00 0.00 0.00 0.00 0.00 0.00 0.00 53.10
Asphalt 04/01/2013-06/30/2013 0.08 0.45 0.35 0.00 0.00 0.04 0.04 0.00 0.03 0.03 48.79
Paving Off-Gas 0.00 0.00 0.00 0.00 0.00 0.00 0.00 0.00 0.00 0.00 0.00
Paving Off Road Diesel 0.07 0.44 0.29 0.00 0.00 0.04 0.04 0.00 0.03 0.03 41.34
Paving On Road Diesel 0.00 0.00 0.00 0.00 0.00 0.00 0.00 0.00 0.00 0.00 0.81
Paving Worker Trips 0.00 0.00 0.06 0.00 0.00 0.00 0.00 0.00 0.00 0.00 6.64
Coating 04/01/2013-06/30/2013 1.35 0.00 0.01 0.00 0.00 0.00 0.00 0.00 0.00 0.00 1.61
Architectural Coating 1.35 0.00 0.00 0.00 0.00 0.00 0.00 0.00 0.00 0.00 0.00
Coating Worker Trips 0.00 0.00 0.01 0.00 0.00 0.00 0.00 0.00 0.00 0.00 1.61
Construction Related Mitigation Measures
The following mitigation measures apply to Phase: Mass Grading 10/1/2010 - 12/31/2010 - Default Fine Site Grading Description
For Soil Stablizing Measures, the Water exposed surfaces 2x daily watering mitigation reduces emissions by:
PM10: 55% PM25: 55%
For Unpaved Roads Measures, the Reduce speed on unpaved roads to less than 15 mph mitigation reduces emissions by:
PM10: 44% PM25: 44%
For Unpaved Roads Measures, the Manage haul road dust 2x daily watering mitigation reduces emissions by:
PM10: 55% PM25: 55%
Area Source Unmitigated Detail Report:
AREA SOURCE EMISSION ESTIMATES Annual Tons Per Year, Unmitigated
Source ROG NOx CO SO2 PM10 PM2.5 CO2
Natural Gas 0.01 0.15 0.13 0.00 0.00 0.00 183.96
Hearth
Landscape 0.01 0.00 0.14 0.00 0.00 0.00 0.25
Consumer Products 0.00
Architectural Coatings 0.13
Area Source Changes to Defaults
0.00 0.00 0.00 184.21TOTALS (tons/year, unmitigated) 0.15 0.15 0.27

Page: 13/25/2010 05:41:09 PM
0.01 1.12 0.21 607.31TOTALS (tons/year, unmitigated) 0.83 0.66 6.17
0.01 1.12 0.21 607.31R&D Center 0.83 0.66 6.17
Operational Unmitigated Detail Report:
OPERATIONAL EMISSION ESTIMATES Annual Tons Per Year, Unmitigated
Source ROG NOX CO SO2 PM10 PM25 CO2
0.01 1.12 0.21 607.31TOTALS (tons/year, unmitigated) 0.83 0.66 6.17
SUM OF AREA SOURCE AND OPERATIONAL EMISSION ESTIMATES
ROG NOx CO SO2 PM10 PM2.5 CO2
0.01 1.12 0.21 607.31TOTALS (tons/year, unmitigated) 0.83 0.66 6.17
ROG NOx CO SO2 PM10 PM2.5 CO2
OPERATIONAL (VEHICLE) EMISSION ESTIMATES
Project Location: Bay Area Air District
On-Road Vehicle Emissions Based on: Version : Emfac2007 V2.3 Nov 1 2006
Off-Road Vehicle Emissions Based on: OFFROAD2007
Summary Report:
Urbemis 2007 Version 9.2.4
Combined Annual Emissions Reports (Tons/Year)
File Name: Z:\Alan Sako\924.06 CRT\Emissions\Alt 3\CRT Alt 3 - Operational.urb924
Project Name: CRT Alternative 3 - Operations

Page: 13/25/2010 05:41:09 PM
16.7Motor Home 0.6 0.0 83.3
0.0
School Bus 0.1 0.0 0.0 100.0
Motorcycle 3.2 56.2 43.8
100.0
Urban Bus 0.1 0.0 0.0 100.0
Other Bus 0.1 0.0 0.0
80.0
Heavy-Heavy Truck 33,001-60,000 lbs 0.4 0.0 0.0 100.0
Med-Heavy Truck 14,001-33,000 lbs 1.0 0.0 20.0
22.2
Lite-Heavy Truck 10,001-14,000 lbs 0.6 0.0 50.0 50.0
Lite-Heavy Truck 8501-10,000 lbs 0.9 0.0 77.8
0.0
Med Truck 5751-8500 lbs 6.6 0.0 100.0 0.0
Light Truck 3751-5750 lbs 19.9 0.5 99.5
0.2
Light Truck < 3750 lbs 12.8 0.8 96.9 2.3
Light Auto 53.7 0.6 99.2
Vehicle Fleet Mix
Vehicle Type Percent Type Non-Catalyst Catalyst Diesel
300.00 498.00 3,566.30
498.00 3,566.30
R&D Center 1.66 unknown
Emfac: Version : Emfac2007 V2.3 Nov 1 2006
Summary of Land Uses
Land Use Type Acreage Trip Rate Unit Type No. Units Total Trips Total VMT
Operational Settings:
Includes correction for passby trips
Does not include double counting adjustment for internal trips
Analysis Year: 2013 Season: Annual

Page: 13/25/2010 05:41:09 PM
R&D Center 50.0 25.0 25.0
% of Trips - Commercial (by land use)
% of Trips - Residential 32.9 18.0 49.1
14.7 6.6 6.6
Trip speeds (mph) 35.0 35.0 35.0 35.0 35.0 35.0
Rural Trip Length (miles) 16.8 7.1 7.9
Commute Non-Work Customer
Urban Trip Length (miles) 10.8 7.3 7.5 9.5 7.4 7.4
Home-Work Home-Shop Home-Other
Travel Conditions
Residential Commercial
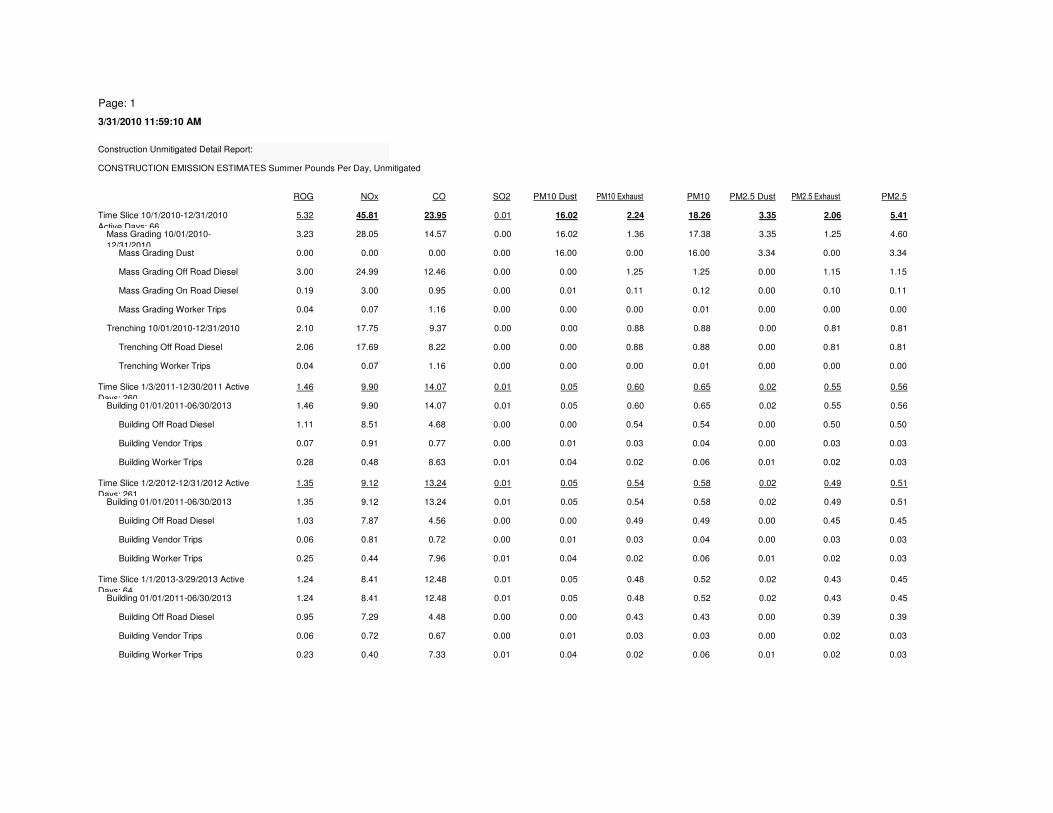
Page: 1
3/31/2010 11:59:10 AM
0.06 0.01 0.02 0.03
0.00 0.02 0.03
Building Worker Trips 0.23 0.40 7.33 0.01 0.04 0.02
0.00 0.01 0.03 0.03Building Vendor Trips 0.06 0.72 0.67
0.43 0.00 0.39 0.39
0.02 0.43 0.45
Building Off Road Diesel 0.95 7.29 4.48 0.00 0.00 0.43
0.01 0.05 0.48 0.52Building 01/01/2011-06/30/2013 1.24 8.41 12.48
0.52 0.02 0.43 0.45
0.01 0.02 0.03
Time Slice 1/1/2013-3/29/2013 Active
Days: 64
1.24 8.41 12.48 0.01 0.05 0.48
0.01 0.04 0.02 0.06Building Worker Trips 0.25 0.44 7.96
0.04 0.00 0.03 0.03
0.00 0.45 0.45
Building Vendor Trips 0.06 0.81 0.72 0.00 0.01 0.03
0.00 0.00 0.49 0.49Building Off Road Diesel 1.03 7.87 4.56
0.58 0.02 0.49 0.51
0.02 0.49 0.51
Building 01/01/2011-06/30/2013 1.35 9.12 13.24 0.01 0.05 0.54
0.01 0.05 0.54 0.58Time Slice 1/2/2012-12/31/2012 Active
Days: 261
1.35 9.12 13.24
0.06 0.01 0.02 0.03
0.00 0.03 0.03
Building Worker Trips 0.28 0.48 8.63 0.01 0.04 0.02
0.00 0.01 0.03 0.04Building Vendor Trips 0.07 0.91 0.77
0.54 0.00 0.50 0.50
0.02 0.55 0.56
Building Off Road Diesel 1.11 8.51 4.68 0.00 0.00 0.54
0.01 0.05 0.60 0.65Building 01/01/2011-06/30/2013 1.46 9.90 14.07
0.65 0.02 0.55 0.56
0.00 0.00 0.00
Time Slice 1/3/2011-12/30/2011 Active
Days: 260
1.46 9.90 14.07 0.01 0.05 0.60
0.00 0.00 0.00 0.01Trenching Worker Trips 0.04 0.07 1.16
0.88 0.00 0.81 0.81
0.00 0.81 0.81
Trenching Off Road Diesel 2.06 17.69 8.22 0.00 0.00 0.88
0.00 0.00 0.88 0.88Trenching 10/01/2010-12/31/2010 2.10 17.75 9.37
0.01 0.00 0.00 0.00
0.00 0.10 0.11
Mass Grading Worker Trips 0.04 0.07 1.16 0.00 0.00 0.00
0.00 0.01 0.11 0.12Mass Grading On Road Diesel 0.19 3.00 0.95
1.25 0.00 1.15 1.15
3.34 0.00 3.34
Mass Grading Off Road Diesel 3.00 24.99 12.46 0.00 0.00 1.25
0.00 16.00 0.00 16.00Mass Grading Dust 0.00 0.00 0.00
17.38 3.35 1.25 4.60
3.35 2.06 5.41
Mass Grading 10/01/2010-
12/31/2010
3.23 28.05 14.57 0.00 16.02 1.36
PM2.5 Exhaust PM2.5
Time Slice 10/1/2010-12/31/2010
Active Days: 66
5.32 45.81 23.95 0.01 16.02 2.24 18.26
CONSTRUCTION EMISSION ESTIMATES Summer Pounds Per Day, Unmitigated
ROG NOx CO SO2 PM10 Dust PM10 Exhaust PM10 PM2.5 Dust
Construction Unmitigated Detail Report:

Page: 1
3/31/2010 11:59:10 AM
1 Tractors/Loaders/Backhoes (108 hp) operating at a 0.55 load factor for 0 hours per day
Phase: Trenching 10/1/2010 - 12/31/2010 - Type Your Description Here
Off-Road Equipment:
2 Excavators (168 hp) operating at a 0.57 load factor for 8 hours per day
1 Other General Industrial Equipment (238 hp) operating at a 0.51 load factor for 8 hours per day
1 Rubber Tired Dozers (357 hp) operating at a 0.59 load factor for 6 hours per day
1 Tractors/Loaders/Backhoes (108 hp) operating at a 0.55 load factor for 7 hours per day
1 Water Trucks (189 hp) operating at a 0.5 load factor for 8 hours per day
20 lbs per acre-day
On Road Truck Travel (VMT): 106.06
Off-Road Equipment:
1 Graders (174 hp) operating at a 0.61 load factor for 6 hours per day
Phase: Mass Grading 10/1/2010 - 12/31/2010 - Default Fine Site Grading Description
Total Acres Disturbed: 3.2
Maximum Daily Acreage Disturbed: 0.8
Fugitive Dust Level of Detail: Default
0.00 0.00 0.00
Phase Assumptions
0.00 0.00 0.00 0.00Coating Worker Trips 0.01 0.02 0.44
0.00 0.00 0.00 0.00
0.00 0.00 0.00
Architectural Coating 41.52 0.00 0.00 0.00 0.00 0.00
0.00 0.00 0.00 0.00Coating 04/01/2013-06/30/2013 41.54 0.02 0.44
0.06 0.01 0.02 0.03
0.00 0.02 0.03
Building Worker Trips 0.23 0.40 7.33 0.01 0.04 0.02
0.00 0.01 0.03 0.03Building Vendor Trips 0.06 0.72 0.67
0.43 0.00 0.39 0.39
0.02 0.43 0.45
Building Off Road Diesel 0.95 7.29 4.48 0.00 0.00 0.43
0.01 0.05 0.48 0.52Building 01/01/2011-06/30/2013 1.24 8.41 12.48
0.02 0.00 0.00 0.01
0.00 0.00 0.00
Paving Worker Trips 0.06 0.10 1.82 0.00 0.01 0.01
0.00 0.00 0.00 0.01Paving On Road Diesel 0.01 0.12 0.04
1.15 0.00 1.05 1.05
0.00 0.00 0.00
Paving Off Road Diesel 2.19 13.60 8.91 0.00 0.00 1.15
0.00 0.00 0.00 0.00Paving Off-Gas 0.05 0.00 0.00
1.17 0.00 1.06 1.07
0.02 1.50 1.52
Asphalt 04/01/2013-06/30/2013 2.31 13.82 10.78 0.00 0.01 1.16
0.01 0.06 1.63 1.69Time Slice 4/1/2013-6/28/2013 Active
Days: 65
45.09 22.26 23.70

Page: 1
3/31/2010 11:59:10 AM
0.00 0.00 0.000.00 0.00 0.00 0.01Trenching Worker Trips 0.04 0.07 1.16
0.88 0.00 0.81 0.81
0.00 0.81 0.81
Trenching Off Road Diesel 2.06 17.69 8.22 0.00 0.00 0.88
0.00 0.00 0.88 0.88Trenching 10/01/2010-12/31/2010 2.10 17.75 9.37
0.01 0.00 0.00 0.00
0.00 0.10 0.11
Mass Grading Worker Trips 0.04 0.07 1.16 0.00 0.00 0.00
0.00 0.01 0.11 0.12Mass Grading On Road Diesel 0.19 3.00 0.95
1.25 0.00 1.15 1.15
1.36 0.00 1.36
Mass Grading Off Road Diesel 3.00 24.99 12.46 0.00 0.00 1.25
0.00 6.53 0.00 6.53Mass Grading Dust 0.00 0.00 0.00
7.92 1.37 1.25 2.62
1.37 2.06 3.43
Mass Grading 10/01/2010-
12/31/2010
3.23 28.05 14.57 0.00 6.55 1.36
PM2.5 Exhaust PM2.5
Time Slice 10/1/2010-12/31/2010
Active Days: 66
5.32 45.81 23.95 0.01 6.56 2.24 8.80
CONSTRUCTION EMISSION ESTIMATES Summer Pounds Per Day, Mitigated
ROG NOx CO SO2 PM10 Dust PM10 Exhaust PM10 PM2.5 Dust
Rule: Nonresidential Interior Coatings begins 1/1/2005 ends 12/31/2040 specifies a VOC of 250
Rule: Nonresidential Exterior Coatings begins 1/1/2005 ends 12/31/2040 specifies a VOC of 250
Construction Mitigated Detail Report:
Phase: Architectural Coating 4/1/2013 - 6/30/2013 - Default Architectural Coating Description
Rule: Residential Interior Coatings begins 1/1/2005 ends 12/31/2040 specifies a VOC of 250
Rule: Residential Exterior Coatings begins 1/1/2005 ends 12/31/2040 specifies a VOC of 250
Off-Road Equipment:
1 Cranes (399 hp) operating at a 0.43 load factor for 4 hours per day
2 Forklifts (145 hp) operating at a 0.3 load factor for 6 hours per day
1 Tractors/Loaders/Backhoes (108 hp) operating at a 0.55 load factor for 8 hours per day
1 Rollers (95 hp) operating at a 0.56 load factor for 7 hours per day
1 Tractors/Loaders/Backhoes (108 hp) operating at a 0.55 load factor for 7 hours per day
Phase: Building Construction 1/1/2011 - 6/30/2013 - Default Building Construction Description
Off-Road Equipment:
4 Cement and Mortar Mixers (10 hp) operating at a 0.56 load factor for 6 hours per day
1 Pavers (100 hp) operating at a 0.62 load factor for 7 hours per day
1 Paving Equipment (104 hp) operating at a 0.53 load factor for 8 hours per day
Phase: Paving 4/1/2013 - 6/30/2013 - Default Paving Description
Acres to be Paved: 1.36

Page: 1
3/31/2010 11:59:10 AM
0.00 0.00 0.000.00 0.00 0.00 0.00Coating Worker Trips 0.01 0.02 0.44
0.00 0.00 0.00 0.00
0.00 0.00 0.00
Architectural Coating 41.52 0.00 0.00 0.00 0.00 0.00
0.00 0.00 0.00 0.00Coating 04/01/2013-06/30/2013 41.54 0.02 0.44
0.06 0.01 0.02 0.03
0.00 0.02 0.03
Building Worker Trips 0.23 0.40 7.33 0.01 0.04 0.02
0.00 0.01 0.03 0.03Building Vendor Trips 0.06 0.72 0.67
0.43 0.00 0.39 0.39
0.02 0.43 0.45
Building Off Road Diesel 0.95 7.29 4.48 0.00 0.00 0.43
0.01 0.05 0.48 0.52Building 01/01/2011-06/30/2013 1.24 8.41 12.48
0.02 0.00 0.00 0.01
0.00 0.00 0.00
Paving Worker Trips 0.06 0.10 1.82 0.00 0.01 0.01
0.00 0.00 0.00 0.01Paving On Road Diesel 0.01 0.12 0.04
1.15 0.00 1.05 1.05
0.00 0.00 0.00
Paving Off Road Diesel 2.19 13.60 8.91 0.00 0.00 1.15
0.00 0.00 0.00 0.00Paving Off-Gas 0.05 0.00 0.00
1.17 0.00 1.06 1.07
0.02 1.50 1.52
Asphalt 04/01/2013-06/30/2013 2.31 13.82 10.78 0.00 0.01 1.16
0.01 0.06 1.63 1.69Time Slice 4/1/2013-6/28/2013 Active
Days: 65
45.09 22.26 23.70
0.06 0.01 0.02 0.03
0.00 0.02 0.03
Building Worker Trips 0.23 0.40 7.33 0.01 0.04 0.02
0.00 0.01 0.03 0.03Building Vendor Trips 0.06 0.72 0.67
0.43 0.00 0.39 0.39
0.02 0.43 0.45
Building Off Road Diesel 0.95 7.29 4.48 0.00 0.00 0.43
0.01 0.05 0.48 0.52Building 01/01/2011-06/30/2013 1.24 8.41 12.48
0.52 0.02 0.43 0.45
0.01 0.02 0.03
Time Slice 1/1/2013-3/29/2013 Active
Days: 64
1.24 8.41 12.48 0.01 0.05 0.48
0.01 0.04 0.02 0.06Building Worker Trips 0.25 0.44 7.96
0.04 0.00 0.03 0.03
0.00 0.45 0.45
Building Vendor Trips 0.06 0.81 0.72 0.00 0.01 0.03
0.00 0.00 0.49 0.49Building Off Road Diesel 1.03 7.87 4.56
0.58 0.02 0.49 0.51
0.02 0.49 0.51
Building 01/01/2011-06/30/2013 1.35 9.12 13.24 0.01 0.05 0.54
0.01 0.05 0.54 0.58Time Slice 1/2/2012-12/31/2012 Active
Days: 261
1.35 9.12 13.24
0.06 0.01 0.02 0.03
0.00 0.03 0.03
Building Worker Trips 0.28 0.48 8.63 0.01 0.04 0.02
0.00 0.01 0.03 0.04Building Vendor Trips 0.07 0.91 0.77
0.54 0.00 0.50 0.50
0.02 0.55 0.56
Building Off Road Diesel 1.11 8.51 4.68 0.00 0.00 0.54
0.01 0.05 0.60 0.65Building 01/01/2011-06/30/2013 1.46 9.90 14.07
0.65 0.02 0.55 0.56Time Slice 1/3/2011-12/30/2011 Active
Days: 260
1.46 9.90 14.07 0.01 0.05 0.60

Page: 1
3/31/2010 11:59:10 AM
Area Source Changes to Defaults
TOTALS (lbs/day, unmitigated) 0.92 0.86 2.26 0.00 0.01 0.01
Architectural Coatings 0.74
0.00 0.01 0.01
Consumer Products 0.00
Landscape 0.12 0.02 1.55
0.00 0.00 0.00
Hearth
Natural Gas 0.06 0.84 0.71
AREA SOURCE EMISSION ESTIMATES Summer Pounds Per Day, Unmitigated
Source ROG NOx CO SO2 PM10 PM2.5
PM10: 44% PM25: 44%
For Unpaved Roads Measures, the Manage haul road dust 2x daily watering mitigation reduces emissions by:
PM10: 55% PM25: 55%
Area Source Unmitigated Detail Report:
The following mitigation measures apply to Phase: Mass Grading 10/1/2010 - 12/31/2010 - Default Fine Site Grading Description
For Soil Stablizing Measures, the Water exposed surfaces 2x daily watering mitigation reduces emissions by:
PM10: 55% PM25: 55%
For Unpaved Roads Measures, the Reduce speed on unpaved roads to less than 15 mph mitigation reduces emissions by:
Construction Related Mitigation Measures
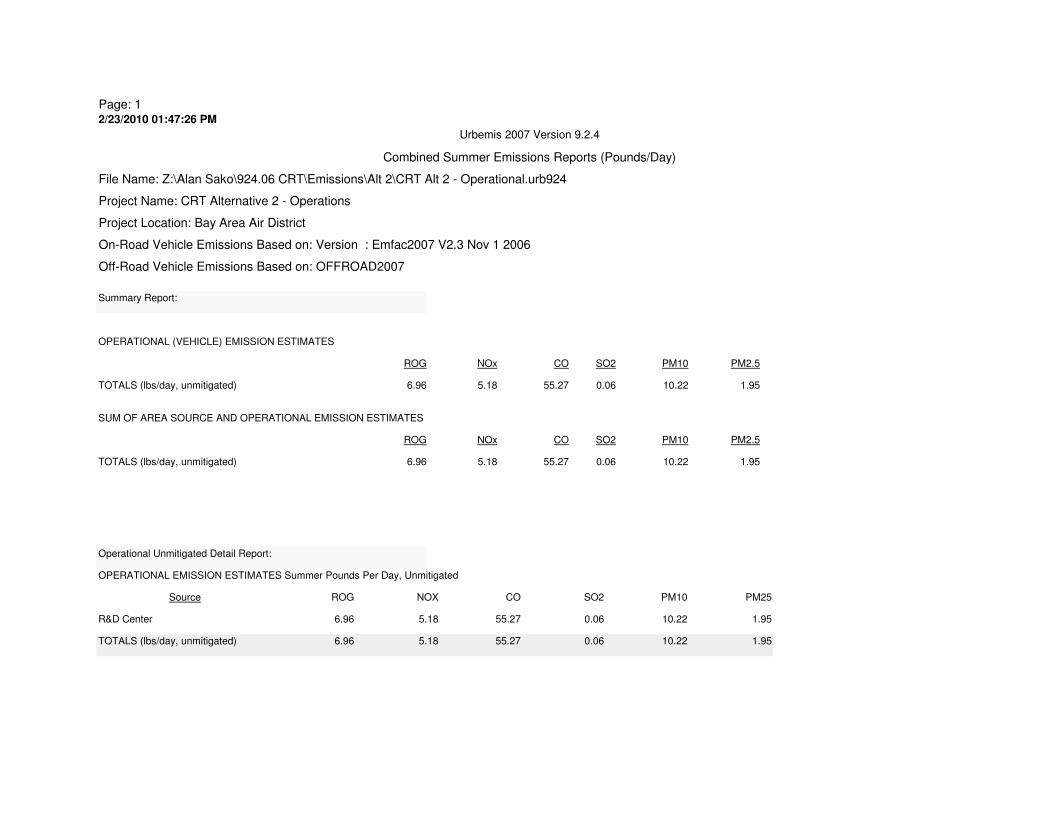
Page: 12/23/2010 01:47:26 PM
0.06 10.22 1.95
TOTALS (lbs/day, unmitigated) 6.96 5.18 55.27 0.06 10.22 1.95
R&D Center 6.96 5.18 55.27
OPERATIONAL EMISSION ESTIMATES Summer Pounds Per Day, Unmitigated
Source ROG NOX CO SO2 PM10 PM25
0.06 10.22 1.95
Operational Unmitigated Detail Report:
TOTALS (lbs/day, unmitigated) 6.96 5.18 55.27
SUM OF AREA SOURCE AND OPERATIONAL EMISSION ESTIMATES
ROG NOx CO SO2 PM10 PM2.5
SO2 PM10 PM2.5
TOTALS (lbs/day, unmitigated) 6.96 5.18 55.27 0.06 10.22 1.95
ROG NOx CO
OPERATIONAL (VEHICLE) EMISSION ESTIMATES
Project Location: Bay Area Air District
On-Road Vehicle Emissions Based on: Version : Emfac2007 V2.3 Nov 1 2006
Off-Road Vehicle Emissions Based on: OFFROAD2007
Summary Report:
Urbemis 2007 Version 9.2.4
Combined Summer Emissions Reports (Pounds/Day)
File Name: Z:\Alan Sako\924.06 CRT\Emissions\Alt 2\CRT Alt 2 - Operational.urb924
Project Name: CRT Alternative 2 - Operations

Page: 12/23/2010 01:47:26 PM
16.7Motor Home 0.6 0.0 83.3
0.0
School Bus 0.1 0.0 0.0 100.0
Motorcycle 3.2 56.2 43.8
100.0
Urban Bus 0.1 0.0 0.0 100.0
Other Bus 0.1 0.0 0.0
80.0
Heavy-Heavy Truck 33,001-60,000 lbs 0.4 0.0 0.0 100.0
Med-Heavy Truck 14,001-33,000 lbs 1.0 0.0 20.0
22.2
Lite-Heavy Truck 10,001-14,000 lbs 0.6 0.0 50.0 50.0
Lite-Heavy Truck 8501-10,000 lbs 0.9 0.0 77.8
0.0
Med Truck 5751-8500 lbs 6.6 0.0 100.0 0.0
Light Truck 3751-5750 lbs 19.9 0.5 99.5
0.2
Light Truck < 3750 lbs 12.8 0.8 96.9 2.3
Light Auto 53.7 0.6 99.2
Vehicle Fleet Mix
Vehicle Type Percent Type Non-Catalyst Catalyst Diesel
300.00 831.00 5,951.00
831.00 5,951.00
R&D Center 2.77 unknown
Emfac: Version : Emfac2007 V2.3 Nov 1 2006
Summary of Land Uses
Land Use Type Acreage Trip Rate Unit Type No. Units Total Trips Total VMT
Operational Settings:
Includes correction for passby trips
Does not include double counting adjustment for internal trips
Analysis Year: 2013 Temperature (F): 85 Season: Summer

Page: 12/23/2010 01:47:26 PM
R&D Center 50.0 25.0 25.0
% of Trips - Commercial (by land use)
% of Trips - Residential 32.9 18.0 49.1
14.7 6.6 6.6
Trip speeds (mph) 35.0 35.0 35.0 35.0 35.0 35.0
Rural Trip Length (miles) 16.8 7.1 7.9
Commute Non-Work Customer
Urban Trip Length (miles) 10.8 7.3 7.5 9.5 7.4 7.4
Home-Work Home-Shop Home-Other
Travel Conditions
Residential Commercial

0.00 0.00 0.00TOTALS (lbs/day, unmitigated) 0.80 0.84 0.71
SUM OF AREA SOURCE AND OPERATIONAL EMISSION ESTIMATES
ROG NOx CO SO2 PM10 PM2.5
SO2 PM10 PM2.5
TOTALS (lbs/day, unmitigated) 0.80 0.84 0.71 0.00 0.00 0.00
ROG NOx CO
0.02 1.50 1.52
AREA SOURCE EMISSION ESTIMATES
0.01 0.06 1.63 1.692013 TOTALS (lbs/day mitigated) 45.09 22.26 23.70
1.69 0.02 1.50 1.522013 TOTALS (lbs/day unmitigated) 45.09 22.26 23.70 0.01 0.06 1.63
0.58 0.02 0.49 0.51
0.02 0.49 0.51
2012 TOTALS (lbs/day mitigated) 1.35 9.12 13.24 0.01 0.05 0.54
0.01 0.05 0.54 0.582012 TOTALS (lbs/day unmitigated) 1.35 9.12 13.24
0.02 0.55 0.560.01 0.05 0.60 0.652011 TOTALS (lbs/day mitigated) 1.46 9.90 14.07
0.65 0.02 0.55 0.562011 TOTALS (lbs/day unmitigated) 1.46 9.90 14.07 0.01 0.05 0.60
8.80 1.37 2.06 3.43
3.35 2.06 5.41
2010 TOTALS (lbs/day mitigated) 5.32 45.81 23.95 0.01 6.56 2.24
0.01 16.02 2.24 18.262010 TOTALS (lbs/day unmitigated) 5.32 45.81 23.95
PM10 PM2.5 Dust PM2.5 Exhaust PM2.5
Off-Road Vehicle Emissions Based on: OFFROAD2007
Summary Report:
CONSTRUCTION EMISSION ESTIMATES
ROG NOx CO SO2 PM10 Dust PM10 Exhaust
File Name: Z:\Alan Sako\924.06 CRT\Emissions\Alt 2\CRT Alt 2 - Const Area.urb924
Project Name: CRT Alternative 2 - Construction and Area Source
Project Location: Bay Area Air District
On-Road Vehicle Emissions Based on: Version : Emfac2007 V2.3 Nov 1 2006
Page: 1
3/31/2010 11:59:37 AM
Urbemis 2007 Version 9.2.4
Combined Winter Emissions Reports (Pounds/Day)

Page: 1
3/31/2010 11:59:37 AM
0.02 0.00 0.00 0.01
0.00 0.00 0.00
Paving Worker Trips 0.06 0.10 1.82 0.00 0.01 0.01
0.00 0.00 0.00 0.01Paving On Road Diesel 0.01 0.12 0.04
1.15 0.00 1.05 1.05
0.00 0.00 0.00
Paving Off Road Diesel 2.19 13.60 8.91 0.00 0.00 1.15
0.00 0.00 0.00 0.00Paving Off-Gas 0.05 0.00 0.00
1.17 0.00 1.06 1.07
0.02 1.50 1.52
Asphalt 04/01/2013-06/30/2013 2.31 13.82 10.78 0.00 0.01 1.16
0.01 0.06 1.63 1.69Time Slice 4/1/2013-6/28/2013 Active
Days: 65
45.09 22.26 23.70
0.06 0.01 0.02 0.03
0.00 0.02 0.03
Building Worker Trips 0.23 0.40 7.33 0.01 0.04 0.02
0.00 0.01 0.03 0.03Building Vendor Trips 0.06 0.72 0.67
0.43 0.00 0.39 0.39
0.02 0.43 0.45
Building Off Road Diesel 0.95 7.29 4.48 0.00 0.00 0.43
0.01 0.05 0.48 0.52Building 01/01/2011-06/30/2013 1.24 8.41 12.48
0.52 0.02 0.43 0.45
0.01 0.02 0.03
Time Slice 1/1/2013-3/29/2013 Active
Days: 64
1.24 8.41 12.48 0.01 0.05 0.48
0.01 0.04 0.02 0.06Building Worker Trips 0.25 0.44 7.96
0.04 0.00 0.03 0.03
0.00 0.45 0.45
Building Vendor Trips 0.06 0.81 0.72 0.00 0.01 0.03
0.00 0.00 0.49 0.49Building Off Road Diesel 1.03 7.87 4.56
0.58 0.02 0.49 0.51
0.02 0.49 0.51
Building 01/01/2011-06/30/2013 1.35 9.12 13.24 0.01 0.05 0.54
0.01 0.05 0.54 0.58Time Slice 1/2/2012-12/31/2012 Active
Days: 261
1.35 9.12 13.24
0.06 0.01 0.02 0.03
0.00 0.03 0.03
Building Worker Trips 0.28 0.48 8.63 0.01 0.04 0.02
0.00 0.01 0.03 0.04Building Vendor Trips 0.07 0.91 0.77
0.54 0.00 0.50 0.50
0.02 0.55 0.56
Building Off Road Diesel 1.11 8.51 4.68 0.00 0.00 0.54
0.01 0.05 0.60 0.65Building 01/01/2011-06/30/2013 1.46 9.90 14.07
0.65 0.02 0.55 0.56
0.00 0.00 0.00
Time Slice 1/3/2011-12/30/2011 Active
Days: 260
1.46 9.90 14.07 0.01 0.05 0.60
0.00 0.00 0.00 0.01Trenching Worker Trips 0.04 0.07 1.16
0.88 0.00 0.81 0.81
0.00 0.81 0.81
Trenching Off Road Diesel 2.06 17.69 8.22 0.00 0.00 0.88
0.00 0.00 0.88 0.88Trenching 10/01/2010-12/31/2010 2.10 17.75 9.37
0.01 0.00 0.00 0.00
0.00 0.10 0.11
Mass Grading Worker Trips 0.04 0.07 1.16 0.00 0.00 0.00
0.00 0.01 0.11 0.12Mass Grading On Road Diesel 0.19 3.00 0.95
1.25 0.00 1.15 1.15
3.34 0.00 3.34
Mass Grading Off Road Diesel 3.00 24.99 12.46 0.00 0.00 1.25
0.00 16.00 0.00 16.00Mass Grading Dust 0.00 0.00 0.00
17.38 3.35 1.25 4.60
3.35 2.06 5.41
Mass Grading 10/01/2010-
12/31/2010
3.23 28.05 14.57 0.00 16.02 1.36
PM2.5 Exhaust PM2.5
Time Slice 10/1/2010-12/31/2010
Active Days: 66
5.32 45.81 23.95 0.01 16.02 2.24 18.26
CONSTRUCTION EMISSION ESTIMATES Winter Pounds Per Day, Unmitigated
ROG NOx CO SO2 PM10 Dust PM10 Exhaust PM10 PM2.5 Dust
Construction Unmitigated Detail Report:

Page: 1
3/31/2010 11:59:37 AM
Off-Road Equipment:
1 Cranes (399 hp) operating at a 0.43 load factor for 4 hours per day
2 Forklifts (145 hp) operating at a 0.3 load factor for 6 hours per day
1 Tractors/Loaders/Backhoes (108 hp) operating at a 0.55 load factor for 8 hours per day
1 Rollers (95 hp) operating at a 0.56 load factor for 7 hours per day
1 Tractors/Loaders/Backhoes (108 hp) operating at a 0.55 load factor for 7 hours per day
Phase: Building Construction 1/1/2011 - 6/30/2013 - Default Building Construction Description
Off-Road Equipment:
4 Cement and Mortar Mixers (10 hp) operating at a 0.56 load factor for 6 hours per day
1 Pavers (100 hp) operating at a 0.62 load factor for 7 hours per day
1 Paving Equipment (104 hp) operating at a 0.53 load factor for 8 hours per day
1 Tractors/Loaders/Backhoes (108 hp) operating at a 0.55 load factor for 0 hours per day
Phase: Paving 4/1/2013 - 6/30/2013 - Default Paving Description
Acres to be Paved: 1.36
Phase: Trenching 10/1/2010 - 12/31/2010 - Type Your Description Here
Off-Road Equipment:
2 Excavators (168 hp) operating at a 0.57 load factor for 8 hours per day
1 Other General Industrial Equipment (238 hp) operating at a 0.51 load factor for 8 hours per day
1 Rubber Tired Dozers (357 hp) operating at a 0.59 load factor for 6 hours per day
1 Tractors/Loaders/Backhoes (108 hp) operating at a 0.55 load factor for 7 hours per day
1 Water Trucks (189 hp) operating at a 0.5 load factor for 8 hours per day
20 lbs per acre-day
On Road Truck Travel (VMT): 106.06
Off-Road Equipment:
1 Graders (174 hp) operating at a 0.61 load factor for 6 hours per day
Phase: Mass Grading 10/1/2010 - 12/31/2010 - Default Fine Site Grading Description
Total Acres Disturbed: 3.2
Maximum Daily Acreage Disturbed: 0.8
Fugitive Dust Level of Detail: Default
0.00 0.00 0.00
Phase Assumptions
0.00 0.00 0.00 0.00Coating Worker Trips 0.01 0.02 0.44
0.00 0.00 0.00 0.00
0.00 0.00 0.00
Architectural Coating 41.52 0.00 0.00 0.00 0.00 0.00
0.00 0.00 0.00 0.00Coating 04/01/2013-06/30/2013 41.54 0.02 0.44
0.06 0.01 0.02 0.03
0.00 0.02 0.03
Building Worker Trips 0.23 0.40 7.33 0.01 0.04 0.02
0.00 0.01 0.03 0.03Building Vendor Trips 0.06 0.72 0.67
0.43 0.00 0.39 0.39
0.02 0.43 0.45
Building Off Road Diesel 0.95 7.29 4.48 0.00 0.00 0.43
0.01 0.05 0.48 0.52Building 01/01/2011-06/30/2013 1.24 8.41 12.48

Page: 1
3/31/2010 11:59:37 AM
0.06 0.01 0.02 0.03
0.00 0.02 0.03
Building Worker Trips 0.23 0.40 7.33 0.01 0.04 0.02
0.00 0.01 0.03 0.03Building Vendor Trips 0.06 0.72 0.67
0.43 0.00 0.39 0.39
0.02 0.43 0.45
Building Off Road Diesel 0.95 7.29 4.48 0.00 0.00 0.43
0.01 0.05 0.48 0.52Building 01/01/2011-06/30/2013 1.24 8.41 12.48
0.52 0.02 0.43 0.45
0.01 0.02 0.03
Time Slice 1/1/2013-3/29/2013 Active
Days: 64
1.24 8.41 12.48 0.01 0.05 0.48
0.01 0.04 0.02 0.06Building Worker Trips 0.25 0.44 7.96
0.04 0.00 0.03 0.03
0.00 0.45 0.45
Building Vendor Trips 0.06 0.81 0.72 0.00 0.01 0.03
0.00 0.00 0.49 0.49Building Off Road Diesel 1.03 7.87 4.56
0.58 0.02 0.49 0.51
0.02 0.49 0.51
Building 01/01/2011-06/30/2013 1.35 9.12 13.24 0.01 0.05 0.54
0.01 0.05 0.54 0.58Time Slice 1/2/2012-12/31/2012 Active
Days: 261
1.35 9.12 13.24
0.06 0.01 0.02 0.03
0.00 0.03 0.03
Building Worker Trips 0.28 0.48 8.63 0.01 0.04 0.02
0.00 0.01 0.03 0.04Building Vendor Trips 0.07 0.91 0.77
0.54 0.00 0.50 0.50
0.02 0.55 0.56
Building Off Road Diesel 1.11 8.51 4.68 0.00 0.00 0.54
0.01 0.05 0.60 0.65Building 01/01/2011-06/30/2013 1.46 9.90 14.07
0.65 0.02 0.55 0.56
0.00 0.00 0.00
Time Slice 1/3/2011-12/30/2011 Active
Days: 260
1.46 9.90 14.07 0.01 0.05 0.60
0.00 0.00 0.00 0.01Trenching Worker Trips 0.04 0.07 1.16
0.88 0.00 0.81 0.81
0.00 0.81 0.81
Trenching Off Road Diesel 2.06 17.69 8.22 0.00 0.00 0.88
0.00 0.00 0.88 0.88Trenching 10/01/2010-12/31/2010 2.10 17.75 9.37
0.01 0.00 0.00 0.00
0.00 0.10 0.11
Mass Grading Worker Trips 0.04 0.07 1.16 0.00 0.00 0.00
0.00 0.01 0.11 0.12Mass Grading On Road Diesel 0.19 3.00 0.95
1.25 0.00 1.15 1.15
1.36 0.00 1.36
Mass Grading Off Road Diesel 3.00 24.99 12.46 0.00 0.00 1.25
0.00 6.53 0.00 6.53Mass Grading Dust 0.00 0.00 0.00
7.92 1.37 1.25 2.62
1.37 2.06 3.43
Mass Grading 10/01/2010-
12/31/2010
3.23 28.05 14.57 0.00 6.55 1.36
PM2.5 Exhaust PM2.5
Time Slice 10/1/2010-12/31/2010
Active Days: 66
5.32 45.81 23.95 0.01 6.56 2.24 8.80
CONSTRUCTION EMISSION ESTIMATES Winter Pounds Per Day, Mitigated
ROG NOx CO SO2 PM10 Dust PM10 Exhaust PM10 PM2.5 Dust
Rule: Nonresidential Interior Coatings begins 1/1/2005 ends 12/31/2040 specifies a VOC of 250
Rule: Nonresidential Exterior Coatings begins 1/1/2005 ends 12/31/2040 specifies a VOC of 250
Construction Mitigated Detail Report:
Phase: Architectural Coating 4/1/2013 - 6/30/2013 - Default Architectural Coating Description
Rule: Residential Interior Coatings begins 1/1/2005 ends 12/31/2040 specifies a VOC of 250
Rule: Residential Exterior Coatings begins 1/1/2005 ends 12/31/2040 specifies a VOC of 250

Page: 1
3/31/2010 11:59:37 AM
Area Source Changes to Defaults
TOTALS (lbs/day, unmitigated) 0.80 0.84 0.71 0.00 0.00 0.00
Architectural Coatings 0.74
Consumer Products 0.00
Landscaping - No Winter Emissions
0.00 0.00 0.00
Hearth
Natural Gas 0.06 0.84 0.71
AREA SOURCE EMISSION ESTIMATES Winter Pounds Per Day, Unmitigated
Source ROG NOx CO SO2 PM10 PM2.5
PM10: 44% PM25: 44%
For Unpaved Roads Measures, the Manage haul road dust 2x daily watering mitigation reduces emissions by:
PM10: 55% PM25: 55%
Area Source Unmitigated Detail Report:
The following mitigation measures apply to Phase: Mass Grading 10/1/2010 - 12/31/2010 - Default Fine Site Grading Description
For Soil Stablizing Measures, the Water exposed surfaces 2x daily watering mitigation reduces emissions by:
PM10: 55% PM25: 55%
For Unpaved Roads Measures, the Reduce speed on unpaved roads to less than 15 mph mitigation reduces emissions by:
0.00 0.00 0.00
Construction Related Mitigation Measures
0.00 0.00 0.00 0.00Coating Worker Trips 0.01 0.02 0.44
0.00 0.00 0.00 0.00
0.00 0.00 0.00
Architectural Coating 41.52 0.00 0.00 0.00 0.00 0.00
0.00 0.00 0.00 0.00Coating 04/01/2013-06/30/2013 41.54 0.02 0.44
0.06 0.01 0.02 0.03
0.00 0.02 0.03
Building Worker Trips 0.23 0.40 7.33 0.01 0.04 0.02
0.00 0.01 0.03 0.03Building Vendor Trips 0.06 0.72 0.67
0.43 0.00 0.39 0.39
0.02 0.43 0.45
Building Off Road Diesel 0.95 7.29 4.48 0.00 0.00 0.43
0.01 0.05 0.48 0.52Building 01/01/2011-06/30/2013 1.24 8.41 12.48
0.02 0.00 0.00 0.01
0.00 0.00 0.00
Paving Worker Trips 0.06 0.10 1.82 0.00 0.01 0.01
0.00 0.00 0.00 0.01Paving On Road Diesel 0.01 0.12 0.04
1.15 0.00 1.05 1.05
0.00 0.00 0.00
Paving Off Road Diesel 2.19 13.60 8.91 0.00 0.00 1.15
0.00 0.00 0.00 0.00Paving Off-Gas 0.05 0.00 0.00
1.17 0.00 1.06 1.07
0.02 1.50 1.52
Asphalt 04/01/2013-06/30/2013 2.31 13.82 10.78 0.00 0.01 1.16
0.01 0.06 1.63 1.69Time Slice 4/1/2013-6/28/2013 Active
Days: 65
45.09 22.26 23.70

Page: 12/23/2010 01:47:41 PM
0.05 10.22 1.95
TOTALS (lbs/day, unmitigated) 5.17 7.72 58.59 0.05 10.22 1.95
R&D Center 5.17 7.72 58.59
OPERATIONAL EMISSION ESTIMATES Winter Pounds Per Day, Unmitigated
Source ROG NOX CO SO2 PM10 PM25
0.05 10.22 1.95
Operational Unmitigated Detail Report:
TOTALS (lbs/day, unmitigated) 5.17 7.72 58.59
SUM OF AREA SOURCE AND OPERATIONAL EMISSION ESTIMATES
ROG NOx CO SO2 PM10 PM2.5
SO2 PM10 PM2.5
TOTALS (lbs/day, unmitigated) 5.17 7.72 58.59 0.05 10.22 1.95
ROG NOx CO
OPERATIONAL (VEHICLE) EMISSION ESTIMATES
Project Location: Bay Area Air District
On-Road Vehicle Emissions Based on: Version : Emfac2007 V2.3 Nov 1 2006
Off-Road Vehicle Emissions Based on: OFFROAD2007
Summary Report:
Urbemis 2007 Version 9.2.4
Combined Winter Emissions Reports (Pounds/Day)
File Name: Z:\Alan Sako\924.06 CRT\Emissions\Alt 2\CRT Alt 2 - Operational.urb924
Project Name: CRT Alternative 2 - Operations

Page: 12/23/2010 01:47:41 PM
16.7Motor Home 0.6 0.0 83.3
0.0
School Bus 0.1 0.0 0.0 100.0
Motorcycle 3.2 56.2 43.8
100.0
Urban Bus 0.1 0.0 0.0 100.0
Other Bus 0.1 0.0 0.0
80.0
Heavy-Heavy Truck 33,001-60,000 lbs 0.4 0.0 0.0 100.0
Med-Heavy Truck 14,001-33,000 lbs 1.0 0.0 20.0
22.2
Lite-Heavy Truck 10,001-14,000 lbs 0.6 0.0 50.0 50.0
Lite-Heavy Truck 8501-10,000 lbs 0.9 0.0 77.8
0.0
Med Truck 5751-8500 lbs 6.6 0.0 100.0 0.0
Light Truck 3751-5750 lbs 19.9 0.5 99.5
0.2
Light Truck < 3750 lbs 12.8 0.8 96.9 2.3
Light Auto 53.7 0.6 99.2
Vehicle Fleet Mix
Vehicle Type Percent Type Non-Catalyst Catalyst Diesel
300.00 831.00 5,951.00
831.00 5,951.00
R&D Center 2.77 unknown
Emfac: Version : Emfac2007 V2.3 Nov 1 2006
Summary of Land Uses
Land Use Type Acreage Trip Rate Unit Type No. Units Total Trips Total VMT
Operational Settings:
Includes correction for passby trips
Does not include double counting adjustment for internal trips
Analysis Year: 2013 Temperature (F): 40 Season: Winter

Page: 12/23/2010 01:47:41 PM
R&D Center 50.0 25.0 25.0
% of Trips - Commercial (by land use)
% of Trips - Residential 32.9 18.0 49.1
14.7 6.6 6.6
Trip speeds (mph) 35.0 35.0 35.0 35.0 35.0 35.0
Rural Trip Length (miles) 16.8 7.1 7.9
Commute Non-Work Customer
Urban Trip Length (miles) 10.8 7.3 7.5 9.5 7.4 7.4
Home-Work Home-Shop Home-Other
Travel Conditions
Residential Commercial

Page: 1
3/31/2010 11:59:53 AM
Urbemis 2007 Version 9.2.4
Combined Annual Emissions Reports (Tons/Year)
File Name: Z:\Alan Sako\924.06 CRT\Emissions\Alt 2\CRT Alt 2 - Const Area.urb924
Project Name: CRT Alternative 2 - Construction and Area Source
Project Location: Bay Area Air District
On-Road Vehicle Emissions Based on: Version : Emfac2007 V2.3 Nov 1 2006
Off-Road Vehicle Emissions Based on: OFFROAD2007
Summary Report:
CONSTRUCTION EMISSION ESTIMATES
ROG NOx CO SO2 PM10 Dust PM10 Exhaust PM10 PM2.5 Dust PM2.5 Exhaust PM2.5 CO2
2010 TOTALS (tons/year unmitigated) 0.18 1.51 0.79 0.00 0.53 0.07 0.60 0.11 0.07 0.18 151.56
2010 TOTALS (tons/year mitigated) 0.18 1.51 0.79 0.00 0.22 0.07 0.29 0.05 0.07 0.11 151.56
Percent Reduction 0.00 0.00 0.00 0.00 59.07 0.00 51.82 59.01 0.00 36.54 0.00
2011 TOTALS (tons/year unmitigated) 0.19 1.29 1.83 0.00 0.01 0.08 0.08 0.00 0.07 0.07 249.49
2011 TOTALS (tons/year mitigated) 0.19 1.29 1.83 0.00 0.01 0.08 0.08 0.00 0.07 0.07 249.49
Percent Reduction 0.00 0.00 0.00 0.00 0.00 0.00 0.00 0.00 0.00 0.00 0.00
2012 TOTALS (tons/year unmitigated) 0.18 1.19 1.73 0.00 0.01 0.07 0.08 0.00 0.06 0.07 250.51
2012 TOTALS (tons/year mitigated) 0.18 1.19 1.73 0.00 0.01 0.07 0.08 0.00 0.06 0.07 250.51
Percent Reduction 0.00 0.00 0.00 0.00 0.00 0.00 0.00 0.00 0.00 0.00 0.00
2013 TOTALS (tons/year unmitigated) 1.51 0.99 1.17 0.00 0.00 0.07 0.07 0.00 0.06 0.06 174.24
2013 TOTALS (tons/year mitigated) 1.51 0.99 1.17 0.00 0.00 0.07 0.07 0.00 0.06 0.06 174.24
Percent Reduction 0.00 0.00 0.00 0.00 0.00 0.00 0.00 0.00 0.00 0.00 0.00
AREA SOURCE EMISSION ESTIMATES
ROG NOx CO SO2 PM10 PM2.5 CO2
TOTALS (tons/year, unmitigated) 0.15 0.15 0.27 0.00 0.00 0.00 184.21

Page: 1
3/31/2010 11:59:53 AM
SUM OF AREA SOURCE AND OPERATIONAL EMISSION ESTIMATES
ROG NOx CO SO2 PM10 PM2.5 CO2
TOTALS (tons/year, unmitigated) 0.15 0.15 0.27 0.00 0.00 0.00 184.21
Construction Unmitigated Detail Report:
CONSTRUCTION EMISSION ESTIMATES Annual Tons Per Year, Unmitigated
ROG NOx CO SO2 PM10 Dust PM10 Exhaust PM10 PM2.5 Dust PM2.5 Exhaust PM2.5 CO2
2010 0.18 1.51 0.79 0.00 0.53 0.07 0.60 0.11 0.07 0.18 151.56
Mass Grading 10/01/2010-
12/31/2010
0.11 0.93 0.48 0.00 0.53 0.04 0.57 0.11 0.04 0.15 91.62
Mass Grading Dust 0.00 0.00 0.00 0.00 0.53 0.00 0.53 0.11 0.00 0.11 0.00
Mass Grading Off Road Diesel 0.10 0.82 0.41 0.00 0.00 0.04 0.04 0.00 0.04 0.04 74.16
Mass Grading On Road Diesel 0.01 0.10 0.03 0.00 0.00 0.00 0.00 0.00 0.00 0.00 14.09
Mass Grading Worker Trips 0.00 0.00 0.04 0.00 0.00 0.00 0.00 0.00 0.00 0.00 3.36
Trenching 10/01/2010-12/31/2010 0.07 0.59 0.31 0.00 0.00 0.03 0.03 0.00 0.03 0.03 59.95
Trenching Off Road Diesel 0.07 0.58 0.27 0.00 0.00 0.03 0.03 0.00 0.03 0.03 56.58
Trenching Worker Trips 0.00 0.00 0.04 0.00 0.00 0.00 0.00 0.00 0.00 0.00 3.36
2011 0.19 1.29 1.83 0.00 0.01 0.08 0.08 0.00 0.07 0.07 249.49
Building 01/01/2011-06/30/2013 0.19 1.29 1.83 0.00 0.01 0.08 0.08 0.00 0.07 0.07 249.49
Building Off Road Diesel 0.14 1.11 0.61 0.00 0.00 0.07 0.07 0.00 0.06 0.06 116.14
Building Vendor Trips 0.01 0.12 0.10 0.00 0.00 0.00 0.01 0.00 0.00 0.00 26.45
Building Worker Trips 0.04 0.06 1.12 0.00 0.01 0.00 0.01 0.00 0.00 0.00 106.90
2012 0.18 1.19 1.73 0.00 0.01 0.07 0.08 0.00 0.06 0.07 250.51
Building 01/01/2011-06/30/2013 0.18 1.19 1.73 0.00 0.01 0.07 0.08 0.00 0.06 0.07 250.51
Building Off Road Diesel 0.13 1.03 0.60 0.00 0.00 0.06 0.06 0.00 0.06 0.06 116.59
Building Vendor Trips 0.01 0.11 0.09 0.00 0.00 0.00 0.00 0.00 0.00 0.00 26.55
Building Worker Trips 0.03 0.06 1.04 0.00 0.01 0.00 0.01 0.00 0.00 0.00 107.38
2013 1.51 0.99 1.17 0.00 0.00 0.07 0.07 0.00 0.06 0.06 174.24
Building 01/01/2011-06/30/2013 0.08 0.54 0.81 0.00 0.00 0.03 0.03 0.00 0.03 0.03 123.85
Building Off Road Diesel 0.06 0.47 0.29 0.00 0.00 0.03 0.03 0.00 0.03 0.03 57.62
Building Vendor Trips 0.00 0.05 0.04 0.00 0.00 0.00 0.00 0.00 0.00 0.00 13.12
Building Worker Trips 0.01 0.03 0.47 0.00 0.00 0.00 0.00 0.00 0.00 0.00 53.10

Page: 1
3/31/2010 11:59:53 AM
Asphalt 04/01/2013-06/30/2013 0.08 0.45 0.35 0.00 0.00 0.04 0.04 0.00 0.03 0.03 48.79
Paving Off-Gas 0.00 0.00 0.00 0.00 0.00 0.00 0.00 0.00 0.00 0.00 0.00
Paving Off Road Diesel 0.07 0.44 0.29 0.00 0.00 0.04 0.04 0.00 0.03 0.03 41.34
Paving On Road Diesel 0.00 0.00 0.00 0.00 0.00 0.00 0.00 0.00 0.00 0.00 0.81
Paving Worker Trips 0.00 0.00 0.06 0.00 0.00 0.00 0.00 0.00 0.00 0.00 6.64
Coating 04/01/2013-06/30/2013 1.35 0.00 0.01 0.00 0.00 0.00 0.00 0.00 0.00 0.00 1.61
Architectural Coating 1.35 0.00 0.00 0.00 0.00 0.00 0.00 0.00 0.00 0.00 0.00
Coating Worker Trips 0.00 0.00 0.01 0.00 0.00 0.00 0.00 0.00 0.00 0.00 1.61
Phase Assumptions
Phase: Mass Grading 10/1/2010 - 12/31/2010 - Default Fine Site Grading Description
Total Acres Disturbed: 3.2
Maximum Daily Acreage Disturbed: 0.8
Fugitive Dust Level of Detail: Default
20 lbs per acre-day
On Road Truck Travel (VMT): 106.06
Off-Road Equipment:
1 Graders (174 hp) operating at a 0.61 load factor for 6 hours per day
1 Rubber Tired Dozers (357 hp) operating at a 0.59 load factor for 6 hours per day
1 Tractors/Loaders/Backhoes (108 hp) operating at a 0.55 load factor for 7 hours per day
1 Water Trucks (189 hp) operating at a 0.5 load factor for 8 hours per day
Phase: Trenching 10/1/2010 - 12/31/2010 - Type Your Description Here
Off-Road Equipment:
2 Excavators (168 hp) operating at a 0.57 load factor for 8 hours per day
1 Other General Industrial Equipment (238 hp) operating at a 0.51 load factor for 8 hours per day
1 Tractors/Loaders/Backhoes (108 hp) operating at a 0.55 load factor for 0 hours per day
Phase: Paving 4/1/2013 - 6/30/2013 - Default Paving Description
Acres to be Paved: 1.36
Off-Road Equipment:
4 Cement and Mortar Mixers (10 hp) operating at a 0.56 load factor for 6 hours per day
1 Pavers (100 hp) operating at a 0.62 load factor for 7 hours per day
1 Paving Equipment (104 hp) operating at a 0.53 load factor for 8 hours per day
1 Rollers (95 hp) operating at a 0.56 load factor for 7 hours per day
1 Tractors/Loaders/Backhoes (108 hp) operating at a 0.55 load factor for 7 hours per day

Page: 1
3/31/2010 11:59:53 AM
Phase: Building Construction 1/1/2011 - 6/30/2013 - Default Building Construction Description
Off-Road Equipment:
1 Cranes (399 hp) operating at a 0.43 load factor for 4 hours per day
2 Forklifts (145 hp) operating at a 0.3 load factor for 6 hours per day
1 Tractors/Loaders/Backhoes (108 hp) operating at a 0.55 load factor for 8 hours per day
Phase: Architectural Coating 4/1/2013 - 6/30/2013 - Default Architectural Coating Description
Rule: Residential Interior Coatings begins 1/1/2005 ends 12/31/2040 specifies a VOC of 250
Rule: Residential Exterior Coatings begins 1/1/2005 ends 12/31/2040 specifies a VOC of 250
Rule: Nonresidential Interior Coatings begins 1/1/2005 ends 12/31/2040 specifies a VOC of 250
Rule: Nonresidential Exterior Coatings begins 1/1/2005 ends 12/31/2040 specifies a VOC of 250
Construction Mitigated Detail Report:
CONSTRUCTION EMISSION ESTIMATES Annual Tons Per Year, Mitigated
ROG NOx CO SO2 PM10 Dust PM10 Exhaust PM10 PM2.5 Dust PM2.5 Exhaust PM2.5 CO2
2010 0.18 1.51 0.79 0.00 0.22 0.07 0.29 0.05 0.07 0.11 151.56
Mass Grading 10/01/2010-
12/31/2010
0.11 0.93 0.48 0.00 0.22 0.04 0.26 0.05 0.04 0.09 91.62
Mass Grading Dust 0.00 0.00 0.00 0.00 0.22 0.00 0.22 0.05 0.00 0.05 0.00
Mass Grading Off Road Diesel 0.10 0.82 0.41 0.00 0.00 0.04 0.04 0.00 0.04 0.04 74.16
Mass Grading On Road Diesel 0.01 0.10 0.03 0.00 0.00 0.00 0.00 0.00 0.00 0.00 14.09
Mass Grading Worker Trips 0.00 0.00 0.04 0.00 0.00 0.00 0.00 0.00 0.00 0.00 3.36
Trenching 10/01/2010-12/31/2010 0.07 0.59 0.31 0.00 0.00 0.03 0.03 0.00 0.03 0.03 59.95
Trenching Off Road Diesel 0.07 0.58 0.27 0.00 0.00 0.03 0.03 0.00 0.03 0.03 56.58
Trenching Worker Trips 0.00 0.00 0.04 0.00 0.00 0.00 0.00 0.00 0.00 0.00 3.36
2011 0.19 1.29 1.83 0.00 0.01 0.08 0.08 0.00 0.07 0.07 249.49
Building 01/01/2011-06/30/2013 0.19 1.29 1.83 0.00 0.01 0.08 0.08 0.00 0.07 0.07 249.49
Building Off Road Diesel 0.14 1.11 0.61 0.00 0.00 0.07 0.07 0.00 0.06 0.06 116.14
Building Vendor Trips 0.01 0.12 0.10 0.00 0.00 0.00 0.01 0.00 0.00 0.00 26.45
Building Worker Trips 0.04 0.06 1.12 0.00 0.01 0.00 0.01 0.00 0.00 0.00 106.90
2012 0.18 1.19 1.73 0.00 0.01 0.07 0.08 0.00 0.06 0.07 250.51
Building 01/01/2011-06/30/2013 0.18 1.19 1.73 0.00 0.01 0.07 0.08 0.00 0.06 0.07 250.51
Building Off Road Diesel 0.13 1.03 0.60 0.00 0.00 0.06 0.06 0.00 0.06 0.06 116.59
Building Vendor Trips 0.01 0.11 0.09 0.00 0.00 0.00 0.00 0.00 0.00 0.00 26.55
Building Worker Trips 0.03 0.06 1.04 0.00 0.01 0.00 0.01 0.00 0.00 0.00 107.38
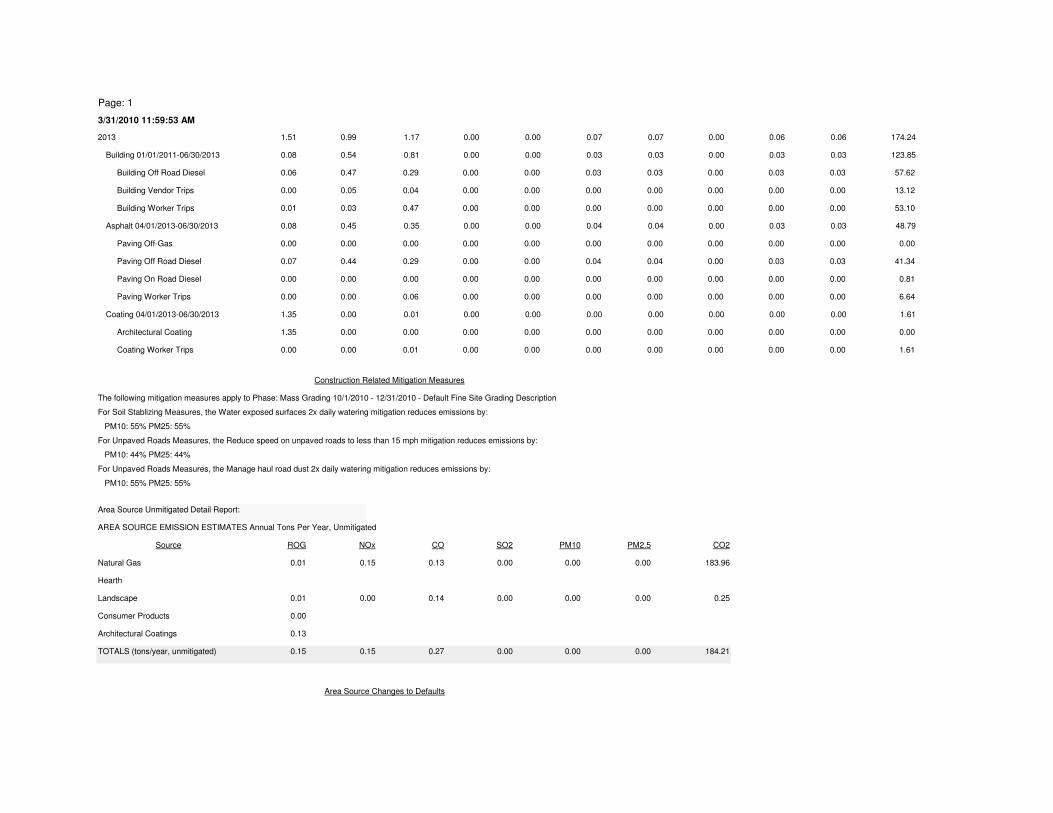
Page: 1
3/31/2010 11:59:53 AM
2013 1.51 0.99 1.17 0.00 0.00 0.07 0.07 0.00 0.06 0.06 174.24
Building 01/01/2011-06/30/2013 0.08 0.54 0.81 0.00 0.00 0.03 0.03 0.00 0.03 0.03 123.85
Building Off Road Diesel 0.06 0.47 0.29 0.00 0.00 0.03 0.03 0.00 0.03 0.03 57.62
Building Vendor Trips 0.00 0.05 0.04 0.00 0.00 0.00 0.00 0.00 0.00 0.00 13.12
Building Worker Trips 0.01 0.03 0.47 0.00 0.00 0.00 0.00 0.00 0.00 0.00 53.10
Asphalt 04/01/2013-06/30/2013 0.08 0.45 0.35 0.00 0.00 0.04 0.04 0.00 0.03 0.03 48.79
Paving Off-Gas 0.00 0.00 0.00 0.00 0.00 0.00 0.00 0.00 0.00 0.00 0.00
Paving Off Road Diesel 0.07 0.44 0.29 0.00 0.00 0.04 0.04 0.00 0.03 0.03 41.34
Paving On Road Diesel 0.00 0.00 0.00 0.00 0.00 0.00 0.00 0.00 0.00 0.00 0.81
Paving Worker Trips 0.00 0.00 0.06 0.00 0.00 0.00 0.00 0.00 0.00 0.00 6.64
Coating 04/01/2013-06/30/2013 1.35 0.00 0.01 0.00 0.00 0.00 0.00 0.00 0.00 0.00 1.61
Architectural Coating 1.35 0.00 0.00 0.00 0.00 0.00 0.00 0.00 0.00 0.00 0.00
Coating Worker Trips 0.00 0.00 0.01 0.00 0.00 0.00 0.00 0.00 0.00 0.00 1.61
Construction Related Mitigation Measures
The following mitigation measures apply to Phase: Mass Grading 10/1/2010 - 12/31/2010 - Default Fine Site Grading Description
For Soil Stablizing Measures, the Water exposed surfaces 2x daily watering mitigation reduces emissions by:
PM10: 55% PM25: 55%
For Unpaved Roads Measures, the Reduce speed on unpaved roads to less than 15 mph mitigation reduces emissions by:
PM10: 44% PM25: 44%
For Unpaved Roads Measures, the Manage haul road dust 2x daily watering mitigation reduces emissions by:
PM10: 55% PM25: 55%
Area Source Unmitigated Detail Report:
AREA SOURCE EMISSION ESTIMATES Annual Tons Per Year, Unmitigated
Source ROG NOx CO SO2 PM10 PM2.5 CO2
Natural Gas 0.01 0.15 0.13 0.00 0.00 0.00 183.96
Hearth
Landscape 0.01 0.00 0.14 0.00 0.00 0.00 0.25
Consumer Products 0.00
Architectural Coatings 0.13
Area Source Changes to Defaults
0.00 0.00 0.00 184.21TOTALS (tons/year, unmitigated) 0.15 0.15 0.27

Page: 12/23/2010 01:47:55 PM
0.01 1.87 0.36 1,013.41TOTALS (tons/year, unmitigated) 1.16 1.10 10.29
0.01 1.87 0.36 1,013.41R&D Center 1.16 1.10 10.29
Operational Unmitigated Detail Report:
OPERATIONAL EMISSION ESTIMATES Annual Tons Per Year, Unmitigated
Source ROG NOX CO SO2 PM10 PM25 CO2
0.01 1.87 0.36 1,013.41TOTALS (tons/year, unmitigated) 1.16 1.10 10.29
SUM OF AREA SOURCE AND OPERATIONAL EMISSION ESTIMATES
ROG NOx CO SO2 PM10 PM2.5 CO2
0.01 1.87 0.36 1,013.41TOTALS (tons/year, unmitigated) 1.16 1.10 10.29
ROG NOx CO SO2 PM10 PM2.5 CO2
OPERATIONAL (VEHICLE) EMISSION ESTIMATES
Project Location: Bay Area Air District
On-Road Vehicle Emissions Based on: Version : Emfac2007 V2.3 Nov 1 2006
Off-Road Vehicle Emissions Based on: OFFROAD2007
Summary Report:
Urbemis 2007 Version 9.2.4
Combined Annual Emissions Reports (Tons/Year)
File Name: Z:\Alan Sako\924.06 CRT\Emissions\Alt 2\CRT Alt 2 - Operational.urb924
Project Name: CRT Alternative 2 - Operations

Page: 12/23/2010 01:47:55 PM
16.7Motor Home 0.6 0.0 83.3
0.0
School Bus 0.1 0.0 0.0 100.0
Motorcycle 3.2 56.2 43.8
100.0
Urban Bus 0.1 0.0 0.0 100.0
Other Bus 0.1 0.0 0.0
80.0
Heavy-Heavy Truck 33,001-60,000 lbs 0.4 0.0 0.0 100.0
Med-Heavy Truck 14,001-33,000 lbs 1.0 0.0 20.0
22.2
Lite-Heavy Truck 10,001-14,000 lbs 0.6 0.0 50.0 50.0
Lite-Heavy Truck 8501-10,000 lbs 0.9 0.0 77.8
0.0
Med Truck 5751-8500 lbs 6.6 0.0 100.0 0.0
Light Truck 3751-5750 lbs 19.9 0.5 99.5
0.2
Light Truck < 3750 lbs 12.8 0.8 96.9 2.3
Light Auto 53.7 0.6 99.2
Vehicle Fleet Mix
Vehicle Type Percent Type Non-Catalyst Catalyst Diesel
300.00 831.00 5,951.00
831.00 5,951.00
R&D Center 2.77 unknown
Emfac: Version : Emfac2007 V2.3 Nov 1 2006
Summary of Land Uses
Land Use Type Acreage Trip Rate Unit Type No. Units Total Trips Total VMT
Operational Settings:
Includes correction for passby trips
Does not include double counting adjustment for internal trips
Analysis Year: 2013 Season: Annual

Page: 12/23/2010 01:47:55 PM
R&D Center 50.0 25.0 25.0
% of Trips - Commercial (by land use)
% of Trips - Residential 32.9 18.0 49.1
14.7 6.6 6.6
Trip speeds (mph) 35.0 35.0 35.0 35.0 35.0 35.0
Rural Trip Length (miles) 16.8 7.1 7.9
Commute Non-Work Customer
Urban Trip Length (miles) 10.8 7.3 7.5 9.5 7.4 7.4
Home-Work Home-Shop Home-Other
Travel Conditions
Residential Commercial


