Alameda-Contra Costa Transit District (AC Transit) Fuel … · Alameda-Contra Costa Transit...
30
A national laboratory of the U.S. Department of Energy Office of Energy Efficiency & Renewable Energy National Renewable Energy Laboratory Innovation for Our Energy Future Alameda-Contra Costa Transit District (AC Transit) Fuel Cell Transit Buses: Third Evaluation Report Appendices Kevin Chandler, Battelle Leslie Eudy, National Renewable Energy Laboratory Link to Report Technical Report NREL/TP-560-43545-2 July 2008 NREL is operated by Midwest Research Institute ● Battelle Contract No. DE-AC36-99-GO10337
Transcript of Alameda-Contra Costa Transit District (AC Transit) Fuel … · Alameda-Contra Costa Transit...

A national laboratory of the U.S. Department of EnergyOffice of Energy Efficiency & Renewable Energy
National Renewable Energy Laboratory Innovation for Our Energy Future
Alameda-Contra Costa Transit District (AC Transit) Fuel Cell Transit Buses: Third Evaluation Report Appendices Kevin Chandler, Battelle Leslie Eudy, National Renewable Energy Laboratory Link to Report
Technical Report NREL/TP-560-43545-2 July 2008
NREL is operated by Midwest Research Institute ● Battelle Contract No. DE-AC36-99-GO10337

Alameda-Contra Costa Transit District (AC Transit) Fuel Cell Transit Buses: Third Evaluation Report Appendices Kevin Chandler, Battelle Leslie Eudy, National Renewable Energy Laboratory
Prepared under Task No. H270.8200
Technical Report NREL/TP-560-43545-2 July 2008
National Renewable Energy Laboratory1617 Cole Boulevard, Golden, Colorado 80401-3393 303-275-3000 • www.nrel.gov
Operated for the U.S. Department of Energy Office of Energy Efficiency and Renewable Energy by Midwest Research Institute • Battelle
Contract No. DE-AC36-99-GO10337

NOTICE
This report was prepared as an account of work sponsored by an agency of the United States government. Neither the United States government nor any agency thereof, nor any of their employees, makes any warranty, express or implied, or assumes any legal liability or responsibility for the accuracy, completeness, or usefulness of any information, apparatus, product, or process disclosed, or represents that its use would not infringe privately owned rights. Reference herein to any specific commercial product, process, or service by trade name, trademark, manufacturer, or otherwise does not necessarily constitute or imply its endorsement, recommendation, or favoring by the United States government or any agency thereof. The views and opinions of authors expressed herein do not necessarily state or reflect those of the United States government or any agency thereof.
Available electronically at http://www.osti.gov/bridge
Available for a processing fee to U.S. Department of Energy and its contractors, in paper, from:
U.S. Department of Energy Office of Scientific and Technical Information P.O. Box 62 Oak Ridge, TN 37831-0062 phone: 865.576.8401 fax: 865.576.5728 email: mailto:[email protected]
Available for sale to the public, in paper, from: U.S. Department of Commerce National Technical Information Service 5285 Port Royal Road Springfield, VA 22161 phone: 800.553.6847 fax: 703.605.6900 email: [email protected] online ordering: http://www.ntis.gov/ordering.htm
Printed on paper containing at least 50% wastepaper, including 20% postconsumer waste

Contents Appendix A: AC Transit Description Appendix B: Evaluation Bus Technology Descriptions Appendix C: Evaluation Infrastructure Description Appendix D: NREL Transit Bus Evaluation Activities Appendix E: Fleet Summary Statistics Appendix F: Fleet Summary Statistics – SI Units
iii

Introduction to the Appendices NREL has reported evaluation results for fuel cell buses since 2003. These reports include background on the transit agency, the buses, infrastructure, and overall experience operating fuel cell buses. Several reports are planned for each evaluation site. The first data report typically includes extensive background material plus an analysis of the first round of data. Update reports follow the initial publication, focusing on the newest data analysis and lessons learned since the previous report. The authors would like to provide more focus on the data, without depriving new readers of the background and context on the transit agency and the technology. These appendices, referenced in the main report, are designed to provide the full background for the evaluation. They will be updated as new information is collected, but will contain the original background material from the first report. Both parts are downloaded separately. A Web link is provided on the cover to allow the reader to download the main report.
All NREL publications on hydrogen and fuel cell buses are available at: http://www.nrel.gov/hydrogen/proj_fc_bus_eval.html
iv

Appendix A: AC Transit Description Host Site Profile The Alameda-Contra Costa Transit District1 (AC Transit) provides public transit service in the East Bay area which includes Oakland, California. AC Transit was created in 1956, but public transit in Oakland dates as far back as 1869. The district is governed by a seven-member board of directors elected by East Bay voters. Five of these board members represent geographic wards while two are elected at-large. The AC Transit service area of 360 square miles includes 13 cities and adjacent unincorporated areas in Alameda and Contra Costa counties. AC Transit operates 538 transit buses in peak service (717 active buses in the fleet including paratransit) on more than 105 fixed routes and provides school bus service. In fiscal year 2005, annual ridership exceeded 68.9 million. Since 2000, AC Transit has developed and operates a fuel cell demonstration program called the HyRoad. With a goal of demonstrating the viability of an emission-free transit system, the HyRoad program includes operating fuel cell buses and passenger cars, on-site hydrogen production, fueling, and vehicle maintenance, and public education and safety training.
Golden Gate Transit2 (GGT) is a participant in the AC Transit fuel cell bus demonstration. GGT is part of the Golden Gate Bridge, Highway, and Transportation District (GGBHTD), which is headquartered in San Francisco, California, and serves the North Bay area. GGBHTD includes GGT as well as the operation of the Golden Gate Bridge and the Golden Gate Ferry. GGT, which operates from San Rafael, California, a central location in its operating area, started fixed-route service in 1972 based on transportation planning aimed at reducing traffic congestion on the Golden Gate Bridge. GGT has 260 buses that operated 5.1 million miles in fiscal year 2005. Figure A-1 shows the AC Transit and GGT operating areas.
AC Transit Fuel Cell Bus Program AC Transit’s interest in fuel cell buses started in October 1999, following a successful one-week demonstration of the Ballard P4 ZEbus on scheduled routes in the AC Transit service area. This preceded Ballard operating the bus for a one-year test at SunLine in 2000. Soon after, the California Air Resources Board (CARB) established a new fleet rule in February 2000 to significantly reduce emissions of existing and new transit buses in California. The rule set more stringent emissions standards for new urban bus engines and promoted advancement of the cleanest propulsion technologies – specifically, zero emission buses (ZEBs). This ruling required transit agencies to choose a compliance path – alternative fuel or diesel.
1AC Transit web site: www.actransit.org 2Golden Gate Transit Web site: www.goldengate.org
A-1

The deadline for choosing one of these compliance paths was later in 2000. AC Transit and GGT chose the diesel path. AC Transit reported that it did not choose the alternative fuel path because it worried about reliability and capital costs for operating an alternative fuel such as compressed natural gas (CNG). Fleets choosing the diesel path were required to reduce the fleet average emissions through methods such as purchasing the cleanest diesel engines and retrofitting existing diesel engines with emissions control devices such as diesel particulate filters (DPFs). All California transit agencies with 200 or more buses (including AC Transit and GGT) choosing the diesel path were subject to demonstrate (by 2003) and eventually procure ZEBs at a rate of 15% of all new bus purchases starting in model year 2008.
Figure A-1. AC Transit and Golden Gate Transit operating area in California
A-2

AC Transit and GGT agreed in 2001 to partner in the training and operation of the fuel cell buses in order to meet the CARB requirements. AC Transit attempted to purchase fuel cell buses in 2000 and early 2001. The agency received only one bid, which was eventually withdrawn by the vendor. AC Transit set out in 2001 to learn all that it could about fuel cell buses, including operating the Ballard P4/ZEbus for one week for testing, joining the California Fuel Cell Partnership (CaFCP), and operating the ISE/UTC Power ThunderPower 30-foot fuel cell bus during part of 2003 and 2004.
During 2001-2002, AC Transit was looking for a new bus design to purchase for its planned Bus Rapid Transit (BRT) project. AC Transit’s next large purchase of diesel buses (approximately 190 buses) was supplied by Van Hool through its distributor in the United States, ABC Companies. These new buses featured three doors for quick loading and unloading for the Rapid BRT service, which started in June 2003 with the San Pablo Rapid service.
At the end of 2001, AC Transit started discussions with ISE Corp. about developing a new fuel cell bus design. In April 2002, negotiations were started for a sole source contract with ISE Corp. and UTC Power with plans to use the same Van Hool bus chassis as was used for the diesel buses; however, this project stalled during most of 2002. After a major meeting of the project partners coinciding with an American Public Transportation Association (APTA) meeting in Las Vegas in September 2002, the project was re-energized. The contract for the new fuel cell buses was revised in April 2003, and the project was back on track. This order included three new Van Hool fuel cell buses for AC Transit and one new Van Hool fuel cell bus for SunLine. Rather than using a standard diesel chassis, as was originally planned, Van Hool designed and constructed an entirely new chassis (based on the existing A330 bus design) that could more effectively accommodate fuel cell and hybrid system components.
This new contract had several changes and the delays now required that the CARB deadline for demonstrating fuel cell buses be postponed. The first fuel cell bus was delivered to AC Transit in October 2005, and the other two AC Transit buses arrived in December 2005. The on-site hydrogen fueling station from Chevron was commissioned on March 13, 2006, and the three fuel cell buses went into service on March 20, 2006.
The HyRoad – Once the fuel cell buses were on order and being manufactured, AC Transit got to work putting together its hydrogen future and vision for its hydrogen fuel cell program. This comprehensive fuel cell program (HyRoad) aims to demonstrate the viability of an emission-free transit system and features:
• Three zero-emission hybrid-electric, hydrogen fuel cell buses
• A fleet of fuel cell passenger vehicles (part of DOE’s Controlled Hydrogen Fleet and Infrastructure Demonstration and Validation Project)
• On-site hydrogen production and fueling
• On-site fleet maintenance
• Ongoing, outside evaluation (this report and future reports)
• Public education and safety training
A-3

A-4
The partners for the fuel cell bus program at AC Transit include:
• Van Hool Bus – manufacturer of the bus bodies and chassis
• UTC Power of Connecticut – maker of the fuel cell power systems
• ISE Corporation of San Diego – integrator of the fuel cell power systems and hybrid-electric drive systems
• Chevron Technology Ventures (a division of Chevron USA) – builder of the hydrogen fueling station at AC Transit’s East Oakland Division
Funding for this project included more than $21 million from public agencies and private sector companies, as follows:
• State of California – $8 million
• CARB – $2.8 million
• Bay Area Air Quality Management District (BAAQMD) – $1 million
• Federal Transit Administration – $1 million
• California Energy Commission – $1 million
• DOE – $700,000 plus partial funding for the hydrogen station construction and operating expenses
• AC Transit matching funds – $1.2 million
• CALSTART-WestStart – $200,000
• Chevron Technology Ventures – $2 million (matching funds) plus additional funding for capital and operating expenses
• Miscellaneous contributions of more than $3 million

Appendix B: Evaluation Bus Technology Descriptions
Table B-1 provides bus system descriptions for the fuel cell and diesel buses that were studied in this evaluation. The prototype fuel cell bus in service at AC Transit (Figure B-1) was developed in collaboration between ISE Corporation1, UTC Power2, and Van Hool3. AC Transit unveiled its hydrogen fuel station and hydrogen fuel cell buses on March 13, 2006. The buses started in passenger service on March 20, 2006. The purchase, manufacturing, and packaging of the Van Hool fuel cell buses took about two years and cost approximately $3.2 million each.
The Van Hool diesel buses were ordered in 2002, with delivery in 2005. To provide a baseline, six of the diesel Van Hool buses were selected from the 21 buses of that type operating from the East Oakland Division. These six diesel buses are operated alongside the fuel cell buses. The diesel buses, one of which is pictured in Figure B-2, cost $323,000 each.
The diesel and fuel cell buses at AC Transit are the same bus model, but the diesel buses are slightly older. The fuel cell bus is a little more than 8,000 lbs heavier than the diesel bus, and this has reduced the passenger capacity. The price of the fuel cell bus is essentially ten times more than the diesel bus.
Table B-1. Fuel Cell and Diesel Bus System Descriptions
Vehicle System Operation from East Oakland Division Fuel Cell Bus Diesel Bus
Number of Buses 3 6 Bus Manufacturer and Model Van Hool A330 Low Floor Van Hool A330 Low Floor Model Year 2005 2003 Length/Width/Height 40 ft/102 in/139 in 40 ft/102 in/121 in GVWR/Curb Weight 43,240 lb/36,000 lb 40,800 lb/27,800 lb Wheelbase 228 in 235 in
Passenger Capacity 30 seated or 26 seated
and two wheelchairs 15 standing
32 seated or 28 seated and two wheelchairs
53 standing
Engine Manufacturer and Model
UTC Power PureMotion4 120 Fuel Cell
Power System Cummins ISL
Rated Power
Fuel cell power system: 120 kW
Two Electric Drive Motors: 170 kW total (continuous)
280 hp @ 2200 rpm
Accessories Electrical Mechanical Emissions Equipment None Diesel Oxidation Catalyst
Transmission/Retarder Gearbox/Flenders Regenerative braking
Voith Integrated retarder
Fuel Capacity 50 kg hydrogen 92 gal Bus Purchase Cost $3.2 million $323,000
1 ISE Corporation Web site: www.isecorp.com 2 UTC Power Web site: www.utcpower.com 3 Van Hool Web site: www.abc-companies.com/sales_vh.htm 4 PureMotion is a registered trademark of UTC Power.
B-1

Figure B-1. AC Transit fuel cell bus
Figure B-2. Diesel bus at AC Transit
Table B-2 provides a description of some of the electric propulsion systems for the fuel cell buses. Note that the diesel buses are not a hybrid configuration and do not have regenerative braking or energy storage for the drive system.
Table B-2. Additional Electric Propulsion System Descriptions
Propulsion Systems Fuel Cell BusManufacturer/Integrator ISE Corporation Hybrid Type Series, charge sustaining Drive System Siemens ELFA/ISE Propulsion Motor 2-AC induction, 85 kW each
Energy Storage Battery – 3 modules/216 cells sodium/nickel chloride ZEBRA®; 53 kWh capacity
Fuel Storage Eight, roof mounted, SCI, type 3 tanks; 5,000 psi rated Regenerative Braking Yes
Fuel Cell Bus Propulsion System Description The fuel cell buses use the PureMotion 120 Fuel Cell Power System manufactured by UTC Power in a hybrid electric drive system designed by ISE. The Van Hool A330 transit bus chassis was redesigned to integrate the fuel cell system. The bus has a low floor from front to back and three doors for easy passenger boarding.
B-2

ISE’s hybrid system (Figure B-3) is a series configuration, meaning the fuel cell power system is not mechanically coupled to the drive axle. The fuel cell power system and energy storage system work together to provide power to two electric drive motors, which are coupled to the driveline through a combining gearbox. When the bus needs extra power, the fuel cell power system and energy storage provide power to the drive motors. When the power requirements of the bus are low, the fuel cell power system provides power and recharges the energy storage system.
The hybrid system is also capable of regenerative braking, which captures the energy typically expended during braking and uses it to recharge the energy storage system. Each component of the propulsion system is carefully controlled through an ISE-developed operating system. The ISE hybrid system was designed to be flexible, enabling integration of a variety of powerplants and energy storage options. The buses at AC Transit have a fuel cell powerplant and three ZEBRA (sodium/nickel chloride) batteries5 as the energy storage system.
The primary power source for this hybrid system is UTC Power’s PureMotion 120 Fuel Cell Power System which produces 120 kW from its proton exchange membrane (PEM) fuel cell stacks. UTC Power’s fuel cells operate at near-ambient pressure, which eliminates the need for a compressor. This not only increases the efficiency of the system, but also results in very quiet operation.
Figure B-3. ISE’s hybrid propulsion system
5 Web site: www.betard.co.uk/
B-3

Appendix C: Evaluation Infrastructure Description
AC Transit operates its bus fleet from four divisions – Richmond, Emeryville, East Oakland, and Hayward. To demonstrate fuel cell buses (FCBs), the fleet needed to install hydrogen fueling infrastructure at one of these bus operating divisions. As a diesel-path fleet, AC Transit had no prior experience with gaseous fuels. Joining the CaFCP provided an opportunity for the fleet to accelerate the learning curve and gain valuable hydrogen fuel experience before the FCBs were delivered. AC Transit’s first hydrogen-related project was in partnership with the CaFCP and Stuart Energy Systems (now Hydrogenics) to install an electrolyzer at the Richmond Division. This station was mainly intended as a satellite station for light-duty fuel cell vehicles (FCVs) being tested by the automotive partners of the CaFCP. This location, between Sacramento and San Francisco, was ideal to enable FCVs to travel between the two cities. In addition to the light-duty FCVs, AC Transit also used this station to fill the ThunderPower FCB during its demonstration.
Oakland Energy Station1 AC Transit selected the East Oakland Division as the site for demonstrating its fleet of FCBs. This was due to its location in a light industrial area and because space was available for the added fueling infrastructure. AC Transit operates over 200 vehicles from this division, including the three FCBs, 21 40-ft diesel Van Hool buses, 41 paratransit shuttles, and six UC Berkeley vans. Of the buses at the site, 138 are required for peak service.
In March 2004, AC Transit partnered with Chevron Technology Ventures to design and build a hydrogen energy station at the East Oakland Division. Plans for a station were already in process as part of the DOE light-duty FCV demonstration. Chevron leads one of the teams demonstrating FCVs and hydrogen infrastructure for the DOE project. AC Transit serves as one of the demonstration sites, operating a small fleet of Hyundai/Kia FCVs.
As the FCB demonstration plans began to solidify, the project partners decided it would be cost effective to combine the needs for both demonstrations into one station. Construction on the station began in June 2005 and was completed by November. The station was operational by mid-December. On March 13, 2006, AC Transit and local officials formally inaugurated the Chevron - AC Transit Hydrogen Energy Station, kicking-off the demonstration project. All of the HyRoad project partners participated in the event, which included facility tours and a ribbon-cutting ceremony.
Figure C-1 illustrates the overall station layout. The energy station at the East Oakland Division generates hydrogen through steam methane reformation in a three-step process:
1. Hydrogen generation - Natural gas from a utility line is fed to a steam methane reformer that produces a hydrogen-rich output gas. This output gas, called reformate, is typically composed of 75% hydrogen and 20% carbon dioxide and other trace gases.
2. Reformate compression – Hydrogen-rich reformate is compressed to approximately 125 psi, as required for the purification step.
1 Information on the Chevron-AC Transit Hydrogen Energy Station was provided in part by Chevron Technology Ventures, a division of Chevron USA.
C-1

3. Purification – A pressure swing absorption unit purifies the reformate stream to 99.99% hydrogen, which is acceptable for use in PEM fuel cells. Excess gas is returned to the reformer for combustion.
The station design includes two reformers that are capable of producing a total of 150 kg hydrogen per day. One of the reformers is a standard design (Figure C-2) and produces hydrogen through the three-step process outlined above. This reformer is intended to be the primary production reformer for hydrogen at the station.
Chevron is using the second reformer, which is an advanced technology design, to investigate ways to further refine production methods and increase efficiency. For that second reformer, steps 1 and 2 are reversed: the natural gas is compressed to about 150 psi, and the reformer then generates hydrogen at the higher pressure. An advantage of this is that compressing natural gas takes less energy than compressing the hydrogen-rich reformate stream. Producing a reformer capable of operating at the higher pressure, however, will potentially increase the cost of that equipment. This may be offset by the reduced cost for the natural gas vs. reformate compressor. The demonstration will help Chevron determine the trade-offs between the increased efficiency of compressing natural gas and the change in equipment cost.
Figure C-1. Chevron – AC Transit (Oakland) Hydrogen Energy Station overall layout
The purified hydrogen is then compressed to 6,250 psi and stored in a series of cascade pressure vessels (Figure C-3). Total storage capacity at the station is 366 kg of hydrogen. The station is equipped with two dispensers that supply the compressed hydrogen to the buses and light-duty vehicles. The system connections monitor the tank-fill status and provide an appropriate fill at 5,000 psi. The dispensing system is designed to enable simultaneous fills for two buses (or light-duty fuel cell vehicles). Figure C-4 shows the hydrogen fueling dispensers at the station. AC Transit’s agreement with Chevron includes all operation and maintenance of the station for two years.
C-2

Figure C-2 Primary reformer at Chevron – AC Transit Hydrogen Energy Station (75 kg/day)
Figure C-3. Cascade hydrogen storage vessels at AC Transit station
C-3

Figure C-4. Dispenser at Chevron – AC Transit Energy Station
The design of the station includes various safety devices to alert AC Transit and Chevron of any potential problems. These devices include hydrogen detectors, flame sensors, emergency stop buttons, and alarm indicator lights (Figure C-5). The alarm indicators reflect the condition of the station as follows:
• Green light – normal operating conditions
• Yellow light – a problem is occurring or has occurred
• Red light – hazardous condition exists, evacuation from area required
• Strobe and siren – fire condition, fire department notified
Figure C-5. Condition indicator lights (left) and hydrogen flame sensor (right)
at the Chevron – AC Transit Hydrogen Energy Station
C-4

Maintenance Facility Modifications AC Transit chose to modify an existing facility to enable staff to maintain the hydrogen-fueled buses safely. The required modifications (~$1.5 million) were completed and the maintenance bay was cleared for use in January 2006. The selected bay was isolated from the rest of the facility by a firewall. There is space for servicing two buses at a time. Figure C-6 shows the bay with and without a fuel cell bus.
Figure C-6. Modified maintenance bay at AC Transit East Oakland Division
The detection system in the maintenance bay is configured to trigger specific actions if a leak or fire is detected. At 20% lower flammability limit (LFL), the garage doors automatically open, ventilation fans are turned on, the heating system is shut down, and the magnetic doors release. If a leak is detected at 40% LFL or a fire is detected, the fire department is automatically notified, all electrical power to the bay is disconnected (except for ventilation and emergency equipment), and a fire alarm is activated to signal evacuation of the building. These safety measures are all in place to ensure maximum protection for staff and facilities in case of a hydrogen-related incident. None have been recorded to date.
Other safety features include:
• Two-hour firewall
• Ignition-free space heating system
• Anti-static, non-skid, grounded floor covering
• High Speed roll-up doors
• Magnetic door release
• Audiovisual strobe alarms
C-5

• Three-fan ventilation system capable of providing up to four to six air exchanges per hour
• Class 1 Division 2 electrical classification Because the specially equipped maintenance bay is co-located with the rest of the maintenance building, maintenance staff is required to depressurize the buses prior to entering the facility. To accomplish this depressurization, the hydrogen in the tanks is vented down to 600 psi. The hydrogen removed from the vehicle is ultimately vented to the atmosphere in a controlled and safe manner. This decision to lower the fuel pressure in the vehicle was made early in the design process to reduce the overall cost of the facility modifications. The safety requirements for a facility capable of maintaining buses with full hydrogen tanks are more costly. Although capturing the vented hydrogen for future use is possible, early investigation showed it was not cost-effective using available methods. For a fleet of only three buses, the amount of hydrogen vented was deemed not significant enough to warrant the cost of the equipment to capture and reuse the fuel.
In preparation for full-day fuel cell bus operation, AC Transit upgraded their electrical access for charging the ZEBRA batteries overnight to allow faster charging. These upgrades were completed in June 2007. Each fuel cell bus is plugged into a charge station (shown in Figure C-7) overnight to balance the charge between batteries, top off the charge, and provide heat for the batteries and freeze protection for the fuel cell when temperatures are 2°C or less.
Figure C-7. Fuel cell bus/battery charging station at AC Transit
C-6

Appendix D: NREL Transit Bus Evaluation Activities
Under funding from the Department of Energy (DOE) and in coordination with the Federal Transit Administration (FTA), the National Renewable Energy Laboratory (NREL) has been evaluating alternative fuel transit buses since the early 1990s. In 1996, DOE and NREL completed an evaluation of transit buses at eight transit agencies that included six different alternative fuels. As part of this alternative fuel transit bus evaluation, NREL and Battelle (NREL’s contractor for this effort) developed a customized data collection and evaluation protocol. This protocol has evolved over time, but is still based on the original effort.
NREL first began evaluating hydrogen-fueled transit buses in 2000 with SunLine Transit Agency. Since that time, NREL has published reports on fuel cell bus (FCB) performance and fleet experience for several transit agencies in the United States. These evaluations were funded under the DOE’s Hydrogen, Fuel Cells & Infrastructure Technologies (HFCIT) Program1, which is focused on addressing the technical challenges and accelerating the development and successful market introduction of hydrogen technologies. Technology validation is one of the key elements of this program.2 NREL supports DOE’s Technology Validation activity by evaluating hydrogen and fuel cell vehicles in parallel with hydrogen infrastructure to determine the current status of the technology and assess the progress toward technology readiness.
While DOE has not funded the direct development of fuel cell buses, it has provided funding to NREL to conduct data collection, analysis, and reporting of existing FCB project evaluation results under its Technology Validation activity. The current hydrogen transit bus evaluations include four active projects and two that were completed in the last few years.
In 2006, FTA initiated its newest development program, the National Fuel Cell Bus Program (NFCBP)3. The NFCBP was established as part of the Safe, Accountable, Flexible, Efficient Transportation Equity Act: a Legacy for Users (SAFETEA-LU) transportation authorization. The NFCBP program designates $49 million in funding for 2006 through 2009 to help develop commercially viable fuel cell buses and technologies. The FTA competitively selected three nonprofit organizations—the Center for Transportation and the Environment (CTE), the Northeast Advanced Vehicle Consortium (NAVC), and WestStart-CALSTART—to administer projects under the program. The FTA selected 14 separate projects in all, including eight planned demonstration projects.
The FTA is collaborating with DOE and NREL to ensure that data are collected on all fuel cell bus demonstrations under the program. FTA has tasked NREL with evaluating the fuel cell bus demonstrations for the NFCBP. NREL uses the standard data collection and analysis protocol established for DOE heavy-duty vehicle evaluations as described in this plan. In May 2008, NREL published Hydrogen and Fuel Cell Transit Bus Evaluations: Joint Evaluation Plan for the U.S. Department of Energy and the Federal Transit Administration, which outlines the
1 DOE HFCIT Web site: www1.eere.energy.gov/hydrogenandfuelcells/ 2 DOE Multi-Year Research, Development and Demonstration Plan, www1.eere.energy.gov/hydrogenandfuelcells/mypp/ 3 FTA Bus Research and Testing Web site: http://www.fta.dot.gov/assistance/technology/research_4578.html
D-1

methodology for these evaluations4. Table D-1 provides an overview of all the FCB evaluation projects planned under both DOE and FTA funding. The projects are separated by funding agency, however for the NFCBP evaluation sites, any detailed data collection and analysis of the fuel cell system or infrastructure will be funded by DOE. Table D-2 provides more details and status for the evaluation sites funded solely by DOE. Additional details on the eight NFCBP demonstrations sites funded by FTA are listed in Table D-3. FTA is also considering additional funding for one or two sites beyond the NFCBP sites, but that has not been determined.
Table D-1. Summary of Hydrogen Evaluations for DOE and FTA5
3 4 1 2 3 4 1 2 3 4 1 2 3 4AC Transit /Oakland CA HyRoadAC Transit /Oakland CA AC Transit CA ZEB 2009SunLine /Thousand Palms CA FCB/HHICESunLine /Thousand Palms CA FCB Ext. ServiceSunLine /Thousand Palms CA Advanced FCB ProjectCTTRANSIT /Hartford CT CTTRANSIT FCB DemoHickam AFB /Honolulu HI Air Force FCV DemoVTA /San Jose CA VTA CA ZEB 2009AC Transit /Oakland CA Accelerated TestingSunLine /Thousand Palms CA American FCB DemoCTTRANSIT /Hartford CT CT Hybrid FCB DemoColumbia /Site 2/ CTTRANSIT SC/CT Dual Variable Output Hybrid FCBLogan Airport /Boston MA MA H2 FCB FleetTBD/NY NY Lightweight FCB DemoTBD/NY NY Hydroelectric H2 Powered FCBSFMTA /San Francisco CA FC APU Hybrid
Site/Locations State
DO
E
Tech
. Val
idat
ion
FTA
Nat
iona
l Fue
l C
ell B
us P
rogr
am*
Eval. Funding
2009 20102007 2008
Color coded by geographic area * Detailed data collection and analysis funded by DOE
Table D-2. DOE/NREL Heavy Vehicle Fuel Cell/Hydrogen Evaluations
Fleet Vehicle/Technology Number Evaluation StatusSunLine Transit Agency (Thousand Palms, CA)
Van Hool/UTC Power fuel cell hybrid transit bus integrated by ISE Corp. 1 Extended testing with updated
fuel cell system, In process Connecticut Transit (Hartford, CT)
Van Hool/UTC Power fuel cell hybrid transit bus integrated by ISE Corp. 1 Bus in operation; data
collection started
U.S. Air Force/Hickam Air Force Base (Honolulu, HI)
Shuttle bus: Hydrogenics and Enova, battery-dominant fuel cell hybrid 1 Shuttle bus in operation; data
collection started Delivery van: Hydrogenics and Enova, fuel cell hybrid 1 Van in operation; data
collection started Completed Evaluations
SunLine Transit Agency (Thousand Palms, CA)
New Flyer/ISE Corp. hydrogen internal combustion engine transit bus 1 Complete; results reported in
Feb. 2007, Sep. 2007, and June 2008 Van Hool/UTC Power fuel cell hybrid
transit bus integrated by ISE Corp. 1
Alameda-Contra Costa Transit District (Oakland, CA)
Van Hool/UTC Power fuel cell hybrid transit bus integrated by ISE Corp. 3
Complete; results reported in Mar. 2007, Oct. 2007, and July 2008
Santa Clara VTA, (San Jose, CA) and San Mateo (San Carlos, CA) Gillig/Ballard fuel cell transit bus 3 Complete and reported in 2006
SunLine Transit Agency (Thousand Palms, CA)
ThunderPower hybrid fuel cell transit bus; ISE Corp./ UTC Power 1 Complete and reported in 2003
4 Hydrogen and Fuel Cell Transit Bus Evaluations: Joint Evaluation Plan for the U.S. Department of Energy and the Federal Transit Administration, NREL/MP-560-42781, May 2008, http://www.nrel.gov/hydrogen/pdfs/42781-1.pdf 5 For current version of the summary table, see link: http://www.nrel.gov/hydrogen/proj_fc_bus_eval.html
D-2

Table D-3. Summary of FTA NFCBP Demonstration Projects
Project DescriptionDual Variable Output Fuel Cell Hybrid Bus Validation and Testing (CTE)
Proterra will develop a battery-dominant 35-ft plug-in hybrid fuel cell bus (Hydrogenics) and demonstrate in Columbia, SC, and cities in CT
Nutmeg/Connecticut Fuel Cell Bus Program (NAVC)
UTC Power and NAVC are leading a team to develop and demonstrate an advanced version hybrid 40-ft fuel cell buses; enhanced UTC Power 120 kW PEM fuel cell with upgraded seals, catalysts, bipolar plates, balance of plant
Lightweight Fuel Cell Hybrid Bus (NAVC)
GE led team to develop an advanced propulsion system integrated with a lightweight bus platform for field evaluation focused on advanced battery technologies for lower cost
Massachusetts Hydrogen Fuel Cell Powered Bus Fleet (NAVC)
Advanced bus development and in-service demonstration; integrate Nuvera 82 kW fuel cell with drive system from ISE Corp. and advanced energy storage; demonstration effort includes Nuvera’s novel PowerTap fueling infrastructure
Hydroelectric Hydrogen Powered FCB Program (NAVC)
The project team led by the New York Power Authority will develop and demonstrate two 40-ft buses for operation in upstate New York for up to 2 years; Next-generation Ballard HD6 fuel cell module (150 kW) in hybrid configuration with ISE drive and ultracapacitors or batteries
American Advanced Fuel Cell Bus Program (WestStart-CALSTART)
A team led by SunLine will design and demonstrate 40-ft fuel cell bus with design improvements that meets FTA buy America requirements (New Flyer chassis, ISE hybrid drive system, and UTC Power fuel cell system); in-service evaluation in hot desert climate
Compound Fuel Cell Hybrid Bus for 2010 (WestStart-CALSTART)
A team led by BAE will develop 40-ft hybrid bus with fuel cell auxiliary power unit coupled with diesel engine; demonstrate for one year at San Francisco MTA; small Hydrogenics PEM fuel cell (12 kW twin or 16 kW), BAE Systems drive, electrically driven accessories, advanced energy storage
AC Transit HyRoad: Commercialization of Fuel Cells for Public Transit (WestStart-CALSTART)
Accelerated testing of existing fuel cell buses; Team includes Van Hool (bus chassis), ISE (hybrid drive system), and UTC Power (fuel cell system)
Overall Evaluation Objectives The objectives of the DOE and FTA evaluations are to provide comprehensive, unbiased evaluation results of fuel cell and hydrogen bus development and performance compared to conventional baseline vehicles when available and appropriate. Baseline vehicles are typically diesel buses or occasionally compressed natural gas (CNG). These evaluations also include information on the development and performance of hydrogen infrastructure, and descriptions of the facility modifications required for safe operation of hydrogen-fueled vehicles.
The DOE and FTA demonstration and evaluation programs have two major goals:
• Provide credible data analysis results to the transit bus and fuel cell industries that go beyond “proof of concept” for fuel cell transit buses and infrastructure.
• Provide results focused on performance and use including progress over time and experience from integrating vehicle systems, operations, and facilities for the fuel cell transit buses and supporting infrastructure.
D-3

D-4
DOE and FTA have both cited the lack of data and analysis results in real-world service as a challenge for moving the technology forward. These evaluations have proved useful for a variety of groups including transit operators considering the technology for future procurements, manufacturers needing to understand the status of the technology for transit applications, and government agencies making policy decisions or determining future research needs.

Appendix E: Fleet Summary Statistics Fleet Summary Statistics: Alameda-Contra Costa Transit District (AC Transit) Diesel and FCB Study Groups Fleet Operations and Economics Fuel Cell Diesel Number of Vehicles 3 6Period Used for Fuel and Oil Op Analysis 4/06-12/07 1/07-12/07Total Number of Months in Period 21 12Fuel and Oil Analysis Base Fleet Mileage 62,191 264,575Period Used for Maintenance Op Analysis 4/06-12/07 4/06-12/07Total Number of Months in Period 21 21Maintenance Analysis Base Fleet Mileage 62,191 389,473Average Monthly Mileage per Vehicle 987 3,091Availability 55% N/AFleet Fuel Usage in Diesel Gal/H2 kg 9,982 62,976Roadcalls 48 85RCs MBRC 1,296 4,582Propulsion Roadcalls 41 37Propulsion MBRC 1,517 10,526 Fleet Miles/kg Hydrogen 6.23 (1.13 kg H2/gal Diesel Fuel) Representative Fleet MPG (energy equiv.) 7.04 4.20 Hydrogen Cost per kg 8.00 Diesel Cost per Gallon 2.27Fuel Cost per Mile 1.28 0.54 Total Scheduled Repair Cost per Mile 0.20 0.09Total Unscheduled Repair Cost per Mile 0.37 0.35Total Maintenance Cost per Mile 0.57 0.44 Total Operating Cost per Mile 1.85 0.98
Maintenance Costs Fuel Cell Diesel Fleet Mileage 62,191 389,473 Total Parts Cost 11,024.59 103,901.41Total Labor Hours 481.8 1346.8Average Labor Cost (@ $50.00 per hour) 24,090.00 67,340.00 Total Maintenance Cost 35,114.59 171,241.41Total Maintenance Cost per Bus 11,704.86 28,540.24Total Maintenance Cost per Mile 0.57 0.44
E-1

Breakdown of Maintenance Costs by Vehicle System
Fuel Cell Diesel Fleet Mileage 62,191 389,473 Total Propulsion-Related Systems (ATA VMRS 27, 30, 31, 32, 33, 41, 42, 43, 44, 45, 46, 65) Parts Cost 887.52 25,191.46Labor Hours 97.8 306.6Average Labor Cost 4,887.50 15,328.50Total Cost (for system) 5,775.02 40,519.96Total Cost (for system) per Bus 1,925.01 6,753.33Total Cost (for system) per Mile 0.09 0.10 Exhaust System Repairs (ATA VMRS 43) Parts Cost 0.00 5,258.08Labor Hours 0.0 33.6Average Labor Cost 0.00 1,677.50Total Cost (for system) 0.00 6,935.58Total Cost (for system) per Bus 0.00 1,155.93Total Cost (for system) per Mile 0.00 0.02 Fuel System Repairs (ATA VMRS 44) Parts Cost 0.00 3,238.31Labor Hours 11.4 49.8Average Labor Cost 575.50 2,490.00Total Cost (for system) 575.50 5,728.31Total Cost (for system) per Bus 190.17 954.72Total Cost (for system) per Mile 0.01 0.02 Power Plant (Engine) Repairs (ATA VMRS 45) Parts Cost 126.68 7,689.35Labor Hours 15.0 98.2Average Labor Cost 748.00 4,909.50Total Cost (for system) 874.68 12,598.85Total Cost (for system) per Bus 291.56 2,099.81Total Cost (for system) per Mile 0.02 0.03 Electric Propulsion Repairs (ATA VMRS 46) Parts Cost 238.39 0.00Labor Hours 66.4 0.0Average Labor Cost 3,319.00 0.00Total Cost (for system) 3,557.39 0.00Total Cost (for system) per Bus 1,185.80 0.00Total Cost (for system) per Mile 0.06 0.00
E-2

Breakdown of Maintenance Costs by Vehicle System (continued) Fuel Cell Diesel Electrical System Repairs (ATA VMRS 30-Electrical General, 31-Charging, 32-Cranking, 33-Ignition) Parts Cost 220.19 1,888.56Labor Hours 2.0 45.8Average Labor Cost 100.00 2,289.00Total Cost (for system) 320.19 4,177.56Total Cost (for system) per Bus 106.73 696.26Total Cost (for system) per Mile 0.01 0.01 Air Intake System Repairs (ATA VMRS 41) Parts Cost 294.45 1,408.08Labor Hours 0.0 0.0Average Labor Cost 0.00 0.00Total Cost (for system) 294.45 1,408.08Total Cost (for system) per Bus 98.15 234.68Total Cost (for system) per Mile 0.01 0.00 Cooling System Repairs (ATA VMRS 42) Parts Cost 7.80 5,041.17Labor Hours 1.0 70.5Average Labor Cost 50.00 3,525.00Total Cost (for system) 57.80 8,566.17Total Cost (for system) per Bus 19.27 1,427.70Total Cost (for system) per Mile 0.00 0.02 Hydraulic System Repairs (ATA VMRS 65) Parts Cost 0.00 134.76Labor Hours 0.0 6.0Average Labor Cost 0.00 300.00Total Cost (for system) 0.00 434.76Total Cost (for system) per Bus 0.00 72.46Total Cost (for system) per Mile 0.00 0.00 General Air System Repairs (ATA VMRS 10) Parts Cost 12.34 385.21Labor Hours 0.0 14.8Average Labor Cost 0.00 737.50Total Cost (for system) 12.34 1,122.71Total Cost (for system) per Bus 4.11 187.12Total Cost (for system) per Mile 0.00 0.00
E-3

Breakdown of Maintenance Costs by Vehicle System (continued) Fuel Cell Diesel Brake System Repairs (ATA VMRS 13) Parts Cost 4,098.95 26,060.20Labor Hours 2.0 117.2Average Labor Cost 100.00 5,859.50Total Cost (for system) 4,198.95 31,919.70Total Cost (for system) per Bus 1,399.65 5,319.95Total Cost (for system) per Mile 0.07 0.08 Transmission Repairs (ATA VMRS 27) Parts Cost 0.00 533.15Labor Hours 2.0 2.8Average Labor Cost 100.00 137.50Total Cost (for system) 100.00 670.65Total Cost (for system) per Bus 33.33 111.78Total Cost (for system) per Mile 0.00 0.00 Inspections Only – No Parts Replacements (101) Parts Cost 0.00 0.00Labor Hours 139.8 555.5Average Labor Cost 6,987.50 27,774.00Total Cost (for system) 6,987.50 27,774.00Total Cost (for system) per Bus 2,329.17 4,629.00Total Cost (for system) per Mile 0.11 0.07 Cab, Body, and Accessories Systems Repairs (ATA VMRS 02-Cab and Sheet Metal, 50-Accessories, 71-Body) Parts Cost 5,431.87 44,983.39Labor Hours 231.6 223.8Average Labor Cost 11,579.50 11,192.00Total Cost (for system) 17,011.37 56,175.39Total Cost (for system) per Bus 5,670.46 9,362.57Total Cost (for system) per Mile 0.28 0.14 HVAC System Repairs (ATA VMRS 01) Parts Cost 0.00 1,089.23Labor Hours 7.6 12.9Average Labor Cost 380.00 644.00Total Cost (for system) 380.00 1,733.23Total Cost (for system) per Bus 126.67 288.87Total Cost (for system) per Mile 0.01 0.01
E-4
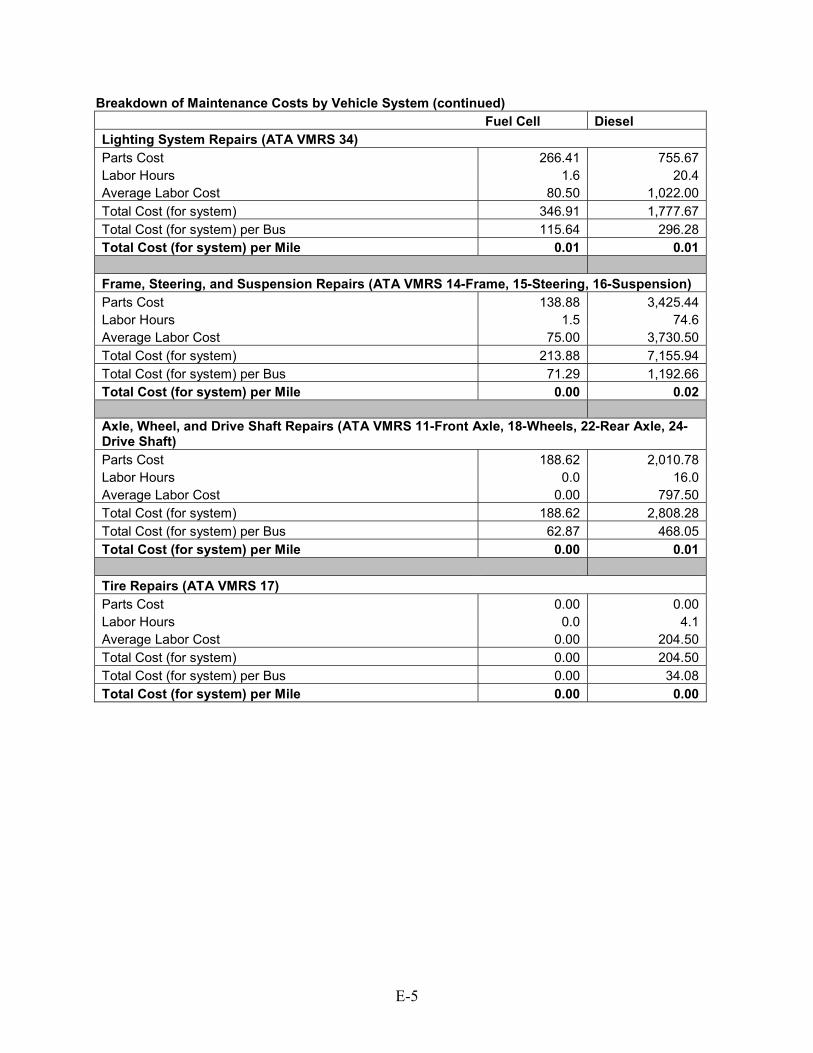
Breakdown of Maintenance Costs by Vehicle System (continued) Fuel Cell Diesel Lighting System Repairs (ATA VMRS 34) Parts Cost 266.41 755.67Labor Hours 1.6 20.4Average Labor Cost 80.50 1,022.00Total Cost (for system) 346.91 1,777.67Total Cost (for system) per Bus 115.64 296.28Total Cost (for system) per Mile 0.01 0.01 Frame, Steering, and Suspension Repairs (ATA VMRS 14-Frame, 15-Steering, 16-Suspension) Parts Cost 138.88 3,425.44Labor Hours 1.5 74.6Average Labor Cost 75.00 3,730.50Total Cost (for system) 213.88 7,155.94Total Cost (for system) per Bus 71.29 1,192.66Total Cost (for system) per Mile 0.00 0.02 Axle, Wheel, and Drive Shaft Repairs (ATA VMRS 11-Front Axle, 18-Wheels, 22-Rear Axle, 24-Drive Shaft) Parts Cost 188.62 2,010.78Labor Hours 0.0 16.0Average Labor Cost 0.00 797.50Total Cost (for system) 188.62 2,808.28Total Cost (for system) per Bus 62.87 468.05Total Cost (for system) per Mile 0.00 0.01 Tire Repairs (ATA VMRS 17) Parts Cost 0.00 0.00Labor Hours 0.0 4.1Average Labor Cost 0.00 204.50Total Cost (for system) 0.00 204.50Total Cost (for system) per Bus 0.00 34.08Total Cost (for system) per Mile 0.00 0.00
E-5

E-6
Notes 1. To compare the hydrogen fuel dispensed and fuel economy to diesel, the hydrogen dispensed
was also converted into diesel energy equivalent gallons. The general energy conversions are as follows, actual energy content will vary by location:
Lower heating value (LHV) for hydrogen = 51,532 Btu/lb LHV for diesel = 128,400 Btu/lb 1 kg = 2.205 * lb 51,532 Btu/lb * 2.205 lb/kg = 113,628 Btu/kg Diesel/hydrogen = 128,400 Btu/gallon / 113,628 Btu/kg = 1.13 kg/diesel gallon
2. The propulsion-related systems were chosen to include only those systems of the vehicles that could be directly impacted by the selection of a fuel/advanced technology.
3. ATA VMRS coding is based on parts that were replaced. If there was no part replaced in a given
repair, then the code was chosen by the system being worked on.
4. In general, inspections (with no part replacements) were only included in the overall totals (not by system). 101 was created to track labor costs for PM inspections.
5. ATA VMRS 02-Cab and Sheet Metal represents seats, doors, etc.; ATA VMRS 50-Accessories
represents things like fire extinguishers, test kits, etc.; ATA VMRS 71-Body represents mostly windows and windshields.
6. Average labor cost is assumed to be $50 per hour. 7. Warranty costs are not included.

Appendix F: Fleet Summary Statistics – SI Units Fleet Summary Statistics: Alameda-Contra Costa Transit District (AC Transit) Diesel and FCB Study Groups Fleet Operations and Economics Fuel Cell Diesel Number of Vehicles 3 6Period Used for Fuel and Oil Op Analysis 4/06-12/07 1/07-12/07Total Number of Months in Period 21 12Fuel and Oil Analysis Base Fleet Kilometers 100,084 425,781Period Used for Maintenance Op Analysis 4/06-12/07 4/06-12/07Total Number of Months in Period 21 21Maintenance Analysis Base Fleet Kilometers 100,084 626,779Average Monthly Kilometers per Vehicle 1,589 4,974Availability 55% N/AFleet Fuel Usage in Diesel L/H2 kg 9,982 238,364Roadcalls 48 85Kilometers between roadcalls (KBRC) 2,085 7,374Propulsion Roadcalls 41 37Propulsion KBRC 2,441 16,940 Fleet kg Hydrogen/100 km 9.97 Representative Fleet MPG (L/100 km) 33.41 55.98 Hydrogen Cost per kg 8.00 Diesel Cost per Liter 0.60Fuel Cost per Kilometer 0.80 0.34 Total Scheduled Repair Cost per Kilometer 0.12 0.06Total Unscheduled Repair Cost per Kilometer 0.23 0.21Total Maintenance Cost per Kilometer 0.35 0.27 Total Operating Cost per Kilometer 1.15 0.61
Maintenance Costs Fuel Cell Diesel Fleet Kilometers 100,084 626,779 Total Parts Cost 11,024.59 103,901.41Total Labor Hours 481.8 1346.8Average Labor Cost (@ $50.00 per hour) 24,090.00 67,340.00 Total Maintenance Cost 36,114.59 171,241.41Total Maintenance Cost per Bus 11,704.86 28,540.24Total Maintenance Cost per Kilometer 0.35 0.27
F-1

F1147-E(09/2007)
REPORT DOCUMENTATION PAGE Form Approved OMB No. 0704-0188
The public reporting burden for this collection of information is estimated to average 1 hour per response, including the time for reviewing instructions, searching existing data sources, gathering and maintaining the data needed, and completing and reviewing the collection of information. Send comments regarding this burden estimate or any other aspect of this collection of information, including suggestions for reducing the burden, to Department of Defense, Executive Services and Communications Directorate (0704-0188). Respondents should be aware that notwithstanding any other provision of law, no person shall be subject to any penalty for failing to comply with a collection of information if it does not display a currently valid OMB control number. PLEASE DO NOT RETURN YOUR FORM TO THE ABOVE ORGANIZATION.1. REPORT DATE (DD-MM-YYYY)
July 2008 2. REPORT TYPE
Technical Report 3. DATES COVERED (From - To)
4. TITLE AND SUBTITLE
Alameda-Contra Costa Transit District (AC Transit) Fuel Cell Transit Buses: Third Evaluation Report and Appendices
5a. CONTRACT NUMBER DE-AC36-99-GO10337
5b. GRANT NUMBER
5c. PROGRAM ELEMENT NUMBER
6. AUTHOR(S) K. Chandler and L. Eudy
5d. PROJECT NUMBER NREL/TP-560-43545
5e. TASK NUMBER H2708200
5f. WORK UNIT NUMBER
7. PERFORMING ORGANIZATION NAME(S) AND ADDRESS(ES)National Renewable Energy Laboratory 1617 Cole Blvd. Golden, CO 80401-3393
8. PERFORMING ORGANIZATIONREPORT NUMBER NREL/TP-560-43545
9. SPONSORING/MONITORING AGENCY NAME(S) AND ADDRESS(ES)
10. SPONSOR/MONITOR'S ACRONYM(S)NREL
11. SPONSORING/MONITORINGAGENCY REPORT NUMBER
12. DISTRIBUTION AVAILABILITY STATEMENT National Technical Information Service U.S. Department of Commerce 5285 Port Royal Road Springfield, VA 22161
13. SUPPLEMENTARY NOTES
14. ABSTRACT (Maximum 200 Words) This report describes operations at Alameda-Contra Costa Transit district for three protoype fuel cell buses and six diesel buses operating from the same location.
15. SUBJECT TERMS hydrogen; buses; transit; demonstration; AC Transit; Alameda-Contra Costa; HyRoad; FTA
16. SECURITY CLASSIFICATION OF: 17. LIMITATION OF ABSTRACT
UL
18. NUMBER OF PAGES
19a. NAME OF RESPONSIBLE PERSON a. REPORT
Unclassified b. ABSTRACT Unclassified
c. THIS PAGE Unclassified 19b. TELEPHONE NUMBER (Include area code)
Standard Form 298 (Rev. 8/98) Prescribed by ANSI Std. Z39.18