Alameda-Contra Costa Transit District Technical Report · Alameda-Contra Costa Transit District (AC...
31
A national laboratory of the U.S. Department of Energy Office of Energy Efficiency & Renewable Energy National Renewable Energy Laboratory Innovation for Our Energy Future Alameda-Contra Costa Transit District (AC Transit) Fuel Cell Transit Buses: Third Evaluation Report Kevin Chandler, Battelle Leslie Eudy, National Renewable Energy Laboratory Link to Appendices Technical Report NREL/TP-560-43545-1 July 2008 NREL is operated by Midwest Research Institute ● Battelle Contract No. DE-AC36-99-GO10337
Transcript of Alameda-Contra Costa Transit District Technical Report · Alameda-Contra Costa Transit District (AC...

A national laboratory of the U.S. Department of EnergyOffice of Energy Efficiency & Renewable Energy
National Renewable Energy Laboratory Innovation for Our Energy Future
Alameda-Contra Costa Transit District (AC Transit) Fuel Cell Transit Buses: Third Evaluation Report Kevin Chandler, Battelle Leslie Eudy, National Renewable Energy Laboratory Link to Appendices
Technical Report NREL/TP-560-43545-1 July 2008
NREL is operated by Midwest Research Institute ● Battelle Contract No. DE-AC36-99-GO10337

Alameda-Contra Costa Transit District (AC Transit) Fuel Cell Transit Buses: Third Evaluation Report Kevin Chandler, Battelle Leslie Eudy, National Renewable Energy Laboratory
Prepared under Task No. H270.8200
Technical Report NREL/TP-560-43545-1 July 2008
National Renewable Energy Laboratory1617 Cole Boulevard, Golden, Colorado 80401-3393 303-275-3000 • www.nrel.gov
Operated for the U.S. Department of Energy Office of Energy Efficiency and Renewable Energy by Midwest Research Institute • Battelle
Contract No. DE-AC36-99-GO10337

NOTICE
This report was prepared as an account of work sponsored by an agency of the United States government. Neither the United States government nor any agency thereof, nor any of their employees, makes any warranty, express or implied, or assumes any legal liability or responsibility for the accuracy, completeness, or usefulness of any information, apparatus, product, or process disclosed, or represents that its use would not infringe privately owned rights. Reference herein to any specific commercial product, process, or service by trade name, trademark, manufacturer, or otherwise does not necessarily constitute or imply its endorsement, recommendation, or favoring by the United States government or any agency thereof. The views and opinions of authors expressed herein do not necessarily state or reflect those of the United States government or any agency thereof.
Available electronically at http://www.osti.gov/bridge
Available for a processing fee to U.S. Department of Energy and its contractors, in paper, from:
U.S. Department of Energy Office of Scientific and Technical Information P.O. Box 62 Oak Ridge, TN 37831-0062 phone: 865.576.8401 fax: 865.576.5728 email: mailto:[email protected]
Available for sale to the public, in paper, from: U.S. Department of Commerce National Technical Information Service 5285 Port Royal Road Springfield, VA 22161 phone: 800.553.6847 fax: 703.605.6900 email: [email protected] online ordering: http://www.ntis.gov/ordering.htm
Printed on paper containing at least 50% wastepaper, including 20% postconsumer waste

Acknowledgements
This evaluation at Alameda-Contra Costa Transit District (AC Transit) would not have been possible without the support and cooperation of many people. The authors thank the following:
U.S. Department of Energy John Garbak National Renewable Energy Laboratory Keith Wipke George Sverdrup AC Transit Jaimie Levin Mallory Nestor-Brush Doug Byrne Roland Fecteau Stuart Thompson Henry Chen Steve Montoya Steve Seliandin Steve Tracey Craig Michels Bruce Randall Patricia Broadbent Huaqi Yuan Bob Bithell Christina Ebojo And many others
UTC Power Mike Tosca Matthew Riley Tiffany Stanley David Boudreau ISE Corporation Paul Scott Tavin Tyler Chevron Puneet Verma GGT Gene Walker Steve Miller
iii

Executive Summary
This report describes operations at Alameda-Contra Costa Transit District (AC Transit) for three prototype fuel cell buses and six diesel buses operating from the same location. This is the third evaluation report for this site, and it describes new results and experiences from September through December 2007. These results are an addition to those provided in the previous two evaluation reports. The evaluation periods presented in this report are as follows:
• Fuel Cell Buses – April 2006 through December 2007 (21 months of operation)
• Diesel Buses – April 2006 through December 2007 (21 months of operation)
Public Outreach AC Transit’s hydrogen fuel cell vehicle program (HyRoad) has always had a significant focus on public awareness. One of the major objectives of the program has been to provide opportunities to educate students, the general public in the Bay Area, and other interested parties such as federal and state government officials. AC Transit has been working with a team led by the Lawrence Hall of Science at the University of California, Berkeley to develop a curriculum to educate high school students and their teachers about hydrogen technologies. The operation of the fuel cell buses in revenue service also provides an opportunity for the public to experience the hydrogen fuel cell bus technology.
As resources allow, transit agency staff take the buses to outside events, provide on-site tours of the facility, and present information on the program. Since the beginning of the demonstration (January 2006 through December 2007), AC Transit estimates it has potentially reached over 520,000 people through various events and tours. AC Transit’s route ridership estimates were used to conservatively estimate the number of fuel cell bus revenue passengers since the buses went into service on March 20, 2006. The total estimate through December 2007 was 141,700 passengers.
Hydrogen Fueling Hydrogen fuel is supplied at AC Transit by two steam methane reformers. The fuel is compressed and dispensed into vehicles at a final pressure of up to 5,000 psi. During the evaluation period, the AC Transit hydrogen station dispensed a total of 11,288 kg of hydrogen for the buses, with an overall average daily usage was 33.7 kg/day. The three buses were filled a total of 551 times during the evaluation period, with an average fill amount of 20.5 kg/fill and an average rate of 1.56 kg/min.
Evaluation Results Table ES-1 provides a summary of results for several of the categories of data presented in this report.
iv

Table ES-1. Summary of Evaluation Results
Data Item Fuel Cell Diesel Number of Buses 3 6 Data Period 4/06-12/07 4/06-12/07 Number of Months 21 21 Total Mileage in Period 62,191 389,473 Average Monthly Mileage per Bus 987 3,091 Availability (85% is target) 55% N/A Fuel Economy (Miles/kg) 6.23 N/A Fuel Economy (Miles/DGEa) 7.04 4.20 Miles between Roadcalls (MBRC) – All 1,296 4,582 MBRC – Propulsion Only 1,517b 10,526 Total Maintenance, $/milec 0.57 0.44 Maintenance – Propulsion Only, $/mile 0.09 0.10
a. Diesel gallon equivalant b. For fuel cell propulsion only, MBRC was 5,654 c. Work order maintenance cost
What’s Next for AC Transit? AC Transit has many hydrogen-related activities currently under way and in the planning stages as part of its HyRoad program. The existing fuel cell bus operation has nearly reached the originally planned two years of operation and evaluation. The current operation is now transitioning over to AC Transit’s accelerated testing (starting November 1, 2007) as part of the Federal Transit Administration’s (FTA) National Fuel Cell Bus Program (NFCBP). AC Transit plans to operate the three existing fuel cell buses in full revenue service to maximize usage for approximately two years.
At the same time, the California Air Resources Board (CARB) has required several California transit agencies (including AC Transit) to purchase new and advanced fuel cell buses as part of its zero-emission bus regulations. The Bay area is now required to have 12 new and advanced fuel cell buses in operation in 2009. AC Transit and UTC Power recently announced (May 6, 2008) an order for a minimum of eight new fuel cell power systems with options for an additional 13. These new fuel cell power systems are planned for delivery in 2009 and 2010. These systems are planned to be used in up to 20 fuel cell buses with one additional power system.
FTA is funding the evaluation of fuel cell buses for the accelerated testing at AC Transit. This means that the next two evaluation reports for AC Transit’s program will be produced by and for FTA. Once the new buses for the CARB fuel cell bus demonstration start to arrive at AC Transit and the current three fuel cell buses are to be retired, the evaluation funding will be transitioned back to the U.S. Department of Energy (DOE). This is expected in mid-2009. The DOE evaluation plans include all 12 of the new fuel cell buses for the planned Bay Area CARB demonstration.
v

vi
Table of Contents
Overview ......................................................................................................................................... 1 Public Outreach ............................................................................................................................... 2
Public Awareness ........................................................................................................................ 2 Ridership ..................................................................................................................................... 4
Hydrogen Fueling ........................................................................................................................... 5 Evaluation Results .......................................................................................................................... 8
Route Descriptions ...................................................................................................................... 8 Bus Use and Availability............................................................................................................. 9 Fuel Economy and Cost ............................................................................................................ 11 Maintenance Analysis ............................................................................................................... 13 Roadcall Analysis ...................................................................................................................... 17
What’s Next for AC Transit? ........................................................................................................ 18 Contacts......................................................................................................................................... 20 Acronyms and Abbreviations ....................................................................................................... 21 References and Related Reports ................................................................................................... 22

Overview
The Alameda-Contra Costa Transit District (AC Transit) provides public transit service in the East Bay area including Oakland, California. The AC Transit service area of 360 square miles includes 13 cities and adjacent unincorporated areas in Alameda and Contra Costa counties. Since 2000, AC Transit has developed and operated a fuel cell demonstration program called HyRoad. With a goal of demonstrating the viability of an emission-free transit system, this program includes operating fuel cell buses and passenger cars, on-site hydrogen production, fueling, vehicle maintenance, public outreach and education, and safety training.
Golden Gate Transit (GGT), headquartered in San Rafael, California, is participating in the AC Transit fuel cell bus demonstration and intends to operate one of the fuel cell buses later in the program. GGT is a part of the Golden Gate Bridge, Highway, and Transportation District (GGBHTD), which is headquartered in San Francisco, California, and serves the North Bay area. Appendix A provides more information about AC Transit and GGT.
In March 2006, AC Transit kicked off its demonstration of three prototype fuel cell buses. The development of the fuel cell buses is the result of collaboration between Van Hool, ISE Corporation, and UTC Power. The buses use the PureMotion1 120 Fuel Cell Power System manufactured by UTC Power in a hybrid electric drive system designed by ISE. The energy storage in this hybrid system consists of three ZEBRA (sodium/nickel chloride, high temperature) batteries. One of the fuel cell buses is pictured in Figure 1.
Figure 1. AC Transit fuel cell bus
This report describes operations at AC Transit for the three fuel cell buses and six Van Hool diesel buses in revenue service at the same location. The diesel buses (shown in Figure 2), which are used in the evaluation as a baseline, are equipped with Cummins ISL engines. Appendix B provides more detail about the buses and propulsion technologies included in this evaluation. Appendix C provides information about the hydrogen fueling infrastructure and facilities modified for use with hydrogen. Updated information regarding hydrogen dispensing into the fuel cell buses is discussed later in this report.
1 PureMotion is a registered trademark of UTC Power.
1

Figure 2. Diesel bus at AC Transit
The Department of Energy’s (DOE) National Renewable Energy Laboratory (NREL) is evaluating these buses to help determine the status of hydrogen and fuel cell systems and corresponding hydrogen infrastructure in transit applications. Appendix D provides a description of NREL’s transit bus evaluation activities for DOE and the Federal Transit Administration (FTA). NREL has published two previous evaluation reports for this ongoing study at AC Transit.2,3
This third evaluation report describes results and experiences from April 2006 through December 2007. The newest data (September 2007 through December 2007) are highlighted when possible. The entire evaluation periods presented in this report are as follows:
• Fuel Cell Buses – April 2006 through December 2007 (21 months of operation)
• Diesel Buses – April 2006 through December 2007 (21 months of operation)
Public Outreach
AC Transit’s hydrogen fuel cell vehicle program (HyRoad) has always had a significant focus on public awareness. One of the major objectives of the program has been to provide opportunities to educate students, the general public in the Bay Area, and other interested parties such as federal and state government officials. The operation of the fuel cell buses in revenue service also provides an opportunity for the public to experience hydrogen fuel cell bus technology.
Public Awareness AC Transit continues to accommodate frequent requests for tours from various individuals and groups. As resources allow, transit agency staff take the buses to outside events, provide on-site tours of the facility, and present information on the program. Since the beginning of the demonstration (January 2006 through December 2007), AC Transit estimates it has potentially
2 Alameda-Contra Costa Transit District (AC Transit), Fuel Cell Transit Buses: Preliminary Evaluation Results, February 2007, NREL/TP-560-41041, http://www.nrel.gov/hydrogen/pdfs/41041.pdf 3 Alameda-Contra Costa Transit District (AC Transit), Fuel Cell Transit Buses: Evaluation Results Update, October 2007, NREL/TP-560-42249, http://www.nrel.gov/hydrogen/pdfs/42249.pdf
2

reached over 520,000 people through various events and tours. International interest has included visits by representatives from eight countries. Table 1 summarizes the public awareness events by category.
Table 1. Public Awareness Events by Category
Event Category Number of Events
Number of People
Academic 15 3,176 General Public 54 515,663 Industry 13 32 International 18 104 Government 13 440 Partner Event 11 609 Total 124 520,024
During the latest data period (September 2007 through December 2007), AC Transit participated in 18 events that included nearly 178,000 people (included in the table above). A few of the events, tours, and presentations held since the last report was published include:
• September 2007: AC Transit provided tours of the hydrogen station and fuel cell buses for several events including Hayward Fire, a group from Australia, and the AC Transit Board and Chevron executives. Off-site events included a major local event called the Solano Stroll.
• October 2007: AC Transit provided fuel cell buses for two off-site events in Berkeley including the Spice of Life Festival and the Lawrence Hall of Science Community Day.
• November 2007: A fuel cell bus was provided for several off-site events including AC Transit’s Uptown Transit Center Grand Opening and Alameda County’s Veterans Day Parade.
• December 2007: During December, there were no tours or events that included the fuel cell buses or facilities. The buses were taken out of service for the holidays (December 22, 2007 through January 3, 2008).
AC Transit is also working in partnership with Lawrence Hall of Science at UC Berkeley and Schatz Energy Research Center at Humboldt State University to develop a 10-week science education curriculum for high schools around the country. The Hydrogen Technology and Education Curriculum (HyTEC) was funded in part by DOE to develop, test, and disseminate hydrogen and fuel cell curricula for high school students. AC Transit is funding the implementation of this curriculum in East Bay high schools served by AC Transit. The materials include hands-on kits to generate hydrogen from electrolysis, working fuel cells, and test equipment to measure results and efficiencies. Also included with the teaching materials are two videos. The first is a two-minute introductory film, and the second is an eight-minute piece that
3

describes various applications and associated challenges. The current status of this project was reported at the DOE Hydrogen Program 2008 Annual Merit Review4.
Ridership AC Transit, like most transit agencies, estimates their ridership. This is typically done by sampling ridership on the routes at different times of day, days of the week, and times of year. AC Transit’s route ridership estimates were used to conservatively estimate the number of fuel cell bus revenue passengers since the buses went into service. From March 20, 2006 through the end of December 2007, each of the buses carried between 45,000 and 50,000 passengers, with the total estimate being 141,700 passengers. Figure 3 shows the ridership estimate by month and as a cumulative total.
The passenger estimates have also been supplemented by actual passenger counts from an automated passenger counter (APC) installed in bus FC3. AC Transit has installed APCs in the other two fuel cell buses. The APCs are planned to be operational in early 2008.
0
2,000
4,000
6,000
8,000
10,000
12,000
Mar-06
Apr-06
May-06
Jun-06
Jul-0
6
Aug-06
Sep-06
Oct-06
Nov-06
Dec-06
Jan-07
Feb-07
Mar-07
Apr-07
May-07
Jun-07
Jul-0
7
Aug-07
Sep-07
Oct-07
Nov-07
Dec-07
Estim
ated
Mon
thly
Pas
seng
ers
0
20,000
40,000
60,000
80,000
100,000
120,000
140,000
160,000
Estim
ated
Cum
ulat
ive
Pass
enge
rs
Monthly Passengers Cumulative Passengers
Figure 3. Ridership estimates for the fuel cell buses at AC Transit
4 B. Nagle, Hydrogen Technology and Energy Curriculum (HyTEC), DOE Hydrogen Program 2008 Annual Merit Review, June 2008, www.hydrogen.energy.gov/pdfs/review08/ed_6_nagle.pdf
4

Hydrogen Fueling
The hydrogen fueling station at AC Transit was designed by Chevron Technology Ventures and installed at the East Oakland division in 2005. The station includes two steam methane reformers that are capable of producing a total of 150 kg of hydrogen per day. Total storage capacity at the station is 366 kg of hydrogen at up to 6,250 psi. The station was inaugurated in March 2006 just prior to the start of revenue service for the fuel cell buses. Figure 4 shows one of the fuel cell buses at the hydrogen fueling island and the fueling connections. A more detailed description of the hydrogen fueling and maintenance facilities at AC Transit is provided in Appendix C.
Figure 4. Fueling at the Chevron Hydrogen Station
Figure 5 shows average daily hydrogen usage from the station during the evaluation period (April 2006 through December 2007) for buses only. AC Transit also has a fleet of seven light duty hydrogen vehicles that use the station as well, but that fuel consumption is not accounted for in this analysis and discussion. The overall average daily usage during this period was 33.7 kg/day for buses. The calculation for this rate only includes the days in which hydrogen was dispensed from the station for buses – 52% of the calendar days during the period. A total of 11,288 kg of hydrogen were dispensed into buses during this period.
5

0.0
5.0
10.0
15.0
20.0
25.0
30.0
35.0
40.0
45.0
50.0
Apr-06
Jun-06
Aug-06
Oct-06
Dec-06
Feb-07
Apr-07
Jun-07
Aug-07
Oct-07
Dec-07
H2
Am
ount
(kg)
/ D
ayNew data since last report
Figure 5. Average hydrogen use per day for AC Transit’s fuel cell buses
Figure 6 shows the distribution of hydrogen amounts per fill. The three buses were filled a total of 551 times during the evaluation period, with an average fill amount of 20.5 kg/fill. Figure 7 shows the cumulative fueling rate histogram for the AC Transit station for the evaluation period. During this time, the overall average fueling rate was 1.56 kg/min. On average, it takes approximately 14 minutes to fuel a bus.
For most of the evaluation period, all hydrogen fueling was conducted by a Chevron technician. However, Chevron and AC Transit have been working on training and certification so that AC Transit employees are qualified to perform the fueling function themselves. Approximately 40 AC Transit employees completed classroom familiarization training for the fueling station and operation. Certification requires that each staff member complete 10 supervised fuelings (with the Chevron technician) along with the classroom training before being certified to fuel hydrogen on their own (with notification of Chevron and AC Transit).
6

0
20
40
60
80
100
120
0-10kg 10-15kg 15-20kg 20-25kg 25-30kg 30-35kg 35-40kg
Num
ber o
f Occ
urre
nces
Figure 6. Distribution of average fill amounts for the fuel cell buses
0-0.5 0.5-1 1-1.5 1.5-2 2-2.5 2.5-3 >30
20
40
60
80
100
120
140
160
180
200
Fueling Rate (kg/min)
Num
ber o
f Eve
nts
Figure 7. Fueling rate histogram for the AC Transit Hydrogen Energy Station (bus only)
7

Evaluation Results
The evaluation period for the fuel cell and diesel baseline buses for this report includes 21 months of operation from April 2006 through December 2007. The fuel cell buses started in revenue service on March 20, 2006, but the March 2006 data have not been included in the evaluation period to remove any early implementation/logistical issues. The diesel Van Hool buses are older and were in operation at AC Transit for some time prior to the evaluation period. The study group of diesel buses started operation in 2003-2004, but did not start operating at the East Oakland Division until July 2005. The evaluation period for the selected diesel buses is the same as that for the fuel cell buses.
In this third evaluation report, the fuel cell buses are considered to be prototype technology that is in the process of being commercialized. The analysis and comparison discussions with standard diesel buses help baseline the progress of the fuel cell bus technology. The intent of this analysis is to determine the status of this implementation and document the improvements that have been made over time at AC Transit. There is no intent to consider this implementation of fuel cell buses as commercial (or full revenue transit service). This evaluation focuses on documenting progress and opportunities for improving the vehicles, infrastructure, and procedures.
Route Descriptions The fuel cell and diesel baseline buses are operated from AC Transit’s East Oakland Division, which operates 15 local, two all-nighter, 10 transbay, and 14 school routes with 179 buses total (138 buses for peak service). The average bus operating speed for weekday service from the East Oakland Division is 14.3 mph.
For most of the evaluation period, the fuel cell buses were operated only during the week on two blocks of work that were created for testing the fuel cell and diesel baseline buses. This was done originally to help ensure that trained drivers and mechanics (and the manufacturer technicians) were available to work with the fuel cell buses. Also, AC Transit decided to place only two of the three fuel cell buses into service on any given weekday to allow for maintenance, training, and special events.
As AC Transit and the manufacturer partners have gained experience, there has been a desire to operate the fuel cell buses in a more aggressive manner. Starting with the June 2007 service change at AC Transit, the fuel cell buses were planned to operate on two new standard blocks of work on the newly formed Route 18, which are essentially the same level of service as a typical diesel bus. These two route blocks of work are shown in Table 2.
Table 2. New Route Blocks of Work Created for Fuel Cell Bus Operation
Route Block
Pull Out Time
Pull In Time
Total Time
Total Miles
Average Speed
18 6:11 AM 11:43 PM 17.53 171 9.8 18 5:16 AM 12:23 AM 19.11 199 10.4
8

There have been issues with meeting the long operation time of the Route 18 blocks because of the need to charge the batteries overnight before the next pullout. A full charge for the batteries requires between 4 and 4.5 hours. During bus operation on the route, the batteries are kept at 50% to 60% state of charge (SOC) to allow for significant energy regeneration from braking back into the batteries. AC Transit has not fully implemented Route 18 fuel cell bus operation because of problems with the ZEBRA batteries (discussed further as part of the next section).
The diesel buses are not restricted to these special blocks of work. These buses are allowed to operate on other work blocks during the week and on weekends as well. This is reflected in the bus use, which is discussed next.
Bus Use and Availability Bus use and availability are indicators of reliability. Lower bus usage may indicate downtime for maintenance or purposeful reduction of planned work for the buses. This section provides a summary of bus usage and availability for the two study groups of buses.
Table 3 summarizes the average monthly mileage accumulation by the fuel cell buses and the study group for the evaluation period. During this period, the fuel cell buses accumulated 62,191 miles (7,787 miles since the last evaluation report), and the fuel cell systems accumulated 5,765 hours (827 hours since the last evaluation report). These numbers indicate an overall average speed of 10.8 mph (9.4 mph since the last evaluation report), which is lower than the East Oakland Division operation speed of 14.3 mph.
The diesel buses operated a monthly average of 3,091 miles each as compared to the fuel cell buses, which operated a monthly average of 987 miles each. This indicates that the fuel cell buses operated only 32% of the miles that the diesel buses did in the same period. The fuel cell buses were limited to one eight-hour shift per weekday for most of the evaluation period. The diesel buses were used in typical service, up to seven days per week and 16-20 hours per day.
Another measure of reliability is availability – the percent of days that the buses are planned for operation compared to the days the buses are actually available. Figure 8 shows monthly availability for each of the three fuel cell buses and an overall average availability for the group during the evaluation period. For the first five months of the evaluation period, the availability for the group was between 80% and 90%. Starting in September 2006, the availability for the group dropped to around 60% due to problems with the ZEBRA batteries and changeouts of the fuel cell stack assemblies (CSAs). The ZEBRA batteries have continued to be an issue for availability and the CSAs were replaced in all three of the buses between April and August 2007 and again between September and December 2007. The length of time for shipping parts from remote locations also had an adverse effect on downtime for both issues.
The most recently installed UTC Power CSAs in the fuel cell buses are a newer/upgraded version of the power system. This newer power system is expected to be much more durable than the previous versions. Plans for more aggressive operation with these new power systems at AC Transit are discussed further in the last section of this report (What’s Next for AC Transit?).
9

Table 3. Average Monthly Mileage (Evaluation Period)
Bus Starting Hubodometer
Ending Hubodometer
Total Mileage Months Monthly Average
Mileage Fuel Cell
System Hours FC1 5,164 25,061 19,897 21 947 N/A FC2 778 19,461 18,683 21 890 N/A FC3 3,153 26,494 23,611 21 1,124 N/A
Fuel Cell 62,191 63 987 5,7651043 91,534 155,982 64,448 21 3,069 N/A 1044 108,346 174,535 66,189 21 3,152 N/A 1045 125,972 186,774 60,802 21 2,895 N/A 1046 125,685 193,493 67,808 21 3,229 N/A 1047 108,336 173,870 65,534 21 3,121 N/A 1048 94,092 158,784 64,692 21 3,081 N/A
Diesel 389,473 126 3,091 N/A
0
10
20
30
40
50
60
70
80
90
100
Apr-06
May-06
Jun-06
Jul-0
6
Aug-06
Sep-06
Oct-06
Nov-06
Dec-06
Jan-07
Feb-07
Mar-07
Apr-07
May-07
Jun-07
Jul-0
7
Aug-07
Sep-07
Oct-07
Nov-07
Dec-07
Ava
ilabi
lity
(%)
Total/Average FCB1 FCB2 FCB3
New data since last report
Figure 8. Availability for all three fuel cell buses and overall average
Table 4 summarizes the reasons for availability and unavailability for each of the three fuel cell buses. During the evaluation period, the average availability for the fuel cell buses was 55%. The overall availability percentage by bus and overall average is highlighted in blue in the table.
10

Table 4. Summary of Reasons for Availability and Unavailability of Buses for Service
Category FC1 FC2 FC3 Group TotalDays % Days % Days % Days %
Planned Work Days 440 437 445 1,322 Days Available 243 55 212 49 273 61 728 55Available 243 100 212 100 273 100 728 100On Route 172 71 183 86 191 70 546 75 Event/Demonstration 19 8 12 5 40 15 71 10 No Driver Available 13 5 7 3 4 1 24 3 Training 13 5 5 3 7 3 25 3 Not Used 26 11 5 3 31 11 62 9 Unavailable 197 100 225 100 172 100 594 100Fuel Cell Propulsion 126 64 92 41 84 49 302 51 ISE Propulsion 1 1 6 3 3 2 10 2 ZEBRA Battery 34 17 80 36 36 21 150 25 Air Conditioning 3 1 3 1 3 2 9 2 AC Transit Maintenance 24 12 37 16 31 18 92 15 Event Preparation 4 2 5 2 10 5 19 3 Fueling Unavailable 5 3 2 1 5 3 12 2
Fuel Economy and Cost Hydrogen fuel is supplied by the Chevron–AC Transit Hydrogen Energy Station at the East Oakland Division. The hydrogen is dispensed at up to 5,000 psi for the three fuel cell transit buses. During the evaluation period, Chevron employees provided nearly all fueling services for the hydrogen-fueled vehicles and electronically reported the fueling amounts.
Table 5 shows hydrogen and diesel fuel consumption and fuel economy for the study buses during the evaluation period. Overall, the three fuel cell buses averaged 6.23 miles per kg of hydrogen, which equates to 7.04 miles per diesel gallon equivalent (DGE). The energy conversion from kg of hydrogen to DGE is provided at the end of Appendix E. ISE also reported that the fuel cell buses had approximately 1,349 kg of hydrogen removed during the evaluation period so that the buses could be taken into the maintenance facility. This amount of hydrogen removed and vented equates to 12% of the hydrogen dispensed into buses.
The amount of hydrogen vented from the buses prior to maintenance has not been included in the fuel economy calculations. Also, as mentioned earlier, the buses are plugged in each night to recharge the batteries. This energy added to the fuel cell buses each night is not currently accounted for in the fuel economy calculation. AC Transit is now collecting the charging energy amounts. In future evaluation activities at AC Transit, we expect that estimates of charging energy per bus will be included in the fuel economy discussion.
11

Table 5. Fuel Use and Economy (Evaluation Period)
Bus Mileage (Fuel Base) Hydrogen (kg) Miles per
kg Diesel Equivalent Amount (Gallon)
Miles per Gallon (mpg)
FC1 19,897 3,138.2 6.34 2,777.1 7.16 FC2 18,683 3,024.2 6.18 2,676.3 6.98 FC3 23,611 3,819.6 6.18 3,380.1 6.99
FCB Total 62,191 9,981.9 6.23 8,833.6 7.041043 43,835 10,765.1 4.07 1044 42,379 9.916.2 4.27 1045 44,256 10,381.1 4.26 1046 45,518 10,873.8 4.19 1047 45,673 10,744.5 4.25 1048 42,914 10,295.4 4.17
Diesel Total 264,575 62,976.1 4.20
The diesel fuel consumption for the evaluation period is only available for January through December 2007. For this 12-month period, the six diesel baseline buses averaged 4.20 mpg, which indicates the fuel economy for the fuel cell buses is an overall 68% higher than that of the diesel buses.
Figure 9 shows a two-month rolling average fuel economy in both miles per kg and miles per DGE for the fuel cell buses as well as the diesel buses in miles per gallon. The chart shows a progression downward for the average fuel economy at the beginning of the period, indicating the first problems with the fuel cell systems. In the last four months of the evaluation period, the fuel cell fuel economy was back to the expected level. During the last few months of the evaluation period, the fuel economy started down again. This was caused by a combination of issues including the operating route, batteries, and additional air conditioning use.
The operating cost for hydrogen production and dispensing for AC Transit is currently estimated at between $6 and $8 per kg. This amount, which excludes capital expenses, was generated using early data (not optimized operation) and conservative maintenance and operating estimates. Using the $8 per kg cost estimate for hydrogen fuel indicates a cost per mile for the fuel cell buses of $1.28. The average diesel fuel cost per gallon during the evaluation period is $2.27 per gallon. This indicates a $0.54 per mile cost. The diesel cost per mile is about 42% of the fuel cell bus fuel cost per mile.
12

0.00
1.00
2.00
3.00
4.00
5.00
6.00
7.00
8.00
9.00
Apr-06
Jun-06
Aug-06
Oct-06
Dec-06
Feb-07
Apr-07
Jun-07
Aug-07
Oct-07
Dec-07
Fuel
Eco
nom
y (M
iles/
Kg)
2-M
onth
Avg
0
10
20
30
40
50
60
70
80
Mon
thly
Ave
rage
Hig
h Te
mpe
ratu
re (F
)
FCB Mi/kg FCB Mi/DGE Diesel MPG Avg. High Temp
Figure 9. Two-month average fuel economy (evaluation period)
Maintenance Analysis The maintenance cost analysis in this section is only for the evaluation period (April 2006 through December 2007). Warranty costs are not included in the cost-per-mile calculations. All work orders for the study buses were collected and analyzed for this evaluation. For consistency, the maintenance labor rate was kept at a constant $50 per hour; this does not reflect an average rate for AC Transit. This section first covers total maintenance costs, then maintenance costs broken down by bus system.
Total Maintenance Costs – Total maintenance costs include the price of parts and labor rates of $50 per hour; they do not include warranty costs. Cost per mile is calculated as follows:
Cost per mile = ((labor hours * 50) + parts cost) / mileage
Table 6 shows total maintenance costs for the fuel cell and diesel buses. Note that the fuel cell bus maintenance costs shown in the table are significantly lower because of the on-site warranty work done by the UTC Power and ISE technicians physically located at AC Transit. These technicians have done nearly all unscheduled and scheduled maintenance on the fuel cell buses for the fuel cell power systems and hybrid drive systems during the evaluation period. The AC Transit mechanics have supported the work done by the manufacturer technicians and have done cleaning and maintenance of the bus (inside and outside). Some support has been provided for responding to roadcalls and that effort is reflected in the maintenance discussion that follows.
13

Table 6. Total Maintenance Costs (Evaluation Period)
Bus Mileage Parts ($) Labor Hours
Cost per Mile ($)
FC1 19,897 2,229.98 139.7 0.46 FC2 18,683 3,510.46 149.1 0.59 FC3 23,611 5,284.15 193.0 0.63
Total Fuel Cell 62,191 11,024.59 481.8 0.57 Avg. per Bus 20,730 3,674.86 160.6 --
1043 64,448 13,950.38 203.9 0.38 1044 66,189 15,344.66 216.5 0.40 1045 60,802 18,561.89 224.7 0.49 1046 67,808 16,629.77 236.8 0.42 1047 65,534 19,152.69 220.8 0.46 1048 64,692 20,262.02 244.1 0.50
Total Diesel 389,473 103,901.41 1,346.8 0.44 Avg. per Bus 64,912 17,316.90 224.5 --
AC Transit has expressed a strong desire to have its mechanics get more involved in all maintenance activities for the fuel cell buses so that they get the experience. AC Transit has assigned one project manager/supervisor and two mechanic trainers to work on the fuel cell buses. This addition of resources for fuel cell bus maintenance will also be necessary based on the desired increase in operation along with the future plans for more fuel cell buses.
Maintenance issues for the fuel cell buses centered on problems with the traction batteries and the three replacements of the fuel cell system CSAs on each of the buses. In addition to those problems, there were two accidents that required significant work by the AC Transit mechanics – one for FC2 during February and March 2007; and one for FC3 in May 2007.
Maintenance issues for the diesel buses were mostly related to engine problems with the turbocharger (three buses), ECM (three buses), and coolant surge tank (three buses). The diesel buses also had significant brake repair costs for standard relining (eight times). The other major maintenance cost issues were for accident repair and replacing seats and windows (five buses).
The total maintenance costs, without warranty costs, are much lower for the diesel buses. The per-bus results for the fuel cell buses compared to the diesel buses are as follows:
• Usage/Mileage – The fuel cell buses are 68% lower than the diesel buses
• Parts Costs – The fuel cell buses are 79% lower than the diesel buses
• Labor Hours – The fuel cell buses are 28% lower than the diesel buses
• Cost per Mile (without warranty costs) – The fuel cell buses are 30% higher than the diesel buses
Maintenance Costs Broken Down by System—Table 7 shows maintenance costs by vehicle system and bus study group (without warranty costs). The vehicle systems shown in the table include the following:
• Cab, Body, and Accessories: Includes body, glass, and paint repairs following accidents; cab and sheet metal repairs on seats and doors; and accessory repairs such as hubodometers and radios
14

• Propulsion-Related Systems: Repairs for exhaust, fuel, engine, electric motors, fuel cell modules, propulsion control, non-lighting electrical (charging, cranking, and ignition), air intake, cooling, and transmission
• Preventive Maintenance Inspections (PMI): Labor for inspections during preventive maintenance
• Brakes
• Frame, Steering, and Suspension
• Heating, Ventilation, and Air Conditioning (HVAC)
• Lighting
• Air System, General
• Axles, Wheels, and Drive Shaft
• Tires
Table 7. Breakdown of Vehicle System Maintenance Cost per Mile (Evaluation Period)
System Fuel Cell* Diesel
Cost per Mile ($)
Percent of Total (%)
Cost per Mile ($)
Percent of Total (%)
Cab, Body, and Accessories 0.28 49 0.14 32
Propulsion-Related 0.09 16 0.10 23 PMI 0.11 19 0.07 16 Brakes 0.07 12 0.08 18 Frame, Steering, and Suspension 0.00 0 0.02 5
HVAC 0.01 2 0.01 2 Lighting 0.01 2 0.01 2 Air, General 0.00 0 0.00 0 Axles, Wheels, and Drive Shaft 0.00 0 0.01 2
Tires 0.00 0 0.00 0 Total 0.57 100 0.44 100
* Excludes warranty work costs
The systems with the highest percentage of maintenance costs for the fuel cell buses were propulsion-related; PMI; cab, body, and accessories; and brakes. These systems were also the highest maintenance cost systems for the diesel buses.
Propulsion-Related Maintenance Costs—Propulsion-related vehicle systems include the exhaust, fuel, engine, electric propulsion, air intake, cooling, non-lighting electrical, and transmission systems.
Table 8 shows the propulsion-related system repairs by category for the two study groups during the evaluation period (no warranty costs). The fuel cell and diesel buses had similar maintenance costs overall; however, these costs do not include the work done by the ISE and UTC Power personnel, which was covered under warranty.
15

Table 8. Propulsion-Related Maintenance Costs by System (Evaluation Period)
Maintenance System Costs Fuel Cell Diesel Mileage 62,191 389,473 Total Propulsion-Related Systems (Roll-up)Parts cost ($) 887.52 25,191.46 Labor hours 97.8 306.6 Total cost ($) 5,775.02 40,519.96 Total cost ($) per mile 0.09 0.10 Exhaust System RepairsParts cost ($) 0.00 5,258.08 Labor hours 0.0 33.6 Total cost ($) 0.00 6,935.58 Total cost ($) per mile 0.00 0.02 Fuel System Repairs Parts cost ($) 0.00 3,238.31 Labor hours 11.4 49.8 Total cost ($) 570.50 5,728.31 Total cost ($) per mile 0.01 0.02 Powerplant System RepairsParts cost ($) 126.68 7,689.35 Labor hours 15.0 98.2 Total cost ($) 874.68 12,598.85 Total cost ($) per mile 0.02 0.03 Electric Motor and Propulsion RepairsParts cost ($) 238.39 0.00 Labor hours 66.4 0.0 Total cost ($) 3,557.39 0.00 Total cost ($) per mile 0.06 0.00 Non-Lighting Electrical System Repairs (General Electrical, Charging, Cranking, Ignition) Parts cost ($) 220.19 1,888.56 Labor hours 2.0 45.8 Total cost ($) 320.19 4,177.56 Total cost ($) per mile 0.01 0.01 Air Intake System RepairsParts cost ($) 294.45 1,408.08 Labor hours 0.0 0.0 Total cost ($) 294.45 1,408.08 Total cost ($) per mile 0.01 0.00 Cooling System Repairs Parts cost ($) 7.80 5,041.17 Labor hours 1.0 70.5 Total cost ($) 57.80 8,566.17 Total cost ($) per mile 0.00 0.02 Transmission Repairs Parts cost ($) 0.00 533.15 Labor hours 2.0 2.8 Total cost ($) 100.00 670.65 Total cost ($) per mile 0.00 0.00
16
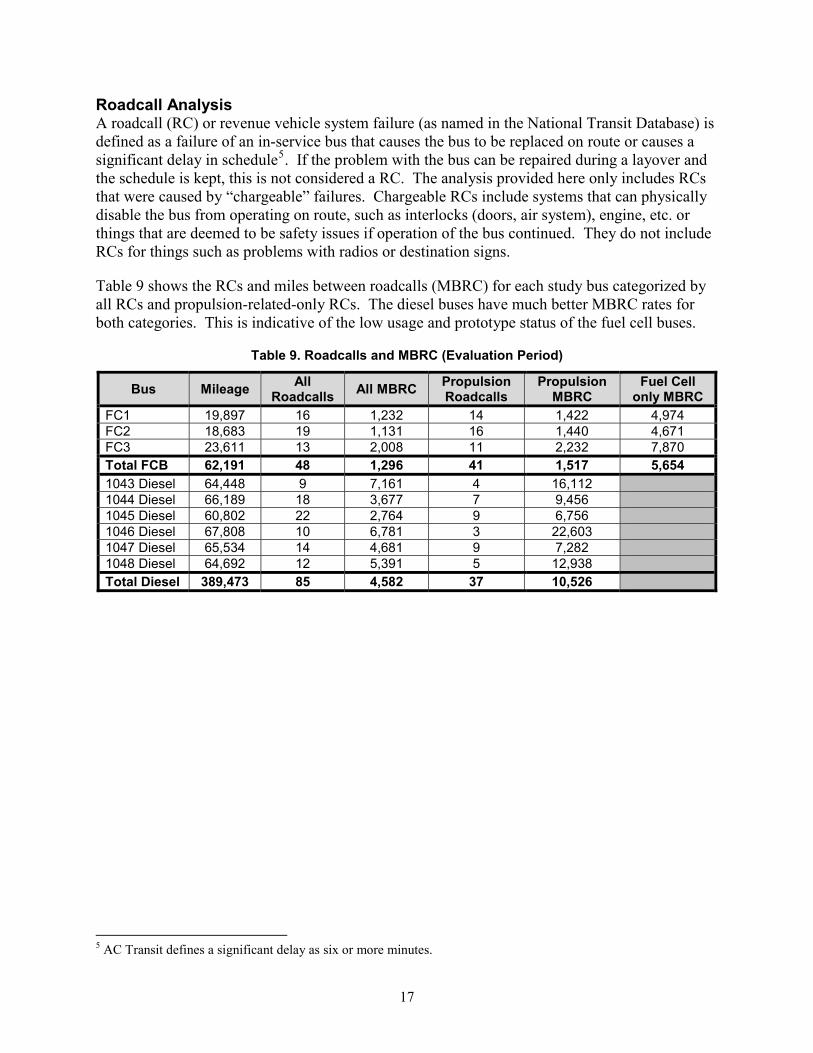
Roadcall Analysis A roadcall (RC) or revenue vehicle system failure (as named in the National Transit Database) is defined as a failure of an in-service bus that causes the bus to be replaced on route or causes a significant delay in schedule5. If the problem with the bus can be repaired during a layover and the schedule is kept, this is not considered a RC. The analysis provided here only includes RCs that were caused by “chargeable” failures. Chargeable RCs include systems that can physically disable the bus from operating on route, such as interlocks (doors, air system), engine, etc. or things that are deemed to be safety issues if operation of the bus continued. They do not include RCs for things such as problems with radios or destination signs.
Table 9 shows the RCs and miles between roadcalls (MBRC) for each study bus categorized by all RCs and propulsion-related-only RCs. The diesel buses have much better MBRC rates for both categories. This is indicative of the low usage and prototype status of the fuel cell buses.
Table 9. Roadcalls and MBRC (Evaluation Period)
Bus Mileage All Roadcalls All MBRC Propulsion
Roadcalls Propulsion
MBRC Fuel Cell
only MBRC FC1 19,897 16 1,232 14 1,422 4,974 FC2 18,683 19 1,131 16 1,440 4,671 FC3 23,611 13 2,008 11 2,232 7,870 Total FCB 62,191 48 1,296 41 1,517 5,6541043 Diesel 64,448 9 7,161 4 16,112 1044 Diesel 66,189 18 3,677 7 9,456 1045 Diesel 60,802 22 2,764 9 6,756 1046 Diesel 67,808 10 6,781 3 22,603 1047 Diesel 65,534 14 4,681 9 7,282 1048 Diesel 64,692 12 5,391 5 12,938 Total Diesel 389,473 85 4,582 37 10,526
5 AC Transit defines a significant delay as six or more minutes.
17

What’s Next for AC Transit?
AC Transit has many hydrogen-related activities currently under way and in the planning stages as part of its HyRoad program. The existing fuel cell bus operation has nearly reached the originally planned two years of operation and evaluation. The current operation is now transitioning over to AC Transit’s accelerated testing as part of the Federal Transit Administration’s (FTA) National Fuel Cell Bus Program (NFCBP). AC Transit plans to operate the three existing fuel cell buses in full revenue service to maximize usage for approximately two years.
At the same time, the California Air Resources Board (CARB) has required several California transit agencies (including AC Transit) to purchase new and advanced fuel cell buses as part of their zero-emission bus regulations. The Bay area is now required to have 12 new and advanced fuel cell buses in operation in 2009. AC Transit and UTC Power recently announced (May 6, 2008) an order for a minimum of eight new fuel cell power systems with options for an additional 13. These new fuel cell power systems are planned for delivery in 2009 and 2010. These systems are planned to be used in up to 20 fuel cell buses with one additional power system.
AC Transit’s Accelerated Testing for FTA – This activity plans to benchmark current fuel cell and hybrid systems in the three existing fuel cell buses at AC Transit. The three buses are now planned to operate in an accelerated manner – one block of the Route 18 on weekdays and three blocks of the Route 57 on weekdays and weekends. This accelerated testing started November 1, 2007, but had not been fully implemented by the end of the evaluation period in this report awaiting the installation of one of the fuel cell power systems and because of issues with availability of matched ZEBRA battery sets for each bus. Significant work has been completed at AC Transit to prepare for this accelerated testing, including training for all of the bus operators on the extra board (125 operators), addition of the two trainer mechanics assigned to the fuel cell bus program, and transition of hydrogen fueling from Chevron employees to AC Transit employees.
CARB Zero Emissions Bus Regulation – CARB adopted a revision to their Zero Emission Bus (ZEB) rule in October 2006. Under this revision, the four Bay area transit agencies without zero-emission buses (AC Transit, GGT, Santa Clara Valley Transportation Authority – VTA, and San Mateo County Transit District – SamTrans) are required to establish a regional advanced fuel cell bus demonstration of 12 fuel cell buses by January 1, 2009. The regulation revision also extends a requirement deadline for procurement of 15% fuel cell buses for all new bus purchases for these transit agencies until January 1, 2011. As mentioned above, AC Transit has announced their purchase of eight new fuel cell buses from Van Hool and UTC Power for delivery in 2009 and 2010. These new buses (purchase price of $2.275 million each) have a slightly different design than the current fuel cell buses – they are 4,000 lbs lighter, three inches shorter in height, and different energy storage battery chemistry such as nickel metal hydride (NiMH) or lithium ion. The other four fuel cell buses for the Bay Area are to be purchased by VTA and their demonstration partner, SamTrans.
18

Next Evaluation Report – This evaluation report covers AC Transit operation of the fuel cell and diesel buses through December 2007 and has been funded by DOE. The next evaluation report is funded by FTA as part of their National Fuel Cell Bus Program (NFCBP). Two evaluation reports are planned as part of AC Transit’s accelerated testing starting with data from November 1, 2007 forward, which does overlap some with this report. The next evaluation report will also document preparations for and operation of one of the fuel cell buses at GGT. GGT personnel were trained in hydrogen and operation of the fuel cell buses. GGT also tested their planned operation with one of the fuel cell buses to make sure that trees were adequately trimmed to account for the taller bus and that there would not be any operational issues. One of the fuel cell buses was operated on weekdays for nearly 30 days at GGT during February and March 2008.
Once the new buses for the CARB fuel cell bus demonstration start to arrive at AC Transit and the accelerated testing is completed, the evaluation funding will be transitioned back to DOE. This is expected to happen in mid-2009. The DOE evaluation plans include all 12 of the new fuel cell buses for the planned Bay Area CARB demonstration.
19

20
Contacts
DOE 1000 Independence Ave., SW Washington, DC 20585 John Garbak, Technology Validation Manager, Office of Hydrogen, Fuel Cells, and Infrastructure Technologies Phone: 202-586-1723 E-mail: [email protected] NREL 1617 Cole Boulevard Golden, CO 80401 Leslie Eudy, Senior Project Leader Phone: 303-275-4412 E-mail: [email protected] Battelle 505 King Avenue Columbus, OH 43201 Kevin Chandler, Program Manager Phone: 614-424-5127 E-mail: [email protected] AC Transit 1700 Franklin Street Oakland, CA 94612 Jaimie Levin, Director of Marketing & Alternative Fuels Policy Phone: 510-891-7244 E-mail: [email protected] Mallory Nestor-Brush, Project Director Phone: 510-891-7213 E-mail: [email protected] Doug Byrne, ZEB Program Manager Phone: 510-577-8821 E-mail: [email protected]
UTC Power 195 Governor’s Highway South Windsor, CT 06074 Michael Tosca, Senior Product Marketing and Sales Manager Phone: 860-727-7324 E-mail: [email protected] Matthew Riley, Senior Systems Engineer Phone: 510-628-8252 E-mail: [email protected] Tiffany Stanley, Marketing and Sales Manager Phone: 860-727-2294 E-mail: [email protected] ISE Corp 12302 Kerran Street Poway, CA 92064 Tavin Tyler, Director of Prototype Programs Phone: 858-413-1745 E-mail: [email protected] Chevron Technology Ventures – a Division of Chevron USA 1254 Daleview Dr McLean, VA 22102 Puneet Verma, Hydrogen Program Manager Phone: 703-848-0419 E-Mail: [email protected] Van Hool Bernard Van Hoolstraat 58 B-2500 Lier Koningshooikt , Belgium Paul Jenné, Automotive Relations Phone: +32 (3) 420 22 10 E-mail: [email protected]

Acronyms and Abbreviations AC Transit Alameda-Contra Costa Transit District
APC automated passenger counter
CARB California Air Resources Board
CSA cell stack assembly
DGE diesel gallon equivalent
DOE U.S. Department of Energy
ECM electronic control module
FTA Federal Transit Administration
GGBHTD Golden Gate Bridge, Highway, and Transportation District
GGT Golden Gate Transit
HyTEC Hydrogen Technology and Education Curriculum
HVAC heating, ventilation, and air conditioning
kg kilogram
MBRC miles between roadcalls
min minutes
mpg miles per gallon
mph miles per hour
NFCBP National Fuel Cell Bus Program
NiMH nickel metal hydride
NREL National Renewable Energy Laboratory
PMI preventive maintenance inspection
psi pounds per square inch
RC roadcall
SamTrans San Mateo County Transit District
SOC state of charge
VTA Santa Clara Valley Transportation Authority
ZEB zero emission bus
21

References and Related Reports AC Transit Chandler, K., Eudy, L., 2007, Alameda-Contra Costa Transit District (AC Transit), Fuel Cell Transit Buses: Evaluation Results Update, National Renewable Energy Laboratory, Golden, CO, NREL/TP-560-42249
Chandler, K., Eudy, L., 2007, AC Transit, Fuel Cell Transit Buses: Preliminary Evaluation Results, National Renewable Energy Laboratory, Golden, CO, NREL/TP-560-41041
NREL, 2006, AC Transit Demos Three Prototype Fuel Cell Buses, National Renewable Energy Laboratory, Golden, CO, DOE/GO-102006-2286
General NREL, 2008, Hydrogen and Fuel Cell Transit Bus Evaluations, Joint Evaluation Plan for the U.S. Department of Energy and the Federal Transit Administration, National Renewable Energy Laboratory, Golden, CO, NREL/MP-560-42781
Eudy, L., Chandler, K., Gikakis, C., 2007, Fuel Cell Buses in U.S. Transit Fleets: Summary of Experiences and Current Status, National Renewable Energy Laboratory, Golden, CO, NREL/TP-560-41967
SunLine Chandler, K., Eudy, L., 2008, SunLine Transit Agency, Hydrogen-Powered Transit Buses: Third Evaluation Report and Appendices, National Renewable Energy Laboratory, Golden, CO, NREL/TP-560-43741-1 and NREL/TP-560-43741-2
NREL, 2008, SunLine Begins Extended Testing of Hybrid Fuel Cell Bus, National Renewable Energy Laboratory, Golden, CO, DOE/GO12008-2610
Chandler, K., Eudy, L., 2007, SunLine Transit Agency, Hydrogen-Powered Transit Buses: Evaluation Results Update, National Renewable Energy Laboratory, Golden, CO, NREL/TP-560-42080
Chandler, K., Eudy, L., 2007, SunLine Transit Agency, Hydrogen-Powered Transit Buses: Preliminary Evaluation Results, National Renewable Energy Laboratory, Golden, CO, NREL/TP-560-41001
NREL, 2006, SunLine Tests HHICE Bus in Desert Climate, National Renewable Energy Laboratory, Golden, CO, DOE/GO-102006-2333
NREL, 2006, SunLine Expands Horizons with Fuel Cell Bus Demo, National Renewable Energy Laboratory, Golden, CO, DOE/GO-102006-2287
Chandler, K., 2006, Ten Years of Compressed Natural Gas (CNG) Operations at SunLine Transit Agency, National Renewable Energy Laboratory, Golden, CO, NREL/SR-540-39180
22

23
Chandler, K., Eudy, L., 2003, ThunderPower Bus Evaluation at SunLine Transit Agency, National Renewable Energy Laboratory, Golden, CO, DOE/GO-102003-1786
NREL, 2003, SunLine Test Drives Hydrogen Bus, National Renewable Energy Laboratory, Golden, CO, DOE/GO-102003-1768
Connecticut Transit NREL, 2008, CT TRANSIT Operates New England’s First Fuel Cell Hybrid Bus, National Renewable Energy Laboratory, Golden, CO, DOE/GO12008-2529
Santa Clara Valley Transportation Authority Chandler, K., Eudy, L., 2006, Santa Clara Valley Transportation Authority and San Mateo County Transit District, Fuel Cell Transit Buses: Evaluation Results, National Renewable Energy Laboratory, Golden, CO, NREL/TP-560-40615
NREL, 2005, VTA, SamTrans Look into Future with Bus Demo, National Renewable Energy Laboratory, Golden, CO, DOE/GO-102005-2147
Reports from DOE/NREL evaluations can be downloaded via the following Web sites: Hydrogen and fuel cell related: www.nrel.gov/hydrogen/proj_fc_bus_eval.html Hybrid and other technologies: www.nrel.gov/vehiclesandfuels/fleettest/publications_bus.html

F1147-E(09/2007)
REPORT DOCUMENTATION PAGE Form Approved OMB No. 0704-0188
The public reporting burden for this collection of information is estimated to average 1 hour per response, including the time for reviewing instructions, searching existing data sources, gathering and maintaining the data needed, and completing and reviewing the collection of information. Send comments regarding this burden estimate or any other aspect of this collection of information, including suggestions for reducing the burden, to Department of Defense, Executive Services and Communications Directorate (0704-0188). Respondents should be aware that notwithstanding any other provision of law, no person shall be subject to any penalty for failing to comply with a collection of information if it does not display a currently valid OMB control number. PLEASE DO NOT RETURN YOUR FORM TO THE ABOVE ORGANIZATION.1. REPORT DATE (DD-MM-YYYY)
July 2008 2. REPORT TYPE
Technical Report 3. DATES COVERED (From - To)
4. TITLE AND SUBTITLE
Alameda-Contra Costa Transit District (AC Transit) Fuel Cell Transit Buses: Third Evaluation Report and Appendices
5a. CONTRACT NUMBER DE-AC36-99-GO10337
5b. GRANT NUMBER
5c. PROGRAM ELEMENT NUMBER
6. AUTHOR(S) K. Chandler and L. Eudy
5d. PROJECT NUMBER NREL/TP-560-43545
5e. TASK NUMBER H2708200
5f. WORK UNIT NUMBER
7. PERFORMING ORGANIZATION NAME(S) AND ADDRESS(ES)National Renewable Energy Laboratory 1617 Cole Blvd. Golden, CO 80401-3393
8. PERFORMING ORGANIZATIONREPORT NUMBER NREL/TP-560-43545
9. SPONSORING/MONITORING AGENCY NAME(S) AND ADDRESS(ES)
10. SPONSOR/MONITOR'S ACRONYM(S)NREL
11. SPONSORING/MONITORINGAGENCY REPORT NUMBER
12. DISTRIBUTION AVAILABILITY STATEMENT National Technical Information Service U.S. Department of Commerce 5285 Port Royal Road Springfield, VA 22161
13. SUPPLEMENTARY NOTES
14. ABSTRACT (Maximum 200 Words) This report describes operations at Alameda-Contra Costa Transit district for three protoype fuel cell buses and six diesel buses operating from the same location.
15. SUBJECT TERMS hydrogen; buses; transit; demonstration; AC Transit; Alameda-Contra Costa; HyRoad; FTA
16. SECURITY CLASSIFICATION OF: 17. LIMITATION OF ABSTRACT
UL
18. NUMBER OF PAGES
19a. NAME OF RESPONSIBLE PERSON a. REPORT
Unclassified b. ABSTRACT Unclassified
c. THIS PAGE Unclassified 19b. TELEPHONE NUMBER (Include area code)
Standard Form 298 (Rev. 8/98) Prescribed by ANSI Std. Z39.18