
National Transit Database - NTD Transit Database 1 ... National Transit Database - NTD . ... Change...
25
Federal Transit Administration National Transit Database 1 Established by Congress in 1974 Primary national database for public transit Collects annual transit performance and financial data, monthly ridership, and safety and security data Summarizes data in various annual reports National Transit Database - NTD
Transcript of National Transit Database - NTD Transit Database 1 ... National Transit Database - NTD . ... Change...

Federal Transit Administration National Transit Database 1
Established by Congress in 1974
Primary national database for public transit
Collects annual transit performance and financial data, monthly ridership, and safety and security data
Summarizes data in various annual reports
National Transit Database - NTD

Federal Transit Administration
National Transit Database - NTD
Used to calculate Federal funding formulas
Supports
◦ Peer-group benchmarking
◦ Analysis of investment needs
◦ Research
Urban and rural transit grantees of Federal
funding are required to report

Federal Transit Administration National Transit Database 3
www.ntdprogram.com

Federal Transit Administration National Transit Database 4
Internet Reporting Login

5
2010 National Transit Database Highlights NTD Reporters by Organization
Urban and Rural NTD Reporters by Organization Type (January 2010 – December 2010)
Urbanized Areas not Served by Public Transit
Ridership
Transit Ridership Versus Employment (January 2003 – January 2011)
Safety
Annual Transit Fatality Data (January 2000 – December 2010)
Funding Sources
Public Funding for Transit by Government Jurisdiction (January 2000 – December 2010)
Capital and Operating Funding for Transit by Funding Source (January 2008 to December 2010)
Uses of Federal Funds by UZAs Over 200k in Population (January 2010 – December 2010)
Uses of Federal Funds by UZAs Under 200k in Population (January 2010 – December 2010)
Transit Asset Data
Transit Active Fleet by Vehicle Type (January 2010 – December 2010)
Change in Fixed Route Bus Service Fuel Types (January 2002 – December 2010)
Transit Operating Cost and Fares
Operating Cost per Vehicle Hour by Mode (January 2010 – December 2010)
Change in Transit Agency Fringe Benefits Expenses (January 2000 – December 2010)
Transit Agencies Operating Costs per Revenue Hour versus Farebox Recovery Ratio (January 2010 – December 2010)
Average Fare and Costs per Trip for Top 50 Fixed-Route Bus Services
NTD Transit Agency Profile Summary
Summary of Profiles for Top 50 Reporting Agencies (2010 Report Year)
WMATA Transit Agency Profile (Fiscal Year 2010)

Federal Transit Administration
What Is Reported to the NTD?
Sources of funds
Capital and operating expenditures
Amount of service provided
Ridership
Capital assets
Reports vary in detail by size of the
transit system reporting

Federal Transit Administration National Transit Database 7
Urban Reporting Agencies (5307)
729 Reporting Agencies
450 UZAs
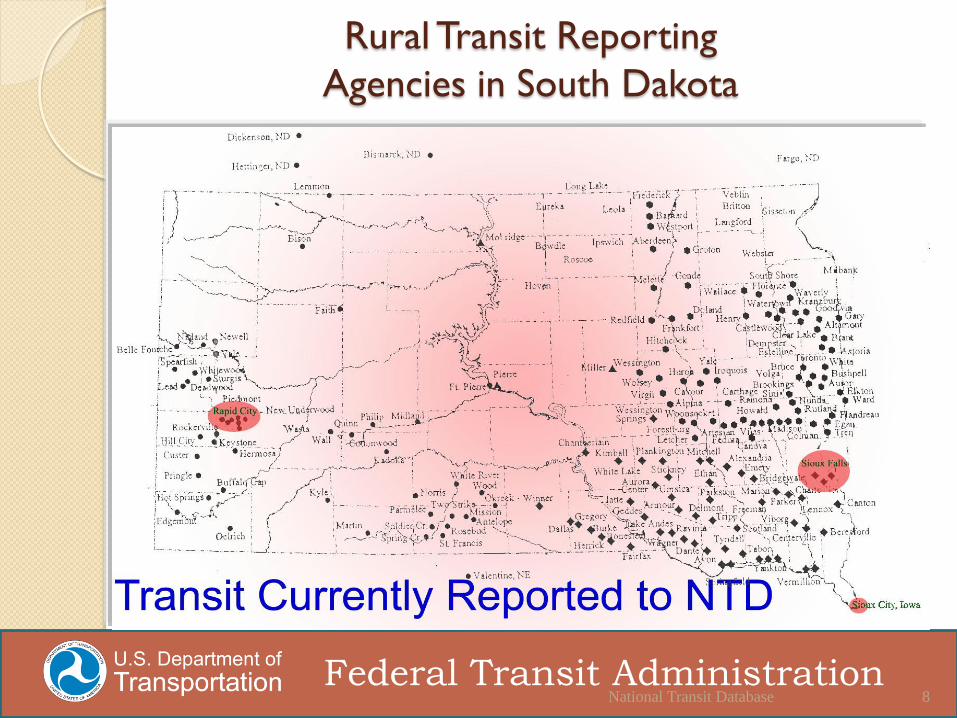
Federal Transit Administration National Transit Database 8
Rural Transit Reporting
Agencies in South Dakota
Federal Transit Administration
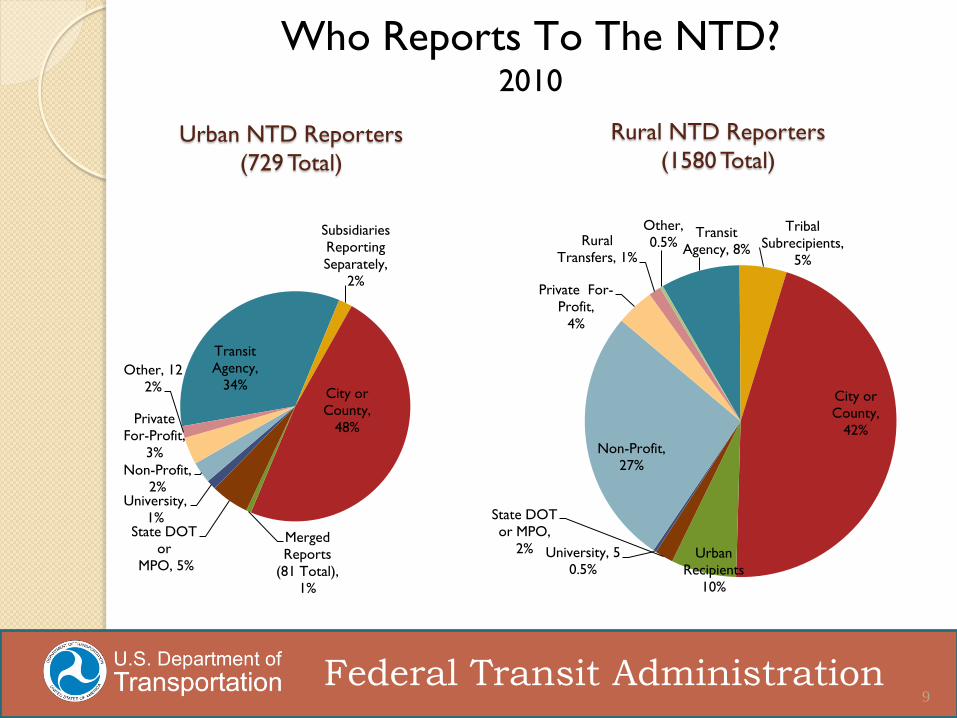
Urban NTD Reporters
(729 Total)
9
Transit
Agency,
34%
Subsidiaries
Reporting
Separately,
2%
City or
County,
48%
Merged
Reports
(81 Total), 1%
State DOT
or
MPO, 5%
University,
1%
Non-Profit,
2%
Private
For-Profit,
3%
Other, 12
2%
Transit
Agency, 8%
Tribal
Subrecipients,
5%
City or
County,
42%
Urban Recipients
10%
State DOT
or MPO,
2% University, 5
0.5%
Non-Profit,
27%
Private For-
Profit,
4%
Rural
Transfers, 1%
Other,
0.5%
Who Reports To The NTD?
Rural NTD Reporters
(1580 Total)
2010

Federal Transit Administration
Urbanized Areas – UZA
• 466 UZAs
• 16 Have no fixed route bus service
• 450 UZAs reporting

This exhibit contains data from July 2006 to October 2011. Weighted monthly NTD ridership data is available from 2002 onward. The gas price overlay is a 12 month average gas price
and therefore ridership, employment, and gas data are all 12 month averages. The graph uses 12 month weighted averages, thereby giving a more accurate representation of the monthly
NTD data. However, the ridership and employment data have been indexed for a clear comparison
11
Source: National Transit Database, U.S. Energy Information Administration's Gas Pump Data History, and Bureau of Labor Statistics' Employment Data.
$1.00
$1.50
$2.00
$2.50
$3.00
$3.50
$4.00
$4.50
94
96
98
100
102
104
106
108
Jul '06 Jan '07 Jul '07 Jan '08 Jul '08 Jan '09 Jul '09 Jan '10 Jul '10 Jan '11 Jul '11
Ind
ex J
ul '
06
= 1
00
R
ider
ship
, Em
plo
ymen
t
Index of Weighted
Nonfarm Employment,
Seasonally Adjusted
12-Month Weighted Ridership
12-Month Weighted Price of Regular Gas, All Formulations
Transit ridership is slowly recovering from lower employment and a crash in gas prices
Transit Ridership Versus
Average Gas Price and Employment

12
Higher Ridership Has Reduced the Fatality Rate per 100 Million PMT
Even as Total Fatalities Have Remained Relatively Constant
Source: National Transit Database Report Years 2000 to 2010 —Transit Safety and Security Statistics and Analysis Reporting.
Note: Exhibit includes data for CR, DR, HR, LR, and MB. Also, fatality totals include both directly operated (DO) and purchase transportation (PT) service
types.
0.56
0.52
0.55
0.50
0.48 0.47
0.44
0.48
0.42
0.44
0.41
0.00
0.10
0.20
0.30
0.40
0.50
0.60
0
50
100
150
200
250
300
350
400
450
500
2000 2001 2002 2003 2004 2005 2006 2007 2008 2009 2010
No
n-S
uic
ide
/ H
om
icid
e Fa
talit
ies
per
10
0 M
illio
n P
MT
Tota
l Fat
alit
ies
346
322
306
282 284 291 288
332
296
333
303
Oth
er F
atal
itie
s Su
icid
es
Non-Suicide/Homicide Fatalities per 100 Million PMT
Suic
ides
O
ther
Fat
alit
ies
Homicides
Homicides

13
Total Public Funding for Transit by
Government Jurisdiction
Source: National Transit Database Report Year 2010.
0%
5%
10%
15%
20%
25%
30%
35%
$0
$5
$10
$15
$20
$25
$30
$35
$40
$45
Fed
eral
Sh
are
of
Fun
din
g
Bill
ion
s o
f C
on
stan
t 2
01
0 D
olla
rs
Year
2010 Federal Funding: $10.4B
2010 State and Local Funding: $30B
2010 Total Funding: $40.4b
26% 26%
2010 Federal Funding:
$6.8B 2000 Federal Funding:
2010 State and Local Funding:
$27M
Federal Share, %
Federal
Funding
State and Local
Funding
The Federal share of total transit funding has remained relatively constant over 10 years
2000 State and Local Funding:
14
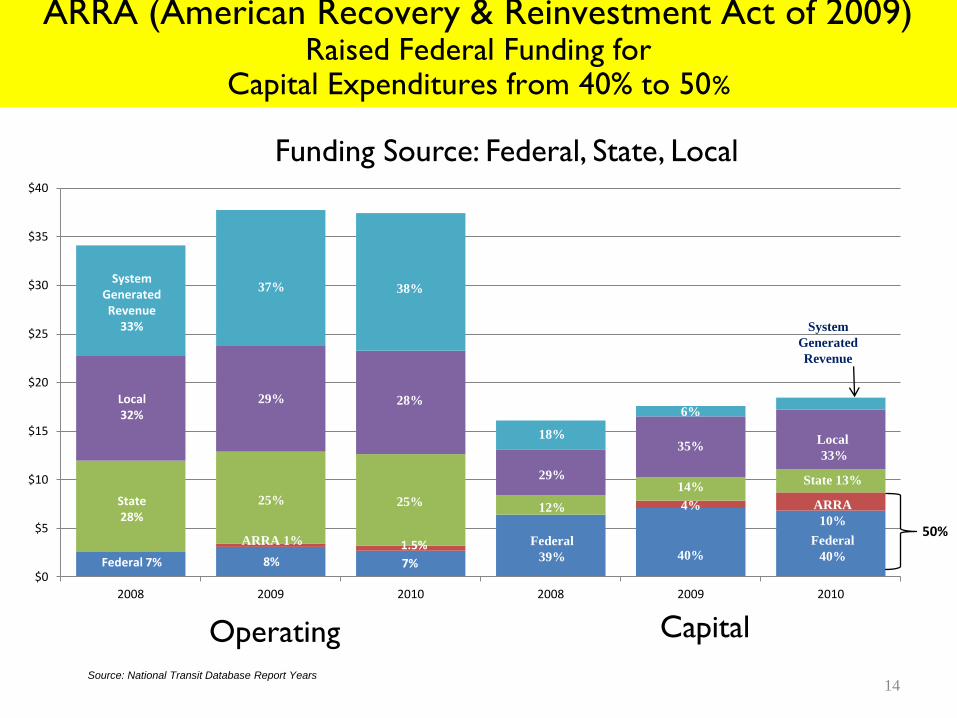
Funding Source: Federal, State, Local
$0
$5
$10
$15
$20
$25
$30
$35
$40
2008 2009 2010 2008 2009 2010
1.5%
Bil
lio
ns
of
Curr
ent
Do
llar
s
Source: National Transit Database Report Years
Operating Capital
System Generated Revenue
33%
Local 32%
State 28%
Federal 7%
37%
29%
25%
8%
38%
28%
25%
7%
ARRA 1%
29%
12%
Federal
39%
18%
14%
40%
6%
35%
4%
State 13%
Federal
40%
System
Generated
Revenue
7%
Local
33%
ARRA
10%
ARRA (American Recovery & Reinvestment Act of 2009) Raised Federal Funding for
Capital Expenditures from 40% to 50%
50%

15
$-
$1
$2
$3
$4
$5
$6
$7
Capital Expenditures Operating Expenditures
Fed
eral
Fu
nd
s A
lloca
ted
(B
illio
ns)
Source: National Transit Database Report Year 2010.
Other ARRA Funds
ARRA 5307 Funds
5309 Funds
5307 Funds 5307 Preventative
Maintenance Funds
5307 Funds
5309 Funds
Other Federal
Other Federal
ARRA 5307 Funds Other ARRA
Large UZAs (over 200k Population)
Nearly Half of 5307 Funds
Are Used for Preventive Maintenance Expenses
Preventive Maintenan
Capital 52%
FGM, New Starts,
Bus Discretionary
JARC, New Freedom, Homeland Security, etc.
$6.4B
$3.2B
Usage of 5307 Funds

16
$-
$50
$100
$150
$200
$250
$300
$350
$400
Capital Expenditures Operating Expenditures
Fed
eral
Fu
nd
s A
lloca
ted
(M
illio
ns)
Source: National Transit Database Report Year 2010.
Other ARRA Funds
ARRA 5307 Funds
5309 Funds
5307 Funds
Other Federal
5307 Funds
5307 Preventative Maintenance Funds
Other Federal
ARRA 5307 Funds Other ARRA
Federal Funding in Small UZAs (Under 200k Population)
$343.9M $269.4M
Capital Operating

17
58% of the Transit Fleet is in UZAs Over 1 Million
Source: National Transit Database Report Year 2010.
Notes:
*Source for "Special Service Vehicles" is the FTA, Fiscal Year Trends Report on the Use of Section 5310 Elderly and Persons with Disabilities Program Funds, 2002.
* *"Other Regular Vehicles" includes automated guideway vehicles, automobiles, cable cars, ferryboats, inclinded plane vehicles, jitneys, públicos, taxicabs, and trolleybuses.
87
125
136
2,386
23,136
8,735
27,613
21,929
719
1,993
2,626
3,504
8,609
11,434
24,723
10,107
52,573
0 20,000 40,000 60,000
Commuter Rail Locomotives
Light Rail Vehicles
Self-Propelled Commuter Rail
Commuter Rail Passenger Cars
Other Regular Vehicles**
Heavy Rail Vehicles
Rural Service Regular Vehicles
Vans
Special Service Vehicles*
Buses
Active Vehicles
Vehicles in Areas with Population of 1 Million
or more 58%
Vehicles in Areas of
Populations with Under 1
Million 42%

Data set includes all motorbus vehicles in fixed route service as reported in Urban NTD 2002 to 2010 report years.
* Other includes Bunker fuel, Electric battery, Ethanol, Grain additive, Kerosene, Liquefied natural gas (LNG), Liquefied petroleum gas (LPG) and fuel types reported as "other" in the
NTD.
** The diesel category contains bio-diesel and diesel fuel vehicles. 18
Annual
Mo
torb
us
Veh
icle
s R
epo
rted
to
Urb
an N
TD
0
10,000
20,000
30,000
40,000
50,000
60,000
70,000
2002 2003 2004 2006 2005 2007 2008 2009 2010
In 2001, CNG
vehicles accounted
for 8.7% of all MB
vehicles reported to
the NTD
In 2010, CNG represented
14.4% of all MB vehicles
reported to the NTD
Diesel Fuel**
CNG
Dual Fuel
Other*
Gasoline
Hybrid
Fixed-Route Bus Emissions
Cleaner Since 2002

19
Operating Cost per Vehicle Revenue Hour by Mode
Source: National Transit Database Report Year 2010.
Op
erat
ing C
ost
per
Veh
icle
Rev
enue
Ho
ur
Fixed-Route Bus Service Remains Cheaper
Per Vehicle - Hour than Rail Services
$246
$393
$160
$199
$245
$480
$120
$64 $61 $33
$54 $32
$0
$50
$100
$150
$200
$250
$300
$350
$400
$450
$500
Automated Guideway
Cable Car Inclined Plane
Heavy Rail Light Rail Commuter Rail
Fixed-Route Bus
Demand Response
Demand Response
Taxi
Vanpool Rural Bus-Only
Systems
Rural DR-Only
Systems
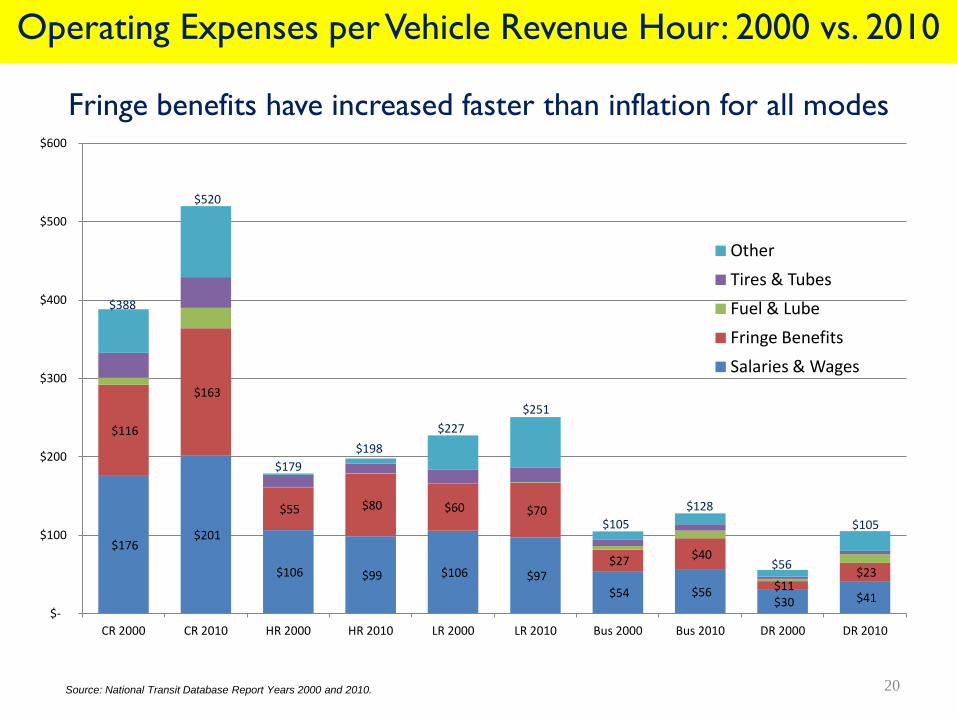
20 Source: National Transit Database Report Years 2000 and 2010.
Commuter Rail
Heavy Rail
Commuter Rail
Operating Expenses per Vehicle Revenue Hour: 2000 vs. 2010 C
onst
ant
20
10
Do
llar
s
$176 $201
$106 $99 $106 $97
$54 $56 $30 $41
$116
$163
$55 $80 $60 $70
$27 $40
$11 $23
$-
$100
$200
$300
$400
$500
$600
CR 2000 CR 2010 HR 2000 HR 2010 LR 2000 LR 2010 Bus 2000 Bus 2010 DR 2000 DR 2010
Other
Tires & Tubes
Fuel & Lube
Fringe Benefits
Salaries & Wages
$520
$388
$179
$198
$227
$251
$105
$128
$56
$105
Fringe benefits have increased faster than inflation for all modes
MTA NYCT
WMATA
CTA
BART
MBTA
MARTA
SEPTA
LA Metro
PATH Tri-Met
Denver RTD
San Diego MTS
MTA (Maryland)
Miami-Dade Transit
St. Louis Metro
MUNI
DART
PATCO
Sacramento RTD
NJ Transit
UTA
VTA (San Jose)
Sound Transit
Valley Metro Rail (Phoenix)
Tren Urbano Staten Island Railway
Cleveland RTA
Metro Transit (Minneapolis)
Port Authority (Pittsburgh)
NORTA
NFTA
Houston Metro
CATS (Charlotte)
0%
10%
20%
30%
40%
50%
60%
70%
80%
$100 $150 $200 $250 $300 $350 $400 $450 $500
Fare
bo
x R
eco
very
Rat
io
Operating Cost per Revenue Hour
21
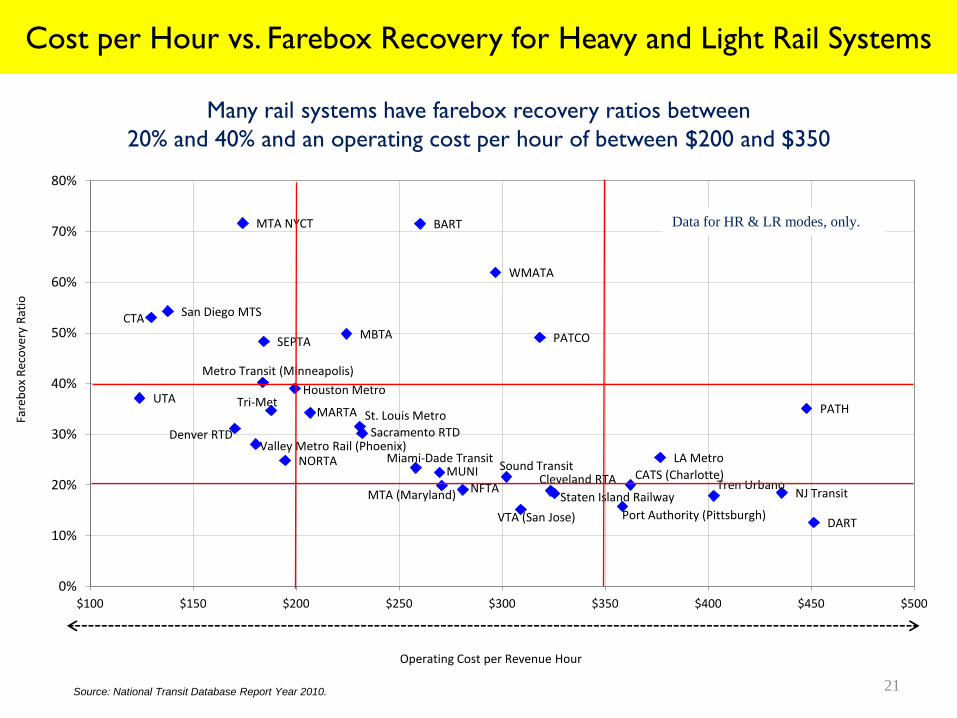
Data for HR & LR modes, only.
Source: National Transit Database Report Year 2010.
Many rail systems have farebox recovery ratios between
20% and 40% and an operating cost per hour of between $200 and $350
More Expensive Less Expensive
Cost per Hour vs. Farebox Recovery for Heavy and Light Rail Systems

MTA NYC Transit
LA Metro
NJ Transit
CTA
Houston Metro
SEPTA
WMATA
Denver RTD
King County Metro
Miami-Dade
DART MARTA
MTA Bus Co. (NYC)
MBTA
MTA (Maryland)
Port Authority (Pittsburgh)
Metro Transit (Minneapolis)
AC Transit
Tri-Met
OCTA
Pace
VIA (San Antonio)
Phoenix MUNI
Honolulu
San Diego
UTA
RTC (Las Vegas) St. Louis Metro
Milwaukee
VTA (San Jose) Lynx (Orlando)
Broward Cnty Detroit DOT
Capital Metro (Austin)
Cleveland RTD
Ride-On
Sound Transit
Foothill Transit
Hampton Roads
MTA Long Island Bus
CATS(Charlotte)
SMART
NFTA
JTA (Jacksonville)
COTA
PSTA(Tampa)
SWORTA
RIPTA Omnitrans
$-
$0.20
$0.40
$0.60
$0.80
$1.00
$1.20
$1.40
$1.60
$1.80
$2.00
$2.00 $3.00 $4.00 $5.00 $6.00 $7.00 $8.00
Ave
rage
Far
e
Operating Cost per Trip
Fixed-Route Bus Systems Ranked by Most Vehicle
Revenue Miles 1-10
11-25
26-50
Colors Indicate Farebox Recovery
Ratio Black: >40%
Green: 30-39% Blue: 20-29%
22
Average Fare and Costs per Trip for Top 50 Fixed-Route Bus Services
Average fares cover only 20% - 40% of a bus trip

Federal Transit Administration 23

Federal Transit Administration 24

Federal Transit Administration
Questions?
John D. Giorgis
National Transit Database Program Manager
Federal Transit Administration
US Department of Transportation


