
ABN AMRO - Annual Report Bank 2019 · 2020-03-27 · ABN AMRO Bank Annual Report 2019 Introduction...
295
ABN AMRO Bank N.V. Annual Report 2019
Transcript of ABN AMRO - Annual Report Bank 2019 · 2020-03-27 · ABN AMRO Bank Annual Report 2019 Introduction...

ABN AMRO Bank N.V.
Annual Report 2019

ABN AMRO Bank Annual Report 2019
IntroductionStrategy and perform
anceRisk, funding &
capitalLeadership
GovernanceAnnual Financial Statem
entsOther
Table of contents
2
Introduction
About this report 2Key figures and profile 3ABN AMRO shares 4
5
Strategy and performanceEconomic environment 6Regulatory environment 9Strategy 11Bank performance 15Business performance 23Responsibility statement 38
39
Risk, funding & capitalIntroduction to Risk,
funding & capital management 40
Risk, funding & capital management 41
Risk, funding & capital review 72
Additional risk, funding & capital disclosures 129
137
Leadership & governanceIntroduction to Leadership
& governance 138Executive Board and
Executive Committee 138Supervisory Board 142Report of the
Supervisory Board 146General Meeting and
shareholder structure 154Codes and regulations 157Legal structure 159Remuneration report 160
171
Annual Financial Statements 2019Consolidated Annual Financial Statements 2019 172Notes to the Consolidated Annual Financial Statements 179Company Financial Statements of ABN AMRO Bank N.V. 263Notes to the Company Financial Statements
of ABN AMRO Bank N.V. 267
281
OtherIndependent
auditor’s report 282Other information 290Cautionary statements 292Enquiries 293
IntroductionStrategy and perform
anceRisk, funding &
capitalLeadership &
governanceAnnual Financial Statem
ents 2019Other

ABN AMRO Bank Annual Report 2019
IntroductionStrategy and perform
anceRisk, funding &
capitalLeadership structure
GovernanceAnnual Financial Statem
entsOther
IntroductionStrategy and perform
anceRisk, funding &
capitalLeadership &
governanceAnnual Financial Statem
ents 2019Other
2Introduction / About this report
Introduction
Integrated Annual Review
AnnualReport
Non-financial data &
Engagement
Value-creating topics
Abbreviations
Overview of total assets
ImpactReport
Pillar 3Human Rights Update
About this report
The IAR takes information from a number of other reports that are published at the same time. This Annual Report is one of the bank’s ‘more’ reports - its purpose is to provide information about ABN AMRO’s financial and non-financial performance in compliance with regulatory requirements.
Other ‘more’ reports, such as the Pillar 3 Report, Impact Report and Human Rights Update, regularly provide further details on quantitative information in the areas of risk and capital management, sustainability performance, disclosures on human rights, and background information.
Presentation of informationThe Annual Report 2019 consists of the Executive Board report (chapters Strategy and performance, Risk, funding & capital management, Leadership & governance and Other information, as well as the sections Key figures and profile and ABN AMRO shares), the Report of the Supervisory Board and the Annual Financial Statements.
Information provided in the Annual Report is not an offer, investment advice or financial service. The information in this Annual Report is not intended to encourage any person to buy or sell any product or service from ABN AMRO Bank, or to be used as a basis for an investment decision. A decision to invest in products and services of ABN AMRO Bank N.V. can and should be based on the information in this Annual Report in conjunction with information included in a definitive prospectus and the Key Investor Information (if and to the extent required).
The financial information contained in this Annual Report has been prepared in accordance with International Financial Reporting Standards (IFRS) as adopted by the European Union (EU IFRS). Some sections of the Risk, funding & capital chapter of this Annual Report contain audited information and are part of the Consolidated Annual Financial Statements. Audited information in these sections is labelled as ‘audited’ in the respective headings. All capital metrics and risk exposures in this chapter are reported under the Basel III (CRD IV/CRR) framework. As from 2019, all capital figures and ratios, including comparatives, are shown on a fully-loaded basis (unless otherwise stated) . The Company Annual Financial Statements comply with Title 9, Book 2 of the Dutch Civil Code, and apply the EU IFRS valuation principles which are also applied in the Consolidated Annual Financial Statements. This report is presented in euros (EUR), which is ABN AMRO Bank’s presentation currency, rounded to the nearest million, and sets out the results for the entire ABN AMRO Bank organisation worldwide (unless otherwise stated). All financial year-end averages in this report are based on month-end figures. Management does not believe these month-end averages present trends that are materially different from those that would be presented by daily averages. Certain figures in this report may not tally exactly due to rounding. In addition, certain percentages in this document have been calculated using rounded figures.
To download this report or obtain more information, please visit us at abnamro.com/ir or contact us at [email protected]. The definitions and abbreviations used in this report can be found on the ABN AMRO website via abnamro.com/annualreport.
Welcome to ABN AMRO’s 2019 Annual Report ABN AMRO takes a ‘core and more’ approach to reporting. The Integrated Annual Review (IAR) is the ‘core’ report that explains how, over time, our bank creates value for its stakeholders. The IAR describes ABN AMRO’s business, strategy and performance - and its support for the long-term transition to a more sustainable economy.
Introduction About this report

ABN AMRO Bank Annual Report 2019
3Introduction / Key figures and profile
Key figures and profileABN AMRO is a modern, full-service bank with a transparent and client-driven business model, serving clients in the retail, private banking and corporate banking sectors. Our primary focus is on Northwest Europe. Outside the Netherlands, ABN AMRO has offices in 13 countries.
ABN AMRO’s ambition is to accelerate the transition to an inclusive, circular and sustainable society. We do this by offering products and services that contribute to a better future. We offer clients an extensive and comprehensive range of products and services across a variety of channels, including our Mobile Banking app and Internet Banking.
Key figures
Target 2019 2018
Financial resultsReturn on average equity 10-13% 10.0% 11.4%
Cost/income ratio 56-58% 61.2% 58.8%
CET1 17.5-18.5% 18.1% 18.4%
Dividend payout ratio1 50% 62% 62%
Non-financial results2
Net Promoter ScoreBest NPS of Dutch peers
- Retail Banking -10 -9
- Commercial Banking 1 -2
- Private Banking 9 -1
- Corporate & Institutional Banking 29 45
Employee engagement ≥ 80% 80% 80%
Trust monitor AFM/NvB Leading among large Dutch banks 3.2 3.3
Dow Jones Sustainability Index ranking Within 5% of sector banks3
top 10% of sector banks
top 5% of sector
banks
Gender diversity (% women)4
- total 44% 44%
- subtop 35% women 27% 27%
- top 30% women 28% 28%
FTEs5
Employee FTEsTotal employee FTEs 17,977 18,830
- of which the Netherlands 14,800 15,557
- of which Rest of Europe 2,169 2,267
- of which USA 438 429
- of which Asia 429 440
- of which Rest of the World 141 138
Non-employee FTEsTotal non-employee FTEs 4,749 4,608
1 Net sustainable profit excludes exceptional items that significantly distort profitability. In the first quarter of 2020, ABN AMRO proposed a dividend payout of 62% of the full-year 2019 net sustainable profit (after deduction of AT1 coupon payments and minority interests). The net sustainable profit for 2019 was identical to the net profit for 2019.
2 For definitions and measurement methods of the non-financial indicators, please refer to the strategy chapter.3 Please note that, under DJSI, scores are not directly comparable because of regular recalibration and changes to methodology (2019: 79; 2018: 86).4 In the Netherlands.5 As per 31 December.
Strategy and performance
Risk, funding & capital
Leadership & governance
Annual Financial Statements 2019
OtherIntroduction
Key figures and profile

ABN AMRO Bank Annual Report 2019
IntroductionStrategy and perform
anceRisk, funding &
capitalLeadership structure
GovernanceAnnual Financial Statem
entsOther
IntroductionStrategy and perform
anceRisk, funding &
capitalLeadership &
governanceAnnual Financial Statem
ents 2019Other
4Introduction / ABN AMRO shares
Introduction
Key developmentsBetween 31 December 2018 and 31 December 2019, ABN AMRO’s share price (depositary receipts) declined by 21% while the STOXX Europe 600 Bank index rose 8%. Total dividend proposed for 2019 is EUR 1.28 per share, representing a dividend payout of 62%. This consists of an interim dividend of EUR 0.60 paid in September 2019 and a proposed final dividend of EUR 0.68 per share, subject to approval at the upcoming Annual General Meeting.
Listing information and substantial holdingsA total of 470.9 million shares, or 50.1% of the total, are held by STAK AAB (‘Stichting Administratiekantoor Continuïteit ABN AMRO Bank’). STAK AAB has issued depositary receipts representing such shares, which are listed on Euronext Amsterdam. NLFI holds 59.7 million (6.4%) of these depositary receipts and has waived, in its capacity of holder of depositary receipts only, all meeting and voting rights attached to the depositary receipts other than the right to vote in the shareholders meeting of ABN AMRO. The remaining 469.1 million shares (49.9%) are held directly by NLFI. More information is provided in the Leadership & governance section of this report.
For more information about STAK AAB or NLFI, please go to the ‘About ABN AMRO’ section of abnamro.com or visit stakaab.org or nlfi.nl. The depositary receipts are traded under ISIN code NL0011540547, Reuters ticker ‘ABNd.AS’ and Bloomberg ticker ‘ABN:NA’.
Other than STAK AAB or NLFI, ABN AMRO is aware of one current or potential shareholder or owner of depositary receipts with an interest of 3% or more as at 31 December 2019: Blackrock, Inc.
Share price development(in %)
60%
80%
100%
120%
140%
Jan 2019 Dec 2019
ABN AMRO STOXX Europe 600 Banks IndexAmsterdam Exchange Index
Source: S&P Global Market Intelligence.
(in millions) 31 December 2019 31 December 2018
Share count1
Total shares outstanding/issued and paid-up shares 940 940
- of which held by NLFI (shares and depositary receipts) 529 529
- of which held by other investors (depositary receipts) 411 411
- as a percentage of total outstanding shares 44% 44%
Average number of shares 940 940
Average diluted number of shares 940 940
Key indicators per share (EUR)1
Earnings per share2 2.06 2.35
Shareholder's equity per share 20.73 20.58
Tangible shareholder's equity per share 20.54 20.41
Dividend per share3 1.28 1.45
Share price development (EUR)Closing price (end of period) 16.22 20.54
High (during the period) 22.98 28.48
Low (during the period) 14.92 19.81
Market capitalisation (end of period, in billions) 15.25 19.31
Valuation indicators (end of period)Price/Earnings 7.87x 8.74x
Price/Tangible book value 0.79x 1.01x
Dividend yield 7.9% 7.1%
Dividend payout ratio2 , 3 62% 62%
1 2018 figures represent former ABN AMRO Group.2 Profit for the period excluding reserved coupons for AT1 capital securities (net of tax) and results attributable to other non-controlling interests divided by the average outstanding
and paid-up ordinary shares.3 Dividend per share and payout ratio subject to approval of the annual general meeting in April 2020.
ABN AMRO shares
ABN AMRO shares
Strategy and performance
6
Economic environment
9
Regulatory environment
11
Strategy
15
Bank performanceFinancial review 15Non-financial review 19
23
Business performanceRetail Banking 24Commercial Banking 27Private Banking 30Corporate & Institutional Banking 33Group Functions 36
38
Responsibility statement
This section describes the environment in which ABN AMRO operated in the past year. It also includes details of the strategy and performance of the Bank and the business lines during the same period.
IntroductionRisk, funding &
capitalLeadership &
governanceAnnual Financial Statem
ents 2019Other
Strategy and performance
Strategy and performance

ABN AMRO Bank Annual Report 2019
IntroductionRisk, funding &
capitalLeadership structure
GovernanceAnnual Financial Statem
entsOther
IntroductionStrategy and perform
anceRisk, funding &
capitalLeadership &
governanceAnnual Financial Statem
ents 2019Other
6Strategy and performance / Economic environment
Strategy and performance
Economic environmentThe economic environment in which ABN AMRO Bank operates weakened in 2019. The economies of key markets – the Netherlands, Belgium, France, Germany, the United Kingdom and the United States – all continued growing, albeit at a slower pace. GDP growth in the Netherlands, ABN AMRO’s home market, weakened from 2.6% in 2018 to 1.7%. However, Dutch GDP growth remained well above the eurozone’s average of 1.2%.
Growth fully reliant on domestic demandTraditionally economic growth in the Netherlands has been strongly supported by the contribution from exports. However, things are changing. Foreign demand weakened in 2019 and, as a result, domestic demand became the major driver of economic growth. Private consumption, government spending and investment all contributed to GDP growth. Private consumption was supported by the favourable labour market, with employment continuing to expand, unemployment declining to 3.4% and the tight labour market propping up wages. Although, for a long time, wage moderation policies kept a lid on wage rises, recent wage agreements point to a moderately upward trend, which will support private consumption. Meanwhile the government has room for fiscal stimulus, although it is experiencing difficulty in implementing its spending plans. Since 2017 it has recorded budget surpluses of more than 1% of GDP, while 2019 government debt fell to below 50% of GDP. Investments also boosted economic activity. However, weaker producer survey outcomes and waning sentiment indicators are signalling a slowdown.
Dutch economic growth and its components(GDP growth (% year-on-year), contributions to GDP growth (percentage points))
20182017 2019
Private consumption Investment
Government spending Net exports
GDP growth
4
3
2
1
0
-1
Source: Thomson Reuters Datastream & ABN AMRO Group economics.
Trade conflicts pressurising global economyThe highly competitive and export-oriented Dutch economy is being affected by the Covid-19 outbreak, which affects global demand and disturbs international production chains. In addition, the trade tensions between the United States and China keep lingering. The world’s two largest economies are engaged in a tariff war, which is weighing on world trade and global industrial production. World trade is also being impacted by growing policy uncertainty. This uncertainty stems from the many political conflicts, including Brexit, the incessant tensions in the Middle East and street protests in various countries. Another cause is the growing awareness of environmental degradation and the challenges this poses to economies around the world. This applies not least in the case of the Netherlands, where the Council of State’s nitrogen ruling in May resulted in certain construction projects being delayed. This ruling was based on European regulations that prescribe restrictions for nitrogen emissions so as to protect biodiversity and soil quality and that prohibit activities producing net nitrogen emissions without compensatory measures.
2017 2018 2019
International trade & industrial production(% year-on-year)
World trade Global industrial production
-2
0
8
4
6
2
Source: Thomson Reuters Datastream.
Accommodative monetary policiesThe slowdown in the global economy during the year forced central banks to change tack. After a short period of monetary tightening they reverted to a more accommodative stance, with both the Federal Reserve and the European Central Bank (ECB) lowering policy rates. The latter also decided to resume its bond-buying programme. Interest rates came down in response to these monetary policy adjustments. The interest rate on 10-year Dutch government bonds even turned negative, falling from an average of 58 basis points in 2018 to minus 7 basis points in 2019. The central banks’ expansive measures were triggered by low inflation.
Economic environment

ABN AMRO Bank Annual Report 2019
7Strategy and performance / Economic environment
More worryingly, the fact that inflation forecasts for the eurozone are continuing to fall means there is a risk that low inflation will become more permanent. Average harmonised inflation in the eurozone is well below the ECB’s 2% target. While the Netherlands was an exception in this respect, with Dutch 2019 inflation rising by more than one percentage point to 2.7%, this rise was mainly due to the increase in the lower rate of VAT and will prove temporary. It is likely that inflation and interest rates will remain low. This could put pressure on funding spreads, particularly since banks are reluctant to charge negative interest rates on savings.
2017 2018 2019
Low interest rates for longer (%)
-0.6
-0.3
1.0
0.7
0.3
0
Source: Thomson Reuters Datastream.
Deposit rate of ECB
Netherlands government bond 10Y Euribor 3M
Continued rise in house pricesHouse prices continued to rise in 2019, albeit more slowly. The average rise recorded for the year was 6.9%, down from 9% in 2018. The average purchase price of existing properties increased to more than EUR 300,000. The continuing increase in house prices means negative equity problems have faded, thus lowering the costs of provisions. However, there are large regional differences as, since 2008, the average purchase price in the Randstad conurbation has risen significantly faster than in the rest of the country. It was not until the second half of 2019 that the rate at which house prices in the four largest cities in the Randstad (Amsterdam, Rotterdam, The Hague and Utrecht) are increasing fell below the national average. All in all, the housing supply remains extremely tight and the for-sale stock is continuing to shrink. As a result, the volume of transactions is under pressure. While more new-build construction is clearly needed, getting projects off the ground is a struggle. To break the impasse, the cabinet has announced various measures and assigned additional funds for the housing market. Given, however, the limited number of building permits issued, the situation is unlikely to improve any time soon.
20192017 2018
House prices and transactions in NL(% year-on-year) (thousands on a yearly basis)
House price (lhs) Transactions (rhs)
2.5
12.5 300
275
250
225
200
175
10
7.5
5
0
Source: Thomson Reuters Datastream.
Credit growth containedThroughout the year, banks continued to ease their credit standards for mortgage loans. A major driver was the increased competition in the mortgage market, also from non-banks. Meanwhile banks’ risk perceptions also diminished as payment arrears declined and negative equity debt problems moved into the background. Despite the looser credit standards, however, mortgage production growth slowed. This was due to the softening in the number of housing transactions. Refinancing accounted for a larger share of mortgage production during the year, with many homeowners trying to lock in to low interest rates. Overall, outstanding mortgage volumes continued to increase. Lending to non-financial businesses, by contrast, declined for the seventh year in a row. Credit demand softened, partly because of the bleaker economic prospects, but also because of the availability of sufficient internal funds and improved access to alternative funding tools such as corporate bonds. The continued decline in interest rates means investors are increasingly searching for yield and developing a greater appetite for risk.
20192017 2018
Outstanding loans in NL(EUR billions)
Bank lending to non-financial businesses
245
250
265
260
255
Source: De Nederlandsche Bank.
IntroductionRisk, funding &
capitalLeadership &
governanceAnnual Financial Statem
ents 2019Other
Strategy and performance

ABN AMRO Bank Annual Report 2019
IntroductionRisk, funding &
capitalLeadership structure
GovernanceAnnual Financial Statem
entsOther
IntroductionStrategy and perform
anceRisk, funding &
capitalLeadership &
governanceAnnual Financial Statem
ents 2019Other
8Strategy and performance / Economic environment
Strategy and performance
20192017 2018
Economic sentiment in NL(index) (index)
Consumer confidence (lhs) Producer confidence (rhs)
-10
0
40
30
20
10
0
15
9
12
6
3
Source: Thomson Reuters Datastream.
Growth prospects bleakWe expect the global business cycle to weaken and only improve in the course of 2020. The positives for GDP growth in 2020 include the stimulus measures being taken in China, monetary accommodation by the Federal Reserve, the cyclical upturn in the German car industry, the roll-out of the 5G network, low oil prices and some pent-up demand in Europe. However, economic growth is preconditional on the Covid-19 outbreak being contained and the United States and China bringing their trade conflicts to an end. Other risks to the more optimistic outlook are the growing uncertainty in the run-up to the presidential elections in the United States and the possibility of unpleasant Brexit-related surprises or a dramatic change of course by the European Commission or the European Central Bank, both of which had a leadership change in 2019. While the Dutch economy will benefit from stronger external demand, domestic production will be restrained by the nitrogen problems, which are expected to linger on and act as a drag on activity. The moderate economic outlook signals the prospect of relatively weak lending.

ABN AMRO Bank Annual Report 2019
9Strategy and performance / Regulatory environment
Regulatory developments in 2019The year 2019 saw large numbers of regulatory developments with a direct bearing on ABN AMRO. The most important of these are summarised below.
Banking reform packageIn 2019, the EU Banking Reform Package came into force. By amending the Capital Requirements Regulation and Directive (CRR/CRD), the Bank Recovery and Resolution Directive (BRRD) and the Single Resolution Mechanism Regulation, this package concludes a process that began in November 2016 and marks an important step towards completing the EU Banking Union. Key changes resulting from this package include:
Å Introduction of the Net Stable Funding Ratio (NSFR), which aims to prevent banks from becoming over-reliant on short-term wholesale funding to finance their long-term commitments;
Å Introduction of the Standardised Approach for Counter-party Credit Risk (SA-CCR), i.e. a new standardised manner to calculate counterparty credit risk;
Å Implementation of parts of the Fundamental Review of the Trading Book by introducing reporting requirements for market risk, calculated in line with the revised Basel Committee framework;
Å Introduction of Environmental, Social and Governance (ESG) risk disclosures for climate change-related risks;
Å Emphasis on prudential supervisors’ role in Anti-Money Laundering (AML) and Counter Terrorist Financing (CTF), as well as on identifying related weaknesses in financial institutions and imposing appropriate sanctions;
Å Changing the ‘minimum requirements for own funds and eligible liabilities’ (MREL) framework, including the introduction of detailed requirements for eligible liabilities, with the aim of achieving a credible bail-in tool;
Å Introduction of disclosure requirements on risk management objectives and policies, own funds and eligible liabilities, buffers and remuneration policy.
For additional information on the above topics, please refer to the relevant section in the Risk, funding & capital review section.
Developments in reducing non-performing loansThe NPE (Non-Performing Exposures) prudential backstop regulation entered into force on 26 April 2019. This regulation prescribes the amount of funds that institutions need to set aside to cover losses incurred on loans that become non-performing (the minimum loss coverage) and prescribes a deduction from own funds where NPE are not sufficiently covered by provisions or other adjustments. In August 2019, the ECB accordingly adjusted its supervisory expectations for prudential provisioning with regard to new NPE.
In addition, European Banking Authority (EBA) guidelines on the disclosure and management of non-performing and forborne exposures became applicable during 2019. This followed the ECB’s publication in November 2018 of new rules on the Definition of Default (DoD), contained in the CRR, which have a clear link to the EBA guidelines on non-performing and forborne exposures and also to the existing EBA guidelines on the DoD. The new ECB rules and the EBA guidelines on the DoD must be applied by 31 December 2020.
Steps were also taken during the year with regard to the proposal for an EU Directive on credit servicers, credit purchasers and the recovery of collateral, while draft EBA guidelines for loan origination were released for consultation and the European Commission launched a national insolvency benchmarking exercise. For additional information, please refer to the Risk, funding & capital management section.
EBA outsourcing guidelinesNew EBA guidelines on outsourcing arrangements entered into force on 1 October 2019. These guidelines replace the existing EBA recommendations of 2017 on outsourcing to cloud service providers and aim to ensure that financial institutions and payment institutions retain control over activities that they outsource to a third-party service provider. The guidelines apply to bank outsourcings entered into, reviewed or amended after 30 September 2019. Banks are also expected to review and amend their existing outsourcing arrangements so as to ensure compliance upon first renewal or, at the latest, by 31 December 2021.
Shareholder Rights Directive IIIn November 2019, the Netherlands implemented the revised European Shareholder Rights Directive (SRD II), which took effect on 1 December 2019. SRD II gives shareholders and depositary receipt holders, and also employees of listed companies (including ABN AMRO), greater influence over executive pay. In addition, it introduces statutory rules on material related-party transactions and existing legislation on shareholder identification, as well as electronic voting by shareholders at general meetings, and amends the processes for transmitting information through the chain. For more information, please refer to the Remuneration report.
Tax integrity and transparencyThe amended EU Directive on Administrative Cooperation (DAC6), which has been in force since June 2018, is aimed at achieving transparency and fairness in taxation. It applies to cross-border tax arrangements that meet one or more specified characteristics (‘hallmarks’). It has also introduced reporting requirements for tax arrangements
Regulatory environment IntroductionRisk, funding &
capitalLeadership &
governanceAnnual Financial Statem
ents 2019Other
Strategy and performance
Regulatory environment

ABN AMRO Bank Annual Report 2019
IntroductionRisk, funding &
capitalLeadership structure
GovernanceAnnual Financial Statem
entsOther
IntroductionStrategy and perform
anceRisk, funding &
capitalLeadership &
governanceAnnual Financial Statem
ents 2019Other
10Strategy and performance / Regulatory environment
Strategy and performance
that are in scope. These reporting requirements will take effect in July 2020, but have a retroactive element dating back to June 2018.
In July 2019, the Dutch central bank (DNB) also published its good practices on tax integrity risks for bank clients, setting out details of how banks should review the tax integrity of their clients as part of their gatekeeper role in the financial system. For additional information, please refer to the Non-financial review section.
Anti-Money Laundering regulationsIn December 2019, the Dutch House of Representatives (Tweede Kamer) adopted three Acts on combating money laundering, including the Act implementing the EU directive amending Anti-Money Laundering Directive 4 (also referred to as AMLD5). These Acts have now been submitted to the Dutch Senate (Eerste Kamer) for approval. AMLD5 introduces – inter alia – strict enhanced due diligence measures for financial flows from high-risk third countries1 and lower thresholds for identifying purchasers of prepaid cards and for the use of e-money. In addition, a bill on the action plan for combating money laundering (Wet plan van aanpak witwassen) was submitted for consultation in December 2019. This bill introduces the possibility – inter alia – of outsourcing transaction monitoring.
TRIM In December 2015, the ECB launched the Targeted Review of Internal Models (TRIM). The key objectives of this multi-year project are to assess whether the internal models currently used by banks comply with regulatory requirements, and whether their results are reliable and comparable. The aim is to reduce unwarranted variability (i.e. variability not justified by different risk profiles) in capital requirements and to ensure consistent supervisory practices across the euro area. The on-site phase of TRIM concluded in 2019. The ECB is expected to finalise the TRIM project in 2020. In parallel, the supervisory follow-up on TRIM findings will continue and the institutions will be expected to work intensively to address those findings. For more information on the impact of TRIM, please refer to the Risk, funding & capital review section.
Update on regulatory developments originating in previous years
Å Sustainability – EU Action Plan on sustainable finance: tripartite discussions between representatives of the European Parliament, the Council and the Commission have started on the ‘taxonomy’, i.e. a uniform EU classification system of sustainable economic activities. In October 2019 the Council published adopted texts of the regulation on sustainability-related disclosures and the regulation on sustainable benchmarks.
Furthermore, in June 2019, the Commission published guidelines on how to apply the 2017 Recommendations of the Task Force on Climate-related Financial Disclosures (TCFD) in a manner consistent with the EU Non-Financial Reporting Directive. The Recommendations of the TCFD, a taskforce established by the G20’s Financial Stability Board, aim to encourage companies to disclose information on climate-related risks and opportunities. Lastly, in December 2019, the EBA published its Action Plan on Sustainable Finance, in which it set out its plans on deliverables and activities related to ESG factors and ESG risks. For additional information, please refer to Sustainability risk management in the Risk, funding & capital management section;
Å Finalisation of Basel III reforms (Basel IV): the process of transposing the Basel IV standards into EU legislation is underway. In October 2019, the Commission launched a public consultation on the impact of implementing Basel IV. For additional information, please refer to the Capital section in the Risk, capital & funding review;
Å Interbank Offered Rates (IBOR) Reforms: the reform of the reference rates in the euro area to adapt to European standards and recommendations from international organisations is taking shape. In October 2019, the ECB began publishing its new overnight rate, the €STR. EONIA and €STR will coexist until the end of 2021, when EONIA will be discontinued. With regard to EURIBOR, the European Money Market Institute was granted authorisation for the administration of this benchmark. This followed the EMMI’s implementation of a new ‘hybrid methodology’ to better anchor the EURIBOR methodology in real transactions. For more information, please refer to Note 1 Accounting policies in the Consolidated Annual Financial Statements;
Å Payment Services Directive II (PSD II): the Regulatory Technical Standards on strong customer authentication and secure communication entered into force in September 2019. This establishes requirements for customer authentication by payment service providers. Following an EBA opinion to this effect, DNB has granted a limited extension, until 31 December 2020, to service providers that process e-commerce card-based payment transactions;
Å Brexit: The UK left the EU on Saturday, 31 January 2020 after a Brexit deal was negotiated and adopted. Parties now have until 31 December 2020 to negotiate a trade treaty. Until that date, a transition period will apply.
1 A country that is not a member of the European Union, as well as a country or territory whose citizens do not enjoy the European Union right to free movement (Schengen treaty).

ABN AMRO Bank Annual Report 2019
11Strategy and performance / Strategy
StrategyBanking for better, for generations to come Banking touches every sector and segment of society. Supporting clients at moments that matter has always been our role, our responsibility and our relevance. So we are taking a stand with a clear purpose: Banking for better, for generations to come.
To help us achieve this purpose, we pursue a strategy based on three pillars: support our clients’ transition to sustainability, reinvent the customer experience and build a future-proof bank. Our strategy goes beyond creating purely financial value: it is about creating lasting value for all our stakeholders. We want to build a bank fit for the future, able to adapt to a rapidly changing social and economic environment. That means strengthening our client focus, investing in innovation and training, meeting the challenge of new regulations and building a committed, skilled workforce – so we can help finance the shift to a more sustainable economy.
We have set up a dedicated strategy execution team to supervise strategy initiatives across the bank. By way of regular reporting to the bank’s Executive Committee, we monitor progress on our strategy and ensure resources are targeted at priority areas.
Support our clients’ transition to sustainabilityThis shift to a more sustainable society is very important to our clients, and we want to use our expertise to help them make the transition to sustainable products and business models. The sustainability shift offers opportunities for a bank at the heart of society, such as ABN AMRO. We aim to make a positive impact by doing what we’re good at - banking. We lead by example, taking a responsible approach to investment and lending, reducing our carbon footprint and behaving ethically and with integrity. To pursue our strategy, we are focused on the wider sustainability shift: our efforts are designed to help mitigate climate change, accelerate the circular transition and create positive social impact.
Increasingly, our clients choose or seek advice on sustainable solutions, such as energy savings for their homes or businesses. When providing mortgage advice, we always discuss with our clients how they could improve the sustainability of their homes. Through our partnership with De Energiebespaarders, we help homeowners in the Netherlands make their homes more energy-efficient. We also finance housing associations that are moving their housing stocks away from gas.
Private Banking in the Netherlands has made sustainability its default option: all new clients are first offered sustainable products and services, a change that has been well received. We offer transparency through our Client Assessment on Sustainability (CASY) dashboard, a tool that shows corporate clients in every sector their environmental footprint and benchmarks their performance against peers. On the basis of this assessment, we either help clients improve, or we offer them financing on the condition that they improve their rating. In addition, we are exploring opportunities for financing renewable energy and may also offer such loans to institutional investors.
Reinvent the customer experienceWe aim to reinvent the customer experience by being a client-focused bank that treasures client relationships. We strive to give our clients a warm welcome, with seamless and instant service. For products and services that we cannot yet offer instantly, such as mortgages, we aim to give our clients peace of mind by being fully transparent about the process, the next steps and the estimated timelines until completion. When our clients want assistance or a service, they should be able to get it instantly, in the way that suits them best, by phone, email, chat, in our apps or at one of our branch offices.
We seek to deliver an effortless and distinctive customer experience, looking at the world through our clients’ eyes rather than taking our own products and services as a starting point. We want our clients to experience ABN AMRO as a client-centric, continuously learning organisation that focuses on improving customer satisfaction.
At the same time, we are reinventing our role as a bank. Taking our clients’ needs and circumstances as a starting point, we develop new propositions beyond traditional financial services. Commercial Banking, Retail Banking and Corporate & Institutional Banking have already started exploring what new opportunities lie ahead in the next five years. We work with many partners to deliver better services and extend our proposition.
Build a future-proof bankTo become a future-proof bank, we have to be highly efficient, with strong capital ratios and a strong financial performance, and we need engaged employees. To keep our employees engaged, we must continue to enable them to develop new skills and improve internal processes. This means investing in employee development and attracting new talent. To be more efficient, we will continue to invest in technology to establish a future-fit
Strategy
IntroductionRisk, funding &
capitalLeadership &
governanceAnnual Financial Statem
ents 2019Other
Strategy and performance

ABN AMRO Bank Annual Report 2019
IntroductionRisk, funding &
capitalLeadership structure
GovernanceAnnual Financial Statem
entsOther
IntroductionStrategy and perform
anceRisk, funding &
capitalLeadership &
governanceAnnual Financial Statem
ents 2019Other
12Strategy and performance / Strategy
Strategy and performance
organisational structure with systems and processes that allow our employees to do the best work they can. We intend to achieve this by renewing our IT landscape, reducing bureaucracy and complexity, and rationalising our product portfolio. Compliance is effectively our licence to operate; we take our role as a gatekeeper very seriously.
At the same time, we are increasing our capacity in order to keep up with the regulatory agenda. We regard compliance as effectively our licence to operate; we take our role as a gatekeeper to the financial system very seriously.
Strategic targets
Group targets Metric Targets 2019 results 2018 results
Non-fi nancial
Gender diversity at the top 30% women at the top 28% 28%
Gender diversity at the subtop 35% women at the subtop 27% 27%
Dow Jones Sustainability Index (DJSI) ranking Top 5% of banking sector
Top 10% of banking sector
Top 5% of banking sector
Banking Confidence Monitor Leading among large Dutch banks 3.2 3.3
Financial
Return on average equity 10-13% 10.0% 11.4%
Cost/income ratio 56-58% 61.2% 58.8%
CET1 (fully-loaded) 17.5-18.5% 18.1% 18.4%
Dividend payout ratio At least 50% of net sustainable profi t 62% 62%
Strategic pillars Metric 2022 targets 2020 targets 2019 targets 2019 results1
Support our clients’ transition to sustainability
We are committed to helping our clients become more sustainable
Å Renewable energy commitment as a % of energy portfolio Å Sustainable financing Å Sustainable investments (client assets)
26%2
EUR 7.5 billionEUR 30 billion4
20%EUR 3.0 billion
EUR 22.5 billion5
14%EUR 1.5 billion
EUR 14.5 billion
14%–3
EUR 20.6 billion
We provide our clients with insight into their sustainability performance
Clients rated on our CASY6 sustainability rating tool Å Commercial Banking Å Corporate & Institutional Banking
100%100%
100%100%
100%100%
42%84%
We help our clients invest to make their homes and real estate more sustainable
Å Average energy label (residential properties) Å Average energy label (commercial properties)
70% rated A-C47% average A
63% rated A-C31% average A
61% rated A-C23% average A
60% rated A-C26% average A
Reinvent the customer experience
Net Promoter Score (relational)
Å Retail Banking Å Commercial Banking Å Private Banking Å Corporate & Institutional Banking
≥ -4≥ +1 ≥ +9
≥ +32
≥ -107
≥ +18
≥ +99
≥ +2910
≥ -6≥ 0
≥ +1≥ +32
-10+1+9
+29
Build a future-proof bank
Employee engagement ≥ 80% 80% 80% 80%
1 We introduced new targets in 2018 as part of our strategy refresh. Therefore, we did not report against all strategic pillar metrics. Figures available for 2018 are as follows: NPS Retail Banking (-9); NPS Private Banking (-1), NPS Commercial Banking (-2), NPS Corporate & Institutional Banking (+45) and Employee engagement (80%).
2 Target for 2022 is indicative only; we are currently enhancing our methodology for this metric. 3 Sustainable financing is a new KPI which is still under development. We expect to report results in 2020.4 Please note that our target for 2022 will be reviewed to reflect the EU taxonomy for sustainable activities. 5 This target was originally set at EUR 16 billion; it has been readjusted to EUR 22.5 billion.6 CASY - Client Assessment on Sustainability.7 This target was originally set at ≥-3; it has been readjusted to ≥-10.8 This target was originally set at ≥+3; it has been readjusted to ≥+1.9 This target was originally set at ≥+3; it has been readjusted to ≥+9.10 This target was originally set at ≥+36; it has been readjusted to ≥+29.

ABN AMRO Bank Annual Report 2019
13Strategy and performance / Strategy
As part of our 2018 strategy refresh, we set several financial and non-financial targets for the bank to fulfil our strategy. 2019 was the year in which we made the shift to execute this strategy.
Despite the low interest rate environment, we achieved a solid return on equity (ROE) of 10.0% in 2019, which is still within our target range. We maintained strong cost-discipline, keeping costs relatively flat despite higher regulatory costs and investments. However, we did not meet our cost/income ratio target of 56-58%, as it was difficult to fully offset the impact of low interest rates on deposit margins. We expect costs to be around EUR 5.1 billion in 2020 and below EUR 5.0 billion thereafter. Our capital position remains strong, with a fully-loaded Basel III CET1 ratio of 18.1% at year-end 2019, including a EUR 10 billion add-on (on RWA) in anticipation of TRIM (Targeted Review of Internal Models) and model reviews. Nevertheless, we currently face a number of uncertainties such as further significant TRIM impacts, and we remain subject to an investigation by the Dutch public prosecutor. In addition, the Dutch central bank (DNB) wants Dutch banks to increase RWA for mortgages, which will increase our RWA by around EUR 7.5 billion in 2020. Given these uncertainties, we propose maintaining the dividend payout stable compared with last year, at 62%, which is a 12% additional distribution on top of the 50% of net sustainable profit.
We made progress in achieving our non-financial group targets, although in some areas the results were below the set targets. We dropped slightly in the Dow Jones Sustainability Index ranking due to a new methodology used by Robeco and we are not on track to achieve either our banking confidence monitor or our gender diversity targets. For the coming year, we have the necessary plans in place to further intensify our efforts aimed at improving these targets.
Our efforts in 2019 resulted in the realisation of some key sustainability targets: on renewable energy, Mission 2030 and clients’ sustainable investments. By the end of 2019, clients’ sustainable investments with ABN AMRO had grown to EUR 20.6 billion – meaning we already surpassed our EUR 16 billion target for 2020 a year ahead of schedule. This is why we set new targets: increase clients’ sustainable investments to EUR 22.5 billion by 2020 and EUR 30 billion by 2022. Average energy labels for both our residential and commercial mortgage portfolios have improved, with the latter achieving our 2019 target. We continued our efforts to make Mission 2030 a success. At the same time we achieved our target for our renewable energy portfolio commitment of 14% (of our total energy portfolio). We are confident that we are on track to achieve our target of 20% in 2020. Our Employee Engagement
Index remains stable, at 80, which is on target. We strive to offer our people the best employee experience, in order to be an employer of choice, now and in the future.
Long-term value creationWe create value, not only as a provider of financial services, but also as an employer and investor. Like any company, however, our activities may also have negative effects. For example, by lending to business, we may help drive economic growth and job creation. However, in doing so, we may also increase carbon emissions and cause damage to the environment. Our strategy is to increase long-term value for our stakeholders, while minimising the negative effects of our business, wherever possible.
Our value creation model (see our Integrated Annual Review 2019) is based on the IIRC’s Integrated Reporting Framework, which recognises six forms of capital – financial, human, intellectual, manufactured, social and relationship, and natural. Our model shows the flow of the value we consume – from the resources, or capital, we need to run our business – to the financial, social and economic value we create through our activities. As a result, it provides an understanding of how we create value for all stakeholders and in what form.
We carry out an assessment of our operating environment every two years. This allows the bank to identify its most important value-creating topics: social, economic, financial or environmental. This assessment is based on input from stakeholders and senior management. We distinguish four different groups of stakeholders: clients, employees, investors and society. Each group’s input is asked and then weighed equally. The results are presented to ABN AMRO’s Executive Committee for discussion and topics are then ranked according to magnitude (their potential impact on value creation) and likelihood (how likely a topic is to bring about this impact). Our last materiality exercise took place in 2018; we reviewed the results in 2019 against recent market developments. Based on this process, we identified nine strategic differentiators where we believe ABN AMRO potentially creates most value for its stakeholders. These differentiators form the basis of the bank’s strategy and its approach to value creation; each differentiator is tied directly to our three strategic pillars (see the following graphic). In turn, each of these pillars has specific KPIs and metrics. In addition to these differentiators, we identified other fundamental value creators, such as secure banking, compliance and data protection, that are key to our ability to implement our strategy and help protect the bank’s long-term licence to operate.
IntroductionRisk, funding &
capitalLeadership &
governanceAnnual Financial Statem
ents 2019Other
Strategy and performance

ABN AMRO Bank Annual Report 2019
IntroductionRisk, funding &
capitalLeadership structure
GovernanceAnnual Financial Statem
entsOther
IntroductionStrategy and perform
anceRisk, funding &
capitalLeadership &
governanceAnnual Financial Statem
ents 2019Other
14Strategy and performance / Strategy
Strategy and performance
Our value-creating topics
Sustainable Development Goals (SDGs)In 2015, all United Nations Member States adopted the 2030 Agenda for Sustainable Development, a shared ambition for peace and prosperity for people and the planet, now and in the future. There are 17 integrated Sustainable Development Goals at the heart of this global partnership, with topics ranging from ending poverty and creating lifelong learning opportunities, to human rights and combating climate change.
ABN AMRO was one of the founding signatories of the Principles for Responsible Banking in September 2019, committing to strategically aligning its business with the SDGs and the Paris Agreement on climate change. By signing the Principles for Responsible Banking, ABN AMRO joined a coalition of 130 banks worldwide, representing over USD 47 trillion in assets, in committing to taking on a crucial role in helping to achieve a sustainable future.
We have identified three SDGs to which we believe we can contribute most, as an investor, employer, partner and a provider of financial services. Obviously we do not exclude any of the other SDGs. Below are the three SDGs we focus on and what outcomes we are promoting:
Å Decent work and economic growth (SDG 8) “Promote sustained, inclusive and sustainable economic growth, full and productive employment and decent work for all.”
Å Human rights and labour standards are built into the bank’s lending, investment and procurement policies;
Å We provide loans and support to SMEs to help them expand, drive economic growth and create new jobs;
Å We issue social impact bonds, which are used to raise funds to help young people on state benefits get a job;
Å We partner with authorities to identify suspicious financial transactions.
Å Responsible consumption and production (SDG 12) “Ensure sustainable consumption and production patterns.”
Å We grant loans that are used to upgrade infrastructure, improve energy efficiency and retrofit industries with cleaner technologies;
Å We provided nearly EUR 590 million to fund circular economy initiatives.
Å Climate action (SDG 13) “Take urgent action to combat climate change and its impacts.”
Å We help clients make their homes and commercial properties more energy efficient to reduce CO2 emissions;
Å We provide green financing through our green bonds, Energy Transition Fund and Groenbank in the Netherlands;
Å We are working with clients to increase their sustainable investments, which now exceed EUR 20 billion;
Å We are on track to achieve our target of investing 20% of our overall energy portfolio in renewable energy by 2020.
Å Responsible investment & financing 1
Å Circular economy 1
Å Ethics & integrity 1
Å Customer experience 2
Å Co-creation & innovation 2
Å Digitalisation 2
Å Viable business model 3
Å System stability 3
Å Talent attraction 3
Å Adaptability
Å Anti-corruption
Å Client data protection
Å Corporate governance
Å Employee empowerment
Å Regulatory compliance
Å Secure banking
Å Strong balance sheet
Å Vision & leadership
Strategic differentiators
Fundamental value creators
Strategic pillar 3Build a future-proof bank
Strategic pillar 1Support clients’ transition to sustainability
Strategic pillar 2Reinvent the customer experience

ABN AMRO Bank Annual Report 2019
15Strategy and performance / Bank performance / Financial review
Bank performanceFinancial reviewThis financial review includes a discussion and analysis of the results and financial condition of ABN AMRO.
Income statementFinancial highlights
Å Net profit amounted to EUR 2,046 million in 2019, reflecting lower operating income largely attributable to a decline in other operating income.
Å Net interest income was solid, despite the low interest rate environment.
Å Costs continued to trend downwards due to cost-saving programmes and lower restructuring provisions, which were partially offset by rising cost of detecting financial crime (DFC activities). Cost/income ratio at 61.2% (2018: 58.8%).
Å Impairments remained flat overall as the increase due to model and methodology changes was fully offset by lower impairments at Commercial Banking and Corporate & Institutional Banking.
Å Capital position was strong with CET 1 ratio at 18.1% (including add-ons in anticipation of TRIM and model reviews) and Return on Equity of 10.0%.
Å We are one of the high ranking banks in the Dow Jones Sustainability Index.
Å Video banking is now used in all segments, including our Private Banking in Germany and France.
Å We are broadening our product range through partnerships; in 2019 we forged partnerships in cybersecurity, corporate finance, legal advice and accounting software.
Operating results
(in millions) 2019 2018 Change
Net interest income 6,468 6,593 -2%
Net fee and commission income 1,632 1,699 -4%
Other operating income 504 800 -37%
Operating income 8,605 9,093 -5%Personnel expenses 2,247 2,441 -8%
Other expenses 3,021 2,910 4%
Operating expenses 5,268 5,351 -2%
Operating result 3,337 3,742 -11%Impairment charges on financial instruments 657 655 0%
Profit/(loss) before taxation 2,680 3,086 -13%Income tax expense1 634 736 -14%
Profit/(loss) for the period1 2,046 2,350 -13%
Attributable to:Owners of the parent company1 2,046 2,312 -12%
Non-controlling interests 39
Other indicatorsNet interest margin (NIM) (in bps) 164 165
Cost/income ratio 61.2% 58.8%
Cost of risk (in bps)2 24 24
Return on average Equity3 10.0% 11.4%
Dividend per share4 1.28 1.45
Earnings per share (in EUR)5 2.06 2.35
Client Assets (end of period, in billions) 296.5 285
Risk-weighted assets (end of period, in billions) 109.8 105
Employee FTEs (end of period) 17,977 18,830
Non-employee FTEs (end of period) 4,749 4,608
1 Comparative figures for 2018 have been restated. Please refer to Note 1 Accounting policies in the Consolidated Annual Financial Statements.2 Annualised impairment charges on loans and advances customers for the period divided by the average loans and advances customers (excluding at fair value through P&L) on the basis
of gross carrying amount and excluding the fair value adjustments from hedge accounting. 3 Annualised profit for the period excluding coupons attributable to AT1 capital securities and results attributable to non-controlling interests divided by the average equity attributable
to the owners of the company excluding AT1 capital securities. 4 Interim/final dividend per share over the relevant period as declared/proposed by the company, subject to approval at the annual general meeting. 5 Profit for the period excluding coupons attributable to AT1 capital securities and results attributable to non-controlling interests divided by the average outstanding and paid-up ordinary shares.
IntroductionRisk, funding &
capitalLeadership &
governanceAnnual Financial Statem
ents 2019Other
Strategy and performance
Bank performance

ABN AMRO Bank Annual Report 2019
IntroductionRisk, funding &
capitalLeadership structure
GovernanceAnnual Financial Statem
entsOther
IntroductionStrategy and perform
anceRisk, funding &
capitalLeadership &
governanceAnnual Financial Statem
ents 2019Other
16Strategy and performance / Bank performance / Financial review
Strategy and performance
Large incidentals
Collective labour agreement (CLA): Q4 2019 included a one-off payment of EUR 30 million to the pension fund, as agreed under the new collective labour agreement for 2020-2021. Q1 2018 included a EUR 16 million one-off payment of EUR 1,000 per employee. CLA wages were adjusted for inflation at 2% on 1 January 2018 and 1 January 2019.
Restructuring provisions:Q4 2019 included EUR 12 million in restructuring provisions related to the integration at Private Banking Belgium. This amount was partly offset by EUR 9 million in releases from restructuring provisions at several business segments. 2018 included EUR 129 million in restructuring provisions.
Provision for the customer due diligence (CDD) programme: Q4 2019 included additional provisions of EUR 33 million for CDD remediation programmes at Commercial Banking (EUR 25 million) and International Card Services (ICS) at Retail Banking (EUR 8 million). Cumulative provisions for CDD remediation programmes now amount to EUR 259 million (EUR 85 million in
Q4 2018, EUR 114 million in Q2 2019, EUR 27 million in Q3 2019 and EUR 33 million in Q4 2019). This amount does not include the usage of the provision. Provision for SME derivates-related issuesThe provision for project costs relating to SME derivatives-related issues increased by EUR 23 million in 2019, compared with an addition of EUR 41 million in 2018. In Q1 2019, we recorded a provision of EUR 34 million for client compensation in operating income.
Divestment StaterQ2 2019 included a EUR 130 million book gain (tax exempt) in other income of Group Functions. ABN AMRO sold 75% of its Stater shares to Infosys at the end of May 2019.
Various one-offs including DSB Q2 2019 included EUR 45 million for one-offs, largely relating to DSB due to the positive revaluation of a claim.
AnalysisABN AMRO’s profit in 2019 amounted to EUR 2,046 million (2018: EUR 2,350 million). The decrease of EUR 304 million compared with full-year 2018 was mainly attributable to a decline in income from volatile items in 2019 (equity participations and hedge accounting-related results) and a EUR 174 million rise in provisions for CDD programmes in 2019 (2018: EUR 85 million). Return on equity was 10.0% in 2019 compared with 11.4% in 2018. This 1.4 percentage point decrease was mainly attributable to the decline in operating income resulting from lower net interest income and other operating income. Operating income amounted to EUR 8,605 million, a decrease of EUR 488 million compared with 2018.
Net interest income decreased by EUR 125 million to EUR 6,468 million (2018: EUR 6,593 million) as deposit margin pressure caused by the low interest rate environment was partially compensated by positive incidentals during 2019. On the asset side, interest income on residential mortgages declined, reflecting slightly lower volumes. New production in 2019 was higher than in the previous year - our market share in new production grew to 18% in 2019 (2018: 17%). Interest income on consumer loans decreased, mainly due to lower margins throughout 2019, while interest income on corporate loans increased due to improved margins.
Net fee and commission income decreased by EUR 67 million to EUR 1,632 million (2018: EUR 1,699 million), largely due to divestments (mainly Stater).
Other operating income decreased by EUR 296 million to EUR 504 million in 2019 (2018: EUR 800 million). Excluding divestments and incidentals recorded in both years, other operating income decreased due to significantly lower equity participations (EUR 52 million versus EUR 274 million in 2018) and lower hedge accounting-related income (EUR 4 million negative versus EUR 111 million in 2018).
Personnel expenses declined by EUR 194 million to EUR 2,247 million in 2019 (2018: EUR 2,441 million). Adjusted for lower restructuring provisions in 2019 (EUR 3 million versus EUR 129 million in 2018), the one-off payment of EUR 30 million to the pension fund in 2019 and a one-off payment of EUR 16 million in 2018, the decline was mainly attributable to continued progress in cost-saving programmes and divestments, which was partially offset by the growing cost of DFC activities.
Other expenses increased by EUR 111 million to EUR 3,021 million in 2019 (2018: EUR 2,910 million). This increase is mainly explained by the provisions booked for CDD remediation programmes (EUR 174 million versus EUR 85 million in 2018) and additional DFC-related costs.
Impairment charges on financial instruments amounted to EUR 657 million, flat compared to 2018 (EUR 655 million). Impairment charges in CIB throughout 2019 were mainly recorded in the energy-offshore and logistics sectors.

ABN AMRO Bank Annual Report 2019
17Strategy and performance / Bank performance / Financial review
Balance sheetCondensed statement of financial position
(in millions) 31 December 2019 31 December 2018
Cash and balances at central banks1 27,061 35,716
Financial assets held for trading 1,137 495
Derivatives 5,730 6,191
Financial investments 45,277 42,184
Securities financing 14,905 12,375
Loans and advances banks1 5,011 6,780
Loans and advances customers 268,102 270,886
Other 7,831 6,668
Total assets 375,054 381,295Financial liabilities held for trading 675 253
Derivatives 6,505 7,159
Securities financing 8,234 7,407
Due to banks 12,785 13,437
Due to customers 234,991 236,123
Issued debt 75,275 80,784
Subordinated liabilities 10,041 9,805
Other 5,076 4,968
Total liabilities 353,582 359,935Equity attributable to the owners of the parent company 21,471 21,357
Equity attributable to non-controlling interests 2
Total equity 21,471 21,360
Total liabilities and equity 375,054 381,295
Committed credit facilities 54,673 61,166
Guarantees and other commitments 17,479 15,241
1 ABN AMRO has reclassified EUR 1.3 billion from loans and advances banks to cash and balances at central banks in the comparative figures for 2018. Please refer to Note 1 Accounting policies in the Consolidated Annual Financial Statements.
Main developments in assetsTotal assets decreased by EUR 6.2 billion to EUR 375.1 billion (2018: EUR 381.3 billion), largely driven by lower cash and balances at central banks and a decline in loans and advances customers.
Cash and balances at central banks decreased by EUR 8.7 billion to EUR 27.1 billion at 31 December 2019, mainly reflecting lower outstanding balances at several European central banks.
Derivatives decreased by EUR 0.5 billion to EUR 5.7 billion (2018: EUR 6.2 billion) on the back of mid- to long-term interest and FX rate movements impacting the valuation of derivatives; this was mirrored in derivatives liabilities.
Financial investments increased by EUR 3.1 billion to EUR 45.3 billion (2018: EUR 42.2 billion), partly due to a shift from cash and balances at central banks.
Loans and advances customers decreased by EUR 2.8 billion to EUR 268.1 billion (2018: EUR 270.9 billion). Loans to professional counterparties and other loans decreased by EUR 1.2 billion, mainly in Clearing. Residential mortgages declined modestly to EUR 148.2 billion (2018: EUR 148.8 billion). Consumer loans remained broadly stable, whereas corporate loans decreased by EUR 1.0 billion. Commercial Banking growth was modest, while CIB client loans decreased by EUR 1.4 billion (including EUR 0.6 billion attributable to the impact of the USD appreciation), mainly in Global Transportation & Logistics and Natural Resources sectors. The decrease in CIB loans follows from the CIB refocus, which is expected to gradually impact volumes throughout 2020.
IntroductionRisk, funding &
capitalLeadership &
governanceAnnual Financial Statem
ents 2019Other
Strategy and performance

ABN AMRO Bank Annual Report 2019
IntroductionRisk, funding &
capitalLeadership structure
GovernanceAnnual Financial Statem
entsOther
IntroductionStrategy and perform
anceRisk, funding &
capitalLeadership &
governanceAnnual Financial Statem
ents 2019Other
18Strategy and performance / Bank performance / Financial review
Strategy and performance
Loans and advances customers
(in millions) 31 December 2019 31 December 2018
Residential mortgages 148,225 148,791
Consumer loans 12,294 12,263
Corporate loans to clients1 90,254 91,265
- of which: Commercial Banking 41,997 41,753
- of which: Corporate & Institutional Banking 41,136 42,521
Total client loans2 250,773 252,319Loans to professional counterparties and other loans3 16,412 17,642
Total Loans and advances customers2 267,185 269,961Fair value adjustments from hedge accounting 3,342 3,185
Less: loan impairment allowance 2,426 2,260
Total Loans and advances customers 268,102 270,886
1 Corporate loans excluding loans to professional counterparties.2 Gross carrying amount excluding fair value adjustment from hedge accounting.3 Loans to professional counterparties and other loans includes loans and advances to governments, official institutions and financial markets parties.
Main developments in liabilities and equityTotal liabilities decreased by EUR 6.4 billion to EUR 353.6 billion (2018: EUR 359.9 billion). The decrease was recorded mainly in due to customers and issued debt.
Derivatives decreased by EUR 0.7 billion to EUR 6.5 billion (2018: EUR 7.2 billion) on the back of mid- to long-term interest and FX rate movements impacting the valuation of derivatives.
Due to banks decreased by EUR 0.7 billion to EUR 12.8 billion (2018: EUR 13.4 billion), mainly as a result of more active balance sheet management.
Due to customers decreased by EUR 1.1 billion to EUR 235.0 billion in 2019 (2018: EUR 236.1 billion). The decreases in Retail Banking (mainly the sale of the Moneyou Belgium portfolio) and CIB were partly offset by increases in Commercial Banking and Private Banking.
Issued debt securities decreased by EUR 5.5 billion to EUR 75.3 billion (2018: EUR 80.8 billion) as a result of lower long-term funding.
Total equity remained stable at EUR 21.5 billion as the inclusion of profit for the period was offset by dividend payments and a decrease in accumulated other comprehensive income (OCI).
Due to customers
(in millions) 31 December 2019 31 December 2018
Retail Banking 90,359 93,482
Commercial Banking 46,269 44,958
Private Banking 69,153 66,156
Corporate & Institutional Banking 26,481 28,018
Group Functions 2,729 3,509
Total Due to customers 234,991 236,123

ABN AMRO Bank Annual Report 2019
19Strategy and performance / Bank performance / Non-financial review
Non-financial reviewThis non-financial review is based on the reporting requirements set out in Section 2:391, paragraphs 1 and 5, of the Dutch Civil Code (Burgerlijk Wetboek) pertaining to non-financial information. This section provides information on our policies with regard to crime and integrity, our employees, human rights, and responsible tax.
Crime and integrityWe acknowledge the importance of our role as a gatekeeper in safeguarding the financial system against financial crime. We seek to continually improve our policies, procedures, systems and controls to live up to our regulatory and societal obligations and expectations, to minimise the risk of being involved in or associated with money laundering, the financing of terrorism, corruption or tax evasion, and to comply with internationally agreed economic sanctions.
In September 2019, the Dutch public prosecutor informed ABN AMRO that it is subject of an investigation relating to requirements under the Dutch Act on the prevention of money laundering and financing of terrorism (in Dutch: Wwft). The scope of the investigation includes whether the bank has complied with the Wwft in relation to having client files in good order, timely reporting unusual transactions and discontinuing relationships with clients in good time. The timing of the completion of the investigation and the outcome are uncertain. Therefore, the financial impact of a potential fine, if any, cannot be reliably estimated at this time. ABN AMRO is cooperating fully.
Clients and third-party integrityBefore entering into and during business relationships, ABN AMRO carries out due diligence on its clients and third parties such as agents, intermediaries and suppliers. We do this using a risk-based approach, aimed at minimising the risk of being involved in or associated with money laundering, terrorism financing, corruption or tax evasion.
We systematically monitor the activities of our clients and report any suspicious or unusual transactions to the relevant authorities. Prospective and existing clients in high-risk situations (such as those involving politically exposed persons, adverse media, or clients in countries or sectors with an inherently higher risk of financial crime) undergo additional due diligence. We also consider geopolitical factors when assessing the risks of financial crime in relation to specific countries or sectors. Unacceptable risks lead to the rejection of the prospective client or third party in question or, in the case of an existing client, to an exit.
In Q4 2018 we announced the accelerated execution of our CDD remediation programmes at Commercial Banking and ICS (Retail Banking). The Dutch central bank (DNB) determined that we are to review all our retail clients in the Netherlands. Consequently, we announced in Q2 2019 that we will undertake further measures and extend our CDD remediation programme, for which we made a cumulative EUR 259 million provision as at 31 December 2019. Our activities to strengthen the DFC foundation and remediate gaps have been reviewed by an independent expert and the plan has been shared with the regulator. At present, more than 2,000 employees are fully dedicated to DFC, and this number will increase substantially over the next few years. We take all remedial actions necessary to ensure full compliance with legislation, while we remain fully committed to complying with all current and future anti-money laundering and terrorist financing legislation and making the required investments.
Organisational and employee integrityAll of our staff members undergo pre-employment screening, and integrity-sensitive positions require additional screening. All staff members also participate in mandatory training aimed at learning how to recognise signs of financial crime, including ‘red flags’ of money laundering, bribery, fraud, corruption and conflicts of interest. We have in place policies under which employees are required to report all actual or suspected incidents, irregularities or breaches relating to bribery or corruption immediately. We encourage employees to speak up if they know of risks or behaviour that are not in line with ABN AMRO’s purpose, culture principles and strategy, and where possible, to first discuss such suspicions with their manager. If this is undesirable for any reason, they should report their suspicions through the bank’s whistleblowing channels, which are also open to external parties.
Combating bribery and corruptionCorruption undermines fair and competitive business, restricts international trade, reduces investor confidence, and impacts regional and global economic growth and international stability. In addition to the risks posed to the financial system, ABN AMRO itself can also face reputational and financial risks from potentially becoming directly exposed to or being abused for corrupt practices. We take these risks seriously and take mitigating measures aimed at limiting them.
In accordance with regulatory requirements, we monitor the risks of money laundering, terrorism financing, bribery and corruption in our organisation so as to maintain a strong control system and to mitigate risks. These risks are assessed as part of our Systematic Integrity Risk Analysis (SIRA), which is based on qualitative and quantitative information and helps us gain insight into the inherent
IntroductionRisk, funding &
capitalLeadership &
governanceAnnual Financial Statem
ents 2019Other
Strategy and performance

ABN AMRO Bank Annual Report 2019
IntroductionRisk, funding &
capitalLeadership structure
GovernanceAnnual Financial Statem
entsOther
IntroductionStrategy and perform
anceRisk, funding &
capitalLeadership &
governanceAnnual Financial Statem
ents 2019Other
20Strategy and performance / Bank performance / Non-financial review
Strategy and performance
and residual risks we face as well as operate within the risk appetite. In addition to the SIRA, ABN AMRO continually strives to obtain data-driven insight into integrity risks.
It is our corporate social responsibility to conduct business with integrity and without any form of bribery or corruption. More information about ABN AMRO’s stance on corruption can be found in our anti-bribery and corruption policy, a key compliance document that is available on our website.
Resilience to security threatsABN AMRO’s information infrastructures connect the bank’s networks to public networks. As a result, banking processes and their supporting information systems are inherently vulnerable, threatening the security and availability of client data and services. We have established a structured information security framework to ensure the confidentiality, integrity and availability of information and its associated assets at all times. This framework defines the organisational structure, management and staff responsibilities, and sets out security directives applying to the bank, its vendors and third parties. The Corporate Information Security Office (CISO) strives to ensure the security of the bank, our clients and society by, among other things, systematically monitoring client transactions in order to detect fraudulent transactions. Security & Integrity Management (SIM) monitors and reports the number of incidents detected and the trends related to fraud, information security and compliance breaches, while also monitoring losses suffered by the bank’s clients and the bank itself.
In addition, different departments in ABN AMRO work together closely in virtual teams to manage and prevent the risk of fraud, financial crime and unethical behaviour. For instance, in 2019 a programme was launched to detect and follow-up on unauthorised access to clients’ accounts by staff in order to prevent abuse of client data or violations of privacy. Furthermore, the bank faces a constant threat of cybercrime. As part of its security programme, the bank continuously monitors cybercrime threats and adapts the bank’s defences wherever necessary. To minimise the impact of cyber-attacks on clients and employees, we filed several police reports and actively shared information with the police and other banks through our ongoing partnership with the Electronic Crimes Task Force (ECTF), which collects intelligence on cyber-enabled fraud and supports ongoing police investigations. In 2019, there was a sharp rise in both the frequency and magnitude of raids against our ATMs, with the use of heavier explosives by perpetrators significantly increasing risks for local residents. This forced us to temporarily close down 380 cash dispensers and 90 Geldmaat ATMs in Q4, pending the development of new counter-measures in collaboration with public and private partners.
The bank is keen to raise awareness among clients and employees on how to recognise and prevent financial crime. Through several public-private partnerships, we also collaborate with other banks, the Financial Intelligence Unit, the Fiscal Intelligence and Investigation Service (FIOD) and the Dutch police to counter different forms of crime, including organised crime, terrorist financing and cybercrime. In 2019, ABN AMRO took the initiative to bring these parties together to jointly set up the Serious Crimes Taskforce (SCTF), which focuses on collectively processing intelligence about professional money launderers and criminal enablers.
Our employeesTo live up to our purpose and achieve our strategic goals, we need to have the right talent on board and be able to unleash the potential of our employees. We therefore continuously invest in: 1) a future-fit workforce, 2) the employee experience, 3) transformation and leadership development and 4) diversity and inclusion.
Future-fit workforceThe nature of work is changing rapidly and on a large scale. While presenting opportunities, change also creates risks. New jobs arise, existing ones disappear and others cannot yet even be conceived. So we regularly assess what critical skills we need, now and in the future, such as data and digital skills, learning agility, risk and compliance awareness, and design thinking and service design skills. We then identify skill gaps in our workforce and invest in what is necessary to close these gaps.
Talent developmentWe continuously invest in our people through coaching, on-the-job learning, formal training (classroom and e-learning) and mandatory training. We enable our people to develop their knowledge and skills, supporting them in securing long-term employability and in contributing to the execution of our strategy. We develop our people’s sustainability skills at our CIRCL Academy and through our Personalised Academy Platform. Having sustainability skills means being aware of the future social, economic and environmental impact of decisions we make today. It also means being able to integrate sustainability into business strategies dynamically and effectively by introducing innovative applications and turning sustainability into a business asset. Employees are supported in their personal and professional development by continuous dialogues with their team and their coach or manager, through our modern performance management process called Together & Better. We measure how much our people appreciate the bank’s talent and development opportunities in our annual Employee Engagement Survey (EES). Overall satisfaction with talent and development stood at 79% in 2019.

ABN AMRO Bank Annual Report 2019
21Strategy and performance / Bank performance / Non-financial review
Talent attraction If we cannot develop critical skills within the organisation, we attract people who have these skills. To be an employer of choice, we need to attract talent by way of effective recruitment strategies and engaging onboarding processes. We hired approximately 1,800 talented new employees in 2019. We were able to do this thanks to relevant employer branding, such as sponsorship of The Next Web (Europe’s biggest tech platform), digital branding campaigns and several data and commercial talent programmes. We also reduced the lead time in our recruitment and onboarding processes by 20%, enhancing productivity, the employee experience and ambassadorship.
Employee experienceOur people are our most valuable asset. We need engaged employees in order to give our clients the best possible service and to ensure we achieve our strategic ambition. Our Global EES, conducted in September, had a 74% employee participation rate. Our Engagement Index remains stable, at 80, which is on target. The Employee Promoter Score is part of the EES and measures the employee experience. We strive to offer our people the best employee experience in order to be an employer of choice, now and in the future. This score increased from 68 in 2018 to 72 in 2019, indicating that more employees perceived themselves as brand ambassadors for ABN AMRO as an employer.
Transformation and leadership developmentIn 2019 we focused on engaging our entire workforce in pursuing our purpose and implementing our strategy. Winning the hearts and minds of our people was a key component of our engagement strategy, and we had great results: 92% of our employees who filled in the survey are positive about ABN AMRO’s purpose and strategy.
We believe that creating the right culture and leadership is crucial to achieving our goal of accelerating the sustainability shift. To support this, we launched a wide array of interventions in 2019. We enriched our culture principles with behavioural guidelines and organised Leadership Get-togethers, Leadership Conversations, permanent education and the Accelerators’ Summit. All of these initiatives are geared to cultivating the right leadership culture and mobilising our leaders to accelerate our strategy.
The Leading for Better Leadership Programme is one of our large-scale interventions that promotes cross-business collaboration, leadership awareness and skills, and accelerates our strategy execution by addressing real business challenges. The programme is divided into eight groups of 50 leaders each, and the first group started in December 2019. We developed this programme in partnership with VU, BTS and Headspring/Financial Times.
In addition, we professionalised our succession management process, ensuring we put the right person in the right position and have enough talented people in house to ensure business continuity.
Diversity and inclusionA diverse and inclusive workforce is of paramount importance to ABN AMRO. It allows employees to perform at their best and yields winning ideas and initiatives. At the same time, it places us at the heart of society. We have been striving to become a diverse and inclusive organisation for many years. Among the various diversity initiatives we pursued in 2019 were external and internal mentoring programmes for women and for employees with a bicultural background, such as the Career Sponsoring Programme and the Future Proof Programme. We specifically aim to build up the pipeline of candidates for senior management positions.
To show our support for the LGBTI+ community, we launched two large inclusion campaigns during Pride Week in Amsterdam and Rotterdam, for which we received the ‘Best Media Representation’ Leadership Award from Workplace Pride. In October, over 1,000 employees participated in Diversity Week, which offered four days full of workshops and lectures on various aspects of diversity and inclusion.
To date, our efforts have resulted in the bank employing a total of 93 disabled individuals, well above our 2020 target. We are behind on our 2020 gender targets, with women holding 28.3% of senior management positions (target: 30%) and 27% of upper middle-management positions (target: 35%). The same goes for our cultural targets, with 3.4% for senior management positions (target: 6%) and 5.9% for upper-middle management positions (target: 7%). In the coming year we will further intensify our efforts to improve on these targets, for example through a dedicated sourcer for diverse talent and inclusively voiced job advertisements. Our efforts so far have been recognised: we received the Chamber’s ‘Outstanding Company for Furthering Diversity and Inclusion’ Award. Our EES showed that 86% of our employees who filled in the survey experience the environment at work as inclusive, a 2 percentage point increase on 2018.
Human rightsFor ABN AMRO, respecting human rights is part of responsible business practice. Through our products and services, we directly or indirectly have an impact on the lives of millions of people. We recognise that in each of our roles, as a provider of investment services but also as an employer, lender and service provider, human rights are at risk and we should actively perform human rights due diligence. Our Human Rights Statement is based on international guidelines and conventions, including the OECD guidelines and the UN Guiding Principles on
IntroductionRisk, funding &
capitalLeadership &
governanceAnnual Financial Statem
ents 2019Other
Strategy and performance

ABN AMRO Bank Annual Report 2019
IntroductionRisk, funding &
capitalLeadership structure
GovernanceAnnual Financial Statem
entsOther
IntroductionStrategy and perform
anceRisk, funding &
capitalLeadership &
governanceAnnual Financial Statem
ents 2019Other
22Strategy and performance / Bank performance / Non-financial review
Strategy and performance
Business and Human Rights. The statement applies to all of the bank’s business activities and business relationships. Our salient human rights issues are discrimination, privacy, labour rights and land-related human rights.
Our main proceedings in 2019In June 2019 we devoted specific attention to human rights defenders, who are increasingly being threatened while their civic freedoms are declining. In collaboration with a host of companies, NGOs, government representatives, academics and frontline human rights defenders, we discussed how the business community can help improve the situation. We also continued organising human rights training sessions for employees, to better embed their understanding of human rights risks and our potential leverage, and thus prevent or mitigate these risks. We prolonged our public-private cooperation with the Inspectorate of the Dutch Ministry of Social Affairs and Employment (SZW) and the University of Amsterdam in order to proactively detect labour exploitation and signs of human trafficking using knowledge-sharing, data analysis, open-source research and transaction analysis. This in turn led to the invitation to join the Financial Sector Commission on Modern Slavery and Human Trafficking. ABN AMRO’s Chief Risk Officer Tanja Cuppen became a member of this commission in order to share the experiences we gained from our research over the past few years.
Responsible tax Tax is an integral part of our sustainability agenda; it is our corporate social responsibility to pay our share of taxes. We communicate about our tax policy transparently and publish our tax principles on our website. Our tax principles illustrate how we fulfil our social responsibility in this area. Our tax policy is based on these principles and provides guidance on what we believe is responsible tax behaviour for ABN AMRO, both regarding our own affairs and in our dealings with clients. Our tax policy has been approved by the ExCo, and tax and tax risk management are discussed in the Audit Committee.
Actions to improve tax control in 2019In 2019, we implemented further measures to enhance our tax risk management. Tax is part of our risk management cycle. Tax evasion and tax integrity (including tax avoidance and aggresive tax planning) are both part of our SIRA, which supports our risk-based approach to all integrity risks, including tax risks. Tax was a risk theme in 2018 and 2019 and will continue to be so in 2020. By making tax a Risk and Control Self-Assessment (RCSA) theme, the internal risk organisation is required to discuss possible relevant tax risks as part of the RCSA process. Tax risks are assessed in conjunction with the businesses where these risks arise, and any key tax risks identified are monitored and relevant controls are tested.
Client tax integrity riskOur client acceptance and review procedures include a review of possible tax evasion – which is never acceptable – as well as a review of clients from a tax integrity perspective. In 2019, DNB published a document on good practices for customer tax integrity risk management. We are in the process of analysing whether we need to modify our client acceptance and review procedures in view of these good practices. In 2020, we will finalise this analysis and implement any modifications needed. Group Tax helps relationship managers assess clients’ tax positions and define appropriate actions. We consult and discuss tax integrity with relevant clients. In addition to the tax awareness sessions that Group Tax arranged for client-facing staff in 2019, we have also included questions on tax in our standard staff training programmes.
As we wish to steer clear of aggressive tax planning and tax avoidance, we want to offer products that comply with the intention and spirit of the law and that are commercially rather than tax-driven. This approach is also reflected in our tax principles and tax policy, and embedded in our product approval process.
Tax transparency Our tax principles and tax policy, as well as our aim to be a good corporate citizen, support our objective to pay our share of taxes. We report taxable income in each country we operate in, and in line with the value created in that specific country. We also file a country-by-country report to the Dutch tax authorities. The country-by-country report in Note 10 of the Consolidated Annual Financial Statements shows our revenue and tax expenses for each country. We met our legal obligation under various regulations to report information on our clients to the tax authorities in 2019 (local reporting, Common Reporting Standards & Foreign Account Tax Compliance Act).
We are implementing requirements to comply with domestic rules enacted in various European countries under the EU Directive on Mandatory Disclosure Rules (DAC6). The requirements relate to transactions which may fall within certain hallmarks indicating involvement in aggressive tax planning, entered into by ABN AMRO itself or its clients.
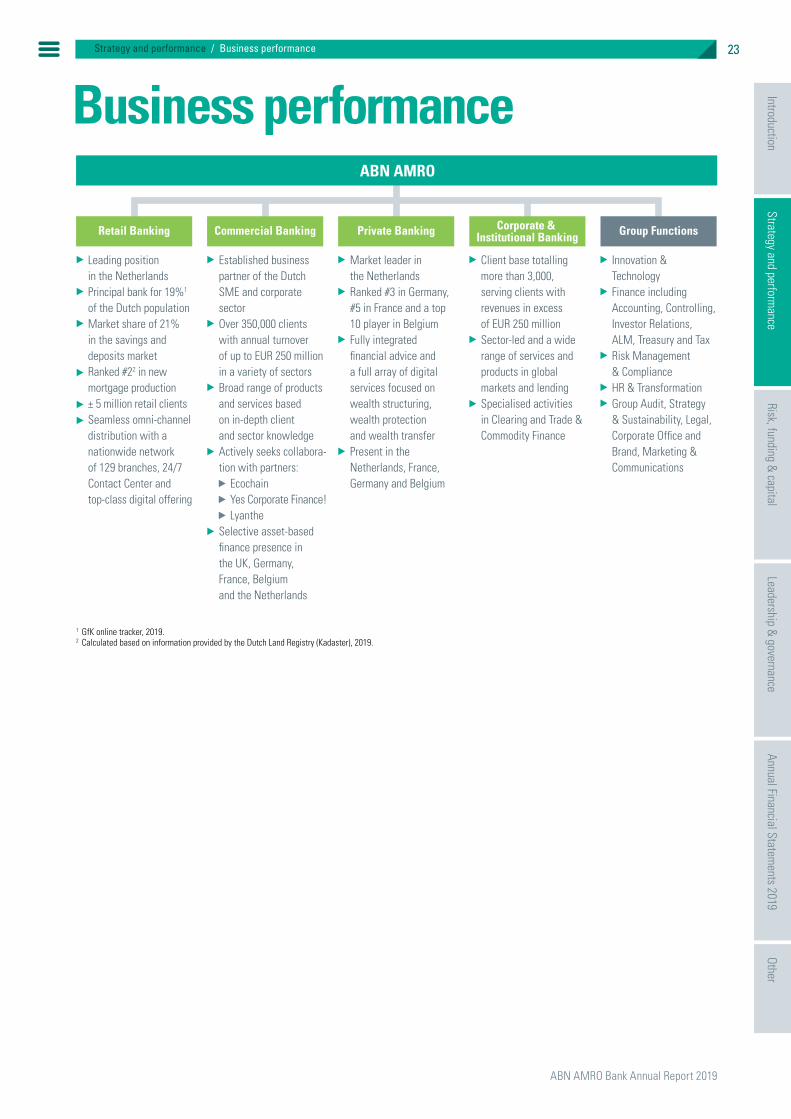
ABN AMRO Bank Annual Report 2019
23Strategy and performance / Business performance
Business performanceABN AMRO
Leading position in the NetherlandsPrincipal bank for 19%1 of the Dutch populationMarket share of 21% in the savings and deposits marketRanked #22 in new mortgage production± 5 million retail clientsSeamless omni-channeldistribution with a nationwide network of 129 branches, 24/7 Contact Center and top-class digital offering
Innovation & TechnologyFinance including Accounting, Controlling, Investor Relations, ALM, Treasury and TaxRisk Management & ComplianceHR & TransformationGroup Audit, Strategy & Sustainability, Legal, Corporate Office and Brand, Marketing & Communications
Corporate & Institutional Banking Group FunctionsRetail Banking
Market leader in the NetherlandsRanked #3 in Germany, #5 in France and a top 10 player in BelgiumFully integrated financial advice and a full array of digital services focused on wealth structuring, wealth protection and wealth transferPresent in the Netherlands, France, Germany and Belgium
Private Banking
Client base totalling more than 3,000, serving clients with revenues in excess of EUR 250 millionSector-led and a wide range of services and products in global markets and lending Specialised activities in Clearing and Trade & Commodity Finance
Established business partner of the Dutch SME and corporate sectorOver 350,000 clients with annual turnover of up to EUR 250 million in a variety of sectorsBroad range of products and services basedon in-depth client and sector knowledgeActively seeks collabora- tion with partners:- Ecochain- Yes Corporate Finance!- LyantheSelective asset-based finance presence in the UK, Germany, France, Belgium and the Netherlands
Commercial Banking
1 GfK online tracker, 2019. 2 Calculated based on information provided by the Dutch Land Registry (Kadaster), 2019.
IntroductionRisk, funding &
capitalLeadership &
governanceAnnual Financial Statem
ents 2019Other
Strategy and performance
Business performance

ABN AMRO Bank Annual Report 2019
IntroductionRisk, funding &
capitalLeadership structure
GovernanceAnnual Financial Statem
entsOther
IntroductionStrategy and perform
anceRisk, funding &
capitalLeadership &
governanceAnnual Financial Statem
ents 2019Other
24Strategy and performance / Business performance / Retail Banking
Strategy and performance
Business descriptionRetail Banking provides a full range of transparent banking products and high-quality services to individuals with investable assets up to EUR 500,000. We offer our products and services under the ABN AMRO brand, as well as specific products and services under different labels. Our clients have access to a seamless omni-channel distribution network providing a top-class digital offering, a network of 129 branches and our 24/7 Contact Centre.
Retail Banking has a strong and recognised market position in the Netherlands. In 2019, we maintained our number three primary bank position for retail clients (19% of the Dutch population1). ABN AMRO captured a number two market position in new mortgage production in 2019, with a combined market share of all ABN AMRO brands in the Dutch mortgage market totalling 18%.
Business developmentsIntroductionThese are turbulent times for the banking sector, as a result of which Retail Banking is operating in a challenging context. The ongoing low interest rate environment impacts Retail Banking’s traditional earnings model and has resulted in low savings rates for ABN AMRO’s clients. ABN AMRO wants to dispel concerns regarding potential negative interest as much as possible. We have therefore decided not to charge the majority of our clients holding deposits below EUR 100,000 negative rates in the coming years. Moreover, given the current conditions we do not see enough opportunity to grow our savings portfolio and generate sufficient scale in Belgium, which is why we decided to sell our Moneyou Belgium savings portfolio (portfolio size EUR 2.0 billion to Keytrade Bank).
In 2019, the Dutch central bank (DNB) determined that we are to review all our retail clients in the Netherlands, so we undertook further measures and extended our CDD remediation programme. In addition, we are expected to play a forefront role in detecting financial crime, and fulfill duty of care obligations to our customers. As a consequence, compliance is becoming a more important part of our customer proposition and approach.
ABN AMRO has temporarily shut down 380 of its own ATMs and 90 Geldmaat ATMs. This emergency measure was needed in view of the growing number of violent ATM explosive attacks. All cash has been removed from the machines. At another 400 locations, ABN AMRO has different types of cash dispensers, which will remain open for use.
Support our clients’ transition to sustainabilitySustainability is at the heart of our strategy and purpose. Our mortgage portfolio totals around EUR 148.2 billion, enabling us and our clients to make a valuable contribution to reducing carbon emissions. At present, the overall portfolio covers 14% of homes with an energy-efficiency label A in the Netherlands.
In 2019, we renovated and refurbished one of our branch offices in Eindhoven, resulting in a sustainable and circular building. By employing this new building concept, we are addressing the issue of scarcity of resources while reducing carbon emissions.
We introduced a mortgage for sustainable living in 2019 that enables clients to invest in energy-saving measures on favourable terms and at lower interest rates. In addition, through a partnership with Energiebespaarders, we help homeowners to make their homes more energy-efficient. And our subsidiary Green Loans is helping clients to invest in home improvement measures that will generate or save energy; and therefore Green Loan’s outstanding loans have increased fivefold.
ABN AMRO also aspires to have more social impact. We introduced the Home Equity Mortgage (Overwaarde Hypotheek), which lets homeowners who have reached their Dutch state pension age cash out their equity without being forced to sell their homes.
We also take responsibility by helping to improve financial autonomy among senior citizens. ABN AMRO has partnered with senior citizen organisation ANBO, the Dutch Ministry of Justice and Google, among other parties, to organise an online safety event. ABN AMRO employees help senior citizens to recognise phishing and teach them how to bank online safely and to secure their devices.
Reinvent the customer experienceAs clients’ expectations and behaviour change, we continue to focus on digital and innovative developments that improve the customer experience. The development of the Net Promoter Score (NPS) stabilised at a score of -10 in 2019 (2018: -9). The overall NPS was affected by the negative impact of the social debate regarding the banking sector and negative media coverage about compliance issues. Our clients are positive about remote and digital channels that are driving our shift to digital. Video banking covered 51% of consultations with our advisors, 43% of our clients who used remote video banking rated their experience 9+ on a ten-point scale. Mobile Banking is also highly valued, with 46% of our mobile banking users rating their experience 9+.
Retail Banking
1 GfK online tracker, 2019.

ABN AMRO Bank Annual Report 2019
25Strategy and performance / Business performance / Retail Banking
ABN AMRO launched contactless payment through wearables for all of its retail clients in 2019. We are the first bank in the world to offer wearables that let our users pay higher amounts at a point-of-sale by using a PIN. We also offer our clients Apple Pay, which is transforming payments with an easy, secure and private way to pay. To provide our multi-bank clients with a better picture of their finances, we enable them to access accounts at other banks through our Mobile Banking app and Internet Banking. We also offer multi-bank functionality in the Grip app, which automatically arranges income and expenses into categories, making it easier for clients to stay on top of their personal finances.
Alongside improvements in the area of payments and everyday finance, we improved other products as well. ABN AMRO landed the Golden Lotus Award for the Mortgage Market for being the best mortgage provider in the Netherlands in 2019. The expertise of our mortgage business staff and our flexible approach to customised solutions for entrepreneurs and other specific target groups were mentioned as important factors. We also introduced Kendu, an app offering asset management services for investments starting at EUR 50.
The bank’s duty of care is an important driver for reinventing the customer experience. We have dedicated teams that proactively reach out to clients with interest-only mortgages. Our approach meets regulatory expectations.
Build a future-proof bankWe continue to focus on digitalisation, rationalisation and partnering to build a future-proof bank. As an important step towards a more future-proof way of fighting money laundering, Dutch banks ABN AMRO, ING, Rabobank, Triodos Bank and Volksbank will explore the possibilities of setting up a joint organisation to monitor payment transactions: Transaction Monitoring Netherlands. In addition, ABN AMRO, ING, Rabobank and Geldmaat
created a bank-independent ATM network, which resulted in the unveiling of the first uniform yellow Geldmaat ATM in 2019.
Retail Banking is on track towards making ALFAM our single credit house for consumer loans, leveraging ABN AMRO’s distribution network and brand value as well as ALFAM’s responsible and efficient processes and products. The first combined product of ABN AMRO and ALFAM (consumer credit) was launched in 2019. We also have dedicated teams in place that take care of locked-in customers within consumer credits. In addition, with effect from 1 January 2020 ABN AMRO has changed terms and conditions for revolving credits in response to clients’ preferences and to tailor the product more closely to today’s needs. In addition, we also made good progress in digitalising our product range and service model by enhancing chatbot Anna and further optimising digital customer journeys. The Employee Engagement Survey produced an overall engagement score of 80%, which is equal to the 2018 score (80%).
Financial reviewFinancial highlights
Å Profit for the period decreased by 23%, mainly due to lower operating income and higher impairments.
Å Net interest income decreased by 7%, primarily due to the impact of a model update for non-maturing deposits and the reallocation of net interest income from Group Functions, accounting for a decline of approximately EUR 135 million in 2019 compared with 2018.
Å Impairment charges in 2019 amounted to EUR 81 million, partly due to model and methodology changes.
Å An additional provision of EUR 122 million was recorded in other expenses for customer due diligence (CDD) remediation programmes regarding retail clients.
Å In 2019 we introduced a mortgage facility for investments in energy efficiency in homes.
IntroductionRisk, funding &
capitalLeadership &
governanceAnnual Financial Statem
ents 2019Other
Strategy and performance

ABN AMRO Bank Annual Report 2019
IntroductionRisk, funding &
capitalLeadership structure
GovernanceAnnual Financial Statem
entsOther
IntroductionStrategy and perform
anceRisk, funding &
capitalLeadership &
governanceAnnual Financial Statem
ents 2019Other
26Strategy and performance / Business performance / Retail Banking
Strategy and performance
Operating results
(in millions) 2019 2018 Change
Net interest income 2,903 3,122 -7%
Net fee and commission income 365 365
Other operating income 57 31 85%
Operating income 3,324 3,517 -5%Personnel expenses 411 442 -7%
Other expenses 1,667 1,586 5%
Operating expenses 2,078 2,028 2%
Operating result 1,246 1,489 -16%Impairment charges on financial instruments 81 -12
Profit/(loss) before taxation 1,165 1,501 -22%Income tax expense 299 375 -20%
Profit/(loss) for the period 866 1,126 -23%
Cost/income ratio 62.5% 57.7%
Cost of risk (in bps)1 5 -1
Other indicatorsLoans and advances customers (end of period, in billions) 152.4 154.5
-of which Client loans (end of period, in billions)2 152.8 154.8
Due to customers (end of period, in billions) 90.4 93.5
Risk-weighted assets (end of period, in billions) 28.4 27.6
Employee FTEs (end of period) 4,340 4,445
Total Client Assets (end of period, in billions) 101.3 103.5
- of which Cash 90.4 93.5
- of which Securities 11.0 10.1
1 Annualised impairment charges on loans and advances customers for the period divided by the average loans and advances customers (excluding at fair value through P&L) on the basis of gross carrying amount and excluding the fair value adjustments from hedge accounting.
2 Gross carrying amount excluding fair value adjustment from hedge accounting.
Retail Banking’s net profit decreased by 23% to EUR 866 million (2018: EUR 1,126 million), driven by lower operating income, slightly higher operating expenses and higher impairments compared with 2018.
Net interest income decreased by 7% to EUR 2,903 million (2018: EUR 3,122 million). The decrease was primarily attributable to the impact of a model update for non-maturing deposits and the reallocation of net interest income from Group Functions of approximately EUR 135 million negative in 2019 compared to 2018. Interest income on mortgages decreased modestly due to the competitive environment, while consumer loan volumes declined year-on-year. Deposit income continued to be impacted by ongoing margin pressure. New production of mortgages in 2019 was higher than in the previous year - our market share in new production grew to 18% in 2019 (2018: 17%).
Net fee and commission income remained stable compared with 2018, totalling EUR 365 million in 2019.
Other operating income increased by EUR 26 million to EUR 57 million (2018: EUR 31 million), partly due to the sale of Moneyou Belgium portfolio.
Personnel expenses decreased by 31 million in 2019 to EUR 411 million (2018: EUR 442 million). This was mainly due to a decline in FTE levels resulting from transfers to Group Functions (to further optimise and centralise
support functions) and also reflected a further reduction in the number of branches.
Other expenses increased by EUR 81 million in 2019 to EUR 1,667 million (2018: EUR 1,586 million), mainly due to the provisions recorded for customer due diligence (CDD) remediation programmes. During 2019, the total amount of CDD provisions in Retail Banking was EUR 122 million (2018: EUR 30 million), including EUR 114 million for retail clients in Q2 and an additional EUR 8 million for ICS in Q4. The increase was also due to higher regulatory levies in 2019 (EUR 183 million, compared with EUR 169 million in 2018).
The operating result decreased by 16%. The cost/income ratio increased to 62.5% in 2019 (2018: 57.7%).
Impairment charges amounted to EUR 81 million in 2019, compared with a release of EUR 12 million in 2018. Impairment charges in 2019 were impacted by model and methodology changes.
Other indicatorsLoans and advances customers decreased by EUR 2.1 billion to EUR 152.4 billion (2018: EUR 154.5 billion), driven by modestly lower residential mortgage volumes in 2019.
Total client assets decreased by EUR 2.2 billion to EUR 101.3 billion (2018: EUR 103.5 billion), mainly due to the sale of the Moneyou Belgium portfolio.

ABN AMRO Bank Annual Report 2019
27Strategy and performance / Business performance / Commercial Banking
Business descriptionCommercial Banking is an established business partner of the Dutch SME and corporate sector, with a selective asset-based finance presence in the UK, Germany, France, Belgium and the Netherlands. We serve over 350,000 clients with annual turnover of up to EUR 250 million in a variety of sectors. Commercial Banking offers a broad range of products and services, based on in-depth client and sector knowledge combined with innovation and digitalisation.
Business developmentsIntroductionCommercial Banking is fully aligned with the bank-wide strategy. We have tailored the strategy to our own specific business in line with ABN AMRO’s three strategic pillars: Support our clients’ transition to sustainability, Reinvent the customer experience and Build a future-proof bank.
We aim to be a valuable strategic partner for clients through our sector focus, and to build strong and personal client relationships. We offer our clients a wide range of innovative digital services designed to meet their needs. We also focus strongly on complying with regulatory obligations and detecting financial crime as part of our effort to build a robust and stable Commercial Banking business.
Support our clients’ transition to sustainabilityWe want to help our clients accelerate their shift to sustainability. We do this by offering new sustainable products, services and business models, embedding sustainability into our existing products and services, engaging in sustainable deals and partnerships, and educating our employees about this topic.
Commercial Banking has engaged in a strategic partnership with Ecochain and launched ABN AMRO Impact Based Banking, a proposition that helps entrepreneurs gain insight into their company’s environmental footprint.
We supported our clients’ sustainability shift by closing several sustainable and social impact deals. Examples of these deals are:
Å Financing Industrial Park Kleefse Waard, an innovative and sustainable industrial park. ABN AMRO is helping them become the most sustainable industrial park in the Netherlands in 2025.
Å Helping Saltrex (a platform where supply and demand of secondary distressed raw materials come together) develop a new additional platform which offers a solution for recycling raw materials that cannot be traded on their current platform.
Å Financing Villa de Gave, a family home that offers 8 children a safe environment to grow up.
In 2019, Groenbank worked with Asset Based Financed (ABF) to launch ‘Groenlease’, a joint effort to provide business lease constructions for sustainable products that fall within the Green Regulations of the Dutch government. Furthermore, we implemented CASY (Client Assessment on Sustainability), a tool that enables us to have strategic conversations with clients about their (potential) sustainability risks and possibilities to shift to a more sustainable business.
In May 2019, we organised the Commercial Banking Sustainability Learning Week in order to engage and educate our employees about sustainability. During this event, employees learned how to engage clients when it comes to sustainability, discovered what various sectors are doing on the sustainability front and gained insight into sustainable business models.
Reinvent the customer experienceWe want to deliver the best customer experience by continuously improving our products and services. We use the drivers of our Net Promoter Score and engage with our clients to better understand their wishes and challenges and support them where needed. In 2019, our Net Promoter Score improved to 1 (2018: -2).
We are striving to reinvent the customer experience by rethinking our portfolio of products and services while actively seeking partnerships that add value and that will help make our offering and processes more innovative. One example is the strategic partnership that ABN AMRO forged with Yes Corporate Finance!, which advises SMEs on selling their company. We also started a pilot to offer a one-stop-shop cyber security service via an external partner that provides fully fledged cyber security for SME entrepreneurs. This pilot focuses on sectors where the threat of cyber attacks is expected to play an increasingly important role.
Commercial Banking started to roll out video banking to offer our clients a better, more flexible and sustainable experience in their conversations with our staff. Over 30% of all SME client conversations are already being held via video banking.
Build a future-proof bankCommercial Banking has further improved its operational efficiency by investing in simple client solutions and optimising processes and documentation. For example, Client Services realised the digitalisation of 7 high volume client processes that enable self-service for our clients. Commercial Banking is taking steps to future-proof its business model, which helps us to remain relevant and enable us to work faster, simpler and more effectively
Commercial Banking
IntroductionRisk, funding &
capitalLeadership &
governanceAnnual Financial Statem
ents 2019Other
Strategy and performance

ABN AMRO Bank Annual Report 2019
IntroductionRisk, funding &
capitalLeadership structure
GovernanceAnnual Financial Statem
entsOther
IntroductionStrategy and perform
anceRisk, funding &
capitalLeadership &
governanceAnnual Financial Statem
ents 2019Other
28Strategy and performance / Business performance / Commercial Banking
Strategy and performance
and help us to improve the customer experience. In order to do this, four priorities are identified that form the foundation in becoming a future-proof bank:
1. New Client Take On (NCTO): optimising new client onboarding process.
2. Know Your Client (KYC): bringing and keeping client files in order.
3. Credits: optimising and digitising the credit process. 4. Product Rationalisation: reducing and smartly
redesigning the product offering.
We have made progress on all four priorities. For example: Å We are working on a fully Straight Through Processing (STP) onboarding flow and make good progress.
Å We invested heavily in detecting financial crime (DFC), accelerating the remediation of client files and scaling up the capacity of the Know Your Client (KYC) Centre.
Å Multiple products have been rationalised without affecting clients.
Å SME loan applications for up to EUR 250,000 are originated by New10 (ABN AMRO’s wholly-owned subsidiary which provides Dutch SMEs with loans with a fully digital and flawless customer experience).
Financial reviewFinancial highlights
Å Net interest income decreased by 5% and was impacted primarily by a model update for non-maturing deposits, the reallocation of net interest income from Group Functions of approximately EUR 50 million negative in 2019 compared to 2018 and continued deposit margin pressure. Client lending continued to grow slightly in 2019.
Å FTE transfers to Group Functions to further optimise and centralise support functions resulted in lower personnel expenses and slightly higher other expenses (due to higher cost allocations).
Å Throughout 2019, provisions totalling EUR 52 million were recorded for customer due diligence (CDD) remediation programmes (2018: EUR 55 million).
Å Impairments decreased by EUR 71 million, to EUR 182 million in 2019 spread across various sectors (2018: EUR 253 million).
Å Ongoing redesign of the SME lending proposition, based on New10 technology.
Operating results
(in millions) 2019 2018 Change
Net interest income 1,523 1,602 -5%
Net fee and commission income 256 258 -1%
Other operating income 27 39 -30%
Operating income 1,807 1,899 -5%Personnel expenses 281 335 -16%
Other expenses 737 711 4%
Operating expenses 1,018 1,046 -3%
Operating result 789 853 -8%Impairment charges on financial instruments 182 253 -28%
Profit/(loss) before taxation 606 600 1%Income tax expense 154 153 1%
Profit/(loss) for the period 453 448 1%Cost/income ratio 56.3% 55.1%
Cost of risk (in bps)1 42 60
Other indicatorsLoans and advances customers (end of period, in billions) 41.8 41.6
-of which Client loans (end of period, in billions)2 42.6 42.3
Due to customers (end of period, in billions) 46.3 45.0
Risk-weighted assets (end of period, in billions) 29.2 27.3
Employee FTEs (end of period) 2,470 2,734
1 Annualised impairment charges on loans and advances customers for the period divided by the average loans and advances customers (excluding at fair value through P&L) on the basis of gross carrying amount and excluding the fair value adjustments from hedge accounting.
2 Gross carrying amount excluding fair value adjustment from hedge accounting.

ABN AMRO Bank Annual Report 2019
29Strategy and performance / Business performance / Commercial Banking
Commercial Banking’s net profit grew 1% to EUR 453 million (2018: EUR 448 million) due to lower operating expenses and impairment charges.
Net interest income decreased by 5% to EUR 1,523 million (2018: EUR 1,602 million). The decrease was mainly attributable to the model update for non-maturing deposits, the reallocation of net interest income from Group Functions of approximately EUR 50 million negative in 2019 compared to 2018 and continued deposit margin pressure. Client lending continued to grow slightly in 2019.
Other operating income in 2019 decreased by EUR 12 million to EUR 27 million (2018: EUR 39 million) as the figure in 2018 benefited from more favourable revaluation results.
Personnel expenses decreased by EUR 54 million in 2019 to EUR 281 million (2018: EUR 335 million). The decrease was a result of FTE transfers to Group Functions (to further optimise and centralise support functions).
Other expenses increased by EUR 26 million to EUR 737 million (2018: EUR 711 million), mainly due to higher cost allocations from Group Functions resulting from FTE transfers to further optimise and centralise support functions. The increase was also attributable to higher regulatory levies in 2019 (EUR 55 million, compared with EUR 48 million in 2018). The provisions recorded for customer due diligence (CDD) remediation programmes were mostly the same as last year (EUR 52 million in 2019 versus EUR 55 million in 2018).
The operating result decreased by 8%, while the cost/income ratio increased to 56.3% (2018: 55.1%).
Impairments decreased by EUR 71 million, to EUR 182 million in 2019 spread across various sectors (2018: EUR 253 million). In 2018, high impairments were recorded mainly for industrial goods and services, healthcare and the shipping industry.
Other indicatorsTotal client loans increased modestly by EUR 0.3 billion to EUR 42.6 billion (2018: EUR 42.3 billion) on the back of the continued strength of the Dutch economy.
IntroductionRisk, funding &
capitalLeadership &
governanceAnnual Financial Statem
ents 2019Other
Strategy and performance

ABN AMRO Bank Annual Report 2019
IntroductionRisk, funding &
capitalLeadership structure
GovernanceAnnual Financial Statem
entsOther
IntroductionStrategy and perform
anceRisk, funding &
capitalLeadership &
governanceAnnual Financial Statem
ents 2019Other
30Strategy and performance / Business performance / Private Banking
Strategy and performance
Business descriptionPrivate Banking is a leading private bank in the eurozone in terms of client assets, with dedicated professionals who have in-depth knowledge of their clients. Our international expertise, local knowledge and over 300 years of experience in private banking form the basis of our long-standing client relationships. We are an enterprising private bank aiming to make a social impact. We support and engage our clients by offering expert advice on managing their wealth in a risk-controlled manner, taking into account life and business events.
Private Banking targets high net worth individuals with more than EUR 500,000 in investable assets in the Netherlands or more than EUR 1 million outside the Netherlands, and ultra-high net worth individuals with more than EUR 25 million in investable assets. Private Banking is present in the Netherlands, France, Germany and Belgium.
Business developmentsIntroductionThe wealth management market is changing rapidly, with consolidation being driven by an increasing need for scale. Private Banking is therefore actively pursuing organic and inorganic growth of its onshore Northwest European footprint. The acquisition of Societe Generale Private Banking Belgium announced in 2018 was completed in February and the legal merger with ABN AMRO Belgium was concluded in September 2019. At the same time, our focus on onshore private banking in Northwest Europe prompted us to divest our Guernsey presence. In Q2 2019, we announced the transfer of our activities in the Channel Islands to Butterfield - a logical fit with our strategy and in the best interests of our clients and staff. The transaction was completed in July 2019.
Support our clients’ transition to sustainabilityPrivate Banking plays a pivotal role in ABN AMRO’s ambition to invest private capital sustainably. Clients greatly value our sustainable service offering. This is reflected in the fact that we have already significantly exceeded our ambition to have EUR 16 billion of client assets invested sustainably by 2020: we ended 2019 at EUR 20.6 billion.
To help clients make sustainable choices, we launched a sustainable investment scan in all countries, which gives clients insight into the environmental, social and governance performance of their portfolios. In 2019, the bank introduced a new sustainable structured product in France and the Netherlands. In Germany and Belgium we launched Sustainable Advisory and a Sustainable Funds Mandate. This mandate invests across asset classes in sustainable investment funds.
We will continue to develop our sustainable asset offering, in the firm belief that investing sustainably is rapidly becoming the standard. Looking forward, we are anticipating upcoming changes in the Socially Responsible Investing methodology and the implications of the taxonomy currently being devised by the European Union, taking into account new regulations regarding client suitability and disclosure.
Reinvent the customer experienceIn 2019, we continued to work on delivering products and services that meet our clients’ needs. In Germany, for example, we introduced a private equity product that was well received by clients, while we significantly increased the range of sustainable options across Private Banking. To understand our clients’ needs, we make use of direct closed-loop feedback (meaning we ask clients for feedback on a recent interaction with the bank, which our client service teams then use to make improvements).
Client investment portfolios performed well, with an average return of 15%. Clients value being able to actively engage with their banker and investment manager via video banking – 20% of client meetings in the Netherlands took place via video banking. Further automating and simplifying customer journeys is a continuous process, and we have optimised a number of processes, including client onboarding, digital signing of documents and automatic archiving of documents. Net Promoter Scores (NPS) for 2019 show that clients appreciate our efforts, with NPS increasing significantly to +9 and improved scores in all countries.
We plan to further roll out video banking in France and Germany, and to extend this option to Belgium. We are continually developing products that address clients’ needs, focusing on the low interest environment. Clients expect a one-on-one approach and want to experience a personal fit. In order to achieve this, we need to have advanced data and analytics capabilities in place to support the customer experience. We are continuously adapting our client service model to address this.
Build a future-proof bankIn 2019, we continued to harmonise processes and product offerings across our Private Banking locations. We call this ‘One PB’, and this approach will enable us to further digitise our services and processes, innovate efficiently and improve client service. Part of the One PB approach is to move all countries to one platform (with the exception of the Netherlands, which shares its platform with Retail Banking). The platform went live in Belgium in Q2 2019. Since then, we have been working to upgrade
Private Banking
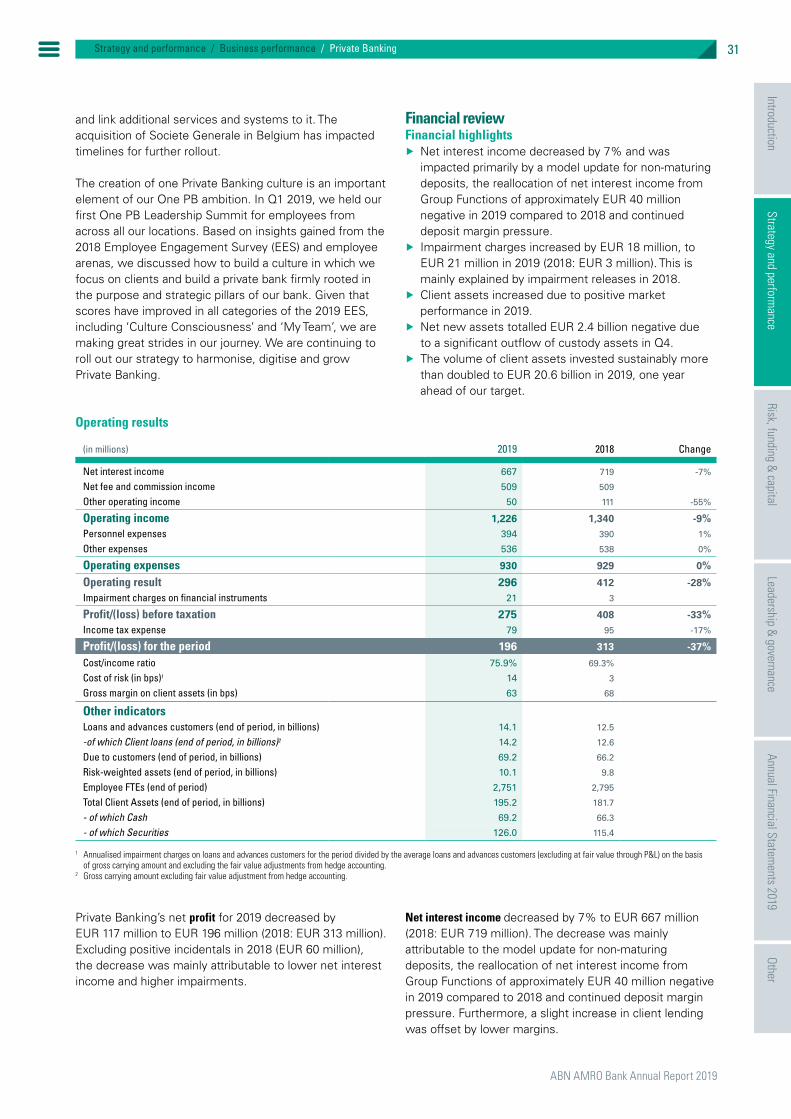
ABN AMRO Bank Annual Report 2019
31Strategy and performance / Business performance / Private Banking
and link additional services and systems to it. The acquisition of Societe Generale in Belgium has impacted timelines for further rollout.
The creation of one Private Banking culture is an important element of our One PB ambition. In Q1 2019, we held our first One PB Leadership Summit for employees from across all our locations. Based on insights gained from the 2018 Employee Engagement Survey (EES) and employee arenas, we discussed how to build a culture in which we focus on clients and build a private bank firmly rooted in the purpose and strategic pillars of our bank. Given that scores have improved in all categories of the 2019 EES, including ‘Culture Consciousness’ and ‘My Team’, we are making great strides in our journey. We are continuing to roll out our strategy to harmonise, digitise and grow Private Banking.
Financial reviewFinancial highlights
Å Net interest income decreased by 7% and was impacted primarily by a model update for non-maturing deposits, the reallocation of net interest income from Group Functions of approximately EUR 40 million negative in 2019 compared to 2018 and continued deposit margin pressure.
Å Impairment charges increased by EUR 18 million, to EUR 21 million in 2019 (2018: EUR 3 million). This is mainly explained by impairment releases in 2018.
Å Client assets increased due to positive market performance in 2019.
Å Net new assets totalled EUR 2.4 billion negative due to a significant outflow of custody assets in Q4.
Å The volume of client assets invested sustainably more than doubled to EUR 20.6 billion in 2019, one year ahead of our target.
Operating results
(in millions) 2019 2018 Change
Net interest income 667 719 -7%
Net fee and commission income 509 509
Other operating income 50 111 -55%
Operating income 1,226 1,340 -9%Personnel expenses 394 390 1%
Other expenses 536 538 0%
Operating expenses 930 929 0%
Operating result 296 412 -28%Impairment charges on financial instruments 21 3
Profit/(loss) before taxation 275 408 -33%Income tax expense 79 95 -17%
Profit/(loss) for the period 196 313 -37%
Cost/income ratio 75.9% 69.3%
Cost of risk (in bps)1 14 3
Gross margin on client assets (in bps) 63 68
Other indicatorsLoans and advances customers (end of period, in billions) 14.1 12.5
-of which Client loans (end of period, in billions)2 14.2 12.6
Due to customers (end of period, in billions) 69.2 66.2
Risk-weighted assets (end of period, in billions) 10.1 9.8
Employee FTEs (end of period) 2,751 2,795
Total Client Assets (end of period, in billions) 195.2 181.7
- of which Cash 69.2 66.3
- of which Securities 126.0 115.4
1 Annualised impairment charges on loans and advances customers for the period divided by the average loans and advances customers (excluding at fair value through P&L) on the basis of gross carrying amount and excluding the fair value adjustments from hedge accounting.
2 Gross carrying amount excluding fair value adjustment from hedge accounting.
Private Banking’s net profit for 2019 decreased by EUR 117 million to EUR 196 million (2018: EUR 313 million). Excluding positive incidentals in 2018 (EUR 60 million), the decrease was mainly attributable to lower net interest income and higher impairments.
Net interest income decreased by 7% to EUR 667 million (2018: EUR 719 million). The decrease was mainly attributable to the model update for non-maturing deposits, the reallocation of net interest income from Group Functions of approximately EUR 40 million negative in 2019 compared to 2018 and continued deposit margin pressure. Furthermore, a slight increase in client lending was offset by lower margins.
IntroductionRisk, funding &
capitalLeadership &
governanceAnnual Financial Statem
ents 2019Other
Strategy and performance

ABN AMRO Bank Annual Report 2019
IntroductionRisk, funding &
capitalLeadership structure
GovernanceAnnual Financial Statem
entsOther
IntroductionStrategy and perform
anceRisk, funding &
capitalLeadership &
governanceAnnual Financial Statem
ents 2019Other
32Strategy and performance / Business performance / Private Banking
Strategy and performance
Net fee and commission income at EUR 509 million was flat compared to 2018. The decrease in fees due to divestments were offset by additional fees from acquisitions.
Other operating income decreased by EUR 61 million to EUR 50 million (2018: EUR 111 million), largely due to positive incidentals in 2018 of EUR 60 million relating to sale proceeds and provision releases from divestments (Private Banking Luxembourg and asset management activities in France).
Personnel expenses increased by EUR 4 million to EUR 394 million (2018: EUR 390 million), mainly due to the restructuring provision for the Private Banking Belgium integration.
Other expenses were broadly stable at EUR 536 million (2018: EUR 538 million). The decrease in general and administration expenses was offset by goodwill impairments in Private Banking Channel Islands and higher cost allocations from Group Functions.
Operating result decreased by 28% year-on-year (including positive incidentals in 2018), with the cost/income ratio rising to 75.9% in 2019 (2018: 69.3%) .
Impairment charges increased by EUR 18 million to EUR 21 million in 2019 (2018: EUR 3 million). This increase is mainly explained by impairment releases in 2018.
Due to customers increased by EUR 3.0 billion to EUR 69.2 billion (2018: EUR 66.2 billion), mainly in the Netherlands.
Client assets
(in billions) 31 December 2019 31 December 2018
Opening balance Client Assets 181.7 200.6Net new assets -2.4 1.8
Market performance 9.9 -11.8
Divestments/acquisitions 6.0 -9.0
Closing Balance Client Assets 195.2 181.7
Breakdown by typeCash 69.2 66.3
Securities 126.0 115.4
- of which Custody 29.9 30.9
Breakdown by geographyThe Netherlands 60% 58%
Rest of Europe 40% 42%
Client assets increased by EUR 13.5 billion to EUR 195.2 billion in 2019 (2018: EUR 181.7 billion) due to an improvement in market performance.
Net new assets totalled EUR 2.4 billion negative due to a significant outflow of custody assets in Q4.

ABN AMRO Bank Annual Report 2019
33Strategy and performance / Business performance / Corporate & Institutional Banking
Business descriptionCorporate & Institutional Banking (CIB) has a client base totalling more than 3,000 clients. We have a strong market position in the Netherlands, serving clients with revenues in excess of EUR 250 million. We are leveraging the Dutch franchise in selected Northwest European countries, where we serve clients in a variety of sectors. Globally we focus on three selected sectors and are present in 14 countries or jurisdictions. CIB is sector-led and offers a wide range of services and products in global markets and lending. We have specialised activities in Clearing and Trade & Commodity Finance.
Business developmentsIntroductionCorporate & Institutional Banking embarked on a strategic journey in 2018, the aim of which is to create a future-proof CIB with a capital-efficient business model, a solid client base and healthy returns. In August 2018, CIB set a financial target of delivering >10% return on equity in 20211. CIB’s strategic journey focuses on three main drivers: 1. Reduce capital usage by EUR 5 billion RWA by 2020; 2. Reduce costs by EUR 80 million through staff reductions and IT rationalisation; 3. Transform into a capital-efficient business model.
CIB’s strategic journey continued in 2019 and is fully aligned with the bank-wide strategy and the bank’s three strategic pillars.
Support our clients’ transition to sustainabilityCIB aims to create long-term value for and with the bank’s clients and other stakeholders. We want to contribute to the transition to a sustainable economy that is greenhouse gas (GHG) emission-neutral, respectful of human rights, and that protects our planet’s life, land and water. We support our clients in their transition to more sustainable products and business models, making use of our data, knowledge and expertise. Our objective is to mobilise capital for sustainability, provide sustainability advice and transparency, and create a positive impact.
In 2019 we deployed multiple initiatives that support our sustainable ambition, examples of which include:
Å Closing green deals, e.g. accelerating Australia’s energy’s transition with Ararat Wind Farm, the third wind farm we are financing in Australia. This project is the third largest operational wind farm in the country.
Å Financing a series of six innovative tankers that set new standards for the global tanker industry. The transaction was awarded with the Marine Money’s ‘Green Ship Finance’ deal of the year.
Å Arranging the first green bond for the Dutch State. ABN AMRO has the role of primary dealer for the Dutch State and is the sole green bond structuring advisor for this specific green transaction.
Reinvent the customer experienceCIB’s business model is built on sustainable relationships with multi-product clients. We use the drivers of our Net Promoter Score and continually engage with our clients in order to better understand their wishes and challenges and to support them where needed. Our Net Promoter Score in 2019 was 29. Reinventing the customer experience helps CIB set new product and service standards that are client-focused and data-driven, and raise the bar to continuously improve this experience.
At CIB, reinventing the customer experience consists of three sets of initiatives: 1. Improve the customer journey such as New Client
Take On (NCTO) and the loan application process.2. Innovate through new business models:
We have further expanded our platforms Franx, Banking as a Service (ABN AMRO Clearing Bank) and trade-related blockchain platforms Komgo and Vakt. We embarked on a journey in 2019 to create new value propositions for our clients. Focus is on how we make sure we stay relevant for our clients in the future by looking at opportunities from an ecosystem perspective. Based on this journey, CIB will work on the development of new concepts that go beyond traditional banking products.
3. Expand capabilities such as improved customer insights and steering on NPS metrics.
As part of the third set of initiatives, we embarked on a journey in 2019 to create new value propositions for our clients. This journey focuses on how to make sure we stay relevant for our clients in the future. We also engaged with our clients by hosting several client events, e.g. the family businesses dinner, the Amsterdam Investment Forum and the Dutch Association of Corporate Treasurers (DACT) education programme.
Build a future-proof bankAs part of the drive to build a future-proof bank, CIB focused its efforts in 2019 on creating a capital-efficient business model, a solid client base and healthy returns. We aim to improve our operational efficiency, which is why processes need to be simpler and more data driven. We made major strides in our transition towards a capital-efficient business model by centralising our portfolio management, coverage and lending activities.
Corporate & Institutional Banking
1 Basel III RWA and a CET1 target of 13.5%
IntroductionRisk, funding &
capitalLeadership &
governanceAnnual Financial Statem
ents 2019Other
Strategy and performance

ABN AMRO Bank Annual Report 2019
IntroductionRisk, funding &
capitalLeadership structure
GovernanceAnnual Financial Statem
entsOther
IntroductionStrategy and perform
anceRisk, funding &
capitalLeadership &
governanceAnnual Financial Statem
ents 2019Other
34Strategy and performance / Business performance / Corporate & Institutional Banking
Strategy and performance
We achieved our goal to reduce RWA by EUR 5 billion. Together with our IT department, we will continue to work on optimising our systems to further improve operational efficiencies and save costs.
We want to unleash the potential of our people throughout their careers and fully equip them so that, together, we can achieve our strategic objectives and contribute to the bank’s purpose. In May 2019, we organised a four-day learning week, offering more than 150 courses based on the CIB strategic journey, the bank-wide strategy and the three pillars. This event is one way we are helping our employees to develop new skills and become fit for the future.
Financial reviewFinancial highlights
Å Net interest income increased by 5%, mainly due to margin growth on client lending, a model update for non-maturing deposits and the reallocation of net interest income from Group Functions of approximately EUR 55 million positive in 2019 compared to 2018.
Å Other operating income declined steeply as equity participations and CVA/DVA/FVA1 results in 2019 were less favourable than in 2018.
Å Operating expenses decreased mainly as a result of lower provisions recorded for SME derivatives-related issues.
Å Impairments came down EUR 51 million from 2018 levels. The energy-offshore and logistics sectors were impacted most (2018: energy-offshore, diamonds and logistics sectors).
Å Making progress in the shift to renewable energy, with 15% of CIB’s energy commitments now renewable.
Operating results
(in millions) 2019 2018 Change
Net interest income 1,229 1,166 5%
Net fee and commission income 505 527 -4%
Other operating income 132 423 -69%
Operating income 1,866 2,116 -12%Personnel expenses 428 480 -11%
Other expenses 669 708 -6%
Operating expenses 1,097 1,189 -8%
Operating result 768 927 -17%Impairment charges on financial instruments 376 427 -12%
Profit/(loss) before taxation 392 501 -22%Income tax expense 101 75 35%
Profit/(loss) for the period 291 426 -32%
Cost/income ratio 58.8% 56.2%
Cost of risk (in bps)1 62 70
Other indicatorsLoans and advances customers (end of period, in billions) 55.1 56.8
-of which Client loans (end of period, in billions)2 41.2 42.6
Due to customers (end of period, in billions) 26.5 28.0
Risk-weighted assets (end of period, in billions) 37.9 35.0
Employee FTEs (end of period) 2,517 2,528
1 Annualised impairment charges on loans and advances customers for the period divided by the average loans and advances customers (excluding at fair value through P&L) on the basis of gross carrying amount and excluding the fair value adjustments from hedge accounting.
2 Gross carrying amount excluding fair value adjustment from hedge accounting.
Corporate & Institutional Banking’s net profit decreased by EUR 135 million to EUR 291 million (2018: EUR 426 million), driven by a decline in operating income.
Net interest income increased by EUR 63 million to EUR 1,229 million (2018: EUR 1,166 million), mainly due to margin growth on client lending, a model update for
non-maturing deposits and the reallocation of net interest income from Group Functions of approximately EUR 55 million positive in 2019 compared to 2018. Due to strategy refocus, client lending decreased mainly in Global Transportation & Logistics and Natural Resources sectors. Global Markets and Clearing also presented higher results when compared with 2018.
1 Credit Valuation Adjustment/Debit Valuation Adjustment/Funding Valuation Adjustment (CVA/DVA/FVA).

ABN AMRO Bank Annual Report 2019
35Strategy and performance / Business performance / Corporate & Institutional Banking
Net fee and commission income decreased by EUR 22 million to EUR 505 million (2018: EUR 527 million), mainly in CIB clients.
Other operating income amounted to EUR 132 million (2018: EUR 423 million). The decrease of EUR 291 million was mainly attributable to less favourable equity participations results in 2019 (EUR 52 million versus EUR 274 million in 2018) and adverse CVA/DVA/FVA results in 2019 (EUR 17 million negative versus EUR 2 million negative in 2018).
Personnel expenses amounted to EUR 428 million (2018: EUR 480 million). The decrease was partially driven by a EUR 27 million restructuring provision in 2018 related to the strategy refocus.
Other expenses decreased by EUR 39 million to EUR 669 million (2018: EUR 708 million), mainly due to lower provisions for project costs relating to SME derivatives-related issues (EUR 23 million versus EUR 41 million in 2018) and lower regulatory levies (EUR 83 million versus EUR 86 million in 2018).
Impairment charges decreased by EUR 51 million in 2019 to EUR 376 million (2018: EUR 427 million). The energy-offshore and logistics sectors were impacted most (2018: energy-offshore, diamonds and logistics sectors).
Other indicatorsTotal client loans decreased by EUR 1.4 billion to EUR 41.2 billion (2018: EUR 42.6 billion). Excluding the USD FX appreciation impact of EUR 0.6 billion, client loans decreased by EUR 2 billion. The decrease was mainly recorded in Global Transportation & Logistics and Natural Resources sectors, as a result of the CIB refocus announced in 2018.
Due to customers decreased by EUR 1.5 billion to EUR 26.5 billion (2018: EUR 28.0 billion). The decrease was mainly reflected in Clearing.
IntroductionRisk, funding &
capitalLeadership &
governanceAnnual Financial Statem
ents 2019Other
Strategy and performance

ABN AMRO Bank Annual Report 2019
IntroductionRisk, funding &
capitalLeadership structure
GovernanceAnnual Financial Statem
entsOther
IntroductionStrategy and perform
anceRisk, funding &
capitalLeadership &
governanceAnnual Financial Statem
ents 2019Other
36Strategy and performance / Business performance / Group Functions
Strategy and performance
Business descriptionGroup Functions is organised into the following main departments: Innovation & Technology, Finance, Risk Management & Compliance, HR & Transformation, Group Audit, Strategy & Sustainability, Legal, Corporate Office and Brand, Marketing & Communications. The majority of Group Functions’ costs are allocated to the businesses.
Innovation & TechnologyInnovation & Technology supports the group by facilitating innovation, managing group programmes (Consistency & Consolidation and Product Rationalisation), and providing services in the areas of IT, information security, data, back-office processing, facilities management and procurement, both in the Netherlands and internationally. I&T’s main deliverable is the IT transformation, which focuses on automation (by implementing the DevOps way of working), optimisation and consolidation (by right-sourcing or the offshore vendor delivery model) and reducing complexity by adopting cloud services.
FinanceFinance enables and safeguards the execution of ABN AMRO’s long-term strategy. It is the primary supplier of management and reporting information to the group’s internal and external stakeholders. Finance has a leading role in the financial planning process and plays an independent role in delivering management information and challenging business decisions. Finance provides a strong financial control environment and ensures compliance with accounting standards and requirements set by the regulatory authorities. It consists of the following main departments: Financial Accounting, Controlling, Investor Relations, ALM, Treasury and Tax.
Risk Management & ComplianceA strong, sustainable bank relies on sound risk management. Risk Management secures a sound risk/reward ratio by maintaining a bank-wide, moderate risk profile as part of the bank’s long-term strategy. This risk profile is managed on the basis of an integrated risk management framework. All identified risk events are assessed and mapped according to risk types, sub-risk types and overarching risks in order to provide a single, integrated view of the risk profile of the bank and its various businesses. Risk Management takes careful account of this integrated risk profile and seeks to balance actions in order to ensure that a moderate risk profile is maintained in accordance with the Strategic Risk Appetite Statement. The main risk types are credit, market, liquidity, business and operational (non-financial) risk and they are linked to the Strategic Risk Appetite Statement. Underlying these main risk types are various sub-risk types. Risk appetite statements are set both for the main and the sub-risk types. The Risk, funding & capital
management section of this report elaborates on the bank’s risk profile, risk taxonomy and risk appetite. Compliance aims to protect the bank, its clients and its employees against compliance and conduct risks, defined as the risk of failure to comply with laws and regulations, self-regulatory organisation standards, values and business principles, and codes of conduct, or generally accepted market standards applicable to the bank’s services and activities; security risks and incidents; financial and reputational damage arising from financial and other crime; and misconduct and/or illegal behaviour of clients, the bank and/or its employees.
HR & TransformationThe primary responsibility of HR & Transformation is to support the group by investing in an optimal employee experience and culture. HR makes sure we acquire the right talent, develop the right skills, and offer our employees a great workplace with good working conditions and inspiring leadership. HR supports the group by providing services such as talent attraction, learning, executive development, executive reward, organisational design and diversity & inclusion. In addition, we are accelerating our efforts to drive ABN AMRO’s transformation by focusing on culture and leadership, and becoming a purpose-driven and values-led business.
Group Audit, Strategy & Sustainability, Legal, Corporate Office and Brand, Marketing & CommunicationsGroup Audit provides independent oversight and control, on behalf of senior and executive management, of the core processes, policies and procedures that are designed to ensure the group complies with both the letter and spirit of general and industry-specific legislation and regulations. In this way, it helps protect the group’s reputation. Strategy & Sustainability provides advice on strategy and the implementation of various strategic initiatives and activities, including acquisitions and divestments, and strategic programmes for the group and its stakeholders. It also formulates the group’s overall sustainability strategies and ensures that sustainable banking is embedded in the group’s business practices. Brand, Marketing & Communications aims to position the bank as a sustainable organisation with a clear purpose (‘Banking for Better, for generations to come’) and to improve the bank’s reputation through open and transparent dialogue with our stakeholders. It also aims to prevent reputational damage and to manage and improve the bank’s reputation, brand name and brand value in the Netherlands and abroad in a consistent manner. As part of this process, ABN AMRO Foundation runs social projects and coordinates activities that promote social engagement.
Group Functions

ABN AMRO Bank Annual Report 2019
37Strategy and performance / Business performance / Group Functions
Financial reviewFinancial highlights
Å Operating income increased by EUR 163 million, totalling EUR 383 million in 2019 (2018: EUR 220 million). The increase was mainly attributable to the full-year impact of a model update for non-maturing deposits and the reallocation of net interest income to the business segments of approximately EUR 170 million
positive in 2019 compared to 2018, alongside the book profit recorded for the sale of Stater.
Å Expenses directly incurred by Group Functions decreased due to lower restructuring provisions and lower expenses due to the sale of Stater, partially offset by FTE transfers from the business segments.
Å The roll-out of DevOps is ongoing, enabling faster delivery time to market and improved efficiency.
Operating results
(in millions) 2019 2018 Change
Net interest income 147 -16
Net fee and commission income -2 40
Other operating income 238 196 21%
Operating income 383 220 74%Personnel expenses 734 794 -8%
Other expenses -589 -635 7%
Operating expenses 145 160 -9%
Operating result 238 60Impairment charges on financial instruments -3 -16 82%
Profit/(loss) before taxation 241 76Income tax expense1 1 38 -97%
Profit/(loss) for the period1 240 39
Other indicatorsSecurities financing - assets (end of period, in billions) 10.3 7.1
Loans and advances customers (end of period, in billions) 4.7 5.5
Securities financing - liabilities (end of period, in billions) 7.7 6.9
Due to customers (end of period, in billions) 2.7 3.5
Risk-weighted assets (end of period, in billions) 4.1 5.6
Employee FTEs (end of period) 5,899 6,328
1 Comparative figures for 2018 have been restated. Please refer to Note 1 Accounting policies in the Consolidated Annual Financial Statements.
Net profit increased by EUR 201 million in 2019 to EUR 240 million (2018: EUR 39 million) as operating income rose while costs declined.
Net interest income increased by EUR 163 million to EUR 147 million (2018: EUR 16 million negative). The increase was mainly attributable to the full-year impact of a model update for non-maturing deposits and the reallocation of net interest income to the business segments of approximately EUR 170 million positive in 2019 compared to 2018, alongside the book profit recorded for the sale of Stater.
Net fee and commission income decreased by EUR 42 million to EUR 2 million negative (2018: EUR 40 million) due to the divestment of Stater.
Other operating income increased by EUR 42 million to EUR 238 million in 2019 (2018: EUR 196 million) mainly
due to the book gain recorded for the sale of Stater (EUR 130 million in Q2 2019), which was partly offset by less favourable hedge accounting-related income, including the partial sale of the public sector loan portfolio (totalling EUR 57 million versus EUR 79 million in 2018) and a lower revaluation of equensWorldline (EUR 39 million versus EUR 69 million in 2018).
Personnel expenses decreased by EUR 60 million to EUR 734 million (2018: EUR 794 million), mainly as a result of lower restructuring provisions due to a EUR 3 million release in 2019 (2018: EUR 58 million). The increase in personnel expenses due to FTE transfers from the business segments was offset by the decrease in FTEs from the sale of Stater.
Other expenses amounted to EUR 589 million negative (2018: EUR 635 million negative). This was due to lower costs being allocated to commercial business lines.
IntroductionRisk, funding &
capitalLeadership &
governanceAnnual Financial Statem
ents 2019Other
Strategy and performance

ABN AMRO Bank Annual Report 2019
IntroductionRisk, funding &
capitalLeadership structure
GovernanceAnnual Financial Statem
entsOther
IntroductionStrategy and perform
anceRisk, funding &
capitalLeadership &
governanceAnnual Financial Statem
ents 2019Other
38Strategy and performance / Responsibility statement
Strategy and performance
Responsibility statementPursuant to section 5:25c sub 2 part c of the Dutch Financial Supervision Act, the members of the Executive Board state that to the best of their knowledge:
Å the Annual Financial Statements give a true and fair view of the assets, liabilities, financial position and profit or loss of ABN AMRO Bank N.V. and the companies included in the consolidation;
Å the Executive Board report gives a true and fair view of the state of affairs on the balance sheet date and the course of business during the 2019 financial year of ABN AMRO Bank N.V. and its affiliated companies, of which data is included in its Annual Financial Statements.
Å the Executive Board report describes the material risks with which ABN AMRO Bank N.V. is faced.
Amsterdam, 10 March 2020
Executive BoardKees van Dijkhuizen, Chief Executive Officer and Chairman Clifford Abrahams, Chief Financial Officer and Vice-Chairman Tanja Cuppen, Chief Risk Officer Christian Bornfeld, Chief Innovation & Technology Officer
Responsibility statement
Risk, funding & capital
Risk, funding & capital
40 Introduction to Risk, funding & capital management
41 Risk, funding & capital managementRisk approach 41Credit risk management 47Market risk management 56Operational risk management 60Funding & liquidity risk management 62Capital management 64Business risk management 65Sustainability risk management 66Management Control Statement 69
This section discloses comprehensive information on risk management, capital adequacy and funding. Some disclosures in this section contain audited information and are an integral part of the Annual Financial Statements.
72 Risk, funding & capital reviewRisk profile 72Key developments 73Credit risk 77Market risk 107Operational risk 110Liquidity risk 112Funding 114Capital 118Sustainability risk 125
129 Additional risk, funding & capital disclosures
IntroductionStrategy and perform
anceLeadership &
governanceAnnual Financial Statem
ents 2019Other
Risk, funding & capital
Risk, funding & capital

ABN AMRO Bank Annual Report 2019
IntroductionStrategy and perform
anceRisk, funding &
capitalLeadership structure
GovernanceAnnual Financial Statem
entsOther
IntroductionStrategy and perform
anceRisk, funding &
capitalLeadership &
governanceAnnual Financial Statem
ents 2019Other
40Risk, funding & capital / Introduction to Risk, funding & capital management
Risk, funding & capital
Introduction to Risk, funding & capital managementThis section provides an introduction to the Risk, funding & capital report. As this section of the Annual Report contains information based on EU IFRS as well as CRD IV/CRR, it provides more information on differences in scope and consolidation.
ContentsRisk, funding & capital managementThis chapter sets out the bank’s approach to risk, funding and capital management by describing strategy, policies, governance and measurement approaches.
Risk, funding & capital reviewPortfolio composition and movements are described in the Risk, funding & capital review. This section also describes developments in the bank’s main types of risk and regulatory capital.
Additional risk, funding & capital disclosuresThis chapter provides additional disclosures required under current regulations.
Regulatory requirementsThe Risk, funding & capital section presents the disclosures required under the Dutch Financial Supervision Act (Wet op financieel toezicht - Wft), the EU Capital Requirements Regulation (CRR), Title 9 Book 2 of the Dutch Civil Code and EU IFRS. ABN AMRO also embraces the Enhanced Disclosure Task Force (EDTF) principles and recommendations.
EU IFRSSome disclosures in the Risk, funding & capital section are an integral part of the Annual Financial Statements (AFS) and contain audited information. The audited parts concern risk disclosures of financial instruments (IFRS 7) and capital disclosures (IAS 1). Audited information in these sections is labelled as ‘audited’ in the respective headings.
Enhanced Disclosure Task Force (EDTF)ABN AMRO has implemented most of the 32 recommendations made by the Enhanced Disclosure Task Force.
Pillar 3 disclosuresPillar 3 disclosures are part of the Basel framework, which is based on the three-pillar concept. The objective of Pillar 3 disclosures is to inform ABN AMRO’s current and potential investors on how the organisation manages risk and capital adequacy. The full Pillar 3 disclosures are published in a separate report on the website of ABN AMRO Bank N.V.
Risk exposure measurement and scope differencesRisk measures vary according to the purpose for which exposure is calculated: EU IFRS or the determination of regulatory or economic capital (CRD IV/CRR).
EU IFRS reporting scopeEU IFRS is mainly used to measure the bank’s financial results and position by class of product. In addition, the financial position according to EU IFRS provides a liquidity view instead of a credit view. The consolidation scope of ABN AMRO is determined in accordance with IFRS 10 Consolidated Financial Statements and IFRS 11 Joint arrangements. More information can be found in the Annual Financial Statements.
Regulatory reporting scopeThe objective of regulatory reporting is to take a risk view on the bank’s portfolio and to ensure that sufficient capital buffers for unexpected losses and sufficient liquidity buffers are maintained. The scope of consolidation for the purpose of calculating regulatory and economic capital (based on the CRD IV and CRR) is generally the same as the consolidation scope under EU IFRS and includes subsidiaries that are directly or indirectly controlled by ABN AMRO and active in the banking and financial sectors. Subsidiaries consolidated under EU IFRS but active in sectors other than banking and finance are excluded from the regulatory scope of consolidation.
Introduction to Risk, funding & capital management
ABN AMRO Bank Annual Report 2019
41Risk, funding & capital / Risk, funding & capital management / Risk approach
Risk, funding & capital managementThis section provides an overview of the bank’s approach to risk, funding and capital management, including its risk strategies, measurement approaches and risk governance framework. Portfolio developments are described in the Risk, funding & capital review section.
Risk approachABN AMRO is committed to being a well-capitalised bank with sufficient liquidity that focuses on delivering sustainable value to its stakeholders. We are committed to maintaining a sound balance between risk and reward and to a bank-wide moderate risk profile as part of our long-term strategy. We thoroughly evaluate the long-term risk and return implications of our operations on an ongoing basis.
Risk profileABN AMRO’s risk profile is managed by way of an integrated risk management framework, which identifies all types of risk and cross-risk, as well as overarching risks, in order to provide a single, integrated view on the bank and its business lines. By taking an integrated view, we strive to carefully balance actions to manage our moderate risk profile. The Enterprise Risk Management policy provides a formal approach to risk management at enterprise level that is aligned with the bank’s strategic objectives, including its risk profile.
The following sections describe the risk taxonomy, risk appetite, risk culture, risk governance and risk measurement, all of which are key elements of a moderate risk profile. For more information on the balance sheet composition, please refer to the Risk, funding & capital review section.
Risk taxonomy bOur risk taxonomy classifies risks into risk types to which the bank is, or could be, exposed. It is reviewed and updated on an annual basis, or sooner if any new actual or potential risk type emerges and requires an update. The taxonomy ensures that all identified material risks are defined and taken into account in the risk governance framework. It creates a common risk vocabulary, provides a checklist of types of risks for use in risk assessments, and helps ensure that all material risks are managed and that roles and responsibilities are identified.
The main risk types we recognise are credit, market, liquidity, business and operational (non-financial) risk. These main risk types comprise various sub-risk types. Risk appetite statements are set for both the main and sub-risk types. The five main risk types fully cover all possible events for the bank that directly impact on the value of the bank. The value of the bank is not only its direct financial value, but also ‘goodwill’ or, in other words, the value of the bank’s reputation.
IntroductionStrategy and perform
anceLeadership &
governanceAnnual Financial Statem
ents 2019Other
Risk, funding & capital
Risk, funding & capital management

ABN AMRO Bank Annual Report 2019
IntroductionStrategy and perform
anceRisk, funding &
capitalLeadership structure
GovernanceAnnual Financial Statem
entsOther
IntroductionStrategy and perform
anceLeadership &
governanceAnnual Financial Statem
ents 2019Other
42
Risk, funding & capital
Risk, funding & capital / Risk, funding & capital management / Risk approach
Risk taxonomy
External causal factorsPolitics, (macro)economy, society, environment,
technology, legislation, regulation
Enterprise risk
Credit risk Market risk
DefaultMigrationCountry
SovereignCounterparty credit
FundingMarket
Sustainability
HRIT
ChangeLegal
ComplianceTax
Model
Interest rateFX
EquityProperty
Credit spread
Liquidity risk Business risk Operational (non-financial)
risk
Value of the bankFinancial
Reputational
NIEUW 2018
Tradingbook
Bankingbook
Internal causal factorsPeople, processes, systems, balance sheet,
products, clients
Risk appetite bThe risk appetite determines the level of risk that the bank is willing to take in order to pursue its strategy.
The bank-wide risk appetite, which is to pursue a moderate risk profile, is an integral part of our corporate strategy. Specific business-line risk appetites further determine the bank-wide risk appetite. In addition, risk appetites exist at a country and material entity level. These risk appetites allow us to manage risk at every appropriate level within the bank, as shown in the figure below.
Risk appetite framework
RiskStrategy
StrategicRisk Appetite
Statement
Risk Indicator Framework(Containing BRAS, BLRAS, LRAS,
ERAS, Linked to the risk taxonomy)
The risk appetite follows the structure presented in the risk appetite framework figure. The strategic Risk Appetite Statement expresses ABN AMRO’s strategy of pursuing a moderate risk profile and cascades into the risk indicator framework at various levels of the organisation: bank-wide (BRAS), business line (BLRAS), local (LRAS) and entity level (ERAS). The strategic Risk Appetite Statement is approved by the Executive Board and Supervisory Board.
Senior management monitors the bank’s activities, based on the risk appetite. The status of adherence to the risk appetite and the outlook are discussed monthly by the Executive Board and quarterly by the Supervisory Board, based on the Enterprise Risk Management report.
The elements of the strategic Risk Appetite Statement ensure a coherent balance between return and value creation, our business model, capital, and liquidity and funding, taking into account the conduct, governance and control framework shown in the following figure. For each element, key qualitative and/or quantitative statements are set.

ABN AMRO Bank Annual Report 2019
43Risk, funding & capital / Risk, funding & capital management / Risk approach
Strategic Risk Appetite Statement
Conduct, governance & control framework
Businessmodel
Sustainablereturn &
value creation
Liquidity &FundingCapital
The statements in the strategic Risk Appetite Statement are cascaded into and supported by an underlying risk indicator framework at bank, business line, entity and country levels. This risk indicator framework consists of statements set for each main and sub-risk type presented in the risk taxonomy. Each statement consists of one or more quantitative and/or qualitative indicators, referred to as key risk indicators (KRI). For every KRI, a limit is set, against which the actual risk profile is monitored. If a KRI limit is breached, action is required to bring our risk profile back within the limit. Early warning checkpoints are in place to allow for timely action to prevent breaches.
Examples of KRIs in our risk appetite include: Å Regulatory and internal capital ratios; Å Risk-adjusted return measures; Å Concentration limits for single counterparties, industry sectors and countries;
Å Economic capital and risk-weighted asset limits for various risk types;
Å Liquidity ratios (LtD, LCR, NSFR); Å Market risk parameters (NII-at-Risk); Å Operational/non-financial risk parameters (effectiveness of internal control environment);
Å Reputational parameters (NPS, employee engagement score).
When setting the statement in the strategic Risk Appetite Statement and the statements for each risk type in the risk indicator framework, the following aspects are considered: the corporate strategy, market standards (such as peer analyses), the economic environment, regulations, the views of our stakeholders and the actual risk profile, as well as internal insights and risk management tools. In addition to incorporating these views, balancing these aspects provides us with the means to substantiate risk statements for each risk type.
Risk cultureThe bank has a continuous focus on risk awareness as an integral part of its bank-wide risk culture. Pursuing a moderate risk profile is embedded in the risk culture by means of communication and training and is monitored through performance management.
Employees are expected to be aware of the drivers of our risk profile and to feel accountable for the risks they take. A permanent education tool and a training app are used to continually reinforce bank-wide awareness of non-financial risks, while more specific training is also available for each business line and for specific roles or functions. Employees are also expected to adhere to the ABN AMRO culture principles and to act in accordance with the code of conduct. These are fundamental to everything we do and describe how we act as a bank, how we make decisions and how we deal with various dilemmas, and, as such, are included in the permanent education tool. The code of conduct is published on our website.
We place a strong emphasis on sound risk control in our remuneration policies, which are in line with our risk profile. More details are provided in the Remuneration Report in the Leadership & Governance section.
Risk governance bThe Risk Governance Charter defines ABN AMRO’s risk governance and decision framework (delegated authorities and mandates) for both financial and non-financial risks. The Risk Governance Charter is in place to support an efficient and effective Risk Control Management throughout, and at all levels of, the bank. The Risk Governance Charter supports the bank in being compliant with the Basel Committee on Banking Supervision guidance on Corporate Governance Principles for Banks and the EBA guidelines on Internal Governance.
The Risk Management organisation operates under the direct responsibility of the Chief Risk Officer, who is a member of the Executive Board. The Executive Board has overall responsibility for the risks that ABN AMRO takes.
IntroductionStrategy and perform
anceLeadership &
governanceAnnual Financial Statem
ents 2019Other
Risk, funding & capital
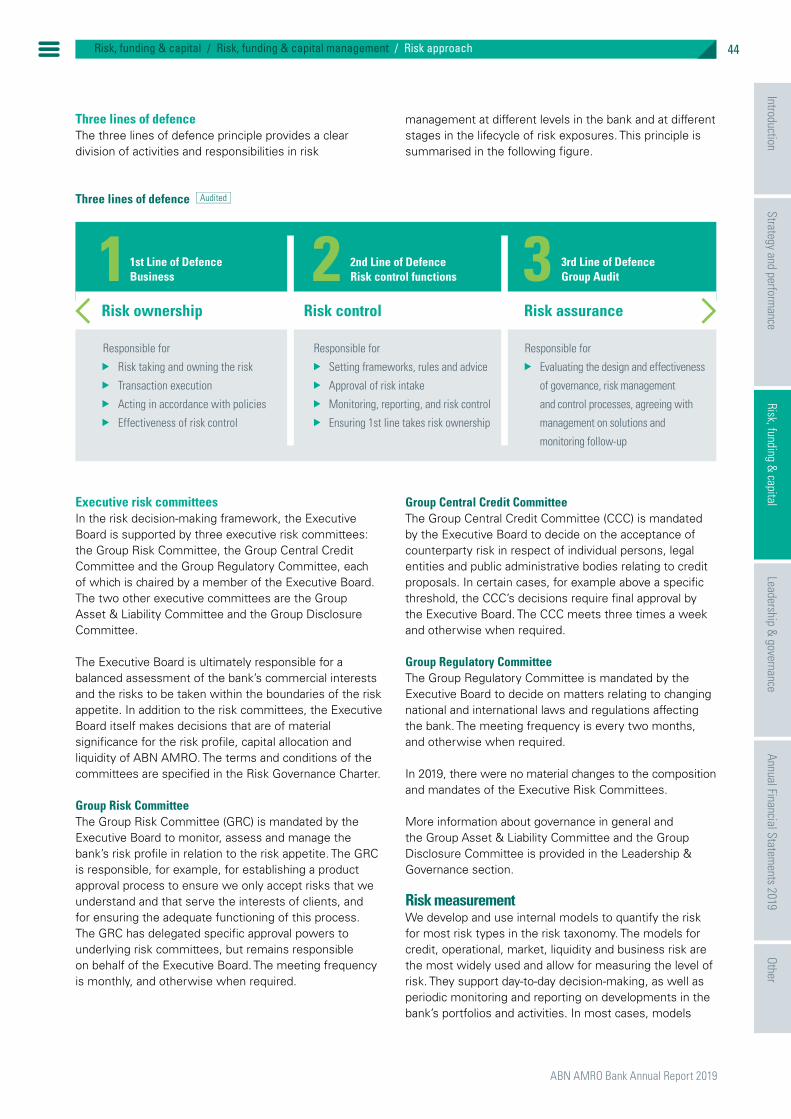
ABN AMRO Bank Annual Report 2019
IntroductionStrategy and perform
anceRisk, funding &
capitalLeadership structure
GovernanceAnnual Financial Statem
entsOther
IntroductionStrategy and perform
anceLeadership &
governanceAnnual Financial Statem
ents 2019Other
44
Risk, funding & capital
Risk, funding & capital / Risk, funding & capital management / Risk approach
Three lines of defence The three lines of defence principle provides a clear division of activities and responsibilities in risk
management at different levels in the bank and at different stages in the lifecycle of risk exposures. This principle is summarised in the following figure.
Three lines of defence b
Risk ownership Risk control Risk assurance
Responsible for
Risk taking and owning the risk
Transaction execution
Acting in accordance with policies
Effectiveness of risk control
Responsible for
Setting frameworks, rules and advice
Approval of risk intake
Monitoring, reporting, and risk control
Ensuring 1st line takes risk ownership
Responsible for
Evaluating the design and effectiveness
of governance, risk management
and control processes, agreeing with
management on solutions and
monitoring follow-up
1st Line of Defence Business
2nd Line of Defence Risk control functions
3rd Line of Defence Group Audit1 2 3
Executive risk committeesIn the risk decision-making framework, the Executive Board is supported by three executive risk committees: the Group Risk Committee, the Group Central Credit Committee and the Group Regulatory Committee, each of which is chaired by a member of the Executive Board. The two other executive committees are the Group Asset & Liability Committee and the Group Disclosure Committee.
The Executive Board is ultimately responsible for a balanced assessment of the bank’s commercial interests and the risks to be taken within the boundaries of the risk appetite. In addition to the risk committees, the Executive Board itself makes decisions that are of material significance for the risk profile, capital allocation and liquidity of ABN AMRO. The terms and conditions of the committees are specified in the Risk Governance Charter.
Group Risk CommitteeThe Group Risk Committee (GRC) is mandated by the Executive Board to monitor, assess and manage the bank’s risk profile in relation to the risk appetite. The GRC is responsible, for example, for establishing a product approval process to ensure we only accept risks that we understand and that serve the interests of clients, and for ensuring the adequate functioning of this process. The GRC has delegated specific approval powers to underlying risk committees, but remains responsible on behalf of the Executive Board. The meeting frequency is monthly, and otherwise when required.
Group Central Credit CommitteeThe Group Central Credit Committee (CCC) is mandated by the Executive Board to decide on the acceptance of counterparty risk in respect of individual persons, legal entities and public administrative bodies relating to credit proposals. In certain cases, for example above a specific threshold, the CCC’s decisions require final approval by the Executive Board. The CCC meets three times a week and otherwise when required.
Group Regulatory CommitteeThe Group Regulatory Committee is mandated by the Executive Board to decide on matters relating to changing national and international laws and regulations affecting the bank. The meeting frequency is every two months, and otherwise when required.
In 2019, there were no material changes to the composition and mandates of the Executive Risk Committees.
More information about governance in general and the Group Asset & Liability Committee and the Group Disclosure Committee is provided in the Leadership & Governance section.
Risk measurementWe develop and use internal models to quantify the risk for most risk types in the risk taxonomy. The models for credit, operational, market, liquidity and business risk are the most widely used and allow for measuring the level of risk. They support day-to-day decision-making, as well as periodic monitoring and reporting on developments in the bank’s portfolios and activities. In most cases, models

ABN AMRO Bank Annual Report 2019
45Risk, funding & capital / Risk, funding & capital management / Risk approach
quantify the probability and severity of an event, i.e. the likelihood that an event will occur and the loss the bank may suffer as a consequence of that event. This information serves as the basis for ABN AMRO’s internal measures of risk (economic capital) and as key input for calculating the minimum regulatory capital requirements according to the Basel framework (regulatory capital).
New models require approval before being implemented and used. Internal approval for the use (or continued use) of a model is obtained from the Methodology Acceptance Group (MAG), a sub-committee of the Group Risk Committee. When required, external approval is obtained from the regulator.
The modelling departments develop models in close cooperation with the relevant business and risk experts. In principle, we review models annually. This means that we back-test the models against historical data and, where relevant, benchmark calibration of the models with external studies.
The independent Model Risk Management Department validates all internal models. Validation guidelines ensure objectivity, consistency, transparency and continuity. Models, data and implementation are checked according to these principles and reviewed against internal and regulatory requirements.
CapitalRegulatory capital (CRD IV/CRR) bUnder the Basel framework as implemented in European legislation (CRD IV and CRR), banks are required to hold capital to cover financial risks. Banks determine the level of risks for three major risk types (credit, operational and market risk) in terms of aggregated risk-weighted assets (RWA). The capital requirements are stated as a percentage of RWA. Under Pillar 1, banks are required to hold a regulatory fixed percentage of RWA in capital. Under Pillar 2, supervisors impose an additional – bank-specific – percentage of RWA in addition to the Pillar 1 requirement. The capital buffer requirements are a mixture of percentages prescribed by law and percentages set by various regulators.
Economic capitalIn addition to regulatory required capital, for Pillar 2 we calculate economic capital (EC). Economic capital covers all risk types in our risk taxonomy for which capital is deemed to be the mitigating instrument to cover unexpected losses, and is used as the key metric for internal risk measurement and management. It is the amount of capital we reserve in order to achieve a sufficient level of protection against large unexpected losses that could result from extreme market conditions or events.
Internal models are used to calculate EC at a 99.95% confidence level and a one-year time horizon. This implies that the estimated capital figure for the coming year is sufficient to cover a level of loss that will be exceeded in only 0.05% of all possible cases.
EC is aggregated for all risk types to determine the total EC at a bank level and to support capital allocation, ex-post performance measurement and risk-appetite setting, such as industry concentration risk limits. EC is also used at a transactional level in loan-pricing tools. These tools act as a decision-making mechanism for assessing the profitability of a new or existing transaction in terms of the Risk-Adjusted Return on Risk-Adjusted Capital (RARORAC).
EC Quality AssessmentThe EC models described above form the core of the Internal Capital Adequacy Assessment Process (ICAAP). In order to monitor and secure the quality of the EC framework and its outcome in terms of capital adequacy, an EC Quality Assessment (ECQA) is performed annually as part of the ICAAP. For each main risk type, the calculated EC figure is evaluated in the following areas:
Å Risk coverage; Å Responsiveness to internal and external developments; Å Data quality; Å Compliance with EC policy; Å Validity of choices and assumptions.
If considered necessary, an additional capital buffer (‘EC add-on’) is taken to cover any identified shortfalls in the EC.
Stress testing and scenario analysis bABN AMRO uses stress testing and scenario analysis as an important risk management instrument, looking at profitability, capital and liquidity from a bank-wide perspective in various scenarios on a regular basis. In addition, sub-portfolio and risk type-specific stress testing and scenario analysis are performed.
Stress testing purposesABN AMRO applies stress testing and scenario analysis for several purposes, including:
Å Business planning: various macroeconomic scenarios for budget purposes;
Å Capital planning: stress testing is used to gain insight into the resilience of our capital under adverse changes in the economic environment and ABN AMRO-specific circumstances;
Å Risk appetite setting and monitoring: the outcome of stress testing is used for setting and monitoring risk appetite limits and targets, including limits under stress;
IntroductionStrategy and perform
anceLeadership &
governanceAnnual Financial Statem
ents 2019Other
Risk, funding & capital

ABN AMRO Bank Annual Report 2019
IntroductionStrategy and perform
anceRisk, funding &
capitalLeadership structure
GovernanceAnnual Financial Statem
entsOther
IntroductionStrategy and perform
anceLeadership &
governanceAnnual Financial Statem
ents 2019Other
46
Risk, funding & capital
Risk, funding & capital / Risk, funding & capital management / Risk approach
Å Contingency planning: stress testing is used to assess and strengthen the triggers and measures in the liquidity and capital contingency and recovery plans. Reverse stress testing is performed to gain advanced insight into plausible events that could put the continuity of ABN AMRO under pressure;
Å Risk type-specific and business lines stress testing, such as market risk trading and banking book and mortgage stress testing;
Å Supervisory stress testing, based on prescribed scenarios and assumptions. This includes the EBA’s stress test programme designed to assess banks’ resilience to adverse economic or financial developments.
The figure below shows the stress testing and scenario analysis cycle.
Riskidentification
Management action
Stress testing & scenario
analysis
Scenario & scope selection
Data sourcing, models and
methodologies
Simulation & impact analysis on ABN AMRO
Conduct, governance & control framework
Stress test & scenario analysis cycle
The stress testing and scenario analysis cycle starts with the identification of material risks for ABN AMRO and individual business lines. Both systemic risks (e.g. macroeconomic risks) and ABN AMRO-specific risks (e.g. cyber attacks or adverse outcomes in legal proceedings) are considered. In addition, sensitivity analyses are used to gain insight into key vulnerabilities. Scenarios are defined, based on the risks identified. Alongside the most likely scenarios, which are used, for example, for budgeting and IFRS purposes, we also define severe, but plausible scenarios for stress testing purposes. Scenarios can have a short-term horizon, such as an instant market shock, or a longer-term horizon, such as a multi-year recession.
Scenario projections are based on quantitative models, as well as expert opinion procedures. In general, results are presented excluding and including potential mitigating actions, taking into account contingency plans. Two types of management actions can be distinguished in the stress testing and scenario analysis: i) direct actions based on the scenario exercise, and ii) actions that would be taken if the scenario were to materialise.
Given the importance of stress testing in terms of sound risk management, the Executive Committee is involved throughout the process and its governance. The Executive Committee, together with the Scenario & Stress Test Committee (SSC, a sub-committee of the Group Risk Committee), discusses and decides on the scenario selection, the results and the implications.

ABN AMRO Bank Annual Report 2019
47Risk, funding & capital / Risk, funding & capital management / Credit risk management
Credit risk is the risk that the value and/or the earnings of the bank decline due to uncertainty in a counterparty’s ability or willingness to repay a loan or meet the terms of a contractual obligation.
Credit risk management is the responsibility of the first and second lines of defence. The primary responsibility for intake, managing and monitoring credit risk lies with the business as the first line of defence. The second line of defence has a permanent and ongoing responsibility to define the boundaries and monitor whether the type and level of credit risk exposures are within the limits of the business lines’ risk appetite. Credit risk management within the bank is governed by the bank-wide central credit risk policy and further detailed in underlying specific credit risk policies and standards.
Credit risk management approach bABN AMRO employs two separate approaches to managing credit risk. These reflect the bank’s way of doing business. For customised lending to counterparties (non-programme lending), risks are assessed on an individual basis. Standardised products and processes are managed on a pooled basis (programme lending), to which uniform risk criteria are assigned. Effectively, any lending not specifically defined as programme lending is defined as non-programme lending.
The process of credit risk management is illustrated in the following figure.
Credit risk process differs by type of loan
Non-programme lendingCustomised loans, mostly Private Banking, Commercial Banking and Corporate & Institutional Banking
Credit decision based on credit score and policy rules Account maintenance
Loan disbursement Default prevention
Risk assessment by business line
Credit risk monitoring Business and risk controlfunctions jointly responsible
Analysis and credit decision by credit risk function
Restructuring and Recovery High-risk monitoring
Loan disbursement
Regular monitoring1
Intensive monitoring(‘Watch’)2
Restructuring
Restructuring
Recovery
Recovery
Increased risk
Programme lendingStandardised loans, mostly Retail Banking
Continual update of risk governance, management and policies
Processes reflect guidelines for credit risk management
For programme lending, product specific standards are established
Credit acceptanceLoan approval anddisbursement
1 Daily monitoring, annual or semi-annual credit review.2 ‘Watch’: status assigned to counterparties with an increased risk.
For more insight on our credit portfolio please refer to the Credit risk chapter in the Risk, funding & capital review section.
Credit risk management
IntroductionStrategy and perform
anceLeadership &
governanceAnnual Financial Statem
ents 2019Other
Risk, funding & capital

ABN AMRO Bank Annual Report 2019
IntroductionStrategy and perform
anceRisk, funding &
capitalLeadership structure
GovernanceAnnual Financial Statem
entsOther
IntroductionStrategy and perform
anceLeadership &
governanceAnnual Financial Statem
ents 2019Other
48
Risk, funding & capital
Risk, funding & capital / Risk, funding & capital management / Credit risk management
PlanningWithin programme lending, the credit cycle starts with a product planning phase, during which period the product is designed and/or reviewed, with the goal of optimising its key drivers of risk and return within the context of ABN AMRO’s strategy, risk appetite, the client’s best interests and sustainability.
Credit acceptanceWithin non-programme lending, the credit acceptance phase of a credit proposal starts with an assessment of the proposal by the relevant business line. The qualitative and quantitative details of the credit risk associated with the loan must be assessed prior to approval. Information must be provided on matters such as the purpose, details and structure of the proposed credit facility, the borrower and other counterparties, the industry and geography, management and owners, and financial and non-financial analyses. Compliance with internal policies should be checked. After the assessment, an analysis is performed by Risk Management. The credit decision is based on independent assessments by both the commercial and the credit risk functions.
For a credit approval decision within programme lending, client-specific aspects and internal and external data are taken into consideration to calculate a credit score (scorecard). The credit decision is based on the outcome of the scorecard and policy rules.
Credit risk monitoringConsistent and regular monitoring of the counterparty, exposures, risk mitigants and ongoing compliance with internal policies helps to safeguard the bank’s position in relation to all risks associated with the counterparty, credit type or portfolio. Monitoring starts when the credit facility has been provided and continues throughout the lifecycle of the credit facility and the relationship with the counterparty until such time as the exposure is repaid and/or the limit is cancelled.
Should a situation arise in which an individual counterparty shows signs of credit risk deterioration, but is not in default, a ‘watch’ status will be assigned. A ‘watch’ status indicates that a counterparty is subject to increased monitoring and appropriate follow-up measures in order to prevent further deterioration or a default. Indicators for this status are changes in risk profile, liquidity problems, management issues, the market outlook, a potential breach of a credit agreement, solvency issues and uncertain continuity.
Restructuring & RecoveryCredit facilities that are subject to a default event are mandatorily transferred to the Financial Restructuring & Recovery department (FR&R). Credit facilities identified as having a significantly high risk can be transferred to FR&R if specialised restructuring knowledge is required. If a ‘going concern’ approach is applicable and return to a
performing status is considered likely, the credit facility is transferred to the Restructuring team, which will devise a plan aimed either at rehabilitation or at enhancing the likelihood of full repayment. In all other cases, the credit facility is transferred to the Recovery team.
Programme lending contracts are transferred to the Restructuring team if a default status is assigned because payments have been past due for more than 90 days or because another default trigger applies. If restructuring is ultimately ineffective, the client is transferred to other internal departments or external parties (such as Intrum) for debt collection.
Once a client is considered able to meet its future payment obligations and the involvement of FR&R is no longer required, the client is transferred back to the business.
Credit risk measurement bThe bank has approval from its supervisor to use the Advanced Internal Ratings-Based (A-IRB) approach for the large majority of its credit portfolios. The approval for use of the A-IRB approach is not restricted to certain exposures classes, while the approval excludes certain specific portfolios from the scope. The simple risk-weighted approach is applied to most equity exposures. The Standardised Approach (SA) is used for some of the bank’s less material portfolios and entities. Prescribed treatments are applied to exposures to qualifying central counterparties. The use of the Standardised Approach and the Foundation IRB (F-IRB) approach is expected to increase substantially in the coming period as a result of more restrictive requirements and supervisory standards for the use of internal models being implemented. At the same time, the forward view on the formal implementation of Basel IV, including the constrained use of the IRB approach to credit risk, also implies that the use of SA and F-IRB will increase, while the use of A-IRB will decrease.
Under the standardised approach, regulatory capital is calculated on the basis of a risk weighting of exposure (net of credit impairments and eligible collateral), based on the exposure characteristics (for retail exposure) or external agency credit ratings of the counterparty (for non-retail exposures). For this purpose, the bank makes use of the external ratings of Standard & Poor’s, Moody’s and Fitch. In the case of counterparties for which no credit ratings are available, exposures are classified as unrated for the purpose of determining regulatory capital requirements.
Under the A-IRB approach, the calculation of regulatory capital requirements is based on the regulatory asset class of an exposure and internal estimates of the Probability of Default (PD), Loss Given Default (LGD), Exposure at Default (EAD) and maturity. The models used for the measurement and management of credit risk vary from purely statistical to expert-based and employ both

ABN AMRO Bank Annual Report 2019
49Risk, funding & capital / Risk, funding & capital management / Credit risk management
quantitative and qualitative risk drivers. All models, including the models used to estimate PD, LGD, EAD and maturity under the A-IRB approach, are subject to the bank’s model risk management framework. This framework requires regulatory models to undergo initial validation by the independent model validation function before their first use, and annually thereafter. Initial validation is also required when a model undergoes a material change.
Default definitionAll the models use a consistent definition of default, which has been specified to be in line with regulations. A default is deemed to have occurred when:
Å the counterparty is past due by more than 90 days; or Å the bank considers the borrower to be unlikely to meet its contractual obligations (unlikely-to-pay or UTP).
To determine unlikeliness to pay, the bank has specified both mandatory default triggers (always resulting in the assignment of a default status and whereby no additional expert judgment is allowed) and judgemental triggers (requiring an assessment by credit risk managers to determine whether the UTP indications should result in a default classification). The method for identifying credit-impaired loans under IFRS has been aligned with the method used for regulatory reporting purposes. As at 30 June 2019, the default definition for UTP in the case of the residential mortgage portfolio was changed. As a result, ABN AMRO also updated the IFRS 9 stage 3 credit-impaired status for this portfolio. The change in this accounting estimate is prospectively recognised from 30 June 2019. The Risk, funding & capital review section provides more details
on the impact of the change under the classification ‘recalibration of UTP triggers’. The ending of the default classification for non-forborne exposures is considered if none of the default triggers continues to apply and a probationary period (‘cure period’) of at least three months has elapsed since the default trigger ceased to apply. For forborne exposures, an additional twelve-month cure period applies from the date on which the last forbearance measure or default trigger applied. After the cure period, an assessment is made to establish whether the improvement in the credit quality is factual and permanent (including the requirement for no remaining past due amounts).
Probability of DefaultThe Probability of Default (PD) indicates the likelihood that a counterparty or exposure will default within a one-year time horizon. Models make use of risk drivers such as financial information, behavioural information, arrears information and assessments of industry, geographic and market conditions. Model output is calibrated to long-run average probability of default estimates, based on internal default data and supplemented, for low-default portfolios, by external data. For the non-programme lending portfolio, the PD maps to and is expressed as an internal uniform counterparty rating (UCR). The UCR rating scale consists of 14 performing ratings, each representing a fixed PD range. The indicative mapping of the internal UCR rating scale to external rating agency ratings is shown in the table below. For programme lending portfolios within Retail Banking and Commercial Banking, exposures with the same characteristics are pooled and a PD is assigned to each pool.
Internal rating scale mapped to external ratings b
UCR (internal
rating)Low
PD%High PD%
Standard & Poor's
equivalentMoody's
equivalentFitch
equivalent
Investment grade UCR 1 0.00 0.03 AAA to A+ Aaa to Aa3 AAA to AA-
UCR 2+ 0.03 0.05 A+ A1 AA-
UCR 2 0.05 0.07 A A1 A+
UCR 2- 0.07 0.13 A- A3 A-
UCR 3+ 0.13 0.20 BBB+ Baa1 BBB+
UCR 3 0.20 0.30 BBB Baa2 BBB
UCR 3- 0.30 0.46 BBB- Baa3 BBB-
Sub-investment grade UCR 4+ 0.46 0.78 BB+ Ba1 BB+
UCR 4 0.78 1.29 BB Ba2 BB
UCR 4- 1.29 2.22 BB- B1 BB-
UCR 5+ 2.22 4.24 B+ B2 B
UCR 5 4.24 8.49 B- Caa1 B-
UCR 5- 8.49 16.97 CCC/C Caa2 CCC/C
UCR 6+ 16.97 100.00 CCC/C Caa-C CCC/C
Default UCR 6-8 D D D
IntroductionStrategy and perform
anceLeadership &
governanceAnnual Financial Statem
ents 2019Other
Risk, funding & capital

ABN AMRO Bank Annual Report 2019
IntroductionStrategy and perform
anceRisk, funding &
capitalLeadership structure
GovernanceAnnual Financial Statem
entsOther
IntroductionStrategy and perform
anceLeadership &
governanceAnnual Financial Statem
ents 2019Other
50
Risk, funding & capital
Risk, funding & capital / Risk, funding & capital management / Credit risk management
Loss Given DefaultLoss Given Default (LGD) models estimate the amount of money the bank would lose if the counterparty were to default. LGD is expressed as a percentage of the outstanding amount at default. On facilities that are not in default, LGD estimates are influenced by the risk mitigating techniques used by the bank (such as the use of collateral), the collateral cover, the facility’s seniority and structure, and the bank’s view of the creditor-friendliness of the relevant country’s legal framework. The model output for these facilities is calibrated to downturn conditions, based on internal recovery data supplemented by external data. For facilities that are already in default, an in-default LGD is estimated that also takes account of all relevant post-default information, such as time-in-default and the progress of the recovery process compared to expectations. In-default LGD is calibrated to reflect possible adverse changes in economic conditions during the expected length of the recovery process.
Exposure at DefaultExposure at Default (EAD) models estimate the expected exposure at the time a counterparty defaults. If all or part of a facility is undrawn (i.e. the outstanding amount is less than the approved limit) at the time of the EAD calculation, a portion of the undrawn amount is added to the exposure to reflect the tendency of counterparties to utilise larger portions of their approved facilities when nearing default. For facilities that are amortising, the EAD calculation reflects the possibility that payments will be missed and capitalised in the period leading up to default. EAD estimates are influenced by the type of facility, the draw-down controls that the bank has in place and the type of counterparty. Internal data is supplemented by benchmark information and external data to calibrate EAD models. EAD is calculated on a monthly basis for all facilities, using actual limits and outstanding exposure data.
Use of internal estimatesThe regulatory models’ estimates are embedded in the bank’s credit approval, risk appetite and internal reporting processes. These estimates are also used to calculate economic capital and serve as input for pricing and the calculation of RARORAC (Risk-Adjusted Return on Risk-Adjusted Capital), the bank’s key metric for risk-adjusted performance.
Capital for credit riskRegulatory capitalFor the purpose of determining capital requirements for credit risk, all top-level exposure classes are calculated in accordance with the Advanced Internal Rating Based (A-IRB) approach. Within these exposure classes, a number of smaller portfolios are temporarily or permanently calculated according to the Standardised Approach (SA).
ABN AMRO has been granted approval by the relevant competent authority for the use of A-IRB, including approval for a number of exemptions.
Economic capitalThe EC model for credit risk uses a Monte Carlo simulation to determine a full portfolio loss distribution, taking into account specific portfolio characteristics and diversification effects. Loan facilities are valued on an economic value (mark-to-market) basis to ensure that loss estimates can be based not only on defaulting borrowers, but also on possible credit migrations and changes associated with the market values of loans.
Specific counterparty credit riskABN AMRO primarily incurs counterparty credit risk (CCR) in two business activities, firstly within ABN AMRO Bank through the derivative positions taken with other financial institutions (including positions taken to manage our interest rate hedging and liquidity position) and secondly in the business of ABN AMRO Clearing Bank. These two main sources of CCR are managed separately and are subject to various different features of risk management. The underlying exposures break down further into two product groups: over-the-counter (OTC) derivatives and securities financing transactions.
OTC derivative instrumentsOTC derivatives are financial instruments that are used to cover current and/or future financial risks or to achieve additional return on an investment. They consist of transactions entered into between two parties and where the value is based on an underlying base value (such as interest rates, foreign exchange rates, commodities or equities).
Securities financing transactionsThe balance sheet item securities financing refers to securities lending, a market activity whereby securities are temporarily transferred from a lender to a borrower, subject to the commitment to redeliver the securities, usually in the short term. The borrower collateralises the transaction with cash or other securities of equal or greater value than the borrowed securities in order to protect the lender against counterparty credit risk. As an intermediary between clients and the market, we act both as lender and borrower.
Regulatory and economic exposure calculation for specific counterparty credit riskCredit Valuation Adjustments (CVA) are taken into account for non-collateralised OTC derivative transactions to reflect the cost associated with the risk that the counterparty with whom ABN AMRO has entered into a transaction will fail to honour its contractual obligations.

ABN AMRO Bank Annual Report 2019
51Risk, funding & capital / Risk, funding & capital management / Credit risk management
Measurement of regulatory capital requirements for OTC derivative transactions within ABN AMRO takes place by using the mark-to-market method specified in the CRR (put simply, the exposure value is calculated as the sum of the current replacement cost (mark-to-market) and the potential future credit exposure, based on prescribed percentages of the notional values).
For economic capital purposes, counterparty credit risk exposure calculations for OTC derivative instruments are based on Monte Carlo simulation models. These simulation models generate random scenarios for price factors (such as foreign exchange and interest rates) that determine the value of a certain trade or portfolio. The trade or portfolio is repriced under price factor scenarios, resulting in scenarios for the value of the trade or portfolio. Based on these scenario values, the 95% worst case (mark-to-market) movement in favour of the bank is computed over the lifetime of the trade or portfolio.
During most of the year, ABN AMRO Clearing Bank used an internal model approved by the supervisory authorities for measurement of the exposure value. For its client portfolio, this approach was recently changed to standard supervisory methods. This exposure value is used both for regulatory and internal risk calculation purposes.
For the purpose of determining capital requirements for securities financing transactions (SFT), ABN AMRO Bank uses the Financial Collateral Comprehensive Method (FCCM) specified in the CRR. ABN AMRO Bank does not use the options provided for in the CRR to apply internal models to estimate market risk effects related to SFT or master netting agreements. For economic counterparty exposure calculations, ABN AMRO Bank applies the FCCM calculation with additional conservatism.
During most of the year, ABN AMRO Clearing Bank used an integrated internal model that also caters for SFT positions for exposure value calculations. This approach was recently changed to standard supervisory methods.
In 2019, both ABN AMRO Bank and ABN AMRO Clearing Bank primarily used the Internal Ratings-Based (IRB) approach to determine the risk weights for the positions that gave rise to CCR. The approach used by ABN AMRO Clearing Bank for risk weights was recently changed to the Standardised Approach (SA).
Wrong-way riskThis risk refers to transactions where the counterparty credit exposure arising from OTC or securities lending transactions is positively correlated to the counterparty’s probability of default. In other words, the credit exposure increases when the credit quality of the counterparty deteriorates. In general, we do not engage in such wrong-way risk transactions. We are also prudent
in considering transactions in which this correlation is less obvious, such as transactions where a general wrong-way risk component forms part of the deal, or where a counterparty and the underlying issuer are in a similar industry, or in the same country or geographical region.
Limit settingLimit setting for positions subject to counterparty credit risk is specifically addressed in ABN AMRO’s risk management policy. With respect to CCR, this policy provides, in principle, for specific risk limits to be set for each derivative portfolio and for each counterparty, subject to further specifications. Limits for CCR are set within the general risk management framework for counterparty limits.
These limits take into account a range of factors, including the mark-to-market of transactions and the potential future exposure of transactions. The monitoring of these limits for CCR (pre-settlement stage) takes place on a daily basis.
Credit concentration risk bCredit concentration risk is the risk of loss arising from large exposures, relative to the bank’s total risk exposure, to a single counterparty or to counterparties that are positively and highly correlated. Positively correlated counterparties are counterparties whose credit quality moves in the same direction under similar circumstances. As limiting excessive concentrations is fundamental to our credit risk strategy, we aim to keep the credit risk portfolio sufficiently granular and diversified.
To avoid excessive credit risk concentrations, Risk Management sets maximum levels for subgroups in the following categories:
Å Single counterparty and groups of related counterparties (counterparty concentration);
Å Countries (geographic concentration); Å Industry sectors (industry concentration).
Counterparty concentrationCounterparty concentration credit risk is the risk of loss arising from relatively large exposures to counterparties belonging to the same risk group. The One Obligor Exposure (OOE) is the exposure to a risk group and includes all drawn and undrawn facilities granted, plus all indirect exposure to the risk group, including guarantees and any other recourse claims. A risk group is an interrelated group of counterparties with a high degree of dependency on each other due to a control relationship. This control relationship may be due to direct or indirect majority interests being held by the same shareholder or group of shareholders. Counterparty credit concentration risk is measured by the OOE and the Economic Capital (EC) per counterparty. The bank limits its counterparty credit risk by setting OOE and EC limits. Additionally, all credit applications with an OOE and/or EC above a certain threshold are reviewed by the Executive Board.
IntroductionStrategy and perform
anceLeadership &
governanceAnnual Financial Statem
ents 2019Other
Risk, funding & capital

ABN AMRO Bank Annual Report 2019
IntroductionStrategy and perform
anceRisk, funding &
capitalLeadership structure
GovernanceAnnual Financial Statem
entsOther
IntroductionStrategy and perform
anceLeadership &
governanceAnnual Financial Statem
ents 2019Other
52
Risk, funding & capital
Risk, funding & capital / Risk, funding & capital management / Credit risk management
Geographic concentrationABN AMRO has branches and subsidiaries located outside the Netherlands, as well as clients who operate internationally. Consequently the bank is exposed to country risk, which is the risk of credit losses arising from country-specific events or circumstances. Management of country risk focuses on cross-border risk, which includes the risk that funds, goods or services cannot be transferred out of a country as a result of actions by local authorities in that country or other events. These risks are managed by setting country credit limits, based on individual country analyses by economic, compliance and country risk experts. Country limits are reviewed at least once a year. Each country also has an internal credit rating, which is reviewed and approved twice a year and is an important factor in managing country concentration risks. As the Netherlands is our home country, it is not included in any concentration risk appetite statement or setting of credit limits.
Industry concentrationIndustry concentration risk is the risk of loss arising from a relatively large credit exposure to counterparties active in a single industry. Industry concentration risk arises when deterioration in a specific industry has an effect on all credit exposures relating to that industry. ABN AMRO manages its industry concentrations by setting limits on economic capital (EC) for credit risk for each industry as a percentage of total EC for credit risk. In addition to the EC limits, EC concentration checkpoints are set to facilitate timely and sufficient management interventions so as to avoid limits being breached.
Credit risk mitigationCredit risk mitigation techniques are used by the bank to reduce the credit risk associated with its credit exposures. Such techniques relate mainly to collateral management and guarantees, offsetting financial assets and liabilities, and enforcing master netting agreements or similar instruments.
Credit risk mitigation techniques themselves entail risks and, as such, have to meet certain requirements so that they can be used effectively and in line with the bank’s risk appetite. For this reason, ABN AMRO has established mandatory, bank-wide policies governing the use and management of credit risk mitigation techniques. These are in line with regulatory requirements, as well as with the needs of the bank and its clients. These bank-wide policies provide the overarching rules to be met by business-specific procedures and processes related to credit risk mitigation.
Collateral management and guaranteesCollateral represents assets with material value that have been received by (or pledged to) the bank to secure obligations under a credit facility or other exposure. To be effective, such security must give the bank the right to
appropriate and liquidate collateral on time and without impediment so that losses on the exposure at default are minimised.
In addition to minimising exposure risk, eligible collateral can also reduce the regulatory and economic capital the bank is required to hold as a buffer for unexpected losses. The Capital Requirements Regulation prescribes the criteria that collateral must meet to become eligible for capital reduction. These criteria, which provide for legal effectiveness and for the enforceability, valuation and monitoring of collateral, are aimed at the effective and timely realisation of collateral.
Accounting policies for offsetting financial assets and liabilities bFinancial assets and liabilities are offset and the net amount is reported on the EU IFRS balance sheet if there is a legally enforceable right to set off the recognised amounts and there is an intention either to settle on a net basis or to realise the asset and settle the liability simultaneously. The bank applies netting to debtor and creditor balances, such as current accounts, where offsetting is justified by formal agreement with the client, provided they meet the applicable criteria.
Accounting policies for enforceable master netting agreements or similar instruments bEnforceable master netting arrangements take into account all agreements containing conditions that allow offsetting in the event of default. In addition, agreements are enforceable if the bank has a legally enforceable right to offset and no ability and/or intention to realise the asset and settle the liability simultaneously. These arrangements include derivative clearing agreements, global master repurchase agreements and global master securities lending agreements.
Forborne, past due and credit loss allowances bLoans at risk are primarily exposures for which there are signs indicating that the counterparty may become credit-impaired in the future. Loans at risk are classified into different risk categories for individual counterparties and into days-in-arrears buckets for groups of aggregated counterparties in order to optimise monitoring and review of these loans.
Forbearance bForbearance is the process of making concessions to clients who are or will soon be experiencing financial difficulty, with the intention of bringing them back within their payment capacity. A forborne asset is any contract that has been entered into with a counterparty who is in or about to face financial difficulty, and that has been
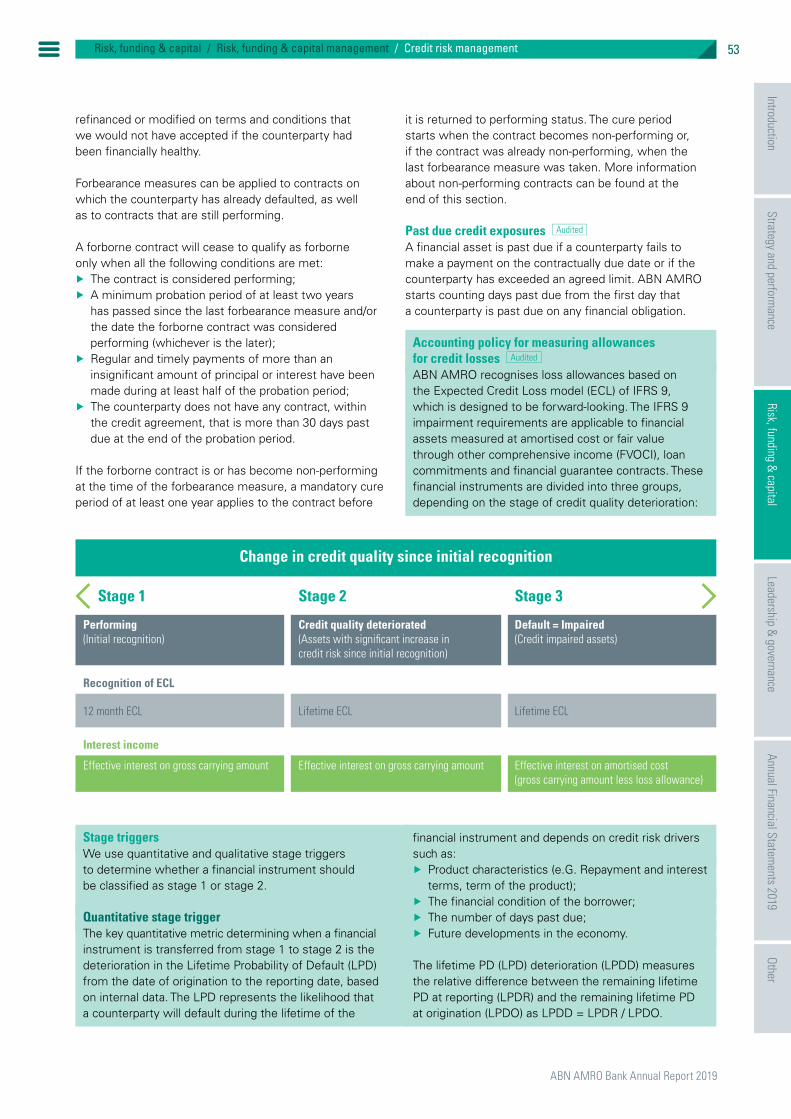
ABN AMRO Bank Annual Report 2019
53Risk, funding & capital / Risk, funding & capital management / Credit risk management
refinanced or modified on terms and conditions that we would not have accepted if the counterparty had been financially healthy.
Forbearance measures can be applied to contracts on which the counterparty has already defaulted, as well as to contracts that are still performing.
A forborne contract will cease to qualify as forborne only when all the following conditions are met:
Å The contract is considered performing; Å A minimum probation period of at least two years has passed since the last forbearance measure and/or the date the forborne contract was considered performing (whichever is the later);
Å Regular and timely payments of more than an insignificant amount of principal or interest have been made during at least half of the probation period;
Å The counterparty does not have any contract, within the credit agreement, that is more than 30 days past due at the end of the probation period.
If the forborne contract is or has become non-performing at the time of the forbearance measure, a mandatory cure period of at least one year applies to the contract before
it is returned to performing status. The cure period starts when the contract becomes non-performing or, if the contract was already non-performing, when the last forbearance measure was taken. More information about non-performing contracts can be found at the end of this section.
Past due credit exposures bA financial asset is past due if a counterparty fails to make a payment on the contractually due date or if the counterparty has exceeded an agreed limit. ABN AMRO starts counting days past due from the first day that a counterparty is past due on any financial obligation.
Accounting policy for measuring allowances for credit losses bABN AMRO recognises loss allowances based on the Expected Credit Loss model (ECL) of IFRS 9, which is designed to be forward-looking. The IFRS 9 impairment requirements are applicable to financial assets measured at amortised cost or fair value through other comprehensive income (FVOCI), loan commitments and financial guarantee contracts. These financial instruments are divided into three groups, depending on the stage of credit quality deterioration:
Recognition of ECL
Interest income
Effective interest on gross carrying amount Effective interest on gross carrying amount Effective interest on amortised cost(gross carrying amount less loss allowance)
12 month ECL Lifetime ECL Lifetime ECL
Performing(Initial recognition)
Credit quality deteriorated(Assets with significant increase in credit risk since initial recognition)
Default = Impaired(Credit impaired assets)
Stage 1 Stage 2 Stage 3
Change in credit quality since initial recognition
Stage triggersWe use quantitative and qualitative stage triggers to determine whether a financial instrument should be classified as stage 1 or stage 2.
Quantitative stage triggerThe key quantitative metric determining when a financial instrument is transferred from stage 1 to stage 2 is the deterioration in the Lifetime Probability of Default (LPD) from the date of origination to the reporting date, based on internal data. The LPD represents the likelihood that a counterparty will default during the lifetime of the
financial instrument and depends on credit risk drivers such as:
Å Product characteristics (e.G. Repayment and interest terms, term of the product);
Å The financial condition of the borrower; Å The number of days past due; Å Future developments in the economy.
The lifetime PD (LPD) deterioration (LPDD) measures the relative difference between the remaining lifetime PD at reporting (LPDR) and the remaining lifetime PD at origination (LPDO) as LPDD = LPDR / LPDO.
IntroductionStrategy and perform
anceLeadership &
governanceAnnual Financial Statem
ents 2019Other
Risk, funding & capital

ABN AMRO Bank Annual Report 2019
IntroductionStrategy and perform
anceRisk, funding &
capitalLeadership structure
GovernanceAnnual Financial Statem
entsOther
IntroductionStrategy and perform
anceLeadership &
governanceAnnual Financial Statem
ents 2019Other
54
Risk, funding & capital
Risk, funding & capital / Risk, funding & capital management / Credit risk management
If the LPD deterioration of an exposure is above a predefined threshold, the lifetime PD is considered to be significantly deteriorated, the exposure is transferred to stage 2 and impairment allowances equal to the lifetime expected credit loss are recognised. If the LPD deterioration subsequently reduces and falls below the threshold, the client is transferred back to stage 1. When determining the thresholds, ABN AMRO distinguishes between various portfolios within consumer lending, residential mortgages and corporate loans. A specific threshold is calculated for each portfolio, based on a statistical method. Due to limitations in the availability of historical data, ABN AMRO currently uses the 12-month PD as a proxy for LPD. We consider deterioration in the 12-month PD to be appropriately representative of LPD deterioration. The table below reflects the range of LPD deterioration thresholds for transfers to stage 2 that applied within consumer lending, residential mortgages and corporate loans as at 31 December 2019.
Range of PD deterioration thresholds b
Qualitative stage triggersThe bank transfers a financial instrument from stage 1 to stage 2 if the instrument meets any one of the following qualitative triggers:
Å Forborne status of a borrower; Å Watch status of a borrower. ABN AMRO assigns the watch status to counterparties with an increased credit risk. This process allows for intensive monitoring, early detection of deterioration in the credit portfolio and appropriate follow-up measures;
Å The client has become non-performing (but is not in default);
Å A delinquency-based regulatory backstop is in place, such that the credit risk of financial assets that are more than 30 days past due will be assumed to have significantly increased.
A transfer to stage 3 will always be the result of the default of a financial instrument. A default is considered to have occurred when one of the default triggers (e.g. unlikelihood of payment, distressed debt restructuring, bankruptcy or fraud) has occurred. Materiality thresholds are applied for counterparties transferring to stage 3 (minimum past due amount of EUR 500 for programme lending and EUR 5,000 for non-programme lending). Below these thresholds, amounts are reported as >90 days past due. Our definitions of default and impaired are aligned.
Stage 1 Stage 2 Stage 3
Default trigger hit?
Lifetime PD significantly deteriorated?
Watch listForbearance (but not impaired)
Days Past Due (DPD)
Asset in scope? YES
YES
YES
YES
30-900-30
NO
NO
NO
Favourable changes in credit risk are recognised consistently with unfavourable changes in credit risk, except when applying a probation period for financial instruments that are forborne or more than 30 days past due.
Å Forborne financial instruments are transferred back from stage 2 to stage 1 only after a two-year probation period and if exposure is not classified as non-performing. Stage 3 forborne instruments transfer back to stage 2 consistently with other defaulted instruments;
Product class ThresholdConsumer lending 3.1-8.3Residential mortgages 1.2-2.8Corporate loans 1.7-5.0

ABN AMRO Bank Annual Report 2019
55Risk, funding & capital / Risk, funding & capital management / Credit risk management
Å For financial instruments that are 30 days past due, a three-month probation period is applied for transfers from stage 2 to stage 1.
Calculation methodThe amount of expected credit loss allowances is based on the probability-weighted present value of all expected cash shortfalls over the remaining life of the financial instrument for both on- and off-balance sheet exposures. ABN AMRO distinguishes between two types of calculation methods for credit loss allowances:
Å Individual Lifetime ECL (LECL) for credit-impaired (stage 3) financial instruments with exposures above EUR 3 million;
Å Collective 12-month ECL (stage 1) and LECL (stage 2 and 3) for financial instruments that have similar credit risk characteristics (e.g. residential mortgages, consumer loans and SME loans) are clustered in portfolios and collectively assessed for impairment losses. A collective impairment calculation approach based on individual parameters is also applied to stage 3 exposures below EUR 3 million. ABN AMRO has models to quantify the Probability of Loss (PL), Loss Given Loss (LGL) and Exposure at Loss (EAL) for the purpose of calculating the collective 12-month ECL and LECL for these financial instruments.
Lifetime expected credit lossABN AMRO defines the lifetime of credit as the maximum contractual period over which the bank is exposed to credit risk and not a longer period, even if that longer period is consistent with business practice. For some contracts, such as overdraft facilities or credit cards, no end date is specified or amounts can be contractually withdrawn by the lender at short notice. In these cases, ABN AMRO uses behavioural maturity models that rely on historical client behaviour to determine future expected exposures.
Forward-looking informationFor expected credit loss calculations, ABN AMRO uses three different scenarios of future economic developments: a baseline (or most likely) scenario, a negative scenario and a positive scenario. The three scenarios are incorporated into the expected credit loss calculation and risk stage determination in a probability-weighted manner (at 31 December 2019: baseline 60%, up 15%, down 25%). ABN AMRO has also aligned its forward-looking scenarios with those used in the budgeting process. The baseline scenario is based on Group Economics’ regular macroeconomic and interest-rate forecasts for the current and next year and is reviewed at each reporting date. The Group Economics analysts consider a range of external sources in order to develop the
forecasts for the different macroeconomic variables (MEVs) required, including GDP, the unemployment rate, the housing price index, oil prices and 3-month Euribor. They check their views and assumptions against external views and assumptions. The preliminary forecasts for the different countries undergo a challenge process to ensure they are reasonable and consistent. To reduce the risk of biased forecasts, the final MEVs are again checked against external forecasts and then submitted to the Scenario and Stress-testing Committee for approval. Both alternative scenarios reflect the lower and upper levels for the different macroeconomic variables, whereby the whole range is meant to cover roughly 85% of the possible economic future. For most MEVs, Group Economics uses its standard deviations. These are calculated on the basis of realised figures in the past few decades. The extent to which MEVs actually deviate over time from their historical means reflects the past materialisation of negative and positive risks in the economy. A probability of about 85% roughly corresponds to a standard deviation of plus and minus one and a half. For the purpose of scenario analysis, the forecasts are extended to a five-year period. It is assumed that MEVs gradually move to their potential or equilibrium values after the second year. For each specific portfolio, a selection of variables is made for calculating the expected credit loss, based on statistical relevance and expert judgment.
Non-performing versus default and impairedFor reporting purposes ABN AMRO distinguishes between performing and non-performing exposures. The criteria for non-performing exposures are broader than those applying to default.
An exposure is qualified as non-performing if it is: Å in default; or Å a performing forborne exposure in a probation period that was classified as non-performing at the time of the latest forbearance measure or as a consequence of entering the forbearance status and on which an additional forbearance measure is imposed; or
Å a performing forborne exposure in a probation period that was classified as non-performing at the time of the latest forbearance measure or as a consequence of entering the forbearance status and becomes more than 30 days past due.
An exposure is categorised as non-performing for the entire amount, taking no account of any available collateral, and including the following revocable and irrevocable off-balance sheet items:
IntroductionStrategy and perform
anceLeadership &
governanceAnnual Financial Statem
ents 2019Other
Risk, funding & capital

ABN AMRO Bank Annual Report 2019
IntroductionStrategy and perform
anceRisk, funding &
capitalLeadership structure
GovernanceAnnual Financial Statem
entsOther
IntroductionStrategy and perform
anceLeadership &
governanceAnnual Financial Statem
ents 2019Other
56
Risk, funding & capital
Risk, funding & capital / Risk, funding & capital management / Market risk management
Within ABN AMRO, market risk is present in both the banking book and trading book.
Market risk in the banking book bMarket risk in the banking book is the risk that the economic value of equity or the income of the bank will decline because of unfavourable market movements. The following market risks are present in the banking book:
Å Interest rate risk: the risk of losses in the economic value of equity or the bank’s net interest income (NII) due to unfavourable yield curve developments, including changes in the volatility of the yield curve;
Å Credit spread risk: the risk of losses due to adverse movements in the credit spread of assets. The main source is from bonds held for liquidity purposes;
Å Funding spread risk: the risk of losses due to adverse movements in the term structure of rates at which ABN AMRO can fund itself – expressed as a spread to a benchmark such as Euribor;
Å Equity risk: the risk of losses due to adverse movements in equity prices, dividends and volatilities. Equity positions can be taken in strategic partnerships and joint ventures, positions in private equity and positions where debt held by the bank has been converted into equity as part of a restructuring process;
Å Property risk: the risk arising from adverse movements in property prices; and
Å Foreign exchange risk: the risk arising from adverse movements in FX spot and forward rates and/or FX volatility. It arises for operational reasons where it is inefficient to hedge exposures as they arise.
Market risk in the banking book consists predominantly of interest rate risk, followed by credit spread risk, funding spread risk and FX risk.
Interest rate risk in the banking bookIn order to model and measure interest rate risk, assumptions are made about client behaviour, most importantly with respect to the maturity of savings and the prepayment of mortgages. These assumptions influence the anticipated interest cash flow pattern. Interest rate risk is continuously managed in line with the risk appetite as the profile of assets and liabilities on the balance sheet can change if client behaviour changes.
The main sources of interest rate risk are: Å The maturity mismatch between assets and liabilities. ABN AMRO provides mortgages and commercial loans with fixed interest terms. These assets are funded by non-maturing deposits and wholesale funding with a shorter average interest maturity than the assets;
Å Client behaviour, which determines the maturity profile of some of our products. As we use models to predict this behaviour, we are exposed to model risk, i.e.
Market risk management
Å Loan commitments; Å Financial guarantees at risk of being called, including the underlying guaranteed exposure that meets the criteria of non-performing;
Å Any other financial commitments.
The non-performing classification typically ends when the counterparty is no longer in default. For non-performing exposures that are not in default, a cure period of at least 12 months applies from the date the exposure became non-performing. After this 12-month period, an assessment is made to establish whether the improvement of the credit quality is factual and permanent (including a requirement for no past due amounts). This is comparable to the out-of-default assessment.
Cured financial assetsWhen a credit impaired financial asset cures, the interest that was previously unrecognised is reported as an impairment release in the impairment charge rather than as a credit to the interest income calculated using the effective interest method.
Write-offA loan is written off against the related loan loss allowance if the likelihood of repayment falls below a certain point or the financial asset reaches a certain stage of delinquency.
Å For non-programme lending, a write-off must be taken if all possible means of recovery have been exhausted and it has become clear that there is a low probability of recovering the debt, either in part or full.
Å Most of the programme lending facilities are automatically written off after 1,080 days in default.
Such loans are written off after all the necessary procedures have been completed and the amount of the loss has been determined. Subsequent recoveries of amounts previously written off are credited to impairment charges on loans and advances in the income statement.

ABN AMRO Bank Annual Report 2019
57Risk, funding & capital / Risk, funding & capital management / Market risk management
to losses from decisions based on incorrect output of models and resulting from errors in the development, implementation or use of such models.
Key assumptions for modelling client behaviourFrom an interest rate risk perspective, the following aspects of client behaviour are the most important:
Å Client behaviour with respect to early redemption of residential mortgages. This has a significant impact on the average interest maturity of the mortgage portfolio. Clients have the option to fully or partially prepay mortgages before maturity. Prepayments can be triggered by, for example, relocation, redemption or curtailment. An important driver of prepayments is the interest rate incentive, i.e. the difference between a client’s current mortgage rate and the prevailing mortgage rates. Future mortgage rates are simulated using a Monte Carlo approach. In addition to the interest rate incentive, account is also taken of other drivers such as loan age, seasonality and house price developments;
Å Client acceptance of the volume offered and the deviation between the offered rate and the actual coupon on an offered residential mortgage;
Å Client behaviour with respect to non-maturing deposits that are callable on demand. Future client rates for savings and current accounts are modelled using a replicating portfolio model. Modelled client rates depend on current or lagged yield curves and funding costs. A maximum maturity of 10 years is assumed. The resulting duration depends on product type and client behaviour. The average duration for retail portfolios is around 3 years, well below the regulatory 5-year cap.
The metrics used for banking book risks are dependent upon the assumptions made in the behavioural models. Models must therefore be based on extensive research, including historical data on observed client behaviour. Models must be independently validated and approved by the mandated risk committees. Models are periodically assessed to determine whether they behave appropriately and are statistically sound; if required, they are adjusted.
Risk measurement for interest rate riskFor management purposes, the interest rate risk position is reported to the Asset & Liability Committee (ALCO) on a monthly basis. ALCO reporting includes both earnings and value metrics, including Net Interest Income (NII) at Risk, Present Value of 1 basis point (PV01), Economic Value of Equity (EVE) at Risk and economic capital for market risk in the banking book. These are complemented with stress testing and scenario analysis, which are used to ensure a comprehensive approach to risk management and to identify potential weaknesses. Stress testing and scenario analysis go beyond determining the impact of alternative developments of interest rates. Assumptions with respect to modelling and client behaviour are also
tested. A combination of market and product floors is applied. These floors are periodically reviewed. Most of the abovementioned metrics are also included in the ERM report submitted monthly to the Executive Board.
NII-at-Risk is the difference in NII between a base scenario and an alternative scenario. In addition to the regulatory prescribed scenarios, the internal metric is defined as the worst outcome of the following scenarios: a gradual increase or decrease in interest rates by 200bps, measured over a one-year period, and an instantaneous increase or decrease of 100bps. NII-at-Risk includes all expected cash flows, including commercial margins and other spread components, from all interest rate-sensitive assets, liabilities and off-balance sheet items in the banking book. The NII-at-Risk calculation contains assumptions about the future balance sheet, including the reinvestment of maturing positions.
The PV01 measures value changes resulting from a 1bp parallel shift of the yield curve. We also measure the value sensitivity to changes in individual term points on the yield curve.
EVE-at-Risk is the loss in economic value of equity as a result of various yield curve shocks. As well as the regulatory prescribed shocks, the EVE-at-risk is based on the following internal shocks: bow up, bow down, steepening, flattening and tilt short-end up and down. The impact is calculated for cash flows from all interest-bearing assets, liabilities and off-balance sheet items in the banking book. An assumption of a run-off balance sheet is made, where banking book positions amortise and are not replaced by new business. The projected cash flows include commercial margins and other spread components and are discounted at the risk-free rate.
Economic capital for market risk in the banking book is calculated using a parametric Monte Carlo simulation model that determines the economic capital needed to absorb losses due to adverse movements in interest rates, client behaviour for mortgages and non-maturing deposits, volatility, credit spreads and foreign exchange rates.
Credit spread risk in the banking bookCredit spread risk for the liquidity portfolio is measured as the impact on economic value of a 1bp change in spreads to a swap rate. The sensitivity is measured for individual term points, as well as for a parallel shift of the curve.
Funding spread riskFunding spread movements can be due to changes in, for example, the perceived credit quality of ABN AMRO, changes in the competitive environment or changes in liquidity premiums. They may be entity-specific or systemic in nature. If funding spreads widen, it costs more to fund assets on the balance sheet. Unless this increased spread
IntroductionStrategy and perform
anceLeadership &
governanceAnnual Financial Statem
ents 2019Other
Risk, funding & capital

ABN AMRO Bank Annual Report 2019
IntroductionStrategy and perform
anceRisk, funding &
capitalLeadership structure
GovernanceAnnual Financial Statem
entsOther
IntroductionStrategy and perform
anceLeadership &
governanceAnnual Financial Statem
ents 2019Other
58
Risk, funding & capital
Risk, funding & capital / Risk, funding & capital management / Market risk management
is passed on to clients by increasing client rates, projected net interest income will decrease. The funding spread risk is measured using an NII-at-risk approach where the funding spread increases.
Foreign exchange riskForeign exchange risk is managed within the bank by ALM and Treasury. The risk is measured by the open currency position, which is the aggregated net position per currency, except for the EUR currency. Both for assets and for liabilities USD is the largest non-EUR exposure.
Market risk management for the banking bookABN AMRO has in place a detailed risk management framework to identify, measure and control market risk in the banking book. This framework provides assurance that the banking book activities remain consistent with the bank’s strategy to pursue a moderate risk profile. The goal of interest rate risk management is to protect current and future NII from adverse yield curve movements. The day-to-day management is delegated from the Asset & Liability Committee to Asset and Liability Management, while Treasury is responsible for the execution. This forms the first line of defence. Market & ALM/T Risk acts as the second line of defence.
The risk appetite is articulated in terms of net interest income for one- and two-year periods, the economic value of equity and the economic capital for market risk in the banking book, and expresses the maximum loss the bank is willing to accept. The risk appetite is cascaded into a limit framework.
ABN AMRO uses a combination of portfolio (macro) hedges and specific asset or liability (micro) hedges to swap fixed interest rates for floating interest rate positions. Micro hedges are used to swap fixed funding transactions and fixed investments in the liquidity buffer for floating interest rate positions. In addition, macro hedging is applied in order to align with the bank’s strategy to contribute to a stable NII while protecting the economic value of equity.
Market risk in the trading bookPositions held with trading intent and hedges for positions held with trading intent must be included in the bank’s trading book. The Central Trading Risk policy describes the positions included in the trading book and the criteria for transferring risk and positions between the trading and banking books (in line with Article 104, CRR). As part of its business strategy, ABN AMRO facilitates client orders, acts as a market maker in key markets and provides liquidity to clients, including institutional investors and private clients. Market risk in the trading book is the risk of losses in market value due to adverse market movements. The following market risks are inherent in the trading book:
Å Interest rate risk, arising from adverse changes in interest rate risk curves and/or interest rate volatilities;
Å Credit spread risk, arising from adverse changes in the term structure of credit spreads and/or from changing credit quality of debt securities or CDS reference entities, with an impact on default probabilities;
Å Equity risk, arising from adverse changes in equity prices, dividends and volatilities;
Å Commodity risk, arising from adverse changes in commodity prices;
Å Foreign exchange risk, arising from adverse changes in FX spot and forward rates and/or FX volatility.
Market risk management for the trading book bABN AMRO has in place a detailed risk management framework to identify, measure and control market risk in the trading book. This framework provides assurance that the bank’s trading activities are consistent with its client-focused business strategy and the objective to maintain a moderate risk profile. In accordance with the strategy, the Business Risk Committee Trading annually approves trading mandates, which define the nature and amount of the permitted transactions and risks, and the associated constraints. The Business Risk Committee Trading is a subsidiary committee of the Group Risk Committee.
Market risk measurement for the trading book bABN AMRO measures and manages market risk in the trading book on a daily basis. The key metrics used are economic capital, regulatory capital, Value-at-Risk (VaR), Stressed VaR (SVaR) and Incremental Risk Charge (IRC), together with a wide array of stress and scenario tests, sensitivity measures, concentration limits and notional limits. These metrics are measured and monitored. Appropriate limits are set at bank level in the risk appetite statement and at bank and business-line levels in the limit framework, in line with the general risk principles in the Central Trading Risk policy.
Metrics and models are managed, reviewed, assessed and, if required, adjusted in a similar way as in the banking book. Other important tools to ensure the adequacy of the models, alongside the formal validation and review of models, are the daily explanation of risk reporting figures, periodic portfolio reviews and regular back-testing.
Value at RiskABN AMRO uses the historical simulation VaR methodology as one of its primary risk measures. The VaR for market risk quantifies, with a one-sided confidence level of 99%, the maximum one-day loss that could occur due to changes in risk factors if positions remain unchanged for a period of one day. The VaR also incorporates market data movements for specific movements in the underlying issuer of securities. The impact of historical market movements on today’s portfolio is estimated on the basis of equally weighted market movements observed in the previous

ABN AMRO Bank Annual Report 2019
59Risk, funding & capital / Risk, funding & capital management / Market risk management
300 days, using a full revaluation method for the majority of risk factors. For each risk factor it is decided whether relative or absolute changes from history are representative for forecasting the next day. The bank uses the VaR with a one-day horizon for internal risk measurement, control and back-testing, and the VaR with a ten-day horizon to determine regulatory capital. The latter is derived by scaling the one-day VaR by the square root of ten.
The daily VaR is back-tested against the actual mark-to-market changes calculated for each subsequent trading day, as well as against hypothetical mark-to-market changes assuming no trading activities over the same horizon. The number of outliers is used to assess the reliability of the VaR model. The model’s back-testing performance is satisfactory.
Stressed VaRThe purpose of the SVaR is to replicate a VaR calculation that would be generated on the bank’s current portfolio with inputs calibrated to historical data for a continuous 12-month period of significant financial stress relevant to the bank’s portfolio. To calculate the SVaR, ABN AMRO uses the same model as used for the VaR (historical simulation). The current historical data period includes the credit crisis of 2008 and is reviewed at least annually. In this annual review, the VaR is approximated for the current portfolios over a long historical period.
Incremental Risk ChargeBy calculating the IRC, ABN AMRO calculates an estimate of the default and migration risks for credit products in the trading book over a one-year capital horizon, with a 99.9% confidence level. Potential profits and losses over the one-year time horizon are created by simulating scenarios showing how the issuer’s credit ratings may change (including possible defaults), taking correlations between different issuers into account, and repricing the positions. The underlying model for the rating migrations and defaults is a t-copula model. The simulated scenarios correspond to an instantaneous shock over the one-year period; in this way, ABN AMRO uses a one-year liquidity horizon for all its positions under the scope of the IRC model. The average liquidity horizon is therefore currently also one year. Rating transitions and defaults are dependent upon individual issuer rating transition
probabilities and correlations between issuer migrations. For the individual transition matrices, data from external vendors are used.
Economic capitalThe calculation of economic capital for market risk in the trading book is based on a daily Value-at-Risk (VaR) market risk measure and historical scenarios simulating stress events such as ‘Black Monday’ and the financial markets crisis.
Stress testing and scenario analysisStress testing and scenario analysis are designed to focus specifically on the impact of tail events that are outside the VaR confidence interval. We perform daily stress tests for large movements in risk factors. Scenario analyses are also conducted frequently to evaluate the impacts of extreme market events that cover multiple risk factors, and the results of these tests are monitored. These scenarios can be based on historical or hypothetical events, or on a combination of the two.
Valuation adjustmentsFor the trading book, we take into account adjustments for counterparty risk on our clients (Credit Valuation Adjustment), ABN AMRO funding costs (Funding Valuation Adjustment) and ABN AMRO credit risk (Debt Valuation Adjustment).
Trading book positions are subject to prudent valuation standards in accordance with regulatory requirements (Article 105, CRR). The prudent value is derived from IFRS accounting fair value and includes additional potential value adjustments.
IntroductionStrategy and perform
anceLeadership &
governanceAnnual Financial Statem
ents 2019Other
Risk, funding & capital

ABN AMRO Bank Annual Report 2019
IntroductionStrategy and perform
anceRisk, funding &
capitalLeadership structure
GovernanceAnnual Financial Statem
entsOther
IntroductionStrategy and perform
anceLeadership &
governanceAnnual Financial Statem
ents 2019Other
60
Risk, funding & capital
Risk, funding & capital / Risk, funding & capital management / Operational risk management
Operational risk is defined as the risk of loss resulting from inadequate or failed internal processes, people or systems or from external events. This definition is in line with the definition by the Basel Committee on Banking Supervision. Operational risk is often also referred to internally as non-financial risk, covering risks such as HR risk, IT risk, compliance risk, legal risk, change risk, tax risk and model risk.
ABN AMRO has a converged approach to operational risk management, providing the business with a clear and fair view on the operational risks that the bank faces and the way these should be managed. For this purpose, ABN AMRO has in place a framework that enables operational risks to be managed within a moderate risk profile. The operational risk management department sets the framework for the bank in line with the requirements for the Advanced Measurement Approach (AMA). This framework evolves and is kept up-to-date as experience gained is incorporated. The main components of the ORM framework are schematically shown in the following figure.
Framework for operational risk management
Management Control Statement
Business-as-usual (including scenarios) Changes
Operational risk events Effectiveness of controls Key Risk Indicators
Operational risk assessments
Strategic risk assessment
Operational risk management overview
Monitoring
Operational risk responses
Operational risk appetite Reporting Operational risk capital
Mitigation Avoidance Transfer Risk acceptance
Operational risk management approachEmployees are expected and encouraged to be alert to and aware of operational risks in their day-to-day work. Operational risk management is strongly embedded in daily business processes. First-line-of-defence managers are responsible for managing their operational risks and are supported by operational risk managers. The latter provide support and work in close cooperation with other second-line parties, including Compliance, Legal, Model Risk Management and Crime & Integrity, which also use the operational risk framework. This reflects the bank’s
view that managing operational risk requires a concerted effort from all these departments. Operational risk is incorporated into risk reports at various levels within the bank, up to the Executive Board and Supervisory Board.
Framework for operational risk management Assessments and monitoring activities are at the heart of the operational risk management framework. Business managers perform assessments to identify and assess risks, including scenarios for rare events. Assessments are executed for business-as-usual activities and for new initiatives and provide support by creating awareness of these risks throughout the organisation. If a risk exceeds the risk appetite, the business manager takes appropriate action. At least once a year, business managers monitor the effectiveness of the controls in their area of responsibility. Controls are strengthened, if necessary. Key Risk Indicators are monitored to signal adverse risk developments.
Despite all the preventive measures in place, incidents and operational losses are inherent to doing business. The bank systematically tracks information and analyses such events in order to take appropriate action. Action taken may consist of strengthening controls or avoiding risks by closing down or not starting operations. Management can also decide to consciously accept a certain risk or transfer a risk to insurance companies. The global insurance programme in place is reviewed annually by the Group Risk Committee.
Once a year, senior management reviews the strategic business objectives and all measures taken from a risk perspective. At the end of each year, based on the effectiveness of the control environment and on the strategic risk outlook, senior management signs a Management Control Statement, which is included at the end of this section.
Specific operational risk areasThe bank has in place a dedicated organisation for operational risk areas that require specific knowledge, such as information security and business continuity management.
Information security Information is one of the bank’s most valuable assets. ABN AMRO clients rely increasingly on digitalisation and on-line banking and hence on the proper functioning of the bank’s IT systems. These systems run in complex information infrastructures, connecting the bank’s networks to public networks. Banking processes and their supporting information systems are consequently inherently vulnerable, with the result that the security of client data and services can be threatened. Examples
Operational risk management x

ABN AMRO Bank Annual Report 2019
61Risk, funding & capital / Risk, funding & capital management / Operational risk management
of such threats include computer-assisted fraud, unauthorised disclosure of confidential information, virus infections and ransomware, computer hacking and denial of service attacks (DDoS).
In recognition of the vital importance of protecting its information and its associated assets, such as systems and infrastructure, at all times, ABN AMRO has established a structured IT risk management approach to ensure the confidentiality, integrity and availability of information. This approach defines the organisational framework, management and staff responsibilities, and the information security directives that apply to ABN AMRO, its vendors and third parties with whom the bank exchanges information.
Business continuity management Business continuity management ensures organisational resilience at all levels of the ABN AMRO organisation and the ability to respond effectively to threats, thus safeguarding stakeholders’ interests and the organisation’s reputation, brand and value-creating activities. Business continuity focuses on:
Å Analysing threats and the business impact of calamities and crises;
Å Determining the strategies and solutions to be applied in the event of a crisis – such as business recovery, crisis management and IT disaster recovery planning – so as to enable continuity of business operations;
Å Documenting, periodically assessing and testing of these strategies and solutions.
Operational risk measurementIn line with the Advanced Measurement Approach (AMA), the bank has in place an internally developed model to define the required own funds for operational risk (operational risk capital). In 2019 ABN AMRO received unconditional approval from our regulator to use this model (conditional approval was granted in January 2017). The AMA model predicts potential operational risk losses (annually aggregated) by combining a forward-looking and a backward-looking view on operational risk events.
Risk & control self-assessments and scenario analyses provide a forward-looking view: experts build scenarios to understand future risks and estimate the severity of potential losses that could occur. The resulting estimates are used as data input for the model. In these scenarios, experts take into consideration the quality of the bank’s control environment, its processes, systems and people, as well as external circumstances and changes that may have an influence. The current relevance of the estimations (and hence of the capital) is safeguarded by reconsidering the scenarios regularly, but also when major changes in the risk profile occur.
Alongside these expert-based estimations, the model also uses backward-looking historical loss data from ABN AMRO and the banking industry. Historical loss data are included as these are assumed to have predictive power for the future.
Capital for operational riskThe level of AMA capital is derived from the results of the model calculations. The bank applies a 99.95% confidence level to the annually aggregated losses when calculating the operational risk economic capital, whereas a 99.9% confidence level is applied to calculate regulatory operational risk capital. The adequacy of the capital levels is monitored on a quarterly basis; if issues occur – for example, regarding the reliability of data – add-ons can be applied.
IntroductionStrategy and perform
anceLeadership &
governanceAnnual Financial Statem
ents 2019Other
Risk, funding & capital

ABN AMRO Bank Annual Report 2019
IntroductionStrategy and perform
anceRisk, funding &
capitalLeadership structure
GovernanceAnnual Financial Statem
entsOther
IntroductionStrategy and perform
anceLeadership &
governanceAnnual Financial Statem
ents 2019Other
62
Risk, funding & capital
Risk, funding & capital / Risk, funding & capital management / Funding & liquidity risk management
Liquidity risk is the risk that actual and potential payments or collateral posting obligations cannot be met on a timely basis, or only at excessive costs. There are two types of liquidity risk:
Å Funding liquidity risk is the risk of not being able to accommodate both expected and unexpected current and future cash outflows and collateral needs because insufficient cash is available. Eventually, this can affect the bank’s daily operations or its financial condition;
Å Market liquidity risk is the risk that the bank cannot sell an asset in a timely manner at a reasonable market price due to insufficient market depth (insufficient supply and demand) or market disruption. Market liquidity risk includes the sensitivity in liquidity value of a portfolio due to changes in the applicable haircuts and market value. It also concerns uncertainty about the time required to realise the liquidity value of the assets.
StrategyLiquidityWe have a liquidity risk management framework in place that helps us maintain a moderate risk profile and safeguards the bank’s reputation from a liquidity perspective. This framework enables the bank to meet the regulatory requirements and its payment obligations at a reasonable cost, even under severely adverse conditions. We have formulated a set of liquidity risk metrics and limits to manage the bank’s liquidity position. By maintaining a smooth long-term maturity profile, limiting dependence on wholesale funding and holding a solid liquidity buffer in our main currencies, we maintain a prudent liquidity profile.
FundingABN AMRO’s main source of funding consists of deposits from Retail Banking, Private Banking, Commercial Banking and CIB clients. The remainder of our funding is raised largely through various long-term wholesale funding instruments. ABN AMRO’s strategy for wholesale funding derives from the bank’s objective to maintain a moderate risk profile. This strategy aims to optimise and diversify the bank’s funding sources in order to maintain market access and the targeted funding position. We aim to have a balance sheet with a diverse, stable and cost-efficient funding base.
The funding strategy takes the following guidelines into account:
Å Maintain market access by diversifying funding sources in different funding markets (Europe, the US and the Asia-Pacific region);
Å Continually monitor attractive funding opportunities and maintain strong relationships with the investor base through active marketing;
Å Optimise the balance between private placements and public benchmark deals;
Å Optimise funding costs within the targets set for volumes and maturities and manage credit curves in different funding programmes and currencies;
Å Optimise the planning and execution of funding in different market windows and currencies.
Risk management approach bThe natural maturity mismatch between loans and funding requires liquidity risk management. We consider maturity transformation to be an integral part of the bank’s business model, which is why we closely monitor our liquidity position and the resulting risks. We diversify our funding sources to maintain market access, and we diversify funding tenors to avoid a concentration of outflows. We also hold a portfolio of highly liquid assets that can be converted into cash in the event of unforeseen market disruptions, thus allowing us to meet payment and collateral obligations at all times.
Funding and liquidity risk is managed centrally. We incorporate liquidity costs into the pricing of our day-to-day business activities.
In managing the risks, a clear distinction is made between going-concern and contingency risk management.
Going-concern managementGoing-concern management entails management of the day-to-day liquidity position within specified limits. This allows us to meet payment obligations on a timely basis. The most important metrics we use are:
Å Stress testing: We conduct monthly and ad hoc stress tests in which we evaluate the impact of cash in- and outflows under plausible stress scenarios. Both market-wide and bank-specific stress scenarios are defined and analysed. The goal of stress testing is twofold. Firstly, it helps us to review our risk framework, i.e. the liquidity buffer size, risk appetite and limits. Secondly, it allows us to identify ways to reduce outflows in times of crisis;
Å Liquidity Coverage Ratio (LCR): The objective of the LCR is to assess the bank’s short-term resilience by ensuring sufficient high-quality liquid assets to survive a significant stress scenario lasting 30 calendar days;
Å Survival period: The survival period reflects the period that the bank’s liquidity position is expected to remain positive in an internal stress scenario in which wholesale funding markets deteriorate and retail and commercial clients withdraw a proportion of their deposits;
Funding & liquidity risk management

ABN AMRO Bank Annual Report 2019
63Risk, funding & capital / Risk, funding & capital management / Funding & liquidity risk management
Å Net Stable Funding Ratio (NSFR): The objective of the NSFR is to assess resilience over a longer time horizon by creating additional incentives for banks to fund their activities from stable sources of funding on an ongoing basis;
Å Loan-to-Deposit ratio (LtD): The LtD ratio measures the relationship between the loan book (Loans and advances customers) and deposits from clients (Due to customers). The ratio includes all client-driven loans and deposits, but excludes loans to and deposits from governments. The LtD ratio gives an indication of our dependence on wholesale funding for financing client loans. Due to the mandatory and collective Dutch pension savings schemes, mortgage loans outweigh client savings balances in the Netherlands, thus driving the LtD ratio above 100%.
Contingency risk managementContingency risk management aims to ensure that, in the event of either a bank-specific or general market stress event, the bank is able to generate sufficient liquidity to withstand a short- or long-term liquidity crisis.
Å Contingency Funding Plan: The Contingency Funding Plan (CFP) sets out the guidelines and responsibilities for addressing possible liquidity shortfalls in emergency situations. This only comes into effect if the liquidity position is threatened, or if strong indications exist that liquidity stress is imminent. The CFP is aligned with the Recovery Plan, as required by the regulators. It enables us to manage our liquidity without unnecessarily jeopardising business lines, while limiting excessive funding costs in severe market circumstances;
Å Collateral posting in the event of a rating downgrade: If ABN AMRO’s credit rating is downgraded, collateral requirements may increase. We monitor these potential additional collateral postings in the liquidity management framework;
Å Liquidity buffer: We hold a liquidity buffer to accommodate cash outflows during stress. This buffer consists of unencumbered, high-quality liquid assets, including government bonds, retained securities (RMBS and covered bonds) and cash.
IntroductionStrategy and perform
anceLeadership &
governanceAnnual Financial Statem
ents 2019Other
Risk, funding & capital

ABN AMRO Bank Annual Report 2019
IntroductionStrategy and perform
anceRisk, funding &
capitalLeadership structure
GovernanceAnnual Financial Statem
entsOther
IntroductionStrategy and perform
anceLeadership &
governanceAnnual Financial Statem
ents 2019Other
64
Risk, funding & capital
Risk, funding & capital / Risk, funding & capital management / Capital management
Capital management strategyThe primary objective of the capital management strategy is to ensure that capital adequacy requirements are met at all times and that sufficient capital is available to support the bank’s strategy. Capital is a necessary resource for doing business and defines the bank’s commercial possibilities. The balance between available and required capital is managed centrally to optimise the use of available capital. The basis of the capital management strategy is the bank’s risk appetite and its business plans. Other important factors taken into account when managing the capital position are expectations and requirements of external stakeholders (such as regulators, investors, shareholders, equity analysts, rating agencies and clients), the bank’s position in the market, market developments, contingent capital needs and the feasibility of capital management actions. Although ABN AMRO manages its capital centrally, the group companies are sufficiently capitalised to comply with all local regulatory solvency requirements and to meet any local business needs. ABN AMRO’s banking activities are carried out by legal entities that are part of the bank’s corporate tax unit. Apart from prevailing statutory and regulatory legislation, there are no specific material impediments for prompt transfer of the bank’s regulatory capital.
DividendThe dividend policy takes into account matters including current and pending regulatory capital requirements, our risk profile, growth in commercial activities and market factors. The dividend payout is set in the light of the bank’s objective to maintain a moderate risk profile and regulatory changes and to ensure that dividend payments can be maintained in the future.
Since 2018, the dividend payout policy has been set at 50% of net sustainable profit attributable to owners of the parent company, excluding exceptional items that significantly distort profitability and excluding AT1 capital securities. Additional distributions of above 50%, which can either be special dividends or share buy-backs (subject to regulatory approval), will be considered if capital is within or above the target range and will be subject to other circumstances, including regulatory and commercial considerations. The combined distribution will be at least 50% of net sustainable profit.
Any distribution of dividend remains discretionary, and ABN AMRO may propose deviations from the above policy. Please refer to the Capital review section for more information on the dividend policy.
Capital measurement and allocationCapital adequacy is measured and monitored on an ongoing basis against target capital ratios, which are derived from the bank’s overall risk appetite and strategy. Capital projections and stress test scenarios, both market-wide and bank-specific, are used to ensure that actual and future capital levels remain above the targets. Capital is allocated to businesses in a way that optimises the long-term value of the bank while serving the bank’s strategic objectives. In the capital allocation process, both risk-based and non-risk-based return parameters are considered, taking into account economic and regulatory capital requirements. This process ensures that the bank meets its return targets while maintaining a moderate risk profile in line with its risk appetite.
Contingency capital managementContingency plans are in place to address any capital issues arising. The Contingency Capital Plan provides a framework to detect capital adequacy stress by setting out various early warning indicators. The plan also sets out a range of actions that can be undertaken, based on the level of severity and urgency of the issues.
Recovery and resolution planningThe Bank Recovery and Resolution Directive requires a recovery plan and a resolution plan to be in place. ABN AMRO submitted a reviewed and updated version of its bank recovery plan to the ECB in December 2019. The Single Resolution Board (SRB) has prepared a resolution plan, in which it concluded that the preferred resolution strategy is a Single-Point-of-Entry (SPE) strategy, with ABN AMRO Bank N.V. as the resolution entity. ABN AMRO expects to continue issuing external MREL-eligible instruments.
Capital management
ABN AMRO Bank Annual Report 2019
65Risk, funding & capital / Risk, funding & capital management / Business risk management
ABN AMRO manages business risk in order to preserve its business earnings, independent of internal or external developments. Business risk management limits the effects of changes in actual and forecasted business earnings. Earnings are affected by various internal and external factors, such as changes in client preferences, competition, and economic and geopolitical developments and regulations. We continually monitor and respond to these factors.
The key criteria for classifying a risk as a business risk are: Å An event that leads to uncertainty in present or future business earnings and/or franchise value;
Å Changes of drivers of future business earnings such as uncertainty in volumes, margins, fee and commission rates and/or business expenses.
The bank mitigates sensitivity to business risk drivers through discussions at an Executive Board level that address developments in these drivers in an effective and timely manner, based on the ERM report. Business risk is also mitigated by a capital buffer.
The bank’s strategy and business risk are related. The strategy incorporates mitigation of uncertain events and business risk drivers. Regular review of the strategy ensures alignment with business risk developments. To ensure that the bank’s strategy is pursued and the strategic goals (financial and non-financial) are met in the long term, our business plans and budgets take these strategic goals into account.
Economic capital for business riskEconomic capital is used to mitigate the negative effects of unexpected business risk events. The economic capital for business risk reflects the maximum downward deviation of actual versus expected net operating profit in one year, excluding any impact already covered by other risk types (e.g. impairments for credit risk).
To determine the economic capital for business risk, a combination of historical and forward-looking scenarios is collected from experts in each business line and from Group Economics. These scenarios determine the sensitivity of macroeconomic variables or industry performance indicators to the business lines’ income. This sensitivity is used to determine the volatility of income for each business line, as well as any correlation between them. Based on the individual volatilities, we use simulation to calculate bank-wide volatility.
Business risk management
IntroductionStrategy and perform
anceLeadership &
governanceAnnual Financial Statem
ents 2019Other
Risk, funding & capital

ABN AMRO Bank Annual Report 2019
IntroductionStrategy and perform
anceRisk, funding &
capitalLeadership structure
GovernanceAnnual Financial Statem
entsOther
IntroductionStrategy and perform
anceLeadership &
governanceAnnual Financial Statem
ents 2019Other
66
Risk, funding & capital
Risk, funding & capital / Risk, funding & capital management / Sustainability risk management
Sustainability risk managementABN AMRO aims to make a positive contribution to achieve a beneficial social impact, including safeguarding human rights, to stimulate the circular economy, to combat climate change and to protect the environment through its financing and investment services. We recognise that, in our roles as lender and investor, we may also be exposed to environmental, social and governmental (ESG) risks through the direct activities of our clients and the companies in which we invest on behalf of our clients and through the activities performed in these companies’ value chains. To manage these sustainability risks, we have defined a specific risk appetite in line with a moderate risk profile.
Sustainability risk policy frameworkABN AMRO applies a sustainability risk policy framework that is governed in accordance with the bank’s ‘three lines of defence’ model. This policy framework covers activities primarily focused on corporate lending and payment and investment services, but also extending to procurement, human resources and product development.
Client and investment management We have in place instruments to identify potential breaches of our sustainability risk policies and do not do business with companies not willing or not able to run their businesses responsibly. Similar checks on exclusions and controversies apply to the investment universe provided to our clients via our investment services.
In corporate lending, the bank performs a sustainability assessment for transactions entailing an increased sustainability risk. This assessment is based on the ESG standards in our sustainability risk policy framework and focuses on our clients’ compliance, commitment, capacity and track record in terms of managing their sustainability risk. This means that we may decide to accept transactions with a high sustainability risk profile, as long as the client is capable of managing these risks and operates within the limits of our sustainability risk policy framework.
In 2019 we continued to expand the use of the Global Sustainability Risk Indicator (GSRI) tool in assessing clients against the requirements of the sustainability risk policy framework. The scope for using the GSRI tool has been widened, such that clients operating in low-risk sectors are now being assessed, too.
Client engagement We strive for an inclusive approach. Most companies meet our sustainability policy requirements. In certain instances, however, a company might not yet meet our requirements, either before or during the relationship. In these cases we enter into a dialogue with the company in question. The goal of such a dialogue is to improve the company’s sustainability performance so that it meets our standards. Underperformers are not excluded immediately, but they do have to be willing and able to enter into a results-oriented process, given that the success of engagement depends on this commitment. We set a maximum term within which improvements must take place. Typically, this is three years, but in certain cases an extension is possible. Disengagement, although a last resort, may be an outcome of the process.
Engagement is triggered by: Å for clients: actual or potential breaches of our ESG risk policy framework;
Å for companies in our investment universe: category 5 breaches of the UN Global Compact. Investment universe engagement is done in collaboration with Robeco, unless the company is also our client.
Our engagement leverage for companies we finance differs from companies our clients invest in. If we finance a company, there is usually potential for direct engagement. If not, or if, for instance, we are part of a loan syndicate with other banks, engagement may be performed by a third party. The engagement procedure is overseen by a team from the relevant business line and the bank’s sustainability advisors. Progress reports are drafted on a quarterly basis and relevant members of the Executive Board are also informed quarterly. We report on the number of high-risk ESG engagements in ABN AMRO’s 2019 Non-Financial Data & Engagement report.
Human rightsOne of the focus areas of our sustainability risk policy framework is on managing human rights risks in accordance with the UN Guiding Principles on Business and Human Rights and the OECD Guidelines. In line with these principles, we have integrated human rights assessment criteria into our lending, investment and corporate procurement activities. In 2019, we continued contributing to the working groups set up to implement the Dutch Banking Sector Agreement on internationally responsible business conduct regarding human rights. This sector agreement includes commitments to achieve a material positive impact for people whose human rights could potentially be adversely impacted as a result of our products and services.

ABN AMRO Bank Annual Report 2019
IntroductionStrategy and perform
anceRisk, funding &
capitalLeadership structure
GovernanceAnnual Financial Statem
entsOther
IntroductionStrategy and perform
anceLeadership &
governanceAnnual Financial Statem
ents 2019Other
67
Risk, funding & capital
Risk, funding & capital / Risk, funding & capital management / Sustainability risk management
Carbon accountingOur policies and targets apply to the transition to a low-carbon economy. We also expect our focus on the circular economy and sustainable assets to have a positive impact. ABN AMRO participates in the Partnership for Carbon Accounting for Financials (PCAF). PCAF is part of the Dutch Sustainable Finance Platform, which is chaired by the Dutch central bank (DNB). PCAF’s objective is to improve carbon accounting by increasing transparency and uniformity in carbon footprinting and target-setting in the financial sector. PCAF intends to contribute to a harmonised framework for science-based targets and has developed a methodology for measuring the carbon footprint of investments and loans. This methodology enables financial institutions to align their portfolios better with climate scenarios. PCAF Global was launched at an event held at ABN AMRO’s New York office during the New York Climate Week in September 2019. Together, the more than 50 financial institutions that have joined PCAF Global represent over EUR 2.6 trillion of assets.
During the 2019 New York Climate Week, ABN AMRO also became one of the founding signatories of the Principles for Responsible Banking, whereby it committed to strategically aligning its business with the Sustainable Development Goals and the Paris Agreement on Climate Change. By signing the Principles for Responsible Banking, ABN AMRO joined a coalition of 130 banks worldwide, representing over USD 47 trillion in assets, committed to playing a crucial role in helping to achieve a sustainable future.
Aligning portfolios to global climate objectivesIn the context of the Paris Agreement of 2015 (COP21), ABN AMRO is participating in a banking pilot project established by the 2-degrees Investing Initiative (2DII). The main objective of this cooperation is to compare ABN AMRO’s exposure to clients active in power generation and upstream fossil fuel extraction with the International Energy Agency’s climate scenarios, which correspond to what was agreed during COP21. This pilot is enabling ABN AMRO to explore the opportunities for setting science-based targets that align financial flows with the aim of limiting global warming to below 2 degrees Celsius.
TCFD recommendations on climate changeABN AMRO is committed to implementing the recommendations of the Financial Stability Board Taskforce on Climate-related Financial Disclosures (TCFD). In June 2019, the European Commission published guidelines on how to apply the TCFD recommendations. These guidelines supplement the Guidelines on Non-Financial Reporting and are consistent with the EU Non-Financial Reporting Directive. This section provides insight into
the current implementation status of the four TCFD pillars: governance, strategy, risk management, and metrics & targets.
Having taken the first important steps towards implementing the TCFD recommendations since its public commitment to do so in November 2017, ABN AMRO is participating in the United Nations Environment Programme Finance Initiative (UNEP-FI) TCFD Pilot Phase 2 to gain further understanding of and build the capacity needed to assess climate risks and opportunities at a borrower and portfolio level.
GovernanceClimate-related risks are integrated in our risk management process. These are managed in line with our risk governance. We believe this will ensure that sustainability risk, including climate risk, is increasingly incorporated into our day-to-day business. The status of adherence to the risk appetite is regularly discussed by the risk committees, the Executive Committee and the Supervisory Board.
Our adoption of the TCFD recommendations has also been defined as a key strategic initiative in our corporate strategy, which is monitored and used in decision-making by the Executive Committee. Our regulatory compliance with forthcoming sustainable finance regulations is also monitored by the Group Regulatory Committee and the Executive Committee by means of regular reports.
StrategyClimate change and its effects are considered from a business opportunities perspective and also in the context of maintaining a moderate risk profile. With regard to business opportunities, climate is also one of the three focus areas in our ‘Support our clients’ transition to sustainability’ strategic pillar. The progress on initiatives is monitored by the Executive Committee as part of our quarterly sustainability dialogue. Our ambition is to further integrate sustainability aspects into our processes and decision-making.
With regard to the moderate risk profile, we performed a number of analyses in 2019 to help assess the climate risks for lending and investments. These included:
Å Climate scenario analyses on our vulnerability to physical risk in the Dutch residential mortgages portfolio in a 4-degrees warming scenario. The mortgage portfolio was selected because of its weight in the overall balance sheet. The scenarios were based on the assumptions of the Intergovernmental Panel on Climate Change (IPCC). In 2020, we are planning to establish a more comprehensive view on the transition risks and physical risks in our corporate lending portfolio;
ABN AMRO Bank Annual Report 2019
68Risk, funding & capital / Risk, funding & capital management / Sustainability risk management
Å A sensitivity assessment of the transition risks in outstanding credit facilities in Shipping, Oil & Gas and Power Generation;
Å The 2-degrees Investing Initiative (2DII) banking pilot, where we completed our first analysis comparing the positioning of ABN AMRO’s energy lending portfolio (more specifically power generation and upstream fossil fuel) to energy scenarios supporting the Paris Agreement. This was conducted on an asset level as part of the above banking pilot in which ABN AMRO is participating;
Å Climate impact analyses of the ‘execution only’ investment portfolio, with the aim of creating a better understanding of the greenhouse gas (GHG) emissions exposure and ensuring that our investments are better placed to make informed decisions on their approach to climate change issues.
Risk managementThe identified material risks are incorporated in our risk taxonomy, risk appetite and financial planning. ABN AMRO considers climate risk to be a material risk and treats it as part of sustainability risk. Since sustainability risk is interconnected with other risk types, such as credit risk, business risk and legal risk, it is managed as part of the existing risk governance.
Within climate risk we follow TCFD in distinguishing between two types of risk: physical risk and transition risk.
Å Physical risk relates to the physical consequences of climate change, including drought, flooding and heat;
Å Transition risk is risk attributable to the transition to a low-carbon economy though greening public policy, technological developments and changing consumer preferences.
While consequences of physical risk and transition risks can be assessed separately, they are interconnected. Although the introduction of ambitious policies to limit global warming increases transition risks in the short and medium term, these policies are expected to reduce the long-term physical risks.
In line with our sustainability risk policy framework, relevant clients are screened and monitored, and, where relevant, advised on limiting their climate impact (e.g. greenhouse gas (GHG) emissions). The specific standards applied to different sectors are outlined in the bank’s sustainability risk policies, along with the sector requirements, and include appropriate criteria related to climate change mitigation. A few examples:
Å Zero deforestation and zero peat-burning commitments for agricultural clients;
Å Monitoring and reduction plans for direct and indirect GHG emissions by clients in carbon-intensive sectors;
Å Production in line with the International Energy Agency’s 2-degrees warming scenario for power-generation clients.
For the energy sector, we have included portfolio targets in our sustainability risk policy framework (e.g. a maximum exposure set for coal in the utilities lending portfolio). In addition, the bank performs portfolio level (scenario) analysis in close cooperation with the business lines as discussed above. Based on these analyses, the appropriate response is being determined. In 2020 we are planning to determine the appropriate response to the identified risks in our mortgage portfolio and the corporate lending portfolio.
Metrics & targetsVarious metrics and targets are in place that relate to or inform on climate-related risks and opportunities. Ultimately, we would like to develop metrics and set targets based on scenario analyses with regard to material climate-related risks and opportunities.
In anticipation of regulatory policies we are seeking to take advantage of the opportunity to deliver sustainable solutions for our clients. One example is our Mission 2030 statement, in which we state that we want to raise the average energy performance of all buildings financed by ABN AMRO to energy label ‘A’ by 2030. By starting this process, we mitigate the transition risk of these upcoming regulatory policies that may materialise soon. Our progress on this target is shown in the 2019 Non-Financial Data & Engagement report.
Other examples of metrics and targets include: Å GHG scope 1, 2 and 3 emissions. Detailed information on emissions is provided under the sustainability risk management heading in the Risk review section of this report, as well as in the bank’s 2019 Non-Financial Data & Engagement report;
Å Our commitment for renewable energy to comprise at least 20% of our energy portfolio in 2022 with the help of our Energy Transition Fund. This fund focuses on investment opportunities in projects and companies that are helping to accelerate the energy transition and has scope to grow to over EUR 200 million;
Å ABN AMRO’s role as a leading lender in the shipping sector, where we aim to improve the shipping portfolio’s energy efficiency by increasing the percentage of ‘A’ and ‘B’ labels to 30% by 2022.
We are planning to further define targets and limits so as to ensure that ABN AMRO’s vulnerability to climate risks in both the short and longer term remains in line with a moderate risk profile.
IntroductionStrategy and perform
anceLeadership &
governanceAnnual Financial Statem
ents 2019Other
Risk, funding & capital

ABN AMRO Bank Annual Report 2019
69Risk, funding & capital / Risk, funding & capital management / Management Control Statement
By virtue of Principle 1.4 (Risk management accountability) of the Dutch Corporate Governance Code, ABN AMRO’s Executive Board is required to account for the effectiveness of the design and operation of the bank’s internal risk management and control systems. By virtue of Principle 2.5 (Culture) of the Code, the Executive Board is responsible for promoting a culture aimed at creating long-term value for the company and its affiliated enterprises. By virtue of Principle 2.5.4 (Accountability regarding culture), the Executive Board is required to explain the bank’s values and how these values are incorporated into the activities of the company and its affiliated enterprises, and to account for the effectiveness of and the bank’s compliance with the code of conduct.
ABN AMRO’s internal risk management and control is a process effectuated by the Executive Board, management and other personnel. It is designed to provide reasonable assurance regarding the achieving of objectives in the following categories:
Å effectiveness and efficiency of operations; Å reliability of financial and non-financial information; Å compliance with laws, regulations and internal policies; Å safeguarding of assets, and identification and management of liabilities; and
Å strategic and business objectives.
ABN AMRO’s first and second lines of defence perform their roles in risk assessments, stress tests, evaluations of the operating effectiveness of controls, and reporting on risk management and control systems. The concluding results are reported in and discussed at senior management level through Enterprise Risk Management reports. Group Audit, as the third line of defence, evaluates the design and effectiveness of ABN AMRO’s governance, as well as its risk management and control systems. Audit reports are discussed with risk and process owners. The Chief Audit Executive (or his deputy) attended the Executive Board and/or Executive Committee meetings every quarter to discuss the Quarterly Audit Opinions. In 2019, the evaluation of the adequacy of ABN AMRO’s internal risk management and control systems was regularly discussed with the Audit Committee, the Risk & Capital Committee and the full Supervisory Board.
In compliance with best practice provision 1.4.3 of the Corporate Governance Code (Statement by the management board) and based on ABN AMRO’s risk management processes, the Executive Board makes the following statements, and provides clear substantiation, regarding the internal risk management and control systems, taking into account ABN AMRO’s strategy of pursuing a moderate risk profile:
Å The Executive Board’s report in ABN AMRO’s Annual Report 2019 provides sufficient insights into any failings in the effectiveness of the internal risk management and control systems (best practice 1.4.3.i);
Å The internal risk management and control systems provide reasonable assurance that the financial reporting for 2019 does not contain any material inaccuracies (best practice 1.4.3.ii);
Å Based on the current state of affairs, preparation of the financial reporting for 2019 on a going-concern basis is justified (best practice 1.4.3.iii). For further information, please refer to Note 1 Accounting policies in the Consolidated Annual Financial Statements;
Å The Executive Board’s report states those material risks and uncertainties that are relevant to expectations regarding ABN AMRO’s continuity for the period of twelve months following the preparation of this report (best practice 1.4.3.iv);
Å The Executive Board’s report explains the bank’s values and how they are incorporated into the activities of the company and its affiliated enterprises, and accounts for the effectiveness of and the bank’s compliance with the code of conduct (best practice 2.5.4).
Regarding internal risk management and control systems, the Executive Board has identified the following external factors as potentially having an impact on ABN AMRO’s current business model:
Å Adverse macroeconomic and monetary conditions (e.g. a downturn of the economic cycle, impact of Covid-19 virus on the economy and our clients and persistently low or negative interest rates), geopolitical uncertainty (such as the impact of Brexit, trade tensions and sanctions) and competition (e.g. pressure on the bank’s market share in mortgages) that could limit execution of the bank’s planned sustainable growth strategies;
Å Laws and regulations that could have an impact on the bank’s strategic position, revenues, costs and capital adequacy (e.g. additional capital requirements for the Dutch mortgage market);
Å Developments in the field of sustainability that could impair asset values and thus the creditworthiness of clients (transition risk).
These external factors may impact on specific businesses, thus hindering ABN AMRO in the achievement of its strategic goals. The Executive Board is exploring income-related measures that could compensate for these external developments (such as a more fee-based business model).
Management Control Statement
IntroductionStrategy and perform
anceLeadership &
governanceAnnual Financial Statem
ents 2019Other
Risk, funding & capital

ABN AMRO Bank Annual Report 2019
IntroductionStrategy and perform
anceRisk, funding &
capitalLeadership structure
GovernanceAnnual Financial Statem
entsOther
IntroductionStrategy and perform
anceLeadership &
governanceAnnual Financial Statem
ents 2019Other
70
Risk, funding & capital
Risk, funding & capital / Risk, funding & capital management / Management Control Statement
Not being compliant with laws and regulations may lead to reputational damage, fines and changes in ABN AMRO’s income and cost or capital basis and could endanger long-term goals. Ensuring demonstrable compliance requires robust risk governance, enhanced data management and a substantial share of the bank’s resources.
Specific areas where the risk of non-compliance with regulations and heightened regulatory scrutiny require substantial effort by the bank are:
Å Customer Due Diligence/Know Your Client, Anti-Money Laundering (AML) and Counter-Terrorism Financing (CTF). ABN AMRO is the subject of an investigation by the Dutch Public Prosecutor relating to requirements under the Act on the prevention of money laundering and financing of terrorism (Wwft). More information on this areas is provided in the Regulatory environment section, the Non-financial review section and Note 29 Provisions in the Consolidated Annual Financial Statements;
Å Duty of care towards our clients. More information on this areas is provided in Note 34 Commitments and contingent liabilities in the Consolidated Annual Financial Statements;
Å Collateral management, credit risk modelling and credit risk monitoring. More information on this areas is provided in the Credit risk management section.
Remediation programmes, including action aimed at improving ABN AMRO’s performance in these areas, were underway and initiated, and will continue to be initiated, in order to remedy shortcomings and ensure full compliance with legislation throughout the bank. In 2019, the bank established a centralised Detecting Financial Crime department, started programmes to address potential issues involving products sold in the past (such as consumer credit and mortgages) and further improved the monitoring of regulatory changes and overseeing of their implementation. For 2020, we expect guidance and requirements to continue to increase; ensuring continued improvement still requires a substantial, multi-year effort, especially with regard to the regulatory areas mentioned above.
In the past ABN AMRO’s legal predecessor, Fortis Bank (Nederland) N.V., ABN AMRO and several (former) subsidiaries were directly or indirectly involved in transactions relating to equity trading extending over dividend record dates, including several forms of tainted dividend arbitrage, i.e. dividend stripping. It cannot be excluded that ABN AMRO or subsidiaries will be faced with further financial consequences as a result of their involvement in these transactions, including penalties and other measures under criminal law and civil law claims. The bank has been implementing measures to prevent that it is involved in tainted dividend arbitrage in the future.
Further measures continue to be considered/implemented to reduce any remaining risk. More information on this risk is provided under Note 34 Commitments and contingent liabilities in the Consolidated Annual Financial Statements.
The Executive Board has identified and agreed on the following areas for improvement, which are being actively managed by senior management:
Å The financial services industry and its supervision are becoming increasingly data-driven and privacy of data is a key aspect to manage. Substantial efforts are required for the bank to improve the control of its data quality and availability in order to meet the data aggregation, data use and risk reporting requirements. These aspects of data management, combined with issues concerning the quality of (historical) data, data ownership, data knowledge and a complex IT infrastructure, may result in suboptimal decision-making and business process execution, as well as in elevated model risk and missed opportunities in the application of new technologies. Data management and preventing data leakage also play an important role in addressing privacy risk. Although progress has been made in many areas of data management, a multi-year approach continues to be required in order for the bank to reach the desired level. In the meantime, we have taken measures to minimise and mitigate the risks.
Å The complexity, accumulation and interdependencies of the bank’s transformation programmes, the enhancement of the bank’s IT landscape, digitalisation and innovation, and various prioritised regulatory and organisational changes lead to an accumulation of change risk. This may cause that the building blocks needed for growth, for example, may not be in place within the agreed timeframes, potentially resulting in increased operational costs and time to market, and in the possibility that the bank may lag behind new entrants not subject to comprehensive regulation. Alignment of these changes and their interdependencies is a key point of attention.
Å The continued increase in and professionalism of external crime threats may expose the bank and its clients to cyber fraud attacks, disruptions of in-house and outsourced IT, ATM attacks and loan fraud. Defence mechanisms against cyber threats are continually being upgraded to the latest technologies and insights. ABN AMRO is working with crime-fighting and other authorities and with other banks in these areas. Automated mechanisms to detect and prevent data leakage will continue to be improved and implemented in the year ahead.

ABN AMRO Bank Annual Report 2019
71Risk, funding & capital / Risk, funding & capital management / Management Control Statement
Å The difficulties to attract, train and retain qualified professionals and new talents remain a point of attention. Improving this, alongside implementing a significant culture change, will help the bank achieve its strategic goals. This risk is mitigated by various programmes focused on strategic workforce management, culture and leadership, the use of self-steering methods and employer branding. These programmes will help the bank achieving their strategic goals.
Å The effectiveness of the Risk Control Framework needs improvement to demonstrate management is in control. Management compensated weaknesses in the Risk Control Framework via several additional control related assessments to detect and follow up on control weaknesses.
It should be noted that ABN AMRO’s internal risk management and control systems do not provide complete assurance on the realisation of business objectives, nor prevent or detect inaccuracies, fraud and non-compliance with rules and regulations at all times.
IntroductionStrategy and perform
anceLeadership &
governanceAnnual Financial Statem
ents 2019Other
Risk, funding & capital

ABN AMRO Bank Annual Report 2019
IntroductionStrategy and perform
anceRisk, funding &
capitalLeadership structure
GovernanceAnnual Financial Statem
entsOther
IntroductionStrategy and perform
anceLeadership &
governanceAnnual Financial Statem
ents 2019Other
72
Risk, funding & capital
Risk, funding & capital / Risk, funding & capital review / Risk profile
Risk profileABN AMRO aims to maintain a moderate risk profile. We actively manage our business and balance sheet composition to remain within our risk appetite.
Risk profile assessmentABN AMRO periodically assesses its risk profile in conjunction with the bank’s risk appetite. The strategic Risk Appetite Statement expresses ABN AMRO’s strategy of pursuing a moderate risk profile. The five elements of the strategic Risk Appetite Statement ensure a coherent balance between a sustainable return and value creation, our business model, capital, and liquidity and funding, taking into account the conduct, governance and control framework. The main conclusions of this assessment are summarised below.
Business model, return and value creationThere is a focus on achieving a healthy return by maintaining a long-term, risk-adjusted return on equity above 10%. Adverse economic (e.g. a downturn in the economic cycle) and monetary conditions (e.g. sustained low or negative interest rates) and geopolitical uncertainty (such as the impact of Brexit, trade tensions and sanctions) could impact on global trade, thus increasing the risk for current business and affecting our margins and revenues. Likewise, the execution of planned sustainable strategies may be limited by the need to allocate resources to regulatory-related projects.
Capital, Liquidity & FundingComfortable buffers are in place to meet capital and liquidity requirements from a regulatory and internal (e.g. economic capital) perspective. In addition, stress testing indicates that sufficient buffers are in place for times of stress.
Conduct, Governance and Control FrameworkCapital buffers are also in place to cover non-financial risks. In managing these risks, we face challenges regarding our ability to fully comply with all regulatory requirements. Specific areas where the risk of non-compliance with regulations requires a substantial effort from the bank are:
Å Customer Due Diligence/KnowYourClient, Anti-Money Laundering (AML) and Counter-Terrorism Financing (CTF);
Å Duty of care; Å Model management.
Regulatory compliance risk is mitigated by ensuring staff remain aware of regulatory programmes through ongoing training and presentations. Furthermore, additional staff and budget have been made available for regulatory adherence and change initiatives.
In addition, the bank has to meet requirements in the field of data aggregation and risk reporting that require a substantial effort. These aspects of data management, combined with issues regarding data quality and data knowledge, may result in suboptimal decision-making and business process execution, as well as in elevated model risk and missed opportunities in the application of new technologies. Although progress has been made in many areas, a multi-year approach continues to be required in order for the bank to reach the desired level.
Balance sheet compositionABN AMRO is mainly active in the Dutch market and in international operations where we have specific expertise and hold leading positions in selective activities.
Liabilities & equity
Assets
Demand depositsOther due to customersDue to BanksSecurities financingDerivativesLong-term & subordinated debtShort-term debtEquityOther liabilities
Residentialmortgages
Other loans &advances customers
Loans andadvances banks
Securities financingDerivatives
FinancialinvestmentsOther assets
40
31
142
12
10
32
23
2
19
30
462
Balance sheet composition at 31 December 2019(in %)
The balance sheet composition reflects the bank’s objective to maintain a moderate risk profile. Some characteristics that limit risk in the balance sheet are:
Å Loan portfolio matched by deposits, long-term debt and equity;
Å Strong focus on collateralised lending; Å Limited market risk and trading portfolios; Å Moderate risk, delivering attractive results and high capital returns of at least 10%;
Å Strong capital positions reflected in a CET1 ratio of at least 13.5% and a leverage ratio of at least 4%;
Å Strategic focus on limiting LtD ratio by diversifying the funding structure and maintaining LtD at <125%;
Å Sufficient liquidity buffers to survive 6 months of severe stress.
Risk, funding & capital review
Risk, funding & capital review

ABN AMRO Bank Annual Report 2019
73Risk, funding & capital / Risk, funding & capital review / Key developments
Key figures
(in millions) 31 December 2019 31 December 2018
Total loans and advances, gross excluding fair value adjustments1 , 2 270,935 275,962
- of which Banks2 5,016 6,789
- of which Residential mortgages 148,225 148,791
- of which Consumer loans 12,294 12,263
- of which Corporate loans1 , 2 99,107 101,163
- of which Other loans and advances customers1 , 2 6,292 6,957
On-balance sheet maximum exposure to credit risk 370,953 378,063
Total Exposure at Default (EAD) 393,247 403,565
- of which Retail Banking 167,453 169,971
- of which Commercial Banking 50,537 52,551
- of which Private Banking 19,289 19,626
- of which Corporate & Institutional Banking 78,586 80,325
- of which Group Functions 77,381 81,092
Credit quality indicators1
Forbearance ratio 2.4% 2.2%
Past due ratio 1.2% 1.3%
Stage 3 Impaired ratio 2.5% 2.2%
Stage 3 Coverage ratio 29.6% 31.6%
Cost of risk (in bps)3 24 24
Regulatory capitalTotal RWA 109,825 105,391
- of which Credit risk4 89,071 84,701
- of which Operational risk 19,391 19,077
- of which Market risk 1,362 1,612
Total RWA/total EAD 27.9% 26.1%
Liquidity and funding indicatorsLoan-to-Deposit ratio 114% 111%
LCR >100% >100%
NSFR >100% >100%
Capital ratiosFully-loaded CET1 ratio 18.1% 18.4%
Fully-loaded leverage ratio 4.5% 4.4%
1 Excluding loans and advances measured at fair value through P&L.2 The comparative figures for 2018 with regard to loans and advances banks, corporate loans and other loans and advances have been restated. Please refer to Note 1 Accounting policies
in the Consolidated Annual Financial Statements.3 Annualised impairment charges on loans and advances customers for the period divided by the average loans and advances customers on the basis of gross carrying amount and excluding
fair value adjustment from hedge accounting.4 RWA for credit value adjustment (CVA) is included in credit risk. CVA per 31 December 2019 is EUR 0.4 billion (31 December 2018 EUR 0.5 billion).
Key developments
IntroductionStrategy and perform
anceLeadership &
governanceAnnual Financial Statem
ents 2019Other
Risk, funding & capital

ABN AMRO Bank Annual Report 2019
IntroductionStrategy and perform
anceRisk, funding &
capitalLeadership structure
GovernanceAnnual Financial Statem
entsOther
IntroductionStrategy and perform
anceLeadership &
governanceAnnual Financial Statem
ents 2019Other
74
Risk, funding & capital
Risk, funding & capital / Risk, funding & capital review / Key developments
Key figures per business segment
31 December 2019
(in millions)Retail
BankingCommercial
BankingPrivate
Banking
Corporate & Institutional
BankingGroup
Functions Total
Total assets 154,240 43,968 17,492 72,157 87,196 375,054
Total Exposure at Default 167,453 50,537 19,289 78,586 77,381 393,247
RWACredit risk1 22,068 24,958 7,218 31,845 2,982 89,071
Operational risk 6,351 4,291 2,866 4,720 1,162 19,391
Market risk 1,362 1,362
Total RWA 28,420 29,249 10,084 37,928 4,144 109,825Total RWA/Total Exposure at Default 17.0% 57.9% 52.3% 48.3% 5.4% 27.9%
Economic capitalCredit risk 1,950 2,008 550 2,514 973 7,995
Operational risk 465 307 203 342 87 1,405
Market risk 60 2,187 2,246
Business risk 237 311 197 523 1,268
Other risk types2 278 67 177 96 1,996 2,614
Economic capital 2,930 2,694 1,127 3,534 5,243 15,528
2019
Average RWA 27,903 27,515 9,886 36,885 5,096 107,285
Cost of risk (in bps)3 5 42 14 62
1 RWA for credit value adjustment (CVA) is included in credit risk. CVA per 31 December 2019 is EUR 0.4 billion (31 December 2018 EUR 0.5 billion).2 Other risk types include own funding spread risk, equity risk and property risk.3 Annualised impairment charges on loans and advances - customers for the period divided by the average loans and advances - customers on the basis of gross carrying amount
and excluding fair value adjustment from hedge accounting.
31 December 2018
(in millions)Retail
BankingCommercial
BankingPrivate
Banking
Corporate & Institutional
BankingGroup
Functions Total
Total assets 155,728 43,642 17,661 74,455 89,807 381,295
Total Exposure at Default 169,971 52,551 19,626 80,325 81,092 403,565
RWACredit risk1 21,884 24,104 6,576 28,414 3,724 84,701
Operational risk 5,700 3,232 3,268 4,984 1,893 19,077
Market risk 1,612 1,612
Total RWA 27,584 27,336 9,844 35,010 5,617 105,391Total RWA/Total Exposure at Default 16.2% 52.0% 50.2% 43.6% 6.9% 26.1%
Economic capitalCredit risk 2,154 1,841 497 2,440 1,019 7,952
Operational risk 322 154 150 278 194 1,099
Market risk 47 2,629 2,676
Business risk 263 282 228 448 7 1,229
Other risk types2 171 46 153 48 1,583 2,001
Economic capital 2,909 2,324 1,029 3,262 5,432 14,956
2018
Average Risk exposure amount 26,916 25,128 9,341 37,658 6,348 105,391
Cost of risk (in bps)3 -1 60 3 70 24
1 RWA for credit value adjustment (CVA) is included in credit risk. CVA per 31 December 2019 is EUR 0.4 billion (31 December 2018 EUR 0.5 billion).2 Other risk types include own funding spread risk, equity risk and property risk.3 Annualised impairment charges on loans and advances - customers for the period divided by the average loans and advances - customers on the basis of gross carrying amount
and excluding fair value adjustment from hedge accounting.

ABN AMRO Bank Annual Report 2019
75Risk, funding & capital / Risk, funding & capital review / Key developments
Portfolio reviewTotal loans and advances decreased to EUR 270.9 billion (31 December 2018: EUR 276.0 billion). There was a small decrease in the residential mortgages portfolio as redemptions outweighed new mortgage production. The largest movement was in corporate loans, primarily due to lower business volumes in Corporate & Institutional Banking (CIB) in line with the CIB refocus.
Exposure at DefaultEAD declined to EUR 393.2 billion (31 December 2018: EUR 403.6 billion). The decrease was mainly related to lower CIB business volumes, partly offset by the changed regulatory treatment of Clearing. EAD also decreased due to lower exposures to central banks in Group Functions, partly offset by the newly added fair value adjustment on hedged items.
Recent developments The current Covid-19 outbreak most likely impacts the global economy and ABN AMRO’s financial position and results. More specifically the impact is expected on instruments measured at fair value and on the expected credit losses. Currently ABN AMRO is closely monitoring any financial impact attributable to the Covid-19 outbreak on industry sectors, such as industrials, transportation & logistics and leisure. Given the uncertainties and ongoing developments the Bank cannot accurately and reliably estimate the quantitative impact.
Credit quality indicatorsThe forbearance ratio increased due to a higher inflow of forborne assets, mainly in corporate loans and partly in residential mortgages. Compared to last year, the outflow of forborne assets was lower because more clients were still within their probation period.
In line with the good performance of the Dutch economy, the total past due ratio improved to 1.2% (Q4 2018: 1.3%), with decreases in all past due buckets. The main driver was residential mortgages, which benefited from the positive economic climate. Corporate and consumer loans, however, showed an increase in short-term arrears (<30 days), mainly due to the inflow of some large clients from CIB, Asset Based Finance and Private Banking.
The increase in the stage 3 impaired ratio was mainly due to the inflow of new stage 3 corporate loans clients, who were transferred from stages 1 and 2 during 2019. This inflow was largely attributable to clients in the energy-offshore and the logistics sectors and the trade and commodity finance business segment within CIB and the healthcare sector in Commercial Banking. As the provisions on this inflow were relatively low compared to the existing stage 3 impaired exposure, the overall stage 3 coverage ratio for loans and advances to customers decreased.
As in 2018, the cost of risk was 24bps in 2019, which was slightly below the through-the-cycle cost of risk (25-30bps) and in line with expectations. The impairment charges related mainly to corporate loans. The inflow of new clients in stage 3 and increases of allowances in existing files came from the food and beverage and energy-offshore sectors in CIB and the healthcare sector in Commercial Banking. For more details on impairments, please refer to the loan impairment charges and allowances subsection.
Regulatory capitalTotal RWA increased to EUR 109.8 billion (31 December 2018: EUR 105.4 billion), mainly due to an increase in credit risk and, to a lesser extent, in operational risk. The increase in credit risk related mainly to model updates in Commercial Banking and Retail Banking and to add-ons anticipating TRIM and model reviews. The add-ons were based on preliminary ECB feedback and in anticipation of developments in 2020.
Economic capitalEconomic capital (EC) increased to EUR 15.5 billion (31 December 2018: EUR 15.0 billion), due to an increase in own funding spread risk EC (EUR 0.5 billion) and operational risk EC (EUR 0.3 billion), which was offset by lower market risk in the banking book EC (EUR 0.4 billion). Credit risk EC remained stable at EUR 8.0 billion.
The decrease in market risk in the banking book EC and the increase in own funding spread risk EC was driven by asset liability management. The increase in operational risk EC was mainly the result of a higher exposure to regulatory fines (e.g. AML-related), as well as a revised set of capital add-ons.
Liquidity and funding The increase in the loan-to-deposit (LtD) ratio is attributable to a definition change in 2019. Under the new definition, the ratio is calculated by dividing loans and advances customers by due to customers as reported in the balance sheet. Based on the new definition, the LtD ratio would have been 115% at year-end 2018. Hence, the LtD decreased to 114% at year-end 2019 from 115% at year-end 2018 as loans and advances customers decreased by more than due to customers.
IntroductionStrategy and perform
anceLeadership &
governanceAnnual Financial Statem
ents 2019Other
Risk, funding & capital

ABN AMRO Bank Annual Report 2019
IntroductionStrategy and perform
anceRisk, funding &
capitalLeadership structure
GovernanceAnnual Financial Statem
entsOther
IntroductionStrategy and perform
anceLeadership &
governanceAnnual Financial Statem
ents 2019Other
76
Risk, funding & capital
Risk, funding & capital / Risk, funding & capital review / Key developments
Reporting scope risk
31 December 2019 31 December 2018
(in millions)
Gross carrying amount
Loan impairment allowance
Carrying amount
Gross carrying amount
Loan impairment allowance
Carrying amount
Loans and advances banks1 5,016 5 5,011 6,789 9 6,780Residential mortgages 151,020 140 150,880 150,892 108 150,784
Less: Fair value adjustment from hedge accounting on residential mortgages 2,795 2,795 2,101 2,101
Residential mortgages, excluding fair value adjustments 148,225 140 148,085 148,791 108 148,683
Consumer loans 12,294 298 11,997 12,263 318 11,945Corporate loans1 99,654 1,982 97,672 102,234 1,825 100,408
Less: Fair value adjustment from hedge accounting on corporate loans 547 547 1,071 1,071
Corporate loans, excluding fair value adjustments1 99,107 1,982 97,125 101,163 1,825 99,338
Corporate loans at fair value through P&L 1,261 1,261 783 783Other loans and advances customers1 6,292 6 6,287 6,970 9 6,961
Less: Fair value adjustment from hedge accounting on other loans and advances customers 1 1 13 13
Other loans and advances customers, excluding fair value adjustments1 6,292 6 6,286 6,957 9 6,948
Other loans at fair value through P&L 5 5 5 5
Total loans and advances customers, excluding fair value adjustments1 267,185 2,426 264,759 269,961 2,260 267,701
Fair value adjustments on Loans and advances customers 3,342 3,342 3,185 3,185
Total loans and advances customers1 270,527 2,426 268,102 273,146 2,260 270,886
Total loans and advances, excluding fair value adjustments 272,201 2,431 269,770 276,750 2,269 274,481
Total fair value adjustments on Loans and advances 3,342 3,342 3,185 3,185
Total loans and advances 275,544 2,431 273,113 279,935 2,269 277,666Other 4 101,941 6 103,629
Total assets 2,436 375,054 2,275 381,295
1 The comparative figures for 2018 with regard to loans and advances banks, corporate loans and other loans and advances have been restated. Please refer to Note 1 Accounting policies in the Consolidated Annual Financial Statements.
All figures reported in the Risk, funding & capital review section are gross of loan impairment allowances and exclude fair value adjustments. The above table provides a comparison with the figures reported in the consolidated balance sheet, which are shown net of allowances and include fair value adjustments.

ABN AMRO Bank Annual Report 2019
77Risk, funding & capital / Risk, funding & capital review / Credit risk
Credit riskCredit risk exposureCredit risk overview b
(in millions) 31 December 2019 31 December 2018
Cash and balances at central banks1 27,061 35,716
Financial assets held for trading 1,137 495
Derivatives 5,730 6,191
Financial investments2 45,277 42,184
Securities financing 14,905 12,375
Loans and advances banks1 5,011 6,780
Loans and advances customers 268,102 270,886
Other assets 4,530 3,904
Less: Other 800 467
Other assets 3,731 3,436
On-balance sheet maximum exposure to credit risk2 370,953 378,063
Off-balance sheetCommitted credit facilities 54,673 61,166
Guarantees and other commitments 17,479 15,241
Revocable credit facilities 46,710 49,001
Off-balance sheet credit facilities and guarantees 118,861 125,409
Maximum exposure to credit risk2 489,815 503,472Adjustments on assets2 , 3 287 -2,483
Valuation adjustments4 14,414 16,756
Offsetting and netting -21,999 -19,510
Off-balance sheet credit facilities and guarantees -118,861 -125,409
Off-balance sheet exposure fraction expected to be drawn prior to default (Credit Conversion Factors) 29,592 30,739
Total Exposure at Default5 393,247 403,565Credit risk RWA / Total Exposure at Default 22.7% 21.0%
1 The comparative figures for 2018 with regard to loans and advances banks, corporate loans and other loans and advances have been restated. Please refer to Note 1 Accounting policies in the Consolidated Annual Financial Statements.
2 The maximum exposure to credit risk includes equity positions as per 2019, comparative figures for 2018 have been restated.3 Main adjustments on assets relate to selected financial assets held for trading and fair value adjustments from hedge accounting.4 Adjustments on valuation include loan impairment allowances.5 ABN AMRO decided to add the fair value adjustment on hedged items to the exposure at default values for Corporate (EUR 0.5 billion) and Retail secured by immovable property
(EUR 2.8 billion) in 2019.
The above table shows the maximum exposure to credit risk and reconciliation with the total exposure at default.
h
IntroductionStrategy and perform
anceLeadership &
governanceAnnual Financial Statem
ents 2019Other
Risk, funding & capital

ABN AMRO Bank Annual Report 2019
IntroductionStrategy and perform
anceRisk, funding &
capitalLeadership structure
GovernanceAnnual Financial Statem
entsOther
IntroductionStrategy and perform
anceLeadership &
governanceAnnual Financial Statem
ents 2019Other
78
Risk, funding & capital
Risk, funding & capital / Risk, funding & capital review / Credit risk
Overall credit risk EAD and RWA b
31 December 2019
Original Exposure at Default
Netting/Exposure at Default
mitigation3
Exposure at Default - of which: RWA
RWA/ Exposure at
Default
(in millions) Derivatives
Securities financing
transactions
Credit risk IRBCentral governments and central banks 61,923 -2,068 63,991 220 42 926 1.4%
Institutions1 14,324 2,165 12,159 1,025 2,067 1,639 13.5%
Corporates 165,251 51,383 113,868 2,665 1,271 39,917 35.1%
Retail 183,858 8,483 175,375 17,378 9.9%
- of which secured by immovable property 165,495 1,634 163,860 13,703 8.4%
- of which qualifying revolving exposures 10,457 5,917 4,540 1,439 31.7%
- of which other retail 7,906 932 6,974 2,237 32.1%
Credit valuation adjustment 370
Securitisation positions 295 295 32 10.7%
Subtotal 425,651 59,962 365,689 3,911 3,380 60,263 16.5%Equities not held for trading 1,010 1,010 3,669 363.3%
Other2 1,247 1,247 16,443 1318.9%
Total IRB 427,908 59,962 367,946 3,911 3,380 80,376 21.8%
Credit risk SACentral governments and central banks 6,251 -25 6,276 30 2 0.0%
Institutions1 23,256 13,701 9,555 3,225 4,535 1,366 14.3%
Corporates 18,546 12,848 5,698 351 1,330 4,756 83.5%
Retail 4,890 3,419 1,471 1,099 74.7%
Secured by mortgages on immovable property 928 214 715 259 36.2%
Exposures in default 257 162 95 130 137.7%
Subtotal 54,128 30,319 23,809 3,606 5,865 7,612 32.0%Other2 1,492 1,492 1,084 72.6%
Total SA 55,620 30,319 25,301 3,606 5,865 8,695 34.4%
Total 483,528 90,281 393,247 7,517 9,245 89,071 22.7%
1 Institutions include exposures to banks and investment undertakings, regional governments and local authorities, and pension funds.2 Other includes default fund contribution under the IRB approach and non-credit obligation assets under the IRB and Standardised Approach.3 Consists mainly of netting, secured funding trades, guarantees, credit conversion factors and impairments under the Standardised Approach.

ABN AMRO Bank Annual Report 2019
79Risk, funding & capital / Risk, funding & capital review / Credit risk
31 December 2018
Original Exposure at Default
Netting/Exposure at Default
mitigation3Exposure at
Default - of which: RWA
RWA/ Exposure at Default
(in millions) Derivatives
Securities financing
transactions
Credit risk IRBCentral governments and central banks 68,928 -2,898 71,827 376 128 694 1.0%
Institutions1 15,911 1,700 14,211 1,384 2,653 2,000 14.1%
Corporates 210,887 88,746 122,141 2,237 1,086 43,691 35.8%
Retail 183,143 8,110 175,033 19,464 11.1%
- of which secured by immovable property 163,174 1,028 162,146 15,097 9.3%
- of which qualifying revolving exposures 11,198 6,066 5,132 1,898 37.0%
- of which other retail 8,771 1,016 7,755 2,470 31.9%
Credit valuation adjustment 497
Securitisation positions 415 415 31 7.4%
Subtotal 479,284 95,657 383,627 3,996 3,867 66,377 17.3%Equities not held for trading 943 943 3,943 418.4%
Other2 1,035 1,035 9,344 902.7%
Total IRB 481,262 95,657 385,605 3,996 3,867 79,664 20.7%
Credit risk SACentral governments and central banks 5,549 -28 5,577 36 0.0%
Institutions1 6,146 20 6,126 2,183 1,946 167 2.7%
Corporates 4,502 1,689 2,813 2,719 96.7%
Retail 4,818 3,409 1,409 1,055 74.9%
Covered bondsSecured by mortgages on immovable property 770 129 641 229 35.7%
Exposures in default 126 82 44 58 129.6%
Subtotal 21,912 5,302 16,610 2,220 1,946 4,227 25.4%Other2 1,351 1,351 810 60.0%
Total SA 23,263 5,302 17,961 2,220 1,946 5,037 28.0%
Total 504,525 100,959 403,565 6,216 5,813 84,701 21.0%
1 Institutions include exposures to banks and investment undertakings, regional governments and local authorities, and pension funds.2 Other includes default fund contribution under the IRB approach and non-credit obligation assets under the IRB and Standardised Approach.3 Consists mainly of netting, secured funding trades, guarantees, credit conversion factors and impairments under the Standardised Approach.
74,000
78,000
82,000
86,000
90,000
31 December 2018
-3,113
6,344 432
707
84,701
RWA flow statement credit risk(in millions)
Business volume
Model changes
Add-on Other 31 December 2019
89,071
Total Credit RWA increased to EUR 89.1 billion (31 December 2018: EUR 84.7 billion). The RWA increase is mainly explained by model updates and add-ons anticipating TRIM and other model reviews. These add-ons were based on preliminary ECB feedback and in anticipation of developments in 2020.
More details on the add-ons anticipating TRIM can be found in the Capital section. The increase was offset primarily by lower business volumes in CIB and Commercial Banking, as well as by the divestment of Private Banking Channel Islands and equensWorldline.
IntroductionStrategy and perform
anceLeadership &
governanceAnnual Financial Statem
ents 2019Other
Risk, funding & capital
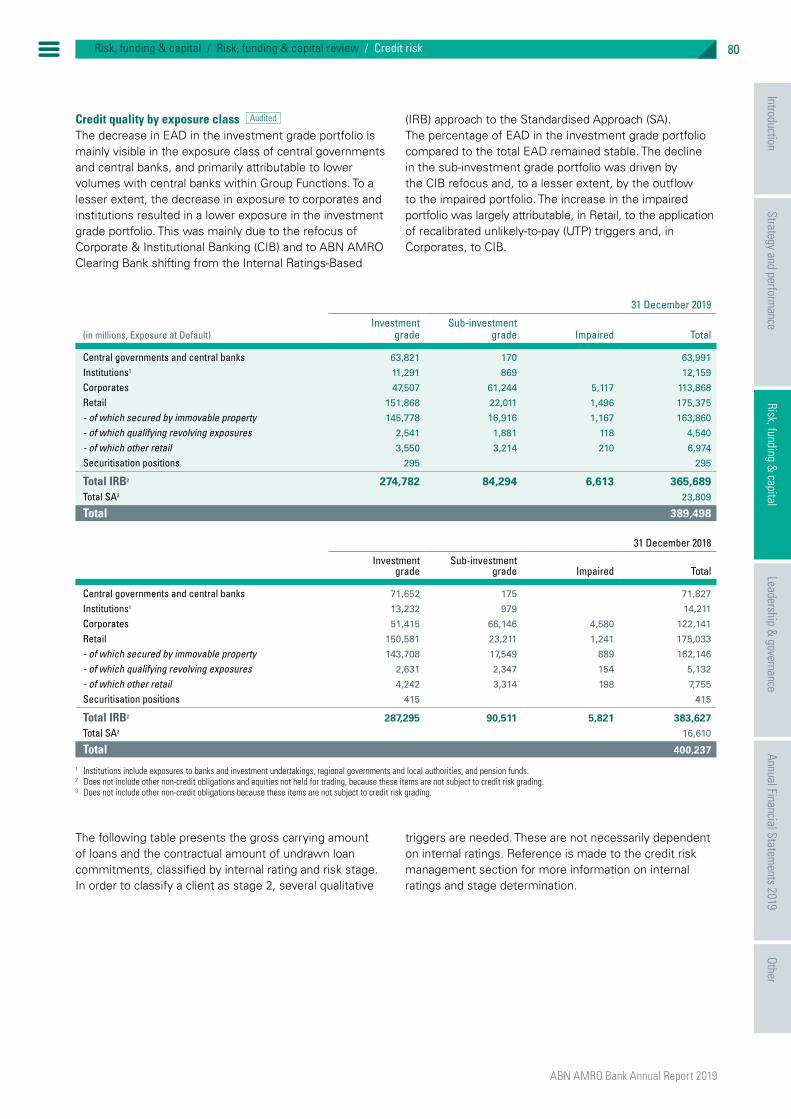
ABN AMRO Bank Annual Report 2019
IntroductionStrategy and perform
anceRisk, funding &
capitalLeadership structure
GovernanceAnnual Financial Statem
entsOther
IntroductionStrategy and perform
anceLeadership &
governanceAnnual Financial Statem
ents 2019Other
80
Risk, funding & capital
Risk, funding & capital / Risk, funding & capital review / Credit risk
Credit quality by exposure class bThe decrease in EAD in the investment grade portfolio is mainly visible in the exposure class of central governments and central banks, and primarily attributable to lower volumes with central banks within Group Functions. To a lesser extent, the decrease in exposure to corporates and institutions resulted in a lower exposure in the investment grade portfolio. This was mainly due to the refocus of Corporate & Institutional Banking (CIB) and to ABN AMRO Clearing Bank shifting from the Internal Ratings-Based
(IRB) approach to the Standardised Approach (SA). The percentage of EAD in the investment grade portfolio compared to the total EAD remained stable. The decline in the sub-investment grade portfolio was driven by the CIB refocus and, to a lesser extent, by the outflow to the impaired portfolio. The increase in the impaired portfolio was largely attributable, in Retail, to the application of recalibrated unlikely-to-pay (UTP) triggers and, in Corporates, to CIB.
31 December 2019
(in millions, Exposure at Default)Investment
gradeSub-investment
grade Impaired Total
Central governments and central banks 63,821 170 63,991
Institutions1 11,291 869 12,159
Corporates 47,507 61,244 5,117 113,868
Retail 151,868 22,011 1,496 175,375
- of which secured by immovable property 145,778 16,916 1,167 163,860
- of which qualifying revolving exposures 2,541 1,881 118 4,540
- of which other retail 3,550 3,214 210 6,974
Securitisation positions 295 295
Total IRB2 274,782 84,294 6,613 365,689Total SA3 23,809
Total 389,498
31 December 2018
Investment grade
Sub-investment grade Impaired Total
Central governments and central banks 71,652 175 71,827
Institutions1 13,232 979 14,211
Corporates 51,415 66,146 4,580 122,141
Retail 150,581 23,211 1,241 175,033
- of which secured by immovable property 143,708 17,549 889 162,146
- of which qualifying revolving exposures 2,631 2,347 154 5,132
- of which other retail 4,242 3,314 198 7,755
Securitisation positions 415 415
Total IRB2 287,295 90,511 5,821 383,627Total SA3 16,610
Total 400,237
1 Institutions include exposures to banks and investment undertakings, regional governments and local authorities, and pension funds.2 Does not include other non-credit obligations and equities not held for trading, because these items are not subject to credit risk grading.3 Does not include other non-credit obligations because these items are not subject to credit risk grading.
The following table presents the gross carrying amount of loans and the contractual amount of undrawn loan commitments, classified by internal rating and risk stage. In order to classify a client as stage 2, several qualitative
triggers are needed. These are not necessarily dependent on internal ratings. Reference is made to the credit risk management section for more information on internal ratings and stage determination.

ABN AMRO Bank Annual Report 2019
81Risk, funding & capital / Risk, funding & capital review / Credit risk
Credit quality by internal rating scale mapped to stages b
31 December 2019 31 December 2018
(in millions) PD scaleUCR
range Stage 1 Stage 2 Stage 3 Total Stage 1 Stage 2 Stage 3 Total
Mortgages0.00 - < 0.03 1 9,983 94 10,078 9,827 9,827
0.03 - < 0.13 2 64,277 629 64,906 61,968 8 61,976
0.13 - < 0.46 3 53,838 1,120 54,958 56,876 61 56,938
0.46 - < 2.22 4 10,970 1,742 12,713 13,358 353 13,711
2.22 - < 16.97 5 1,043 3,223 4,266 3,165 2,069 5,234
16.97 - < 100 6+ 132 134 267 143 199 342
100 6-8 1,038 1,038 763 763
Total Mortgages 140,244 6,943 1,038 148,225 145,337 2,691 763 148,791
Consumer loans0.00 - < 0.03 1 1,339 3 1,342 1,477 1 1,478
0.03 - < 0.13 2 1,256 20 1,275 1,705 13 1,718
0.13 - < 0.46 3 3,952 94 4,046 2,885 112 2,997
0.46 - < 2.22 4 3,545 174 3,719 3,654 257 3,910
2.22 - < 16.97 5 814 504 1,318 898 505 1,402
16.97 - < 100 6+ 92 134 226 150 126 276
100 6-8 368 368 481 481
Total Consumer loans 10,999 928 368 12,294 10,768 1,014 481 12,263
Corporate loans1
0.00 - < 0.03 1 11,635 31 11,666 7,340 1 7,340
0.03 - < 0.13 2 8,313 170 8,484 8,822 45 8,867
0.13 - < 0.46 3 17,776 716 18,492 19,579 771 20,350
0.46 - < 2.22 4 39,136 3,805 42,940 40,874 2,922 43,796
2.22 - < 16.97 5 5,248 3,553 8,801 6,795 4,610 11,405
16.97 - < 100 6+ 2,545 849 3,394 3,846 923 4,769
100 6-8 5,331 5,331 4,636 4,636
Total Corporate loans1 84,652 9,125 5,331 99,107 87,255 9,271 4,636 101,163
Other loans1 , 2
0.00 - < 0.03 1 11,780 11,780 12,580 12,580
0.03 - < 0.13 2 6,955 6,955 7,136 7,136
0.13 - < 0.46 3 5,787 6 5,793 5,159 5,160
0.46 - < 2.22 4 1,140 1,140 472 5 476
2.22 - < 16.97 5 101 64 165 145 149 293
16.97 - < 100 6+ 374 1 375 460 8 468
100 6-8 4 4 6 6
Total Other loans1 , 2 26,139 70 4 26,213 25,952 162 6 26,120
Loan commitments and financial guarantee contracts
0.00 - < 0.03 1 7,195 3 7,198 8,015 4 8,019
0.03 - < 0.13 2 15,164 235 15,399 15,420 48 15,467
0.13 - < 0.46 3 16,791 537 17,328 19,496 299 19,795
0.46 - < 2.22 4 17,268 1,150 18,418 17,926 1,362 19,289
2.22 - < 16.97 5 1,727 930 2,657 1,968 1,078 3,045
16.97 - < 100 6+ 3,027 62 3,089 4,490 189 4,679
100 6-8 1,329 1,329 180 180
Total Loan commitments and financial guarantee contracts 61,172 2,918 1,329 65,419 67,315 2,979 180 70,474
Total0.00 - < 0.03 1 41,932 131 42,064 39,238 6 39,244
0.03 - < 0.13 2 95,966 1,054 97,019 95,051 113 95,164
0.13 - < 0.46 3 98,144 2,473 100,617 103,996 1,243 105,239
0.46 - < 2.22 4 72,060 6,871 78,931 76,284 4,899 81,183
2.22 - < 16.97 5 8,933 8,274 17,208 12,970 8,410 21,380
16.97 - < 100 6+ 6,170 1,181 7,351 9,088 1,445 10,534
100 6-8 8,070 8,070 6,066 6,066
Total 323,205 19,984 8,070 351,259 336,628 16,117 6,066 358,811
1 The comparative figures for 2018 with regard to corporate loans and other loans and advances have been restated. Please refer to Note 1 Accounting policies in the Consolidated Annual Financial Statements.
2 Includes banks, securities financing and government and official institutions.
IntroductionStrategy and perform
anceLeadership &
governanceAnnual Financial Statem
ents 2019Other
Risk, funding & capital

ABN AMRO Bank Annual Report 2019
IntroductionStrategy and perform
anceRisk, funding &
capitalLeadership structure
GovernanceAnnual Financial Statem
entsOther
IntroductionStrategy and perform
anceLeadership &
governanceAnnual Financial Statem
ents 2019Other
82
Risk, funding & capital
Risk, funding & capital / Risk, funding & capital review / Credit risk
The largest part of our portfolio is classified in the highest and mid-range of the internal ratings in stage 1. In 2019 the distribution of internal ratings in stage 1 was comparable to that in 2018. Until a new rating is available, UCR 6+ is also the fall-back rating for clients whose rating has expired. This applies to the majority of the data presented in UCR 6+.
Credit risk concentration bGeographic concentrationThe consolidated exposures in the table below have been classified by the geographical regions where clients are domiciled. The bank monitors and manages country risk based on the country at risk. The country at risk may be different from the country of domicile, for example if the bank finances a project in a country other than the country in which the borrower is domiciled. The bank actively manages and monitors the development of its country risk exposures.
Geographic concentration by EAD b
31 December 2019
(in millions, Exposure at Default) The Netherlands Rest of Europe USA Asia Rest of the world Total
Central governments and central banks 32,013 20,294 7,138 3,609 937 63,991
Institutions1 3,530 6,436 936 765 492 12,159
Corporates 60,669 29,569 8,740 6,496 8,395 113,868
Retail 174,650 549 48 83 46 175,375
- of which secured by immovable property 163,318 391 43 73 35 163,860
- of which qualifying revolving exposures 4,491 41 2 2 5 4,540
- of which other retail 6,840 116 4 8 6 6,974
Securitisation positions 295 295
Total IRB2 271,157 56,847 16,862 10,953 9,869 365,689Total SA3 5,108 14,111 2,268 500 1,822 23,809
Total 276,264 70,958 19,130 11,453 11,692 389,498Percentage of total 70.9% 18.2% 4.9% 2.9% 3.0% 100.0%
31 December 2018
The Netherlands Rest of Europe USA Asia Rest of the world Total
Central governments and central banks 40,352 22,083 6,948 1,572 872 71,827
Institutions1 3,857 7,169 1,413 1,238 534 14,211
Corporates 65,141 30,075 9,623 7,194 10,108 122,141
Retail 174,228 609 53 82 62 175,033
- of which secured by immovable property 161,579 400 47 72 48 162,146
- of which qualifying revolving exposures 5,073 50 2 2 5 5,132
- of which other retail 7,575 159 3 9 8 7,755
Securitisation positions 415 415
Total IRB2 283,992 59,936 18,036 10,087 11,576 383,627Total SA3 2,860 11,269 1,470 510 501 16,610
Total 286,852 71,205 19,506 10,597 12,077 400,237Percentage of total 71.7% 17.8% 4.9% 2.6% 3.0% 100.0%
1 Institutions include exposures to banks and investment undertakings, regional governments and local authorities, and pension funds.2 Total exposure at default does not include EAD calculated for equities not held for trading and other non-credit obligations.3 Exposure at default does not include EAD calculated for other non-credit obligations.
The bank’s portfolio is largely concentrated in the Netherlands (70.9%). Businesses outside the Netherlands are primarily located in neighbouring European countries. Specialised lending activities, such as natural resources (NR), trade & commodity finance (TCF), global transporation & logistics (GTL), clearing and securities financing, are also conducted outside Europe. The Exposure at Default (EAD) in the Netherlands decreased to EUR 276.3 billion at 31 December 2019 (31 December 2018: EUR 286.9 billion), mainly due to the decrease in the central banks exposure class, resulting from a reduction in deposits with such
institutions. The decrease in EAD in the corporates exposure class related primarily to the CIB refocus and was visible in all regions.
Industry concentrationABN AMRO applies industry concentration limits in line with the Industry Classification Benchmark (ICB). In the exposure table, non-material industry clusters are aggregated under Other. Industry concentration limits are established within the bank’s risk appetite, where the

ABN AMRO Bank Annual Report 2019
83Risk, funding & capital / Risk, funding & capital review / Credit risk
thresholds for concentrations are based on relative risk, the importance of the industry to the Dutch economy and expert opinion.
Industry concentration is presented both in terms of the original obligor and in terms of the resultant obligor. The original obligor is the counterparty with whom ABN AMRO has the original contractual relationship, often referred to as the borrower. The resultant obligor is the counterparty
bearing the ultimate credit risk, often referred to as the guarantor. The industry classification of the original obligor may differ from that of the resultant obligor, for example in the real estate, healthcare and public administration sectors. While government-guaranteed exposures are included in the applicable industry in the original obligor view, these exposures are included in public administration in the resultant obligor view as they entail government-related exposures.
Industry concentration by EAD b
31 December 2019
(in millions, Exposure at Default)Exposure at Default
(original obligor)Percentage
of totalExposure at Default
(resultant obligor)Percentage
of total
Industry sectorBanks 17,745 4.6% 18,232 4.7%
Financial services1 18,788 4.8% 18,007 4.6%
Industrial goods and services 25,077 6.4% 24,098 6.2%
Real estate 13,678 3.5% 13,290 3.4%
Oil and gas 14,682 3.8% 13,793 3.5%
Food and beverage 17,515 4.5% 17,339 4.5%
Retail 6,277 1.6% 6,245 1.6%
Basic resources 4,563 1.2% 4,466 1.1%
Healthcare 4,396 1.1% 4,361 1.1%
Construction and materials 4,459 1.1% 4,368 1.1%
Other2 20,582 5.3% 21,765 5.6%
Subtotal Industry Classification Benchmark 147,763 37.9% 145,964 37.5%Private individuals (non-Industry Classification Benchmark) 177,107 45.5% 177,107 45.5%
Public administration (non-Industry Classification Benchmark) 64,628 16.6% 66,427 17.1%
Subtotal non-Industry Classification Benchmark 241,735 62.1% 243,534 62.5%
Exposure at Default3 389,498 100.0% 389,498 100.0%
1 Financial services include asset managers, credit card companies and providers of personal financial services and securities and brokers.2 Other includes travel and leisure, utilities, personal and household goods, media, technology, automobile and parts, chemicals, telecommunication and insurance, in addition to unclassified.3 Exposure at Default does not include other non-credit obligations and equities not held for trading.
31 December 2018
(in millions, Exposure at Default)Exposure at Default
(original obligor)Percentage
of totalExposure at Default
(resultant obligor)Percentage
of total
Industry sectorBanks 14,629 3.7% 14,290 3.6%
Financial services1 20,660 5.2% 20,730 5.2%
Industrial goods and services 26,514 6.6% 26,114 6.5%
Real estate 15,900 4.0% 14,272 3.6%
Oil and gas 15,711 3.9% 14,759 3.7%
Food and beverage 18,436 4.6% 18,221 4.6%
Retail 6,682 1.7% 6,657 1.7%
Basic resources 5,179 1.3% 5,087 1.3%
Healthcare 4,863 1.2% 4,814 1.2%
Construction and materials 4,545 1.1% 4,418 1.1%
Other2 20,224 5.1% 22,302 5.6%
Subtotal Industry Classification Benchmark 153,344 38.3% 151,665 37.9%Private individuals (non-Industry Classification Benchmark) 175,785 43.9% 175,786 43.9%
Public administration (non-Industry Classification Benchmark) 71,107 17.8% 72,786 18.2%
Subtotal non-Industry Classification Benchmark 246,893 61.7% 248,572 62.1%
Exposure at Default3 400,237 100.0% 400,237 100.0%
1 Financial services include asset managers, credit card companies and providers of personal financial services and securities and brokers.2 Other includes travel and leisure, utilities, personal and household goods, media, technology, automobile and parts, chemicals, telecommunication and insurance, in addition to unclassified.3 Exposure at Default does not include other non-credit obligations and equities not held for trading.
IntroductionStrategy and perform
anceLeadership &
governanceAnnual Financial Statem
ents 2019Other
Risk, funding & capital

ABN AMRO Bank Annual Report 2019
IntroductionStrategy and perform
anceRisk, funding &
capitalLeadership structure
GovernanceAnnual Financial Statem
entsOther
IntroductionStrategy and perform
anceLeadership &
governanceAnnual Financial Statem
ents 2019Other
84
Risk, funding & capital
Risk, funding & capital / Risk, funding & capital review / Credit risk
The decrease in EAD is mainly explained by a decrease in public administration (non-ICB) due to lower volumes with central banks within Group Functions. In addition, lower exposures are visible in the CIB-related sectors (oil and gas, industrial goods and services and, to a lesser extent, food and beverage). This decrease is partly offset by higher exposure values for private individuals.
Credit risk mitigation bCollateral reporting is based on the net collateral value (NCV). The NCV is a conservative value and represents
the amount the bank expects to recover from the collateral pledged to the bank if the client defaults. Where necessary, certain discounts are applied.
The NCV is approached by an average recovery rate observed for the specific type of collateral and, where applicable, by applying haircuts, for example in the event of currency mismatches. Surplus collateral is the amount of over-collateralisation, calculated on an individual basis. A surplus is not included for guarantees as the debtor cannot be liable for more than the maximum debt.
Financial assets: offsetting, netting, collateral and guarantees b
31 December 2019
Offset in the statement of financial position
Not offset in the statement of financial position
Net exposure4
(in millions)
Carrying amount before
balance- sheet netting
Balance sheet
netting with gross
liabilitiesCarrying amount1
Master netting agree-
ment2
Financial instru-ments
collateral
Property & equip-
ment
Other collateral and guar-
anteesTotal risk
mitigation
Surplus collat-
eral3
Financial assets held for trading 1,137 1,137 1,137
Derivatives 5,730 5,730 3,760 194 3,954 1,776
Financial investments 45,277 45,277 45,277
Securities financing 16,994 2,089 14,905 474 16,810 17,283 2,637 258Interest-bearing deposits 2,034 526 1,508 16 39 55 1,453
Loans and advances 1,784 1,784 1,014 323 106 1,443 323 664
Other 1,719 1,719 1 1 1,718
Total loans and advances banks 5,537 526 5,011 1,030 323 106 40 1,499 323 3,836Loans and advances
customersResidential mortgages 148,085 148,085 2,757 222,219 1,245 226,221 81,051 2,915
Consumer loans 11,999 2 11,997 5,510 5,939 119 11,569 5,722 6,149
Corporate loans 98,883 1,758 97,125 2,834 30,631 55,424 10,193 99,083 30,985 29,027
Other loans and advances customers 6,297 10 6,286 990 100 76 1,166 44 5,164
Fair value adjustment from hedge accounting 3,342 3,342 3,342
Total loans and advances customers 268,606 1,771 266,835 3,824 38,899 283,683 11,634 338,039 117,802 46,599Loans at fair value
through P&L 1,267 1,267 12 1,198 1,210 3 60
Total loans and advances customers 269,872 1,771 268,102 3,824 38,899 283,695 12,831 339,248 117,806 46,659
Other assets 3,200 3,200 3 65 68 3,132
Total on-balance sheet subject to netting and pledged agreements 347,748 4,386 343,362 9,090 56,226 283,801 12,937 362,053 120,766 102,076
Assets not subject to netting and pledged agreements 31,691 31,691 31,691
Total assets 379,440 4,386 375,054 9,090 56,226 283,801 12,937 362,053 120,766 133,767Total off-balance sheet 118,861 118,861 7,290 8,648 8,839 24,778 7,494 101,578
Total on- and off-balance sheet 498,301 4,386 493,915 9,090 63,516 292,449 21,776 386,831 128,260 235,345
1 Carrying amount includes Loan impairment allowances where applicable.2 Collateral in the column Master netting agreement is mainly markets related and consists of Master netting agreements which also includes cash collateral as part of these agreements.
Cash collateral not part of Master netting agreements has been reported under Financial instruments.3 Surplus collateral is the amount of over-collateralisation, calculated on an individual basis.4 Net exposure represents the portfolio corrected for the surplus amount and gives a view on the potential shortfall in collateral on the total portfolio.

ABN AMRO Bank Annual Report 2019
85Risk, funding & capital / Risk, funding & capital review / Credit risk
31 December 2018
Offset in the statement of financial position
Not offset in the statement of financial position
Net exposure6
(in millions)
Carrying amount before
balance- sheet netting
Balance sheet
netting with gross
liabilitiesCarrying amount3
Master netting agree-ment4
Financial instru-ments
collateral
Property & equip-
ment
Other collateral and guar-
anteesTotal risk
mitigationSurplus
collateral5
Financial assets held for trading 495 495 495
Derivatives 6,191 6,191 4,107 63 4,170 2,021
Financial investments 42,184 42,184 42,184
Securities financing 17,613 5,238 12,375 583 19,654 20,237 8,161 299Interest-bearing deposits1 2,681 536 2,144 4 44 48 2,096
Loans and advances 2,870 2,870 1,784 849 100 2,734 753 889
Other 1,765 1,765 50 50 1,715
Total loans and advances banks1 7,316 536 6,780 1,788 849 100 95 2,832 753 4,700
Loans and advances customers
Residential mortgages 148,683 148,683 2,334 225,119 1,320 228,774 83,142 3,052
Consumer loans 11,948 3 11,945 4,038 5,008 34 9,081 3,893 6,757
Corporate loans1 , 2 102,388 3,051 99,338 1,951 34,554 56,713 13,081 106,299 31,202 24,240
Other loans and advances - customers1 , 2 6,949 1 6,948 717 196 115 1,028 41 5,961
Fair value adjustment from hedge accounting 3,185 3,185 3,185
Total loans and advances customers 273,153 3,055 270,099 2,668 40,926 287,037 14,551 345,182 118,278 43,195Loans at fair value
through P&L 787 787 530 530 98 355
Total loans and advances customers 273,941 3,055 270,886 2,668 40,926 287,037 15,081 345,712 118,377 43,550
Other assets 2,450 2,450 14 2 104 120 2 2,332
Total on-balance sheet subject to netting and pledged agreements1 350,191 8,830 341,361 9,160 61,495 287,137 15,280 373,072 127,293 95,582
Assets not subject to netting and pledged agreements1 39,933 39,933 39,933
Total assets 390,124 8,830 381,295 9,160 61,495 287,137 15,280 373,072 127,293 135,516Total off-balance sheet 125,409 125,409 7,294 9,803 8,547 25,644 7,621 107,385
Total on- and off-balance sheet 515,533 8,830 506,703 9,160 68,789 296,940 23,827 398,716 134,914 242,901
1 The comparative figures for 2018 with regard to loans and advances banks, corporate loans and other loans and advances have been restated. Please refer to Note 1 Accounting policies in the Consolidated Annual Financial Statements.
2 In line with restated corporate loans and other loans and advances customers (footnote 1), the corresponding collateral was also restated.3 Carrying amount includes Loan impairment allowances where applicable.4 Collateral in the column master netting agreement is mainly markets related and consists of master netting agreements which also includes cash collateral as part of these agreements.
Cash collateral not part of master netting agreements has been reported under financial instruments.5 Surplus collateral is the amount of over-collateralisation, calculated on an individual basis.6 Net exposure represents the portfolio corrected for the surplus amount and gives a view on the potential shortfall in collateral on the total portfolio.
Total net exposure of loans and advances customers increased to EUR 46.6 billion (31 December 2018: EUR 43.2 billion). This increase was mainly attributable to corporate loans (EUR 4.8 billion) and partly offset by decreases in other loans and advances, consumer loans and residential mortgages.
For corporate loans, the net exposure increased to EUR 29.0 billion (31 December 2018: EUR 24.2 billion) owing to a relatively larger decrease in total risk mitigation
compared with the decrease in the carrying amount. The decrease was observed in collateral for financial instruments and other collateral and guarantees, as well as in property and equipment, and was largely attributable to CIB.
Although the net exposure for residential mortgages marginally improved to EUR 2.9 billion (31 December 2018: EUR 3.1 billion), property and equipment collateral decreased to EUR 2.9 billion. This was as a result of back testing, which is performed every three years. The back testing
IntroductionStrategy and perform
anceLeadership &
governanceAnnual Financial Statem
ents 2019Other
Risk, funding & capital

ABN AMRO Bank Annual Report 2019
IntroductionStrategy and perform
anceRisk, funding &
capitalLeadership structure
GovernanceAnnual Financial Statem
entsOther
IntroductionStrategy and perform
anceLeadership &
governanceAnnual Financial Statem
ents 2019Other
86
Risk, funding & capital
Risk, funding & capital / Risk, funding & capital review / Credit risk
performed in 2019 showed that the market value of the collateral, based on the indexation method without a haircut, should be reduced by 4%. As a result, the valuation method for residential real estate within residential mortgages was adjusted and a haircut applied from November 2019. The haircut means that an increase in the collateral value will be taken into account for 75%, while a decrease in the collateral will be taken into
account for 100%. The impact of these updates was a EUR 13.0 billion decrease in the Net Collateral Value (NCV), which was largely offset by indexation.
For consumer loans, the net exposure decreased markedly to EUR 6.1 billion (31 December 2018: EUR 6.8 billion) owing to increased risk mitigation. The increase in total risk mitigation was observed mainly in collateral for financial instruments and largely attributable to Private Banking clients.
Financial assets: offsetting, netting, collateral and guarantees for credit-impaired assets b
31 December 2019Offset in the statement
of financial positionNot offset in the statement
of financial positionNet
exposure5
(in millions)
Carrying amount before
balance- sheet netting
Balance sheet
netting with gross
liabilitiesCarrying amount2
Master netting agree-
ment3
Financial instru-ments
collateral
Property & equip-
ment
Other collat-
eral and guaran-
teesTotal risk
mitigationSurplus
collateral4
Loans and advances banksLoans and advances
customersResidential mortgages 973 973 11 1,207 10 1,228 260 5
Consumer loans 170 170 5 98 103 30 96
Corporate loans 3,604 3,604 581 2,930 347 3,858 811 557
Other loans and advances customers
Total Loans and advances customers 4,747 4,747 597 4,235 357 5,189 1,101 659
Total loans and advances 4,747 4,747 597 4,235 357 5,189 1,101 659
31 December 2018
Loans and advances banksLoans and advances
customersResidential mortgages 686 686 7 875 9 891 211 6
Consumer loans 252 252 13 181 194 45 102
Corporate loans1 3,084 3,084 420 2,604 244 3,268 632 449
Other loans and advances customers1 2 2 2
Total Loans and advances customers 4,024 4,024 440 3,660 253 4,353 888 559
Total loans and advances 4,024 4,024 440 3,660 253 4,353 888 559
1 The comparative figures for 2018 with regard to corporate loans and other loans and advances have been restated. Please refer to Note 1 Accounting policies in the Consolidated Annual Financial Statements.
2 Carrying amount includes loan impairment allowances where applicable.3 Collateral in the column master netting agreement is mainly markets related and consists of master netting agreements which also includes cash collateral as part of these agreements.
Cash collateral not part of master netting agreements has been reported under financial instruments.4 Surplus collateral is the amount of over-collateralisation, calculated on an individual basis.5 Net exposure represents the portfolio corrected for the surplus amount and gives a view on the potential shortfall in collateral on the total portfolio.
Collateral and guarantees for credit-impaired assets (stage 3) represent credit risk mitigation based on the NCV for clients in default. The carrying amount includes expected credit loss allowances, based on the probability-weighted present value of all expected cash shortfalls over the remaining life of the financial instrument for both on- and off-balance sheet exposures. The Financial
Restructuring & Recovery department identifies the most likely scenarios for non-programme lending defaulted clients (going concern or gone concern) and, using its professional judgement, the amounts and timing of expected future cash flows. This explains why a net exposure remains after collateral pledged to the bank has been taken into account.

ABN AMRO Bank Annual Report 2019
87Risk, funding & capital / Risk, funding & capital review / Credit risk
Net exposure for credit-impaired assets (stage 3) increased to EUR 0.7 billion (31 December 2018: EUR 0.6 billion), which was mostly attributable to corporate loans. Although the increase in collateral for corporate loans in stage 3 was in line with the increase in the corporate stage 3 exposure, part of the increase in collateral related to surplus collateral, mainly in the industrial goods and services sector. This led to an increase in net exposure.
During 2019, ABN AMRO obtained property and equipment by taking possession of collateral held as security for loans and advances. The total amount of such assets held on 31 December 2019 amounted to EUR 4 million (2018: EUR 5 million). ABN AMRO does not intend to use these assets in its operations and will pursue timely and orderly realisation of the collateral.
Financial liabilities: offsetting, netting, collateral and guarantees b
31 December 2019Offset in the statement
of financial positionNot offset in the statement
of financial positionNet
exposure
(in millions)
Carrying amount
before bal-ance-sheet
netting
Balance sheet netting
with gross assets
Carrying amount
Master netting
agreement1
Financial instruments
collateralTotal risk
mitigationSurplus
collateral
Financial liabilities held for trading 675 675 675
Derivatives 6,505 6,505 5,907 192 6,099 406
Securities financing 10,323 2,089 8,234 474 10,035 10,509 2,868 594Deposits 13,047 262 12,785 625 625 12,160
Other
Due to banks 13,047 262 12,785 625 625 12,160Deposits 236,059 2,035 234,023 1,281 1,281 232,742
Other borrowings 967 967 802 802 165
Due to customers 237,026 2,035 234,991 2,083 2,083 232,908
Other liabilities 4,030 4,030 4,030
Total liabilities subject to netting arrangements 271,606 4,386 267,220 9,090 10,227 19,317 2,868 250,771
Remaining liabilities not subject to netting 86,362 86,362 86,362
Total liabilities 357,969 4,386 353,582 9,090 10,227 19,317 2,868 337,134
1 Collateral in the column master netting agreement is mainly markets related and consists of master netting agreements which also includes cash collateral as part of these agreements. Cash collateral not part of master netting agreements has been reported under financial instruments.
31 December 2018
Offset in the statement of financial position
Not offset in the statement of financial position
Net exposure
(in millions)
Carrying amount be-
fore balance- sheet netting
Balance sheet netting
with gross assets
Carrying amount
Master netting
agreement2
Financial instruments
collateralTotal risk
mitigationSurplus
collateral
Financial liabilities held for trading 253 253 253
Derivatives 7,159 7,159 6,296 63 6,359 800
Securities financing 12,645 5,238 7,407 531 12,894 13,425 6,494 476Deposits1 13,654 233 13,421 495 495 12,925
Other1 16 16 16
Due to banks 13,670 233 13,437 495 495 12,941.49Deposits 238,666 3,353 235,313 1,170 1,170 234,143
Other borrowings 810 810 667 667 143
Due to customers 239,476 3,353 236,123 1,837 1,837 234,286
Other liabilities 3,691 5 3,686 3,686
Total liabilities subject to netting arrangements 276,894 8,830 268,065 9,160 12,957 22,117 6,494 252,442Remaining liabilities not subject to netting 91,870 91,870 91,870
Total liabilities 368,764 8,830 359,935 9,160 12,957 22,117 6,494 344,312
1 In 2018 master netting agreements at due to banks were partly reported at other instead of deposits. This had been restated.2 Collateral in the column master netting agreement is mainly markets related and consists of master netting agreements which also includes cash collateral as part of these agreements.
Cash collateral not part of master netting agreements has been reported under financial instruments.
IntroductionStrategy and perform
anceLeadership &
governanceAnnual Financial Statem
ents 2019Other
Risk, funding & capital

ABN AMRO Bank Annual Report 2019
IntroductionStrategy and perform
anceRisk, funding &
capitalLeadership structure
GovernanceAnnual Financial Statem
entsOther
IntroductionStrategy and perform
anceLeadership &
governanceAnnual Financial Statem
ents 2019Other
88
Risk, funding & capital
Risk, funding & capital / Risk, funding & capital review / Credit risk
Management of forborne, past due and credit-impaired loans bForborne exposures bClients in (or potentially in) financial difficulty whose contracts have been amended in ways that are regarded
as concessions on the part of the bank are accounted for as forborne assets. The following table provides an overview of forborne assets, broken down into performing and non-performing assets, and classified by the type of forbearance measure.
Overview of forborne assets b
31 December 2019
Gross carrying amount2
Performing assets
Total performing
forborne assets
Non-performing assets Total non-per-forming
forborne assets
Total forborne
assets
For-bear-ance ratio(in millions)
Tem-porary modifi-cation
Perma-nent
modifi-cation
Refi-nanc-
ing
Tem-porary modifi-cation
Perma-nent
modifi-cation
Refi-nanc-
ing
Loans and advances banks 5,016 0.0%
Loans and advances customersResidential mortgages 148,225 332 8 9 350 479 6 19 503 853 0.6%
Consumer loans 12,294 28 14 159 200 22 16 63 102 302 2.5%
Corporate loans 99,107 537 1,169 276 1,983 407 1,946 869 3,221 5,204 5.3%
Other loans and advances customers 6,292 6 6 6 0.1%
Total loans and advances customers1 265,918 897 1,198 444 2,538 907 1,969 951 3,827 6,365 2.4%Loans at fair value through P&L 1,267
Total loans and advances 272,201 897 1,198 444 2,538 907 1,969 951 3,827 6,365 2.3%Other assets 3,200 0.0%
Total on-balance 275,402 897 1,198 444 2,538 907 1,969 951 3,827 6,365 2.3%
1 Excluding loans at fair value through P&L.2 Gross carrying amount excludes fair value adjustments from hedge accounting.
31 December 2018
Gross carrying amount3
Performing assets
Total performing
forborne assets
Non-performing assetsTotal
non-per-forming
forborne assets
Total forborne
assets
For-bear-ance ratio(in millions)
Tem-porary modifi-cation
Perma-nent
modifi-cation
Refi-nanc-
ing
Tem-porary modifi-cation
Perma-nent
modifi-cation
Refi-nanc-
ing
Loans and advances banks1 6,789 0.0%
Loans and advances customersResidential mortgages 148,791 265 16 29 309 385 9 18 412 721 0.5%
Consumer loans 12,263 48 18 168 235 44 44 73 161 396 3.2%
Corporate loans1 101,163 437 938 411 1,786 511 1,384 1,020 2,915 4,700 4.6%
Other loans and advances customers1 6,957 3 3 3 0.0%
Total Loans and advances customers2 269,174 750 975 608 2,333 940 1,436 1,111 3,488 5,820 2.2%Loans at fair value through P&L 787
Total loans and advances 276,750 750 975 608 2,333 940 1,436 1,111 3,488 5,820 2.1%
Other assets 2,077 0.0%
Total on-balance 278,827 750 975 608 2,333 940 1,436 1,111 3,488 5,821 2.1%
1 The comparative figures for 2018 with regard to loans and advances banks, corporate loans and other loans and advances have been restated. Please refer to Note 1 Accounting policies in the Consolidated Annual Financial Statements.
2 Excluding loans at fair value through P&L.3 Gross carrying amount excludes fair value adjustments from hedge accounting.

ABN AMRO Bank Annual Report 2019
89Risk, funding & capital / Risk, funding & capital review / Credit risk
In 2019, the total forborne portfolio increased to EUR 6.4 billion (2018 EUR 5.8 billion). This rise was mainly driven by growth in forborne corporate loans and, to a lesser extent, in forborne residential mortgages. Consumer loans, however, showed a decrease in forborne assets.
The increase in forborne corporate loans was primarily caused by new forborne clients in Commercial Banking and CIB, generated by the growth in the Dutch food and beverage sector and in the oil and gas sector in the United States, Asia and the Rest of the World.
The rise in forbearance for residential mortgages relates to changes in the definition of unlikely-to-pay contracts and payment agreements.
Past due exposures bWhen a counterparty is past due or exceeds its credit limit, all loans and advances (total gross carrying amount) in the related credit arrangement are considered to be past due. Materiality thresholds are applied for counterparties transferring to stage 3 (EUR 500 for programme lending and EUR 5,000 for non-programme lending). Below these thresholds, amounts are reported as >90 days past due.
Ageing of past due not classified as stage 3 b
31 December 2019Days past due
(in millions)Gross carrying
amount2
Assets not classified as stage 3
≤ 30 days
> 30 days & ≤ 90 days
> 90 days3
Total past due but not stage 3
Past due ratio
Securities financing 14,905 14,905
Loans and advances banks 5,016 5,016 0.0%
Loans and advances customersResidential mortgages 148,225 147,187 1,314 69 9 1,393 0.9%
Consumer loans 12,294 11,927 245 100 93 437 3.6%
Corporate loans1 99,107 93,777 1,035 246 76 1,357 1.4%
Other loans and advances customers1 6,292 6,288 0.0%
Total Loans and advances customers1 265,918 259,178 2,594 415 178 3,187 1.2%Loans at fair value through P&L 1,267 1,267
Total Loans and advances customers 267,185 260,445 2,594 415 178 3,187 1.2%Other assets 3,200 3,198 265 48 1 314 9.8%
Total assets 290,307 283,564 2,859 463 179 3,501 1.2%
1 Excluding loans at fair value through P&L.2 Gross carrying amount excludes fair value adjustments from hedge accounting.3 Materiality thresholds are applied for counterparties transferring to stage 3. Below these thresholds, amounts are reported on > 90 days past due.
31 December 2018
Days past due
(in millions)Gross carrying
amount3 Assets not
classified as stage 3≤ 30
days> 30 days &
≤ 90 days> 90
days4Total past due
but not stage 3Past due
ratio
Securities financing 12,375 12,375
Loans and advances banks1 6,789 6,789 0.0%
Loans and advances customersResidential mortgages 148,791 148,028 1,834 140 11 1,985 1.3%
Consumer loans 12,263 11,782 193 122 76 391 3.2%
Corporate loans1 , 2 101,163 96,527 794 303 105 1,202 1.2%
Other loans and advances customers1 , 2 6,957 6,951 0.0%
Total Loans and advances customers2 269,174 263,287 2,821 565 192 3,577 1.3%Loans at fair value through P&L 787 787
Total Loans and advances customers 269,961 264,075 2,821 565 192 3,577 1.3%
Other assets 2,077 2,075 267 67 11 344 16.6%
Total assets 291,201 285,312 3,088 631 202 3,921 1.3%
1 The comparative figures for 2018 with regard to loans and advances banks, corporate loans and other loans and advances have been restated. Please refer to Note 1 Accounting policies in the Consolidated Annual Financial Statements.
2 Excluding loans at fair value through P&L.3 Gross carrying amount excludes fair value adjustments from hedge accounting.4 Materiality thresholds are applied for counterparties which are transferred to impaired. Below these thresholds, amounts are reported on > 90 days past due.
IntroductionStrategy and perform
anceLeadership &
governanceAnnual Financial Statem
ents 2019Other
Risk, funding & capital
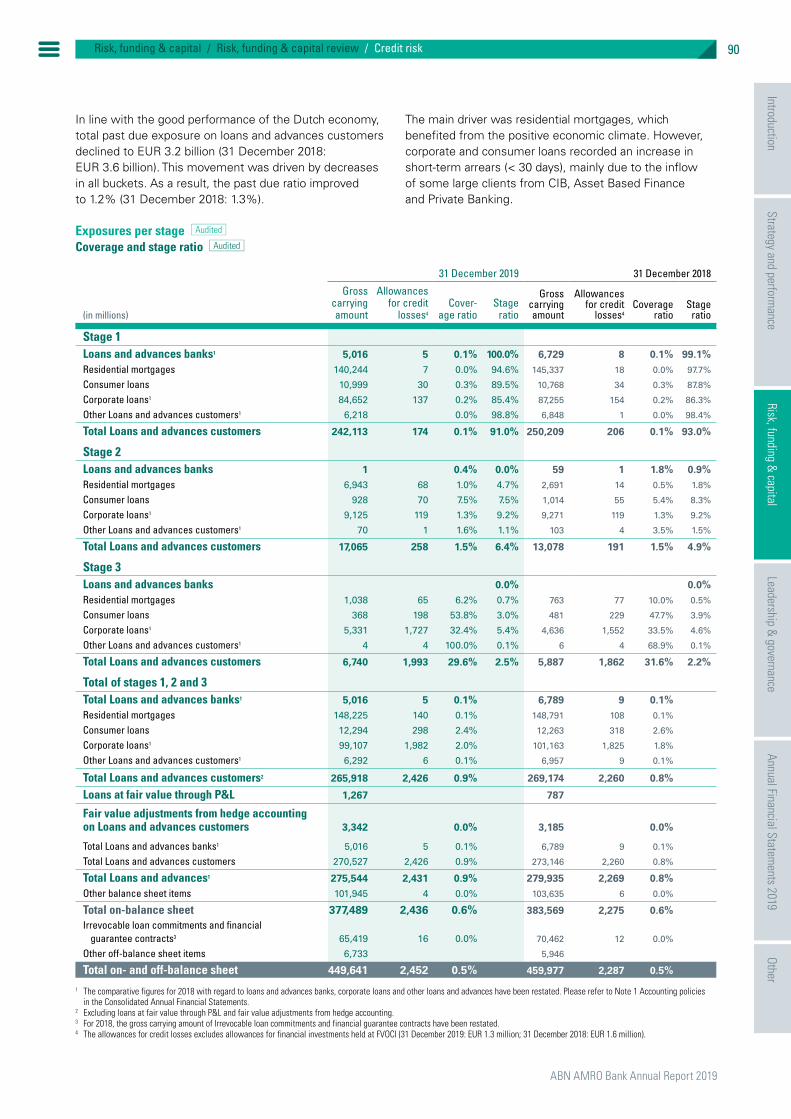
ABN AMRO Bank Annual Report 2019
IntroductionStrategy and perform
anceRisk, funding &
capitalLeadership structure
GovernanceAnnual Financial Statem
entsOther
IntroductionStrategy and perform
anceLeadership &
governanceAnnual Financial Statem
ents 2019Other
90
Risk, funding & capital
Risk, funding & capital / Risk, funding & capital review / Credit risk
In line with the good performance of the Dutch economy, total past due exposure on loans and advances customers declined to EUR 3.2 billion (31 December 2018: EUR 3.6 billion). This movement was driven by decreases in all buckets. As a result, the past due ratio improved to 1.2% (31 December 2018: 1.3%).
The main driver was residential mortgages, which benefited from the positive economic climate. However, corporate and consumer loans recorded an increase in short-term arrears (< 30 days), mainly due to the inflow of some large clients from CIB, Asset Based Finance and Private Banking.
Exposures per stage bCoverage and stage ratio b
31 December 2019 31 December 2018
(in millions)
Gross carrying amount
Allowances for credit
losses4
Cover-age ratio
Stage ratio
Gross carrying amount
Allowances for credit
losses4Coverage
ratioStage
ratio
Stage 1Loans and advances banks1 5,016 5 0.1% 100.0% 6,729 8 0.1% 99.1%Residential mortgages 140,244 7 0.0% 94.6% 145,337 18 0.0% 97.7%
Consumer loans 10,999 30 0.3% 89.5% 10,768 34 0.3% 87.8%
Corporate loans1 84,652 137 0.2% 85.4% 87,255 154 0.2% 86.3%
Other Loans and advances customers1 6,218 0.0% 98.8% 6,848 1 0.0% 98.4%
Total Loans and advances customers 242,113 174 0.1% 91.0% 250,209 206 0.1% 93.0%
Stage 2Loans and advances banks 1 0.4% 0.0% 59 1 1.8% 0.9%Residential mortgages 6,943 68 1.0% 4.7% 2,691 14 0.5% 1.8%
Consumer loans 928 70 7.5% 7.5% 1,014 55 5.4% 8.3%
Corporate loans1 9,125 119 1.3% 9.2% 9,271 119 1.3% 9.2%
Other Loans and advances customers1 70 1 1.6% 1.1% 103 4 3.5% 1.5%
Total Loans and advances customers 17,065 258 1.5% 6.4% 13,078 191 1.5% 4.9%
Stage 3Loans and advances banks 0.0% 0.0%Residential mortgages 1,038 65 6.2% 0.7% 763 77 10.0% 0.5%
Consumer loans 368 198 53.8% 3.0% 481 229 47.7% 3.9%
Corporate loans1 5,331 1,727 32.4% 5.4% 4,636 1,552 33.5% 4.6%
Other Loans and advances customers1 4 4 100.0% 0.1% 6 4 68.9% 0.1%
Total Loans and advances customers 6,740 1,993 29.6% 2.5% 5,887 1,862 31.6% 2.2%
Total of stages 1, 2 and 3Total Loans and advances banks1 5,016 5 0.1% 6,789 9 0.1%Residential mortgages 148,225 140 0.1% 148,791 108 0.1%
Consumer loans 12,294 298 2.4% 12,263 318 2.6%
Corporate loans1 99,107 1,982 2.0% 101,163 1,825 1.8%
Other Loans and advances customers1 6,292 6 0.1% 6,957 9 0.1%
Total Loans and advances customers2 265,918 2,426 0.9% 269,174 2,260 0.8%
Loans at fair value through P&L 1,267 787
Fair value adjustments from hedge accounting on Loans and advances customers 3,342 0.0% 3,185 0.0%
Total Loans and advances banks1 5,016 5 0.1% 6,789 9 0.1%
Total Loans and advances customers 270,527 2,426 0.9% 273,146 2,260 0.8%
Total Loans and advances1 275,544 2,431 0.9% 279,935 2,269 0.8%Other balance sheet items 101,945 4 0.0% 103,635 6 0.0%
Total on-balance sheet 377,489 2,436 0.6% 383,569 2,275 0.6%Irrevocable loan commitments and financial
guarantee contracts3 65,419 16 0.0% 70,462 12 0.0%
Other off-balance sheet items 6,733 5,946
Total on- and off-balance sheet 449,641 2,452 0.5% 459,977 2,287 0.5%
1 The comparative figures for 2018 with regard to loans and advances banks, corporate loans and other loans and advances have been restated. Please refer to Note 1 Accounting policies in the Consolidated Annual Financial Statements.
2 Excluding loans at fair value through P&L and fair value adjustments from hedge accounting.3 For 2018, the gross carrying amount of Irrevocable loan commitments and financial guarantee contracts have been restated.4 The allowances for credit losses excludes allowances for financial investments held at FVOCI (31 December 2019: EUR 1.3 million; 31 December 2018: EUR 1.6 million).

ABN AMRO Bank Annual Report 2019
91Risk, funding & capital / Risk, funding & capital review / Credit risk
The stage 3 impaired ratio at year-end 2019 increased, whereas the stage 3 coverage ratio for loans and advances customers decreased. The stage 3 impaired ratio increased mainly as a result of the inflow of new stage 3 corporate loans clients, who were transferred from stages 1 and 2 during the year. This inflow was largely attributable to clients in the energy-offshore and logistics sectors and to trade and commodity finance within CIB and to the healthcare sector in Commercial Banking. As the provisions made on this inflow were lower than on the existing stage 3 exposure, the overall stage 3 coverage ratio for loans and advances customers decreased.
The stage 2 ratio for residential mortgages also increased. This was related to enhanced provisioning on interest-only mortgages in response to the ECB’s supervisory expectations. Based on affordability tests, remaining time to repayment and loan-to-market value (LtMV) at maturity, additional impairment charges were taken in stage 2 and clients were transferred from stage 1 to stage 2. Without this approach, the coverage ratio and the stage ratio for stage 2 would have remained stable.
The stage 3 ratio for residential mortgages also increased during 2019, largely due to a recalibration of the UTP triggers. This recalibration was applied for the first time on 30 June 2019 and was recognised prospectively from that date onwards. A gross carrying amount of around EUR 124 million and an allowance for credit losses of around EUR 6 million was transferred from stage 1 to stage 3. Another EUR 248 million of a gross carrying amount and an allowance for credit losses of EUR 8 million was transferred from stage 2 to stage 3. Excluding this impact, the stage 3 ratio would have decreased slightly to 0.4%. The provisions for the clients transferred to stage 3 were relatively low compared to the existing stage 3 provisions. Combined with the release in allowances in stage 3 due to model updates, the indexation of collateral and the change in arrears, this resulted in a decrease in the stage 3 coverage ratio to 6.2% (31 December 2018: 10.0%). Excluding the impact of the recalibration of UTP triggers, the stage 3 coverage ratio would have been 7.6%.
Overview of performing and non-performing assets
31 December 2019
Performing assets
Total performing
assetsNon-performing
assets
Total non- performing
assets Total
(in millions) Stage 1 Stage 2 Stage 2Stage 3
(default)
Loans and advances banks 5,016 1 5,016 5,016
Loans and advances customersResidential mortgages 140,244 6,826 147,070 117 1,038 1,155 148,225
Consumer loans 10,999 926 11,924 2 368 370 12,294
Corporate loans 84,652 9,036 93,688 88 5,331 5,419 99,107
Other loans and advances customers 6,218 70 6,288 4 4 6,292
Total loans and advances customers 242,113 16,857 258,970 208 6,740 6,948 265,918
31 December 2018
Performing assets
Total performing
assetsNon-performing
assets
Total non- performing
assets Total
(in millions) Stage 1 Stage 2 Stage 2Stage 3
(default)
Loans and advances banks 6,729 59 6,789 6,789
Loans and advances customersResidential mortgages 145,337 2,623 147,960 68 763 831 148,791
Consumer loans 10,768 1,004 11,772 10 481 491 12,263
Corporate loans 87,255 9,194 96,449 77 4,636 4,714 101,163
Other loans and advances customers 6,848 103 6,951 6 6 6,957
Total loans and advances customers 250,209 12,923 263,132 155 5,887 6,042 269,174
IntroductionStrategy and perform
anceLeadership &
governanceAnnual Financial Statem
ents 2019Other
Risk, funding & capital

ABN AMRO Bank Annual Report 2019
IntroductionStrategy and perform
anceRisk, funding &
capitalLeadership structure
GovernanceAnnual Financial Statem
entsOther
IntroductionStrategy and perform
anceLeadership &
governanceAnnual Financial Statem
ents 2019Other
92
Risk, funding & capital
Risk, funding & capital / Risk, funding & capital review / Credit risk
Exposure flow b
2019(in millions) Stage 1 Stage 2 Stage 3 Total
Gross carrying amount of total loans and advances1 , 2
Balance at 1 January 2019 256,938 13,137 5,887 275,962Transfer to stage 1 3,499 -3,456 -43
Transfer to stage 2 -12,374 12,758 -384
Transfer to stage 3 -1,521 -1,433 2,954
Additional drawdowns and partial repayments -20,836 -1,591 -540 -22,966
Originated or purchased 43,058 43,058
Matured or sold -22,760 -2,284 -597 -25,640
Write offs -608 -608
Foreign exchange 1,046 61 36 1,143
Other movements 78 -126 35 -13
Balance at 31 December 2019 247,129 17,066 6,740 270,935
1 Excluding loans at fair value through P&L.2 Gross carrying amount excludes fair value adjustments from hedge accounting.
2018
(in millions) Stage 1 Stage 2 Stage 3 Total
Gross carrying amount of total loans and advances1 , 2
Balance at 1 January 2018 258,972 14,871 6,981 280,824Transfer to stage 1 6,378 -6,158 -220
Transfer to stage 2 -9,011 9,388 -377
Transfer to stage 3 -1,301 -1,022 2,323
Additional drawdowns and partial repayments -32,161 2,504 -1,012 -30,670
Originated or purchased 52,552 52,552
Matured or sold -20,185 -6,525 -866 -27,576
Write offs -1,068 -1,068
Foreign exchange 1,537 122 98 1,758
Other movements 157 -43 29 143
Balance at 31 December 2018 256,938 13,137 5,887 275,962
1 Excluding loans at fair value through P&L.2 Gross carrying amount excludes fair value adjustments from hedge accounting.
2019
(in millions) Stage 1 Stage 2 Stage 3 Total
Gross carrying amount of Residential mortgages1
Balance at 1 January 2019 145,337 2,691 763 148,791Transfer to stage 1 818 -798 -20
Transfer to stage 2 -6,625 6,847 -222
Transfer to stage 3 -329 -348 677
Additional drawdowns and partial repayments -5,866 28 -5,838
Originated or purchased 15,481 15,481
Matured or sold -8,521 -1,472 -138 -10,131
Write offs -22 -22
Foreign exchange 1
Other movements -52 -5 -57
Balance at 31 December 2019 140,244 6,943 1,038 148,225
1 Gross carrying amount excludes fair value adjustments from hedge accounting.

ABN AMRO Bank Annual Report 2019
93Risk, funding & capital / Risk, funding & capital review / Credit risk
2018
(in millions) Stage 1 Stage 2 Stage 3 Total
Gross carrying amount of Residential mortgages1
Balance at 1 January 2018 145,881 3,662 1,018 150,562Transfer to stage 1 2,539 -2,404 -135
Transfer to stage 2 -2,781 2,946 -165
Transfer to stage 3 -116 -163 279
Additional drawdowns and partial repayments -6,523 132 -30 -6,422
Originated or purchased 14,627 14,627
Matured or sold -8,288 -1,482 -168 -9,939
Write offs -36 -36
Foreign exchange -2 -1
Other movements
Balance at 31 December 2018 145,337 2,691 763 148,791
1. Gross carrying amount excludes fair value adjustments from hedge accounting.
2019(in millions) Stage 1 Stage 2 Stage 3 Total
Gross carrying amount of Consumer loansBalance at 1 January 2019 10,768 1,014 481 12,263Transfer to stage 1 324 -319 -5
Transfer to stage 2 -552 562 -10
Transfer to stage 3 -64 -55 119
Additional drawdowns and partial repayments -674 -164 -81 -918
Originated or purchased 2,371 2,371
Matured or sold -1,365 -87 -18 -1,469
Write offs -122 -122
Foreign exchange 5 6
Other movements 184 -24 3 163
Balance at 31 December 2019 10,999 928 368 12,294
2018
(in millions) Stage 1 Stage 2 Stage 3 Total
Gross carrying amount of Consumer loansBalance at 1 January 2018 10,130 1,826 470 12,426Transfer to stage 1 933 -914 -19
Transfer to stage 2 -493 508 -16
Transfer to stage 3 -116 -54 170
Additional drawdowns and partial repayments -1,202 589 45 -568
Originated or purchased 2,217 2,217
Matured or sold -821 -903 -76 -1,800
Write offs -103 -103
Foreign exchange 9 10
Other movements 109 -38 10 81
Balance at 31 December 2018 10,768 1,014 481 12,263
IntroductionStrategy and perform
anceLeadership &
governanceAnnual Financial Statem
ents 2019Other
Risk, funding & capital
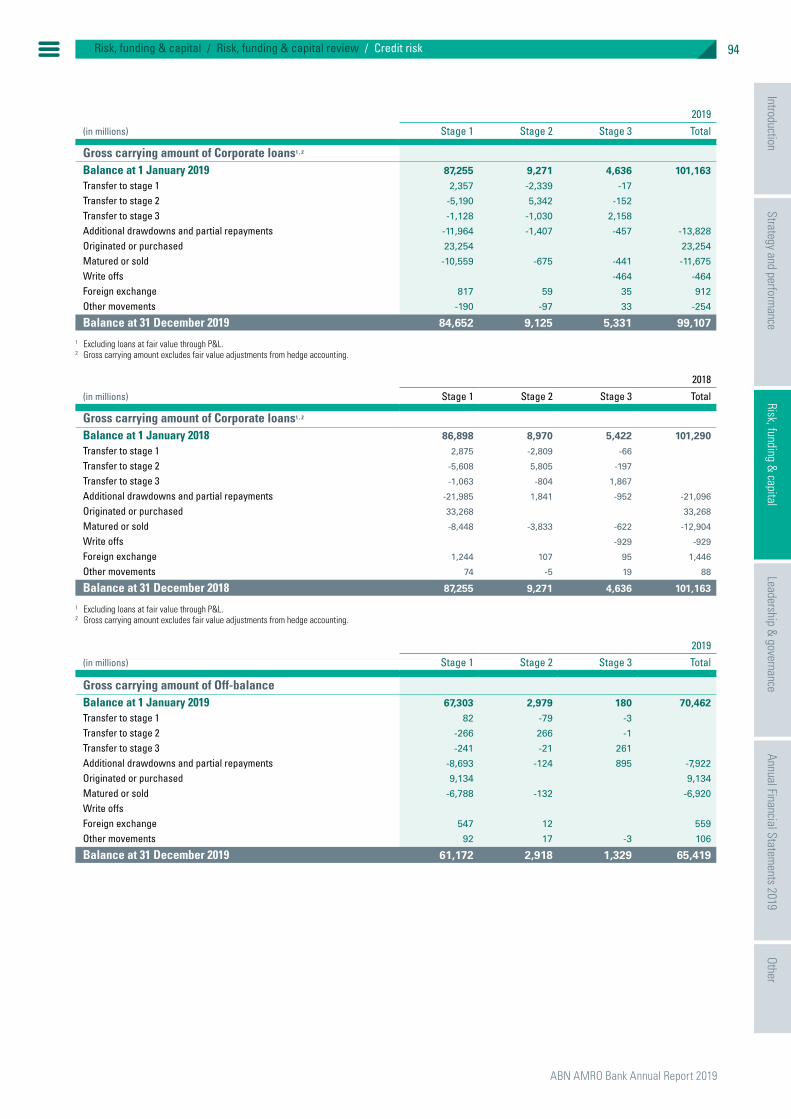
ABN AMRO Bank Annual Report 2019
IntroductionStrategy and perform
anceRisk, funding &
capitalLeadership structure
GovernanceAnnual Financial Statem
entsOther
IntroductionStrategy and perform
anceLeadership &
governanceAnnual Financial Statem
ents 2019Other
94
Risk, funding & capital
Risk, funding & capital / Risk, funding & capital review / Credit risk
2019(in millions) Stage 1 Stage 2 Stage 3 Total
Gross carrying amount of Corporate loans1 , 2
Balance at 1 January 2019 87,255 9,271 4,636 101,163Transfer to stage 1 2,357 -2,339 -17
Transfer to stage 2 -5,190 5,342 -152
Transfer to stage 3 -1,128 -1,030 2,158
Additional drawdowns and partial repayments -11,964 -1,407 -457 -13,828
Originated or purchased 23,254 23,254
Matured or sold -10,559 -675 -441 -11,675
Write offs -464 -464
Foreign exchange 817 59 35 912
Other movements -190 -97 33 -254
Balance at 31 December 2019 84,652 9,125 5,331 99,107
1 Excluding loans at fair value through P&L.2 Gross carrying amount excludes fair value adjustments from hedge accounting.
2018
(in millions) Stage 1 Stage 2 Stage 3 Total
Gross carrying amount of Corporate loans1 , 2
Balance at 1 January 2018 86,898 8,970 5,422 101,290Transfer to stage 1 2,875 -2,809 -66
Transfer to stage 2 -5,608 5,805 -197
Transfer to stage 3 -1,063 -804 1,867
Additional drawdowns and partial repayments -21,985 1,841 -952 -21,096
Originated or purchased 33,268 33,268
Matured or sold -8,448 -3,833 -622 -12,904
Write offs -929 -929
Foreign exchange 1,244 107 95 1,446
Other movements 74 -5 19 88
Balance at 31 December 2018 87,255 9,271 4,636 101,163
1 Excluding loans at fair value through P&L.2 Gross carrying amount excludes fair value adjustments from hedge accounting.
2019(in millions) Stage 1 Stage 2 Stage 3 Total
Gross carrying amount of Off-balanceBalance at 1 January 2019 67,303 2,979 180 70,462Transfer to stage 1 82 -79 -3
Transfer to stage 2 -266 266 -1
Transfer to stage 3 -241 -21 261
Additional drawdowns and partial repayments -8,693 -124 895 -7,922
Originated or purchased 9,134 9,134
Matured or sold -6,788 -132 -6,920
Write offsForeign exchange 547 12 559
Other movements 92 17 -3 106
Balance at 31 December 2019 61,172 2,918 1,329 65,419

ABN AMRO Bank Annual Report 2019
95Risk, funding & capital / Risk, funding & capital review / Credit risk
2018
(in millions) Stage 1 Stage 2 Stage 3 Total
Gross carrying amount of Off-balanceBalance at 1 January 2018 63,563 1,248 123 64,934Transfer to stage 1 256 -255
Transfer to stage 2 -2,662 2,662
Transfer to stage 3 -58 -16 74
Additional drawdowns and partial repayments -6,431 -648 62 -7,017
Originated or purchased 19,642 19,642
Matured or sold -7,840 -48 -79 -7,966
Write offsForeign exchange 832 36 1 869
Other movements 1 -1
Balance at 31 December 2018 67,303 2,979 180 70,462
The total balance at 31 December 2019 was lower than at year-end 2018, mainly due to a decrease in corporate loans and, to a lesser extent, to a decrease in loans to banks. The decrease in corporate exposures was primarily in CIB,
reflecting the lower business volumes in line with the CIB refocus. The loans to banks exposure decreased primarily due to lower cash collateral positions.
Loan impairment charges and allowances b
2019
(in millions) BanksResidential mortgages
Consumer loans
Corporate loans
Other loans
Total Loans and advances
Off- balance
Balance at 1 January 2019 9 108 318 1,825 9 2,269 12Transfer to stage 1 -7 -10 -21 -38
Transfer to stage 2 2 4 14 19 1
Transfer to stage 3 48 47 298 393 3
Remeasurements1 33 49 291 -2 372 2
Changes in models -13 4 20 -1 9 -2
Originated or purchased 1 4 12 36 53 5
Matured or sold loans -5 -12 -13 -49 -78 -6
Impairment charges (releases) on loans and advances -3 54 93 589 -3 730 3Write-offs -22 -122 -464 -608
Unwind discount / unearned interest accrued 2 1 28 31
Foreign exchange and other movements -3 8 5 10 1
Balance at 31 December 2019 5 140 298 1,982 6 2,431 16
Impairment charges (releases) on loans and advances -3 54 93 589 -3 730 3
Recoveries and other charges (releases) -23 -43 -21 -87 11
Total impairment charges for the period2 -3 31 50 568 -3 643 14
1 Remeasurements represents the current year change of expected credit loss allowances mainly attributable to changes in volumes such as partial repayments and changes in the credit quality of existing loans remaining in their stage.
2 The impairment charges for the period excludes charges (releases) for financial investments held at FVOCI (31 December 2019: EUR 0 million).
IntroductionStrategy and perform
anceLeadership &
governanceAnnual Financial Statem
ents 2019Other
Risk, funding & capital

ABN AMRO Bank Annual Report 2019
IntroductionStrategy and perform
anceRisk, funding &
capitalLeadership structure
GovernanceAnnual Financial Statem
entsOther
IntroductionStrategy and perform
anceLeadership &
governanceAnnual Financial Statem
ents 2019Other
96
Risk, funding & capital
Risk, funding & capital / Risk, funding & capital review / Credit risk
2018
(in millions) BanksResidential mortgages
Consumer loans
Corporate loans
Other loans
Total Loans and advances
Off- balance
Balance at 1 January 2018 9 182 362 2,055 2 2,610 25Transfer to stage 1 -15 -31 -59 -104
Transfer to stage 2 2 17 59 1 79
Transfer to stage 3 9 24 211 244
Remeasurements1 4 23 18 469 6 521 -14
Originated or purchased 1 8 5 30 45 7
Matured or sold loans -5 -20 -6 -36 -67 -4
Impairment charges (releases) on loans and advances 7 27 676 7 717 -12Write-offs -36 -103 -929 -1,068
Unwind discount / unearned interest accrued -25 2 7 -16
Foreign exchange and other movements -19 30 16 -1 26 -1
Balance at 31 December 2018 9 108 318 1,825 9 2,269 12
Impairment charges (releases) on loans and advances 7 27 676 7 717 -12
Recoveries and other charges (releases) -18 -31 -16 -65 16
Total impairment charges for the period2 -11 -4 660 7 652 4
1 Remeasurements represents the current year change of expected credit loss allowances mainly attributable to changes in volumes such as partial repayments and changes in the credit quality of existing loans remaining in their stage.
2 The impairment charges for the period excludes charges (releases) for financial investments held at FVOCI (31 December 2018: EUR 0 million).
Loan impairment charges and allowances per stage b
2019 2018
(in millions) Stage 1 Stage 2 Stage 3 Total Stage 1 Stage 2 Stage 3 Total
Balance at 1 January 214 192 1,862 2,269 214 213 2,184 2,610Transfer to stage 1 45 -66 -17 -38 116 -164 -56 -104
Transfer to stage 2 -31 126 -76 19 -112 278 -88 79
Transfer to stage 3 -5 -32 429 393 -7 -54 305 244
Remeasurements1 -88 36 423 372 7 -61 575 521
Changes in models 16 22 -29 9
Originated or purchased 53 53 44 45
Matured or sold -22 -25 -30 -78 -39 -26 -2 -67
Impairment charges (releases) on loans and advances -33 62 701 730 9 -27 735 717Write offs -608 -608 -1,068 -1,068
Unwind discount / unearned interest accrued 31 31 -16 -16
Foreign exchange and other movements -2 4 8 10 -9 6 28 26
Balance at 31 December 180 258 1,993 2,431 214 192 1,862 2,269
Impairment charges (releases) on loans and advances -33 62 701 730 9 -27 735 717
Recoveries and other charges (releases) -87 -87 -65 -65
Total impairment charges for the period -33 62 613 643 9 -27 669 652
1 Remeasurements represents the current year change of expected credit loss allowances mainly attributable to changes in volumes such as partial repayments and changes in the credit quality of existing loans remaining in their stage.

ABN AMRO Bank Annual Report 2019
97Risk, funding & capital / Risk, funding & capital review / Credit risk
Loan impairment charges and allowances – residential mortgages
2019 2018
(in millions) Stage 1 Stage 2 Stage 3 Total Stage 1 Stage 2 Stage 3 Total
Balance at 1 January 18 14 77 108 26 24 132 182Transfer to stage 1 8 -8 -7 -7 21 -16 -20 -15
Transfer to stage 2 -3 52 -47 2 -3 24 -19 2
Transfer to stage 3 -1 -9 58 48 -4 -7 20 9
Remeasurements1 -10 28 15 33 -26 4 45 23
Changes in models -7 1 -7 -13
Originated or purchased 4 4 8 8
Matured or sold -2 -9 -1 -12 -2 -16 -2 -20
Impairment charges (releases) on loans and advances -11 55 10 54 -7 -10 25 7Write offs -22 -22 -36 -36
Unwind discount / unearned interest accrued 2 2 -25 -25
Foreign exchange and other movements -1 -2 -3 -1 -18 -19
Balance at 31 December 7 68 65 140 18 14 77 108
Impairment charges (releases) on loans and advances -11 55 10 54 -7 -10 25 7
Recoveries and other charges (releases) -23 -23 -18 -18
Total impairment charges for the period -11 55 -14 31 -7 -10 6 -11
1 Remeasurements represents the current year change of expected credit loss allowances mainly attributable to changes in volumes such as partial repayments and changes in the credit quality of existing loans remaining in their stage.
Loan impairment charges and allowances – consumer loans
2019 2018
(in millions) Stage 1 Stage 2 Stage 3 Total Stage 1 Stage 2 Stage 3 Total
Balance at 1 January 34 55 229 318 42 74 246 362Transfer to stage 1 12 -20 -3 -10 22 -41 -12 -31
Transfer to stage 2 -8 20 -8 4 -20 56 -19 17
Transfer to stage 3 -1 -4 52 47 -1 -7 31 24
Remeasurements1 -20 27 42 49 -7 -26 51 18
Changes in models 4 -1 2 4
Originated or purchased 11 12 5 5
Matured or sold -3 -6 -3 -13 -4 -2 -6
Impairment charges (releases) on loans and advances -4 15 82 93 -5 -20 52 27Write offs -122 -122 -103 -103
Unwind discount / unearned interest accrued 1 1 2 2
Foreign exchange and other movements 8 8 -3 32 30
Balance at 31 December 30 70 198 298 34 55 229 318
Impairment charges (releases) on loans and advances -4 15 82 93 -5 -20 52 27
Recoveries and other charges (releases) -43 -43 -31 -31
Total impairment charges for the period -4 15 39 50 -5 -20 20 -4
1 Remeasurements represents the current year change of expected credit loss allowances mainly attributable to changes in volumes such as partial repayments and changes in the credit quality of existing loans remaining in their stage.
IntroductionStrategy and perform
anceLeadership &
governanceAnnual Financial Statem
ents 2019Other
Risk, funding & capital

ABN AMRO Bank Annual Report 2019
IntroductionStrategy and perform
anceRisk, funding &
capitalLeadership structure
GovernanceAnnual Financial Statem
entsOther
IntroductionStrategy and perform
anceLeadership &
governanceAnnual Financial Statem
ents 2019Other
98
Risk, funding & capital
Risk, funding & capital / Risk, funding & capital review / Credit risk
Loan impairment charges and allowances – corporate loans
2019 2018
(in millions) Stage 1 Stage 2 Stage 3 Total Stage 1 Stage 2 Stage 3 Total
Balance at 1 January 154 119 1,552 1,825 138 112 1,805 2,055Transfer to stage 1 24 -39 -7 -21 73 -107 -24 -59
Transfer to stage 2 -19 54 -21 14 -87 195 -50 59
Transfer to stage 3 -3 -18 319 298 -2 -41 254 211
Remeasurements1 -59 -17 367 291 36 -41 474 469
Changes in models 19 24 -23 20
Originated or purchased 36 36 30 30
Matured or sold -14 -9 -26 -49 -29 -7 -36
Impairment charges (releases) on loans and advances -15 -6 609 589 21 654 676Write offs -464 -464 -929 -929
Unwind discount / unearned interest accrued 28 28 7 7
Foreign exchange and other movements -3 5 2 5 -6 7 15 16
Balance at 31 December 137 119 1,727 1,982 154 119 1,552 1,825
Impairment charges (releases) on loans and advances -15 -6 609 589 21 654 676
Recoveries and other charges (releases) -21 -21 -16 -16
Total impairment charges for the period -15 -6 588 568 21 638 660
1 Remeasurements represents the current year change of expected credit loss allowances mainly attributable to changes in volumes such as partial repayments and changes in the credit quality of existing loans remaining in their stage.
Loan impairment charges and allowances – off-balance
2019 2018
(in millions) Stage 1 Stage 2 Stage 3 Total Stage 1 Stage 2 Stage 3 Total
Balance at 1 January 10 2 1 12 9 1 15 25Transfer to stage 1 -1 -1
Transfer to stage 2 -1 2 1 -1 1
Transfer to stage 3 -1 4 3
Remeasurements1 -2 3 1 2 1 -15 -14
Changes in models -1 -1 -2
Originated or purchased 5 5 7 7
Matured or sold -3 -2 -6 -4 -1 -4
Impairment charges (releases) -2 1 4 3 3 -15 -12Foreign exchange and other movements 1 -2 -1
Balance at 31 December 8 4 5 16 10 2 1 12
Impairment charges (releases) on off-balance -2 1 4 3 3 -15 -12
Other charges (releases)2 11 11 16 16
Total impairment charges for the period -2 1 15 14 3 1 4
1 Remeasurements represents the current year change of expected credit loss allowances mainly attributable to changes in volumes such as partial repayments and changes in the credit quality of existing loans remaining in their stage.
2 These charges (releases) relate to the off-balance sheet items that do not fall within the scope of IFRS 9 and for which stage information is not applicable.

ABN AMRO Bank Annual Report 2019
99Risk, funding & capital / Risk, funding & capital review / Credit risk
Individual and collective loan impairment allowances b
31 December 2019
(in millions) BanksResidential mortgages
Consumer loans
Corporate loans
Other loans
Total Loans and advances
Off- balance
Individual impairmentStage 3 9 66 1,519 4 1,599 1
Total individual impairment 9 66 1,519 4 1,599 1
Collective impairmentStage 1 5 7 30 137 180 8
Stage 2 68 70 119 1 258 4
Stage 3 55 132 208 394 4
Total collective impairment 5 130 232 463 1 832 15
Total impairments 5 140 298 1,982 6 2,431 16
Carrying amount of loans, determined to be impaired, before deducting any assessed impairment allowance 1,038 368 5,331 4 6,740
31 December 2018
(in millions) BanksResidential mortgages
Consumer loans
Corporate loans1
Other loans1
Total Loans and advances
Off- balance
Individual impairmentStage 3 13 83 1,292 4 1,392 1
Total individual impairment 13 83 1,292 4 1,392 1
Collective impairmentStage 1 8 18 34 154 1 214 10
Stage 2 1 14 55 119 4 192 2
Stage 3 64 146 260 470
Total individual impairment 9 95 235 533 4 877 12
Total impairments 9 108 318 1,825 9 2,269 12
Carrying amount of loans, determined to be impaired, before deducting any assessed impairment allowance 763 481 4,636 6 5,887
1 The comparative figures for 2018 with regard to corporate loans and other loans and advances have been restated. Please refer to Note 1 Accounting policies in the Consolidated Annual Financial Statements.
Impairment charges in 2019 amounted to EUR 657 million (2018: EUR 655 million), consisting of EUR 643 million of on-balance sheet and EUR 14 million of off-balance sheet charges. These charges related mainly to specific CIB and Commercial Banking files in the stage 3 corporate loans portfolio and, to a lesser extent, to Retail Banking and Private Banking.
Impairment charges in Commercial Banking in 2019 amounted to EUR 148 million (EUR 253 million in 2018) and were spread across various sectors. Net additions in 2019 in CIB totalled EUR 475 million, compared to EUR 427 in 2018. The main contributors to the additions in 2019 were new and existing impaired files in the energy-offshore (services) and logistics sectors and in trade and commodity finance, whereas the main contributors in 2018 were the energy-offshore, diamonds, shipping and commodities sectors.
Residential mortgages recorded net additions of EUR 31 million in 2019 (2018: EUR 11 million negative), mainly due to the impact of the more prudent approach to interest-only mortgages, where provisioning was enhanced in response to the ECB’s supervisory expectations.
The impairment charges for consumer loans in 2019 amounted to EUR 50 million, compared with a release of EUR 4 million in 2018. The main contribution to this year’s impairment charges was attributable to remeasurements, amongst others for clients with forbearance measures in the consumer lending portfolio.
As in 2018, the 2019 cost of risk (COR) was 24bps, which was slightly below the through-the-cycle COR (25-30bps) and in line with expectations. For 2020 we expect a COR within the through-the-cycle range of 25-30bps.
IntroductionStrategy and perform
anceLeadership &
governanceAnnual Financial Statem
ents 2019Other
Risk, funding & capital

ABN AMRO Bank Annual Report 2019
IntroductionStrategy and perform
anceRisk, funding &
capitalLeadership structure
GovernanceAnnual Financial Statem
entsOther
IntroductionStrategy and perform
anceLeadership &
governanceAnnual Financial Statem
ents 2019Other
100
Risk, funding & capital
Risk, funding & capital / Risk, funding & capital review / Credit risk
Macroeconomic scenarios and sensitivity Forecasts over the past four quarters were impacted by a less positive economic outlook, specifically owing to changes in the expectations regarding Brexit, the escalation of the trade war and the fact that interest rates look set to remain low for a lengthy period. During 2019, therefore, Group Economics adjusted its forecasts to reflect this less positive outlook. Throughout the year, the weightings in the scenario, which are reviewed quarterly, remained at 60%, 25% and 15% in the base, negative and positive scenarios respectively.
The calculation of the expected credit loss (ECL) takes a large number of macroeconomic variables into account. The relative weighting of individual variables in the calculation depends on the factor loading in the ECL models and on the projected values in the scenarios. For corporates, the most influential macroeconomic variable in terms of expected credit loss is Dutch GDP growth, while the risk profile of Retail Banking is most affected by changes in affordability (e.g. the unemployment rate) and collateral values (e.g. house prices).
Macroeconomic scenarios in 2019 b
(in millions) Weight Macroeconomic variable 2019 2020 2021 2022 2023Unweighted
ECLWeighted
ECL4
Real GDP Netherlands1 1.8% 3.2% 3.5% 3.2% 2.8%
Positive 15% Unemployment2 3.4% 3.0% 3.0% 2.9% 2.9% 358
House price index3 7.1% 9.7% 9.6% 7.3% 5.0%
Real GDP Netherlands 1.7% 0.9% 1.2% 1.6% 1.6%
Baseline 60% Unemployment 3.4% 3.7% 4.0% 4.1% 4.1% 418 438
House price index 6.8% 4.0% 3.0% 3.0% 3.0%
Real GDP Netherlands 1.5% -0.5% 0.0% 0.2% 0.8%
Negative 25% Unemployment 3.5% 4.7% 6.0% 6.5% 6.8% 533
House price index 6.6% 2.9% -1.0% -4.5% -3.3%
1 Real GDP Netherlands, % change year-on-year.2 Unemployment Netherlands, % of labour force.3 House price index Netherlands - average % change year-on-year.4 Excluding ECL for stage 3.
Macroeconomic scenarios in 2018 b
(in millions) Weight Macroeconomic variable 2018 2019 2020 2021 2022Unweighted
ECL4Weighted
ECL4
Real GDP Netherlands1 2.8% 3.2% 3.5% 3.5% 3.5%
Positive 15% Unemployment2 3.8% 3.1% 3.0% 3.0% 3.0%
House price index3 9.5% 11.5% 9.5% 7.5% 7.5%
Real GDP Netherlands 2.6% 2.0% 1.7% 1.6% 1.6%
Baseline 60% Unemployment 3.8% 3.6% 3.6% 3.7% 3.8%
House price index 9.0% 7.0% 5.0% 3.5% 3.0%
Real GDP Netherlands 2.3% 0.8% 0.0% 0.0% 0.0%
Negative 25% Unemployment 3.9% 4.3% 5.2% 6.0% 6.8%
House price index 7.0% 4.0% 2.0% 1.0% 1.5%
1 Real GDP Netherlands, % change year-on-year.2 Unemployment Netherlands, % of labour force.3 House price index Netherlands - average % change year-on-year.4 Due to the recalibration ECL models in 2019, results for 2018 are not provided.

ABN AMRO Bank Annual Report 2019
101Risk, funding & capital / Risk, funding & capital review / Credit risk
The table showing macroeconomic scenarios in 2019 reflects the forecasted values of the macroeconomic drivers in the baseline, positive and negative scenarios. To provide an indication of the expected credit losses’ sensitivity to the macroeconomic environment, the table
also shows the impact on ECL of applying a 100% weighting to each scenario. Stage 3 instruments are expected to be more sensitive to idiosyncratic factors and recovery than to changes in macroeconomic assumptions and are therefore not included in the sensitivity analysis.
Forborne, past due and credit-impaired loans by geography and industryForborne, past due and credit-impaired loans by geography
31 December 2019
(in millions)Forborne exposure
Exposures past due, but not stage 3
Stage 3 exposures
Allowances for stage 3
Stage 3 charges for the period
The Netherlands 4,543 2,530 4,939 1,240 286
Rest of Europe 704 579 937 361 107
USA 278 1 142 120 127
Asia 192 52 192 93 47
Rest of the world 649 25 531 180 46
Total On-balance 6,365 3,187 6,740 1,993 614Off-balance 1,329 4
Total 6,365 3,187 8,070 1,993 618
31 December 2018
Forborne exposure
Exposures past due, but not stage 31
Stage 3 exposures
Allowances for stage 3
Stage 3 charges for the period
The Netherlands 4,115 3,171 4,067 1,200 297
Rest of Europe 783 332 898 318 130
USA 266 2 210 100 45
Asia 148 3 123 88 79
Rest of the world 509 69 588 158 119
Total On-balance 5,821 3,577 5,887 1,862 670Off-balance 180 -15
Total 5,821 3,577 6,066 1,862 655
1 Exposures past due, but not stage 3 have been restated.
The forborne portfolio is mainly concentrated in the Netherlands. The increase in this country was primarily driven by Commercial Banking and, to a lesser extent, by CIB and Retail Banking. The increase in the Rest of the World and Asia related mainly to new forborne loans in CIB.
The Netherlands contributed the most to the decline in past due but not stage 3 exposures, mainly due to a decrease in domestic residential mortgages. This movement was partly offset by the movement in the Rest of Europe, which related mainly to an inflow
of clients from Belgium and France and to ABF/Lease clients from Germany. In addition, Asia increased due to some CIB trade and commodity finance clients.
Credit-impaired exposures for credit losses in the United States and the Rest of the World fell, whereas exposures in Asia, the Netherlands and the Rest of Europe rose. The Netherlands contributed most to the overall increase in exposures (and allowances), due to corporate clients transferring from stages 1 and 2 to stage 3. Part of the increase in stage 3 exposures in the Netherlands was also due to recalibration of the UTP triggers for residential mortgages.
IntroductionStrategy and perform
anceLeadership &
governanceAnnual Financial Statem
ents 2019Other
Risk, funding & capital

ABN AMRO Bank Annual Report 2019
IntroductionStrategy and perform
anceRisk, funding &
capitalLeadership structure
GovernanceAnnual Financial Statem
entsOther
IntroductionStrategy and perform
anceLeadership &
governanceAnnual Financial Statem
ents 2019Other
102
Risk, funding & capital
Risk, funding & capital / Risk, funding & capital review / Credit risk
Forborne, past due and credit-impaired loans by industry
31 December 2019
(in millions)Exposure at Default
Forborne exposures
Forborne ratio
(EAD)
Exposures past due,
but not stage 3
Past due
ratio (EAD)
Stage 3 exposures
Stage 3 ratio
(EAD)
Allowances for impairments
for identified credit risk4
Stage 3 impairment charges for
the period
Industry sectorBanks 17,745
Financial services1 18,788 76 0.4% 168 0.9% 133 0.7% 90 -4
Industrial goods and services 25,077 1,555 6.2% 273 1.1% 1,770 7.1% 518 176
Real estate 13,678 209 1.5% 186 1.4% 173 1.3% 63 -1
Oil and gas 14,682 863 5.9% 36 0.2% 609 4.2% 276 186
Food and beverage 17,515 1,035 5.9% 123 0.7% 850 4.9% 225 109
Retail 6,277 286 4.5% 95 1.5% 296 4.7% 77 12
Basic resources 4,563 92 2.0% 120 2.6% 278 6.1% 132 26
Healthcare 4,396 242 5.5% 11 0.3% 398 9.1% 62 1
Construction and materials 4,459 357 8.0% 221 5.0% 342 7.7% 132 14
Other2 20,582 503 2.4% 126 0.6% 481 2.3% 129 73
Subtotal Industry Classification Benchmark 147,763 5,218 3.5% 1,359 0.9% 5,331 3.6% 1,705 594Private individuals (non-Industry
Classification Benchmark) 177,107 1,141 0.6% 1,828 1.0% 1,407 0.8% 288 19
Public administration (non-Industry Classification Benchmark) 64,628 6 0.0% 2 0.0% 1
Subtotal non-Industry Classification Benchmark 241,735 1,147 0.5% 1,828 0.8% 1,409 0.6% 289 19
Total3 389,498 6,365 1.6% 3,187 0.8% 6,740 1.7% 1,993 6141 Financial services include asset managers, credit card companies and providers of personal financial services and securities and brokers.2 Other includes personal and household goods, media, technology, automobiles and parts, chemicals, telecommunication and insurance, in addition to unclassified.3 Exposure at Default does not include EAD calculated for equities not held for trading and other non-credit obligations.
Forborne, past due and credit-impaired loans by industry
31 December 2018
(in millions)Exposure at Default
Forborne exposures
For-borne
ratio (EAD)
Exposures past due,
but not stage 33
Past due
ratio (EAD)
Stage 3 exposures
Stage 3 ratio
(EAD)
Allowances for impairments
for identified credit risk4
Stage 3 impairment charges for
the period
Industry sectorBanks 14,629
Financial services1 20,660 75 0.4% 103 0.5% 175 0.8% 113 -11
Industrial goods and services 26,514 1,661 6.3% 329 1.2% 1,519 5.7% 324 237
Real estate 15,900 288 1.8% 227 1.4% 261 1.6% 89 2
Oil and gas 15,711 569 3.6% 0.0% 703 4.5% 218 177
Food and beverage 18,436 839 4.6% 207 1.1% 634 3.4% 167 55
Retail 6,682 221 3.3% 94 1.4% 270 4.0% 124 19
Basic resources 5,179 152 2.9% 28 0.5% 156 3.0% 108 60
Healthcare 4,863 183 3.8% 34 0.7% 259 5.3% 97 40
Construction and materials 4,545 324 7.1% 39 0.9% 296 6.5% 125 14
Other2 20,224 411 2.0% 161 0.8% 388 1.9% 197 74
Subtotal Industry Classification Benchmark 153,344 4,723 3.1% 1,223 0.8% 4,662 3.0% 1,563 666
Private individuals (non-Industry Classification Benchmark) 175,785 1,098 0.6% 2,351 1.3% 1,222 0.7% 298 3
Public administration (non-Industry Classification Benchmark) 71,107 3 0.0% 3 0.0% 1
Subtotal non-Industry Classification Benchmark 246,893 1,098 0.4% 2,354 1.0% 1,225 0.5% 299 3
Total 400,237 5,820 1.5% 3,577 0.9% 5,887 1.5% 1,862 6701 Financial services include asset managers, credit card companies and providers of personal financial services and securities and brokers.2 Other includes personal and household goods, media, technology, automobiles and parts, chemicals, telecommunication and insurance, in addition to unclassified.3 Exposures past due, but not stage 3 have been restated.4 Exposure at Default does not include EAD calculated for equities not held for trading and other non-credit obligations.

ABN AMRO Bank Annual Report 2019
103Risk, funding & capital / Risk, funding & capital review / Credit risk
Broken down by industry, the increase in the forbearance portfolio was primarily caused by the inflow of forborne corporate loans in the Commercial Banking and CIB portfolios. The increase in Commercial Banking was largely generated by growth in the Dutch food and beverage sector. The increase in CIB was mainly attributable to inflows in the oil and gas sector in the United States, Asia and the Rest of the World. The addition of forborne loans within the private individuals sector was attributable to the changes in the UTP triggers in our mortgage portfolio, which were partly offset by the outflow of forborne clients in Private Banking.
At an industry level, private individuals, benefiting from the positive economic climate, were the main drivers of the decline in exposures past due but not stage 3. This movement was partly offset by increases in construction and materials, basic resources and financial services.
Stage 3 exposure increased in 2019, mainly due to clients who were transferred from stage 2 to stage 3. The main contributions to these transfers came from corporate loans, and specifically the industrial goods and services and the food and beverage sectors within CIB and the healthcare sector within Commercial Banking.
The increase in stage 3 exposure for private individuals was attributable to the increase in residential mortgages, where recalibration of the UTP triggers resulted in an increase of EUR 370 million in stage 3 exposure. This increase was partly offset by a decline for private individuals, reflecting the housing market and Dutch economy.
Developments in specific portfoliosThe following section provides a more detailed overview of developments in specific portfolios and products.
Residential mortgagesThe Dutch housing market is suffering from a shortage of homes available for sale. Nevertheless the number of building permits issued has fallen substantially, with environmental issues putting annual construction targets in jeopardy. The housing price index published by Statistics Netherlands (CBS) at the end of 2019 was 6.5% higher than at the end of 2018. The overall price level in December 2019 (not adjusted for inflation) was 11.5% higher than before the financial crisis. According to Statistics Netherlands, the number of transactions in the Dutch housing market in 2019 was stable compared to 2018 (+0.1%), lower than the peak level in 2017, but still above the 10-year moving average.
Residential mortgage indicators
(in millions) 31 December 2019 31 December 2018
Gross carrying amount excluding fair value adjustment from hedge accounting 148,225 148,791
- of which Nationale Hypotheek Garantie (NHG) 35,304 36,257
Fair value adjustment from hedge accounting 2,795 2,101
Carrying amount 148,085 148,683
Exposure at Default1 164,575 162,787
RWA1 16,665 16,853
RWA/Exposure at Default 10.1% 10.4%
Forbearance ratio 0.6% 0.5%
Past due ratio 0.9% 1.3%
Stage 3 ratio 0.7% 0.5%
Stage 3 coverage ratio 6.2% 10.0%
Cost of risk (in bps)2 2 -1
Average LtMV (indexed)3 64% 64%
Average LtMV - excluding NHG loans (indexed)3 62% 62%
Total risk mitigation 226,221 228,774
Total risk mitigation/carrying amount 152.8% 153.9%
1 The RWA and Exposure at Default amounts are based on the exposure class Secured by immovable property. This scope is slightly broader than the residential mortgage portfolio.2 Annualised impairment charges on loans and advances customers for the period divided by the average loans and advances customers on the basis of gross carrying amount and excluding
fair value adjustment from hedge accounting.3 The collateral valuation method changed and became more accurate, i.e. increases in the price index are now subject to a haircut, while decreases are not, which provides a better
estimate of the actual house price.
The residential mortgage portfolio decreased by 0.4% to EUR 148.2 billion in 2019 (31 December 2018: EUR 148.8 billion) as redemptions exceeded new production of mortgage loans. ABN AMRO’s market share in new mortgage production ended at 18.0% (2018: 16.8%). The proportion of amortising mortgages
continued to increase, totalling 33% at 31 December 2019 (31 December 2018: 29%). Total redemptions were 4.0% higher than in 2018. Contractual redemptions gradually increased, in line with changes in the portfolio composition. Extra repayments in 2019 amounted to EUR 2.6 billion, an increase of 13% compared with 2018.
IntroductionStrategy and perform
anceLeadership &
governanceAnnual Financial Statem
ents 2019Other
Risk, funding & capital

ABN AMRO Bank Annual Report 2019
IntroductionStrategy and perform
anceRisk, funding &
capitalLeadership structure
GovernanceAnnual Financial Statem
entsOther
IntroductionStrategy and perform
anceLeadership &
governanceAnnual Financial Statem
ents 2019Other
104
Risk, funding & capital
Risk, funding & capital / Risk, funding & capital review / Credit risk
Mortgages covered by the National Mortgage Guarantee (NHG) scheme remained fairly stable, compared with 31 December 2018, at 24%.
Regulatory capitalThe RWA for the residential mortgage portfolio decreased to EUR 16.7 billion (2018: EUR 16.9 billion). The decrease in the RWA was the combined result of improved credit quality, higher collateral values and lower amounts in arrears. Exposure at default (EAD) increased to EUR 164.6 billion (2018: EUR 162.8 billion). Fair value adjustments from hedge accounting were included in the EAD in 2019, whereas they were excluded in 2018. Without this adjustment EAD would have decreased to EUR 161.8 billion.
Credit quality indicatorsCredit quality indicators for residential mortgages improved in line with the performance of the Dutch economy and housing market. The past due ratio decreased, mainly due to a limited inflow into past due exposures in short-term arrears. The coverage ratio decreased as a result of improved credit quality and higher collateral values. However, stage 3 exposure increased as a result of the recalibrated UTP triggers. Stage 2 exposure increased because of the recalibration of IFRS 9 models, as well as a reclassification of clients with interest-only mortgages and a high refinancing risk at maturity.
Residential mortgages to indexed market value
31 December 2019Gross
carrying amountPercentage
of total
(in millions)- of which
guaranteed2
- of which unguaranteed
LtMV category1
<50% 37,819 25.5% 3.0% 22.5%
50% - 80% 71,458 48.2% 13.2% 35.0%
80% - 90% 22,428 15.1% 4.5% 10.6%
90% - 100% 13,574 9.2% 2.7% 6.4%
>100% 2,160 1.5% 0.3% 1.1%
Unclassified 787 0.5%
Total 148,225 100%
31 December 2018
Percentage of total
- of which guaranteed2
- of which unguaranteed
<50% 37,754 25.4% 3.0% 22.4%
50% - 80% 70,164 47.2% 13.1% 34.0%
80% - 90% 23,080 15.5% 4.9% 10.6%
90% - 100% 13,278 8.9% 2.7% 6.3%
>100% 3,497 2.4% 0.6% 1.7%
Unclassified 1,017 0.7%
Total 148,791 100%
1 Loan-to-Market Value is calculated using the indexation of the CBS (Central Bureau of Statistics).2 NHG guarantees.
Rising housing prices and restrictions set for the maximum loan-to-market value (LtMV) of new mortgages led to further improvements in the underlying average indexed LtMV, both guaranteed and unguaranteed. Owing, however, to a more accurate collateral valuation method, the average indexed LtMV increased in Q4. Increases in the price index are now subject to a haircut, while decreases are not, which provides a better estimate of actual house prices.
The long-term LtMV of the bank’s portfolio is expected to decrease further as a combined result of rising housing prices, contractual and extra redemptions, and the gradual reduction in mortgage interest tax relief.
The gross carrying amount of mortgages with an LtMV in excess of 100% declined significantly, totalling EUR 2.2 billion at year-end 2019 (2018: EUR 3.5 billion). Note that LtMVs in excess of 100% do not necessarily indicate that these clients are in financial difficulties. ABN AMRO actively approaches clients with an interest-only mortgage in combination with a high LtMV level to discuss changing their mortgage product. Mortgages with an LtMV >100% account for 1.5% of total mortgages, while approximately 3% of the extra repayments relate to this category.
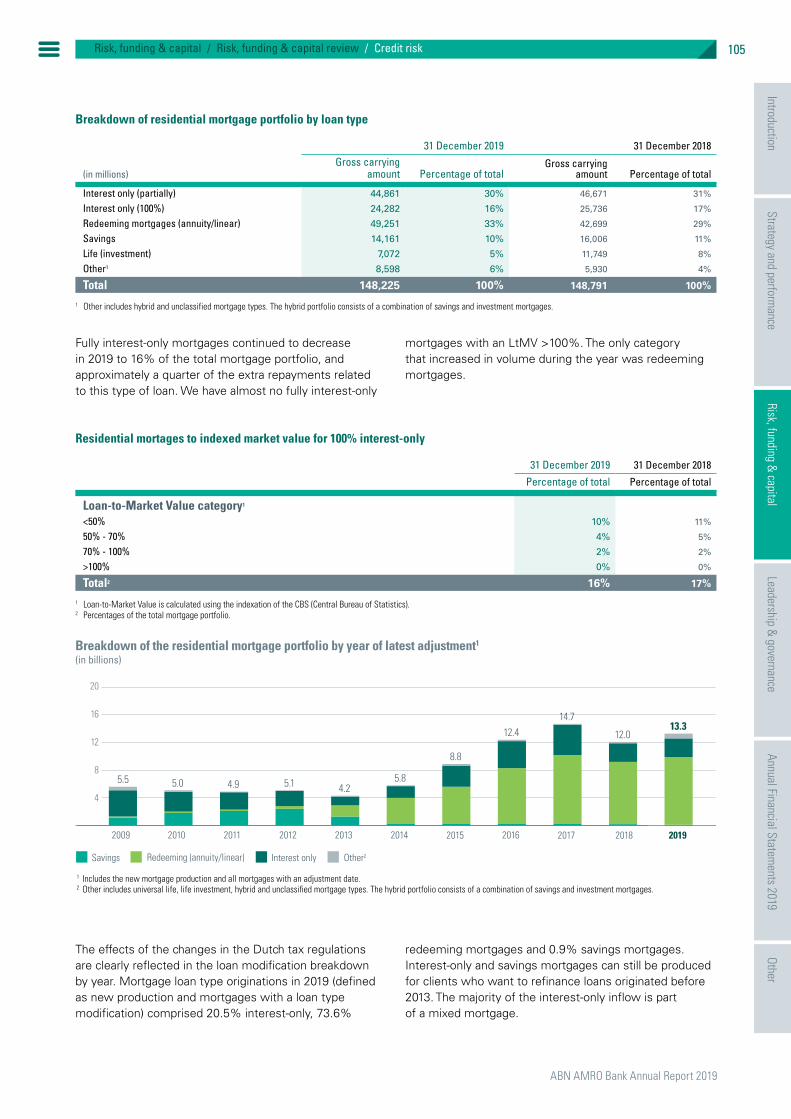
ABN AMRO Bank Annual Report 2019
105Risk, funding & capital / Risk, funding & capital review / Credit risk
Breakdown of residential mortgage portfolio by loan type
31 December 2019 31 December 2018
(in millions)Gross carrying
amount Percentage of totalGross carrying
amount Percentage of total
Interest only (partially) 44,861 30% 46,671 31%
Interest only (100%) 24,282 16% 25,736 17%
Redeeming mortgages (annuity/linear) 49,251 33% 42,699 29%
Savings 14,161 10% 16,006 11%
Life (investment) 7,072 5% 11,749 8%
Other1 8,598 6% 5,930 4%
Total 148,225 100% 148,791 100%
1 Other includes hybrid and unclassified mortgage types. The hybrid portfolio consists of a combination of savings and investment mortgages.
Fully interest-only mortgages continued to decrease in 2019 to 16% of the total mortgage portfolio, and approximately a quarter of the extra repayments related to this type of loan. We have almost no fully interest-only
mortgages with an LtMV >100%. The only category that increased in volume during the year was redeeming mortgages.
Residential mortages to indexed market value for 100% interest-only
31 December 2019 31 December 2018
Percentage of total Percentage of total
Loan-to-Market Value category1
<50% 10% 11%
50% - 70% 4% 5%
70% - 100% 2% 2%
>100% 0% 0%
Total2 16% 17%
1 Loan-to-Market Value is calculated using the indexation of the CBS (Central Bureau of Statistics).2 Percentages of the total mortgage portfolio.
Breakdown of the residential mortgage portfolio by year of latest adjustment1
(in billions)
2009 2010 2011 2012 2013 2014 2015 2016 2017 2018 2019
Savings Redeeming (annuity/linear) Interest only Other2
1 Includes the new mortgage production and all mortgages with an adjustment date. 2 Other includes universal life, life investment, hybrid and unclassified mortgage types. The hybrid portfolio consists of a combination of savings and investment mortgages.
4
8
12
16
20
13.312.0
5.5 5.0 4.9 4.25.1 5.8
8.8
12.414.7
The effects of the changes in the Dutch tax regulations are clearly reflected in the loan modification breakdown by year. Mortgage loan type originations in 2019 (defined as new production and mortgages with a loan type modification) comprised 20.5% interest-only, 73.6%
redeeming mortgages and 0.9% savings mortgages. Interest-only and savings mortgages can still be produced for clients who want to refinance loans originated before 2013. The majority of the interest-only inflow is part of a mixed mortgage.
IntroductionStrategy and perform
anceLeadership &
governanceAnnual Financial Statem
ents 2019Other
Risk, funding & capital

ABN AMRO Bank Annual Report 2019
IntroductionStrategy and perform
anceRisk, funding &
capitalLeadership structure
GovernanceAnnual Financial Statem
entsOther
IntroductionStrategy and perform
anceLeadership &
governanceAnnual Financial Statem
ents 2019Other
106
Risk, funding & capital
Risk, funding & capital / Risk, funding & capital review / Credit risk
Commercial Real Estate (CRE)Although the Dutch CRE (investment) market continued to expand in 2019, growth is slowing down. A total of EUR 20.8 billion was invested in 2019, an increase of 0.5% compared with 2018. While low interest rates continue to attract investors, good investment opportunities are becoming more scarce, and a decline in investment volumes is consequently expected.
In 2019, for the second year in a row, the biggest investment volume – totalling EUR 7.6 billion – was attributable to residential assets. The demand for private rental properties remains especially high, due to increasing housing prices, stricter mortgage rules, the lack of new-builds and more limited access to social rental housing.
Both the demand for and scarcity of office space are increasing as a result of higher employment levels, the lack of new-build construction and more offices being converted into homes. Vacancy rates are therefore low.
The third highest investment volumes in 2019 were in the industrial market. This market benefited from high economic growth and a strong rise in e-commerce, resulting in many large new distribution centres being built. At the same time, the continuing rise in e-commerce is putting pressure on the struggling retail market. As a result, investment volumes in 2019 decreased, with vacancy rates for retail property increasing and approaching the peak level seen in 2015.
Commercial Real Estate portfolioThe EAD increased by 22% in 2019 to EUR 14.6 billion compared with year-end 2018. Due to the strong CRE market, the credit quality indicators continued to improve. The stage 3 impaired ratio declined to 1.4% (31 December 2018: 2.6%), with a coverage ratio of 31% (31 December 2018: 34%). The CRE loan-to-market value decreased to 41.9% (2018: 53.3%), mainly as the result of rising commercial real estate prices.
The CRE loan portfolio is largely based on Dutch properties and consists primarily of investment loans that are well diversified across different asset types.
Asset type(in %)
Residential Retail Industrial Office Other1
1 Other asset types includes mixed objects, hotels & horeca facilities and parking real estate.2 Excluding collateral not defined as commercial real estate collateral, such as cash, financial guarantees and life insurance policies.3 Due to a scope change the 2018 comparative figures of the commercial real estate portfolio have been restated in order to align ABN AMRO’s CRE reporting.
15.8
24.4
30.9
11.4
17.5
20192 EADEUR 12.2 billion
14.7
23.8
33.6
10.5
17.4
20182, 3 EADEUR 10.6 billion
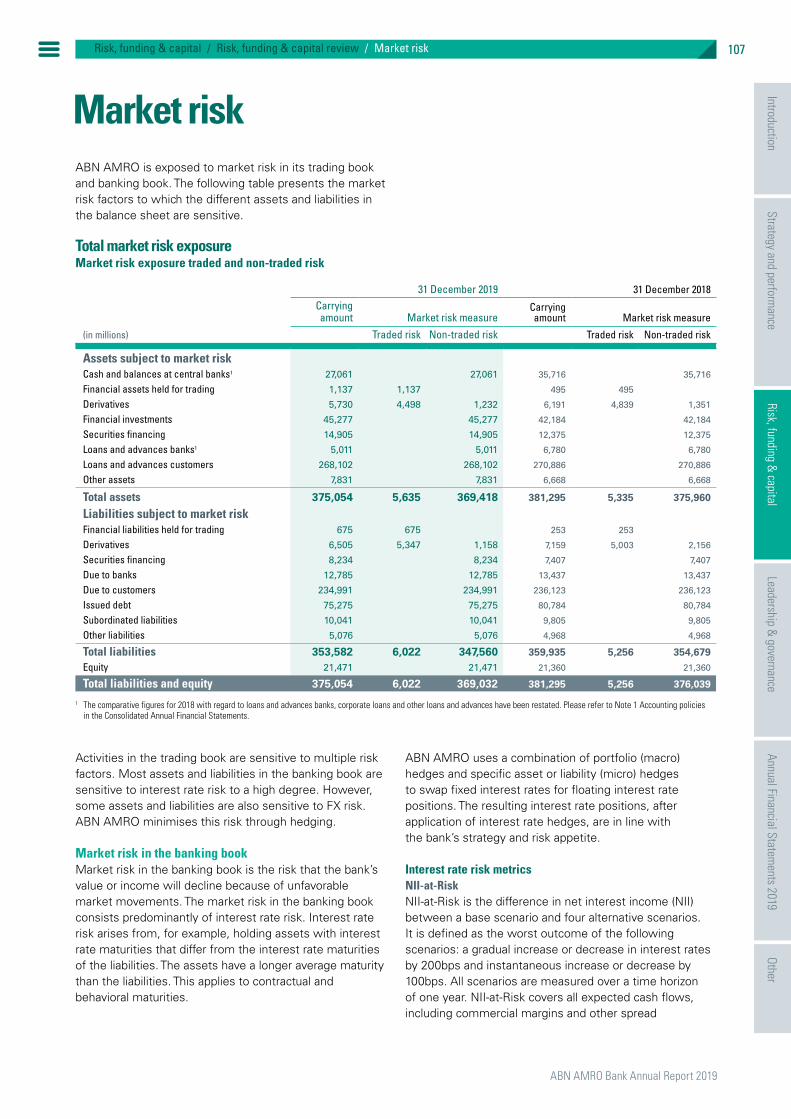
ABN AMRO Bank Annual Report 2019
107Risk, funding & capital / Risk, funding & capital review / Market risk
Market riskABN AMRO is exposed to market risk in its trading book and banking book. The following table presents the market risk factors to which the different assets and liabilities in the balance sheet are sensitive.
Total market risk exposureMarket risk exposure traded and non-traded risk
31 December 2019 31 December 2018Carrying amount Market risk measure
Carrying amount Market risk measure
(in millions) Traded risk Non-traded risk Traded risk Non-traded risk
Assets subject to market riskCash and balances at central banks1 27,061 27,061 35,716 35,716
Financial assets held for trading 1,137 1,137 495 495
Derivatives 5,730 4,498 1,232 6,191 4,839 1,351
Financial investments 45,277 45,277 42,184 42,184
Securities financing 14,905 14,905 12,375 12,375
Loans and advances banks1 5,011 5,011 6,780 6,780
Loans and advances customers 268,102 268,102 270,886 270,886
Other assets 7,831 7,831 6,668 6,668
Total assets 375,054 5,635 369,418 381,295 5,335 375,960
Liabilities subject to market riskFinancial liabilities held for trading 675 675 253 253
Derivatives 6,505 5,347 1,158 7,159 5,003 2,156
Securities financing 8,234 8,234 7,407 7,407
Due to banks 12,785 12,785 13,437 13,437
Due to customers 234,991 234,991 236,123 236,123
Issued debt 75,275 75,275 80,784 80,784
Subordinated liabilities 10,041 10,041 9,805 9,805
Other liabilities 5,076 5,076 4,968 4,968
Total liabilities 353,582 6,022 347,560 359,935 5,256 354,679Equity 21,471 21,471 21,360 21,360
Total liabilities and equity 375,054 6,022 369,032 381,295 5,256 376,039
1 The comparative figures for 2018 with regard to loans and advances banks, corporate loans and other loans and advances have been restated. Please refer to Note 1 Accounting policies in the Consolidated Annual Financial Statements.
Activities in the trading book are sensitive to multiple risk factors. Most assets and liabilities in the banking book are sensitive to interest rate risk to a high degree. However, some assets and liabilities are also sensitive to FX risk. ABN AMRO minimises this risk through hedging.
Market risk in the banking bookMarket risk in the banking book is the risk that the bank’s value or income will decline because of unfavorable market movements. The market risk in the banking book consists predominantly of interest rate risk. Interest rate risk arises from, for example, holding assets with interest rate maturities that differ from the interest rate maturities of the liabilities. The assets have a longer average maturity than the liabilities. This applies to contractual and behavioral maturities.
ABN AMRO uses a combination of portfolio (macro) hedges and specific asset or liability (micro) hedges to swap fixed interest rates for floating interest rate positions. The resulting interest rate positions, after application of interest rate hedges, are in line with the bank’s strategy and risk appetite.
Interest rate risk metricsNII-at-RiskNII-at-Risk is the difference in net interest income (NII) between a base scenario and four alternative scenarios. It is defined as the worst outcome of the following scenarios: a gradual increase or decrease in interest rates by 200bps and instantaneous increase or decrease by 100bps. All scenarios are measured over a time horizon of one year. NII-at-Risk covers all expected cash flows, including commercial margins and other spread
IntroductionStrategy and perform
anceLeadership &
governanceAnnual Financial Statem
ents 2019Other
Risk, funding & capital

ABN AMRO Bank Annual Report 2019
IntroductionStrategy and perform
anceRisk, funding &
capitalLeadership structure
GovernanceAnnual Financial Statem
entsOther
IntroductionStrategy and perform
anceLeadership &
governanceAnnual Financial Statem
ents 2019Other
108
Risk, funding & capital
Risk, funding & capital / Risk, funding & capital review / Market risk
components, from interest-rate-sensitive assets and liabilities and off-balance sheet items in the banking book. Floors on markets rates and specific products are applied.
PV01PV01 measures value changes resulting from a 1bp parallel shift of the yield curve. For internal risk management, shocks on individual maturities and larger shocks are also applied.
Duration of equityDuration of equity reflects changes in the economic value of equity due to small parallel shifts of the yield curve.
During 2019, ABN AMRO switched from using duration of equity to PV01 as the main metric for managing the interest rate risk from a value perspective because this metric is less sensitive to value changes. For comparability’s sake, duration of equity is still included in the annual report for 2019. NII-at-Risk continues to be used as the main metric for managing the interest rate risk from an income perspective. The following table shows the interest rate risk metrics.
31 December 2019 31 December 2018
NII-at-risk (in %) -1.0 -1.3
PV01 (in EUR million) -7.0 -5.5
Duration of equity (in years) 1.7 1.4
The NII-at-Risk at year-end 2019 fell to -1.0% and reflects the impact on NII in the scenario of an instantaneous decrease in interest rates by 100bps. This is the same NII-at-Risk scenario as in 2018, when the NII-at-Risk was -1.3%. The highest NII occurs for the scenario where interest rates gradually increase by 200bps, resulting in a 5.5% increase in NII.
PV01 increased from -EUR 5.5 million to -EUR 7.0 million, while duration of equity increased from 1.4 to 1.7 years. These changes were driven by the continuing demand for long-term mortgages and other business developments. Owing, however, to active hedging of the portfolio, the effect was limited.
Market risk in the trading bookMarket risk exposureABN AMRO applies a diversified portfolio VaR approach. This takes into account the fact that returns across risk factors may offset one another to a certain extent and consequently reduce risk. As long as these returns are not perfectly correlated to one another, VaR figures based on a diversified portfolio approach will be lower than if the figures are calculated using undiversified VaR.
Undiversified VaR means that the VaR figures computed for the different risk factors are summed up without taking into account any offset across risk factors, and therefore negates the potential for risk reduction.
The following graph shows the total 1-day VaR at a 99% confidence level (‘VaR diversified’) and aggregation of the stand-alone risk factors (‘VaR undiversified’).
1
2
3
4
5
Jan 2019 Apr 2019 Jul 2019 Oct 2019 Dec 2019
VaR diversified and undiversified(in millions)
VaR diversified VaR (un)diversified
Internal aggregated diversified and undiversified VaR for all trading positions b
31 December 2019 31 December 2018
(in millions) Diversified Undiversified Diversified Undiversified
VaR at last trading day of period 0.9 1.4 0.9 1.4
Highest VaR 2.4 4.9 5.0 11.4
Lowest VaR 0.6 0.9 0.6 1.4
Average VaR 1.1 1.9 2.0 3.4

ABN AMRO Bank Annual Report 2019
109Risk, funding & capital / Risk, funding & capital review / Market risk
In 2019, the average diversified 1-day VaR at a 99% confidence level decreased from EUR 2.0 million to EUR 1.1 million compared to 2018. The highest diversified VaR in 2019 was EUR 2.4 million. The average undiversified VaR decreased from EUR 3.4 million to EUR 1.9 million in 2019. The decrease in the average VaR observed from 2018 to 2019 was driven by reduced positions in 2019 compared to 2018. The reduction of positions occurred mainly in Q4 2018.
Regulatory capitalRWA for market risk decreased to EUR 1.4 billion (2018: EUR 1.6 billion). This was the result of a reduction of positions.
IntroductionStrategy and perform
anceLeadership &
governanceAnnual Financial Statem
ents 2019Other
Risk, funding & capital

ABN AMRO Bank Annual Report 2019
IntroductionStrategy and perform
anceRisk, funding &
capitalLeadership structure
GovernanceAnnual Financial Statem
entsOther
IntroductionStrategy and perform
anceLeadership &
governanceAnnual Financial Statem
ents 2019Other
110
Risk, funding & capital
Risk, funding & capital / Risk, funding & capital review / Operational risk
Operational risk by risk typeThe figure below shows the breakdown of the bank’s operational losses for each type of event. Operational losses also include on-balance additions to provisioned legal claims. Overall, a small decrease in the total amount of operational risk losses was seen compared to 2018.
As in 2018, losses were highest in the Clients, Products and Business Practices category. This was due to further additions to the existing provisions for SME derivatives-related issues. The external fraud figures are comparable to those in 2018. The number of attacks on ATMs increased, with a total of 52 ABN AMRO ATMs being attacked in 2019. The net loss for execution, delivery and process management consists of losses due to flaws or errors in the execution of processes. The damage attributable to these errors was largely comparable to last year’s figures, although these errors’ share of total losses increased. Risk awareness and continued strengthening of controls are helping to limit these losses.
Operational losses by event category1
Distribution (% of net loss amount)
1 Operational losses are presented excluding provisioned claims.
0
20
40
60
80
100
Clients,products
and business practices
Externalfraud
Execution,delivery, process manage-
ment
Techno-logy and
infra-structure failures
Disaster and
public safety
Internalfraud
Employeepractices
and workplace
safety
2019 2018
68
9
22
1 0 0
73
917
0 1 00
Please note that the presentation in this year’s report differs from the 2018 annual report: in the latter, litigation payments charged to provisions were shown as operational losses. As these payments sometimes relate to provisions established many years ago, we changed the set-up in 2019 to provide a more up-to-date picture and now show the on-balance additions in 2019 to the provisions made in 2019. The 2018 figures in the graph have been restated for the sake of comparison. Note that provisions made in 2018 and 2019 for costs to accelerate
the CDD remediation programmes in Retail Banking (ICS) and Commercial Banking are not considered to be operational losses, but rather costs made to enhance processes. In 2018, the first provision for these costs was still included in the figures. The above graph is restated for these costs.
IT & Cyber riskIn the light of internal and external developments, such as digitalisation, the adopting of Cloud services, evolving threats to the landscape and regulations, we continually strive to improve our capabilities, including our security controls. As an example, Distributed Denial of Service (DDoS) prevention technology has significantly improved since 2018, thus enabling us to successfully mitigate the related risk of business disruption. Alongside these improvements, we continue to devote great efforts to ensuring the overall stability of our digital payment services so as to safeguard their availability and to maintaining the operating effectiveness of the risk and control framework.
Fraud is another risk that we proactively manage. With our transition to open banking (PSD2), customer data (e.g. transactions and balances) can be aggregated and transferred, stored and used in a third party’s infrastructure. This is associated with an increased risk profile for ABN AMRO’s cyber security as it increases the attack surface and also, therefore, the potential threats. Despite the persistent volume of attacks, losses in 2019 were low. However, operational losses resulting from external fraud through digital client channels were higher in 2019 than in 2018. The amounts involved in phishing, malware and card theft attacks in 2019 also increased compared with previous years.
Besides having a strong Corporate Information Security Office (CISO), we require all bank employees to know how to deal with information security risks. To this end, a structural awareness campaign to enhance knowledge on managing different kinds of attacks is in place for all levels within the bank.
Stability of digital services The availability of the bank’s internet banking services during prime time was an average of 99.90% in 2019, compared to 99.46% in 2018. Although a few operational incidents occurred in 2019, these were fully resolved. Various improvements to processes and underlying systems were implemented during the year, resulting in an overall improvement of availability compared to 2018.
Operational risk

ABN AMRO Bank Annual Report 2019
111Risk, funding & capital / Risk, funding & capital review / Operational risk
ATM attacksIn response to the increase in both the number and severity of ATM attacks, ABN AMRO temporarily closed down 380 cash dispensers and 90 Geldmaat ATMs during the year. The banks, Geldmaat (a collaboration between the three largest Dutch banks), DNB, the prosecution service, the police and municipalities are now working together to identify and implement additional measures.
Business continuityBusiness continuity management (BCM) is part of the risk management framework and embedded in the organisation by a combination of first-line-of-defence roles within business and support functions, subsidiaries and countries and a second-line-of-defence function within the corporate BCM department. Business continuity mitigation controls, such as business continuity plans, crisis management, business relocation plans and IT disaster recovery plans, are in place to prepare for and deal with incidents and crises threatening the continuity of critical business processes. During 2019, our crisis management organisation proved able to respond adequately on all occasions and to restore business processes in accordance with the requirements specified in the business impact analysis. Evaluations and root cause analyses were executed to analyse incidents and implement lessons learned.
Change riskThe bank has to deal with large numbers of change initiatives, ranging from supporting the execution of our strategy to ensuring implementation of regulatory requirements. For the success of ABN AMRO and its teams, it is crucial to establish the right balance in the total change portfolio. A governance framework has therefore been put in place to align the various stakeholders, agendas and limited resources.
Data managementThe importance of data and models is increasing and the quality of data and model management capabilities has to keep pace with the related operational risks. In 2019 the bank further strengthened its governance and tools for data management, including a thorough control framework.
Compliance riskCompliance risk is defined as the risk of failure to comply with legislation and regulations, self-regulatory organisational standards, values and business principles, and codes of conduct or generally accepted market standards applicable to the bank’s services and activities. It can result in security risks and incidents and in financial and reputational damage arising from financial or other crime and misconduct or illegal conduct on the part of clients, the bank or its employees.
ABN AMRO has to live up to continuing regulatory expectations and mitigate their compliance risk. It is expected to act as a gatekeeper in detecting financial and economic crime, and to fulfil obligations arising under its duty of care to clients and society. Compliance requirements are not only part of our licence to operate, but also a vital part of our strategy: ‘Banking for better, for generations to come’.
From a compliance risk perspective, 2019 was an intense year and one in which regulatory demands often took precedence. The key priority during the year was to devote the appropriate attention and efforts to the various investigations and inquiries taking place. Important steps were taken in 2019 to ensure appropriate priorities were set, mainly by ensuring focused governance and improving the risk and control framework. In 2020, the Compliance function will continue in its ambition to become a data-driven and intelligence-led organisation, thus contributing to achieving the business goals of the bank and regulatory compliance.
Regulatory capitalOperational risk RWA as calculated under the Advanced Measurement Approach (AMA) increased slightly to EUR 19.4 billion in 2019 (2018: EUR 19.1 billion). This was mainly the result of higher exposure to regulatory fines (e.g. AML-related), as well as a revised set of capital add-ons. An update of RWA add-ons also took place during the year, based on the final decision letter from the ECB (received in March 2019). This updated set of add-ons, amounting to EUR 2.9 billion, will remain part of RWA until we have resolved the underlying findings and these have been validated by the ECB.
IntroductionStrategy and perform
anceLeadership &
governanceAnnual Financial Statem
ents 2019Other
Risk, funding & capital
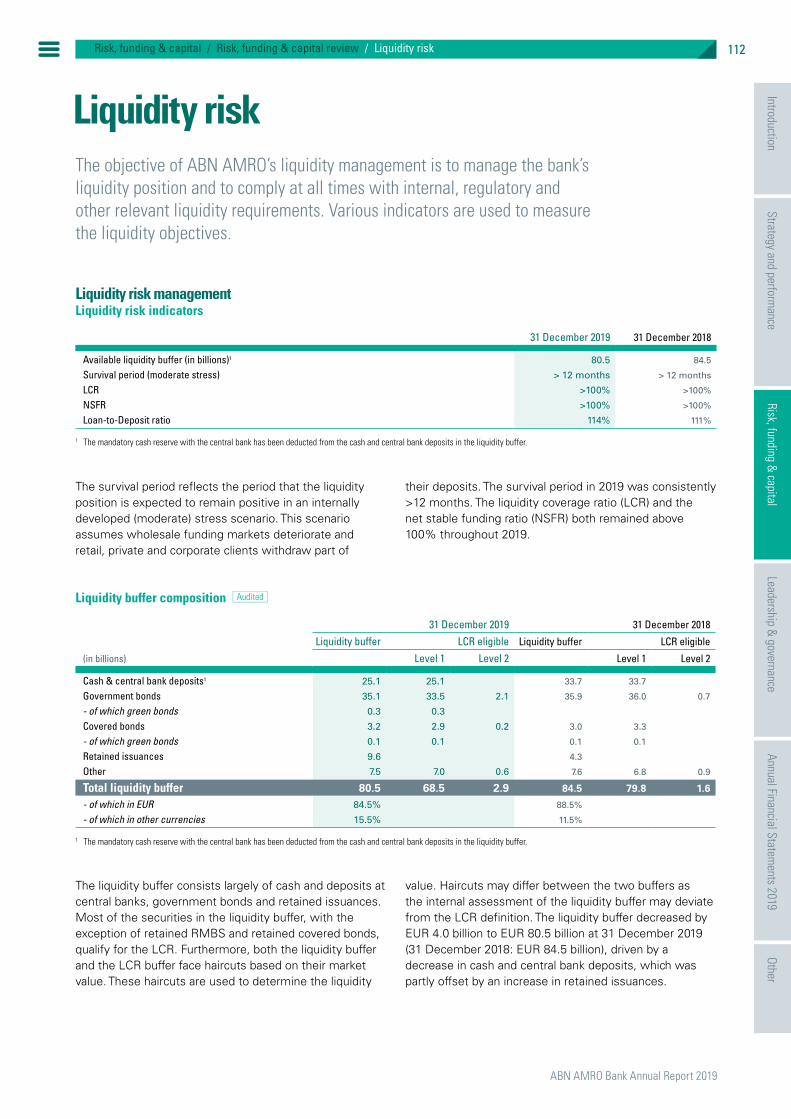
ABN AMRO Bank Annual Report 2019
IntroductionStrategy and perform
anceRisk, funding &
capitalLeadership structure
GovernanceAnnual Financial Statem
entsOther
IntroductionStrategy and perform
anceLeadership &
governanceAnnual Financial Statem
ents 2019Other
112
Risk, funding & capital
Risk, funding & capital / Risk, funding & capital review / Liquidity risk
Liquidity riskThe objective of ABN AMRO’s liquidity management is to manage the bank’s liquidity position and to comply at all times with internal, regulatory and other relevant liquidity requirements. Various indicators are used to measure the liquidity objectives.
Liquidity risk managementLiquidity risk indicators
31 December 2019 31 December 2018
Available liquidity buffer (in billions)1 80.5 84.5
Survival period (moderate stress) > 12 months > 12 months
LCR >100% >100%
NSFR >100% >100%
Loan-to-Deposit ratio 114% 111%
1 The mandatory cash reserve with the central bank has been deducted from the cash and central bank deposits in the liquidity buffer.
The survival period reflects the period that the liquidity position is expected to remain positive in an internally developed (moderate) stress scenario. This scenario assumes wholesale funding markets deteriorate and retail, private and corporate clients withdraw part of
their deposits. The survival period in 2019 was consistently >12 months. The liquidity coverage ratio (LCR) and the net stable funding ratio (NSFR) both remained above 100% throughout 2019.
Liquidity buffer composition b
31 December 2019 31 December 2018
Liquidity buffer LCR eligible Liquidity buffer LCR eligible
(in billions) Level 1 Level 2 Level 1 Level 2
Cash & central bank deposits1 25.1 25.1 33.7 33.7
Government bonds 35.1 33.5 2.1 35.9 36.0 0.7
- of which green bonds 0.3 0.3
Covered bonds 3.2 2.9 0.2 3.0 3.3
- of which green bonds 0.1 0.1 0.1 0.1
Retained issuances 9.6 4.3
Other 7.5 7.0 0.6 7.6 6.8 0.9
Total liquidity buffer 80.5 68.5 2.9 84.5 79.8 1.6
- of which in EUR 84.5% 88.5%
- of which in other currencies 15.5% 11.5%
1 The mandatory cash reserve with the central bank has been deducted from the cash and central bank deposits in the liquidity buffer.
The liquidity buffer consists largely of cash and deposits at central banks, government bonds and retained issuances. Most of the securities in the liquidity buffer, with the exception of retained RMBS and retained covered bonds, qualify for the LCR. Furthermore, both the liquidity buffer and the LCR buffer face haircuts based on their market value. These haircuts are used to determine the liquidity
value. Haircuts may differ between the two buffers as the internal assessment of the liquidity buffer may deviate from the LCR definition. The liquidity buffer decreased by EUR 4.0 billion to EUR 80.5 billion at 31 December 2019 (31 December 2018: EUR 84.5 billion), driven by a decrease in cash and central bank deposits, which was partly offset by an increase in retained issuances.

ABN AMRO Bank Annual Report 2019
113Risk, funding & capital / Risk, funding & capital review / Liquidity risk
Loan-to-Deposit ratio bLoans and advances customers decreased to EUR 268.1 billion at 31 December 2019 (31 December 2018: EUR 270.9 billion) due to a decline in mortgages and the corporate loan book. Due to customers decreased to EUR 235.0 billion at 31 December 2019 (31 December 2018: EUR 236.1 billion), mainly due to a decrease in Retail Banking deposits. The Loan-to-Deposit (LtD) ratio increased to 114% at 31 December 2019 (31 December
2018: 111%). The increase in the LtD ratio is attributable to a definition change with effect from 2019. Under the new definition, this ratio is calculated by dividing loans and advances customers by due to customers as reported at the balance sheet. Based on the new definition, the LtD ratio would have been 115% at year-end 2018. Hence, the LtD decreased to 114% from 115% at year-end 2018 as loans and advances customers decreased by more than due to customers.
Liquidity buffer currency diversification b
(in billions, liquidity value) 31 December 2019 31 December 2018
EUR 68.0 74.8
USD 8.9 8.3
JPY 2.1 0.5
GBP 0.3 0.2
Other 1.2 0.7
Total 80.5 84.5
The above table shows the breakdown per currency in the liquidity buffer. The currency composition reflects the composition of the balance sheet, which mainly consists
of EUR and USD exposures. The monthly averages of the liquidity buffer are shown in the table below.
Liquidity buffer composition - monthly average b
(in billions, liquidity value) 2019 2018
Cash & Central Bank deposits1 28.0 29.1
Government bonds 36.0 32.4
Covered bonds 3.5 2.7
Retained issuances 6.2 2.8
Other 8.4 7.4
Total 82.0 74.5
1 The mandatory cash reserve with the central bank has been deducted from the cash and central bank deposits in the liquidity buffer.
IntroductionStrategy and perform
anceLeadership &
governanceAnnual Financial Statem
ents 2019Other
Risk, funding & capital

ABN AMRO Bank Annual Report 2019
IntroductionStrategy and perform
anceRisk, funding &
capitalLeadership structure
GovernanceAnnual Financial Statem
entsOther
IntroductionStrategy and perform
anceLeadership &
governanceAnnual Financial Statem
ents 2019Other
114
Risk, funding & capital
Risk, funding & capital / Risk, funding & capital review / Funding
FundingLiability and equity breakdown bClient deposits are our main source of funding, complemented by a well-diversified book of wholesale funding. The graph below shows the liability and equity breakdown for the full balance sheet.
Liability and equity breakdown(in billions)
235.0
85.3
12.8 8.221.5 12.3
31 December 2019 31 December 2018
250
200
150
100
50
Client deposits Issued debt & Subordinated liabilities
Due to banks Securities financing Equity Other
236.1
90.6
13.4 7.421.4 12.4
Audited
The graph below shows the breakdown of client deposits by segment.
Retail Banking deposits
Private Banking deposits
Commercial Banking deposits
Corporate & InstitutionalBanking deposits
Group Functions deposits
Breakdown of client deposits(in billions)
25
50
75
100
125
Audited
90.4 93.5
69.2
46.3
26.5
2.7
66.2
45.0
28.0
3.5
31 December 2019 31 December 2018

ABN AMRO Bank Annual Report 2019
115Risk, funding & capital / Risk, funding & capital review / Funding
Available funding instruments bA key goal of the funding strategy is to diversify funding sources. Our funding programmes allow us to issue various instruments in different currencies and markets,
enabling us to diversify our investor base. A description of capital and funding instruments issued by ABN AMRO is provided on our website, abnamro.com/ir. The table below shows a breakdown of total funding instruments.
Overview of funding types b
(in millions) 31 December 2019 31 December 2018
Commercial Paper/Certificates of Deposit 14,666 15,801Securitisations 500
Covered bonds 34,014 32,629
Secured funding (long-term) 34,014 33,129Saving certificates 6
Senior preferred (medium-term notes)1 26,595 31,848
- of which green bonds 2,542 1,771
Unsecured funding (long-term) 26,595 31,854
Total issued debt 75,275 80,784Subordinated liabilities 10,041 9,805
Other long-term funding2 8,733 8,765
Total funding instruments3 94,049 99,353- of which issued debt matures within one year 23,148 27,181
1 Includes Senior preferred instruments only.2 Includes long-term repos (recorded in securities financing), TLTRO funding (recorded in due to banks) and funding with the Dutch State as counterparty (recorded in due to customers).3 Includes FX effects, fair value adjustments and interest movements.
Total wholesale funding (issued debt and subordinated liabilities) decreased to EUR 94.0 billion at 31 December 2019 (31 December 2018: EUR 99.3 billion), driven by a decrease in unsecured medium-term notes, commercial paper and certificates of deposits. This was
mainly due to a decline in the corporate loan book, resulting in a lower funding need. The following graph shows the development of the total funding instruments relative to the balance sheet totals at 31 December 2019 and 31 December 2018.
Funding vs balance sheet total(as % of total assets)
3.9
31 December 2019 31 December 2018
10
8
6
4
2
CP/CD Seniorsecured
Subordinated debt
Securitisations (incl. long-term repos)
Senior Unsecured
2.7
9.1
7.1
0.0
2.3
4.1
2.6
8.68.4
0.1
2.3
Other long-term funding
Audited
IntroductionStrategy and perform
anceLeadership &
governanceAnnual Financial Statem
ents 2019Other
Risk, funding & capital

ABN AMRO Bank Annual Report 2019
IntroductionStrategy and perform
anceRisk, funding &
capitalLeadership structure
GovernanceAnnual Financial Statem
entsOther
IntroductionStrategy and perform
anceLeadership &
governanceAnnual Financial Statem
ents 2019Other
116
Risk, funding & capital
Risk, funding & capital / Risk, funding & capital review / Funding
Long-term funding components bThe following graph shows an overview of long-term funding outstanding at 31 December 2019 and 31 December 2018. The information presented is based
on notional values and therefore differs from the above information owing to discrepancies between the notional values and issue prices and the fair value hedge accounting adjustments.
Long-term funding components(in %)
31 December2019
74.9 billion
41
35
13
12
31 December2018
80.8 billion
111
39
38
12
Securitisations Covered bondsSenior UnsecuredSubordinated liabilitiesOther long-term funding
Audited
Funding issuance in 2019 bTotal long-term funding raised in 2019 amounted to EUR 5.1 billion. This included EUR 1.8 billion of covered bonds and EUR 3.3 billion of senior unsecured funding.
Capital instruments are excluded in the long-term funding overview and included in the capital review section, which provides a complete overview of all outstanding capital instruments.
Q1 2018 Q2 2018 Q3 20181 Q4 2018 Q1 2019 Q2 2019 Q3 2019 Q4 2019
Long-term funding raised in 2018 and 2019(notional amounts at issuance, in billions)
0.9
2.5
0.8
0.8
3.4
1.6
0.0 0.1 0.1
Covered bonds Subordinated liabilitiesSenior Unsecured Other long-term funding2
1 The issuance of the EUR 1 billion of additional Tier 1 capital instrument is excluded from the graph above. An overview of the capital instruments is provided in the capital section.2 Other long-term funding consists of the TLTRO II participation.
1
2
3
4
5
Audited
2.1
1.8
1.6
1.3
0.2
3.0
2.0
3.9
2.93.2
2.0
Long-term wholesale funding in non-euro currencies declined to 25.4% of total outstanding long-term wholesale funding1, compared with 28.3% at 31 December 2018. In 2019, the bank raised all its long-term funding and capital instruments in euros
as the US dollar buffer built up in 2018 remained at sufficient levels throughout 2019. The diversification of the outstanding long-term funding in non-euro currencies is shown in the following graph.
1 Excluding long-term repos, TLTRO funding and funding with the Dutch State as counterparty.

ABN AMRO Bank Annual Report 2019
117Risk, funding & capital / Risk, funding & capital review / Funding
2.62.21.3
11.7
17.9 3.82.41.5
13.5
21.2
2019 2018
Non-euro currency diversificationof total outstanding long-term funding(in billions)
USD CHF GBP Other
Audited
25
20
15
10
5
Maturity calendar bWe enhance the maturity profile of our long-term funding predominantly by spreading redemptions of funding instruments over time. The average maturity of newly issued funding increased to 8.4 years (up from 7.5 years in 2018). This was mainly due to the issuance of covered bonds with longer tenors (15-20 years), reflecting the longer fixed interest rate periods of new mortgage production. The average maturity of outstanding long-term funding decreased to 4.8 years at year-end 2019 (down from 5.2 years at year-end 2018), due to the overall reduction in outstanding long-term funding. The maturity calendar assumes redemption on the earliest possible call date or the legal maturity date, which does not mean that the instruments will be called at the earliest possible call date. Early redemption of subordinated instruments is subject to approval by the regulator. The Targeted Long-Term Refinancing Operations (TLTRO) II of EUR 8.0 billion is reported at the legal maturity of four years, although there is a voluntary repayment option after two years.
Maturity calender b
31 December 2019(notional amounts, in billions) 2020 2021 2022 2023 2024 2025 2026 2027 2028 2029 ≥ 2030 Total
Covered bonds 2.4 2.6 2.7 1.9 1.8 0.5 1.6 0.6 0.6 0.5 15.4 30.7
Senior unsecured 6.0 7.6 4.2 2.4 1.8 2.4 0.8 0.2 0.1 0.3 25.9
Subordinated liabilities 1.6 1.5 1.5 2.4 1.3 0.9 0.3 9.5
Other long-term funding1 4.1 4.3 0.3 0.2 8.8
Total Long-term funding 14.1 16.0 8.5 6.8 3.6 4.2 3.6 1.0 0.7 0.5 16.0 74.9
Total Long-term funding2019 2020 2021 2022 2023 2024 2025 2026 2027 2028 ≥ 2029 Total
31 December 2018 11.2 14.1 14.7 8.5 6.8 2.1 4.2 2.8 1.0 0.7 14.6 80.8
1 Other long-term funding includes TLTRO II and funding with the Dutch State as counterparty.
IntroductionStrategy and perform
anceLeadership &
governanceAnnual Financial Statem
ents 2019Other
Risk, funding & capital

ABN AMRO Bank Annual Report 2019
IntroductionStrategy and perform
anceRisk, funding &
capitalLeadership structure
GovernanceAnnual Financial Statem
entsOther
IntroductionStrategy and perform
anceLeadership &
governanceAnnual Financial Statem
ents 2019Other
118
Risk, funding & capital
Risk, funding & capital / Risk, funding & capital review / Capital
CapitalCapital structureRegulatory capital structure b
(fully-loaded, in millions) 31 December 2019 31 December 2018
Total equity (EU IFRS) 21,471 21,360Cash flow hedge reserve 1,648 1,162
Dividend reserve -668 -752
AT1 capital securities -1,987 -1,986
Other regulatory adjustments -551 -438
Common Equity Tier 1 19,913 19,346AT1 capital securities 1,987 1,986
Other regulatory adjustments -5 -5
Tier 1 capital 21,895 21,327Subordinated liabilities (EU IFRS) 10,041 9,805
Regulatory adjustments -3,505 -3,363
Tier 2 capital1 6,536 6,441
Total regulatory capital 28,431 27,768
1 ABN AMRO changed the presentation of the Tier 2 capital to ensure reconciliation with the condensed consolidated statement of financial position. As a result of the change, the regulatory adjustments have been presented separately, resulting in a presentation change in 2019 and in the comparative figures.
Regulatory capital flow statement b
(fully-loaded, in millions) 2019 2018
Common Equity Tier 1 capitalBalance at 1 January 19,346 18,793Addition of net profit attributable to owners of the parent company1 2,046 2,312
Reserved dividend -668 -752
Interim dividend paid -564 -611
Other, including regulatory adjustments1 -246 -396
Balance at 31 December 19,913 19,346
Additional Tier 1 capitalBalance at 1 January 1,981 1,891New issued Tier 1 eligible capital instrumentsOther, including regulatory adjustments 2 90
Balance at 31 December 1,982 1,981
Tier 1 capital 21,895 21,327
Tier 2 capitalBalance at 1 January 6,441 7,546New issued Tier 2 eligible capital instrumentsOther, including regulatory adjustments 95 -1,105
Balance at 31 December 6,536 6,441
Total regulatory capital 28,431 27,768
1 Comparative figures for 2018 have been restated. Please refer to Note 1 Accounting policies in the Consolidated Annual Financial Statements.

ABN AMRO Bank Annual Report 2019
119Risk, funding & capital / Risk, funding & capital review / Capital
RWA b
(in millions) 31 December 2019 31 December 2018
Credit risk 89,071 84,701
- of which standardised 8,695 5,037
- of which advanced 80,376 79,664
Operational risk 19,391 19,077
- of which standardised 910 708
- of which advanced 18,481 18,369
Market risk 1,362 1,612
- of which standardised 6 1
- of which advanced 1,357 1,611
Total RWA 109,825 105,391
Main developments in capital positionAt 31 December 2019, the Basel III Common Equity Tier 1 (CET1), Tier 1 and total capital ratios were 18.1%, 19.9%, and 25.9% respectively (December 2018: 18.4%, 20.2% and 26.3% respectively). The capital position decreased compared to 31 December 2018, driven by a net RWA increase, partly offset by the addition of year-to-date profits attributable to the owners of the parent company (excluding AT1 capital securities). All capital ratios were in line with the bank’s risk appetite and strategic ambitions and were well above the regulatory minimum requirements.
The fully-loaded Basel IV CET1 ratio at year-end 2019 improved to above 14%. Basel IV calculations are subject to uncertainties stemming from the EU implementation of Basel IV, data limitations, management actions and other
portfolio developments. The Basel IV impact is regularly updated to reflect new insights on the EU implementation (including EBA advice), resolving data limitations and the execution of mitigations. The first effects of measures implemented to mitigate Basel IV inflation are visible in the RWA and we continue to work on further mitigations. These are expected to mitigate around an additional 20% of the Basel IV RWA inflation. We are well-positioned to meet the Basel IV CET1 target of at least 13.5% early in the phase-in period. The timelines for implementing Basel IV in the EU remain uncertain. The European Commission is expected to present a proposal for EU implementation in summer 2020.
The following chart shows the primary drivers of the Basel III capital ratios in 2019.
31 December 2018
Reportednet profit
RWA changes
Dividendreserve
Tier 2instruments
Other changes
-0.20.1-1.1-1.1
Developments impacting capital ratios in 2019(in %)
Common Equity Tier 1 ratio Tier 1 ratio Total capital ratio
18.119.9
25.9
1.9
31 December 2019
7.5
15
22.5
30
37.5
18.420.2
26.3
The CET1 capital target range under Basel III remains 17.5-18.5%, consisting of a Basel IV implementation buffer on top of the current SREP capital requirement, the Pillar 2 guidance and a management buffer. While the Basel IV buffer decreased in 2019, SREP increased to 12.0% and the Basel IV assumptions were updated.
We also continue to expect regulatory capital headwinds from the industry-wide non-performing exposure (NPE) guidance and minimum coverage levels for the existing stock of NPEs expected by the supervisor. In Q2 2019, we recorded a supervisory capital deduction of around EUR 0.2 billion. During the phase-in from 2020 to 2024,
IntroductionStrategy and perform
anceLeadership &
governanceAnnual Financial Statem
ents 2019Other
Risk, funding & capital

ABN AMRO Bank Annual Report 2019
IntroductionStrategy and perform
anceRisk, funding &
capitalLeadership structure
GovernanceAnnual Financial Statem
entsOther
IntroductionStrategy and perform
anceLeadership &
governanceAnnual Financial Statem
ents 2019Other
120
Risk, funding & capital
Risk, funding & capital / Risk, funding & capital review / Capital
we estimate the combined annual impact of NPE regulations to be of a similar order of magnitude. We are working on mitigating actions aimed at increasing NPE velocity by intensifying management attention for clients in FR&R and realising potential NPE divestments. If TRIM and model reviews further reduce the gap between Basel III and Basel IV RWA, we will lower our Basel III target range of 17.5-18.5% accordingly.
Developments impacting capital ratios in 2019Common Equity Tier 1 capitalCET1 capital increased in 2019, primarily as a result of profit accumulation. Net profit attributable to the owners of the parent company (excluding AT1 capital securities) amounted to EUR 1,941 million and, after dividend allocation, EUR 738 million was included in CET1 capital, in accordance with regulations and the dividend policy.
The Maximum Distributable Amount (MDA) trigger level under Basel III for 2020 increased to 12.09% (from 11.84%), reflecting the SREP requirements of 12.0% and the countercyclical buffer of 0.09%. The Pillar 2 requirement for 2020 has increased by 25bps compared with 2019, reflecting improvements required in credit risk models and processes, and our Detecting Financial Crime activities. The reported CET1 ratio is comfortably above the MDA trigger level.
On 29 June 2019, ABN AMRO Bank N.V. merged with its parent company, ABN AMRO Group N.V. This simplification of the corporate structure removed the AT1 shortfall and is beneficial to the bank’s Tier 1, total capital and leverage ratios at a consolidated level as the EBA interpretation for minority interest rules no longer applies.
Additional Tier 1A total of EUR 2.0 billion of AT1 instruments is currently outstanding. The AT1 instruments have triggers at the bank consolidated level (7.0% CET1) and solo level (5.125% CET1). If the CET1 ratio breaks through the trigger level, the AT1 is temporarily written down. ABN AMRO is comfortably above the trigger levels, with the bank consolidated CET1 ratio at 18.1% and the bank solo CET1 ratio at 17.4%. Available distributable items at 31 December 2019 amounted to EUR 18.5 billion (December 2018: EUR 18.5 billion).
Tier 2 capitalThe fully-loaded total capital ratio (25.9%) decreased by 0.4 percentage points compared to 31 December 2018 (26.3%). This was due to an increase in RWA, partly offset by profit accumulation.
Risk-weighted assetsTotal RWA at 31 December 2019 increased by EUR 4.4 billion to EUR 109.8 billion (31 December 2018: EUR 105.4 billion). The increase in RWA was primarily attributable to credit risk and operational risk. RWA for
credit risk increased by EUR 5.3 billion owing to add-ons anticipating TRIM and model reviews. These were partly offset by business developments and changes in the risk-weighting methodology of equity. RWA for operational risk increased by EUR 0.8 billion, mainly as a result of an update of the KYC/AML scenario in the capital model. Including the 2019 increase, we have recorded approximately EUR 10 billion for add-ons to RWA in anticipation of TRIM and model reviews since Q4 2018. The review of our corporate lending and specialised lending portfolios is in progress and we have already included some add-ons in our RWA to reflect preliminary TRIM feedback. RWA for mortgages will increase further in 2020 as a result of the risk weight floor announced by DNB. We also expect some impact from the guidelines for harmonising the definition of default in 2020. We expect a further, substantial impact from TRIM later in 2020, which will also affect our Basel III RWA and is likely to have an effect on our Basel IV-constrained use of IRB for RWA. TRIM and model reviews, including the risk weight floor announced by DNB, are not expected to materially impact on Basel IV fully-loaded RWA as the output floor is a constraint for us.
Further information on share capital, dividend and capital instrumentsShare capitalThe share capital remained unchanged in 2019. At 31 December 2018, the authorised share capital amounted to EUR 4,700 million, distributed as 4,500 million class A ordinary shares and 200 million class B ordinary shares. Class A and B ordinary shares have a nominal value of EUR 1.00 each.
At 31 December 2019, issued and paid-up capital amounted to EUR 940 million and consisted of 940 million class A ordinary shares. Further information is provided in Note 32 of the Consolidated Annual Financial Statements.
DividendSince 2018, the dividend payout policy has been set at 50% of net sustainable profit attributable to owners of the parent company, excluding exceptional items that significantly distort profitability and excluding AT1 capital securities. Additional distributions of above 50%, which can either be special dividends or share buy-backs (subject to regulatory approval), will be considered if capital is within or above the target range and will be subject to other circumstances, including regulatory and commercial considerations. The combined distribution will be at least 50% of net sustainable profit.
While we have a strong capital position and expect ongoing capital generation, we currently face a number of uncertainties. These include further significant TRIM impacts, a material add-on of around EUR 7.5 billion imposed by DNB for mortgages, and the fact that we remain subject to an investigation by the Dutch public

ABN AMRO Bank Annual Report 2019
121Risk, funding & capital / Risk, funding & capital review / Capital
prosecutor. Given these uncertainties, ABN AMRO proposes a final cash dividend of EUR 639 million, or EUR 0.68 per share, reflecting an additional distribution of EUR 233 million on top of the 50% payout ratio. Together with the interim cash dividend of EUR 564 million, this will bring the total dividend for 2019 to EUR 1,203 million, or EUR 1.28 per
share. This is equivalent to a payout ratio of 62% of reported net earnings after the deduction of AT1 coupon payments and minority interests and reflects a 12% additional distribution. In 2018, the payout ratio was also 62%, with a dividend of EUR 1,363 million, or EUR 1.45 per share.
Capital instrumentsCapital instruments b
31 December 2019 31 December 2018
(in millions) ISIN/CUSIP Maturity dateFirst possible
call dateNominal amount
Carrying amount
Nominal amount
Carrying amount
Tier 11
EUR 1,000 million 5.75% per annum XS1278718686 Perpetual September 2020 1,000 994 1,000 993
EUR 1,000 million 4.75% per annum XS1693822634 Perpetual September 2027 1,000 994 1,000 994
Total Tier 1 capital instruments 2,000 1,987 2,000 1,986
Tier 2EUR 1,228 million 6.375% per annum XS0619548216 April 2021 1,228 1,345 1,228 1,386
USD 595 million 6.250% per annum XS0619547838 April 2022 522 559 519 541
EUR 1,000 million 7.125% per annum XS0802995166 July 2022 1,000 1,096 1,000 1,109
USD 113 million 7.75% per annumUS00080QAD79 / USN0028HAP03 May 2023 99 103 99 98
EUR 1,500 million 2.875% per annum XS1253955469 June 2025 June 2020 1,500 1,522 1,500 1,538
USD 1,500 million 4.75% per annumUS00080QAF28 /
XS1264600310 July 2025 1,317 1,408 1,309 1,311
SGD 450 million 4.7% per annum XS1341466487 April 2026 April 2021 292 302 288 292
USD 1,000 million 4.8% per annumUS0008DAL47 / XS1392917784 April 2026 878 891 872 818
EUR 1,000 million 2.875% per annum XS1346254573 January 2028 January 2023 1,000 1,047 1,000 1,040
USD 1,500 million 4.4% per annum XS1586330604 March 2028 March 2023 1,317 1,371 1,309 1,299
USD 300 million 5.6% per annum XS1385037558 April 2031 263 275 262 244
EUR various smaller instruments 2020 - 2031 121 122 129 131
Total Tier 2 capital instruments 9,540 10,041 9,514 9,805
- of which eligible for regulatory capital:Basel III, Tier 1 (fully-loaded) 2,000 2,000
Basel III, Tier 2 (fully-loaded) 6,536 6,441
1 AT1 capital securities. For both AT1 instruments, the CET1 Trigger levels are 7.0% for ABN AMRO Bank level, and 5.125% for ABN AMRO Bank solo level. The amount of available distributable items for ABN AMRO Bank N.V. per 31 December 2019 totals EUR 18.5 billion (31 December 2018: EUR 18.5 billion).
Movements in subordinated liabilities b
2019 2018
(in millions) Carrying amount Carrying amount
Balance as at 1 January 9,805 9,720
Cash flowsIssuance 19
Redemption -8 -25
Non-cash changesForeign exchange differences 102 177
Other 141 -86
Balance as at 31 December 10,041 9,805
IntroductionStrategy and perform
anceLeadership &
governanceAnnual Financial Statem
ents 2019Other
Risk, funding & capital

ABN AMRO Bank Annual Report 2019
IntroductionStrategy and perform
anceRisk, funding &
capitalLeadership structure
GovernanceAnnual Financial Statem
entsOther
IntroductionStrategy and perform
anceLeadership &
governanceAnnual Financial Statem
ents 2019Other
122
Risk, funding & capital
Risk, funding & capital / Risk, funding & capital review / Capital
Minimum capital requirements bThe Pillar 1 capital requirement is the absolute minimum amount of capital required to cover the three major risk types that a bank faces: credit risk, operational risk and market risk, as determined in the Capital Requirements
Directive (CRD) IV Pillar 1 framework. The following table provides an overview of RWA and minimum capital requirements per risk type, category of exposure and regulatory approach.
Minimum capital requirements b
31 December 2019 31 December 2018
(in millions) Capital requirement RWA Capital requirement RWA
Credit risk IRBCentral governments and central banks 74 926 56 694
Institutions1 131 1,639 160 2,000
Corporates 3,193 39,917 3,495 43,691
Retail 1,390 17,378 1,557 19,464
- of which secured by immovable property/retail mortgages 1,096 13,703 1,208 15,097
- of which qualifying revolving exposures 115 1,439 152 1,898
- of which other retail 179 2,237 198 2,470
Equities not held for trading 294 3,669 315 3,943
Securitisation positions 3 32 2 31
Credit valuation adjustment 30 370 40 497
Other2 1,315 16,443 748 9,344
Total credit risk IRB 6,430 80,376 6,373 79,664
Credit risk SACentral governments and central banks 2
Institutions1 109 1,366 13 167
Corporates 380 4,756 217 2,719
Retail 88 1,099 84 1,055
Secured by mortgages on immovable property 21 259 18 229
Exposures in default 10 130 5 58
Other2 87 1,084 65 810
Total credit risk SA 696 8,695 403 5,037
Other risksMarket risk 109 1,362 129 1,612
- of which Standardised Approach 6 1
- of which Internal Model Approach 109 1,357 129 1,611
Operational risk 1,551 19,391 1,526 19,077
- of which Standardised Approach3 73 910 57 708
- of which Advanced Measurement Approach 1,478 18,481 1,470 18,369
Total other risks 1,660 20,754 1,655 20,689
Total 8,786 109,825 8,431 105,391
1 Institutions include exposures to banks and investment companies, regional and local governments and pension funds.2 Other includes non-credit obligations. 3 Inclusive Basic Indicator Approach.
Main regulatory developmentsThe Basel Committee has set the implementation date for Basel IV at 1 January 2022, from which date the output floor will gradually be phased-in over a period of 5 years. Basel IV will significantly impact ABN AMRO’s portfolio. Based on the year-end 2019 figures, the assessment indicates a potential increase in RWA of around 25% when applying a 72.5% floor. We aim to meet the fully-loaded Basel IV CET1 requirement, i.e. 13.5%, early on in the phase-in period.
The CRR fully-loaded CET1 ratio at 31 December 2019 was 18.1%, which was equal to the CRR phase-in CET1 ratio. Under the CRD IV/CRR fully-loaded rules, RWA are equivalent to those under the phase-in rules. The amount of CET1 capital under the fully-loaded rules is approximately equal to the amount under the phase-in rules since the fully-loaded impact on CET1 capital deductions is largely neutral. The CRR fully-loaded total capital ratio at 31 December 2019 was 25.9%, which was slightly lower than the CRR phase-in total capital ratio of
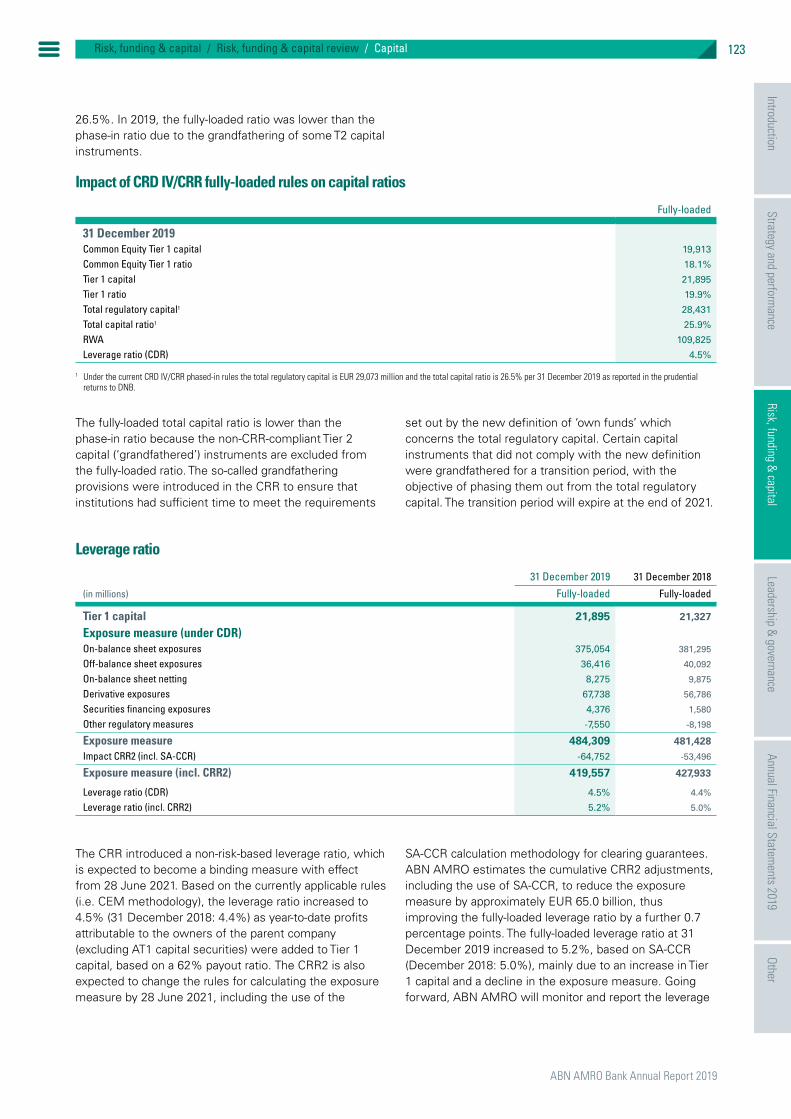
ABN AMRO Bank Annual Report 2019
123Risk, funding & capital / Risk, funding & capital review / Capital
26.5%. In 2019, the fully-loaded ratio was lower than the phase-in ratio due to the grandfathering of some T2 capital instruments.
Impact of CRD IV/CRR fully-loaded rules on capital ratios
Fully-loaded
31 December 2019Common Equity Tier 1 capital 19,913
Common Equity Tier 1 ratio 18.1%
Tier 1 capital 21,895
Tier 1 ratio 19.9%
Total regulatory capital1 28,431
Total capital ratio1 25.9%
RWA 109,825
Leverage ratio (CDR) 4.5%
1 Under the current CRD IV/CRR phased-in rules the total regulatory capital is EUR 29,073 million and the total capital ratio is 26.5% per 31 December 2019 as reported in the prudential returns to DNB.
The fully-loaded total capital ratio is lower than the phase-in ratio because the non-CRR-compliant Tier 2 capital (‘grandfathered’) instruments are excluded from the fully-loaded ratio. The so-called grandfathering provisions were introduced in the CRR to ensure that institutions had sufficient time to meet the requirements
set out by the new definition of ‘own funds’ which concerns the total regulatory capital. Certain capital instruments that did not comply with the new definition were grandfathered for a transition period, with the objective of phasing them out from the total regulatory capital. The transition period will expire at the end of 2021.
Leverage ratio
31 December 2019 31 December 2018
(in millions) Fully-loaded Fully-loaded
Tier 1 capital 21,895 21,327
Exposure measure (under CDR)On-balance sheet exposures 375,054 381,295
Off-balance sheet exposures 36,416 40,092
On-balance sheet netting 8,275 9,875
Derivative exposures 67,738 56,786
Securities financing exposures 4,376 1,580
Other regulatory measures -7,550 -8,198
Exposure measure 484,309 481,428Impact CRR2 (incl. SA-CCR) -64,752 -53,496
Exposure measure (incl. CRR2) 419,557 427,933
Leverage ratio (CDR) 4.5% 4.4%
Leverage ratio (incl. CRR2) 5.2% 5.0%
The CRR introduced a non-risk-based leverage ratio, which is expected to become a binding measure with effect from 28 June 2021. Based on the currently applicable rules (i.e. CEM methodology), the leverage ratio increased to 4.5% (31 December 2018: 4.4%) as year-to-date profits attributable to the owners of the parent company (excluding AT1 capital securities) were added to Tier 1 capital, based on a 62% payout ratio. The CRR2 is also expected to change the rules for calculating the exposure measure by 28 June 2021, including the use of the
SA-CCR calculation methodology for clearing guarantees. ABN AMRO estimates the cumulative CRR2 adjustments, including the use of SA-CCR, to reduce the exposure measure by approximately EUR 65.0 billion, thus improving the fully-loaded leverage ratio by a further 0.7 percentage points. The fully-loaded leverage ratio at 31 December 2019 increased to 5.2%, based on SA-CCR (December 2018: 5.0%), mainly due to an increase in Tier 1 capital and a decline in the exposure measure. Going forward, ABN AMRO will monitor and report the leverage
IntroductionStrategy and perform
anceLeadership &
governanceAnnual Financial Statem
ents 2019Other
Risk, funding & capital

ABN AMRO Bank Annual Report 2019
IntroductionStrategy and perform
anceRisk, funding &
capitalLeadership structure
GovernanceAnnual Financial Statem
entsOther
IntroductionStrategy and perform
anceLeadership &
governanceAnnual Financial Statem
ents 2019Other
124
Risk, funding & capital
Risk, funding & capital / Risk, funding & capital review / Capital
ratio on the basis of the currently applicable rules and CRR2, and we expect the leverage ratio to remain above the anticipated regulatory requirements.
The exposure measure is reported to the Asset and Liability Committee (ALCO) at the business line level and monitored closely in order to ensure the leverage ratio
remains within the bank’s risk appetite. The leverage ratio outlook takes account of business-specific plans, as well as macroeconomic conditions, regulatory developments and capital-related uncertainties. In the event of risk appetite breaches for the leverage ratio, the bank-wide escalation paths for capital and funding are followed.
MREL
(fully-loaded, in millions) 31 December 2019 31 December 2018
Regulatory capital 28,431 27,768
Other MREL eligible liabilities1 2,885 2,976
Total MREL eligible liabilities 31,316 30,744
Total risk-weighted assets 109,825 105,391
MREL2 28.5% 29.2%
1 Other MREL eligible liabilities consists of subordinated liabilities that are not included in regulatory capital.2 MREL is calculated as total regulatory capital plus other MREL eligible subordinated liabilities divided by total risk-weighted assets.
In 2019, the European Parliament approved a new version of the Bank Recovery and Resolution Directive (BRRD2). This means that amended international standards on loss absorption and recapitalisation have been incorporated into EU law and will become applicable in the member states during 2020. Based on our current interpretation of the minimum requirement for own funds and eligible liabilities (MREL) framework, but subject to further
changes and SRB guidance, we have a preliminary MREL ambition of approximately 27% of RWA by 2022, based on own funds, subordinated instruments and senior non-preferred notes. Based on these instruments, MREL was 28.5% at 31 December 2019. In January 2020, the bank issued its first tranche of EUR 1.25 billion of senior non-preferred notes.

ABN AMRO Bank Annual Report 2019
125Risk, funding & capital / Risk, funding & capital review / Sustainability risk
Sustainability riskAdvice on increased sustainability risk Certain industries face more sustainability risks than others, while the nature of these risks also varies considerably. During 2019, the Sustainable Banking department provided advice on clients operating in
industries with a higher sustainability risk profile on 407 occasions (2018: 472). The following graphs present a breakdown of the advice given for each industry, as well as the type of advice and conclusions.
Global advice
AgricultureChemicals & Pharma DefenceEnergy & Public utilitiesForestry InfrastructureManufacturing industryMining & MetalsMiscellaneous industriesOil & GasTobaccoTransport & LogisticsOther industries
2019Total 407
76
52
14 15
38
1265
5
39
9
71
112018
Total 472
7118
75
1 15
33
87
17
19
30
106
Aside from advising on client acceptance files, Sustainable Banking also provides advice on credit proposals and miscellaneous files. Credit proposals require a more extensive sustainability assessment than client acceptance files. The composition of the different types of advice given in 2019 was not significantly different from 2018, despite a decrease in the total number of advice responses issued.
ABN AMRO applies specific policy requirements for its lending clients in seven high-risk sectors. Each sector is divided into multiple subsectors and activities at different
places in the supply chain and matched with specific requirements. The types of advice and conclusions are presented below. The 407 cases for which advice was given in 2019 comprised 26 rejected cases, 173 approved cases and 208 cases in which approval was subject to conditions. The composition of the types of conclusions was very similar to the conclusions reached in 2018. The conditions imposed ranged from requesting additional information to engagement aimed at substantially improving the sustainability performance. Approximately 6% of the requests for advice in 2019 received a negative response.
Type of advice
187
193
27407
Client acceptanceRequest for finance
Other requests
625
500
375
250
125
20182019
220
215
37472
IntroductionStrategy and perform
anceLeadership &
governanceAnnual Financial Statem
ents 2019Other
Risk, funding & capital

ABN AMRO Bank Annual Report 2019
IntroductionStrategy and perform
anceRisk, funding &
capitalLeadership structure
GovernanceAnnual Financial Statem
entsOther
IntroductionStrategy and perform
anceLeadership &
governanceAnnual Financial Statem
ents 2019Other
126
Risk, funding & capital
Risk, funding & capital / Risk, funding & capital review / Sustainability risk
Conclusion of advice
173
208
26407
191
251
282
472
ApprovalsApproved with conditions
RejectionsWithdrawn
625
500
375
250
125
20182019
Effectiveness of sustainability risk management First-line relationship managers are aware of the bank’s sustainability risk policies and predominantly submit credit applications that comply with these policies. More than 2947 transactions were assessed for sustainability using the Global Sustainability Risk Index (GSRI) tool in 2019. In particular, 2023 of these transactions, mainly regarding CIB clients, were assessed for compliance with our ESG standards because they involved a higher degree of sustainability risk. ESG criteria are used in sustainability assessments to assess clients’ ethical, social, environmental and/or governance risks, their conduct or the entities they invest in.
TCFD climate risk scenario analysisIn line with the recommendations of the Financial Stability Board Taskforce on Climate-related Financial Disclosures (TCFD), we performed our first climate risk scenario analysis in 2019. This focused on physical risk in the Dutch residential mortgage portfolio, which is the bank’s largest lending portfolio. We also took some preliminary steps in assessing transition risk in the upstream oil and gas portfolio, which may be impacted by a global transition to a low carbon economy.
Physical riskScenariosThe Dutch Meteorological Institute (KNMI) develops climate scenarios for the Netherlands in line with the assumptions of the Intergovernmental Panel on Climate Change (IPCC). These scenarios show the expected weather in the Netherlands in 2050 if the global average temperature rise follows a path towards global warming of 2 or 4 degrees Celsius by 2100 and take account of specific wind variables for the Netherlands. In all scenarios, but mostly in the 4-degrees scenarios, extreme weather events, particularly flooding and drought, will increase in both frequency and severity. The effects of this extreme weather were assessed at a portfolio and
individual client level, focusing on what is generally considered the most extreme but not the most unlikely scenario: i.e. a rise in temperature of 4 degrees Celsius, with high wind variables.
ImpactThe impact of flooding and drought on our mortgage portfolio can be both direct and indirect. The direct impact will result from flooding or drought causing damage to property. Below you can see the geographical distribution of our residential mortgage portfolio and the probabilities of flooding of ≥50 cm1. Probability data were provided by Climate Adaptation Services (CAS).
0 > 1/301/3.000
Flooding probabilities ≥ 50 cm in 2050
Drought causes groundwater levels to decrease, thus exposing wooden foundation poles to oxygen and causing wooden poles to rot. The following figure shows the locations of our residential mortgage portfolio in the Netherlands and an indication of the risk of foundation pole rot in the coming 30 years.
1 Although probability in the coming 30 years will grow as a result of climate change, we assume it will be equally reduced by additional investment in water protection by the government, creating a constant probability for the coming 30 years.

ABN AMRO Bank Annual Report 2019
127Risk, funding & capital / Risk, funding & capital review / Sustainability risk
No risk Medium risk High riskLow risk
Wooden pole rot risk the coming 30 years
The indirect impact will work through the market and the macroeconomy. The focus in the scenario analysis was on:
Å market value reductions caused by the perception of risk and subsequent shifts in demand; and
Å the effects on the macroeconomy of flooding of ≥50 and ≥200 cm.
Initial insightsThe majority of the residential properties in our portfolio have a very low probability of experiencing damage from flooding or drought in the next 30 years. A relatively small number of properties, however, have a high probability of experiencing damage from flooding or drought in that period. Therefore, the impact on an individual household may be significant, even more so if the quality of the property is already low or the household’s response capacity is low (e.g. insufficient wealth or mortgage headroom). Nevertheless this initial analysis does not suggest a significant impact at either a portfolio or bank level.
A literature review of various empirical studies1 suggests that market value reductions based on risk perception will increase in response to the increasing risks associated with and public attention for climate change. The occurrence of flooding is also expected to have a significant effect on the macroeconomy in the form of
house price and gross domestic product (GDP) shocks, causing a standstill (temporary or otherwise) of economic activity and affecting consumption, employment and investment. This effect is expected to be even greater if a dynamic model is used to show feedback loops and interrelations between macroeconomic variables.
Next stepsInitial insights suggest that more detailed assessment is necessary. In 2020, therefore, we will further develop the analysis, improving methodology and data where possible, and also devise actions, both on our own and in cooperation with partners, to respond to the risks identified within our sphere of influence.
Transition risk
ScenariosThe International Energy Agency provides scenarios of different energy policy and investment choices in its World Energy Outlook 2019. The most significant decrease in demand for fossil fuels is in a scenario in which the Paris Agreement’s objective to limit global warming to well below 2 degrees is met (‘Sustainable Developed Scenario’, or SDS). This scenario entails the most extreme changes to the energy market, with decreasing demand for oil and gas, and consequently entails the most extreme changes in production and prices. The initial analysis focused on this scenario’s effect on our upstream oil and gas portfolio.
Initial insightsFollowing the methodology developed in the UNEP FI TCFD pilot, we assessed the sensitivity of our upstream oil and gas portfolio to the following risk factors: direct and indirect emissions costs, capital expenditure (investments in low carbon technology) and revenues. Given the nature of our clients, revenues are the most relevant risk factor for this portfolio. Initial insights suggest that, within the relatively short time horizon of our facilities, the impact is limited.
Next stepsIn 2020, therefore, we will broaden our analysis to focus on a longer time horizon and include more sectors affected by the transition to a low carbon economy. Where possible, this will also be connected to the assessment of our lending portfolio’s alignment with achieving the Paris Agreement ambition, using the 2dii banking tool.
1 Atreya, A., Ferreira, S. and Kriesel, W. (2013). Forgetting the Flood? An Analysis of the Flood Risk Discount over Time, 89(4), pp. 577-596. Bosker, M. et al. (2018). Nether Lands: Evidence on the Price and Perception of Rare Natural Disasters, 17 (2), pp. 413-453. Koks, E. et al. (2019). The macroeconomic impacts of future river flooding in Europe, 14 (8), pp. 1-9.
IntroductionStrategy and perform
anceLeadership &
governanceAnnual Financial Statem
ents 2019Other
Risk, funding & capital

ABN AMRO Bank Annual Report 2019
IntroductionStrategy and perform
anceRisk, funding &
capitalLeadership structure
GovernanceAnnual Financial Statem
entsOther
IntroductionStrategy and perform
anceLeadership &
governanceAnnual Financial Statem
ents 2019Other
128
Risk, funding & capital
Risk, funding & capital / Risk, funding & capital review / Sustainability risk
GHG protocolThe table below reflects the scope 1, 2 and 3 greenhouse gas (GHG) emissions from our operations and lending
portfolio, expressed in ktons of CO2 equivalent. The definitions of these scopes are based on the GHG protocol of the World Resources Institute (WRI).
CO2 emissions summary table - totals
(in ktons) 2019 2018 Delta
Total scope 11 13 12 1
Total scope 22 8 2 6
Total scope 3 - air travel3 10 12 -1
Total scope 3 - emissions of lending portfolio4 29,437 30,245 -808
Total CO2 Emission 29,469 30,271 -803
1 Natural gas / biogas, solar energy (the Netherlands and rest of world) and mobility lease cars (Netherlands). Emissions for 2018 excludes rest of the world.2 Electricity (excluding solar energy) and heating & cooling, location based figures provided by energy suppliers (the Netherlands and rest of world, emissions for 2018 exclude rest of world).3 Mobility business air travel (the Netherlands and rest of world).4 Based on PCAF methodology. Excluding consumer loans, other retail and client investments.
The lending portfolio’s emissions are calculated in accordance with the principles set by the Platform Carbon Accounting Financials (PCAF). These combine various sources of information, including company-level emissions data (for stock exchange-listed corporate clients) and average carbon intensities by energy label (for residential mortgages and corporate real estate finance) and by sector (for other corporates). More details can be found in our Non-Financial Data & Engagement 2019 report.

ABN AMRO Bank Annual Report 2019
129Risk, funding & capital / Additional risk, funding & capital disclosures
Additional risk, funding & capital disclosuresThe following section includes additional disclosures on risk, funding and capital. This mandatory information is provided in accordance with EU IFRS and EDTF. This section is supplemental to the core analysis provided in the Risk, funding & capital review section and provides additional or more detailed information.
Credit quality by exposure class under the Internal Ratings-Based (IRB) approachThe following tables provide an overview of the EAD, REA and LGD buckets by exposure class and grade category.
IRB approach: credit quality by exposure class
31 December 2019Total LGD 0-20% LGD 20-50% LGD >50%
(in millions) EAD RWA RWA/EAD EAD (%) EAD (%) EAD (%)
Exposure class Grade categoryCentral governments
and central banksInvestment grade 63,821 761 1% 89% 5% 6%
Sub-investment grade 170 165 97% 16% 84%
Impaired
Total 63,991 926 1% 89% 6% 6%Institutions1 Investment grade 11,291 1,246 11% 50% 50% 0%
Sub-investment grade 869 393 45% 2% 98%
Impaired
Total 12,159 1,639 13% 47% 53% 0%Corporates Investment grade 47,507 11,071 23% 40% 59% 1%
Sub-investment grade 61,244 23,464 38% 67% 33% 0%
Impaired 5,117 5,382 105% 21% 64% 15%
Total 113,868 39,917 35% 53% 46% 1%Retail Investment grade 151,868 7,763 5% 94% 5% 1%
Sub-investment grade 22,011 8,303 38% 75% 15% 10%
Impaired 1,496 1,313 88% 72% 17% 12%
Total 175,375 17,378 10% 91% 6% 3%Securitisation positions Investment grade 295 32 11% 100%
Sub-investment gradeImpaired
Total 295 32 11% 100% 0% 0%Credit valuation adjustment Investment grade
Sub-investment grade 370
Impaired
Total 370Total Investment grade 274,782 20,872 8% 82% 16% 2%
Sub-investment grade 84,294 32,696 39% 68% 29% 3%
Impaired 6,613 6,695 101% 33% 53% 14%
Total2 365,689 60,263 16% 78% 20% 3%
1 Institutions include exposures to banks and investment undertakings, regional governments and local authorities, and pension funds.2 Exposure at Default does not include other non-credit obligations and equities not held for trading, because these items are not subject to credit risk grading.
IntroductionStrategy and perform
anceRisk, funding &
capitalLeadership &
governanceAnnual Financial Statem
ents 2019Other
Risk, funding & capital
Additional risk, funding & capital disclosures
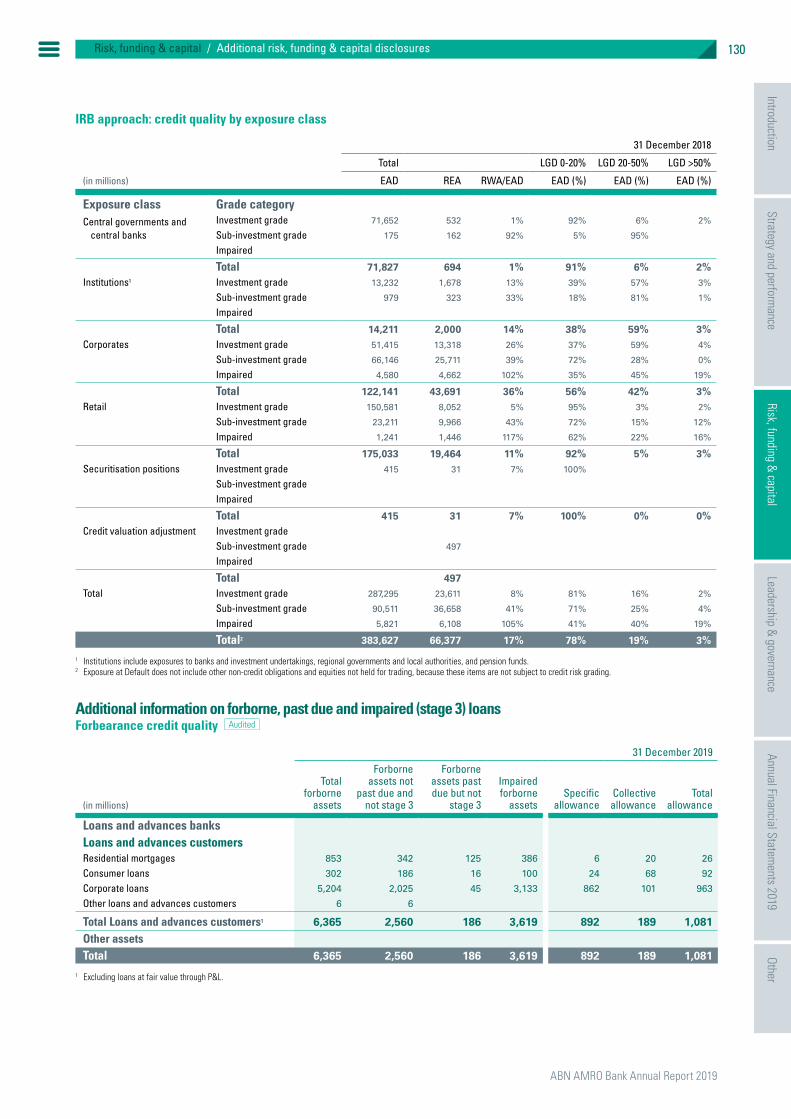
ABN AMRO Bank Annual Report 2019
IntroductionStrategy and perform
anceRisk, funding &
capitalLeadership structure
GovernanceAnnual Financial Statem
entsOther
IntroductionStrategy and perform
anceRisk, funding &
capitalLeadership &
governanceAnnual Financial Statem
ents 2019Other
130Risk, funding & capital / Additional risk, funding & capital disclosures
Risk, funding & capital
IRB approach: credit quality by exposure class
31 December 2018
Total LGD 0-20% LGD 20-50% LGD >50%
(in millions) EAD REA RWA/EAD EAD (%) EAD (%) EAD (%)
Exposure class Grade categoryCentral governments and
central banksInvestment grade 71,652 532 1% 92% 6% 2%
Sub-investment grade 175 162 92% 5% 95%
Impaired
Total 71,827 694 1% 91% 6% 2%Institutions1 Investment grade 13,232 1,678 13% 39% 57% 3%
Sub-investment grade 979 323 33% 18% 81% 1%
Impaired
Total 14,211 2,000 14% 38% 59% 3%Corporates Investment grade 51,415 13,318 26% 37% 59% 4%
Sub-investment grade 66,146 25,711 39% 72% 28% 0%
Impaired 4,580 4,662 102% 35% 45% 19%
Total 122,141 43,691 36% 56% 42% 3%Retail Investment grade 150,581 8,052 5% 95% 3% 2%
Sub-investment grade 23,211 9,966 43% 72% 15% 12%
Impaired 1,241 1,446 117% 62% 22% 16%
Total 175,033 19,464 11% 92% 5% 3%Securitisation positions Investment grade 415 31 7% 100%
Sub-investment gradeImpaired
Total 415 31 7% 100% 0% 0%Credit valuation adjustment Investment grade
Sub-investment grade 497
Impaired
Total 497Total Investment grade 287,295 23,611 8% 81% 16% 2%
Sub-investment grade 90,511 36,658 41% 71% 25% 4%
Impaired 5,821 6,108 105% 41% 40% 19%
Total2 383,627 66,377 17% 78% 19% 3%
1 Institutions include exposures to banks and investment undertakings, regional governments and local authorities, and pension funds.2 Exposure at Default does not include other non-credit obligations and equities not held for trading, because these items are not subject to credit risk grading.
Additional information on forborne, past due and impaired (stage 3) loansForbearance credit quality b
31 December 2019
(in millions)
Total forborne
assets
Forborne assets not
past due and not stage 3
Forborne assets past due but not
stage 3
Impaired forborne
assetsSpecific
allowanceCollective
allowanceTotal
allowance
Loans and advances banksLoans and advances customersResidential mortgages 853 342 125 386 6 20 26
Consumer loans 302 186 16 100 24 68 92
Corporate loans 5,204 2,025 45 3,133 862 101 963
Other loans and advances customers 6 6
Total Loans and advances customers1 6,365 2,560 186 3,619 892 189 1,081
Other assetsTotal 6,365 2,560 186 3,619 892 189 1,081
1 Excluding loans at fair value through P&L.

ABN AMRO Bank Annual Report 2019
131Risk, funding & capital / Additional risk, funding & capital disclosures
Forbearance credit quality b31 December 2018
(in millions)
Total forborne
assets
Forborne assets not
past due and not stage 3
Forborne assets past due but not
stage 3
Impaired forborne
assetsSpecific
allowanceCollective
allowanceTotal
allowance
Loans and advances banks1
Loans and advances customersResidential mortgages 721 268 108 344 8 28 35
Consumer loans 396 222 23 151 37 37 75
Corporate loans1 4,700 1,788 75 2,837 693 159 851
Other loans and advances customers1 3 3
Total Loans and advances customers2 5,820 2,282 206 3,332 737 224 961
Other assetsTotal 5,821 2,282 206 3,333 737 224 961
1 The comparative figures for 2018 with regard to loans and advances banks, corporate loans and other loans and advances have been restated. Please refer to Note 1 Accounting policies in the Consolidated Annual Financial Statements.
2 Excluding loans at fair value through P&L.
Forborne assets by geography b31 December 2019
(in millions) The Netherlands Rest of Europe USA Asia Rest of the world Total
Loans and advances banksLoans and advances customersResidential mortgages 845 8 853
Consumer loans 285 17 302
Corporate loans 3,413 679 278 186 648 5,204
Other loans and advances customers 6 6
Total Loans and advances customers1 4,543 704 278 192 649 6,365
Other assetsTotal 4,543 704 278 192 649 6,365
1 Excluding loans at fair value through P&L.
Forborne assets by geography b31 December 2018
(in millions) The Netherlands Rest of Europe USA Asia Rest of the world Total
Loans and advances banksLoans and advances customersResidential mortgages 703 17 1 721
Consumer loans 354 41 396
Corporate loans1 3,054 725 266 147 508 4,700
Other loans and advances customers1 3 3
Total Loans and advances customers2 4,115 783 266 148 509 5,820
Other assetsTotal 4,115 783 266 148 509 5,821
1 The comparative figures for 2018 with regard to loans and advances banks, corporate loans and other loans and advances have been restated. Please refer to Note 1 Accounting policies in the Consolidated Annual Financial Statements.
2 Excluding loans at fair value through P&L.
Forborne assets by business segment b
(in millions) 31 December 2019 31 December 2018
Retail Banking 1,087 989
Commercial Banking 3,045 2,807
Private Banking 138 209
Corporate & Institutional Banking 2,095 1,816
Total forborne assets 6,365 5,821
IntroductionStrategy and perform
anceRisk, funding &
capitalLeadership &
governanceAnnual Financial Statem
ents 2019Other
Risk, funding & capital

ABN AMRO Bank Annual Report 2019
IntroductionStrategy and perform
anceRisk, funding &
capitalLeadership structure
GovernanceAnnual Financial Statem
entsOther
IntroductionStrategy and perform
anceRisk, funding &
capitalLeadership &
governanceAnnual Financial Statem
ents 2019Other
132Risk, funding & capital / Additional risk, funding & capital disclosures
Risk, funding & capital
Maturity overview of assets and liabilities bThe following table shows financial assets and liabilities arranged by the earliest possible contractual maturity.
Contractual maturity of assets and liabilities b
31 December 2019
(in millions)On de-mand
Trad-ing
deriv-atives
Up to one
month
Between one and
three months
Between three
and six months
Between six and twelve
months
Between one
and two years
Between two
and five years
More than five
years
No matu-
rity Total
AssetsCash and balances at central banks 27,061 27,061
Financial assets held for trading 6 11 55 340 82 85 312 246 1,137
Derivatives 10 4,498 36 7 26 69 90 45 949 5,730
Financial investments 1,791 1,187 1,538 1,806 2,767 4,806 15,462 15,086 833 45,277
Securities financing 848 11,034 2,952 17 54 14,905
Loans and advances banks 1,103 1,416 555 386 219 341 35 956 5,011
Loans and advances customers 21,756 10,857 6,868 2,908 7,474 12,903 38,062 167,275 268,102
Other assets 4,056 1,892 511 145 34 752 334 107 7,831
Total assets 56,631 4,498 26,432 12,486 5,628 10,699 18,977 54,250 184,620 833 375,054
LiabilitiesFinancial liabilities held for trading 4 28 11 9 23 75 211 313 675
Derivatives 25 5,347 63 8 21 81 127 218 616 6,505
Securities financing 179 6,795 1,260 8,234
Due to banks 1,562 1,123 254 608 4,364 4,092 398 385 12,785
Due to customers 212,967 6,144 5,194 888 1,107 957 1,636 6,098 234,991
Issued debt 4,536 6,958 8,643 3,011 10,427 15,929 25,771 75,275
- of which senior secured 174 2,067 248 2,746 7,070 21,709 34,014
- of which senior unsecured 137 538 3,471 1,848 7,681 8,858 4,062 26,595
- of which senior non-preferred- of which other 4,225 6,421 3,106 915 14,666
Subordinated liabilities 3 1,522 103 1,647 4,186 2,580 10,041
Other liabilities 2,998 999 469 85 22 277 43 183 5,076
Total liabilities 217,734 5,347 19,690 14,154 11,778 8,710 17,602 22,620 35,947 353,582
Total equity 21,471 21,471
Total liabilities and equity 217,734 5,347 19,690 14,154 11,778 8,710 17,602 22,620 35,947 21,471 375,054
Off-balance sheet liabilitiesCommitted credit facilities 54,673 54,673
Guarantees 2,407 2,407
Irrevocable facilities 6,733 6,733
Recourse risks arising from discounted bills 8,339 8,339
Total off-balance sheet liabilities 72,152 72,152

ABN AMRO Bank Annual Report 2019
133Risk, funding & capital / Additional risk, funding & capital disclosures
Contractual maturity of assets and liabilities b
31 December 2018
(in millions)On de-mand2
Trad-ing
deriv-atives2
Up to one
month2
Between one and
three months
Between three
and six months
Between six and twelve
months
Between one
and two years
Between two
and five years
More than five
yearsNo ma-
turity Total
AssetsCash and balances at central banks1 35,716 35,716
Financial assets held for trading 495 495
Derivatives 379 206 236 241 773 1,390 2,966 6,191
Financial investments 129 357 1,560 845 1,815 4,182 14,306 17,992 998 42,184
Securities financing 6,661 2,516 2,985 143 70 12,375
Loans and advances banks1 1,028 2,429 560 360 266 308 703 1,126 6,780
Loans and advances customers 6,613 12,409 3,189 3,017 7,060 29,420 37,426 171,751 270,886
Other assets 1,239 1,135 440 154 261 311 401 966 1,761 6,668
Total assets 51,881 379 18,845 8,940 4,755 9,715 34,994 54,225 194,802 2,758 381,295
LiabilitiesFinancial liabilities held for trading 253 253
Derivatives 294 85 459 231 290 664 1,535 3,600 7,159
Securities financing 5,468 731 1,202 4 2 7,407
Due to banks 1,959 768 879 387 344 4,240 4,508 353 13,437
Due to customers 218,333 7,557 1,054 1,113 544 2,197 5,325 236,123
Issued debt 7,292 11,466 3,747 4,676 8,571 21,352 23,680 80,784
- of which senior secured 115 10 1,761 2,699 7,803 20,242 32,629
- of which senior unsecured 4,854 2,282 317 1,536 5,872 13,549 3,438 31,848
- of which securitisation 500 500
- of which other 2,324 9,184 3,420 880 15,807
Subordinated liabilities 7 1,644 5,773 2,380 9,805
Other liabilities 867 1,429 296 23 20 66 7 240 2,020 4,968
Total liabilities 226,879 294 10,305 21,859 5,453 6,446 15,730 35,371 35,578 2,020 359,935
Total equity 21,360 21,360
Total liabilities and equity 226,879 294 10,305 21,859 5,453 6,446 15,730 35,371 35,578 23,380 381,295
Off-balance sheet liabilitiesCommitted credit facilities 61,166 61,166
Guarantees 2,473 2,473
Irrevocable facilities 5,946 5,946
Recourse risks arising from discounted bills 6,822 6,822
Total off-balance sheet liabilities 76,408 76,408
1 The comparative figures for 2018 with regard to loans and advances banks have been restated. Please refer to Note 1 Accounting policies in the Consolidated Annual Financial Statements.2 In 2019, up to one month has been divided into on demand, trading derivatives and up to one month. The comparative figures for 2018 have been restated accordingly.
Maturity based on contractual undiscounted cash flows bThe following table provides a maturity analysis of the earliest contractual undiscounted cash flows for financial assets and liabilities. Financial assets and liabilities held for
trading are recorded under On demand, at fair value. We believe this best represents the short-term nature and cash flows of these activities. The contractual maturity of the instruments may be extended over significantly longer periods.
IntroductionStrategy and perform
anceRisk, funding &
capitalLeadership &
governanceAnnual Financial Statem
ents 2019Other
Risk, funding & capital
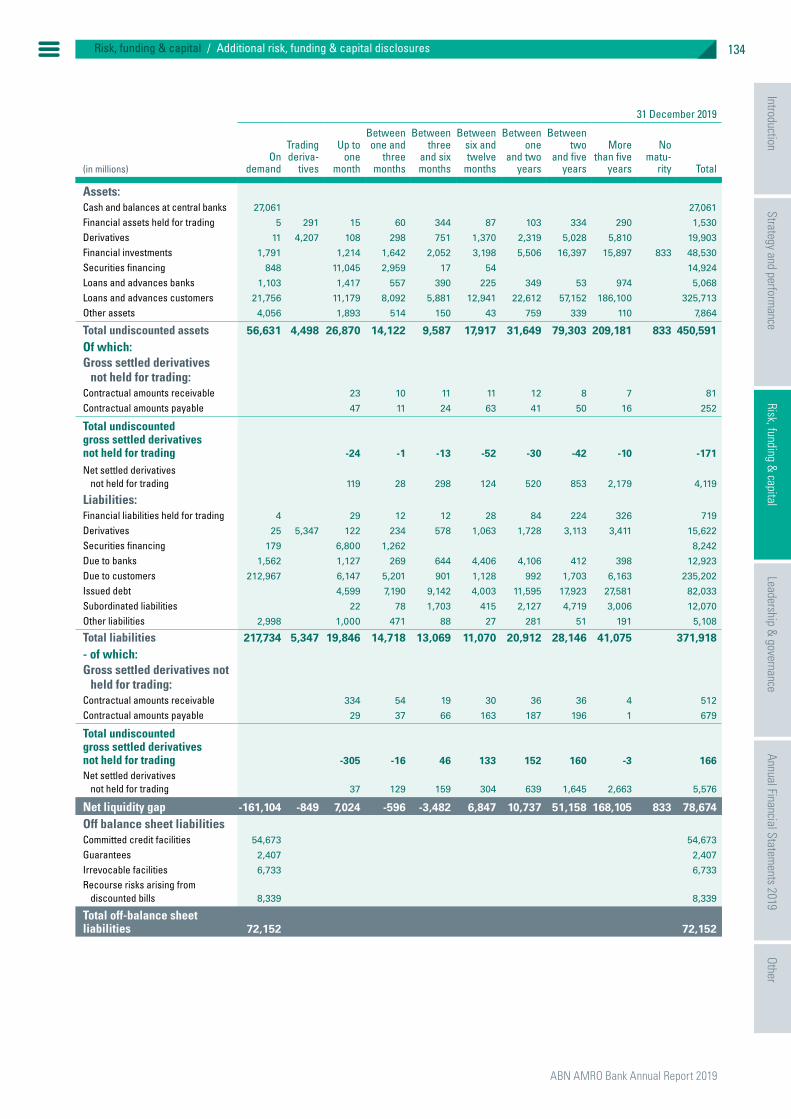
ABN AMRO Bank Annual Report 2019
IntroductionStrategy and perform
anceRisk, funding &
capitalLeadership structure
GovernanceAnnual Financial Statem
entsOther
IntroductionStrategy and perform
anceRisk, funding &
capitalLeadership &
governanceAnnual Financial Statem
ents 2019Other
134Risk, funding & capital / Additional risk, funding & capital disclosures
Risk, funding & capital
31 December 2019
(in millions)On
demand
Trading deriva-
tives
Up to one
month
Between one and
three months
Between three
and six months
Between six and twelve
months
Between one
and two years
Between two
and five years
More than five
years
No matu-
rity Total
Assets:Cash and balances at central banks 27,061 27,061
Financial assets held for trading 5 291 15 60 344 87 103 334 290 1,530
Derivatives 11 4,207 108 298 751 1,370 2,319 5,028 5,810 19,903
Financial investments 1,791 1,214 1,642 2,052 3,198 5,506 16,397 15,897 833 48,530
Securities financing 848 11,045 2,959 17 54 14,924
Loans and advances banks 1,103 1,417 557 390 225 349 53 974 5,068
Loans and advances customers 21,756 11,179 8,092 5,881 12,941 22,612 57,152 186,100 325,713
Other assets 4,056 1,893 514 150 43 759 339 110 7,864
Total undiscounted assets 56,631 4,498 26,870 14,122 9,587 17,917 31,649 79,303 209,181 833 450,591
Of which:Gross settled derivatives
not held for trading:Contractual amounts receivable 23 10 11 11 12 8 7 81
Contractual amounts payable 47 11 24 63 41 50 16 252
Total undiscounted gross settled derivatives not held for trading -24 -1 -13 -52 -30 -42 -10 -171
Net settled derivatives not held for trading 119 28 298 124 520 853 2,179 4,119
Liabilities:Financial liabilities held for trading 4 29 12 12 28 84 224 326 719
Derivatives 25 5,347 122 234 578 1,063 1,728 3,113 3,411 15,622
Securities financing 179 6,800 1,262 8,242
Due to banks 1,562 1,127 269 644 4,406 4,106 412 398 12,923
Due to customers 212,967 6,147 5,201 901 1,128 992 1,703 6,163 235,202
Issued debt 4,599 7,190 9,142 4,003 11,595 17,923 27,581 82,033
Subordinated liabilities 22 78 1,703 415 2,127 4,719 3,006 12,070
Other liabilities 2,998 1,000 471 88 27 281 51 191 5,108
Total liabilities 217,734 5,347 19,846 14,718 13,069 11,070 20,912 28,146 41,075 371,918
- of which:Gross settled derivatives not
held for trading:Contractual amounts receivable 334 54 19 30 36 36 4 512
Contractual amounts payable 29 37 66 163 187 196 1 679
Total undiscounted gross settled derivatives not held for trading -305 -16 46 133 152 160 -3 166Net settled derivatives
not held for trading 37 129 159 304 639 1,645 2,663 5,576
Net liquidity gap -161,104 -849 7,024 -596 -3,482 6,847 10,737 51,158 168,105 833 78,674
Off balance sheet liabilitiesCommitted credit facilities 54,673 54,673
Guarantees 2,407 2,407
Irrevocable facilities 6,733 6,733
Recourse risks arising from discounted bills 8,339 8,339
Total off-balance sheet liabilities 72,152 72,152
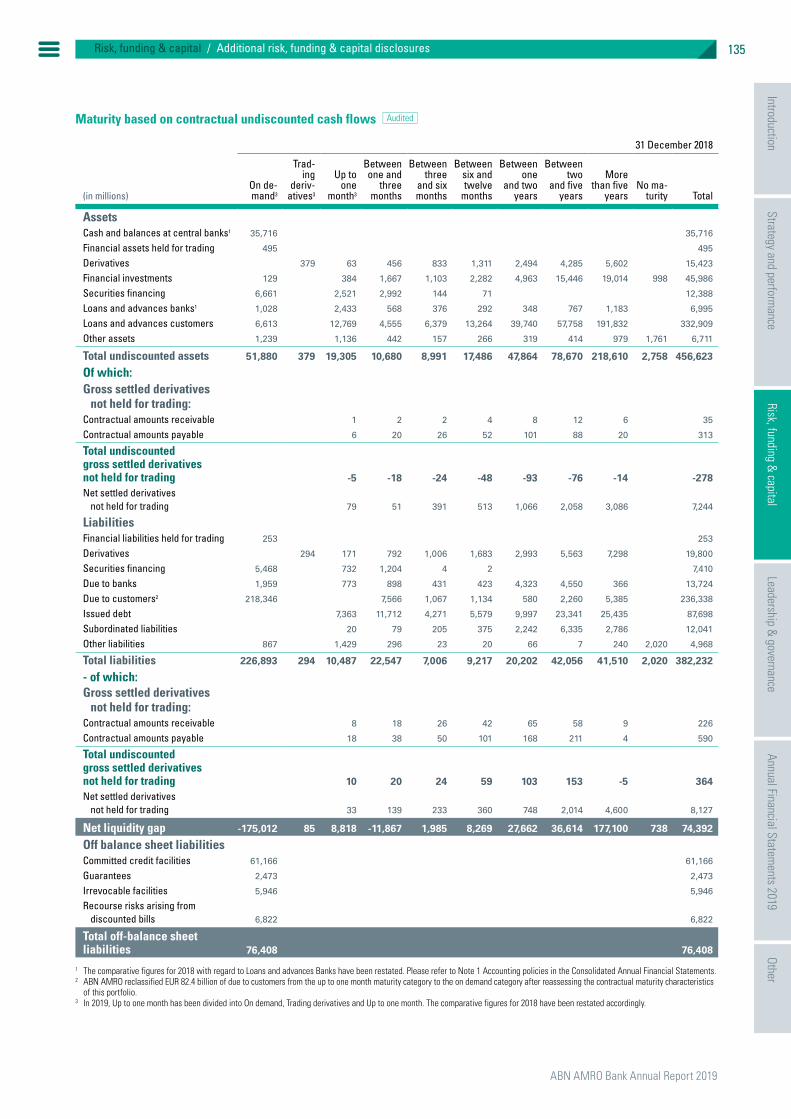
ABN AMRO Bank Annual Report 2019
135Risk, funding & capital / Additional risk, funding & capital disclosures
Maturity based on contractual undiscounted cash flows b
31 December 2018
(in millions)On de-mand3
Trad-ing
deriv-atives3
Up to one
month3
Between one and
three months
Between three
and six months
Between six and twelve
months
Between one
and two years
Between two
and five years
More than five
yearsNo ma-
turity Total
AssetsCash and balances at central banks1 35,716 35,716
Financial assets held for trading 495 495
Derivatives 379 63 456 833 1,311 2,494 4,285 5,602 15,423
Financial investments 129 384 1,667 1,103 2,282 4,963 15,446 19,014 998 45,986
Securities financing 6,661 2,521 2,992 144 71 12,388
Loans and advances banks1 1,028 2,433 568 376 292 348 767 1,183 6,995
Loans and advances customers 6,613 12,769 4,555 6,379 13,264 39,740 57,758 191,832 332,909
Other assets 1,239 1,136 442 157 266 319 414 979 1,761 6,711
Total undiscounted assets 51,880 379 19,305 10,680 8,991 17,486 47,864 78,670 218,610 2,758 456,623
Of which:Gross settled derivatives
not held for trading:Contractual amounts receivable 1 2 2 4 8 12 6 35
Contractual amounts payable 6 20 26 52 101 88 20 313
Total undiscounted gross settled derivatives not held for trading -5 -18 -24 -48 -93 -76 -14 -278Net settled derivatives
not held for trading 79 51 391 513 1,066 2,058 3,086 7,244
LiabilitiesFinancial liabilities held for trading 253 253
Derivatives 294 171 792 1,006 1,683 2,993 5,563 7,298 19,800
Securities financing 5,468 732 1,204 4 2 7,410
Due to banks 1,959 773 898 431 423 4,323 4,550 366 13,724
Due to customers2 218,346 7,566 1,067 1,134 580 2,260 5,385 236,338
Issued debt 7,363 11,712 4,271 5,579 9,997 23,341 25,435 87,698
Subordinated liabilities 20 79 205 375 2,242 6,335 2,786 12,041
Other liabilities 867 1,429 296 23 20 66 7 240 2,020 4,968
Total liabilities 226,893 294 10,487 22,547 7,006 9,217 20,202 42,056 41,510 2,020 382,232
- of which:Gross settled derivatives
not held for trading:Contractual amounts receivable 8 18 26 42 65 58 9 226
Contractual amounts payable 18 38 50 101 168 211 4 590
Total undiscounted gross settled derivatives not held for trading 10 20 24 59 103 153 -5 364Net settled derivatives
not held for trading 33 139 233 360 748 2,014 4,600 8,127
Net liquidity gap -175,012 85 8,818 -11,867 1,985 8,269 27,662 36,614 177,100 738 74,392
Off balance sheet liabilitiesCommitted credit facilities 61,166 61,166
Guarantees 2,473 2,473
Irrevocable facilities 5,946 5,946
Recourse risks arising from discounted bills 6,822 6,822
Total off-balance sheet liabilities 76,408 76,408
1 The comparative figures for 2018 with regard to Loans and advances Banks have been restated. Please refer to Note 1 Accounting policies in the Consolidated Annual Financial Statements.2 ABN AMRO reclassified EUR 82.4 billion of due to customers from the up to one month maturity category to the on demand category after reassessing the contractual maturity characteristics
of this portfolio.3 In 2019, Up to one month has been divided into On demand, Trading derivatives and Up to one month. The comparative figures for 2018 have been restated accordingly.
IntroductionStrategy and perform
anceRisk, funding &
capitalLeadership &
governanceAnnual Financial Statem
ents 2019Other
Risk, funding & capital

ABN AMRO Bank Annual Report 2019
IntroductionStrategy and perform
anceRisk, funding &
capitalLeadership structure
GovernanceAnnual Financial Statem
entsOther
IntroductionStrategy and perform
anceRisk, funding &
capitalLeadership &
governanceAnnual Financial Statem
ents 2019Other
136Risk, funding & capital / Additional risk, funding & capital disclosures
Risk, funding & capital
Maturity based on behavioural models bThe table below provides an overview of the amounts expected to be settled within twelve months and after twelve months, based on the behavioural maturity profile.
31 December 2019 31 December 2018
(in millions)Up to
one yearMore than
one year TotalUp to
one yearMore than
one year Total
AssetsCash and balances at central banks 27,061 27,061 35,716 35,716
Financial assets held for trading 1,137 1,137 495 495
Derivatives 4,498 1,232 5,730 4,839 1,351 6,191
Financial investments 9,005 36,272 45,277 5,666 36,518 42,184
Securities financing 14,436 468 14,905 11,771 604 12,375
Loans and advances banks 3,570 1,441 5,011 4,563 2,216 6,780
Residential mortgages 28,069 122,811 150,880 22,978 127,806 150,784
Consumer loans 3,196 8,800 11,997 3,576 8,369 11,945
Corporate loans at amortised cost 35,454 62,217 97,672 35,558 64,850 100,408
Corporate loans at fair value through P&L 816 445 1,261 421 362 783
Other loans and advances customers 4,093 2,199 6,292 4,969 1,997 6,966
Equity accounted investments 639 639 522 522
Property and equipment 598 1,108 1,706 218 1,287 1,506
Goodwill and other intangible assets 36 142 178 33 131 164
Assets held for sale 14 14 56 56
Tax assets 764 764 516 516
Other assets 1,515 3,016 4,530 1,432 2,471 3,904
Total assets 134,263 240,790 375,054 132,808 248,487 381,295
LiabilitiesFinancial liabilities held for trading 675 675 253 253
Derivatives 5,347 1,158 6,505 5,003 2,156 7,159
Securities financing 8,082 152 8,234 6,784 623 7,407
Due to banks 6,797 5,988 12,785 2,738 10,699 13,437
Current accounts 29,836 62,064 91,900 27,936 56,256 84,192
Demand deposits 20,826 100,066 120,892 21,597 104,466 126,063
Time deposits 8,090 13,142 21,232 12,445 12,613 25,058
Other due to customers 200 768 967 270 540 810
Issued debt 23,637 51,638 75,275 27,255 53,529 80,784
Subordinated liabilities 1,624 8,417 10,041 7 9,798 9,805
Provisions 983 983 1,204 1,204
Liabilities held for sale 41 41
Tax liabilities 63 63 36 36
Other liabilities 1,698 2,332 4,030 1,648 2,038 3,686
Total liabilities 107,858 245,724 353,582 107,218 252,717 359,935
The behavioural maturity profile is based on internally developed liquidity risk models. These liquidity risk models cover residential mortgages, consumer and corporate loans, non-maturing assets (mainly current accounts), credit cards, non-maturing liabilities (demand deposits and current accounts) and term deposits. The liquidity models predict the behavioural cash flows, which can differ from the contractual cash flows as a result, for example, of prepayments or because some products do not have a defined contractual maturity date. The models are based on historically observed client behaviour and use a combination of internal and external risk drivers. The models are used for monitoring the bank’s liquidity mismatch position.
The liquidity risk models are included in the bank’s model risk management framework. This means that the models have to follow a regular monitoring and validation schedule. Approval of the models is done by the Methodology Acceptance Group (MAG) ALM/T, based on independent advice from Model Validation.

Leadership & governance
138 Introduction to Leadership & governance
138 Executive Board and Executive Committee
142 Supervisory Board
146 Report of the Supervisory Board
154 General Meeting and shareholder structure
157 Codes and regulations
159 Legal structure
160 Remuneration report
This section presents the bank’s leadership which includes the Executive Board, Executive Committee and Supervisory Board. Additionally it presents the Report of the Supervisory Board over the year 2019 and an overview of the Bank’s corporate governance framework, including information on the Bank’s legal structure and remuneration policy.
IntroductionStrategy and perform
anceRisk, funding &
capitalAnnual Financial Statem
ents 2019Other
Leadership & governance
Leadership & governance

ABN AMRO Bank Annual Report 2019
IntroductionStrategy and perform
anceRisk, funding &
capitalLeadership structure
GovernanceAnnual Financial Statem
entsOther
IntroductionStrategy and perform
anceRisk, funding &
capitalAnnual Financial Statem
ents 2019Other
138
Leadership & governance
Leadership & governance / Introduction to Leadership & governance
This section presents ABN AMRO’s leadership and corporate governance framework. It provides information on ABN AMRO’s Executive Board, Executive Committee and Supervisory Board, as well as on its legal structure and remuneration policy. This section also presents the Report of the Supervisory Board for 2019.
Introduction to Leadership & governance
On 13 February 2019 ABN AMRO announced its intention to simplify the group structure by executing a legal merger between ABN AMRO Bank N.V. (“ABN AMRO Bank”) and ABN AMRO Group N.V. (“ABN AMRO Group”). When the legal merger took effect on 29 June, ABN AMRO Bank became the remaining entity and ABN AMRO Group ceased to exist. As of 29 June 2019, ABN AMRO’s management structure comprises an Executive Board and an Executive Committee at ABN AMRO Bank level only.
On 16 June 2019, ABN AMRO announced that Mr Kees van Dijkhuizen would not be serving a new term of office as CEO following the end of his current term, which will expire at the Annual General Meeting on 22 April 2020. After carrying out an extensive and thorough selection procedure, it was announced that Mr Robert Swaak would be appointed as the new CEO of ABN AMRO by the Supervisory Board. Mr Swaak will succeed Mr van Dijkhuizen during the Annual General Meeting on 22 April 2020. His appointment is subject to regulatory approval. The Employee Council and NLFI have issued a positive advice with regard to his appointment.
The terms of office of the members of the Executive Committee (not Executive Board) were due to end in March 2020. These terms were extended by two or four years in March 2020. The terms of Mr Frans van der Horst (CEO of Retail Banking) and Mr Pieter van Mierlo (CEO of Private Banking) have been extended by two years, while those of Ms Daphne de Kluis (CEO of Commercial Banking) and Mr Rutger van Nouhuijs (CEO of Corporate & Institutional Banking) have been extended by four years.
The bank has opted for staggered terms to ensure that the Executive Committee’s positions will not be up for reappointment all at the same time.
On 1 August 2019, Mr Gert-Jan Meppelink stepped down as Executive Committee member responsible for the bank’s HR, Transformation & Communications (HTC) by mutual agreement in response to the proposed decision to regroup the HTC portfolio in light of ABN AMRO’s strategy. A search process for a new Executive Committee member responsible for HR & Transformation has been initiated. Interim arrangements were put in place for the period until the appointment (and start) of the new Executive Committee member, to ensure continuity of the Executive Committee’s decision-making.
Role and responsibilities of the Executive BoardThe Executive Board is the managing board of ABN AMRO within the meaning of Section 2:129 of the Dutch Civil Code. It is responsible for (i) the general course of business of ABN AMRO, ensuring compliance with laws and regulations and the adequate financing of its activities; (ii) the continuity of ABN AMRO and its business; and (iii) setting ABN AMRO’s mission, vision, strategy, risk appetite, corporate standards and values, risk framework, main policies, budgets, financial and non-financial targets, and for the realisation thereof. In respect of these duties, and to the extent they relate to ABN AMRO and its subsidiaries, the Executive Board consults the Executive Committee, without prejudice to the Executive Board’s statutory collective management responsibilities. The Executive Board is also required to consult the Executive Committee regarding the strategic direction of the bank.
Executive Board and Executive Committee
Introduction to Leadership & governance
Executive Board and Executive Committee
ABN AMRO Bank Annual Report 2019
139Leadership & governance / Executive Board and Executive Committee
Kees van Dijkhuizen (Dutch, male, 1955)Chief Executive Officer Chairman of the Executive Board and Executive Committee Kees van Dijkhuizen was appointed to the Executive Boards (previously Managing Boards) of ABN AMRO Group N.V. and ABN AMRO Bank N.V. on 1 May 2013 (due to the merger, only of ABN AMRO Bank N.V. with effect from 29 June 2019). He was Chief Financial Officer from 1 June 2013 to 31 December 2016 and was appointed Chairman of the Executive Boards and CEO with effect from 1 January 2017. On the occasion of the General Meeting in May 2017, his mandate as an Executive Board member was extended and aligned with his term as CEO of ABN AMRO.
As CEO, Kees van Dijkhuizen is also responsible for Corporate Office, Strategy & Sustainability, Legal and Brand, Marketing & Communications. Group Audit also reports to the CEO. His current term expires at the Annual General Meeting on 22 April 2020.Other relevant ancillary positions: Chairman of the Executive Board and Executive Committee of ABN AMRO Bank N.V.Other positions: Chairman of the National Committee for Export, Import and Investment Guarantees (Rijkscommissie voor Export-, Import- en Investeringsgaranties), member of the AFM Capital Market Committee.
Clifford Abrahams (British, male, 1967)Chief Financial Officer and Vice-Chairman of the Executive Board and Executive CommitteeClifford Abrahams was appointed to the Executive Boards of ABN AMRO Group N.V. and ABN AMRO Bank N.V. as a member and Chief Financial Officer (CFO) on 1 September 2017 (due to the merger, only of ABN AMRO Bank N.V. with effect from 29 June 2019).
He was appointed Vice-Chairman of the Executive Boards and Executive Committee on 1 March 2018. As CFO, he is responsible for Finance, including Financial Accounting, Asset & Liability Management, Controlling, Tax, Treasury and Investor Relations. His current term expires in 2021.Relevant positions pursuant to CRD IV: Chief Financial Officer and Vice-Chairman of the Executive Board and Executive Committee of ABN AMRO Bank N.V.
Personal details of the members of the Executive Board and Executive CommitteeThe information below refers to the members of the Executive Board and Executive Committee as at 10 March 2020.
The Executive Board ensures close cooperation with the Supervisory Board in the discharge of its responsibilities and seeks the approval of the Supervisory Board for the bank-wide strategy (in line with the pursued culture aimed at long-term value creation) and targets. The Executive Board is accountable to the Supervisory Board and to the General Meeting for the performance of its duties. In performing its duties, the Executive Board develops a view on long-term value creation for ABN AMRO and its business and takes into account relevant stakeholder interests.
Role and responsibilities of the Executive CommitteeThe Executive Committee is part of ABN AMRO’s ‘management body’ (together with the Supervisory Board) as defined in CRD IV and has duties and responsibilities which have been delegated to it by the Executive Board. The Executive Committee is entrusted with the effective direction of ABN AMRO and its subsidiaries and is specifically mandated to ensure ABN AMRO’s mission, vision, strategy, policies, annual budget, risk appetite, standards and values, financial and non-financial targets are translated into specific group-aligned strategies, policies, budgets, risk appetites, standards and performance targets for each business line, with the aim of contributing to long-term value creation by ABN AMRO and building and maintaining the culture required for that purpose. The respective members of the Executive Committee are also responsible for the daily management of their own business lines.
In addition, the Executive Committee helps define the strategic direction of the bank: the Executive Board is required to consult the Executive Committee in respect of decisions regarding the bank’s (i) mission, vision and strategy, and (ii) risk policies, risk appetite framework and statement. The Executive Committee ensures an open dialogue with the Supervisory Board, both on specific issues and in general, in order to inform the Supervisory Board adequately. The Executive Committee provides the Supervisory Board and its committees with all the information they need for the proper performance of their supervisory duties and as requested by the Supervisory Board through the Chairman of the Executive Committee.
In the execution of its duties, the Executive Committee focuses on client centricity, the activities and needs of the business lines, transformation, innovation, digitalisation and sustainable growth of operating income, and promotes ABN AMRO’s and its subsidiaries’ values through leading by example.
Composition and diversityThe Executive Board consists of the Chief Executive Officer (CEO), the Chief Financial Officer (CFO), the Chief Risk Officer (CRO) and the Chief Innovation & Technology Officer (CI&TO). The Executive Committee is chaired by the CEO and consists of the four statutory Executive Board members and five non-statutory senior executives, including four business line roles (Retail Banking, Commercial Banking, Private Banking and Corporate & Institutional Banking) and one role with bank-wide
IntroductionStrategy and perform
anceRisk, funding &
capitalAnnual Financial Statem
ents 2019Other
Leadership & governance

ABN AMRO Bank Annual Report 2019
IntroductionStrategy and perform
anceRisk, funding &
capitalLeadership structure
GovernanceAnnual Financial Statem
entsOther
IntroductionStrategy and perform
anceRisk, funding &
capitalAnnual Financial Statem
ents 2019Other
140
Leadership & governance
Leadership & governance / Executive Board and Executive Committee
Tanja Cuppen (Dutch, female, 1969)Chief Risk Officer of the Executive Board and Executive CommitteeTanja Cuppen was appointed to the Executive Boards of ABN AMRO Group N.V. and ABN AMRO Bank N.V. (due to the merger, only of ABN AMRO Bank N.V. with effect from 29 June 2019) on 1 October 2017 and was appointed Chief Risk Officer (CRO) with effect from 1 November 2017. As CRO, she is responsible for Risk Management, Financial
Restructuring & Recovery and Compliance. Her current term expires in 2021.Relevant positions pursuant to CRD IV: Chief Risk Officer of the Executive Board and Executive Committee of ABN AMRO Bank N.V.Other relevant ancillary positions: Member of Investment Committee, Argidius Foundation, Zug, Switzerland
Christian Bornfeld (Danish, male, 1976)Chief Innovation & Technology Officer of the Executive Board and Executive CommitteeChristian Bornfeld was appointed to the Executive Boards of ABN AMRO Group N.V. and ABN AMRO Bank N.V. as Chief Innovation & Technology Officer (CI&TO) effective 1 March 2018 (due to the merger, only of ABN AMRO Bank N.V. with effect
from 29 June 2019). As CI&TO, he is responsible for Innovation, IT, Corporate Information Security and Business Services. His current term expires in 2021.Relevant positions pursuant to CRD IV: Chief Innovation & Technology Officer of the Executive Board and Executive Committee of ABN AMRO Bank N.V.
Frans van der Horst (Dutch, male, 1959)CEO Retail Banking and member of the Executive CommitteeFrans van der Horst was appointed to the Executive Committee of ABN AMRO Bank N.V. as CEO Retail Banking on 5 February 2017, subject to regulatory approval. The appointment was formally approved by the regulator on 3 November 2017. As his term was due to expire on 1 March 2020, the Supervisory Board approved the Executive Board’s decision to reappoint him for another term of two years with effect from 1 March 2020. His current term expires on 1 March 2022.
Relevant positions pursuant to CRD IV: CEO Retail Banking and member of the Executive Committee of ABN AMRO Bank N.V., Chairman of the Supervisory Board of ABN AMRO Clearing Bank N.V., member of the Supervisory Board of Nationale Nederlanden ABN AMRO Verzekeringen Holding B.V., ABN AMRO Levensverzekering N.V., ABN AMRO Verzekeringen B.V. and ABN AMRO Schadeverzekering N.V.
Daphne de Kluis (Dutch, female, 1969)CEO Commercial Banking and member of the Executive CommitteeDaphne de Kluis was appointed to the Executive Committee of ABN AMRO Bank N.V. as CEO Commercial Banking on 5 February 2017, subject to regulatory approval. The appointment was formally approved by the regulator on 3 November 2017.
As her term was due to expire on 1 March 2020, the Supervisory Board approved the Executive Board’s decision to reappoint her for another term of four years with effect from 1 March 2020. Her current term expires on 1 March 2024.Relevant positions pursuant to CRD IV: CEO Commercial Banking and member of the Executive Committee of ABN AMRO Bank N.V., member of the Supervisory Board of Stadsherstel N.V., member of the Supervisory Board of Euronext Amsterdam N.V.
Pieter van Mierlo (Dutch, male, 1961)CEO Private Banking and member of the Executive CommitteePieter van Mierlo was appointed to the Executive Committee of ABN AMRO Bank N.V. as CEO Private Banking on 5 February 2017, subject to regulatory approval. The appointment was formally approved by the regulator on 3 November 2017. As his term was due to expire on 1 March 2020, the Supervisory Board approved the Executive Board’s decision to reappoint him for another term
of two years with effect from 1 March 2020. His current term expires on 1 March 2022.Relevant positions pursuant to CRD IV: CEO Private Banking and member of the Executive Committee of ABN AMRO Bank N.V.Other relevant ancillary positions: Member of the Supervisory Board of Stichting Ruysdael Clinics.
Rutger van Nouhuijs (Dutch, male, 1962)CEO Corporate & Institutional Banking and member of the Executive CommitteeRutger van Nouhuijs was appointed to the Executive Committee of ABN AMRO Bank N.V. as CEO Corporate & Institutional Banking on 5 February 2017, subject to regulatory approval. The appointment was formally approved by the regulator on 3 November 2017. As his term was due to expire on 1 March 2020, the Supervisory Board approved the Executive Board’s decision to reappoint him for another term of four years with effect from 1 March 2020. His current term expires on 1 March 2024.
Relevant positions pursuant to CRD IV: CEO Corporate & Institutional Banking and member of the Executive Committee of ABN AMRO Bank N.V.Other relevant ancillary positions: Member of the Board of Directors of AmCham (American Chamber of Commerce in the Netherlands), member of the Advisory Board of Euronext, member of the Executive Board of Vereniging VNO-NCW (Confederation of Netherlands Industry and Employers).

ABN AMRO Bank Annual Report 2019
141Leadership & governance / Executive Board and Executive Committee
responsibilities (HR & Transformation), which is currently vacant. The management structure is thus designed to create an enhanced focus on the bank’s business activities at a senior executive level.
The Executive Committee’s composition is based on ABN AMRO’s guiding principle that diversity of thought, expertise, background, competences and interpersonal styles, including but not limited to gender diversity, is a prerequisite for effective management and, by extension, for long-term value creation. In line with ABN AMRO’s diversity policy, ABN AMRO strives to meet the gender target of 30% for the Executive Committee and Executive Board. Gender diversity in both the Executive Committee and the Executive Board is currently 25%. When vacancies arise, ABN AMRO Bank gives due consideration to any applicable gender requirements in its search for suitable new members who meet the fit and proper requirements stipulated in the Dutch Financial Markets Supervision Act.
The Rules of Procedure of the Executive Board and the Executive Committee are available on abnamro.com.
Appointment, suspension and dismissalMembers of the Executive Board are appointed and reappointed by the Supervisory Board for a term of up to four years, provided that the term of office continues up to and including the first General Meeting to be held after expiry of the term. The diversity objectives laid down in ABN AMRO’s internal policies are taken into consideration when preparing the appointment and reappointment of the members of the Executive Board. The Supervisory Board notifies the General Meeting of the intended appointment or reappointment of a member of the Executive Board. Only candidates who meet the fit and proper test under the Dutch Financial Markets Supervision Act are eligible for appointment. The Supervisory Board may appoint one of the members of the Executive Board as Chairman (to be awarded the title of Chief Executive Officer). Pursuant to the relationship agreement with NLFI, the Supervisory Board gives NLFI the opportunity to advise on the decision to appoint or reappoint a member of the Executive Board and on the decision to appoint the chairman of the Executive Board, as long as NLFI directly or indirectly holds at least 10% of the issued share capital of the bank. The Supervisory Board may at all times suspend or dismiss a member of the Executive Board. Further information on the suspension and dismissal procedure of the Executive Board is provided in
ABN AMRO’s Articles of Association and the Executive Board Rules of Procedure as published on the ABN AMRO website.
Members of the Executive Committee (other than members of the Executive Board) are appointed, suspended and/or dismissed by the Executive Board subject to the approval of the Supervisory Board and advice of the Selection and Nomination Committee. The Executive Board takes into account ABN AMRO’s diversity objectives in respect of the composition of the Executive Committee. Only candidates who meet the fit and proper test under the Dutch Financial Markets Supervision Act are eligible for appointment. The CEO is the Chairman of the Executive Committee. The Supervisory Board, on the proposal of the Executive Board and the advice of the Selection and Nomination Committee, appoints one member of the Executive Board as Vice-Chairman of the Executive Committee. Members of the Executive Committee are appointed and reappointed for a maximum term of four years.
CommitteesThe Executive Board has established a number of committees that are responsible for preparing the decision-making on certain subjects, taking certain delegated decisions and advising the Executive Board on certain matters. The committees include the following three risk-related committees: the Group Risk Committee, the Group Regulatory Committee and the Group Central Credit Committee. More information on the delegated authority of these committees is provided in the Risk, funding & capital management section.
In addition, the Executive Board has installed a Group Disclosure Committee and a Group Asset & Liability Committee.
The Group Disclosure Committee’s responsibilities include advising and supporting the Executive Board in relation to (i) supervision on the accuracy and timeliness of public disclosures by the group, and (ii) integrity with regard to the financial statements and other public disclosures.
The Group Asset & Liability Committee has been mandated by the Executive Board to decide on matters relating to the interest rate and liquidity risk profile as well as the solvency of the group within the parameters set by the Executive Board.
IntroductionStrategy and perform
anceRisk, funding &
capitalAnnual Financial Statem
ents 2019Other
Leadership & governance
ABN AMRO Bank Annual Report 2019
IntroductionStrategy and perform
anceRisk, funding &
capitalLeadership structure
GovernanceAnnual Financial Statem
entsOther
IntroductionStrategy and perform
anceRisk, funding &
capitalAnnual Financial Statem
ents 2019Other
142
Leadership & governance
Leadership & governance / Supervisory Board
As a result of the legal merger between ABN AMRO Bank N.V., the surviving entity, and ABN AMRO Group N.V., the disappearing entity, ABN AMRO’s supervisory structure comprises a Supervisory Board solely at ABN AMRO Bank level with effect from 29 June 2019.
At the Annual General Meeting of 24 April 2019, Ms Anna Storåkers and Mr Michiel Lap were appointed as members of the Supervisory Board for a term of four years ending at the close of the Annual General Meeting in 2023. Mr Steven ten Have and Ms Frederieke Leeflang stepped down as members of ABN AMRO’s Supervisory Board as at the date of appointment of Ms Storåkers and Mr Lap.
Mr ten Have was appointed pursuant to the Employee Council’s enhanced recommendation right. As agreed with the Employee Council, the latter capacity was attributed to Mr Arjen Dorland with effect from the Annual General Meeting on 24 April 2019. On 14 May 2019 Mr Dorland was appointed as Vice-Chairman of the Supervisory Board.
At the Annual General Meeting of 30 May 2017, Ms Annemieke Roobeek’s term of office was extended until such time as a new member of the Supervisory Board would be appointed. The Employee Council was asked to exercise its enhanced right of recommendation for the position held by Ms Roobeek and submitted an enhanced recommendation proposing that Ms Laetitia Griffith be appointed as a member of the Supervisory Board. The Supervisory Board supported the Employee Council’s proposal and proposed the appointment of Ms Griffith to the General Meeting. At the Extraordinary General Meeting of 17 December 2019, Ms Griffith was appointed a member of the Supervisory Board for a term of office that starts at the close of that Extraordinary General Meeting and ends at the close of the Annual General Meeting of ABN AMRO Bank in 2024. Ms Roobeek has stepped down as a member of ABN AMRO’s Supervisory Board with effect from the date of Ms Griffith’s appointment.
Role and responsibilities of the Supervisory BoardThe Supervisory Board supervises, advises, challenges and supports the Executive Board and the Executive Committee in the exercise of their powers and duties. Together with the Executive Board, the Supervisory Board is responsible for ABN AMRO’s long-term value creation, requiring members to execute their duties in a sustainable manner with due observance of the long-term viability of the strategy being pursued. In discharging its task, the Supervisory Board takes into account the dynamics and the relationship between the Executive Board and the Executive Committee and its members. The Supervisory Board’s early and close involvement with the Executive
Board is required when formulating the bank-wide strategy and targets in line with the pursued culture aimed at long-term value creation.
In performing their duties, the members of the Supervisory Board are guided by the interests of ABN AMRO and its businesses, taking due consideration of the legitimate interests of all of ABN AMRO’s stakeholders (such as its clients, savers and deposit holders, shareholders, holders of depositary receipts, employees and the society in which ABN AMRO operates). Certain decisions taken by the Executive Board are subject to the approval of the Supervisory Board.
Composition and diversityThe Supervisory Board’s composition is based on the Board’s guiding principle that diversity of thought, expertise, background, competences and interpersonal styles, including but not limited to gender diversity, is a prerequisite for effective supervision and, by extension, for long-term value creation. In line with its diversity policy, ABN AMRO is striving to meet the gender target of 30% for the Supervisory Board. Gender diversity within ABN AMRO’s Supervisory Board is currently 29%. When vacancies arise, the Supervisory Board gives due consideration to any applicable gender requirements in its search for suitable new members meeting the fit and proper requirements stipulated in the Dutch Financial Markets Supervision Act. Collectively, the members have expertise in retail and private banking, commercial banking, corporate & institutional banking, investment banking, risk management, P&L line management, strategy formulation and execution, cultural and other change management, IT, digitalisation, innovation, economics, remuneration and human resources management, sustainability and corporate social responsibility, legal and compliance matters and the development of products and services, and experience in the key markets in which the bank is active. The Supervisory Board has one financial expert (CPA/RA), in accordance with the formal definition and requirements, and four highly experienced bankers with a combined total of 60 years of broad and deep banking experience across all key areas of domestic and international banking.
Supervisory Board
Supervisory Board

ABN AMRO Bank Annual Report 2019
143Leadership & governance / Supervisory Board
Personal details of the members of the Supervisory BoardThe information below refers to the members of the Supervisory Board as at 10 March 2020.
Tom de Swaan (Dutch, male, 1946)Chairman of the Supervisory BoardTom de Swaan was appointed to the Supervisory Boards of ABN AMRO Group N.V. and ABN AMRO Bank N.V. on 12 July 2018. On 29 June 2019, ABN AMRO Group N.V. merged into ABN AMRO Bank N.V., as a result of which ABN AMRO Bank N.V. became the surviving entity and ABN AMRO Group N.V. ceased to exist. His current term expires at the Annual General Meeting in 2022. Last executive position held: CFO, ABN AMRO Bank N.V.Relevant positions pursuant to CRD IV: Chairman of the Supervisory Board of ABN AMRO Bank N.V.
Other relevant ancillary positions: Chairman of the Board of Foundation National Opera & Ballet Fund, the Netherlands, member of the Board of Foundation Premium Erasmianum, member of the International Advisory Board of Akbank, Chairman of the Management Board of Foundation Funds Netherlands Cancer Institute, member of the Advisory Board of Stichting tot Instandhouding van de Diergaarde van het Koninklijk Zoölogisch Genootschap Natura Artis Magistra, member of the Supervisory Board of the Holland Festival Foundation, member of the Board of Stichting Liszt Concours.
Arjen Dorland (Dutch, male, 1955)Vice-Chairman of the Supervisory Board (from 14 May 2019)Arjen Dorland was appointed to the Supervisory Boards of ABN AMRO Group N.V. and ABN AMRO Bank N.V. on 18 May 2016. On 29 June 2019, ABN AMRO Group N.V. merged into ABN AMRO Bank N.V. as a result of which ABN AMRO Bank N.V. became the surviving entity and ABN AMRO Group N.V. ceased to exist. His current term expires at the Annual General Meeting in 2020.
Last executive position held: Executive Vice-President of Technical and Competitive IT, Royal Dutch Shell. Relevant positions pursuant to CRD IV: Vice-Chairman of the Supervisory Board of ABN AMRO Bank N.V., Vice-Chairman of the Supervisory Board of Essent N.V.Other relevant ancillary positions: Member of the combined Supervisory Council of Stichting Naturalis Biodiversity Center and Stichting Japanmuseum Sieboldhuis, Chairman of the Supervisory Council of Haaglanden Medisch Centrum.
Laetitia Griffith (Dutch, female, 1965)MemberLaetitia Griffith was appointed to the Supervisory Board of ABN AMRO Bank N.V. on 17 December 2019. Her current term expires at the Annual General Meeting in 2024. Last executive position held: Member of Parliament on behalf of the VVD, portfolio Home Affairs, the House of Representatives of the Netherlands.
Relevant position pursuant to CRD IV: Member of the Supervisory Board of ABN AMRO Bank N.V., member of the Supervisory Board of Tennet TSO GmbH, member of the Supervisory Board of Tennet Holding B.V., member of the Supervisory Board of Benno Leeser Holding B.V. Other relevant ancillary positions: Chairman of the Supervisory Board of Holding Nationale Goede Doelen Loterijen N.V., Chairman of the Supervisory Board of the Dutch Film Fund.
Michiel Lap (Dutch, male, 1962)MemberMichiel Lap was appointed to the Supervisory Boards of ABN AMRO Group N.V. and ABN AMRO Bank N.V. on 24 April 2019. On 29 June 2019, ABN AMRO Group N.V. merged into ABN AMRO Bank N.V., as a result of which ABN AMRO Bank N.V. became the surviving entity and ABN AMRO Group N.V. ceased to exist. His current term expires at the Annual General Meeting in 2023.
Last executive position held: Partner and Head Northwest Europe, Goldman Sachs. Relevant position pursuant to CRD IV: Member of the Supervisory Board of ABN AMRO Bank N.V., Vice-Chairman and member of the Supervisory Board of Arcadis N.V., Non-Executive Board Member of Rijn Capital B.V. Other relevant ancillary positions: Member of the Supervisory Board of Stichting Het Nederlands Kanker Instituut - Antoni van Leeuwenhoek Ziekenhuis.
Jurgen Stegmann (Dutch, male, 1960)MemberJurgen Stegmann was appointed to the Supervisory Boards of ABN AMRO Group N.V. and ABN AMRO Bank N.V. on 12 August 2016. On 29 June 2019, ABN AMRO Group N.V. merged into ABN AMRO Bank N.V., as a result of which ABN AMRO Bank N.V. became the surviving entity and ABN AMRO Group N.V. ceased to exist. His term expires at the Annual General Meeting in 2020.
Last executive position held: Director, Stegmanagement B.V. Relevant positions pursuant to CRD IV: Member of the Supervisory Board of ABN AMRO Bank N.V., member of the Supervisory Board of Janssen de Jong Groep B.V., member of the Supervisory Board of MN Services N.V.Other relevant ancillary positions: Member of the Supervisory Board of Stichting tot Beheer Museum Boijmans Van Beuningen.
IntroductionStrategy and perform
anceRisk, funding &
capitalAnnual Financial Statem
ents 2019Other
Leadership & governance
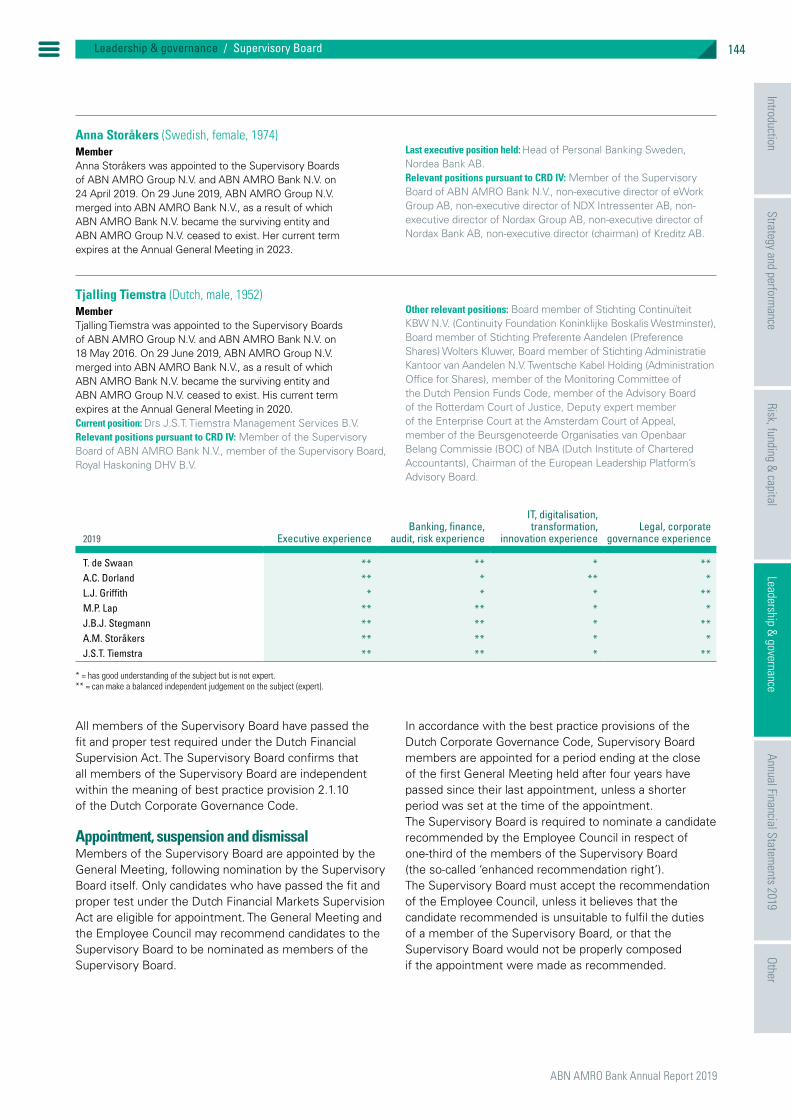
ABN AMRO Bank Annual Report 2019
IntroductionStrategy and perform
anceRisk, funding &
capitalLeadership structure
GovernanceAnnual Financial Statem
entsOther
IntroductionStrategy and perform
anceRisk, funding &
capitalAnnual Financial Statem
ents 2019Other
144
Leadership & governance
Leadership & governance / Supervisory Board
Anna Storåkers (Swedish, female, 1974)MemberAnna Storåkers was appointed to the Supervisory Boards of ABN AMRO Group N.V. and ABN AMRO Bank N.V. on 24 April 2019. On 29 June 2019, ABN AMRO Group N.V. merged into ABN AMRO Bank N.V., as a result of which ABN AMRO Bank N.V. became the surviving entity and ABN AMRO Group N.V. ceased to exist. Her current term expires at the Annual General Meeting in 2023.
Last executive position held: Head of Personal Banking Sweden, Nordea Bank AB. Relevant positions pursuant to CRD IV: Member of the Supervisory Board of ABN AMRO Bank N.V., non-executive director of eWork Group AB, non-executive director of NDX Intressenter AB, non-executive director of Nordax Group AB, non-executive director of Nordax Bank AB, non-executive director (chairman) of Kreditz AB.
Tjalling Tiemstra (Dutch, male, 1952)MemberTjalling Tiemstra was appointed to the Supervisory Boards of ABN AMRO Group N.V. and ABN AMRO Bank N.V. on 18 May 2016. On 29 June 2019, ABN AMRO Group N.V. merged into ABN AMRO Bank N.V., as a result of which ABN AMRO Bank N.V. became the surviving entity and ABN AMRO Group N.V. ceased to exist. His current term expires at the Annual General Meeting in 2020.Current position: Drs J.S.T. Tiemstra Management Services B.V. Relevant positions pursuant to CRD IV: Member of the Supervisory Board of ABN AMRO Bank N.V., member of the Supervisory Board, Royal Haskoning DHV B.V.
Other relevant positions: Board member of Stichting Continuïteit KBW N.V. (Continuity Foundation Koninklijke Boskalis Westminster), Board member of Stichting Preferente Aandelen (Preference Shares) Wolters Kluwer, Board member of Stichting Administratie Kantoor van Aandelen N.V. Twentsche Kabel Holding (Administration Office for Shares), member of the Monitoring Committee of the Dutch Pension Funds Code, member of the Advisory Board of the Rotterdam Court of Justice, Deputy expert member of the Enterprise Court at the Amsterdam Court of Appeal, member of the Beursgenoteerde Organisaties van Openbaar Belang Commissie (BOC) of NBA (Dutch Institute of Chartered Accountants), Chairman of the European Leadership Platform’s Advisory Board.
2019 Executive experienceBanking, finance,
audit, risk experience
IT, digitalisation,transformation,
innovation experienceLegal, corporate
governance experience
T. de Swaan ** ** * **
A.C. Dorland ** * ** *
L.J. Griffith * * * **
M.P. Lap ** ** * *
J.B.J. Stegmann ** ** * **
A.M. Storåkers ** ** * *
J.S.T. Tiemstra ** ** * **
* = has good understanding of the subject but is not expert.** = can make a balanced independent judgement on the subject (expert).
All members of the Supervisory Board have passed the fit and proper test required under the Dutch Financial Supervision Act. The Supervisory Board confirms that all members of the Supervisory Board are independent within the meaning of best practice provision 2.1.10 of the Dutch Corporate Governance Code.
Appointment, suspension and dismissalMembers of the Supervisory Board are appointed by the General Meeting, following nomination by the Supervisory Board itself. Only candidates who have passed the fit and proper test under the Dutch Financial Markets Supervision Act are eligible for appointment. The General Meeting and the Employee Council may recommend candidates to the Supervisory Board to be nominated as members of the Supervisory Board.
In accordance with the best practice provisions of the Dutch Corporate Governance Code, Supervisory Board members are appointed for a period ending at the close of the first General Meeting held after four years have passed since their last appointment, unless a shorter period was set at the time of the appointment. The Supervisory Board is required to nominate a candidate recommended by the Employee Council in respect of one-third of the members of the Supervisory Board (the so-called ‘enhanced recommendation right’). The Supervisory Board must accept the recommendation of the Employee Council, unless it believes that the candidate recommended is unsuitable to fulfil the duties of a member of the Supervisory Board, or that the Supervisory Board would not be properly composed if the appointment were made as recommended.
ABN AMRO Bank Annual Report 2019
145Leadership & governance / Supervisory Board
The Supervisory Board may suspend any of its members at any time. The General Meeting may dismiss the Supervisory Board in its entirety due to lack of confidence in the Board, by an absolute majority of the votes cast, representing a quorum of at least one-third of the issued share capital. If this quorum is not met, there is no possibility of holding a second General Meeting in which no quorum applies. Further information on the suspension and dismissal procedure is provided in ABN AMRO Bank’s Articles of Association and the Supervisory Board Rules of Procedure as published on the ABN AMRO website.
CommitteesThe Supervisory Board has established four committees to prepare its decision-making and to advise the Supervisory Board on specific matters. These committees are composed exclusively of Supervisory Board members.
These committees are the: Å Audit Committee; Å Risk & Capital Committee; Å Remuneration Committee; Å Selection & Nomination Committee.
IntroductionStrategy and perform
anceRisk, funding &
capitalAnnual Financial Statem
ents 2019Other
Leadership & governance

ABN AMRO Bank Annual Report 2019
IntroductionStrategy and perform
anceRisk, funding &
capitalLeadership structure
GovernanceAnnual Financial Statem
entsOther
IntroductionStrategy and perform
anceRisk, funding &
capitalAnnual Financial Statem
ents 2019Other
146
Leadership & governance
Leadership & governance / Report of the Supervisory Board
Report of the Supervisory BoardMeetings of the Supervisory BoardDuring 2019, the Supervisory Board held five regular meetings according to the pre-set schedule and twenty-two additional meetings. In addition, the Supervisory Board and the Executive Committee jointly had several deep dive sessions, culture & behaviour sessions, awareness sessions and two strategy meetings.
Regular Supervisory Board meetings take place following the meetings of the Remuneration, Selection & Nomination Committee, the Risk & Capital Committee and the Audit Committee. These committees send the Supervisory Board a report of their deliberations and findings after their meeting, and the Supervisory Board takes into account their outcomes and recommendations. The Company Secretary attends all meetings and is the secretary to the Supervisory Board and its committees. The Executive Board attends the regular meetings of the Supervisory Board and prepares detailed supporting documents. The regular meetings take four hours on average. At each regular Supervisory Board meeting, on a rotational basis, an Executive Committee member is invited to give a presentation on the opportunities and risks in their specific line of business. Other bank staff as well as the internal and external auditors are frequently invited to give presentations on specific topics such as performance highlights, the capital & funding plan, dividend payments, strategy, an investor relations update, the risk appetite, quarterly risk reports, quarterly audit reports and quarterly compliance reports. The execution of the bank’s strategy was discussed at two joint meetings with the Executive
Board and Executive Committee. Their discussions included the further implementation of the bank’s strategic pillars but also the translation to business models based on future banking trends.
In addition to the regular subjects, the meetings focused on specific subjects such as the Executive Committee’s succession planning, particularly the succession of the CEO, the recruitment, selection and appointment process of new members of the Supervisory Board, the legal merger of ABN AMRO Bank N.V. and ABN AMRO Group N.V. (which was initiated to improve regulatory capital ratios including the leverage ratio, optimise administrative processes and lower administrative costs), various M&A topics, the annual self-assessments, the delivery plan for Detecting Financial Crime, the investigation by the Dutch public prosecutor, the financial plan for 2020-2023, the division of the Remuneration, Selection & Nomination Committee into a Remuneration Committee and a Selection & Nomination Committee, and ancillary positions of Supervisory Board members.
Details of the composition of the Supervisory Board throughout 2019 can be found in the Composition and diversity paragraph of the Supervisory Board section. The personal details and résumés of the members of the Supervisory Board are considered to be incorporated by reference, in this Report of the Supervisory Board. The attendance matrix of the Supervisory Board members in 2019 is shown in the following table.
2019 Formal meetings (5) Additional meetings (22) Total meetings (27) Attendance (%)
T. de Swaan 5 22 27 100%
S. ten Have1 2 3 5 71%
A.C. Dorland 5 20 25 93%
L.J. Griffith2 n.a. n.a. n.a. n.a.
M.P. Lap3 3 16 19 95%
F.J. Leeflang1 2 3 5 71%
J.M. Roobeek4 4 18 22 81%
J.B.J. Stegmann 5 21 26 96%
A.M. Storåkers3 3 17 20 100%
J.S.T. Tiemstra 5 18 23 85%
1 Member of the Supervisory Board until 24 April 2019, before which 7 meetings were held.2 Member of the Supervisory Board from 17 December 2019, after which no meetings were held.3 Member of the Supervisory Board from 24 April 2019, after which 20 meetings were held.4 Member of the Supervisory Board until 17 December 2019, before which 27 meetings were held.
Focus areas and activities of the Supervisory BoardThe Supervisory Board’s key areas of focus included the bank’s compliance with legislation, codes and regulations. Regarding the regulatory environment, ABN AMRO continued to work on retaining trust. On 25 September 2019, the Dutch public prosecutor informed ABN AMRO that the bank was subject of an investigation relating to
requirements under the Act on the prevention of money laundering and financing of terrorism (Wwft). The public prosecutor is investigating whether ABN AMRO has complied with the requirements of the Wwft. ABN AMRO is cooperating fully with the investigation. Given that KYC is key to the bank’s licence to operate, the Supervisory Board extensively discussed the bank’s gatekeeper role
1
Report of the Supervisory Board
ABN AMRO Bank Annual Report 2019
147Leadership & governance / Report of the Supervisory Board
and its KYC/AML processes, which were improved by the establishment of the Detecting Financial Crime department.
Significant improvements to new client take-on processes have been made in all business lines and further improvements are being implemented by the bank. In order to achieve a deeper focus on the topics of nomination and remuneration, the Supervisory Board approved the division of the Remuneration, Selection & Nomination Committee into a separate Remuneration Committee and Selection & Nomination Committee with effect from 12 November 2019.
The Supervisory Board was also regularly updated on ABN AMRO’s key financial and non-financial risks and the design of the internal risk management and control systems. During these updates the Executive Board’s assessment of the adequacy and effectiveness of the risk management and control systems was monitored and discussed. The bank’s risk appetite and ICAAP/ILAAP were also discussed and approved. Furthermore, the Supervisory Board had in-depth discussions on material legal, credit, tax and compliance files.
The bank refreshed its strategic priorities which were launched in 2018. In 2019 the refreshed strategy moved into execution mode. Throughout the year, the Supervisory Board supervised and challenged that the strategic priorities support the bank’s clients’ transition to sustainability, as well as help reinvent the customer experience, and build a future-proof bank. ABN AMRO is also tackling costs well and is underway in the further digitalisation and automation of its processes. Other key topics that the Supervisory Board discussed with management during the year included improving the bank’s cost-to-income ratio, simplifying internal processes and controls, regulatory topics, optimising the bank’s return on equity, updating the capital plan based on Basel IV, improving the overall data quality (especially given the increasing frequency of detailed data requests by the regulators) and IT innovation, as well as cybersecurity. The development of talent within the bank, including leadership development and succession planning at management body level, was also a key topic.
Furthermore, the Executive Committee and Supervisory Board jointly travelled to New York for a study trip aimed at learning more about latest developments in the fintech world, what the bank of the future will look like and where ABN AMRO stands in this race. Fintechs as well as larger organisations were visited to discuss what these companies are doing in terms of innovation, the use of artificial intelligence, and data analytics. Researchers gave an update on the energy transition in the US. ABN AMRO can be proud of its innovations but it has to run fast to keep pace in the innovation race.
The Supervisory Board actively engaged its key stakeholders in 2019, visiting various parts of the organisation in the Netherlands and internationally in order to obtain client and staff feedback regarding the bank’s duty of care, integrity, client focus, culture and competitive differentiation. The two members appointed pursuant to the enhanced recommendation right of the Employee Council, Ms Roobeek and Mr Dorland, met regularly with the Employee Council throughout the year to maintain an active dialogue and to obtain the Employee Council’s thoughts and input on various matters, including appointments, diversity, work satisfaction and the negotiations for a new Collective Labour Agreement effective from 1 January 2020, which was concluded at the end of 2019. The Chairman and other members of the Supervisory Board also met with the Employee Council on several formal and informal occasions during the year. This included the annual half-day three-council meeting of the Supervisory Board, the Executive Committee and the Employee Council (‘drie raden overleg’), held on 31 October 2019. This year, the joint session focused on the ‘Future workforce’, i.e. the wishes of the future employee, how to attract and retain the best talents and how to ensure employees of the future are offered a pleasant working environment. During this three-council meeting, the councils also discussed future collaboration as it is important to be able to react quickly in a rapidly changing world. The Supervisory Board appreciates the constructive relationship it has with the Employee Council, and highly values the input, engagement, suggestions and considerations provided by the Employee Council in the interests of the bank. Active engagement was also maintained throughout the year with the Dutch central bank (DNB), the European Central Bank (ECB), the AFM, STAK AAB and NLFI. The Supervisory Board’s aim continued to be ensuring that the bank is well positioned to create long-term value for its shareholders and for society, while focusing firmly on clients’ interests and balancing the interests of all stakeholders.
The Supervisory Board was regularly updated on progress made with regard to the programme for detecting financial crime, providing an overall view of the bank’s remediation activities and enabling the Supervisory Board to perform a challenging role. The programme included a plan that was prepared at the beginning of 2019 and that was translated into resourcing requirements and a financial forecast aimed at supporting the bank’s execution mode.
In the course of 2019, the Supervisory Board and Executive Board established two joint temporary committees, as referred to in the Supervisory Board’s and Executive Board’s Rules of Procedure. One committee was established in June 2019 to coordinate, advise on and supervise activities following from DNB’s letter and (final) directive on mass retail, covering topics such as the Anti-Money Laundering and Anti-Terrorist Financing Act and specific matters of the Financial Supervision Act. This committee was
IntroductionStrategy and perform
anceRisk, funding &
capitalAnnual Financial Statem
ents 2019Other
Leadership & governance

ABN AMRO Bank Annual Report 2019
IntroductionStrategy and perform
anceRisk, funding &
capitalLeadership structure
GovernanceAnnual Financial Statem
entsOther
IntroductionStrategy and perform
anceRisk, funding &
capitalAnnual Financial Statem
ents 2019Other
148
Leadership & governance
Leadership & governance / Report of the Supervisory Board
discontinued as of 25 November 2019 as the relevant action plans had been finalised and submitted to the regulator, and the Executive Board and the Supervisory Board therefore decided that this joint temporary committee would no longer be needed. The other committee was established in October 2019 and focuses on the bank’s strategy and legal position with respect to the public prosecutor’s investigation.
The Supervisory Board approved amendments to the Executive Board’s Rules of Procedure (including the Executive Committee’s Rules of Procedure), the Supervisory Board’s Rules of Procedure as well as ABN AMRO’s articles of association. These amendments concerned the legal merger of ABN AMRO Bank N.V. and ABN AMRO Group N.V. with effect from 28 June 2019. Further amendments were incorporated on 12 November 2019 due to the division of the Remuneration, Selection & Nomination Committee into a separate Remuneration Committee and Selection & Nomination Committee.
A description of the duties, responsibilities and current composition of the Supervisory Board, including its committees and other positions held by members of the Supervisory Board, is provided in the Supervisory Board section of this chapter. More information on remuneration is provided under Remuneration in this chapter. These subjects are considered to be incorporated, by reference, in this Report of the Supervisory Board.
Noteworthy is that ABN AMRO has committed itself to the Taskforce Climate-related Financial Disclosures (TCFD) being a signatory of the Principles for Responsible Investment (PRI) and the Dutch Climate Agreement. In addition, the European Commission published Guidelines on Non-Financial Reporting which came into force on 17 June 2019. Based on this, TCFD requirements have been added to this Annual Report to provide guidance on material financial impacts of climate-related risks and opportunities such as the transition to a lower-carbon economy.
Furthermore, the new Shareholders Rights Directive (SRD II) entered into force on 1 December 2019. SRD II aims to create more transparency and facilitate shareholder involvement by setting rules on topics such as remuneration policies, disclosures in the annual Remuneration Report and the involvement of the company’s shareholders. ABN AMRO has worked on the implementation of SRD II. The Executive Board and Supervisory Board revised the remuneration policies which are to be presented for adoption to the Annual General Meeting in April 2020 and the remuneration report regarding the financial year 2019 which will be put forward for an advisory vote by the shareholders. The remuneration policy, the date of adoption and the voting results will be published on ABN AMRO’s website immediately after the Annual General Meeting.
Supervisory Board CommitteesAudit CommitteeThe Audit Committee is tasked with the direct supervision of all matters relating to financial reporting and controlling. In doing so, it is responsible for supervising (and advising the complete Supervisory Board on), among other things, (i) the assessment of the principles of valuation and determination of results for the financial statements, (ii) internal control and financial reporting functions, (iii) internal and external audit, (iv) risk assessment of issues that could impact the financial reporting, (v) regulatory compliance in relation to financial reporting, (vi) mediation between internal or external auditors and/or management where needed, and (vii) reporting to the Supervisory Board.
Throughout 2019, the Audit Committee consisted of Mr Tjalling Tiemstra (Chairman), Mr Jurgen Stegmann and Mr Tom de Swaan. Mr Arjen Dorland was a member of the Committee until 14 May 2019. Mr Michiel Lap replaced Mr Dorland with effect from 14 May 2019. The Audit Committee held six regular plenary meetings in 2019. The attendance rate of the Committee’s members is shown in the following table.
2019 Regular meetings (6) Additional meetings (1) Total meetings (7) Attendance (%)
T. de Swaan 6 6 86%
A.C. Dorland1 4 1 5 100%
M.P. Lap2 2 2 100%
J.B.J. Stegmann 6 6 86%
J.S.T. Tiemstra 6 1 7 100%
1 Committee member until 24 April 2019, before which 5 meetings were held.2 Committee member from 24 April 2019, after which 2 meetings were held.
In addition, Ms Roobeek and Mr Lap, in their capacity of Supervisory Board members, attended one plenary meeting of the Audit Committee in May 2019 in order to keep abreast of the most important developments relating to the Committee’s tasks. All regular plenary meetings of the Audit Committee were also attended by the CEO, the CFO and the CRO. Furthermore, the (acting) Director Group
Audit, the Director Financial Accounting, the Director Corporate Controlling, the external auditor and the (deputy) Company Secretary attended the full plenary meetings.
The Audit Committee held an additional meeting in April 2019 to discuss and evaluate the performance of the external auditor for the purpose of the Annual General

ABN AMRO Bank Annual Report 2019
149Leadership & governance / Report of the Supervisory Board
Meeting. The Chairman and Mr Dorland attended this meeting, while the other two Committee members provided the attending members with a proxy vote. The CEO, the CRO, the Director Financial Accounting, the acting Director Group Audit and the deputy Company Secretary also attended this meeting.
In addition to the plenary meetings, the Chairman and other members of the Audit Committee regularly held separate sessions throughout 2019 with the Director Group Audit, the CFO, the CRO, the Director Financial Accounting and the (acting) Director Corporate Controlling, among others. The Chairman of the Audit Committee met the external auditor bilaterally several times in 2019, focusing on the progress of the external audit and other subjects relevant to the Committee’s responsibilities. The Chairman also met with the European Central Bank and the Dutch central bank once in 2019. In addition, the Committee’s members met managers of different departments to remain well informed on topics subject to the Committee’s supervision. Directly after the meeting in March 2019, during which the annual accounts were discussed, the Audit Committee met the external auditor bilaterally to seek confirmation that all relevant matters emerging from the audit had come to the Committee’s attention.
The Audit Committee’s discussions in the plenary meetings covered topics including the quarterly reports, the interim and annual accounts, the quarterly press releases, the interim and final dividend proposals, the 2018 Integrated Annual Review and 2018 Annual Report of ABN AMRO and key audit matters reported by internal and external audit. In relation to the latter, the Committee discussed all control observations and key audit matters of the internal and external auditors, including progress on improvements. Please refer to the Management Control Statement in the Annual Report (see chapter Risk, funding & capital management section) and the Audit Opinion of EY (see chapter Other) for further details. The Audit Committee also discussed financial reporting, the overall internal control environment, the governance and internal controls over financial reporting, adherence to laws and regulations governing financial and regulatory reporting, regular reports on any signals from clients or employees suggesting possible internal control issues and updates on tax and tax-related issues.
The Audit Committee extensively discussed the financial performance and audit ratings of the bank’s first and second line departments once every quarter. During each meeting the Committee devoted attention to the procedures for financial reporting, including the procedure for the establishment of loan impairments, the timelines in which impairments are established and the robustness and development of the financial results and ratios, including the level of loan impairments. The Committee also took note of financial reports issued to supervisory authorities, such as the COREP and FINREP reports.
Furthermore, the Audit Committee considered the role, performance and reports from Group Audit, reports from the external auditor, management letters and the auditor’s independence and fees. The Committee was also informed of, and discussed, all letters from the European Central Bank and the Dutch central bank that were of relevance to the Audit Committee. The Committee closely monitored the financial and regulatory reporting improvement programmes in 2019 and was regularly updated on the progress of these programmes by the Executive Board, Group Audit and the external auditor.
In addition to the regular topics noted above, the Audit Committee received the report of the external auditor regarding the 2018 consolidated financial statements and the overview of whistleblowing cases for the year 2018 in February 2019. The Committee also exchanged views regarding a letter from the VEB focusing on the explanation of the external auditor during the Annual General Meeting.
In March 2019, the Audit Committee reviewed and discussed the Integrated Annual Review 2018, the Annual Reports 2018 of ABN AMRO Group and ABN AMRO Bank respectively, the audits thereof by the external auditor and the Management Control Statement.
In May 2019, in addition to the regular agenda items, the Audit Committee discussed the 2019 Audit Plan of the external auditor and advised the Supervisory Board positively to approve the annually updated auditor independence policy.
In August 2019, apart from the standard agenda items, the Audit Committee discussed and subsequently advised the Supervisory Board to approve the Corporate Reporting approach for 2019. Specifically, it was agreed to enhance the focus regarding the recommendations of the Task Force on Climate-related Financial Disclosure in order to strengthen decision-useful information for stakeholders.
In November 2019, in addition to the regular subject-matters, the Audit Committee advised the Supervisory Board to approve the Group Audit Plan 2020 and the annual review of the Group Audit Charter. Furthermore, the Committee was informed of the most important developments in tax matters and related risks for ABN AMRO.
Risk & Capital CommitteeThe Risk & Capital Committee is responsible for supervising (and advising the complete Supervisory Board on), among other things, (i) risk management and risk control, (ii) the strategies for capital and liquidity management, (iii) the bank’s risk appetite and risk strategy and reviewing the business activities in relation to these matters, (iv) compliance with applicable laws and regulations (including codes of conduct and internal procedures), (v) risk and compliance awareness within the bank, (vi) sound remuneration policies and practices in light of risk, capital,
IntroductionStrategy and perform
anceRisk, funding &
capitalAnnual Financial Statem
ents 2019Other
Leadership & governance
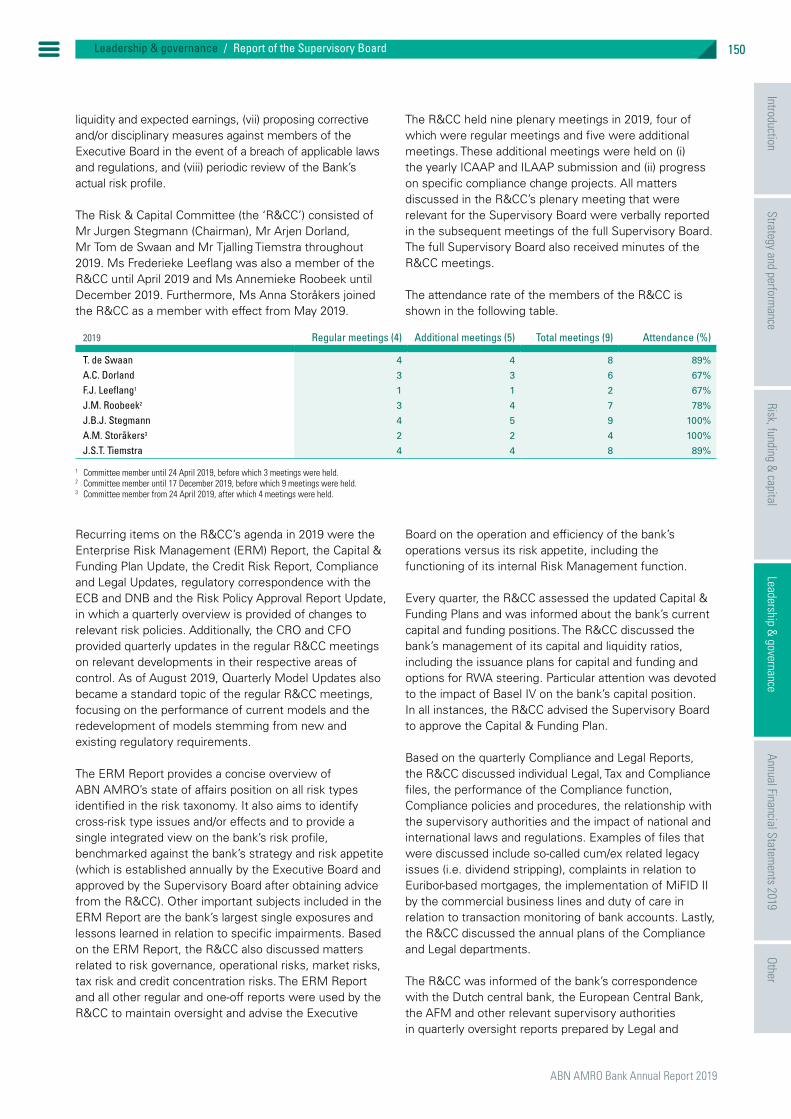
ABN AMRO Bank Annual Report 2019
IntroductionStrategy and perform
anceRisk, funding &
capitalLeadership structure
GovernanceAnnual Financial Statem
entsOther
IntroductionStrategy and perform
anceRisk, funding &
capitalAnnual Financial Statem
ents 2019Other
150
Leadership & governance
Leadership & governance / Report of the Supervisory Board
liquidity and expected earnings, (vii) proposing corrective and/or disciplinary measures against members of the Executive Board in the event of a breach of applicable laws and regulations, and (viii) periodic review of the Bank’s actual risk profile.
The Risk & Capital Committee (the ‘R&CC’) consisted of Mr Jurgen Stegmann (Chairman), Mr Arjen Dorland, Mr Tom de Swaan and Mr Tjalling Tiemstra throughout 2019. Ms Frederieke Leeflang was also a member of the R&CC until April 2019 and Ms Annemieke Roobeek until December 2019. Furthermore, Ms Anna Storåkers joined the R&CC as a member with effect from May 2019.
The R&CC held nine plenary meetings in 2019, four of which were regular meetings and five were additional meetings. These additional meetings were held on (i) the yearly ICAAP and ILAAP submission and (ii) progress on specific compliance change projects. All matters discussed in the R&CC’s plenary meeting that were relevant for the Supervisory Board were verbally reported in the subsequent meetings of the full Supervisory Board. The full Supervisory Board also received minutes of the R&CC meetings.
The attendance rate of the members of the R&CC is shown in the following table.
2019 Regular meetings (4) Additional meetings (5) Total meetings (9) Attendance (%)
T. de Swaan 4 4 8 89%
A.C. Dorland 3 3 6 67%
F.J. Leeflang1 1 1 2 67%
J.M. Roobeek2 3 4 7 78%
J.B.J. Stegmann 4 5 9 100%
A.M. Storåkers3 2 2 4 100%
J.S.T. Tiemstra 4 4 8 89%
1 Committee member until 24 April 2019, before which 3 meetings were held.2 Committee member until 17 December 2019, before which 9 meetings were held.3 Committee member from 24 April 2019, after which 4 meetings were held.
Recurring items on the R&CC’s agenda in 2019 were the Enterprise Risk Management (ERM) Report, the Capital & Funding Plan Update, the Credit Risk Report, Compliance and Legal Updates, regulatory correspondence with the ECB and DNB and the Risk Policy Approval Report Update, in which a quarterly overview is provided of changes to relevant risk policies. Additionally, the CRO and CFO provided quarterly updates in the regular R&CC meetings on relevant developments in their respective areas of control. As of August 2019, Quarterly Model Updates also became a standard topic of the regular R&CC meetings, focusing on the performance of current models and the redevelopment of models stemming from new and existing regulatory requirements.
The ERM Report provides a concise overview of ABN AMRO’s state of affairs position on all risk types identified in the risk taxonomy. It also aims to identify cross-risk type issues and/or effects and to provide a single integrated view on the bank’s risk profile, benchmarked against the bank’s strategy and risk appetite (which is established annually by the Executive Board and approved by the Supervisory Board after obtaining advice from the R&CC). Other important subjects included in the ERM Report are the bank’s largest single exposures and lessons learned in relation to specific impairments. Based on the ERM Report, the R&CC also discussed matters related to risk governance, operational risks, market risks, tax risk and credit concentration risks. The ERM Report and all other regular and one-off reports were used by the R&CC to maintain oversight and advise the Executive
Board on the operation and efficiency of the bank’s operations versus its risk appetite, including the functioning of its internal Risk Management function.
Every quarter, the R&CC assessed the updated Capital & Funding Plans and was informed about the bank’s current capital and funding positions. The R&CC discussed the bank’s management of its capital and liquidity ratios, including the issuance plans for capital and funding and options for RWA steering. Particular attention was devoted to the impact of Basel IV on the bank’s capital position. In all instances, the R&CC advised the Supervisory Board to approve the Capital & Funding Plan.
Based on the quarterly Compliance and Legal Reports, the R&CC discussed individual Legal, Tax and Compliance files, the performance of the Compliance function, Compliance policies and procedures, the relationship with the supervisory authorities and the impact of national and international laws and regulations. Examples of files that were discussed include so-called cum/ex related legacy issues (i.e. dividend stripping), complaints in relation to Euribor-based mortgages, the implementation of MiFID II by the commercial business lines and duty of care in relation to transaction monitoring of bank accounts. Lastly, the R&CC discussed the annual plans of the Compliance and Legal departments.
The R&CC was informed of the bank’s correspondence with the Dutch central bank, the European Central Bank, the AFM and other relevant supervisory authorities in quarterly oversight reports prepared by Legal and

ABN AMRO Bank Annual Report 2019
151Leadership & governance / Report of the Supervisory Board
Compliance. Particular attention in this context was devoted to on-site inspections by the ECB, for example in the area of credit risk and model risk. Furthermore, the R&CC discussed the impact of the interest rate benchmark reforms on ABN AMRO three times over the course of 2019. Current industry-wide methodologies (e.g. EONIA and EURIBOR) will be replaced and these are widely used throughout the bank. Although timelines and envisioned end-states are still under development, ABN AMRO should be adequately positioned to ensure a smooth transition to new benchmarks (e.g. €STER).
Furthermore, the R&CC paid attention to Compliance change projects with a particular focus on client due diligence and anti-money laundering & the countering of terrorism financing. In relation to this, the introduction and further improvement of the Detecting Financial Crime unit was discussed during various R&CC meetings, from the perspectives of remediation and of building a future-proof approach. Given the prominence of these subjects, the R&CC expects to devote continued attention to these areas in 2020.
More information on the risk, capital, liquidity and funding related topics discussed in the R&CC is provided in the Risk, funding & capital section.
Remuneration, Selection & Nomination CommitteeWith effect from 12 November 2019, the Remuneration, Selection & Nomination Committee was divided into two separate committees: the Remuneration Committee and the Selection & Nomination Committee.
Prior to the division into two committees, the Remuneration, Selection & Nomination Committee consisted of Mr Arjen Dorland (Chairman), Mr Steven ten Have (until 24 April 2019), Ms Frederieke Leeflang (until 24 April 2019), Mr Michiel Lap (from 24 April 2019), Ms Annemieke Roobeek and Mr Tom de Swaan.
The composition of both the Remuneration Committee and the Selection & Nomination Committee was the same as that of the former Remuneration, Selection & Nomination Committee, except that Mr Tom de Swaan was appointed
Chairman of the Selection & Nomination Committee. Ms Anna Storåkers joined both committees from 10 December 2019. Ms Annemieke Roobeek stepped down from both committees on 17 December 2019 and was succeeded by Ms Laetitia Griffith from the same date.
The Remuneration, Selection & Nomination Committee was responsible for supervising (and advising the complete Supervisory Board on) topics such as (i) remuneration policies and their execution for members of the Executive Board, the Supervisory Board and selected members of senior management, (ii) the selection, appointment and reappointment of Supervisory Board and Executive Board members, (iii) succession plans of the Supervisory Board and the Executive Board, (iv) the knowledge, skills, experience, performance, size, composition and profile of both boards, (v) the performance of the members of these boards, (vi) reporting on execution of the remuneration policies in a remuneration report, and (vii) total human capital, including talent and leadership development.
In 2019, the Remuneration, Selection & Nomination Committee (until 12 November 2019) held four regular meetings and fourteen additional meetings. Two decisions were made without a meeting being held, in compliance with proper procedure. Committee members who were unable to attend a meeting made sure they reviewed all relevant documents and provided their input to the Committee’s Chairman in advance of any such meeting. The CEO, the member of the Executive Committee responsible for HR & Transformation and relevant representatives after his departure, and the Company Secretary also attended the meetings. In accordance with stricter legislation, the Supervisory Board continued in 2019 to ratify all decisions made by the Remuneration, Selection & Nomination Committee, either at a meeting or in writing without a meeting being held.
The attendance matrix of the members of the Remuneration, Selection & Nomination Committee (until 12 November 2019) is shown in the following table.
2019 Formal meetings (4) Additional meetings (14) Total meetings (18) Attendance (%)
T. de Swaan 4 14 18 100%
A.C. Dorland 4 13 17 94%
L.J. Griffith1 n.a.
S. ten Have2 2 3 5 63%
M.P. Lap3 7 7 78%
F.J. Leeflang2 2 5 7 88%
J.M. Roobeek4 3 9 12 67%
A.M. Storåkers5 n.a.
1 Committee member from 17 December 2019, after which no meetings were held.2 Committee member until 24 April 2019, before which 8 meetings were held.3 Committee member from 14 May 2019, after which 9 meetings were held.4 Committee member untill 17 December 2019, before which 18 meetings were held.5 Committee member from 10 December 2019, after which no meetings were held.
IntroductionStrategy and perform
anceRisk, funding &
capitalAnnual Financial Statem
ents 2019Other
Leadership & governance
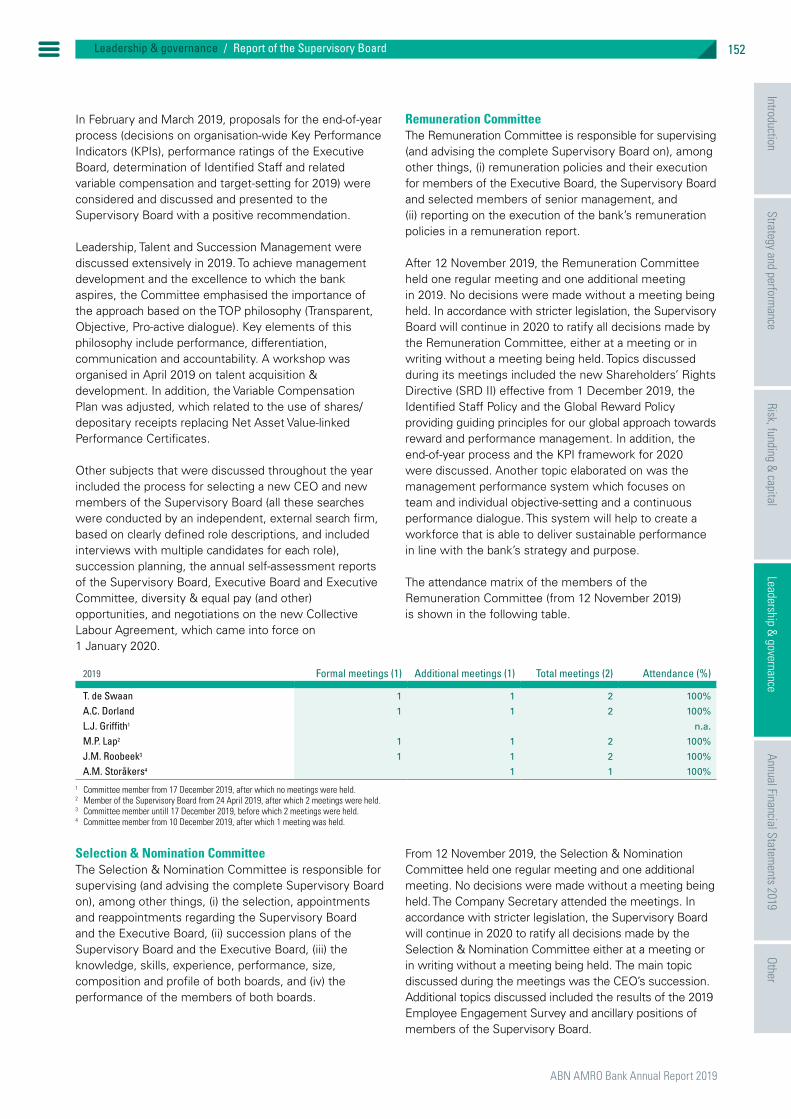
ABN AMRO Bank Annual Report 2019
IntroductionStrategy and perform
anceRisk, funding &
capitalLeadership structure
GovernanceAnnual Financial Statem
entsOther
IntroductionStrategy and perform
anceRisk, funding &
capitalAnnual Financial Statem
ents 2019Other
152
Leadership & governance
Leadership & governance / Report of the Supervisory Board
In February and March 2019, proposals for the end-of-year process (decisions on organisation-wide Key Performance Indicators (KPIs), performance ratings of the Executive Board, determination of Identified Staff and related variable compensation and target-setting for 2019) were considered and discussed and presented to the Supervisory Board with a positive recommendation.
Leadership, Talent and Succession Management were discussed extensively in 2019. To achieve management development and the excellence to which the bank aspires, the Committee emphasised the importance of the approach based on the TOP philosophy (Transparent, Objective, Pro-active dialogue). Key elements of this philosophy include performance, differentiation, communication and accountability. A workshop was organised in April 2019 on talent acquisition & development. In addition, the Variable Compensation Plan was adjusted, which related to the use of shares/depositary receipts replacing Net Asset Value-linked Performance Certificates.
Other subjects that were discussed throughout the year included the process for selecting a new CEO and new members of the Supervisory Board (all these searches were conducted by an independent, external search firm, based on clearly defined role descriptions, and included interviews with multiple candidates for each role), succession planning, the annual self-assessment reports of the Supervisory Board, Executive Board and Executive Committee, diversity & equal pay (and other) opportunities, and negotiations on the new Collective Labour Agreement, which came into force on 1 January 2020.
Remuneration CommitteeThe Remuneration Committee is responsible for supervising (and advising the complete Supervisory Board on), among other things, (i) remuneration policies and their execution for members of the Executive Board, the Supervisory Board and selected members of senior management, and (ii) reporting on the execution of the bank’s remuneration policies in a remuneration report.
After 12 November 2019, the Remuneration Committee held one regular meeting and one additional meeting in 2019. No decisions were made without a meeting being held. In accordance with stricter legislation, the Supervisory Board will continue in 2020 to ratify all decisions made by the Remuneration Committee, either at a meeting or in writing without a meeting being held. Topics discussed during its meetings included the new Shareholders’ Rights Directive (SRD II) effective from 1 December 2019, the Identified Staff Policy and the Global Reward Policy providing guiding principles for our global approach towards reward and performance management. In addition, the end-of-year process and the KPI framework for 2020 were discussed. Another topic elaborated on was the management performance system which focuses on team and individual objective-setting and a continuous performance dialogue. This system will help to create a workforce that is able to deliver sustainable performance in line with the bank’s strategy and purpose.
The attendance matrix of the members of the Remuneration Committee (from 12 November 2019) is shown in the following table.
2019 Formal meetings (1) Additional meetings (1) Total meetings (2) Attendance (%)
T. de Swaan 1 1 2 100%
A.C. Dorland 1 1 2 100%
L.J. Griffith1 n.a.
M.P. Lap2 1 1 2 100%
J.M. Roobeek3 1 1 2 100%
A.M. Storåkers4 1 1 100%
1 Committee member from 17 December 2019, after which no meetings were held.2 Member of the Supervisory Board from 24 April 2019, after which 2 meetings were held.3 Committee member untill 17 December 2019, before which 2 meetings were held.4 Committee member from 10 December 2019, after which 1 meeting was held.
Selection & Nomination CommitteeThe Selection & Nomination Committee is responsible for supervising (and advising the complete Supervisory Board on), among other things, (i) the selection, appointments and reappointments regarding the Supervisory Board and the Executive Board, (ii) succession plans of the Supervisory Board and the Executive Board, (iii) the knowledge, skills, experience, performance, size, composition and profile of both boards, and (iv) the performance of the members of both boards.
From 12 November 2019, the Selection & Nomination Committee held one regular meeting and one additional meeting. No decisions were made without a meeting being held. The Company Secretary attended the meetings. In accordance with stricter legislation, the Supervisory Board will continue in 2020 to ratify all decisions made by the Selection & Nomination Committee either at a meeting or in writing without a meeting being held. The main topic discussed during the meetings was the CEO’s succession. Additional topics discussed included the results of the 2019 Employee Engagement Survey and ancillary positions of members of the Supervisory Board.

ABN AMRO Bank Annual Report 2019
153Leadership & governance / Report of the Supervisory Board
The attendance matrix of the members of the Selection & Nomination Committee (from 12 November 2019) is shown in the following table.
2019 Formal meetings (1) Additional meetings (1) Total meetings (2) Attendance (%)
T. de Swaan 1 1 2 100%
A.C. Dorland 1 1 2 100%
L.J. Griffith1 n.a.
M.P. Lap2 1 1 2 100%
J.M. Roobeek3 1 1 2 100%
A.M. Storåkers4 1 1 100%
1 Committee member from 17 December 2019, after which no meetings were held.2 Member of the Supervisory Board from 24 April 2019, after which 2 meetings were held.3 Committee member untill 17 December 2019, before which 2 meetings were held.4 Committee member from 10 December 2019, after which 1 meeting was held.
Performance evaluationThe annual assessment of the Executive Board, the Executive Committee, the Supervisory Board and the Supervisory Board Committees regarding performance year 2018 was carried out in Q1 2019. The functioning of the Executive Board and Executive Committee and its members was assessed based on results assembled from questionnaires and interviews with all members of the Executive Board and Executive Committee and discussions during their meetings, which were evaluated by the Supervisory Board. The assessment of the Supervisory Board, and its individual members and committees was based on results assembled from questionnaires and interviews with all members of the Supervisory Board and discussions within the Supervisory Board. These assessments and evaluations were then used to identify areas of improvement to define an action plan. The quality of the PE programme, the relationship with the regulator and adjustments to the meeting order were some of the areas identified for improvement, and these areas are currently being addressed.
In Q4 of 2019 the annual assessment of the Executive Board, the Executive Committee, the Supervisory Board and the Supervisory Board Committees regarding performance year 2019 was carried out externally. The functioning of the Executive Board and Executive Committee and its members was assessed based on interviews with all members of the Executive Board and Executive Committee, as well as key individuals within ABN AMRO and discussions at their meetings, which were evaluated by the Supervisory Board. The assessment of the Supervisory Board, its individual members and committees was assessed based on interviews with all members of the Supervisory Board as well as key individuals within ABN AMRO and discussions within the Supervisory Board. Areas of improvement identified on the basis of these assessments and evaluations included a joint focus on long-term rather than short-term fixing, the history based corporate culture and optimisation of the use of time; these areas are currently being addressed.
Induction Programme and Lifelong Learning ProgrammeInduction ProgrammeFollowing their appointment, all new members of the Supervisory Board completed an extensive induction programme designed to ensure they have relevant knowledge needed to fulfil their role, including thorough knowledge of ABN AMRO and its business activities, financial reporting of the group ABN AMRO belongs to and general financial, social, risk, compliance and legal matters. In view of the different knowledge, background and experience of newly appointed members of the Supervisory Board, each induction programme has a tailor-made curriculum.
Lifelong Learning ProgrammeA lifelong learning programme is in place for members of the Supervisory Board, Executive Board and Executive Committee. This is designed to keep their expertise up to date and to broaden and deepen their knowledge, where necessary. The objective is for members of the Supervisory Board, Executive Board and Executive Committee to participate in the same training sessions so as to foster knowledge-sharing. The curriculum is developed and updated continually to ensure the programme is of high quality, covers all relevant aspects of the bank’s performance and takes into account current developments in the global financial industry. Topics covered in 2019 and attended by the Supervisory Board together with the Executive Board and Executive Committee included corporate governance, data management, detecting financial crime, data and information related risks, conflicts of interest, in-depth sessions on mortgages and on Private Banking and its strategy, and innovation and digitalisation. Moreover, the members of the Supervisory Board attended in-depth sessions on remuneration regulation and recovery and resolution planning.
IntroductionStrategy and perform
anceRisk, funding &
capitalAnnual Financial Statem
ents 2019Other
Leadership & governance

ABN AMRO Bank Annual Report 2019
IntroductionStrategy and perform
anceRisk, funding &
capitalLeadership structure
GovernanceAnnual Financial Statem
entsOther
IntroductionStrategy and perform
anceRisk, funding &
capitalAnnual Financial Statem
ents 2019Other
154
Leadership & governance
Leadership & governance / General Meeting and shareholder structure
General meetingThe Annual General Meeting is held each year by 30 June at the latest. The agenda for the Annual General Meeting must contain certain subjects specified in ABN AMRO Bank’s Articles of Association and under Dutch law, for example the adoption of the annual financial statements. Shareholders or holders of depositary receipts who alone or jointly represent at least 3% of the issued share capital of ABN AMRO are allowed to add items to the agenda of the General Meeting, provided they submit a request for this (including reasons) to ABN AMRO at least 60 days prior to the General Meeting.
The Supervisory Board and the Executive Board are both entitled to convene a General Meeting. Shareholders or holders of depositary receipts issued with the cooperation of ABN AMRO Bank may also convene a General Meeting, provided they represent at least 10% of the issued share capital. NLFI may also request the Executive Board or Supervisory Board to convene a General Meeting, as stated in the Relationship Agreement.
Extraordinary General Meetings may be convened if deemed necessary to resolve important decisions, such as major acquisitions and divestments or appointments of Supervisory Board members that cannot be deferred until the next Annual General Meeting.
ABN AMRO Bank held two General Meetings in 2019: the Annual General Meeting on 24 April (at the time ABN AMRO Group) and an Extraordinary General Meeting on 17 December.
The agenda of the Annual General Meeting on 24 April 2019 included:
Å the adoption of the 2018 annual financial statements; Å the approval of the proposed dividend for the year 2018; Å the discharge of each member of the Executive and Supervisory Boards in office during the financial year 2018;
Å the re-appointment of Ernst & Young Accountants LLP as external auditor for the financial years 2019, 2020 and 2021;
Å amendment to the Articles of Association; Å the appointment of Anna Storåkers and Michiel Lap as members of the Supervisory Board;
Å the merger between ABN AMRO Group N.V. and ABN AMRO Bank N.V.;
Å the authorisation for the Executive Board to (a) issue shares and grant rights to subscribe to rights for shares for a period of 18 months up to a maximum of 10% of the issued share capital of ABN AMRO Group, (b) limit or exclude pre-emptive rights, and (c) acquire shares or depositary receipts representing shares in ABN AMRO Group’s own capital for a period of 18 months, subject to the approval of the Supervisory
General Meeting and shareholder structure
Shareholder structure
ABN AMRO Bank N.V.
Operating entities
Depositary receipts for shares(Not listed on the stock exchange)
Depositary receipts for shares(Listed on the stock exchange)
NLFI
Dutch State
STAK AAB
Investors
49.9%+6.4% DRs 50.1%
General Meeting and shareholder structure

ABN AMRO Bank Annual Report 2019
155Leadership & governance / General Meeting and shareholder structure
Board and provided the total number of shares or depositary receipts held by ABN AMRO is limited to 10% of the issued share capital of ABN AMRO Group;
Å the cancellation of shares or depositary receipts representing shares in ABN AMRO Group’s own capital held by ABN AMRO Group and the related reduction of the authorised capital.
Due to a legal merger that took effect on 29 June 2019, ABN AMRO Group N.V. merged into ABN AMRO Bank N.V., as a result of which ABN AMRO Bank N.V. became the surviving entity and ABN AMRO Group N.V. ceased to exist. At 31 December 2019, all shares in the capital of ABN AMRO Bank were held by two foundations: Stichting Administratiekantoor beheer financiële instellingen (NLFI) and Stichting Administratie kantoor Continuïteit ABN AMRO Bank (STAK AAB). On that date, NLFI held 56.3% in ABN AMRO Bank, of which 49.9% was directly held via ordinary shares and 6.4% was indirectly held via depositary receipts (DRs) for shares in ABN AMRO Bank. On that date, STAK AAB held 50.1% of the shares in the issued capital of ABN AMRO Bank. Only STAK AAB’s depositary receipts have been issued with the cooperation of ABN AMRO Bank and are traded on Euronext Amsterdam.
NLFIThe Dutch State holds an interest in ABN AMRO Bank through NLFI. NLFI was set up to avoid potential conflicting responsibilities that the Dutch Minister of Finance might otherwise face and to avoid undesired political influence being exerted. NLFI issued exchangeable depositary receipts for shares in the capital of ABN AMRO Bank (at the time ABN AMRO Group) to the Dutch State. NLFI is responsible for managing these shares and exercising all rights associated with these shares under Dutch law, including voting rights. NLFI acts as a standalone shareholder that is independent from the Dutch State, including the Dutch Ministry of Finance. However, important decisions taken by NLFI require the prior approval of the Dutch Minister of Finance, who can also give binding voting instructions to NLFI with respect to such decisions. NLFI is not permitted to dispose of or encumber the ordinary shares in the capital of ABN AMRO Bank except pursuant to an authorisation from and on behalf of the Dutch Minister of Finance.
NLFI entered into a Relationship Agreement with ABN AMRO Group (currently ABN AMRO Bank) governing their relationship after the IPO. The full text of the Relationship Agreement is available on abnamro.com. The Relationship Agreement will terminate if and when NLFI (directly or indirectly) holds less than 10% of ABN AMRO Bank’s issued share capital. A limited number of clauses will not terminate under any circumstances. The Relationship Agreement includes the following provisions, subject to certain conditions stated in the agreement:
Å The right of NLFI to be consulted by (a) the Supervisory Board on the appointment or reappointment of (i) members of the Executive Board and (ii) the Chairman of the Executive Board or the Supervisory Board, and (b) the Executive Board on a proposal for the appointment of the external auditor;
Å NLFI’s right of prior approval of any issuance of (or granting of rights to acquire) shares in ABN AMRO for as long as NLFI holds at least 33 1/3% of the shares in ABN AMRO;
Å For as long as NLFI holds more than 50% of the shares in ABN AMRO: any investments or divestments by ABN AMRO or any of its subsidiaries with a value of more than 5% of the equity of ABN AMRO; and
Å For as long as NLFI holds 50% or less but 33 1/3% or more of the shares in ABN AMRO: any investment or divestments by ABN AMRO or any of its subsidiaries with a value of more than 10% of the equity of ABN AMRO;
Å The obligation of NLFI to effect sell-downs of ABN AMRO shares through STAK AAB;
Å Certain orderly market arrangements; and Å Certain information rights for NLFI as long as it holds at least 33 1/3% of the shares in ABN AMRO.
STAK AABSTAK AAB is independent from ABN AMRO and the holder of shares in ABN AMRO Bank’s issued share capital. STAK AAB has acquired such shares for the purpose of administration (ten titel van beheer) in exchange for depositary receipts. The manner in which this structure can serve as a defence measure and STAK AAB’s role in this is set out in this section under Anti-takeover measures.
In addition to serving as a defence measure, STAK AAB aims to promote the exchange of information between ABN AMRO Bank on the one hand and holders of depositary receipts and shareholders on the other. It also promotes the acquisition of voting instructions from DR holders, for example by organising a meeting of depositary receipt holders prior to ABN AMRO Bank’s General Meeting. STAK AAB reports on its activities at least once a year in its annual report. In addition, further sell-downs of NLFI’s shareholding in ABN AMRO Bank will take place through STAK AAB (and in the form of depositary receipts) only.
By virtue of its Trust Conditions, STAK AAB must ensure that, no later than two weeks before a General Meeting of ABN AMRO Bank is held, a meeting of depositary receipt holders is held at which the agenda items of that General Meeting are discussed. Accordingly, STAK AAB held meetings of depositary receipt holders before the Annual and Extraordinary General Meeting of ABN AMRO Bank, on respectively 8 April 2019 and 3 December 2019. Furthermore, STAK AAB held an extraordinary depositary
IntroductionStrategy and perform
anceRisk, funding &
capitalAnnual Financial Statem
ents 2019Other
Leadership & governance

ABN AMRO Bank Annual Report 2019
IntroductionStrategy and perform
anceRisk, funding &
capitalLeadership structure
GovernanceAnnual Financial Statem
entsOther
IntroductionStrategy and perform
anceRisk, funding &
capitalAnnual Financial Statem
ents 2019Other
156
Leadership & governance
Leadership & governance / General Meeting and shareholder structure
receipt holders meeting on 24 April 2019, with the sole purpose of amending its articles of association and trust conditions in order to facilitate the legal merger between ABN AMRO Bank and ABN AMRO Group.
The STAK AAB website (stakaab.org) provides more information on the activities of STAK AAB, as well as its annual report, articles of association (including STAK AAB’s objectives), the Trust Conditions and any information relating to meetings of depositary receipt holders.
ABN AMRO and STAK AAG held two periodic meetings in 2019. The items discussed included the published financial results, the long-term strategy of ABN AMRO Bank and the intended governance in the event of hostile bids and shareholder activism.
Anti-takeover measuresABN AMRO has implemented a structure whereby STAK AAB is the holder of shares in ABN AMRO Bank’s issued share capital and has issued depositary receipts representing such shares with the cooperation of ABN AMRO Bank. The purpose of having a structure under which depositary receipts are created and STAK AAB is the legal owner of the underlying shares is to create a defence measure.
STAK AAB will do everything in its power to deter any action that could affect the independence, continuity or identity of ABN AMRO. In a non-hostile situation, STAK AAB will act primarily in the interests of depositary receipt holders. In a hostile situation, STAK AAB will act primarily in the interests of ABN AMRO Bank and its business enterprises. Under all circumstances, STAK AAB will also take into account the legitimate interests of all other stakeholders: clients, debt investors, shareholders, depositary receipt holders, employees, and the society in which ABN AMRO operates.
In a non-hostile situation, STAK AAB will grant a power of attorney to the holders of depositary receipts to exercise the voting rights attached to the underlying shares. STAK AAB will not exercise voting rights on the shares, unless holders of depositary receipts have requested it to do so. This may be different under hostile circumstances as described in section 2:118a of the Dutch Civil Code. In this case, STAK AAB may refuse or revoke powers of attorney for up to two years (whereby NLFI must pre-approve this decision by STAK AAB as long as NLFI holds at least 33 1/3% of the shares in ABN AMRO Bank) and STAK AAB itself will exercise the voting rights. In doing so, it should, pursuant to the Trust Conditions and the articles of association of STAK AAB, focus primarily on ABN AMRO’s interests, taking into account the legitimate interests of the stakeholders mentioned above.
Employee CouncilABN AMRO’s employees are represented by works councils (ondernemingsraden) at all levels of its group in which specifically appointed delegates are centralised in the overarching Employee Council (Raad van Medewerkers). Under Dutch law, the managing board of any company running an enterprise in which a works council has been established must seek the non-binding advice of the works council before taking certain decisions with respect to the enterprise, such as those related to a major restructuring, a change of control, or the appointment or dismissal of a member of the managing board. Certain other decisions directly involving employment matters that apply either to all employees or certain groups of employees may only be taken with the works council’s consent.
The Employee Council deals primarily with topics that affect all parts of the group’s organisation and meets regularly with members of the Executive Board and Supervisory Board on various other occasions throughout the year, including an annual joint meeting of the Executive Committee, the Supervisory Board and the Employee Council. The Employee Council and ABN AMRO Bank have entered into an agreement under which the Employee Council has been granted certain additional rights (the Works Council Covenant). Under the Works Council Covenant, the Employee Council has the right of inquiry (enquêterecht) within the meaning of Section 2:346 of the Dutch Civil Code in the event of a hostile situation. The Works Council Covenant defines the following situations as hostile: (i) a public offer has been announced or is made in respect of shares in the capital of ABN AMRO Bank (or in respect of depositary receipts representing such shares) or there is a justified expectation that this will take place, without agreement first having been reached between the bidder and ABN AMRO Bank, (ii) the exercise of the voting rights by a depositary receipt holder or shareholder would effectively be in conflict with the interests of ABN AMRO Bank and its business, or (iii) any other situation in which the independence, continuity or identity of ABN AMRO Bank and the enterprises associated with ABN AMRO Bank could be harmed. Other situations can be qualified as hostile by means of an agreement between the Employee Council and ABN AMRO Bank. Furthermore, if NLFI requests the consent, cooperation and/or a position statement of ABN AMRO Bank in the event of a subsequent placement or a private sale of shares or depositary receipts, the Employee Council will be requested by ABN AMRO Bank to provide advice within the meaning of articles 25 and 26 of the Works Councils Act (Wet op de Ondernemingsraden).

ABN AMRO Bank Annual Report 2019
157Leadership & governance / Codes and regulations
ABN AMRO is required to comply with a wide variety of governance codes and regulations, including the Dutch Corporate Governance Code, the Banking Code and CRD IV. This section explains how ABN AMRO complies with these codes and regulations. More comprehensive overviews of ABN AMRO’s compliance with such codes and regulations are published under the Corporate Governance section on abnamro.com.
Dutch Corporate Governance CodeWe believe that when corporate governance meets high international standards, it significantly boosts the confidence of a company’s stakeholders. As depositary receipts for shares in ABN AMRO Bank are listed on Euronext Amsterdam, ABN AMRO Bank adheres to the Dutch Corporate Governance Code.
ABN AMRO Bank complies with all principles and best practices of the Dutch Corporate Governance Code, except for the deviations and nuances described below.
Under the Corporate Governance section on its website, ABN AMRO Bank also publishes a detailed comply or explain list with regard to the Dutch Corporate Governance Code which applied in 2019.
Best practice provision 1.3.6 (Absence of an internal audit department) does not apply since ABN AMRO Bank does have an internal audit function.
ABN AMRO Bank applies best practice provision 2.1.9 (Independence of the chairman of the supervisory board), which states that the chairman of the supervisory board should not be a former member of the management board of the company. Although Mr Tom de Swaan was a member of the managing board of the former ABN AMRO, the current ABN AMRO Bank is the result of various legal and operational separations and combinations, a merger and a legal demerger that took place after the acquisition of the former ABN AMRO Holding N.V. (the former ABN AMRO group) by a consortium of banks in October 2007. The consortium consisted of the Royal Bank of Scotland Group, Fortis and Banco Santander S.A (the Consortium). In October 2008, when the Fortis group experienced financial difficulties, the Dutch State acquired certain operations of the Fortis group, as well as Fortis’ interest in the vehicle that had acquired the former ABN AMRO group. ABN AMRO Group N.V. (ABN AMRO Group) was newly incorporated on 18 December 2009 to hold the operations, assets and liabilities of parts of the former ABN AMRO group and the part of the Fortis group acquired by the Dutch State. On 6 February 2010, the new and current ABN AMRO Bank demerged from the former
ABN AMRO Bank N.V. into a newly incorporated entity. The former ABN AMRO Bank N.V. was subsequently renamed Royal Bank of Scotland N.V. On 1 July 2010, the new ABN AMRO Bank and Fortis Bank (Nederland) N.V. merged pursuant to a legal merger, following which the current ABN AMRO Bank was the surviving entity and Fortis Bank (Nederland) N.V. was the disappearing entity . ABN AMRO Group was merged into ABN AMRO Bank on 29 June 2019. The former ABN AMRO Group and ABN AMRO Bank are different entities than the former ABN AMRO Holding N.V. or former ABN AMRO Bank N.V.
ABN AMRO Bank applies best practice provision 4.1.3 (Agenda), which states, among other things, that (a) each substantial change in the corporate governance structure of ABN AMRO Bank and in the compliance with the Code and (b) material changes in the Articles of Association should be presented to the General Meeting as a separate discussion item or voting item, as applicable. The only exception to this best practice provision is that the Executive Board and the Supervisory Board may decide to place certain topics on the agenda under one agenda item if these topics are justifiably related. ABN AMRO Bank considers this to be a further substantiation of this best practice provision, which may be necessary when proposals to amend the Articles of Association or the corporate governance structure of ABN AMRO Bank are interrelated in such a way that separate votes on each of these proposals could result in an imbalanced voting result and, in turn, an imbalance in the corporate governance structure.
Best practice provision 4.3.3 (Cancelling the binding nature of a nomination or dismissal) is not applicable to ABN AMRO Bank since it applies the rules applicable to a large company regime (structuurregime).
ABN AMRO Bank does not apply principle 4.4 (Issuing depositary receipts for shares). In contradiction to this principle and provision, the issuing of depositary receipts by STAK AAB is primarily used as a defence measure and not to prevent shareholder absenteeism, from enabling a minority of shareholders to control the decision-making process at a General Meeting. Regulatory considerations have been decisive in choosing a structure with depositary receipts as a protective measure. Declarations of No Objection are required in connection with the direct or indirect acquisition of a qualified holding in regulated entities in which ABN AMRO Bank holds an interest. Therefore, this structure provides ABN AMRO Bank with the greatest possible certainty of adequate protection against a hostile takeover. Although the issuing of depositary receipts has been set up primarily as a defence measure and not to prevent absenteeism, STAK AAB aims to promote the exchange of information between
Codes and regulations IntroductionStrategy and perform
anceRisk, funding &
capitalAnnual Financial Statem
ents 2019Other
Leadership & governance
Codes and regulations

ABN AMRO Bank Annual Report 2019
IntroductionStrategy and perform
anceRisk, funding &
capitalLeadership structure
GovernanceAnnual Financial Statem
entsOther
IntroductionStrategy and perform
anceRisk, funding &
capitalAnnual Financial Statem
ents 2019Other
158
Leadership & governance
Leadership & governance / Codes and regulations
ABN AMRO Bank on the one hand and holders of depositary receipts and shareholders on the other by, for example, organising a meeting of depositary receipt holders before every General Meeting. More information on the purpose and functioning of the depositary receipts and STAK AAB, including information on situations in which STAK AAB may decide to limit, refuse or revoke powers of attorney (and to not observe any voting instructions received), can be found on the STAK AAB website (stakaab.org).
Compliance with best practice provisions 4.4.1 - 4.4.5 and 4.4.7 - 4.4.8 are a responsibility of the board of STAK AAB. With respect to best practice provisions 4.4.5 and 4.4.8, the following applies. In a non-hostile situation, STAK AAB will act primarily in the interests of depositary receipt holders. In a hostile situation, STAK AAB will act primarily in the interests of ABN AMRO Bank and its business enterprises. Under all circumstances STAK AAB will also take into account the legitimate interests of all other stakeholders: clients, savers and deposit holders, shareholders, depositary receipt holders, employees, and the society in which ABN AMRO operates. Furthermore, STAK AAB has in principle the obligation to grant a power of attorney to depositary receipt holders to exercise the voting rights attached to the underlying shares and will not exercise voting rights on the shares in ABN AMRO Bank (unless depositary receipt holders have requested STAK AAB to do so). The foregoing could be different in the hostile situations described in article 2:118a of the Dutch Civil Code. STAK AAB may then decide to (a) limit, exclude or revoke powers of attorney and (b) not observe voting instructions received for a period of up to two years. Furthermore, under the depositary receipt terms, when exercising the voting rights in a hostile situation, STAK AAB should focus primarily on the interests of ABN AMRO Bank and its business enterprises as set out above.
Principle 5.1 and best practice provisions 5.1.1 - 5.1.5 are not applicable since ABN AMRO Bank has a two-tier board.
Dutch Banking CodeThe Dutch Banking Code sets out principles that banks with a corporate seat in the Netherlands (i.e. with a Dutch banking license) should observe in terms of corporate governance, risk management, audit and remuneration. The Dutch Banking Code applies to ABN AMRO Bank as the main entity within a group that holds a Dutch banking licence. ABN AMRO is therefore committed to complying with the Dutch Banking Code and devotes a great deal of effort to ensuring that the spirit of the code is reflected in the behaviour of its employees and the culture of the bank. As such, we are pleased to confirm that ABN AMRO complies with the principles of the Dutch Banking Code. A principle-by-principle overview of the manner in which ABN AMRO Bank complied with the Dutch Banking Code during 2019 is published on abnamro.com.
Throughout 2019, we continued to improve the manner in which we apply the principles of the Dutch Banking Code, taking into account the focus areas indicated by the Dutch Banking Code Monitoring Committee. In particular, the bank devoted a great deal of attention to leadership, integrity and its societal role, including increased efforts regarding sustainability and providing services to clients in their best interests.
During 2019, further improvements were made to the process of succession planning, permanent education and self-assessments preformed at Board level. All members of the Supervisory Board and Executive Board of ABN AMRO Group have taken the Banker’s Oath, as required by Dutch law. The oath is a confirmation of ABN AMRO’s existing policies, which are fully in line with the bank’s cultural principles and core values. Along with the introduction of a Social Charter and the Banking Code, the Dutch banking industry has taken the initiative to have all employees take the Banker’s Oath. Employees take the oath to affirm their commitment to upholding high standards of ethical behaviour. They are personally responsible for complying with these rules of conduct and may be held accountable for non-compliance in the near future.
Subsidiaries of ABN AMRO Bank and the Dutch Banking CodeOn 31 December 2019, ABN AMRO Bank had four Dutch subsidiaries with a banking licence: ABN AMRO Clearing Bank N.V., ABN AMRO Groenbank B.V., ABN AMRO Hypotheken Groep B.V. and International Card Services B.V. ABN AMRO applies the principles of the Dutch Banking Code to all of these Dutch subsidiaries on a consolidated basis by developing group-wide policies and standards that promote compliance with internal and external rules and best-practice provisions. However, in view of the differences between the activities, organisation and risk management of the subsidiaries, the application of group-wide policy and standards may vary from one subsidiary to another. An explanation of the manner in which these subsidiaries comply with the Dutch Banking Code is published on abnamro.com.
CRD IVArticle 96 of CRD IV requires financial institutions to explain on their website how they comply with the requirements of articles 88 - 95 of CRD IV. These articles set out governance, disclosure, remuneration and nomination requirements for financial institutions. The obligation to publish such an overview was implemented into Dutch law by article 134b of the Decree on prudential measures FMSA (Besluit prudentiële regels Wft). ABN AMRO Bank has published on abnamro.com an overview of how the bank complies with article 134b of the Prudential Measures Decree and article 96 of CRD IV.
ABN AMRO Bank Annual Report 2019
159Leadership & governance / Legal structure
Global structureThe full list of subsidiaries and participating interests referred to in article 414, Book 2 of the Dutch Civil Code has been filed with the Trade Register.
Retail BankingThe Retail Banking business of ABN AMRO is supported by the following subsidiaries (this list is not exhaustive): ABN AMRO Hypotheken Groep B.V. offers all ABN AMRO labelled residential mortgage products, including Florius and Moneyou brands. ALFAM Holding N.V. provides consumer loans under different labels: e.g. Alpha Credit Nederland, Credivance, Defam and GreenLoans. International Card Services B.V. (ICS) issues, promotes, manages and processes more than 25 different credit cards in partnership with companies, including credit card transactions, and offers other financial services, such as revolving credit facilities. Moneyou B.V. operates in the Netherlands and Germany as a consumer internet bank offering payment and savings accounts as well as lending products (consumer credit and mortgages). Nationale-Nederlanden ABN AMRO Verzekeringen Holding B.V. (ABN AMRO Verzekeringen) is an associate of ABN AMRO Bank N.V.(49%). Nationale-Nederlanden N.V. holds a 51% interest. ABN AMRO Verzekeringen offers life and non-life insurance products under the ABN AMRO brand. ABN AMRO Pensioeninstelling N.V. (ABN AMRO Pensions) is a premium pension institution (‘PPI’) which offers pension schemes without insurance based on longevity or death.
Commercial BankingThe Commercial Banking business of ABN AMRO is supported by the following subsidiaries (this list is not exhaustive): ABN AMRO Asset Based Finance N.V. provides asset-based solutions (working capital solutions, equipment lease, equipment loans and vendor lease services) to its customers in the Netherlands, France, Germany and the United Kingdom. New10 provides SMEs in the Netherlands with standard loans through a fully digital product offering. ABN AMRO Groenbank B.V. provides financing for sustainable and green investments based on the Green Scheme, a facility through which the Dutch government encourages sustainable investments.
Private BankingThe Private Banking business of ABN AMRO is supported in France and Germany by the following subsidiaries (this list is not exhaustive): Banque Neuflize OBC S.A. offers a private banking model based on an integrated approach to private and commercial wealth, articulated around dedicated advisory and product offers. Bethmann Bank AG is a private bank which enjoys a strong local heritage and brand recognition in the German market. Bethmann covers all major regions of Germany and offers all private banking and private wealth management-related services. Neuflize Vie S.A. is a joint venture between Banque Neuflize OBC (60%) and AXA (40%). It was created to offer life insurance products to high net worth and ultrahigh net worth individuals and has developed customised solutions.
Corporate & Institutional BankingThe Corporate & Institutional Banking business of ABN AMRO is supported by the following subsidiaries (this list is not exhaustive): ABN AMRO Clearing Bank N.V. is a global leader in derivatives and equity clearing. It is one of the few players currently able to offer global market access and clearing services on more than 85 of the world’s leading exchanges and it operates from several locations across the globe. Banco ABN AMRO SA is the Brazilian subsidiary of ABN AMRO; it has its own local bank license.
Group FunctionsThe Group Functions business of ABN AMRO is supported by the following subsidiaries (this list is not exhaustive): ABN AMRO Funding USA LLC is active in the US market, issuing ABN AMRO’s US dollar Commercial Paper funding for clients operating in the US and for clients with US dollar loans. ABN AMRO Captive N.V. is a captive reinsurance company.
Legal structure IntroductionStrategy and perform
anceRisk, funding &
capitalAnnual Financial Statem
ents 2019Other
Leadership & governance
Legal structure

ABN AMRO Bank Annual Report 2019
IntroductionStrategy and perform
anceRisk, funding &
capitalLeadership structure
GovernanceAnnual Financial Statem
entsOther
IntroductionStrategy and perform
anceRisk, funding &
capitalAnnual Financial Statem
ents 2019Other
160
Leadership & governance
Leadership & governance / Remuneration report
ABN AMRO aims to be a bank at the heart of society that is relevant and responsible now and in the future. We want to create value for society not only as a provider of financial services to our clients but also as an employer. Our strategy goes far beyond purely financial value. We want to create lasting value for all our stakeholders. ABN AMRO’s remuneration philosophy and principles apply to all our employees and support them in our goal to nurture a culture of engaged, well-trained and high performing people and processes. The remuneration policy and practices for the Supervisory Board, the Executive Board and other Identified Staff are discussed in greater detail in the subsequent sections of this report.
OverviewAs a financial institution, ABN AMRO is subject to many guidelines and restrictions with respect to remuneration. Since 2015, limitations with respect to remuneration and particularly variable remuneration have applied to all employees in the Dutch financial sector, with even more restrictions applying to financial institutions which the Dutch State supports by way of shareholdings. As this is the case for ABN AMRO, the restrictions include a prohibition on bonuses and individual salary increases for a specific group of senior employees. On 1 December 2019, new legislation following the second Shareholders’ Rights Directive entered into force, giving shareholders a stronger position with regard to the remuneration of supervisory board and executive board members, and creating more transparancy. ABN AMRO will implement as many of the Directive’s requirements into the Boards’ remuneration policies as possible, taking into consideration the applicable remuneration restrictions, such as the bonus prohibition and salary freeze for senior employees, which prohibits full implementation.
Remuneration philosophyABN AMRO has embedded its long-term corporate strategy and interests as well as its sustainability policies into its remuneration policy and principles. This strategy is based on our purpose (‘Banking for better, for generations to come’) and the three main strategic pillars which are reflected in our remuneration philosophy:
Å Pillar 1 - Supporting our clients’ transition to sustainability;
Å Pillar 2 - Reinvent the customer experience; Å Pillar 3 - Build a future-proof bank.
Remuneration policyResponsible remuneration policyABN AMRO pursues a responsible remuneration policy that remains within the regulatory boundaries, such as limitations on variable remuneration and the prohibition on bonuses for a specific group of senior employees, while
taking into account the interests of stakeholders and best practices. Our business strategy puts our positive, proactive purpose at the centre of everything we do. This means we are rethinking, innovating and pulling together to move forward with our purpose. Given that we want to support our client’s transition to sustainability, reinvent the customer experience and build a future proof bank, we must offer clients flawless experiences. To achieve that, we need well trained, engaged and entrepreneurial employees and flawless processes and technologies. We need to keep our current employees engaged and enable them to develop new skills by investing in employee development. We also need to be able to attract new talent in order to deliver and continue to create value for our stakeholders and society at large. And we also strive to embed new remuneration regulations effectively and efficiently in our reward policies and principles while safeguarding our license to operate, achieving our ambitions, and keeping our risks and opportunities in balance.
Our remuneration principles are set out in ABN AMRO’s Global Reward Policy, which is designed to support the bank’s business strategy, objectives, values and long-term interests. Our remuneration policy should enable us to attract and retain the right talent and should ensure that we meet our responsibilities towards clients and other stakeholders, both now and in the future. Given that our remuneration policy also provides a framework for effectively managing reward and performance across the bank, it is periodically updated in order to remain aligned with our goals and all applicable guidelines and regulations. The Supervisory Board approves the general remuneration principles laid down in the Global Reward Policy and assesses the general principles and exceptions that relate to the applicable governance and/or internationally applicable guidelines and regulations within the financial sector. The policy is therefore reviewed regularly, taking into account the company’s strategy and culture, and any changes in these, as well as factors such as risk awareness, targets and corporate values. The reviews also take into account external requirements with respect to governance, the international context and relevant market practice and data.
Apart from remuneration, we realise that the only way to successfully implement our strategy is to create conditions in which every employee can use his or her talents to contribute to our purposes and to develop or acquire the right skills. We strive to achieve a future-proof workforce by investing in an excellent Employee
Remuneration report
Remuneration report

ABN AMRO Bank Annual Report 2019
161Leadership & governance / Remuneration report
Experience and leadership that inspires, alongside efficient organisational structures, processes and IT systems that help our employees work more effectively.
The Global Reward Policy applies at all levels and in all countries of ABN AMRO’s international network (including branch offices). Different starting points apply to the various levels of the bank’s workforce, but we always position our remuneration levels around the median of the relevant labour market while keeping labour costs under control. A typical remuneration package for ABN AMRO employees consists of an annual base salary, annual variable remuneration if the relevant market practice so requires, benefits and other entitlements. We also have in place specific rules for staff whose professional activities could have a material impact on the bank’s risk profile; these individuals are referred to as Identified Staff.
ABN AMRO’s Executive Board is subject to a separate remuneration policy, which is in alignment with the policy that was adopted in 2010 for the Managing Board at that time. In 2015, the Executive Board’s remuneration policy was aligned with all relevant and applicable guidelines and regulations, including developments and recommendations of the EBA, ECB, DNB, AFM, Banking Code and Corporate Governance Code. The Executive Board’s current remuneration policy will be amended to include requirements under new legislation following the Second Shareholders Rights Directive and will be put forward for adoption by the general meeting at the Annual General Meeting of Shareholders in 2020. The new remuneration policy for ABN AMRO’s Supervisory Board members will also be put forward for adoption.
Our annual performance management cycle for Identified Staff aims to create links between performance (realistic, sustainable results) and reward in such a way that reward is aligned with both the employee’s and the bank’s performance. We use a set of balanced financial and non-financial targets, as well as qualitative and quantitative KPIs. For 2019, our group non-financial KPIs consisted of sustainability (based on the Dow Jones Sustainability Index ranking and the AFM/NVB Trust Monitor), employee engagement (via the annual Employee Engagement survey) and house in order (conveying the desired compliance and risk culture).The financial targets used in 2019 at group level were ROE, CET1 ratio and cost/income ratio. Cost ceiling and RAROE are also used at a business line level. There is ample room for setting individual and business-related KPIs, such as individual leadership which includes risk awareness, culture transformation and strategy execution. The table of KPIs for Identified Staff provides more insight into the methodology used.
In line with the general trend toward less hierarchy and more teamwork, ABN AMRO wants to subject employees
to fewer checks, give them more empowerment, and offer them tools that will keep them well equipped for their job and help them deal with the ever-changing environment. Our responsible remuneration policy should enable our employees to further develop their expertise and help us create a simpler, more agile organisation. We strive to make our staff’s work more meaningful, while at the same time ensuring their duties are aligned with all the bank’s current and future priorities. We use Together & Better performance management to further emphasise our employees’ ambitions, expertise and development and seek alignment with our goals, such as creating long-term value for all our stakeholders.
Changes in 2019On 29 June 2019, ABN AMRO Group N.V. merged into ABN AMRO Bank N.V. and as a result, ABN AMRO Bank N.V. became a listed company. All of the bank’s Executive Board members are statutory directors. By law, the contractual relationship between a statutory director and a listed company cannot qualify as an employment agreement. The contractual relationships with the four Executive Board members were therefore amended into service agreements with effect from 29 June 2019.
The Remuneration Report regarding the financial year 2019 has been aligned with the requirements of the Second Shareholders Rights Directive and new legislation where possible. This means that the Remuneration Report aims to be comprehensible, and that it contains an overview of all remuneration awarded or payable to individual Executive Board members in the year 2019. The Remuneration Report will be presented for an advisory vote in the Annual General Meeting of Shareholders in 2020 and will be published on ABN AMRO’s website after the Annual General Meeting. The information published in accordance with this paragraph shall be accessible for a period of ten years. If the information disclosed in accordance with this paragraph remains public after expiry of the ten-year period, it shall no longer contain personal data of directors after that period.
Changes expected in 2020The remuneration policies for the Executive Board and the Supervisory Board from 2020 onwards will be put forward for adoption by the General Meeting of Shareholders in 2020, for which a 75% majority of the votes is required.
As part of ABN AMRO’s new collective labour agreement for 2020-2022, it was agreed to change the pension contribution. In order to keep the bank’s pension costs predictable, the pension contribution will be fixed at 37% of the pensionable salary for the coming five years. ABN AMRO will cease to pay a variable pension contribution based on actual interest rates. To compensate for the risk transfer, a one-off additional payment of 4% of
IntroductionStrategy and perform
anceRisk, funding &
capitalAnnual Financial Statem
ents 2019Other
Leadership & governance

ABN AMRO Bank Annual Report 2019
IntroductionStrategy and perform
anceRisk, funding &
capitalLeadership structure
GovernanceAnnual Financial Statem
entsOther
IntroductionStrategy and perform
anceRisk, funding &
capitalAnnual Financial Statem
ents 2019Other
162
Leadership & governance
Leadership & governance / Remuneration report
pensionable base salary (EUR 30 million) was made into a pension contribution reserve. This payment was accounted for in the last quarter of 2019.
Remuneration principles for the Supervisory Board, Executive Board and other Identified StaffSupervisory Board remuneration in 2019The remuneration of members of the Supervisory Board is determined by the General Meeting of Shareholders, based on a proposal submitted by the Supervisory Board. ABN AMRO does not grant any variable remuneration or equity to Supervisory Board members in lieu of remuneration. The level of remuneration has not changed since 2010. In November 2019 the former Remuneration, Selection & Nomination Committee was divided into two separate committees, a Remuneration Committee and a Selection & Nomination Committee.
The annual fees for 2019 were as follows: Å Membership of the Supervisory Board: EUR 50,000 (EUR 65,000 for the Chairman);
Å Membership of the Audit and Risk & Capital Committee: EUR 12,500 (EUR 15,000 for the Chairman);
Å Membership of the Remuneration Committee: EUR 10,000 (EUR 12,500 for the Chairman);
Å Membership of the Selection & Nomination Committee: EUR 10,000 (EUR 12,500 for the Chairman).
The remuneration for Supervisory Board committee membership is limited to two such memberships.
Supervisory Board members are appointed by the General Meeting upon nomination by the Supervisory Board. The initial appointment period is 4 years and Supervisory Board members can be re-appointed twice.
Remuneration for the individual Supervisory Board members
(In thousands) 20199 20189
T. de Swaan1 90 42
S. ten Have2 19 67
A.C. Dorland 75 75
L.J. Griffith3 3
M.P. Lap4 50
F.J. Leeflang5 23 73
J.M. Roobeek6 70 73
J.B.J. Stegmann 78 78
A.M. Storåkers7 43
J.S.T. Tiemstra 78 78
O.L. Zoutendijk8 39
Total 529 525
1 T. de Swaan was appointed as Chairman of the Supervisory Board with effect from 12 July 2018.2 S. ten Have stepped down as member of the Supervisory Board with effect from 24 April 2019.3 L.J. Griffith was appointed as member of the Supervisory Board with effect from 17 December 2019.4 M.P. Lap was appointed as member of the Supervisory Board with effect from 24 April 2019.5 F.J. Leeflang stepped down as a member from the Supervisory Board with effect from 24 April 2019.6 J.M. Roobeek stepped down as member of the Supervisory Board with effect from 17 December 2019.7 A.M. Storåkers was appointed as member of the Supervisory Board with effect from 24 April 2019.8 O.L. Zoutendijk stepped down as Chairman of the Supervisory Board with effect from 5 February 2018 and as member of the Supervisory Board with effect from 1 July 2018.9 Remuneration amounts excluding VAT.
Loans from ABN AMRO to Supervisory Board members
2019 2018
(In thousands)Outstanding
31 December Redemptions Interest rateOutstanding
31 December Redemptions Interest rate
T. de Swaan1 1,407 2.8% 1,407 2.8%
L.J. Griffith2 522 1.8%
J.B.J. Stegmann 500 400 0.1% 900 0.1%
J.M. Roobeek3 1,600 3.0% 1,600 100 3.0%
S. ten Have4 564
1 T. de Swaan was appointed as Chairman of the Supervisory Board with effect from 12 July 2018.2 L.J. Griffith was appointed as member of the Supervisory Board with effect from 17 December 2019.3 J.M. Roobeek stepped down as member of the Supervisory Board with effect from 17 December 2019.4 S. ten Have stepped down as member of the Supervisory Board with effect from 24 April 2019.

ABN AMRO Bank Annual Report 2019
163Leadership & governance / Remuneration report
Executive Board remuneration in 2019The Supervisory Board is responsible for proposing the remuneration policy and principles for the Executive Board and also executes the policy for the Executive Board. The policy and principles are subject to shareholder approval. The fixed remuneration for the Chairman and the three members of ABN AMRO’s Executive Board, all statutory directors, has been set at a level slightly below that of the former CEO and Managing Board members. The Executive Board members’ views were not taken into account in the design of the remuneration policy, given the remuneration restrictions that apply as long as the Dutch State provides support through a shareholding.
In the case of the former Managing Board, ABN AMRO always aimed for a level of compensation slightly below the median of the relevant markets. while using a peer group of companies. This peer group consisted of both financial and non-financial companies in the Netherlands and Europe, against which the remuneration proposals for the former
Managing Board were assessed. In recent years, however, the large number of changes occurring in the banking industry in the Netherlands made it difficult to properly assess board-level remuneration packages, as such changes did not necessarily affect companies in the general industry or the financial industry outside the Netherlands. In 2019, a benchmark comparison was undertaken in order to compare the remuneration of the Executive Board members with relevant markets. The main observation was that ABN AMRO is positioned below median market levels for both base salary and overall direct compensation (i.e. fixed and variable remuneration). The fixed remuneration for members of ABN AMRO’s Executive Committee that has applied since 1 March 2017 is based on the Executive Board members’ salaries and reflects the various responsibilities of the Executive Committee members.
Details of the remuneration of the individual members of the Executive Committee are provided in Note 37 to the Consolidated Annual Financial Statements.
Remuneration for the individual Executive Board members
2019
Base salary
Compensation for lease car
expenses
Benefits from mortgage
interest rateVariable
remuneration6
Total pension related
contributions7
Severance payments Total8
(In thousands)
Post employee
pension (7a)
Short-term allowances
(7b)
C. van Dijkhuizen1 741 38 222 1,001
C.J. Abrahams2 629 38 183 850
C.M. Bornfeld3 629 38 183 850
T.J.A.M. Cuppen4 629 38 183 850
Total 2,628 152 771 3,551
2018
C. van Dijkhuizen 723 37 210 970
C.J. Abrahams2 614 37 173 824
C.M. Bornfeld3 512 31 144 687
T.J.A.M. Cuppen4 614 37 173 824
J. van Hall5 456 1 25 147 157 786
Total 2,919 1 167 847 157 4,091
1 The Executive Board membership for C. van Dijkhuizen will end on 22 April 2020. The labour agreement of C. van Dijkhuizen will end on 31 October 2020. C. van Dijkhuizen will be awarded a severance payment of three months’ gross fixed salary (EUR 189,995) on his departure as per 31 October 2020.
2 C. Abrahams receives a compensation for housing costs (2019: EUR 94 thousand; 2018: EUR 94 thousand) and flight tickets (2019: EUR 13 thousand; 2018: EUR 28 thousand) to his home country which is not included in the base salary.
3 C.M. Bornfeld joined the Executive Board with effect from 1 March 2018 and receives a compensation for housing costs (2019: EUR 132 thousand; 2018: EUR 121 thousand) and flight tickets (2019: EUR 38 thousand of which EUR 25 thousand for previous year; 2018: nil) to his home country which is not included in the base salary.
4 In addition to remuneration T.J.A.M. Cuppen received a benefit of EUR 3 thousand for the personal use of the company car in 2019 and 2018.5 The Executive Board membership for J. van Hall ended on 1 March 2018. As J. van Hall’s employment agreement ended on 1 September 2018, his remuneration relates to the period
up to 1 September 2018. The severance payment was awarded in 2018.6 As a consequence of the Bonus Prohibition Act, the Executive Board members are not entitled to receive variable compensation. This prohibition has applied since the performance year 2011.7 The Executive Board members participate in ABN AMRO Bank’s pension plans for employees in the Netherlands. This participation is not mandatory for Mr C. Abrahams considering his
current non-Dutch tax resident status. Total pension related contributions refer to (7a) the employer contribution to the pension fund (for the CDC pension scheme for pensionable income up to EUR 107,593 (2018: EUR 105,075) and (7b) the arrangement in accordance with the ABN AMRO Collective Labour Agreement (‘ABN AMRO CAO’).
8 In addition to remuneration, Executive Board members are eligible for benefits such as the use of a company car. Only T.J.A.M. Cuppen uses this car for private purposes. Members of the Executive Board may receive compensation for Dutch language classes, private schools for their children and home security.
IntroductionStrategy and perform
anceRisk, funding &
capitalAnnual Financial Statem
ents 2019Other
Leadership & governance

ABN AMRO Bank Annual Report 2019
IntroductionStrategy and perform
anceRisk, funding &
capitalLeadership structure
GovernanceAnnual Financial Statem
entsOther
IntroductionStrategy and perform
anceRisk, funding &
capitalAnnual Financial Statem
ents 2019Other
164
Leadership & governance
Leadership & governance / Remuneration report
Loans from ABN AMRO to Executive Board members
2019 2018
(In thousands)Outstanding
31 December Redemptions Interest rateOutstanding
31 December Redemptions Interest rate
J. van Hall1 69 3.5%
1 Executive Board Membership for J. van Hall ended on 1 March 2018.
Annual fixed remuneration for 2019The annual base salary for the Executive Board members follows developments in the collective labour agreement for the banking industry (CAO Banken). In February 2019, an agreement was reached for the years 2019-2020, providing for two collective salary increases of 2.5% each with effect from 1 January 2019 and 1 January 2020 respectively.
The three members of the Executive Board each earn the same salary, which for 2019 amounted to EUR 629,427 gross per annum. The differential between the salary of the Chairman of the Executive Board, Mr Kees van Dijkhuizen, and the other members is 15%. His salary for 2019 amounted to EUR 741,442 gross per annum.
The Chairman of the Executive Board’s salary for 2020 will be EUR 759,978 gross, while the members of the Executive Board will each receive an annual salary of EUR 645,163 gross.
Variable remunerationThe remuneration package for members of the Executive Board provides for a variable compensation component. However, the prohibition on bonuses, which became effective in 2011 and was incorporated into Article 1:128 of the Financial Supervision Act on 7 February 2015, does not allow payment of such compensation to board members of financial institutions falling under the scope of the Financial Supervision Act during the period the Dutch State provides support through a shareholding in the institution. The members of the Executive Board are therefore not entitled to receive variable remuneration during the period of state ownership. As this continued to be the case in the 2019 performance year, Executive Board members consequently did not participate in the variable compensation plan applying to all Identified Staff within ABN AMRO.
BenefitsThe Chairman and members of the Executive Board participate in ABN AMRO’s pension schemes applicable to all employees in the Netherlands, whereby it should be noted that Mr Clifford Abrahams is not a Dutch tax resident. For pensionable salary up to the applicable threshold, which for 2019 amounted to EUR 107,593, a collective defined contribution (CDC) pension scheme applies. The standard retirement age is aligned to the date on which the Executive Board members will be eligible for Dutch State old-age pensioen (AOW), while the average pension accrual is 1.875% and the employee pension contribution is 5.5%. For pensionable salary in excess of EUR 107,593, employees receive an allowance that can be used to build up a net pension in a defined contribution (DC) plan. The allowance amounted to 35% in 2019 and is reset annually, based on the year-end interest rate in the preceding calendar year. In addition to pension benefits, Executive Board members are eligible for benefits such as a company car and a chauffeur.
Severance The remuneration policy for Executive Board members provides for a severance payment up to a maximum of one year’s gross salary in the event their employment contract is terminated at ABN AMRO’s initiative. The current Executive Board members all have the same contractual right to a severance payment equal to three months’ gross fixed salary. Mr van Dijkhuizen will be awarded a severance payment equivalent to three months’ gross fixed salary upon his departure in 2020.
Contractual Relation and Appointment periodThe appointment term for Executive Board members is, in principle, set at four years. Mr van Dijkhuizen was appointed CEO and Chairman on 1 January 2017. Mr Clifford Abrahams was appointed an Executive Board member and CFO on 1 September 2017 and has acted as Vice-Chairman since 1 March 2018. Ms Tanja Cuppen was appointed an Executive Board member on 1 October 2017 and became CRO on 1 November 2017. Mr Christian Bornfeld was appointed an Executive Board member and CI&TO on 1 March 2018. The appointment terms for all current Executive Board members have been contractually agreed to be three years, with the appointment ending at the closing of the first Annual General Meeting held after three years have passed since their appointment date. Reappointment is possible.
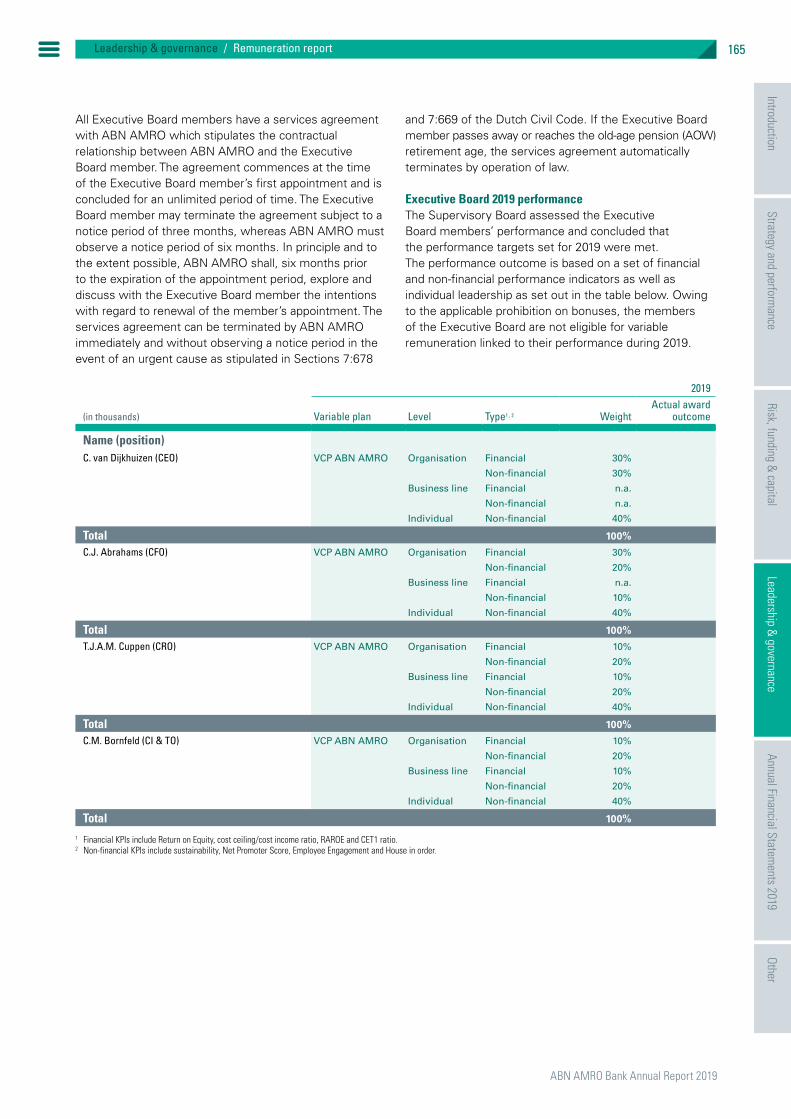
ABN AMRO Bank Annual Report 2019
165Leadership & governance / Remuneration report
All Executive Board members have a services agreement with ABN AMRO which stipulates the contractual relationship between ABN AMRO and the Executive Board member. The agreement commences at the time of the Executive Board member’s first appointment and is concluded for an unlimited period of time. The Executive Board member may terminate the agreement subject to a notice period of three months, whereas ABN AMRO must observe a notice period of six months. In principle and to the extent possible, ABN AMRO shall, six months prior to the expiration of the appointment period, explore and discuss with the Executive Board member the intentions with regard to renewal of the member’s appointment. The services agreement can be terminated by ABN AMRO immediately and without observing a notice period in the event of an urgent cause as stipulated in Sections 7:678
and 7:669 of the Dutch Civil Code. If the Executive Board member passes away or reaches the old-age pension (AOW) retirement age, the services agreement automatically terminates by operation of law.
Executive Board 2019 performanceThe Supervisory Board assessed the Executive Board members’ performance and concluded that the performance targets set for 2019 were met. The performance outcome is based on a set of financial and non-financial performance indicators as well as individual leadership as set out in the table below. Owing to the applicable prohibition on bonuses, the members of the Executive Board are not eligible for variable remuneration linked to their performance during 2019.
2019
(in thousands) Variable plan Level Type1 , 2 WeightActual award
outcome
Name (position)C. van Dijkhuizen (CEO) VCP ABN AMRO Organisation Financial 30%
Non-financial 30%
Business line Financial n.a.
Non-financial n.a.
Individual Non-financial 40%
Total 100%
C.J. Abrahams (CFO) VCP ABN AMRO Organisation Financial 30%
Non-financial 20%
Business line Financial n.a.
Non-financial 10%
Individual Non-financial 40%
Total 100%
T.J.A.M. Cuppen (CRO) VCP ABN AMRO Organisation Financial 10%
Non-financial 20%
Business line Financial 10%
Non-financial 20%
Individual Non-financial 40%
Total 100%
C.M. Bornfeld (CI & TO) VCP ABN AMRO Organisation Financial 10%
Non-financial 20%
Business line Financial 10%
Non-financial 20%
Individual Non-financial 40%
Total 100%
1 Financial KPIs include Return on Equity, cost ceiling/cost income ratio, RAROE and CET1 ratio. 2 Non-financial KPIs include sustainability, Net Promoter Score, Employee Engagement and House in order.
IntroductionStrategy and perform
anceRisk, funding &
capitalAnnual Financial Statem
ents 2019Other
Leadership & governance

ABN AMRO Bank Annual Report 2019
IntroductionStrategy and perform
anceRisk, funding &
capitalLeadership structure
GovernanceAnnual Financial Statem
entsOther
IntroductionStrategy and perform
anceRisk, funding &
capitalAnnual Financial Statem
ents 2019Other
166
Leadership & governance
Leadership & governance / Remuneration report
Annual remuneration development Executive Board membersThe table below shows the development of the annual remuneration development of Executive Board members. The table shows how changes in annual remuneration relate to last year, to the performance of the bank and
the development of average employee remuneration. The column absolute change shows the difference in the indicator over two periods in time, while the relative column shows the increase or decrease as a percentage.
Development of annual remuneration 2014 - 2015 2015 - 2016 2016 - 2017 2017 - 2018 2018 - 2019
Reporting year
(in thousands) Function Absolute Relative Absolute Relative Absolute Relative Absolute Relative Absolute Relative 2019
ExBoC. van Dijkhuizen1 CEO 976 n.a. -6 -1% 31 3% 1,001
C. van Dijkhuizen CFO 7 1% 26 3% -825 n.a.
G. Zalm2 CEO -12 -1% 34 3% -991 n.a. -93 n.a.
C.J. Abrahams3 CFO 277 n.a. 547 n.a. 26 3% 850
T.J.A.M. Cuppen4 CRO 207 n.a. 617 n.a. 26 3% 850
W. Reehoorn5 CRO 36 4% 27 3% 663 n.a. -1,530 n.a.
C.M. Bornfeld6 CI&TO 687 n.a. 163 n.a. 850
J. van Hall7 COO 38 5% 27 3% 26 3% -107 n.a. -786 n.a.
C.E. Princen8 PR&I 12 1% 664 n.a. -1,504 n.a.
C.F.H.H. Vogelzang9 R&PB 34 4% 27 3% -224 n.a. -643 n.a.
J.G. Wijn1 0 CB 9 1% 27 3% -569 n.a. -298 n.a.
Company performance
(underlying) Profit 373 24% 152 8% 715 34% -441 -16% -304 -13% 2,046
(underlying) Cost/Income ratio 1.6% 3% 4.1% 7% -5.8% -9% -1.3% -2% 2.4% 4% 61.2%
(underlying) Return on Equity 1.1% 10% -0.2% -2% 2.7% 23% -3.1% -21% -1.4% -12% 10.0%
Average employee remuneration -9 -9% 2 2% 3 3% 3 3% 3 3% 104
1 C. van Dijkhuizen succeeded G. Zalm as CEO as of 1 January 2017.2 The Managing Board membership for G. Zalm ended on 1 January 2017. G. Zalm’s employment agreement ended on 1 February 2017.3 C.J. Abrahams joined the Executive Board on 1 September 2017.4 T.J.A.M. Cuppen joined the Executive Board on 1 October 2017.5 The Executive Board membership for W. Reehoorn ended on 1 November 2017. As W. Reehoorn’s employment agreement ended on 1 July 2018, his remuneration relates to the period
up to 1 July 2018. The severance payment was awarded in 2017.6 C.M. Bornfeld joined the Executive Board on 1 March 2018.7 The Executive Board membership for J. van Hall ended on 1 March 2018. As J. van Hall’s employment agreement ended on 1 September 2018, his remuneration relates to the period
up to 1 September 2018. The severance payment was awarded in 2018.8 The Managing Board membership for C.E. Princen ended on 1 January 2017. The labour agreement of C.E. Princen ended on 1 July 2017. Remuneration in 2016 includes the period
up to 1 July 2017. The severance payment was awarded in 2016.9 C.F.H.H. Vogelzang stepped down as Managing Board member on 6 February 2017. The employment agreement of C.F.H.H. Vogelzang ended on 1 September 2017.10 J.G. Wijn stepped down as Managing Board member on 18 January 2017. The employment agreement of J.G. Wijn ended on 1 May 2017.
Identified Staff remunerationRemuneration restrictions apply not only to the Executive Board, but also to staff whose professional activities could have a material impact on the bank’s risk profile (‘Identified Staff’). Within ABN AMRO, the group of Identified Staff consists of:
Å Members of the Executive and Supervisory Boards; Å Members of the Executive Committee, not being member of the Executive Board;
Å Members who fulfil an Executive Committee 1 or 2 position at above-CLA level;
Å Staff responsible for independent control functions; Å Other risk takers. The definition of the group of other risk takers follows from their impact on the economic capital of ABN AMRO (EC threshold), membership of certain risk committees, having credit authority above a certain threshold and fulfilling specific roles;
Å Other employees whose total remuneration puts them in the same remuneration bracket as senior managers and risk takers.
Composition of remuneration packagesIn general, the remuneration packages for Identified Staff have been structured in accordance with regulations and restrictions applying to the financial sector. A typical remuneration package for Identified Staff consists of the following components:
Å Annual base salary; Å Annual variable remuneration (with deferred payout in alignment with ABN AMRO’s variable compensation plan);
Å Benefits and other entitlements.

ABN AMRO Bank Annual Report 2019
167Leadership & governance / Remuneration report
ABN AMRO strives to position the overall level of direct compensation for Executive Committee members and Executive Committee 1 and 2 positions just below the market median levels. In alignment with the Act on the Remuneration Policy for Financial Undertakings (Wbfo), which came into force in 2015, the variable compensation for this group of employees is capped at 20% of base salary for those employed in the Netherlands. In addition and also with effect from 2015, all other remuneration restrictions, including the prohibition on bonuses, were extended to a specific group of senior employees as defined in the Wbfo. These senior employees, comprising Executive Committee members who are not at the same time statutory directors, are therefore not allowed to be granted any variable remuneration until the Dutch State no longer holds an interest in ABN AMRO.
ABN AMRO’s collective labour agreement (CLA) governs the remuneration packages for Identified Staff based in the Netherlands unless they have been appointed to a position not governed by the CLA, such as the Executive Committee 1 and Executive Committee 2 groups of employees. For Identified Staff based outside the Netherlands, ABN AMRO takes into account relevant business dynamics (e.g. market conditions, local labour
and tax legislation) when deciding on the composition of their reward packages. For the latter two categories of employees, the overall direct compensation is aimed to be positioned around the median levels in the relevant market. The maximum variable compensation percentage for employees working outside the Netherlands in another European Economic Area (‘EEA’) state is 100%; for employees working outside the EEA more than 100% is allowed, with a maximum of 200% and subject to shareholder approval. These percentages are in line with the international market environment in which we operate.
Until 14 December 2018, special plans were in place for certain key investment professionals within Private Equity. These professionals were able to participate in private equity funds for which separate performance-related incentives (‘carried interest’) had been agreed upon. Due to the sale of the Private Equity business in 2018, the carried interest schemes no longer exist at ABN AMRO.
Performance is measured over a one-year performance period at three levels: group, business unit and individual level, and by means of (partly) risk-adjusted financial and non-financial performance indicators.
Performance indicators for Identified Staff
Weighting Executive Board5
Weighting Executive Committee
Weighting above CLA identified staff
Weighting CLA identified staff
Organisation level KPIs 30-60% 20-30% 20% 10%
Businessline level KPIs 0-30% 30-50% 40-50% 15%
Individual KPI1 40% 30-40% 30-40% 75%
Total 100% 100% 100% 100%- of which financial 2 , 3 20-30% 20-30% 15-30% 0-50%
- of which non-financial 3 , 4 70-80% 70-80% 70-85% 50-100%
1 Individual KPI: For employees above CLA the individual KPI refers to leadership.2 Financial KPIs include Return on Equity, cost ceiling/cost income ratio, RAROE and CET1 ratio. 3 Non-financial KPIs include sustainability, Net Promoter Score, Employee Engagement and House in order.4 Mix and weighting of KPIs tailored to specific function of the identified staff member.5 The CEO only has KPIs on Individual and Organisation level.
Variable remuneration for Identified StaffAll variable remuneration awards for Identified Staff are subject to and structured in accordance with ABN AMRO’s variable compensation plan. Before any variable remuneration is granted, ABN AMRO applies an ex-ante risk assessment consisting of collective quantitative risk adjustment mechanisms (such as the solvency check) and a qualitative individual check (the gatekeeper). The gatekeeper procedure is part of the performance management framework and provides for an assessment of each individual Identified Staff member by the control functions (Risk, Compliance and Audit) on the basis of several behavioural elements.
This assessment results in advice to the Executive Board, which ultimately decides on whether variable compensation can indeed be granted to the Identified Staff member concerned. The Executive Board’s decision must be formally approved by the Supervisory Board, based on the advice of the Remuneration Committee. The variable remuneration is awarded over time and split between an up-front portion (60%) and a deferred portion (40%), with all portions divided equally between a cash and a non-cash instrument, as shown in the following chart.
IntroductionStrategy and perform
anceRisk, funding &
capitalAnnual Financial Statem
ents 2019Other
Leadership & governance

ABN AMRO Bank Annual Report 2019
IntroductionStrategy and perform
anceRisk, funding &
capitalLeadership structure
GovernanceAnnual Financial Statem
entsOther
IntroductionStrategy and perform
anceRisk, funding &
capitalAnnual Financial Statem
ents 2019Other
168
Leadership & governance
Leadership & governance / Remuneration report
20
40
60
80
100
100
20
20
30
30
Variable remuneration(in %)
t=1 t=2 t=3 t=4 t=5 t=6 Total
Up-front cash1
Up-front non-cash1, 3 Deferred non-cash2, 3
Deferred cash2
1 The up-front payment (60% in total) is awarded in March following the relevant performance year.2 The deferred award (40% in total) vests in three separate tranches respectively 1, 2 and 3 years after the end of the relevant performance year. 3 All non-cash awards are subject to a two-year retention period.
Once the variable compensation amounts have been awarded, they are divided into cash and non-cash parts, and upfront and deferred parts. Up-front variable remuneration is awarded in the first quarter of the year following the relevant performance year, while deferred variable remuneration vests in equal instalments in the three years following the first payment. This remuneration vests only after an explicit ex-post risk assessment: the ‘malus assessment’.
The Supervisory Board approved the new variable compensation plan, which was updated to reflect changes in the non-cash instrument, on 14 May 2019. Since the awards reflecting the 2016 performance year, the instrument underlying the non-cash award has consisted of an award in the form of a depositary receipt (DR) award, which is a conditional right to receive DRs. One DR represents one share in ABN AMRO. The number of DRs to be awarded is calculated on the basis of the fair market value, which is equivalent to the average of the closing prices of the DRs as reported on the composite tape for securities at Euronext for the period of five trading days preceding the award date, which would normally be the first Thursday of March. The value therefore fluctuates in line with the market price of the DRs and its use will result in an increased alignment between remuneration and shareholder value for all employees participating in the variable compensation plan.
Variable income awards with respect to the performance years up to and including 2015 will continue to use performance certificates, the value of which fluctuates in line with the net asset value of ABN AMRO.
A two-year retention period applies to the non-cash instruments. Any unconditional instrument will therefore need to be retained for a further two years.
The malus assessment is conducted by the Risk, Compliance, HR, Finance and Audit control functions, and any outcome is subject to approval by the Executive Board and Supervisory Board. The assessment includes determining whether any new information is available that prevents the vesting of deferred remuneration.
This could include: Å Evidence of misconduct or serious error by the staff member (e.g. breach of a code of conduct or other internal rules, especially concerning risks);
Å The institution or the business unit subsequently suffers a significant downturn in its financial performance (specific indicators must be used);
Å The institution or the business unit in which the Identified Staff member works suffers a significant failure of risk management;
Å Significant changes in the institution’s economic or regulatory capital base.
The Supervisory Board decided that, based on the reassessment performed by the control functions, there was no reason to apply a collective malus with respect to the vesting of:
Å The first tranche of deferred variable compensation for the 2018 performance period;
Å The second tranche of deferred variable compensation for the 2017 performance period;
Å The third tranche of deferred variable compensation for the 2016 performance period.
The Supervisory Board decided in six individual cases to apply a malus with respect to the vesting of any remaining deferred variable compensation for the 2016 and 2017 performance period, which affects two employees for a total outstanding amount of EUR 26 thousand.
The other deferred variable compensation awards with respect to the above three performance years will now be granted to the relevant Identified Staff members in line with the rules of the bank’s variable compensation plan.
The Supervisory Board has the discretionary power to reduce any variable compensation to a suitable amount if, in its opinion, payment of the compensation would be unacceptable under the principle of reasonableness and fairness. The Supervisory Board is also authorised to reclaim any variable remuneration for any performance period if the award, calculation or payment was based on incorrect data or if, in hindsight, the performance conditions were not achieved. The recipient will then be required to repay the relevant amount to the bank.
Lastly, personal hedging or insurance linked to remuneration and liability in order to circumvent the risk control effects that have been embedded in the bank’s variable compensation plan is not permitted.

ABN AMRO Bank Annual Report 2019
169Leadership & governance / Remuneration report
Details of remunerationRemuneration comprises fixed and variable compensation, employer pension contributions, sign-on, and retention and severance pay for 2019.
Remuneration details of Identified Staff
2019 2018
Number of FTEs (Identified Staff)2
Aggregated remuneration
(in thousands)Number of FTEs
(Identified Staff)2
Aggregated remuneration
(in thousands)
Retail Banking 29 7,790 32 9,203
Commercial Banking 38 9,809 48 12,316
Private Banking 37 12,426 40 15,848
Corporate & Institutional Banking 93 36,838 108 41,982
Group Functions1 158 40,890 143 42,271
Total 355 107,753 371 121,619
1 Executive and Supervisory Board members are reported under Group Functions.2 The number of FTEs includes all employees that were Identfied Staff during the year (including leavers).
Number of FTEs (identified staff)
Aggregated remuneration (in thousands)
ExBo, ExCo, ExCo1 and ExCo2 Other
Fixed remuneration over 2019 145 210 98,810
Variable remuneration over 20191 88 96 8,943
- of which in cash 2,686
- of which in non-cash instruments2 2,682
- of which unconditional (up-front payment) 5,368
- of which conditional (deferred payment) 3,575
Retention payments over 2019 2 53
Sign on payments over 2019 1 2 360
Severance payments over 20193 9 1 2,811
1 Certain variable compensation elements are, due to their specific nature, paid out in cash and are not or only partially subject to deferral.2 The non-cash instruments are performance certificates and as from 2016 depositary receipts. 3 Highest severance pay amounted EUR 436 thousand.
As at the end of 2019 the following non-cash awards exist, reflecting the performance years 2016-2018 and every depositary receipt representing its fair value in alignment with the ABN AMRO Variable Compensation Plan.
(In thousands of DRs) 31 December 2019
Outstanding at 1 JanuaryGranted on appoval date 701
Granted during the year 295
Forfeited during the year 12
Paid out during the year cash 224
Paid out during the year DRs 9
Less: total paid out/forfeited -245
Outstanding at end of period 751
IntroductionStrategy and perform
anceRisk, funding &
capitalAnnual Financial Statem
ents 2019Other
Leadership & governance

ABN AMRO Bank Annual Report 2019
IntroductionStrategy and perform
anceRisk, funding &
capitalLeadership structure
GovernanceAnnual Financial Statem
entsOther
IntroductionStrategy and perform
anceRisk, funding &
capitalAnnual Financial Statem
ents 2019Other
170
Leadership & governance
Leadership & governance / Remuneration report
Remuneration details of all employees
Remuneration in millions2
(in FTE) 1-1.5 1.5-2 2-2.5 2.5-3 3-3.5 3.5-4 4-4.5 >4.5
Retail BankingCommercial BankingPrivate BankingCorporate & Institutional BankingGroup Functions1 1
1 Executive and Supervisory Board members are reported under Group Functions.2 Remuneration reflects the amounts paid in the financial year as per EBA requirement, as opposed to the remuneration disclosure in the tables Remuneration of Executive Board and
Supervisory Board which represents the remuneration allocated to the financial year in accordance with EU IFRS.
The variable remuneration awarded to all employees including Identified Staff for 2019 amounted to EUR 9 million.
Remuneration in millions1
(in FTE) 1-1.5 1.5-2 2-2.5 2.5-3 3-3.5 3.5-4 4-4.5 >4.5
Executive Board / Executive Committee 1
Executive Committee -1 and -2 above CLAOther Identified Staff
1 Remuneration reflects the amounts paid in the financial year as per EBA requirement, as opposed to the remuneration disclosure in the tables Remuneration of Executive Board and Supervisory Board which represents the remuneration allocated to the financial year in accordance with EU IFRS.
The ratio of the mean annual employee compensation and the total annual remuneration of the CEO was 9.6 in 2019, the same as in 2018. The ratio is equivalent to the CEO’s remuneration, including pension costs, divided by the mean employee remuneration and pension costs for the average number of employees during 2019. This ratio is considered to be a fair reflection of ABN AMRO’s current position. The ratios published in 2016, 2017 and 2018 were 11.4 and 10 and 9.6 respectively.

ABN AMRO Bank Annual Report 2019
171
Annual Financial Statements 2019Consolidated income statement 172
Consolidated statement of comprehensive income 173
Consolidated statement of financial position 174
Consolidated statement of changes in equity 175
Consolidated statement of cash flows 177
Notes to the Consolidated Annual Financial Statements 1791 Accounting policies 1792 Segment reporting 1873 Overview of financial assets
and liabilities by measurement base 1944 Net interest income 1955 Net fee and commission income 1966 Net trading income 1997 Other operating income 1998 Personnel expenses 2009 General and administrative expenses 20110 Income tax expense, tax assets and tax liabilities 20211 Earnings per share 20712 Cash and balances at central banks 20713 Financial assets and liabilities held for trading 20814 Derivatives 20915 Hedge accounting 21116 Financial investments 217
17 Securities financing 21918 Fair value of financial instruments carried at fair value 22019 Loans and advances banks 22620 Loans and advances customers 22621 Fair value of financial instruments
not carried at fair value 22722 Bank structure 22923 Property and equipment, leases,
goodwill and other intangible assets 23524 Non-current assets and disposal groups held for sale 24025 Other assets 24026 Due to banks 24127 Due to customers 24128 Issued debt and subordinated liabilities 24229 Provisions 24430 Pension and other employee benefits 24631 Other liabilities 24932 Equity attributable to owners of the parent company 24933 Transferred, pledged, encumbered
and restricted assets 25034 Commitments and contingent liabilities 25335 Remuneration of Executive Board
and Supervisory Board 25736 Share-based payment 25837 Related parties 25938 Post balance sheet events 262
Authorisation of the Consolidated Annual Financial Statements 262
Company Financial Statements of ABN AMRO Bank N.V. 263
Certain IFRS disclosures in the Risk, funding & capital section are labelled as ‘Audited’ in the respective headings. These disclosures are an integral part of these Annual Financial Statements and are covered by the Audit opinion.
IntroductionStrategy and perform
anceRisk, funding &
capitalLeadership &
governanceOther
Annual Financial Statements 2019
Annual Financial Statements 2019

ABN AMRO Bank Annual Report 2019
IntroductionStrategy and perform
anceRisk, funding &
capitalLeadership structure
GovernanceAnnual Financial Statem
entsOther
IntroductionStrategy and perform
anceRisk, funding &
capitalLeadership &
governanceOther
172
Annual Financial Statements 2019
Annual Financial Statements 2019
Consolidated income statement(in millions) Note 2019 2018
IncomeInterest income calculated using the effective interest method1 9,701 10,007
Other interest and similar income1 355 317
Interest expense calculated using the effective interest method1 3,407 3,590
Other interest and similar expense1 181 140
Net interest income 4 6,468 6,593Fee and commission income1 2,121 2,174
Fee and commission expense1 489 475
Net fee and commission income 5 1,632 1,699Net trading income 6 84 173
Share of result in equity accounted investments 37 43
Other operating income 7 383 584
Operating income 8,605 9,093
ExpensesPersonnel expenses 8 2,247 2,441
General and administrative expenses 9 2,781 2,737
Depreciation and amortisation of tangible and intangible assets 23 240 173
Operating expenses 5,268 5,351Impairment charges on financial instruments 657 655
Total expenses 5,925 6,006
Profit/(loss) before taxation 2,680 3,086Income tax expense1 10 634 736
Profit/(loss) for the period1 2,046 2,350
Attributable to:Owners of the parent company1 2,046 2,312
Non-controlling interests 39
Earnings per share (in euros)Basic earnings per ordinary share2 , 3 11 2.06 2.35
1 Comparative figures for 2018 have been restated. Please refer to Note 1 Accounting policies in the Consolidated Annual Financial Statements.2 Earnings per share consist of profit for the period excluding results attributable to non-controlling interests and payments to holders of AT1 instruments divided by the average outstanding
and paid-up ordinary shares.3 As a result of the merger of ABN AMRO Group N.V. and ABN AMRO Bank N.V. the numbers of shares have been adjusted for comparison reasons by aligning the number of shares
of ABN AMRO Bank N.V. to the number of shares of ABN AMRO Group N.V. Please refer to Note 1 Accounting policies in the Consolidated Annual Financial Statements.
Consolidated Annual Financial Statements 2019

ABN AMRO Bank Annual Report 2019
173Annual Financial Statements 2019
Consolidated statement of comprehensive income(in millions) 2019 2018
Profit/(loss) for the period1 2,046 2,350
Other comprehensive income:Items that will not be reclassified to the income statementRemeasurement gains/(losses) on defined benefit plans -17 20
(Un)realised gains/(losses) on Liability own credit risk 5 28
Share of other comprehensive income of associates not reclassified to the income statement -115
Items that will not be reclassified to the income statement before taxation -12 -67Income tax relating to items that will not be reclassified to the income statement -1 13
Items that will not be reclassified to the income statement after taxation -10 -81Items that may be reclassified to the income statement(Un)realised gains/(losses) currency translation 76 41
(Un)realised gains/(losses) fair value through OCI -155 -223
(Un)realised gains/(losses) cash flow hedge -650 -225
Share of other comprehensive income of associates reclassified to the income statement 17 -22
Items that may be reclassified to the income statement before taxation -711 -429Income tax relating to items that may be reclassified to the income statement -209 -39
Items that may be reclassified to the income statement after taxation -502 -390
Total comprehensive income/(expense) for the period after taxation1 1,533 1,880
Attributable to:Owners of the parent company1 1,533 1,841
Non-controlling interests 39
1 Comparative figures for 2018 have been restated. Please refer to Note 1 Accounting policies in the Consolidated Annual Financial Statements.
IntroductionStrategy and perform
anceRisk, funding &
capitalLeadership &
governanceOther
Annual Financial Statements 2019

ABN AMRO Bank Annual Report 2019
IntroductionStrategy and perform
anceRisk, funding &
capitalLeadership structure
GovernanceAnnual Financial Statem
entsOther
IntroductionStrategy and perform
anceRisk, funding &
capitalLeadership &
governanceOther
174
Annual Financial Statements 2019
Annual Financial Statements 2019
Consolidated statement of financial position(in millions) Note 31 December 2019 31 December 2018
AssetsCash and balances at central banks1 12 27,061 35,716
Financial assets held for trading 13 1,137 495
Derivatives 14 5,730 6,191
Financial investments 16 45,277 42,184
Securities financing 17 14,905 12,375
Loans and advances banks1 19 5,011 6,780
Residential mortgages 20 150,880 150,784
Consumer loans 20 11,997 11,945
Corporate loans at amortised cost 20 97,672 100,408
Corporate loans at fair value through P&L 20 1,261 783
Other loans and advances customers 20 6,292 6,966
Equity accounted investments 22 639 522
Property and equipment 23 1,706 1,506
Goodwill and other intangible assets 23 178 164
Assets held for sale 24 14 56
Tax assets 10 764 516
Other assets 25 4,530 3,904
Total assets 375,054 381,295
LiabilitiesFinancial liabilities held for trading 13 675 253
Derivatives 14 6,505 7,159
Securities financing 17 8,234 7,407
Due to banks 26 12,785 13,437
Current accounts 27 91,900 84,192
Demand deposits2 27 120,892 126,063
Time deposits2 27 21,232 25,058
Other due to customers 27 967 810
Issued debt 28 75,275 80,784
Subordinated liabilities 28 10,041 9,805
Provisions 29 983 1,204
Liabilities held for sale 24 41
Tax liabilities 10 63 36
Other liabilities 31 4,030 3,686
Total liabilities 353,582 359,935
EquityShare capital 940 800
Share premium 12,970 4,041
Other reserves (incl. retained earnings/profit for the period) 6,993 15,437
Accumulated other comprehensive income -1,419 -906
AT1 capital securities 1,987 1,986
Equity attributable to owners of the parent company 21,471 21,357Equity attributable to non-controlling interests 2
Total equity 32 21,471 21,360
Total liabilities and equity 375,054 381,295
Committed credit facilities 34 54,673 61,166
Guarantees and other commitments 34 17,479 15,241
1 ABN AMRO has reclassified EUR 1.3 billion from loans and advances banks to cash and balances at central banks in the comparative figures for 2018. Please refer to Note 1 Accounting policies in the Consolidated Annual Financial Statements.
2 ABN AMRO has reclassified EUR 2.0 billion from time deposits to demand deposits in the comparative figures for 2018. Please refer to Note 1 Accounting policies in the Consolidated Annual Financial Statements.

ABN AMRO Bank Annual Report 2019
175Annual Financial Statements 2019
Consolidated statement of changes in equity
(in millions)Share
capitalShare
premium
Other reserves including retained
earnings1
Accumulated other com-prehensive
income
Net profit/(loss) attributable
to owners of the parent company1
AT1 Capital
securities Total
Non-con-trolling
interestsTotal
equity
Balance at 1 January 2018 800 4,041 11,811 -435 2,788 1,987 20,991 20 21,011Total comprehensive income -471 2,312 1,841 39 1,880
Transfer 2,788 -2,788
Dividend -1,363 -1,363 -10 -1,373
Increase/(decrease) of capitalPaid interest on AT1 capital securities -103 -103 -103
Other changes in equity -7 -7 -47 -54
Balance at 31 December 2018 800 4,041 13,125 -906 2,312 1,986 21,357 2 21,360
Total comprehensive income -513 2,046 1,533 1,533
Transfer 2,312 -2,312
Dividend -1,316 -1,316 -1,316
Increase/(decrease) of capital 1 1 1
Paid interest on AT1 capital securities -105 -105 -105
Capital restucturing 140 8,929 -9,069
Other changes in equity 1 1 -2 -2
Balance at 31 December 2019 940 12,970 4,947 -1,419 2,046 1,987 21,471 21,471
1 Comparative figures for 2018 have been restated. Please refer to Note 1 Accounting policies in the Consolidated Annual Financial Statements.
On 29 June 2019, the merger between ABN AMRO Bank N.V. and ABN AMRO Group N.V. was completed. Before completion of the merger, ABN AMRO Bank N.V. made a payment of EUR 9,069 million from its retained earnings to ABN AMRO Group N.V., and ABN AMRO Group N.V. contributed the same amount to ABN AMRO Bank N.V.’s share premium. Consequently, ABN AMRO Bank N.V.’s retained earnings decreased by EUR 9,069 million and its share premium increased by the same amount.
Every shareholder of ABN AMRO Group N.V. received one share in ABN AMRO Bank N.V. As the number of shares outstanding at ABN AMRO Group N.V. was 140 million higher, ABN AMRO Bank N.V. issued 140 million additional shares of EUR 1 each. These shares were funded out of the share premium. As a result of these transactions, the equity components of ABN AMRO Bank N.V. match the pre-merger equity components of ABN AMRO Group N.V.
As a result of the IAS 12 amendments which were part of the Annual Improvements Cycle 2015-2017, tax on dividends of equity instruments are no longer presented in equity but in the income statement as part of the current income tax expense. As of 2019, due to a change in tax regulation, the payment of AT1 Capital security interest is no longer deductible. For additional information, please refer to Note 1 Accounting policies in the Consolidated Annual Financial Statements.
IntroductionStrategy and perform
anceRisk, funding &
capitalLeadership &
governanceOther
Annual Financial Statements 2019
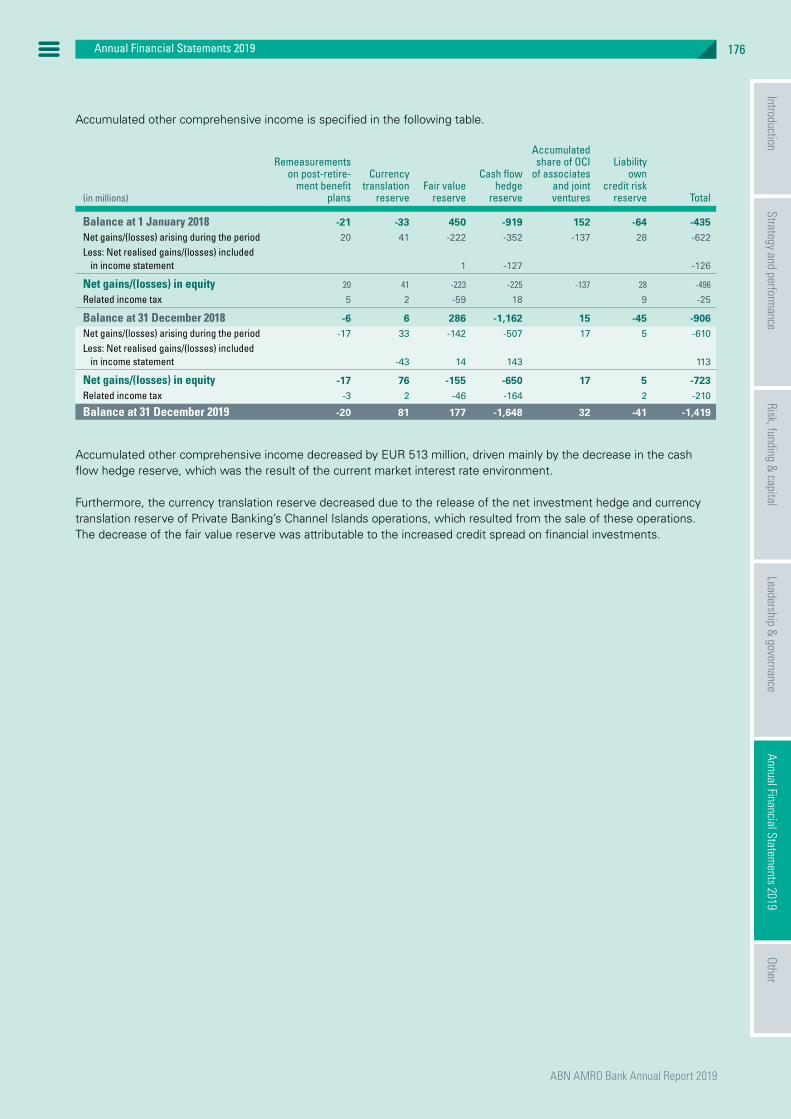
ABN AMRO Bank Annual Report 2019
IntroductionStrategy and perform
anceRisk, funding &
capitalLeadership structure
GovernanceAnnual Financial Statem
entsOther
IntroductionStrategy and perform
anceRisk, funding &
capitalLeadership &
governanceOther
176
Annual Financial Statements 2019
Annual Financial Statements 2019
Accumulated other comprehensive income is specified in the following table.
(in millions)
Remeasurements on post-retire-
ment benefit plans
Currency translation
reserveFair value
reserve
Cash flow hedge
reserve
Accumulated share of OCI
of associates and joint ventures
Liability own
credit risk reserve Total
Balance at 1 January 2018 -21 -33 450 -919 152 -64 -435Net gains/(losses) arising during the period 20 41 -222 -352 -137 28 -622
Less: Net realised gains/(losses) included in income statement 1 -127 -126
Net gains/(losses) in equity 20 41 -223 -225 -137 28 -496
Related income tax 5 2 -59 18 9 -25
Balance at 31 December 2018 -6 6 286 -1,162 15 -45 -906Net gains/(losses) arising during the period -17 33 -142 -507 17 5 -610
Less: Net realised gains/(losses) included in income statement -43 14 143 113
Net gains/(losses) in equity -17 76 -155 -650 17 5 -723Related income tax -3 2 -46 -164 2 -210
Balance at 31 December 2019 -20 81 177 -1,648 32 -41 -1,419
Accumulated other comprehensive income decreased by EUR 513 million, driven mainly by the decrease in the cash flow hedge reserve, which was the result of the current market interest rate environment.
Furthermore, the currency translation reserve decreased due to the release of the net investment hedge and currency translation reserve of Private Banking’s Channel Islands operations, which resulted from the sale of these operations. The decrease of the fair value reserve was attributable to the increased credit spread on financial investments.

ABN AMRO Bank Annual Report 2019
177Annual Financial Statements 2019
(in millions) Note 2019 2018
Profit/(loss) for the period1 2,046 2,350
Adjustments on non-cash items included in profit:(Un)realised gains/(losses) 1,630 495
Share of profits in associates and joint ventures -38 -45
Depreciation, amortisation and accretion 501 303
Provisions and impairment losses 964 994
Income tax expense1 6 634 736
Tax movements other than taxes paid & income taxes -52 -99
Operating activitiesChanges in:- Assets held for trading -640 1,108
- Derivatives - assets 24 2,999
- Securities financing - assets -2,367 3,734
- Loans and advances banks2 49 -1,018
- Residential mortgages -281 1,733
- Consumer loans 58 -43
- Corporate loans 1,958 818
- Other loans and advances customers 723 464
- Other assets -650 -2,692
- Liabilities held for trading 418 -830
- Derivatives - liabilities -623 -1,116
- Securities financing - liabilities 745 -4,246
- Due to banks -630 -2,922
- Due to customers 819 1,554
Net changes in all other operational assets and liabilities -1,101 -1,767
Dividend received from associates and private equity investments 75 310
Income tax paid -645 -635
Cash flow from operating activities 3,617 2,187
Consolidated statement of cash flows
continued >
IntroductionStrategy and perform
anceRisk, funding &
capitalLeadership &
governanceOther
Annual Financial Statements 2019

ABN AMRO Bank Annual Report 2019
IntroductionStrategy and perform
anceRisk, funding &
capitalLeadership structure
GovernanceAnnual Financial Statem
entsOther
IntroductionStrategy and perform
anceRisk, funding &
capitalLeadership &
governanceOther
178
Annual Financial Statements 2019
Annual Financial Statements 2019
(in millions) Note 2019 2018
Investing activitiesPurchases of financial investments -9,283 -13,741
Proceeds from sales and redemptions of financial investments 7,042 12,403
Acquisition of subsidiaries (net of cash acquired), associates and joint ventures 22 435 -129
Divestments of subsidiaries (net of cash sold), associates and joint ventures 22 -1,179 324
Purchases of property and equipment -338 -396
Proceeds from sales of property and equipment 104 125
Purchases of intangible assets -45 -23
Proceeds from sales of intangible assets 1
Cash flow from investing activities -3,264 -1,436
Financing activities:Proceeds from the issuance of debt 28 27,437 40,196
Repayment of issued debt 28 -35,555 -36,396
Proceeds from subordinated liabilities issued 28 19
Repayment of subordinated liabilities issued 28 -8 -25
Proceeds from other borrowing 1
Dividends paid to the owners of the parent company 32 -1,316 -1,362
Interest paid AT1 capital securities -105 -103
Dividends paid to non-controlling interests -10
Payment of lease liabilities 23 -81
Cash flow from financing activities -9,626 2,318
Net increase/(decrease) of cash and cash equivalents -9,273 3,069
Cash and cash equivalents as at 1 January2 37,740 34,640
Effect of exchange rate differences on cash and cash equivalents -21 31
Cash and cash equivalents as at 31 December2 28,445 37,740
Supplementary disclosure of operating cash flow informationInterest paid 3,963 3,869
Interest received 10,342 10,344
Dividend received excluding associates 14 176
1 Comparative figures for 2018 have been restated. Please refer to Note 1 Accounting policies in the Consolidated Annual Financial Statements.2 ABN AMRO has reclassified EUR 1.5 billion (1 January 2018) and EUR 1.3 billion (31 December 2018) from loans and advances banks to cash and balances at central banks
in the comparative figures.
(in millions) 31 December 2019 31 December 2018
Cash and balances at central banks1 27,061 35,716
Loans and advances banks (less than 3 months)2 1,385 2,024
Total cash and cash equivalents 28,445 37,740
1 ABN AMRO has reclassified EUR 1.3 billion from loans and advances banks to cash and balances at central banks in the comparative figures for 2018. Please refer to Note 1 Accounting policies in the Consolidated Annual Financial Statements.
2 Loans and advances banks with an original maturity of 3 months or more is included in loans and advances banks.
The cash position decreased by a total of EUR 9.3 billion in 2019. The non-cash activities were impacted mainly by movements in the fair value reserve, cash flow hedge reserve, foreign currency translation, interest accruals and additions to provisions and allowances. The operating activities fluctuated primarily as a result of changes in securities financing of assets and corporate loans. The variance in the investing activities was mostly attributable to purchases, sales and redemptions of financial investments. Cash flow related to investing activities was also impacted, for EUR 1.2 billion, by divestments of subsidiaries. The proceeds from issuance of debt resulted in cash flow of EUR 27.4 billion, which was largely offset by repayments of issued debt in the amount of EUR 35.6 billion. The dividend paid to ordinary shareholders of the parent company resulted in cash flow of EUR 1.3 billion.

ABN AMRO Bank Annual Report 2019
179Annual Financial Statements 2019 / Notes to the Consolidated Annual Financial Statements
Notes to the Consolidated Annual Financial Statements1 Accounting policiesThe notes to the Consolidated Annual Financial Statements, including the audited information in the Risk, funding & capital section, are an integral part of these Annual Financial Statements. This section describes ABN AMRO Bank’s significant accounting policies and critical accounting estimates or judgements relating to the Annual Financial Statements. If an accounting policy or a critical accounting estimate relates to a specific note, it is included within the relevant note.
Corporate informationABN AMRO Bank N.V. (referred to as ABN AMRO Bank, ABN AMRO or the parent company) and its consolidated entities provide financial services in the Netherlands and abroad. ABN AMRO Bank is a public limited liability company, incorporated under Dutch law on 9 April 2009, and registered at Gustav Mahlerlaan 10, 1082 PP Amsterdam, the Netherlands (Chamber of Commerce number 34334259). On 29 June 2019, ABN AMRO Bank N.V. merged with its parent company, ABN AMRO Group N.V. As a result of the merger, ABN AMRO Group N.V. ceased to exist. The activities of ABN AMRO Group N.V. have been integrated into and continued in ABN AMRO Bank N.V. Shareholders of ABN AMRO Group N.V. became shareholders of ABN AMRO Bank N.V. Shares in ABN AMRO Bank N.V. are represented by depositary receipts, through which ABN AMRO’s listing on Euronext Amsterdam has been retained. Before completion of the merger, ABN AMRO Bank N.V. made a payment of EUR 9,069 million from its retained earnings to ABN AMRO Group N.V., and ABN AMRO Group N.V. contributed the same amount to ABN AMRO Bank N.V.’s share premium. Consequently, ABN AMRO Bank N.V.’s retained earnings decreased by EUR 9,069 million and its share premium increased by the same amount. As the number of shares outstanding at ABN AMRO Group N.V. was 140 million higher, ABN AMRO Bank N.V. issued 140 million additional shares of EUR 1 each. These shares were funded from the share premium. As a result of these transactions, the equity components of ABN AMRO Bank N.V. match the pre-merger equity components of ABN AMRO Group N.V. The comparative figures of earnings per share include an adjustment for the capital restructuring to align the number of shares of ABN AMRO Bank N.V. to the number of shares of ABN AMRO Group N.V. Holders of debt instruments continue to hold instruments issued by ABN AMRO Bank N.V. As at 31 December 2019, all shares in the capital of ABN AMRO Bank N.V. are held by two foundations: NLFI and STAK AAB. NLFI holds 56.3% in ABN AMRO Bank N.V., of which 49.9% is directly held via ordinary shares and 6.4% is indirectly held via depositary receipts for shares in ABN AMRO Bank N.V. STAK AAB holds 50.1% of the shares in the issued capital of ABN AMRO Bank N.V. Both foundations have issued depositary receipts for shares in ABN AMRO Bank N.V. Only STAK AAB’s depositary receipts are issued with the cooperation of ABN AMRO Bank N.V. and traded on Euronext Amsterdam. ABN AMRO provides a broad range of financial services to retail, private and corporate banking clients. These activities are conducted primarily in the Netherlands and selectively abroad. The Consolidated Annual Financial Statements of ABN AMRO Bank for the annual period ended 31 December 2019 incorporate financial information of ABN AMRO Bank N.V., its controlled entities, interests in associates and joint ventures. The Annual Financial Statements were prepared by the Executive Board and authorised for issue by the Supervisory Board and Executive Board on 10 March 2020.
Statement of complianceThe Consolidated Annual Financial Statements have been prepared in accordance with International Financial Reporting Standards (IFRS), as endorsed by the European Union (EU). They also comply with the financial reporting requirements included in Title 9 of Book 2 of the Dutch Civil Code, where applicable.
IntroductionStrategy and perform
anceRisk, funding &
capitalLeadership &
governanceOther
Annual Financial Statements 2019
Notes to the Consolidated
Annual Financial Statements Notes to the Consolidated Annual Financial Statements

ABN AMRO Bank Annual Report 2019
IntroductionStrategy and perform
anceRisk, funding &
capitalLeadership structure
GovernanceAnnual Financial Statem
entsOther
IntroductionStrategy and perform
anceRisk, funding &
capitalLeadership &
governanceOther
180
Annual Financial Statements 2019
Annual Financial Statements 2019 / Notes to the Consolidated Annual Financial Statements
Basis of preparationThe Consolidated Annual Financial Statements are prepared on a historical cost basis, except for derivative financial instruments, financial assets and liabilities held for trading or designated as measured at fair value through profit or loss, financial instruments not held in a ‘hold to collect’ business model, debt instruments that do not meet the solely payments of principal and interest (SPPI) test, and equity investments in associates or joint ventures for which the venture capital exemption is applied, all of which are measured at fair value through profit or loss. The carrying values of recognised assets and liabilities that are hedged items in fair value hedges, and otherwise carried at amortised cost, are adjusted to record changes in fair value attributable to the risks that are being hedged. Associates and joint ventures are accounted for using the equity method. The Annual Financial Statements are presented in euros, which is the reporting currency of ABN AMRO, rounded to the nearest million (unless otherwise stated).
Changes in accounting policiesNew EU-endorsed standards became effective as at 1 January 2019. The following standards were adopted:
Å IFRS 16 - Leases; Å IFRIC 23 - Uncertainty over Income Tax Treatments; Å Amendments to IFRS 9 - Prepayment Features with Negative Compensation; Å Amendments to IAS 19 - Plan Amendment, Curtailment or Settlement; Å Amendments to IAS 28 - Long-term Interests in Associates and Joint Ventures; Å Annual Improvements 2015 - 2017 Cycles: IFRS 3 Business Combinations, IFRS 11 Joint Arrangements, IAS 12 Income Taxes and IAS 23 Borrowing Costs.
IFRS 16 LeasesAs at 1 January 2019, ABN AMRO adopted IFRS 16 Leases. ABN AMRO has applied IFRS 16 retrospectively, with the cumulative effect of initial application recognised in retained earnings as at 1 January 2019. Comparative figures have not been restated, as permitted by the transitional provisions of the standard.
Lessor accountingWhere ABN AMRO acts as lessor, a distinction is made between operating and finance leases. Leases where the bank transfers substantially all risks and rewards incidental to ownership of the asset to the lessee are classified as finance leases. Leases that do not transfer these risks and rewards are classified as operating leases. Finance leases are recognised as a receivable in loans and advances at an amount equal to the net investment in the lease, less credit loss allowances. Assets subject to operating leases are recognised at cost in property and equipment. Operating income from finance leases is recognised in a pattern reflecting a constant periodic rate of return on the net investment in the lease.
Lessee accountingFor lessee accounting, IFRS 16 removes the distinction between ‘operating’ and ‘finance’ leases. All leases are recognised on the balance sheet as a right of use (ROU) asset and lease liability. As a lessee, ABN AMRO enters into various lease contracts, mainly for office buildings and cars which the bank leases for its own use. Under IAS 17, ABN AMRO did not enter into any finance leases as a lessee. When accounting for the contracts as a lessee, ABN AMRO separates non-lease components from lease components. Upon initial recognition, the lease liability is measured by discounting all future lease payments at the incremental borrowing rate. This rate reflects the rate of interest ABN AMRO would have to pay to borrow over a similar term, and with similar security, the funds necessary to obtain an asset of a value similar to that of the ROU asset in a similar economic environment. Upon transition, the remaining lease term is used in applying the incremental borrowing rate. The ROU asset is initially measured at cost, which reflects the initial lease liability, adjusted for upfront lease payments, received incentives and initial direct costs. The initial lease liability is equal to the sum of the fixed lease payments, discounted by the incremental borrowing rate. Other payments, such as variable lease payments and non-lease components, are not included in the initial lease liability.
The ROU asset is depreciated over the period of the lease, using the straight-line method. The lease liability is increased to reflect the amount of interest on the lease liability and decreased for the lease payments made.
Adjustments to the lease liability may result from remeasurement and/or modification. Remeasurement occurs when there is a change in the lease term or discount rate, or when ABN AMRO changes its assessment regarding purchase, extension or termination options. Remeasurement results in an adjustment of the ROU asset. When the ROU asset has been depreciated to zero, it is recorded in the income statement.

ABN AMRO Bank Annual Report 2019
181Annual Financial Statements 2019 / Notes to the Consolidated Annual Financial Statements
A lease modification is a change in the scope of the lease, or the consideration of a part of a lease that was not part in the original terms and conditions of the lease. A lease modification results in either a separate additional lease (based on the terms of the modified lease) or a change in the accounting for the existing lease. In the case of a lease modification not resulting in an additional lease, the lease liability is remeasured by adjusting the carrying amount of the ROU asset and, to reflect the partial or full termination of the lease, recognising any gain or loss in profit and loss.
Expenses related to short-term leases with a term of less than 12 months and leases of low-value are recognised in the income statement, as permitted by the standard. ROU assets are included in property and equipment, while the lease liabilities are included in other liabilities. Depreciation of the ROU assets is presented in the line item for depreciation and amortisation of tangible and intangible assets in the income statement, and interest expense on lease liabilities is included in the line item Other interest and similar expense.
Impact of transition to IFRS 16As permitted by the standard, ABN AMRO used the following practical expedients upon transition, on a lease-by-lease basis, that are available under the chosen implementation approach:
Å Calculation of the ROU assets at the date of initial application at an amount equal to the lease liability, adjusted for any prepaid or accrued lease payments;
Å Application of the recognition exemption for leases ending within 12 months at initial application; Å Reliance on the previous assessment of whether leases are onerous in accordance with IAS 37 as an alternative to performing an impairment review;
Å Use of hindsight in determining the lease term if contractual options to extend or terminate the lease exist.
The transition to IFRS 16 resulted in an increase in assets and liabilities of EUR 0.3 billion on 1 January 2019. There is no impact on equity as ABN AMRO chose to apply the practical expedient that allows it to measure the ROU asset at an amount equal to the lease liability. The table below explains the difference between the operating lease commitments on 31 December 2018 applying IAS 17 and the lease liabilities recognised as a result of the initial application of IFRS 16 on 1 January 2019.
(in millions) 1 January 2019
Future minimum lease payments under non-cancellable contracts as per 31 December 2018 (IAS 17) 413Discounting effect using the average incremental borrowing rate of 1.4% -15
Recognition exemption for short-term and low value leases -39
Adjustments resulting from a different treatment of extension and termination options -5
Other changes -51
Lease liabilities as per 1 January 2019 (IFRS 16) 304
Other changes relate to new lease contracts which were non-cancellable lease commitments under IAS 17 as at 31 December 2018, but which had not yet commenced on 1 January 2019 and were therefore not included in the IFRS 16 opening balance.
Refer to Note 23 Property and equipment, leases, goodwill and other intangible assets for the disclosures on leases and ROU assets.
IFRIC23 - Uncertainty over Income Tax TreatmentsThe interpretation addresses the accounting for income taxes when tax positions involve uncertainty. The interpretation is effective for annual reporting periods beginning on or after 1 January 2019. IFRIC 23 applies to taxes that fall within the scope of IAS 12 and does not apply to taxes or levies outside the scope of IAS 12. The interpretation addresses specifically whether an entity considers uncertain tax positions separately. The interpretation has no impact on the tax position reported by ABN AMRO as prescribed treatments were already effectively applied.
Amendments to IFRS 9 Financial Instruments The IASB issued amendments to IFRS 9, Prepayment Features with Negative Compensation, which became effective on 1 January 2019. These amendments allow instruments with symmetric prepayment options to be measured at amortised cost or at fair value through other comprehensive income. Since ABN AMRO does not have financial instruments with these features, these amendments have no impact on the financial statements.
IntroductionStrategy and perform
anceRisk, funding &
capitalLeadership &
governanceOther
Annual Financial Statements 2019

ABN AMRO Bank Annual Report 2019
IntroductionStrategy and perform
anceRisk, funding &
capitalLeadership structure
GovernanceAnnual Financial Statem
entsOther
IntroductionStrategy and perform
anceRisk, funding &
capitalLeadership &
governanceOther
182
Annual Financial Statements 2019
Annual Financial Statements 2019 / Notes to the Consolidated Annual Financial Statements
Amendments to IAS 19 Plan Amendment, Curtailment or SettlementThe IASB issued amendments to IAS 19 to clarify the effect of a defined benefit plan amendment, curtailment or settlement. The amendments became effective on 1 January 2019. Since ABN AMRO’s pension plans are almost exclusively defined contribution plans, and defined benefit plans are also no longer offered as part of the Collective Labour Agreement, the amendments do not have a material impact on the financial statements.
Amendments to IAS 28 Investments in Associates and Joint VenturesIn October 2017, the IASB issued amendments to IAS 28 that became effective on 1 January 2019. The amendments state that IFRS 9 should be applied to long-term interests in an associate or joint venture to which the equity method is not applied. The implementation of these amendments has no impact on ABN AMRO.
Annual Improvements 2015-2017 CycleIn December 2017, the IASB issued the Annual Improvements to IFRS Standards. These are required to be applied for reporting periods beginning on or after 1 January 2019. This cycle of annual improvements comprises amendments to IFRS 11 Joint Arrangements, IAS 12 Income Taxes and IAS 23 Borrowing Costs. The amendment to IAS 12 Income Taxes addresses the tax treatment of dividends on equity instruments. The impact on income taxes has to be recognised in profit or loss instead of equity. Adopting the amendment resulted in a EUR 26 million decrease in income tax expense for ABN AMRO as at 31 December 2018. Total equity was not impacted by the amendment. The comparative information has been adjusted.
The amendments to IFRS 11 Joint Arrangements and IAS 23 Borrowing Costs do not have a significant impact on the financial statements.
Voluntary change in accounting policy relating to presentation of interest income and interest expenseAs at 1 January 2019, ABN AMRO changed the presentation of interest income and expense on hedge accounting. Interest income and expense on hedging instruments is now presented in the same line item as the interest income and expense on the hedged item. The change enhances comparability with market participants and better reflects the net effective interest results on hedged assets and liabilities in an effective hedge accounting relationship. The interest income (expense) is included in the line item Interest income (expense), calculated using the effective interest method. The change in presentation did not have an impact on net interest income. In addition to the changed presentation of interest income from hedge accounting, ABN AMRO decided to present interest expense at the same level of detail as interest income. Due to the change in presentation of interest income and expense, the comparative figures have been adjusted, resulting in a EUR 2,321 million decrease of both interest income and expense as at 31 December 2018.
Change in accountingPresentation of fee and commission income and expenseIn 2019, ABN AMRO changed the presentation of fee and commission income and expenses related to pass-through fees resulting from clearing activities in the United States. Pass-through fees are collected from customers and fully passed through to third parties. Historically, these pass-through fees were presented ‘gross’. After reconsideration of the judgement applied following IFRS 15, ABN AMRO changed the presentation of such fees to ‘net’ in the statement of comprehensive income. This change in the presentation of the fees means all fees with the same nature and related to clearing activities are presented consistently. The change in presentation does not have an impact on net fee and commission income.
Due to the change, fee and commission income and expenses for 2019 decreased by EUR 966 million (2018: EUR 995 million).
Correction of prior periodsClassification of financial lease and factoring receivablesAs at 1 January 2019, ABN AMRO Bank changed the presentation of all financial lease and factoring receivables in the Risk, funding & capital section of this report. Within loans and advances customers, an amount of EUR 8.6 billion in assets, including EUR 0.6 billion in stage 2 and EUR 0.3 billion in stage 3, was reclassified from other loans and advances to corporate loans. The comparative figures have been adjusted accordingly.
Classification of amounts due to central banks and customer deposits During the first half of 2019, ABN AMRO concluded that some amounts relating to central banks should not be reported in loans and advances banks. An amount of EUR 1.3 billion has been reclassified from loans and advances banks to cash and balances at central banks in the comparative figures of 31 December 2018 (EUR 1.5 billion as at 1 January 2018).

ABN AMRO Bank Annual Report 2019
183Annual Financial Statements 2019 / Notes to the Consolidated Annual Financial Statements
ABN AMRO improved its reporting procedures for deposits due to customers. This resulted in a reclassification of EUR 2.0 billion from time deposits to demand deposits as at 31 December 2018.
New standards, amendments and interpretations not yet effectiveThe following standards and amendments have been issued by the IASB and endorsed for use in the EU, but are not yet effective.
Revised Conceptual Framework for Financial Reporting (Amendments to IAS 1)In March 2018, the IASB issued the revised Conceptual Framework for Financial Reporting. The Conceptual Framework provides guidance for developing consistent accounting policies and assistance with understanding the standards. The changes in the Conceptual Framework may affect the application of IFRS in situations where no standard applies to a particular transaction or event. The revised Conceptual Framework is effective from 1 January 2020. Of the amendments to IAS 1, the classification of current or non-current liabilities has not yet been endorsed. The adoption of the endorsed amendments is not expected to have a material impact on the financial statements.
Definition of Material (Amendments to IAS 1 and IAS 8)In October 2018, the IASB issued amendments to IAS 1 Presentation of Financial Statements and IAS 8 Accounting Policies, Changes in Accounting Estimates and Errors. The amendments, which will become effective for reporting periods starting on or after 1 January 2020, revise the definition of material and align the definition across other IFRS publications such as IFRS Standards and IFRIC Interpretations. ABN AMRO does not expect the adoption of the amendments to have a significant impact on the financial statements.
Interest Rate Benchmark Reform (Amendments to IFRS 9, IAS 39 and IFRS 7)In September 2019, the IASB issued amendments to IFRS 9, IAS 39 and IFRS 7 to address the issues affecting financial reporting in the period before the IBOR reform (also referred to as the pre-replacement phase). The amendments allow a company to apply certain exceptions to all hedging relationships directly affected by the IBOR reform. Applying the relief prevents the disruption of hedging relationships as a result of uncertainty caused by the IBOR reform. The effective date of the amendments is 1 January 2020, with the option of early adoption. ABN AMRO has decided not to adopt the amendments early, but instead to apply them from 1 January 2020. ABN AMRO does not expect adoption of the amendments to have any impact on profit or loss or the statement of financial position. This is because applying the relief during the pre-replacement phase prevents the discontinuation of hedging relationships and any financial impact such discontinuation would have.
New standards, amendments and interpretations not yet endorsedThe following new or revised standards and amendments have been issued by the IASB, but have not yet been endorsed by the EU and are therefore not open for early adoption. Only the amendments to IFRS that are relevant for ABN AMRO are discussed below.
IFRS 17 - Insurance ContractsIFRS 17 sets out the requirements for the recognition and measurement, presentation and disclosure of insurance contracts. When effective, IFRS 17 will replace IFRS 4 Insurance Contracts (IFRS 4). IFRS 17 is effective for reporting periods beginning on or after 1 January 2021, with comparative figures required.
ABN AMRO offers only limited insurance products. ABN AMRO has assessed that the impact of IFRS 17 on these insurance contracts is not material. ABN AMRO has two equity accounted investments that have insurance products. IFRS 17 could have a significant impact on the shareholders’ equity, net result, presentation and disclosures of these two equity accounted investments. This will have an impact on the carrying amount of the equity accounted investments and therefore on ABN AMRO’s shareholder’s equity. Even though IFRS 17 may have a significant impact on these equity accounted investments, ABN AMRO does not anticipate that the impact is material to ABN AMRO’s shareholder’s equity.
Amendments to IFRS 3 Business CombinationsIn October 2018, the IASB issued amendments to IFRS 3 Business Combinations. These amendments, which resolve difficulties in determining whether an entity has acquired a business or a group of assets, are effective for business combinations with an acquisition date on or after 1 January 2020. ABN AMRO will use the revised IFRS 3 in the event of acquisitions with an acquisition date on or after 1 January 2020. The adoption of the amendment is not expected to have a material impact on the financial statements.
IntroductionStrategy and perform
anceRisk, funding &
capitalLeadership &
governanceOther
Annual Financial Statements 2019

ABN AMRO Bank Annual Report 2019
IntroductionStrategy and perform
anceRisk, funding &
capitalLeadership structure
GovernanceAnnual Financial Statem
entsOther
IntroductionStrategy and perform
anceRisk, funding &
capitalLeadership &
governanceOther
184
Annual Financial Statements 2019
Annual Financial Statements 2019 / Notes to the Consolidated Annual Financial Statements
Revised Conceptual Framework for Financial Reporting (Amendments to IAS 1)The amendment to IAS 1 determining whether a liability should be classified as current or non-current has not yeen been endorsed. The amendment is effective for annual reporting periods beginning on or after 1 January 2022 and is to be applied retrospectively. Earlier application is permitted. ABN AMRO is currently studying the proposed amendment and the potential impact on the financial statements.
Critical accounting estimates and judgementsThe preparation of financial statements requires management to exercise its judgement in the process of applying ABN AMRO’s accounting policies and to make estimates and assumptions concerning the future. Actual results may differ from those estimates and assumptions. Accounting policies for the most significant areas requiring management to make judgements and estimates that affect reported amounts and disclosures are made in the following sections: Impairment losses on financial assets measured at AC Risk, funding & capital section Income tax expense, tax assets and tax liabilities Note 10 Impairment of instruments measured at FVOCI Note 16 Fair value of financial instruments Note 18 Impairment of goodwill Note 23 Provisions Note 29
Assessment of risks, rewards and controlWhenever ABN AMRO is required to assess risks, rewards and control, when considering the recognition and derecognition of assets or liabilities and the consolidation or deconsolidation of subsidiaries, it may sometimes be required to use judgement. Although management uses its best knowledge of current events and actions in making such assessments, the actual risks, rewards and control may ultimately differ.
Significant accounting policiesBasis of consolidationThe Consolidated Annual Financial Statements of ABN AMRO Bank N.V. include the financial statements of the parent company and its controlled entities, thus incorporating the assets, liabilities, revenues and expenses of ABN AMRO Bank N.V. and its subsidiaries. Non-controlling interests (held by third parties) in both equity and results of group companies are presented separately in the Consolidated Annual Financial Statements. Subsidiaries are included using the same reporting period and consistent accounting policies. Intercompany balances and transactions, and any related unrealised gains and losses, are eliminated in preparing the Consolidated Financial Statements. Unrealised gains arising from transactions with associates and jointly controlled entities are eliminated to the extent of ABN AMRO’s interest in the entities. Unrealised losses are also eliminated unless the transaction provides evidence of impairment in the asset transferred.
Foreign currencyABN AMRO applies IAS 21 The Effects of Changes in Foreign Exchange Rates. Transactions in foreign currencies are translated into euros at the rate prevailing on the transaction date. Foreign currency balances of monetary items are translated into euros at the period-end exchange rates. Exchange gains and losses on such balances are recognised in the income statement. The Consolidated Annual Financial Statements are stated in euros, which is the presentation and functional currency of ABN AMRO. The bank’s foreign operations may have different functional currencies. The functional currency is the currency that best reflects the economic substance of the underlying event and circumstances relevant to that entity. Prior to consolidation (or equity accounting), the assets and liabilities of non-euro operations are translated into euros at the closing rate, and items in the income statement and other comprehensive income are translated at the rate prevailing on the transaction dates. Exchange differences arising on the translation of foreign operations are included in the currency translation reserve within equity. These are transferred to the income statement when the bank loses control, joint control or significant influence over the foreign operation.
ABN AMRO Bank Annual Report 2019
185Annual Financial Statements 2019 / Notes to the Consolidated Annual Financial Statements
Financial assets and liabilitiesClassification and measurement of financial assetsABN AMRO classifies financial assets based on the business model in which they are held in accordance with IFRS 9. The business model is determined at a portfolio level. Portfolios are based on how ABN AMRO manages financial assets in order to achieve a particular business objective. The business model assessment is based on the level of sales, risk management, performance evaluation and management compensation. Derecognition is used as a condition to determine whether a transaction results in a sale. Three business models are distinguished:
Å ‘Hold to collect’ business model, in which cash flows are primarily generated by collecting contractual cash flows until maturity of the financial instrument. Sales can occur, as long as they are incidental, infrequent and insignificant. The assessment of the frequency and significance of sales is determined for each underlying portfolio. Sales that result from increases in the credit risk of the counterparty or take place close to maturity do not contradict the ‘hold to collect’ business model;
Å ‘Hold to collect and sell’ business model, in which the selling of financial assets is integral to achieving the business objective. In this business model, sales take place more frequently and have a greater value than in a business model with an objective to hold to collect;
Å Other business models not meeting the criteria of the business models mentioned above, for example business models in which financial assets are managed with the objective of generating cash flows from sales (trading book), are measured at FVTPL.
After the business model has been determined, the contractual cash flows of financial assets are assessed. Debt instruments can be classified at amortised cost or FVOCI only when the contractual cash flows are solely payments of principal and interest (SPPI). Contractual cash flows that are SPPI are consistent with a basic lending arrangement in which consideration for the time value of money and credit risk are typically the most significant interest elements. Debt instruments that do not meet the SPPI requirements are mandatorily measured at FVTPL. Financial assets are assessed in their entirety, including any embedded derivatives that are not separated from the host contract. Based on the business model determined and the SPPI assessment, the following measurement categories are identified under IFRS 9:
Å Amortised cost – Financial instruments measured at amortised cost are debt instruments within a ‘hold to collect’ business model with fixed or determinable payments which meet the SPPI criteria. These instruments are initially measured at fair value (including transaction costs) and subsequently measured at amortised cost using the effective interest rate method. Financial instruments measured at amortised cost are presented net of credit loss allowances in the statement of financial position;
Å FVTPL – Financial instruments measured at FVTPL include instruments held for trading, derivatives, equity instruments for which the FVOCI option has not been elected and instruments whose cash flows do not meet the SPPI requirements. Changes in the fair value of these instruments are directly recognised in the income statement;
Å FVOCI – Financial instruments measured at FVOCI are debt instruments which are held in a ‘hold to collect and sell’ business model and which meet the SPPI criteria. They are initially measured at fair value, with subsequent unrealised changes recognised in other comprehensive income. Equity instruments for which the fair value option is elected are also measured at FVOCI.
Reclassifications of financial assets are expected to be very infrequent and occur only when ABN AMRO changes its business model for a certain portfolio of financial assets. Refer to the Risk, funding & capital section for our accounting policies on the measurement of expected credit losses on financial instruments measured at amortised cost and FVOCI.
Classification of assets and liabilities held for trading In both the current and prior reporting period a financial asset or financial liability is classified as held for trading if it is:
Å Acquired or incurred principally for the purpose of selling or repurchasing it in the near term; Å Part of a portfolio of identified financial instruments that are managed together and for which there is evidence of a recent actual pattern of short-term profit taking; or
Å A trading derivative (except for a derivative that is a designated and effective hedging instrument).
IntroductionStrategy and perform
anceRisk, funding &
capitalLeadership &
governanceOther
Annual Financial Statements 2019

ABN AMRO Bank Annual Report 2019
IntroductionStrategy and perform
anceRisk, funding &
capitalLeadership structure
GovernanceAnnual Financial Statem
entsOther
IntroductionStrategy and perform
anceRisk, funding &
capitalLeadership &
governanceOther
186
Annual Financial Statements 2019
Annual Financial Statements 2019 / Notes to the Consolidated Annual Financial Statements
Classification and measurement of financial liabilitiesFinancial liabilities are initially recognised at their fair value. Under IFRS 9, financial liabilities are classified as subsequently measured at amortised cost, except for the following instruments:
Å Financial liabilities held for trading are measured at fair value through profit or loss; Å Financial liabilities that ABN AMRO has irrevocably designated at initial recognition as held at fair value through profit or loss when the instruments are held to reduce an accounting mismatch are managed on the basis of their fair value or include terms that have derivative characteristics in their nature.
Under IFRS 9, the changes in fair value attributable to changes in the credit risk of financial liabilities designated at FVTPL are presented in other comprehensive income. The cumulative amount of changes in fair value attributable to credit risk of such liabilities is presented as liability own credit risk reserve in equity.
Financial liabilities are never reclassified after initial recognition.
Recognition and derecognitionTraded instruments are recognised on the trade date, which is defined as the date on which ABN AMRO commits to purchase or sell the underlying instrument. If the settlement terms are non-standard, the commitment is accounted for as a derivative between the trade and settlement dates. Loans and advances are recognised when they are acquired or funded by ABN AMRO and derecognised when settled. Issued debt is recognised when issued, and deposits are recognised when the cash is deposited with ABN AMRO. Other financial assets and liabilities, including derivatives, are recognised when ABN AMRO becomes a party to the contractual provisions of the asset or liability.
Financial assets are derecognised when ABN AMRO loses control and the ability to obtain benefits from the contractual rights that comprise that asset. This occurs when the rights are realised or expire, or when substantially all risks and rewards are transferred. Financial assets are also derecognised if the bank has neither transferred nor retained substantially all risks and rewards of ownership, but control has passed to the transferee.
Financial assets continue to be recognised in the balance sheet, and a liability recognised for the proceeds of any related funding transaction, unless a fully proportional share of all or specifically identified cash flows are transferred to the lender without material delay and the lender’s claim is limited to those cash flows, and substantially all the risks, rewards and control associated with the financial instruments have been transferred, in which case that proportion of the asset is derecognised.
When the terms and conditions of a financial asset have been renegotiated or otherwise modified to the extent that, substantially, it becomes a new financial asset, ABN AMRO derecognises the financial asset, with the difference recognised in the income statement, to the extent that an impairment loss has not already been recorded. The newly recognised financial asset is classified as stage 1 for ECL measurement purposes. ABN AMRO assess, in both qualitative and quantitative terms, whether such modifications are substantial. Generally, a 10% change in the net present value of the cash flows between the initial and new contract results in a derecognition. With regard to substantial modifications, the derecognition gains or losses are recognised in net gains/(losses) on derecognition of financial assets measured at amortised cost. Substantial modifications due to forbearance measures or derecognition gains or losses are recognised in the impairment charges on financial instruments and disclosed separately, if material.
If the modification of the financial asset does not result in derecognition, the gross carrying amount of the financial asset is recalculated, based on the net present value of the new contractual cash flows, and discounted at the financial asset’s original effective interest rate. The effect is recognised and disclosed as a modification loss in the income statement. Impairment losses and releases are accounted for and disclosed separately from modification losses or gains that are accounted for as an adjustment of the financial asset’s gross carrying value. Modifications due to forbearance measures or modification gains or losses are recognised in the impairment charges on financial instruments and disclosed separately. With regard to modifications not related to forbearance measures, the modification gains or losses are recognised in the income statement and presented according to the nature of the modification.
Financial liabilities are derecognised when the liability has been settled, has expired or has been extinguished. An exchange of an existing financial liability for a new liability with the same lender on substantially different terms, qualitatively and quantitatively (a 10% difference in the present value of the cash flows), is accounted for as an extinguishment of the original financial liability and recognition of a new financial liability. The difference between the former amortised cost and the consideration paid is recognised in the income statement. Any subsequent resale is treated as a new issuance.

ABN AMRO Bank Annual Report 2019
187Annual Financial Statements 2019 / Notes to the Consolidated Annual Financial Statements
Client clearingAs a general clearing member, ABN AMRO provides clearing and settlement services to its clients for, among other things, exchange traded derivatives.
In its capacity as a clearing member, ABN AMRO guarantees the fulfilment of obligations towards central counterparty clearing houses (CCPs) of clients’ transactions. ABN AMRO is not liable to clients for the non-performance of the CCP. In the event of a client defaulting, ABN AMRO has the legal obligation to settle all the client’s positions with the relevant CCPs, possibly at a loss. Possible losses arising from this guarantee might relate not only to a client’s current positions, but also to future trades of the client. ABN AMRO receives and collects (cash) margins from clients, and remits these margins to the relevant CCP in whole or in part. Given the stringent margin requirements set by the CCPs, possible future outflows of resources for new clearing transactions are considered close to zero.
ABN AMRO does not reflect the exchange-traded derivatives cleared on behalf of clients in its financial statements. Under normal circumstances, the guarantee has no fair value and is not recognised in the financial statements. The loss recognition in the event of non-performance of a client will be in line with our contingent liabilities policy.
OffsettingThe bank offsets financial assets and liabilities and the net amount reported in the statement of financial position if it is legally entitled to set off the recognised amounts and intends to settle on a net basis, or to realise the asset and settle the liability simultaneously.
Statement of cash flowsFor the purposes of the statement of cash flows, cash and cash equivalents comprise cash on hand, freely available balances with central banks and other banks, and net balances on current accounts with other banks with a maturity of less than three months from the date of acquisition. The statement of cash flows, based on the indirect method of calculating operating cash flows, gives details of the source of cash and cash equivalents which became available during the year and the application of these cash and cash equivalents over the course of the year. The cash flows are analysed into cash flows from operations, including banking activities, investment activities and financing activities. Movements in loans and advances and interbank deposits are included in the cash flow from operating activities. Investment activities are comprised of acquisitions, sales and redemptions in respect of financial investments, as well as investments in, and sales of, subsidiaries and associates, property and equipment. The issuing of shares and the borrowing and repayment of long-term funds are treated as financing activities. Cash flows arising from foreign currency transactions are translated into euros using the exchange rates at the date of the cash flows.
Government grantsGovernment grants are recognised in the income statement on a systematic basis over the periods that the related expenses, for which it is intended to compensate, are recognised. In the case of an income-related grant, the grant is deducted from the related expense.
Levies and other regulatory chargesABN AMRO recognises a liability arising from levies and similar charges when it becomes legally enforceable (i.e. when the obligating event arises).
2 Segment reporting
Accounting policy for segment reportingThe segment reporting is in accordance with IFRS 8 Operating Segments. The segments are reported in a manner consistent with internal reporting provided to the Executive Board, which is responsible for allocating resources and assessing performance and has been identified as the chief operating decision-maker. All transactions between segments are eliminated as intersegment revenues and expenses in Group Functions. Geographical data are presented according to the management view.
Segment assets, liabilities, income and results are measured based on our accounting policies. Segment assets, liabilities, income and results include items directly attributable to a segment, as well as those that can be allocated on a reasonable basis. Transactions between segments are conducted on an arm’s length basis.
IntroductionStrategy and perform
anceRisk, funding &
capitalLeadership &
governanceOther
Annual Financial Statements 2019

ABN AMRO Bank Annual Report 2019
IntroductionStrategy and perform
anceRisk, funding &
capitalLeadership structure
GovernanceAnnual Financial Statem
entsOther
IntroductionStrategy and perform
anceRisk, funding &
capitalLeadership &
governanceOther
188
Annual Financial Statements 2019
Annual Financial Statements 2019 / Notes to the Consolidated Annual Financial Statements
Interest income is reported as net interest income because management primarily relies on net interest income as a performance measure, not gross income and expense.
There was no revenue from transactions with a single external client or counterparty exceeding 10% of the bank’s total revenue in 2019 or 2018.
Retail BankingRetail Banking provides a full range of transparent banking products and high-quality services to individuals with investable assets up to EUR 500,000. We offer our products and services under the ABN AMRO brand, as well as specific products and services under different labels. Our clients have access to a seamless omni-channel distribution network providing a top-class digital offering, a network of 129 branches and our 24/7 Contact Centre.
Commercial BankingCommercial Banking is an established business partner of the Dutch SME and corporate sector, with a selective asset-based finance presence in the UK, Germany, France, Belgium and the Netherlands. We serve over 350,000 clients with annual turnover of up to EUR 250 million in a variety of sectors. Commercial Banking offers a broad range of products and services, based on in-depth client and sector knowledge combined with innovation and digitalisation.
Private BankingPrivate Banking is a leading private bank in the eurozone in terms of client assets, with dedicated professionals who have in-depth knowledge of their clients. Our international expertise, local knowledge and over 300 years of experience in private banking form the basis of our long-standing client relationships. We are an enterprising private bank aiming to make a social impact. We support and engage our clients by offering expert advice on managing their wealth in a risk-controlled manner, taking into account life and business events. Private Banking targets high net worth individuals with more than EUR 500,000 in investable assets in the Netherlands or more than EUR 1 million outside the Netherlands, and ultra-high net worth individuals with more than EUR 25 million in investable assets. Private Banking is present in the Netherlands, France, Germany and Belgium.
Corporate & Institutional BankingCorporate & Institutional Banking (CIB) has a client base totalling more than 3,000 clients. We have a strong market position in the Netherlands, serving clients with revenues in excess of EUR 250 million. We are leveraging the Dutch franchise in selected Northwest European countries, where we serve clients in a variety of sectors. Globally we focus on three selected sectors and are present in 14 countries or jurisdictions. CIB is sector-led and offers a wide range of services and products in global markets and lending. We have specialised activities in Clearing and Trade & Commodity Finance.
Group FunctionsGroup Functions is organised into the following main departments: Innovation & Technology, Finance, Risk Management & Compliance, HR & Transformation, Group Audit, Strategy & Sustainability, Legal, Corporate Office and Brand, Marketing & Communications. The majority of Group Functions’ costs are allocated to the businesses.

ABN AMRO Bank Annual Report 2019
189Annual Financial Statements 2019 / Notes to the Consolidated Annual Financial Statements
Segment income statement for the year 2019
2019
(in millions)Retail
BankingCommercial
BankingPrivate
Banking
Corporate & Institutional
BankingGroup
Functions Total
IncomeNet interest income 2,903 1,523 667 1,229 147 6,468
Net fee and commission income 365 256 509 505 -2 1,632
Net trading income -1 76 10 84
Share of result in equity accounted investments 14 3 17 1 2 37
Other operating income 43 25 34 55 226 383
Operating income 3,324 1,807 1,226 1,866 383 8,605
ExpensesPersonnel expenses 411 281 394 428 734 2,247
General and administrative expenses 729 196 206 281 1,368 2,781
Depreciation and amortisation of tangible and intangible assets 9 10 42 26 154 240
Intersegment revenues/expenses 930 531 289 362 -2,111
Operating expenses 2,078 1,018 930 1,097 145 5,268Impairment charges on financial instruments 81 182 21 376 -3 657
Total expenses 2,159 1,200 951 1,473 142 5,925
Profit/(loss) before taxation 1,165 606 275 392 241 2,680Income tax expense 299 154 79 101 1 634
Profit/(loss) for the period 866 453 196 291 240 2,046
Attributable to:Owners of the parent company 866 453 196 291 240 2,046
Non-controlling interests
Segment income statement for the year 20182018
(in millions)Retail
BankingCommercial
BankingPrivate
Banking
Corporate & Institutional
BankingGroup
Functions Total
IncomeNet interest income 3,122 1,602 719 1,166 -16 6,593
Net fee and commission income 365 258 509 527 40 1,699
Net trading income -1 8 153 14 173
Share of result in equity accounted investments 28 2 13 2 -1 43
Other operating income 3 38 91 268 183 584
Operating income 3,517 1,899 1,340 2,116 220 9,093
ExpensesPersonnel expenses 442 335 390 480 794 2,441
General and administrative expenses 568 202 248 337 1,381 2,737
Depreciation and amortisation of tangible and intangible assets 10 7 21 8 127 173
Intersegment revenues/expenses 1,008 502 269 363 -2,143
Operating expenses 2,028 1,046 929 1,189 160 5,351Impairment charges on financial instruments -12 253 3 427 -16 655
Total expenses 2,016 1,299 932 1,616 144 6,006
Profit/(loss) before taxation 1,501 600 408 501 76 3,086Income tax expense1 375 153 95 75 38 736
Profit/(loss) for the period1 1,126 448 313 426 39 2,350
Attributable to:Owners of the parent company1 1,126 448 313 387 38 2,312
Non-controlling interests 39 39
1 Comparative figures for 2018 have been restated. Please refer to Note 1 Accounting policies in the Consolidated Annual Financial Statements.
IntroductionStrategy and perform
anceRisk, funding &
capitalLeadership &
governanceOther
Annual Financial Statements 2019

ABN AMRO Bank Annual Report 2019
IntroductionStrategy and perform
anceRisk, funding &
capitalLeadership structure
GovernanceAnnual Financial Statem
entsOther
IntroductionStrategy and perform
anceRisk, funding &
capitalLeadership &
governanceOther
190
Annual Financial Statements 2019
Annual Financial Statements 2019 / Notes to the Consolidated Annual Financial Statements
Retail BankingRetail Banking’s net profit decreased by 23% to EUR 866 million. This was driven by lower operating income, slightly higher expenses and higher impairments compared with 2018. Net interest income decreased by 7% to EUR 2,903 million (2018: EUR 3,122 million). The decrease was partially attributable to the combined impact of the model update for non-maturing deposits (NMD) and the reallocation of net interest income from Group Functions, which negatively impacted net interest income in 2019 by approximately EUR 234 million (2018: EUR 97 million negative). Interest income on mortgages decreased modestly due to the competitive environment, while consumer loan volumes declined year-on-year. Deposit income continued to be impacted by ongoing margin pressure.
Net fee and commission income in 2019 remained stable at EUR 365 million.
Other operating income amounted to EUR 43 million (2018: EUR 3 million), partially due to the sale of the Moneyou Belgium portfolio and the revaluation of investments.
Personnel expenses decreased by EUR 31 million in 2019 to EUR 411 million. This was mainly due to the decrease in FTE levels, which resulted from transfers to Group Functions to further optimise and centralise support functions, and also reflected a further reduction in the number of branches.
General and administrative expenses increased by EUR 161 million to EUR 729 million (2018: EUR 568 million), mainly due to the provisions recorded for CDD remediation programmes. Total CDD provisions in Retail Banking in 2019 amounted to EUR 122 million (2018: EUR 30 million), including EUR 114 million for Retail Banking clients in Q2 and an additional EUR 8 million for ICS in Q4. The increase was also due to higher regulatory levies in 2019 (EUR 183 million, compared with EUR 169 million in 2018).
Intersegment expenses decreased by EUR 78 million to EUR 930 million (2018: EUR 1,008 million) as a result of lower allocated costs from Group Functions.
Impairment charges amounted to EUR 81 million, compared with a release of EUR 12 million in 2018. Impairment charges in 2019 were impacted by model and methodology changes (please refer to the Credit risk section for more information).
Commercial BankingCommercial Banking’s net profit was up 1% due to lower expenses and impairment charges.
Net interest income decreased by 5% to EUR 1,523 million (2018: EUR 1,602 million). The decrease was mainly attributable to the combined impact of the model update for non-maturing deposits (NMD) and the reallocation of net interest income from Group Functions, which negatively impacted net interest income in 2019 by approximately EUR 92 million (2018: EUR 44 million negative). Net interest income also decreased due to deposit income, which continued to be impacted by ongoing margin pressure in the low interest rate environment.
Other operating income in 2019 totalled EUR 25 million (2018: EUR 38 million) as the figure for 2018 benefited from more favourable revaluation results.
Personnel expenses decreased by EUR 54 million in 2019 to EUR 281 million (2018: EUR 335 million). The decrease was a result of FTE transfers to Group Functions to further optimise and centralise support functions.
General and administrative expenses decreased by EUR 6 million to EUR 196 million (2018: EUR 202 million).
Intersegment expenses increased by EUR 29 million to EUR 531 million (2018: EUR 502 million), mainly due to higher cost allocations from Group Functions resulting from FTE transfers to further optimise and centralise support functions.
Impairments amounted to EUR 182 million, compared with EUR 253 million in 2018. The sectors mainly accounting for the higher level of impairments in 2018 were industrial goods and services, healthcare and logistics.
Private BankingPrivate Banking’s net profit for 2019 amounted to EUR 196 million (2018: EUR 313 million). Excluding positive incidentals of EUR 60 million in 2018, the decrease was mainly due to lower net interest income and higher impairments.

ABN AMRO Bank Annual Report 2019
191Annual Financial Statements 2019 / Notes to the Consolidated Annual Financial Statements
Net interest income decreased by 7% to EUR 667 million (2018: EUR 719 million). The decrease was mainly attributable to the combined impact of the model update for non-maturing deposits (NMD) and the reallocation of net interest income from Group Functions, which negatively impacted net interest income in 2019 by approximately EUR 53 million (2018: EUR 14 million negative). Net interest income also decreased due to deposit income, which continued to be impacted by ongoing margin pressure in the low interest rate environment. Interest income was broadly stable, with a slight increase in client lending being partially offset by lower margins.
Net fee and commission income of EUR 509 million was in line with the figure for 2018, with the decrease in fees due to divestments being offset by additional fees from acquisitions.
Other operating income decreased by EUR 57 million to EUR 34 million (2018: EUR 91 million), largely due to positive incidentals in 2018 of EUR 60 million relating to the sale proceeds and provision releases from divestments (Private Banking Luxembourg and asset management activities in France).
Personnel expenses increased by EUR 4 million to EUR 394 million (2018: EUR 390 million), mainly due to the restructuring provision for Private Banking Belgium.
The decrease of EUR 42 million in general and administrative expenses was mainly due to the divestment of Private Banking Luxembourg and cost savings within Private Banking International. The decrease is partly offset by increases in depreciation and amortisation due to the goodwill impairments in Private Banking Channel Islands and higher intersegment expenses due to increases in IT-related cost allocations from Group Functions.
Intersegment expenses amounted to EUR 289 million in 2019 (2018: EUR 269 million). Intersegment expenses mainly increased due to higher intersegment expenses due to increases in IT-related cost allocations from Group Functions.
Impairment charges increased by EUR 18 million to EUR 21 million in 2019. This is mainly explained by impairment releases in 2018.
Corporate & Institutional BankingCorporate & Institutional Banking’s net profit decreased by EUR 135 million in 2019, driven by a decline in operating income.
Net interest income increased by EUR 63 million to EUR 1,229 million (2018: EUR 1,166 million) due to higher margins on client lending and the combined impact of the model update for non-maturing deposits (NMD) and the reallocation of net interest income from Group Functions, which impacted net interest income in 2019 by approximately EUR 89 million positive (2018: EUR 35 million positive). The strategy refocus resulted in a decrease in client lending, mainly in Global Transportation & Logistics and Natural Resources sectors. Global Markets and Clearing also recorded higher results than in 2018.
Net fee and commission income decreased by EUR 22 million to EUR 505 million (2018: EUR 527 million), with most of the decrease being attributable to CIB Clients.
Net trading income decreased by EUR 77 million to EUR 76 million (2018: EUR 153 million) due to adverse CVA/DVA/FVA results in 2019 (EUR 17 million negative versus EUR 2 million negative in 2018) and lower foreign exchange transaction results (EUR 109 million versus EUR 135 million in 2018).
Other operating income amounted to EUR 55 million (2018: EUR 268 million). The decrease was mainly attributable to favourable Equity Participations results in 2018.
Personnel expenses amounted to EUR 428 million (2018: EUR 480 million). The decrease was partially driven by a EUR 27 million restructuring provision in 2018 related to the strategy refocus.
General and administrative expenses decreased by EUR 56 million to EUR 281 million (2018: EUR 337 million), mainly due to lower provisions for project costs for SME derivatives-related issues (EUR 23 million versus EUR 41 million in 2018) and lower regulatory levies.
Impairment charges amounted to EUR 376 million (2018: EUR 427 million). The impairments booked in 2019 were EUR 51 million lower than in 2018 and mostly in the energy-offshore and logistics sectors.
IntroductionStrategy and perform
anceRisk, funding &
capitalLeadership &
governanceOther
Annual Financial Statements 2019

ABN AMRO Bank Annual Report 2019
IntroductionStrategy and perform
anceRisk, funding &
capitalLeadership structure
GovernanceAnnual Financial Statem
entsOther
IntroductionStrategy and perform
anceRisk, funding &
capitalLeadership &
governanceOther
192
Annual Financial Statements 2019
Annual Financial Statements 2019 / Notes to the Consolidated Annual Financial Statements
Group FunctionsNet profit increased by EUR 201 million due to higher operating income and lower costs.
Net interest income amounted to EUR 147 million (2018: EUR 16 million negative).This increase was mainly due to the full-year impact of the model update for non-maturing deposits and the reallocation of net interest income to the business segments of approximately EUR 290 million positive (2018: EUR 119 million positive).
Net fee and commission income decreased by EUR 42 million to EUR 2 million negative (2018: EUR 40 million) due to the divestment of Stater N.V.
Other operating income increased to EUR 226 million (2018: EUR 183 million), mainly due to the book gain on Stater (EUR 130 million in Q2 2019). This was partially offset by less favourable hedge accounting-related income, the partial sale of the public sector loan portfolio (together EUR 57 million versus EUR 79 million) and the lower revaluation result of equensWorldline.
Personnel expenses decreased by EUR 60 million to EUR 734 million (2018: EUR 794 million), mainly as a result of lower restructuring provisions of EUR 3 million in 2019 (2018: EUR 58 million). The increase in personnel expenses due to FTE transfers from the business segments was offset by the decrease in FTEs resulting from the sale of Stater.
Intersegment revenues increased to EUR 2,111 million negative (2018: EUR 2,143 million negative) due to lower costs being allocated to commercial business lines.
Selected assets and liabilities per segment
31 December 2019
(in millions)Retail
BankingCommercial
BankingPrivate
Banking
Corporate & Institutional
BankingGroup
Functions Total
AssetsFinancial assets held for trading 1,137 1,137
Derivatives 24 4,549 1,157 5,730
Securities financing 4,631 10,274 14,905
Residential mortgages 144,225 3 3,856 2,795 150,880
Consumer loans 6,510 579 4,867 40 11,997
Corporate loans 1,688 41,022 5,343 49,109 1,771 98,933
Other loans and advances customers 13 181 4 5,991 102 6,292
Other 1,803 2,183 3,397 6,699 71,097 85,180
Total assets 154,240 43,968 17,492 72,157 87,196 375,054
LiabilitiesFinancial liabilities held for trading 675 675
Derivatives 3 5,369 1,133 6,505
Securities financing 561 7,673 8,234
Current accounts 17,539 30,520 22,348 20,802 691 91,900
Demand deposits 65,286 12,809 42,241 555 120,892
Time deposits 7,384 2,940 4,564 4,353 1,991 21,232
Other due to customers 150 771 47 967
Other 63,882 -2,301 -51,664 39,071 54,190 103,177
Total liabilities 154,240 43,968 17,492 72,157 65,725 353,582
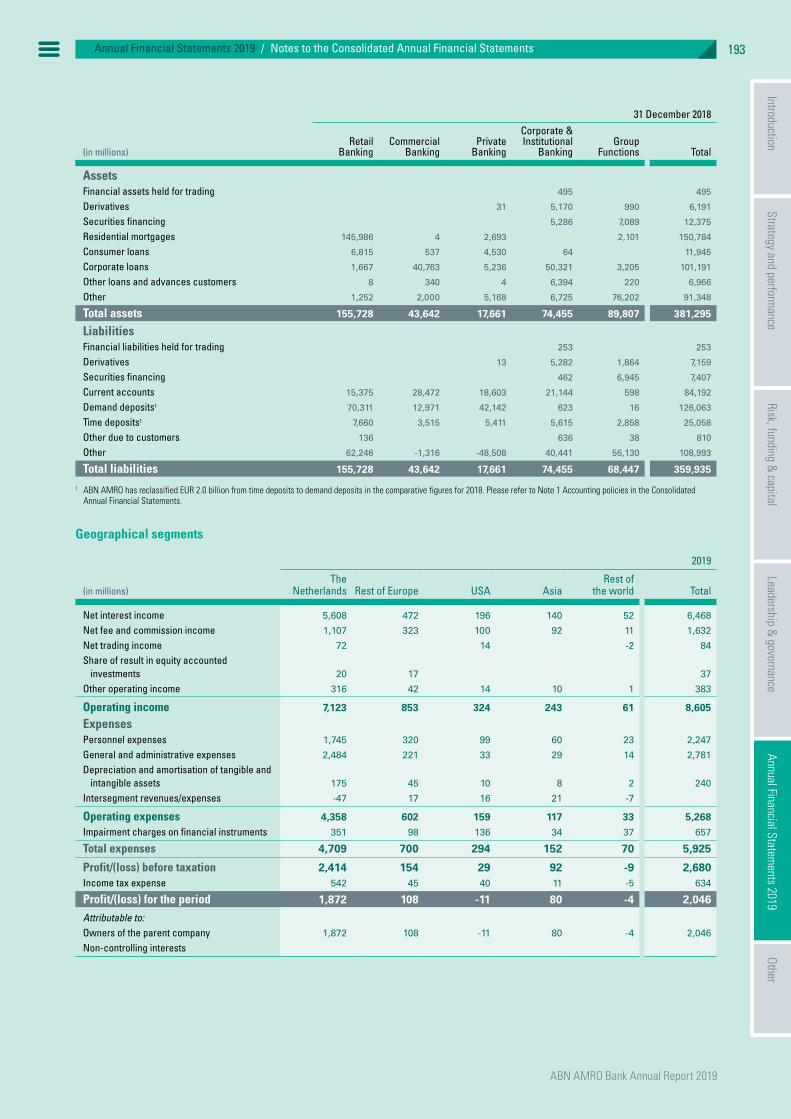
ABN AMRO Bank Annual Report 2019
193Annual Financial Statements 2019 / Notes to the Consolidated Annual Financial Statements
31 December 2018
(in millions)Retail
BankingCommercial
BankingPrivate
Banking
Corporate & Institutional
BankingGroup
Functions Total
AssetsFinancial assets held for trading 495 495
Derivatives 31 5,170 990 6,191
Securities financing 5,286 7,089 12,375
Residential mortgages 145,986 4 2,693 2,101 150,784
Consumer loans 6,815 537 4,530 64 11,945
Corporate loans 1,667 40,763 5,236 50,321 3,205 101,191
Other loans and advances customers 8 340 4 6,394 220 6,966
Other 1,252 2,000 5,168 6,725 76,202 91,348
Total assets 155,728 43,642 17,661 74,455 89,807 381,295
LiabilitiesFinancial liabilities held for trading 253 253
Derivatives 13 5,282 1,864 7,159
Securities financing 462 6,945 7,407
Current accounts 15,375 28,472 18,603 21,144 598 84,192
Demand deposits1 70,311 12,971 42,142 623 16 126,063
Time deposits1 7,660 3,515 5,411 5,615 2,858 25,058
Other due to customers 136 636 38 810
Other 62,246 -1,316 -48,508 40,441 56,130 108,993
Total liabilities 155,728 43,642 17,661 74,455 68,447 359,935
1 ABN AMRO has reclassified EUR 2.0 billion from time deposits to demand deposits in the comparative figures for 2018. Please refer to Note 1 Accounting policies in the Consolidated Annual Financial Statements.
Geographical segments
2019
(in millions)The
Netherlands Rest of Europe USA AsiaRest of
the world Total
Net interest income 5,608 472 196 140 52 6,468
Net fee and commission income 1,107 323 100 92 11 1,632
Net trading income 72 14 -2 84
Share of result in equity accounted investments 20 17 37
Other operating income 316 42 14 10 1 383
Operating income 7,123 853 324 243 61 8,605
ExpensesPersonnel expenses 1,745 320 99 60 23 2,247
General and administrative expenses 2,484 221 33 29 14 2,781
Depreciation and amortisation of tangible and intangible assets 175 45 10 8 2 240
Intersegment revenues/expenses -47 17 16 21 -7
Operating expenses 4,358 602 159 117 33 5,268Impairment charges on financial instruments 351 98 136 34 37 657
Total expenses 4,709 700 294 152 70 5,925
Profit/(loss) before taxation 2,414 154 29 92 -9 2,680Income tax expense 542 45 40 11 -5 634
Profit/(loss) for the period 1,872 108 -11 80 -4 2,046
Attributable to:Owners of the parent company 1,872 108 -11 80 -4 2,046
Non-controlling interests
IntroductionStrategy and perform
anceRisk, funding &
capitalLeadership &
governanceOther
Annual Financial Statements 2019

ABN AMRO Bank Annual Report 2019
IntroductionStrategy and perform
anceRisk, funding &
capitalLeadership structure
GovernanceAnnual Financial Statem
entsOther
IntroductionStrategy and perform
anceRisk, funding &
capitalLeadership &
governanceOther
194
Annual Financial Statements 2019
Annual Financial Statements 2019 / Notes to the Consolidated Annual Financial Statements
2018
(in millions)The
Netherlands Rest of Europe USA AsiaRest of
the world Total
IncomeNet interest income 5,663 554 167 151 57 6,593
Net fee and commission income 1,138 335 116 96 15 1,699
Net trading income 148 9 15 1 -1 173
Share of result in equity accounted investments 37 6 43
Other operating income 478 82 20 4 584
Operating income 7,465 986 319 251 72 9,093
ExpensesPersonnel expenses 1,922 325 104 66 24 2,441
General and administrative expenses 2,386 253 50 33 15 2,737
Depreciation and amortisation of tangible and intangible assets 142 25 3 3 1 173
Intersegment revenues/expenses -44 28 8 16 -8
Operating expenses 4,406 630 165 117 33 5,351Impairment charges on financial instruments 287 169 45 84 69 655
Total expenses 4,694 799 211 201 102 6,006
Profit/(loss) before taxation 2,771 187 108 51 -30 3,086Income tax expense1 648 44 45 4 -4 736
Profit/(loss) for the period1 2,124 143 63 47 -26 2,350
Attributable to:Owners of the parent company1 2,085 143 63 47 -26 2,312
Non-controlling interests 39 39
1 Comparative figures for 2018 have been restated. Please refer to Note 1 Accounting policies in the Consolidated Annual Financial Statements.
3 Overview of financial assets and liabilities by measurement base
31 December 2019
(in millions) Amortised cost
Fair value through profit or loss -
Trading
Fair value through profit or loss -
Other
Fair value through other comprehensive
income Total
Financial assetsCash and balances at central banks 27,061 27,061
Financial assets held for trading 1,137 1,137
Derivatives 4,910 820 5,730
Financial investments 840 44,437 45,277
Securities financing 14,905 14,905
Loans and advances banks 5,011 5,011
Loans and advances customers 266,835 1,267 268,102
Other financial assets 1,364 1,364
Total financial assets 315,175 6,047 2,927 44,437 368,586
Financial LiabilitiesFinancial liabilities held for trading 675 675
Derivatives 5,840 665 6,505
Securities financing 8,234 8,234
Due to banks 12,785 12,785
Due to customers 234,991 234,991
Issued debt 74,252 1,024 75,275
Subordinated liabilities 10,041 10,041
Other financial liabilities 824 824
Total financial liabilities 341,126 6,515 1,689 349,330

ABN AMRO Bank Annual Report 2019
195Annual Financial Statements 2019 / Notes to the Consolidated Annual Financial Statements
31 December 2018
(in millions) Amortised cost
Fair value through profit or loss -
Trading
Fair value through profit or loss -
Other
Fair value through other comprehensive
income Total
Financial assetsCash and balances at central banks1 35,716 35,716
Financial assets held for trading 495 495
Derivatives 5,247 943 6,191
Financial investments 1,004 41,180 42,184
Securities financing 12,375 12,375
Loans and advances banks1 6,780 6,780
Loans and advances customers 270,099 787 270,886
Assets held for sale 5 5
Other financial assets 945 945
Total financial assets 325,918 5,743 2,735 41,180 375,576
Financial LiabilitiesFinancial liabilities held for trading 253 253
Derivatives 5,727 1,432 7,159
Securities financing 7,407 7,407
Due to banks 13,437 13,437
Due to customers 236,123 236,123
Issued debt 79,739 1,045 80,784
Subordinated liabilities 9,805 9,805
Other financial liabilities 796 796
Total financial liabilities 347,307 5,979 2,477 355,763
1 The comparative figures for 2018 with regard to cash and balances at central banks and loans and advances banks have been restated. Please refer to Note 1 Accounting policies in the Consolidated Annual Financial Statements.
4 Net interest income
Accounting policy for net interest incomeInterest income and expense on financial instruments is recognised in the income statement on an accrual basis using the effective interest rate method, except for those financial instruments measured at fair value through profit or loss. The effective interest rate method allocates interest, amortisation of any discount or premium or other differences, including transaction costs and qualifying fees and commissions, over the expected lives of the assets and liabilities. The effective interest rate is the rate that exactly discounts estimated future cash flows to the net carrying amount of the asset. As a result, this method requires ABN AMRO to estimate future cash flows, in some cases based on its experience of customer behaviour, considering all contractual terms of the financial instrument, as well as the expected lives of the assets and liabilities. Interest on loans and advances measured at fair value through profit or loss is also included in net interest income and recognised using the contractual interest rate. Interest income and expense on trading balances is included in net trading income. Interest paid on assets with a negative interest yield is classified as interest expense. Interest received from liabilities with a negative interest yield is classified as interest income.
(in millions) 2019 2018
Interest income calculated using the effective interest method1 9,701 10,007
Other interest and similar income1 355 317
Interest income1 10,056 10,324Interest expense calculated using the effective interest method1 3,407 3,590
Other interest and similar expense1 181 140
Interest expense1 3,588 3,731
Net interest income 6,468 6,593
1 Comparative figures for 2018 have been restated. Please refer to Note 1 Accounting policies in the Consolidated Annual Financial Statements.
Net interest incomeNet interest income amounted to EUR 6,468 million, a decrease of EUR 125 million compared to EUR 6,593 million in 2018. The main drivers of the decline were decreases in corporate loans and residential mortgages, as well as deposit margin pressures resulting from the low interest rate environment.
IntroductionStrategy and perform
anceRisk, funding &
capitalLeadership &
governanceOther
Annual Financial Statements 2019
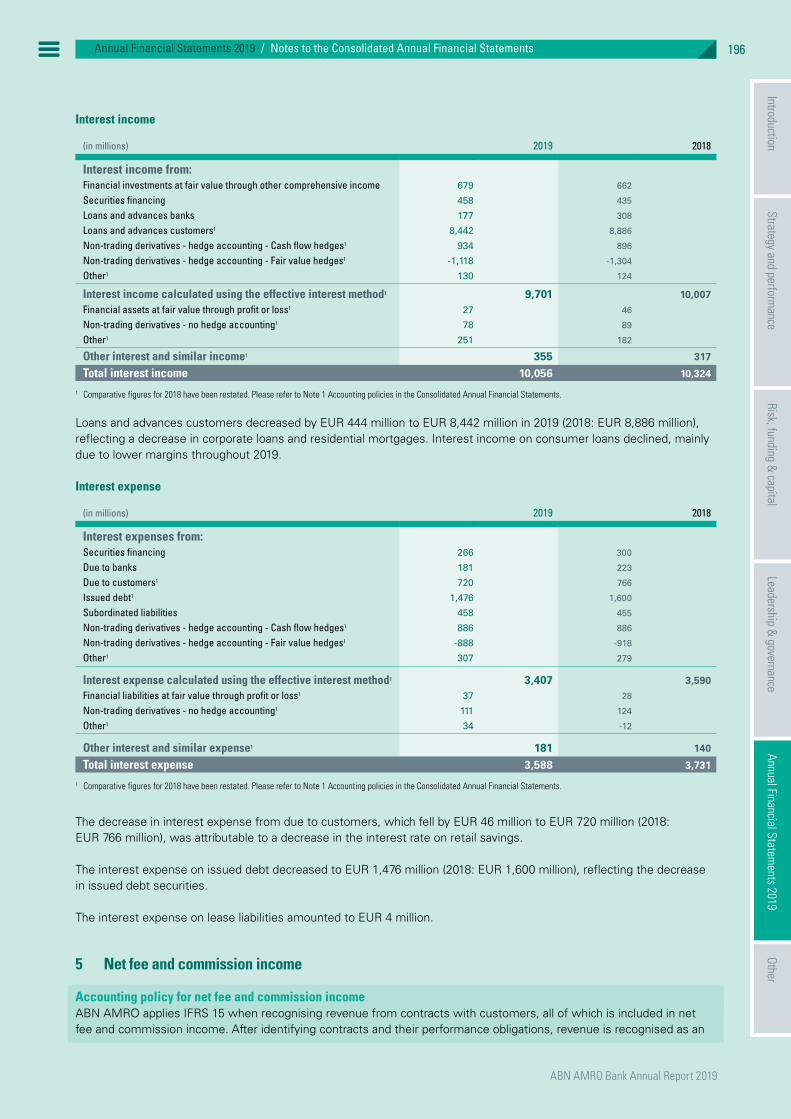
ABN AMRO Bank Annual Report 2019
IntroductionStrategy and perform
anceRisk, funding &
capitalLeadership structure
GovernanceAnnual Financial Statem
entsOther
IntroductionStrategy and perform
anceRisk, funding &
capitalLeadership &
governanceOther
196
Annual Financial Statements 2019
Annual Financial Statements 2019 / Notes to the Consolidated Annual Financial Statements
Interest income
(in millions) 2019 2018
Interest income from:Financial investments at fair value through other comprehensive income 679 662
Securities financing 458 435
Loans and advances banks 177 308
Loans and advances customers1 8,442 8,886
Non-trading derivatives - hedge accounting - Cash flow hedges1 934 896
Non-trading derivatives - hedge accounting - Fair value hedges1 -1,118 -1,304
Other1 130 124
Interest income calculated using the effective interest method1 9,701 10,007Financial assets at fair value through profit or loss1 27 46
Non-trading derivatives - no hedge accounting1 78 89
Other1 251 182
Other interest and similar income1 355 317
Total interest income 10,056 10,324
1 Comparative figures for 2018 have been restated. Please refer to Note 1 Accounting policies in the Consolidated Annual Financial Statements.
Loans and advances customers decreased by EUR 444 million to EUR 8,442 million in 2019 (2018: EUR 8,886 million), reflecting a decrease in corporate loans and residential mortgages. Interest income on consumer loans declined, mainly due to lower margins throughout 2019.
Interest expense
(in millions) 2019 2018
Interest expenses from:Securities financing 266 300
Due to banks 181 223
Due to customers1 720 766
Issued debt1 1,476 1,600
Subordinated liabilities 458 455
Non-trading derivatives - hedge accounting - Cash flow hedges1 886 886
Non-trading derivatives - hedge accounting - Fair value hedges1 -888 -918
Other1 307 279
Interest expense calculated using the effective interest method1 3,407 3,590Financial liabilities at fair value through profit or loss1 37 28
Non-trading derivatives - no hedge accounting1 111 124
Other1 34 -12
Other interest and similar expense1 181 140
Total interest expense 3,588 3,731
1 Comparative figures for 2018 have been restated. Please refer to Note 1 Accounting policies in the Consolidated Annual Financial Statements.
The decrease in interest expense from due to customers, which fell by EUR 46 million to EUR 720 million (2018: EUR 766 million), was attributable to a decrease in the interest rate on retail savings.
The interest expense on issued debt decreased to EUR 1,476 million (2018: EUR 1,600 million), reflecting the decrease in issued debt securities.
The interest expense on lease liabilities amounted to EUR 4 million.
5 Net fee and commission income
Accounting policy for net fee and commission incomeABN AMRO applies IFRS 15 when recognising revenue from contracts with customers, all of which is included in net fee and commission income. After identifying contracts and their performance obligations, revenue is recognised as an
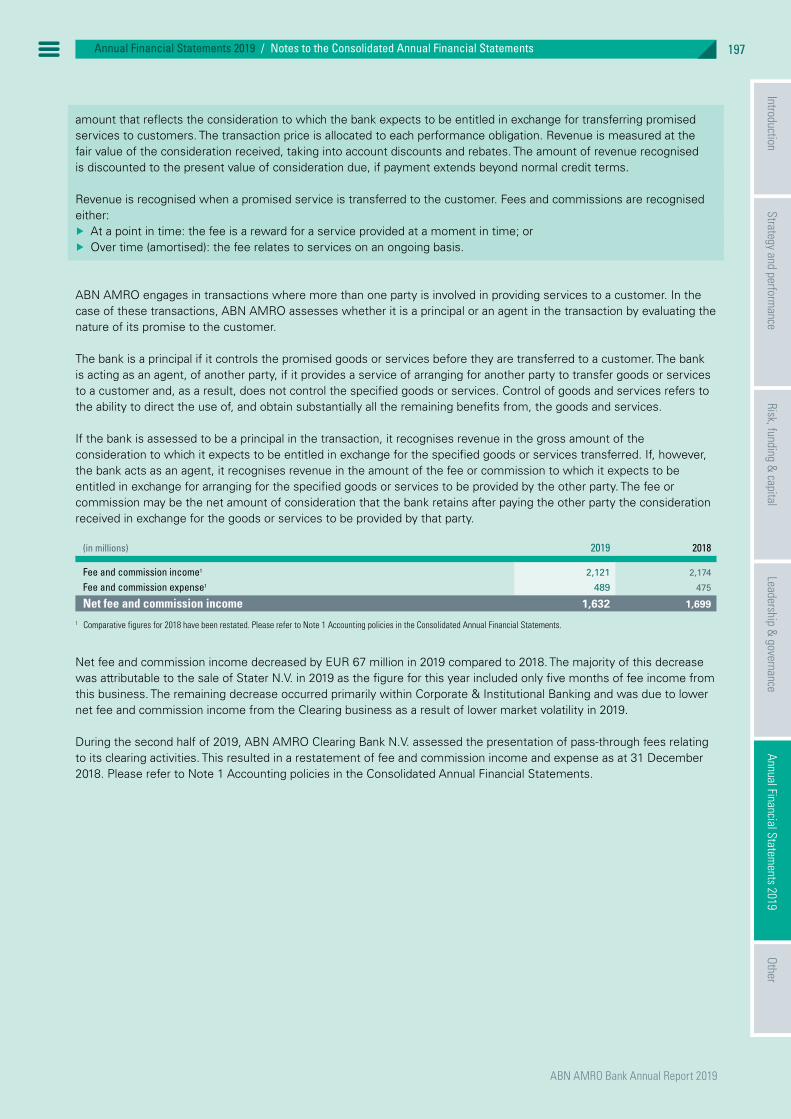
ABN AMRO Bank Annual Report 2019
197Annual Financial Statements 2019 / Notes to the Consolidated Annual Financial Statements
amount that reflects the consideration to which the bank expects to be entitled in exchange for transferring promised services to customers. The transaction price is allocated to each performance obligation. Revenue is measured at the fair value of the consideration received, taking into account discounts and rebates. The amount of revenue recognised is discounted to the present value of consideration due, if payment extends beyond normal credit terms.
Revenue is recognised when a promised service is transferred to the customer. Fees and commissions are recognised either:
Å At a point in time: the fee is a reward for a service provided at a moment in time; or Å Over time (amortised): the fee relates to services on an ongoing basis.
ABN AMRO engages in transactions where more than one party is involved in providing services to a customer. In the case of these transactions, ABN AMRO assesses whether it is a principal or an agent in the transaction by evaluating the nature of its promise to the customer. The bank is a principal if it controls the promised goods or services before they are transferred to a customer. The bank is acting as an agent, of another party, if it provides a service of arranging for another party to transfer goods or services to a customer and, as a result, does not control the specified goods or services. Control of goods and services refers to the ability to direct the use of, and obtain substantially all the remaining benefits from, the goods and services. If the bank is assessed to be a principal in the transaction, it recognises revenue in the gross amount of the consideration to which it expects to be entitled in exchange for the specified goods or services transferred. If, however, the bank acts as an agent, it recognises revenue in the amount of the fee or commission to which it expects to be entitled in exchange for arranging for the specified goods or services to be provided by the other party. The fee or commission may be the net amount of consideration that the bank retains after paying the other party the consideration received in exchange for the goods or services to be provided by that party.
(in millions) 2019 2018
Fee and commission income1 2,121 2,174
Fee and commission expense1 489 475
Net fee and commission income 1,632 1,699
1 Comparative figures for 2018 have been restated. Please refer to Note 1 Accounting policies in the Consolidated Annual Financial Statements.
Net fee and commission income decreased by EUR 67 million in 2019 compared to 2018. The majority of this decrease was attributable to the sale of Stater N.V. in 2019 as the figure for this year included only five months of fee income from this business. The remaining decrease occurred primarily within Corporate & Institutional Banking and was due to lower net fee and commission income from the Clearing business as a result of lower market volatility in 2019.
During the second half of 2019, ABN AMRO Clearing Bank N.V. assessed the presentation of pass-through fees relating to its clearing activities. This resulted in a restatement of fee and commission income and expense as at 31 December 2018. Please refer to Note 1 Accounting policies in the Consolidated Annual Financial Statements.
IntroductionStrategy and perform
anceRisk, funding &
capitalLeadership &
governanceOther
Annual Financial Statements 2019

ABN AMRO Bank Annual Report 2019
IntroductionStrategy and perform
anceRisk, funding &
capitalLeadership structure
GovernanceAnnual Financial Statem
entsOther
IntroductionStrategy and perform
anceRisk, funding &
capitalLeadership &
governanceOther
198
Annual Financial Statements 2019
Annual Financial Statements 2019 / Notes to the Consolidated Annual Financial Statements
Fee and commission incomeFee and commission income is specified in the following tables.
2019
(in millions)Retail
BankingCommercial
BankingPrivate
Banking
Corporate & Institutional
BankingGroup
Functions Total
Fee and commission income from:Securities and custodian services 15 1 63 450 1 531
Payment services 328 202 27 81 37 675
Portfolio management and trust fees 43 1 463 508
Guarantees and commitment fees 24 28 6 104 162
Insurance and investment fees 46 1 32 80
Other service fees 17 67 16 38 30 167
Total fee and commission income 473 299 607 674 68 2,121
Timing fee and commission incomeRecognised at a point in time 250 265 340 621 68 1,543
Recognised over time 224 34 267 53 579
Total fee and commission income 473 299 607 674 68 2,121
Fee and commission income decreased by EUR 53 million compared with 2018, mainly due to less fee income being generated as a result of the sale of Stater N.V. in 2019. This was partly offset by the acquisition of Societe Generale Private Banking N.V.
2018
(in millions)Retail
BankingCommercial
BankingPrivate
Banking
Corporate & Institutional
BankingGroup
Functions Total
Fee and commission income from:Securities and custodian services1 19 1 60 440 1 521
Payment services 310 202 28 87 35 661
Portfolio management and trust fees 45 1 475 521
Guarantees and commitment fees 21 28 5 109 163
Insurance and investment fees 46 1 32 78
Other service fees 17 71 14 48 80 230
Total fee and commission income 457 303 613 685 115 2,174
Timing fee and commision incomeRecognised at a point in time1 241 271 355 657 115 1,638
Recognised over time 216 33 259 29 536
Total fee and commission income 457 303 613 685 115 2,174
1 Comparative figures for 2018 have been restated. Please refer to Note 1 Accounting policies in the Consolidated Annual Financial Statements.
Fee and commission expenseThe components of fee and commission expense are specified in the following table.
(in millions) 2019 2018
Fee and commission expenses from:Securities and custodian services1 180 172
Payment services 168 158
Portfolio management and trust fees 68 73
Guarantees and commitment fees 12 9
Insurance and investment fees 39 36
Other service fees 24 27
Total fee and commission expense 489 475
1 Comparative figures for 2018 have been restated. Please refer to Note 1 Accounting policies in the Consolidated Annual Financial Statements.

ABN AMRO Bank Annual Report 2019
199Annual Financial Statements 2019 / Notes to the Consolidated Annual Financial Statements
Fee and commission expense increased by EUR 14 million in 2019. This was driven by higher payment service charges within Retail Banking, combined with an increase in securities and custodian service charges within Corporate and Institutional Banking due to higher volumes of trading activity.
6 Net trading income
Accounting policy for net trading incomeIn accordance with IFRS 9, trading positions are held at fair value, and net trading income includes gains and losses arising from changes in the fair value of such financial assets and liabilities. The latter comprise gains and losses from trading financial assets and liabilities, interest income and expenses related to trading financial assets and liabilities, and dividends received from trading instruments. Dividend income and dividends from trading instruments are recognised at the dividend announcement date. Net trading income also includes changes in fair value arising from changes in counterparty credit spreads (CVA) and changes in own credit spreads (DVA) where these impact on the value of our trading assets and liabilities. The funding valuation adjustment (FVA) incorporates the incremental cost of funding into the valuation of uncollateralised and partly collateralised derivatives.
(in millions) 2019 2018
Interest instruments trading -43 12
Equity and commodity trading 20 20
Foreign exchange transaction results 107 142
Total net trading income 84 173
Net trading income amounted to a gain of EUR 84 million (2018: gain of EUR 173 million) and was EUR 89 million lower than in 2018. The CVA and DVA were relatively stable during 2019. The FVA reserve increased by EUR 14 million due to the decrease in interest rates during 2019.
Income from interest instruments trading was impacted by challenging market conditions, resulting in a net trading loss. The challenging market conditions were caused mainly by the low interest rate environment. Income from this trading was also impacted by an addition of EUR 24 million to the provision for SME derivatives-related issues.
The main impact on foreign exchange transaction results was caused by the volatile exchange rate environment in 2019.
7 Other operating income
Accounting policy for other operating incomeOther operating income includes all other banking activities such as operating lease activities as lessor and results on the disposal of assets. It also includes the change in fair value of derivatives used for risk management purposes that do not meet the requirements for hedge accounting, ineffectiveness of hedging programmes, fair value changes relating to assets and liabilities measured at fair value through profit or loss, and changes in the value of derivatives related to such instruments. Dividend income from non-trading equity investments is recognised when entitlement is established. Income from operating lease activities is measured net of depreciation of the related assets.
(in millions) 2019 2018
Leasing activities 22 21
Disposal of operating activities and equity accounted investments 103 42
Result from financial transactions 193 411
Other 64 110
Total other operating income 383 584
Other operating income decreased by EUR 201 million to EUR 383 million (2018: EUR 584 million), mainly due to a decrease in the result from financial transactions.
IntroductionStrategy and perform
anceRisk, funding &
capitalLeadership &
governanceOther
Annual Financial Statements 2019

ABN AMRO Bank Annual Report 2019
IntroductionStrategy and perform
anceRisk, funding &
capitalLeadership structure
GovernanceAnnual Financial Statem
entsOther
IntroductionStrategy and perform
anceRisk, funding &
capitalLeadership &
governanceOther
200
Annual Financial Statements 2019
Annual Financial Statements 2019 / Notes to the Consolidated Annual Financial Statements
Disposal of operating activities and equity accounted investments increased by EUR 61 million to EUR 103 million (2018: EUR 42 million). The year 2019 includes the divestment of subsidiary Stater N.V. and the sale of subsidiary ABN AMRO Channel Islands. For 2018, this item included the divestments of Private Banking Luxembourg and part of the stake in the investment funds of ABN AMRO Participaties.
The result from financial transactions decreased by EUR 218 million to EUR 193 million in 2019 (2018: EUR 411 million). The decrease in result from financial transactions was driven by a EUR 242 million decrease in fair value gains and losses relating to instruments mandatorily measured at fair value through profit and loss. These gains related to private equities, equity associates and joint ventures. The movement was partially offset by derecognition gains, which increased by EUR 105 million to EUR 64 million (2018: EUR 41 million negative). The derecognition gains primarily related to commercial loans. Result from financial transactions includes EUR 33 million of foreign currency exchange differences.
Other income - Other decreased by EUR 46 million to EUR 64 million (2018: EUR 110 million). In 2018, Other Income - Other included the property sale of Private Banking Luxembourg.
8 Personnel expenses
Accounting policy for personnel expensesSalaries and wages, social security charges and other salary-related costs are recognised over the period in which the employees provide the services to which the payments relate. The accounting policies for pensions and other post-retirement benefits are included in Note 30.
(in millions) 2019 2018
Salaries and wages 1,529 1,594
Social security charges 238 243
Pension expenses relating to defined benefit plans -1 2
Defined contribution plan expenses 372 338
Other 109 265
Total personnel expenses 2,247 2,441
Total personnel expenses for 2019 decreased by EUR 194 million to EUR 2,247 million in 2019 (2018: EUR 2,441 million).
Salaries and wages decreased by EUR 65 million to EUR 1,529 million in 2019 (2018: EUR 1,594 million). This decrease was mainly driven by a further decline in FTE levels following the execution of cost-saving programmes and the sale of ABN AMRO Channel Islands Ltd and Stater N.V. This decrease was partly offset by a 2% increase in salaries in accordance with the Collective Labour Agreement. The year 2018 included a one-off payment of EUR 16 million under the Collective Labour Agreement. With effect from 2019, ABN AMRO has had a share-based payment plan that consists of a cash bonus and a non-cash bonus. The non-cash bonus qualifies as a cash-settled share-based payment plan as defined by IFRS 2 Share-Based Payments and is included in Salaries and wages. Reference is made to Note 36 Share-based payment.
Social security charges decreased by EUR 5 million in 2019 to EUR 238 million (2018: EUR 243 million), mainly due to the lower social security charges resulting from the decline in the number of FTEs.
The defined contribution plan expenses increased by EUR 34 million to EUR 372 million (2018: EUR 338 million). The year 2019 included a one-off payment of EUR 30 million to the pension fund, as agreed under the new Collective Labour Agreement.
Other personnel expenses decreased by EUR 156 million to EUR 109 million in 2019. This was mainly due to lower restructuring provisions in 2019. The addition of EUR 12 million relating to the integration of Private Banking Belgium was partly offset by EUR 11 million in releases from restructuring provisions in various business segments (2018: EUR 126 million). Other employee benefit expenses also decreased by EUR 14 million to EUR 69 million (2018: EUR 83 million).

ABN AMRO Bank Annual Report 2019
201Annual Financial Statements 2019 / Notes to the Consolidated Annual Financial Statements
9 General and administrative expenses
Accounting policy for general and administrative expensesCosts are recognised in the period in which services have been provided and to which the payment relates.
(in millions) 2019 2018
Agency staff, contractors and consultancy costs 713 699
Staff related costs 74 73
Information technology costs 998 1,002
Housing 118 167
Post, telephone and transport 39 48
Marketing and public relations costs 96 112
Regulatory charges 381 362
Other 360 273
Total general and administrative expenses 2,781 2,737
Total general and administrative expenses increased by EUR 44 million to EUR 2,781 million in 2019 (2018: EUR 2,737 million).
Housing decreased by EUR 49 million to EUR 118 million in 2019, mainly due to the implementation of IFRS 16 and the resultant decrease in rental costs.
Other increased by EUR 87 million to EUR 360 million in 2019, mainly owing to the provisions for the Customer Due Diligence (CDD) programme in 2019. Additional provisions for the CDD remediation programme in 2019 amounted to EUR 174 million (2018: EUR 85 million).
(in millions) 2019 2018
Bank tax 100 103
Deposit Guarantee Scheme 124 108
Single Resolution Fund 127 125
Other regulatory levies 30 26
Total regulatory charges 381 362
Regulatory charges increased by EUR 19 million to EUR 381 million in 2019, mainly due to the higher contribution for the Deposit Guarantee Scheme.
Fees paid to EY are included under agency staff, contractors and consultancy costs. These are specified in the following table.
(in millions) 2019 2018
Financial statements audit fees 12 9
Audit related fees 4 4
Total auditor's fee 16 13
Financial statement audit fees relating to the audit of activities in the Netherlands amounted to EUR 10 million in 2019 (2018: EUR 7 million). Audit-related fees for activities in the Netherlands amounted to EUR 2 million in 2019 (2018: EUR 2 million).
Audit-related fees comprise services for regulatory reporting purposes, comfort letters and consent letters, assurance engagements on segregation of assets, assurance on service organisation reports and procedures agreed for supervisory purposes.
IntroductionStrategy and perform
anceRisk, funding &
capitalLeadership &
governanceOther
Annual Financial Statements 2019
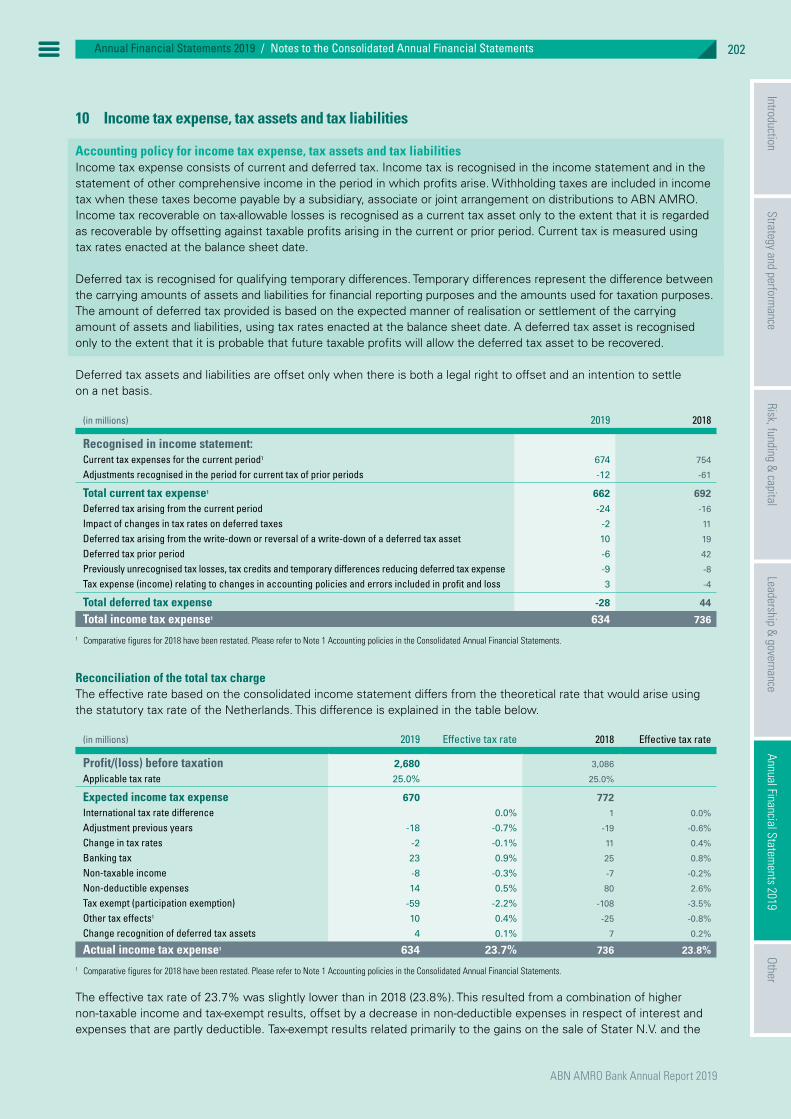
ABN AMRO Bank Annual Report 2019
IntroductionStrategy and perform
anceRisk, funding &
capitalLeadership structure
GovernanceAnnual Financial Statem
entsOther
IntroductionStrategy and perform
anceRisk, funding &
capitalLeadership &
governanceOther
202
Annual Financial Statements 2019
Annual Financial Statements 2019 / Notes to the Consolidated Annual Financial Statements
10 Income tax expense, tax assets and tax liabilities
Accounting policy for income tax expense, tax assets and tax liabilitiesIncome tax expense consists of current and deferred tax. Income tax is recognised in the income statement and in the statement of other comprehensive income in the period in which profits arise. Withholding taxes are included in income tax when these taxes become payable by a subsidiary, associate or joint arrangement on distributions to ABN AMRO. Income tax recoverable on tax-allowable losses is recognised as a current tax asset only to the extent that it is regarded as recoverable by offsetting against taxable profits arising in the current or prior period. Current tax is measured using tax rates enacted at the balance sheet date.
Deferred tax is recognised for qualifying temporary differences. Temporary differences represent the difference between the carrying amounts of assets and liabilities for financial reporting purposes and the amounts used for taxation purposes. The amount of deferred tax provided is based on the expected manner of realisation or settlement of the carrying amount of assets and liabilities, using tax rates enacted at the balance sheet date. A deferred tax asset is recognised only to the extent that it is probable that future taxable profits will allow the deferred tax asset to be recovered. Deferred tax assets and liabilities are offset only when there is both a legal right to offset and an intention to settle on a net basis.
(in millions) 2019 2018
Recognised in income statement:Current tax expenses for the current period1 674 754
Adjustments recognised in the period for current tax of prior periods -12 -61
Total current tax expense1 662 692Deferred tax arising from the current period -24 -16
Impact of changes in tax rates on deferred taxes -2 11
Deferred tax arising from the write-down or reversal of a write-down of a deferred tax asset 10 19
Deferred tax prior period -6 42
Previously unrecognised tax losses, tax credits and temporary differences reducing deferred tax expense -9 -8
Tax expense (income) relating to changes in accounting policies and errors included in profit and loss 3 -4
Total deferred tax expense -28 44
Total income tax expense1 634 736
1 Comparative figures for 2018 have been restated. Please refer to Note 1 Accounting policies in the Consolidated Annual Financial Statements.
Reconciliation of the total tax chargeThe effective rate based on the consolidated income statement differs from the theoretical rate that would arise using the statutory tax rate of the Netherlands. This difference is explained in the table below.
(in millions) 2019 Effective tax rate 2018 Effective tax rate
Profit/(loss) before taxation 2,680 3,086
Applicable tax rate 25.0% 25.0%
Expected income tax expense 670 772International tax rate difference 0.0% 1 0.0%
Adjustment previous years -18 -0.7% -19 -0.6%
Change in tax rates -2 -0.1% 11 0.4%
Banking tax 23 0.9% 25 0.8%
Non-taxable income -8 -0.3% -7 -0.2%
Non-deductible expenses 14 0.5% 80 2.6%
Tax exempt (participation exemption) -59 -2.2% -108 -3.5%
Other tax effects1 10 0.4% -25 -0.8%
Change recognition of deferred tax assets 4 0.1% 7 0.2%
Actual income tax expense1 634 23.7% 736 23.8%
1 Comparative figures for 2018 have been restated. Please refer to Note 1 Accounting policies in the Consolidated Annual Financial Statements.
The effective tax rate of 23.7% was slightly lower than in 2018 (23.8%). This resulted from a combination of higher non-taxable income and tax-exempt results, offset by a decrease in non-deductible expenses in respect of interest and expenses that are partly deductible. Tax-exempt results related primarily to the gains on the sale of Stater N.V. and the

ABN AMRO Bank Annual Report 2019
203Annual Financial Statements 2019 / Notes to the Consolidated Annual Financial Statements
sale of the participation in equensWorldline S.E. The adjustment for previous years relates to adjustments resulting from the filing of tax returns and settlement of prior-year positions with the various tax authorities. Other tax effects include the effects of income taxed at an adjusted rate or the effects of an adjusted tax base.
Tax assets and liabilitiesThe most significant temporary differences arise from the revaluation of certain financial assets and liabilities, including derivative contracts, allowances for loan impairments and investments. The following table summarises the tax position.
31 December 2019 31 December 2018
(in millions) Assets Liabilities Assets Liabilities
Current tax 174 42 172 30
Deferred tax 591 22 344 6
Total tax assets and liabilities 764 63 516 36
The significant components and annual movements in deferred tax assets and deferred tax liabilities at are shown in the following tables.
(in millions)
As at 31 December
2018Income
statement OCI Equity Other
As at 31 December
2019
Of which: deferred tax asset
Of which: deferred
tax liability
Assets and liabilities held for trading, derivatives and financial investments 185 6 208 1 400 455 -55
Property and equipment (Excluding leases) and Intangible assets 14 -1 -7 5 15 -10
Loans 37 2 -1 38 39 -1
Equity accounted investments 3 -1 2 2
Leases 5 5 45 -39
Pensions and other (post-)employment benefits 11 -2 2 6 17 17
Provisions 28 -3 1 -6 20 22 -2
Tax Losses carried forward 14 21 -4 31 31
Other 45 2 3 50 63 -13
Deferred tax assets (+) and liabilities (-) 338 28 210 -8 569 689 -120Offsetting deferred tax assets and liabilities -101 101
Net deferred tax assets (+) and liabilities (-) 588 -19
(in millions)
As at 31 December
2017Income
statement OCI Equity Other
As at 31 December
2018
Of which: deferred tax asset
Of which: deferred
tax liability
Assets and liabilities held for trading, derivatives and financial investments 150 -75 105 4 2 185 290 -105
Property and equipment (Excluding leases) and Intangible assets 12 1 1 14 19 -5
Loans 37 -7 1 6 37 40 -3
Equity accounted investments 8 -3 -2 3 3
Pensions and other (post-)employment benefits 14 -1 -2 11 11
Provisions 29 -1 -4 -2 6 28 28
Tax Losses carried forward 17 3 -6 14 14
Other 86 39 -80 4 -4 45 60 -15
Deferred tax assets (+) and liabilities (-) 354 -44 22 5 1 338 466 -128Offsetting deferred tax assets and liabilities -122 122
Net deferred tax assets (+) and liabilities (-) 344 -6
Deferred tax assetsDeferred tax assets are recognised to the extent that it is probable that future taxable profits will allow the deferred tax asset to be recovered. Recognition is based on estimates of sufficient taxable income by jurisdiction in which ABN AMRO operates and the period over which deferred tax assets are recoverable. In the event that actual results
IntroductionStrategy and perform
anceRisk, funding &
capitalLeadership &
governanceOther
Annual Financial Statements 2019

ABN AMRO Bank Annual Report 2019
IntroductionStrategy and perform
anceRisk, funding &
capitalLeadership structure
GovernanceAnnual Financial Statem
entsOther
IntroductionStrategy and perform
anceRisk, funding &
capitalLeadership &
governanceOther
204
Annual Financial Statements 2019
Annual Financial Statements 2019 / Notes to the Consolidated Annual Financial Statements
differ from these estimates in future periods, changes to the recognition of deferred tax assets could be required and these could impact on our financial position and net profit. No deferred income taxes have been recognised on undistributed earnings of ABN AMRO’s subsidiaries, branches and interests in joint ventures.
Tax lossesThe total accumulated losses available for carry-forward at 31 December 2019 amounted to EUR 1,416 million (31 December 2018: EUR 1,413 million), of which EUR 141 million (31 December 2018: EUR 55 million) is recognised for future tax benefits. The recorded deferred tax asset for tax losses carried forward at 31 December 2019 amounted to EUR 31 million (31 December 2018: EUR 14 million).
Unrecognised tax assetsDeferred tax assets of EUR 51 million (31 December 2018: EUR 42 million) have not been recognised in respect of gross deductible temporary differences of EUR 171 million (31 December 2018: EUR 144 million), while EUR 206 million (31 December 2018: EUR 231 million) has not been recognised in respect of gross tax losses of EUR 1,267 million (31 December 2018: EUR 1,358 million). This is because sufficient future taxable profits related to these tax assets are not considered probable. These tax assets are mainly related to positions outside the Netherlands.
Tax credits and unrecognised tax creditsABN AMRO does not have any carry-forward tax credits at 31 December 2019. The following table shows when the operating losses as at 31 December 2019 expire.
(in millions) 2019 2020 2021 2022 2023 2024After 5
yearsNo
expiration Total
2019Loss carry-forward recognised 7 2 4 3 125 141
Loss carry-forward not recognised 6 7 5 3 1,252 1,275
Total tax losses carry-forward (gross) 6 7 7 8 4 6 1,377 1,416
2018Loss carry-forward recognised 9 7 1 4 34 55
Loss carry-forward not recognised 2 6 3 7 3 1,336 1,358
Total tax losses carry-forward (gross) 2 6 12 7 8 7 1,370 1,413
ABN AMRO does not recognise deferred tax in respect of investments in subsidiaries, branches, associates and interests in joint arrangements when ABN AMRO is able to control the timing of the reversal of the temporary difference and it is probable that the temporary difference will not be reversed in the foreseeable future.
Of the total amount of recognised net deferred assets, EUR 36 million (31 December 2018: EUR 37 million) relates to entities that suffered a loss in either the current or preceding year. The recognition of these deferred tax assets is based on a projection of future taxable income.
Tax related to equityTax related to each component of other comprehensive income and tax related to equity can be found in the Consolidated statement of comprehensive income and the Consolidated statement of changes in equity.
Income tax consequences of dividendThe Executive Board proposes, subject to approval by the Supervisory Board, a final dividend of EUR 639 million on the ordinary shares. The dividend will, in principle, be subject to 15% withholding tax.
Country-by-country reportingThe following table provides an overview of total assets, total operating income, average number of FTE, operating profit/(loss) before taxation and income tax expense, as well as the principal subsidiary and main activity, for each country. The full list of participating interests as referred to in Article 414, Book 2 of the Dutch Civil Code has been filed with the Trade Register.

ABN AMRO Bank Annual Report 2019
205Annual Financial Statements 2019 / Notes to the Consolidated Annual Financial Statements
31 December 2019
Principal subsidiary Main activityTotal
assets
Total operating
income (in millions)
Average number of
FTEs
Operating profit/(loss)
before taxation
(in millions)
Income tax expense
(in millions)
Netherlands ABN AMRO Bank N.V. Retail Banking 328,975 7,198 14,999 2,448 551
- of which international activities 2,869 75 17 34 8
France Banque Neuflize OBC S.A. Private Banking 5,369 295 818 70 21
Germany Bethmann Bank AG Private Banking 3,414 242 687 52 14
Belgium ABN AMRO Bank N.V. Branch Belgium Private Banking 1,789 116 356 -15 -1
United KingdomABN AMRO Asset based Finance N.V.,
UK brancheCommercial
Banking 2,350 76 323 29 6
Norway ABN AMRO Bank N.V. Oslo Branch
Corporate & Institutional
Banking 2,643 58 26 -27 -6
DenmarkABN AMRO Securities Holdings
(Denmark) ApS
Corporate & Institutional
Banking -119
Guernsey ABN AMRO (Guernsey) Ltd. Private Banking 22 71 -1 1
United States ABN AMRO Clearing Chicago LLC
Corporate & Institutional
Banking 19,560 324 422 29 40
Brazil Banco ABN AMRO S.A.
Corporate & Institutional
Banking 631 16 82 4 -1
SingaporeABN AMRO Bank N.V. Branch
Singapore
Corporate & Institutional
Banking 7,847 135 264 72 9
Hong KongABN AMRO Bank N.V. Branch Hong
Kong Private Banking 2,201 91 112 20 1
Japan ABN AMRO Clearing Tokyo Co. Ltd.
Corporate & Institutional
Banking -36 13 17 3 1
Australia ABN AMRO Clearing Sydney Pty Ltd.
Corporate & Institutional
Banking 359 14 60 -1 -1
Other 70 6 23 -3
Total 375,054 8,605 18,259 2,680 634
IntroductionStrategy and perform
anceRisk, funding &
capitalLeadership &
governanceOther
Annual Financial Statements 2019

ABN AMRO Bank Annual Report 2019
IntroductionStrategy and perform
anceRisk, funding &
capitalLeadership structure
GovernanceAnnual Financial Statem
entsOther
IntroductionStrategy and perform
anceRisk, funding &
capitalLeadership &
governanceOther
206
Annual Financial Statements 2019
Annual Financial Statements 2019 / Notes to the Consolidated Annual Financial Statements
31 December 2018
Principal subsidiary Main activityTotal
assets
Total operating
income (in millions)
Average number of
FTEs
Operating profit/(loss)
before taxation
(in millions)
Income tax expense
(in millions)
Netherlands1 ABN AMRO Bank N.V. Retail Banking 337,308 7,558 15,711 2,749 640
- of which international activities 3,224 94 14 -22 -8
France Banque Neuflize OBC S.A. Private Banking 6,099 324 893 80 25
Germany Bethmann Bank AG Private Banking 4,436 268 710 53 1
Belgium ABN AMRO Bank N.V. Branch Belgium Private Banking 1,113 92 233 -32 2
United Kingdom ABN AMRO Commercial Finance PlcCommercial
Banking 2,193 90 344 45 8
Luxembourg ABN AMRO Bank (Luxembourg) S.A. Private Banking 61 110 30 8
Norway ABN AMRO Bank N.V. Oslo Branch
Corporate & Institutional
Banking 2,794 61 31 -41 -8
DenmarkABN AMRO Securities Holdings
(Denmark) ApS
Corporate & Institutional
Banking -119
Jersey ABN AMRO Bank N.V. Jersey Branch Private Banking -8
Guernsey ABN AMRO (Guernsey) Ltd. Private Banking 389 43 130 21 2
United States ABN AMRO Clearing Chicago LLC
Corporate & Institutional
Banking 15,699 319 439 109 46
Brazil Banco ABN AMRO S.A.
Corporate & Institutional
Banking 392 18 88 10 5
Singapore ABN AMRO Bank N.V. Branch Singapore
Corporate & Institutional
Banking 8,131 139 280 68 8
Hong Kong ABN AMRO Bank N.V. Branch Hong Kong Private Banking 2,322 86 124 -12 -4
Japan ABN AMRO Clearing Tokyo Co. Ltd.
Corporate & Institutional
Banking 107 16 16 6 1
United Arab Emirates ABN AMRO Bank N.V. Branch UAE/DIFC Private Banking -4 1 17 1
Australia ABN AMRO Clearing Sydney Pty Ltd.
Corporate & Institutional
Banking 370 14 54 3 2
Other 72 2 22 -3
Total1 381,295 9,093 19,203 3,086 736
1 Comparative figures for 2018 have been restated. Please refer to Note 1 Accounting policies in the Consolidated Annual Financial Statements.
ABN AMRO received government grants for its TLTRO II programme in 2019 and 2018. This programme has a maturity of four years and will end in 2021.

ABN AMRO Bank Annual Report 2019
207Annual Financial Statements 2019 / Notes to the Consolidated Annual Financial Statements
11 Earnings per shareThe following table shows the composition of basic earnings per share.
2019 2018
(in millions)Profit/(loss) for
the period1
Number of shares
Earnings per share (in euros)
Profit/(loss) for the period1
Number of shares2
Earnings per share (in euros)
Basic earnings 1,941 940 2.06 2,209 940 2.35
1 Earnings consist of profit excluding results attributable to non-controlling interests and payments to holders of AT1 instruments.2 As a result of the merger of ABN AMRO Group N.V. and ABN AMRO Bank N.V. the numbers of shares have been adjusted for comparison reasons by aligning the number of shares
of ABN AMRO Bank N.V. to the number of shares of ABN AMRO Group N.V. Please refer to Note 1 Accounting policies in the Consolidated Annual Financial Statements.
ABN AMRO Bank N.V. does not have any dilutive potential ordinary shares. Therefore, only the basic earnings per ordinary share are disclosed. Basic earnings per ordinary share are calculated by dividing the profit attributable to the owners of the parent company by the weighted average number of ordinary shares outstanding.
The earnings per share in 2019 amounted to EUR 2.06 (2018: EUR 2.35). This is a decrease of EUR 0.29, or 12%. A final dividend of EUR 0.68 per share is proposed for 2019 (2018: EUR 0.80). Including the interim dividend paid on 3 September 2019 (EUR 564 million, or EUR 0.60 per share), the total dividend proposed is EUR 1.28 per share (2018: EUR 1.45).
12 Cash and balances at central banks
Accounting policy for cash and balances at central banksCash and balances at central banks are held at amortised cost. This item includes cash on hand and available demand deposits with central banks in countries in which the bank has a presence. Mandatory reserve deposits are disclosed in Note 19 Loans and advances banks.
(in millions) 31 December 2019 31 December 2018
AssetsCash on hand and other cash equivalents 183 314
Balances with central banks readily convertible in cash other than mandatory reserve deposits1 26,878 35,402
Total cash and balances at central banks1 27,061 35,716
1 ABN AMRO has reclassified EUR 1.3 billion from loans and advances banks to cash and balances at central banks in the comparative figures for 2018. Please refer to Note 1 Accounting policies in the Consolidated Annual Financial Statements.
Cash and balances at central banks decreased by EUR 8.7 billion to EUR 27.1 billion at 31 December 2019, mainly reflecting lower outstanding balances at several European central banks.
The decrease in cash on hand and other cash equivalents was mainly the result of the decision of ABN AMRO to temporarily close down ATMs due to a sharp rise in both the frequency and severity of raids against ATMs.
IntroductionStrategy and perform
anceRisk, funding &
capitalLeadership &
governanceOther
Annual Financial Statements 2019

ABN AMRO Bank Annual Report 2019
IntroductionStrategy and perform
anceRisk, funding &
capitalLeadership structure
GovernanceAnnual Financial Statem
entsOther
IntroductionStrategy and perform
anceRisk, funding &
capitalLeadership &
governanceOther
208
Annual Financial Statements 2019
Annual Financial Statements 2019 / Notes to the Consolidated Annual Financial Statements
13 Financial assets and liabilities held for trading
Accounting policy for financial assets and liabilities held for tradingIn accordance with IFRS 9, all assets and liabilities held for trading are measured at fair value through profit or loss, with gains and losses in the changes of the fair value taken to net trading income in the income statement.
Financial assets held for trading
(in millions) 31 December 2019 31 December 2018
Trading securities:Government bonds 486 273
Corporate debt securities 643 202
Equity securities 6 19
Total trading securities 1,136 494Trading book loans 2 1
Total assets held for trading 1,137 495
Financial assets held for trading increased by EUR 0.6 billion to EUR 1.1 billion at 31 December 2019 (31 December 2018: EUR 0.5 billion).
Government bonds increased by EUR 0.2 billion which was mainly related to changes in Dutch, German and French government bond positions. These portfolios are mainly a result of the primary dealership in these countries and for the purpose of client facilitation. Most of these contracts are hedged with short positions in corporate debt securities, government bonds and futures.
The increase of corporate debt securities by EUR 0.4 billion is a result of movements in various bonds, of which Dutch positions in credit institutions and financial institutions represent the main part.
Financial liabilities held for trading
(in millions) 31 December 2019 31 December 2018
Bonds 528 131
Equity securities 4
Total short security positions 528 135Other liabilities held for trading 147 117
Total liabilities held for trading 675 253
Financial liabilities held for trading increased by EUR 0.4 billion to EUR 0.7 billion at 31 December 2019.
The increase is the result of higher short positions in bonds, primarily in Dutch and German sovereign debt. To a lesser extent, there are short positions in French and Belgium bonds and corporate debt securities.
Other liabilities held for trading increased, mainly due to hedging activities.

ABN AMRO Bank Annual Report 2019
209Annual Financial Statements 2019 / Notes to the Consolidated Annual Financial Statements
14 Derivatives
Accounting policy for derivativesDerivatives comprise derivatives held for trading and derivatives held for risk management purposes. Derivatives held for trading are closely related to facilitating the needs of our clients. A significant part of the derivatives in the trading portfolio is related to serving clients in their risk management to hedge, for example, currency or interest rate exposures. ABN AMRO also offers products that are traded on the financial markets to institutional and individual clients and governments.
Derivatives held for risk management purposes include derivatives qualifying for hedge accounting and those used for economic hedges. A hedging instrument, for hedge accounting purposes, is a designated derivative whose fair value or cash flows are expected to offset changes in the fair value or cash flows of a designated hedged item. Derivative assets and liabilities subject to master netting arrangements are presented net only when they satisfy the eligibility requirements for netting under IAS 32. ABN AMRO did not have any netted derivative positions in the statement of financial position in either 2019 or 2018. As derivative transactions and the related cash collateral held at a CCP are settled on a daily basis, the carrying amount of these positions in the statement of financial position is nil. From a risk perspective, the gross amount of trading assets must be associated with the gross amount of trading liabilities, which are presented separately in the statement of financial position.
31 December 2019Derivatives held for trading Economic hedges Hedge accounting Total derivatives
(in millions) Interest rate Currency Other Interest rate Currency Other Interest rate
Exchange tradedFair value assets 1 1 14 2 18
Fair value liabilities 2 1 4 17 23
Notionals 459 195 60 1,095 1,809
Over-the-counterCentral counterpartiesFair value assetsFair value liabilitiesNotionals 1,049,209 1,708 111,554 1,162,471
Other bilateralFair value assets 3,476 541 465 99 292 18 820 5,712
Fair value liabilities 4,276 564 501 156 319 1 665 6,482
Notionals 130,614 77,469 5,164 746 20,094 367 16,911 251,364
TotalFair value assets 3,477 542 480 99 292 20 820 5,730
Fair value liabilities 4,278 565 505 156 319 18 665 6,505
Notionals 1,180,282 77,664 5,224 2,454 20,094 1,462 128,465 1,415,644
IntroductionStrategy and perform
anceRisk, funding &
capitalLeadership &
governanceOther
Annual Financial Statements 2019

ABN AMRO Bank Annual Report 2019
IntroductionStrategy and perform
anceRisk, funding &
capitalLeadership structure
GovernanceAnnual Financial Statem
entsOther
IntroductionStrategy and perform
anceRisk, funding &
capitalLeadership &
governanceOther
210
Annual Financial Statements 2019
Annual Financial Statements 2019 / Notes to the Consolidated Annual Financial Statements
31 December 2018
Derivatives held for trading Economic hedges Hedge accounting Total derivatives
(in millions) Interest rate Currency Other Interest rate Currency Other Interest rate
Exchange tradedFair value assets 1 143 14 158
Fair value liabilities 4 8 4 16
Notionals 55 43 173 436 706
Over-the-counterCentral counterpartiesFair value assetsFair value liabilitiesNotionals 962,063 540 127,294 1,089,897
Other bilateralFair value assets 3,484 769 443 91 280 23 943 6,033
Fair value liabilities 3,383 1,063 545 105 610 4 1,432 7,143
Notionals 131,702 92,186 1,971 971 29,520 723 10,952 268,025
TotalFair value assets 3,485 769 585 91 280 37 943 6,191
Fair value liabilities 3,387 1,063 553 105 610 9 1,432 7,159
Notionals 1,093,820 92,229 2,144 1,511 29,520 1,159 138,246 1,358,629
The notional amount of interest rate derivatives held for trading at 31 December 2019 amounted to EUR 1,180.3 billion (31 December 2018: EUR 1,093.8 billion), representing an increase of EUR 86.5 billion. This increase was mainly due to higher client activity of financial institutions.
The notional amount of currency derivatives held for trading at 31 December 2019 amounted to EUR 77.7 billion (31 December 2018: EUR 92.2 billion), representing a decrease of EUR 14.6 billion. This decrease was mainly due to lower client activity.
The notional amount of currency derivatives held for economic hedges at 31 December 2019 amounted to EUR 20.1 billion (31 December 2018: EUR 29.5 billion), representing a decrease of EUR 9.4 billion. This decrease was mainly due to the various types of transactions the bank utilises to manage foreign currency risk exposure.
The notional amount of interest rate derivatives held for hedge accounting at 31 December 2019 amounted to EUR 128.5 billion (31 December 2018: EUR 138.2 billion), representing a decrease of EUR 9.8 billion. As a result of interest rate risk management activities the portfolio of interest rate swaps declined with EUR 6.5 billion. Next to this ABN AMRO partially sold a Public Sector Loan portfolio of EUR 1.5 billion with related hedges of EUR 2.1 billion.
The hedging strategies are explained in greater detail in Note 15.

ABN AMRO Bank Annual Report 2019
211Annual Financial Statements 2019 / Notes to the Consolidated Annual Financial Statements
15 Hedge accounting
Accounting policy for hedge accounting ABN AMRO enters into various derivative and non-derivative instrument transactions with external parties to hedge risks on assets, liabilities and net investments. The accounting treatment of the hedged item and the hedging instrument depends on whether the hedge relationship qualifies for hedge accounting. Qualifying hedges may be designated as fair value hedges, cash flow hedges or hedges of net investments. A non-derivative financial asset or liability may be designated as a hedging instrument for hedge accounting purposes only if it hedges the risk of changes in foreign currency exchange rates. The hedged item can be an asset, liability, or net investment in a foreign operation that (a) exposes the entity to the risk of changes in fair value or future cash flows, and (b) is designated as being hedged. The risks being hedged (the hedged risks) are typically changes in interest rates or foreign currency rates. Both at the inception of the hedge and on an ongoing basis, ABN AMRO assesses whether the derivatives designated in each hedging relationship are expected to be and have been highly effective in offsetting changes in the fair value or cash flows of the hedged item (prospectively and retrospectively), using a regression analysis. Under the bank’s policy, ABN AMRO applies the following criteria to assess whether the hedging relationship is effective:
Å A regression co-efficient (R squared), which measures the correlation between the variables in the regression; and Å A slope of the regression line is within a 0.80-1.25 range.
Hedge ineffectiveness and gains and losses on components of a derivative that are excluded from the assessment of hedge effectiveness are recorded directly in the result from financial transactions as part of other operating income. ABN AMRO discontinues hedge accounting when the hedge relationship has ceased to be effective or is no longer expected to be effective, or when the derivative or hedged item is sold or otherwise terminated.
Adoption of EU carved-out version IAS 39Micro fair value hedges are hedging of separate hedged items, which can be assets or liabilities. For micro fair value hedging, ABN AMRO uses the carved-out version of IAS 39, as adopted by the European Union, which means that negative credit spreads are excluded in the hedge relationship for micro fair value hedging. Macro fair value hedging implies that a group of financial assets is reviewed in combination and jointly designated as the hedged item. However, the portfolio may, for risk management purposes, include assets and liabilities. In this context, the starting difference between the fair value and the carrying value of the hedged item at the designation of the hedging relationship is amortised over the remaining life of the hedged item. For macro fair value hedging, ABN AMRO uses the carved-out version of IAS 39, as adopted by the European Union, which removes some of the limitations on fair value hedges and the strict requirements on the effectiveness of those hedges. In this context, the impact of changes in the estimates of the repricing dates is considered ineffective only if it leads to over-hedging.
Fair value hedgesABN AMRO applies fair value hedge accounting on individual hedged items (micro fair value hedging), as well as on a portfolio of hedged items (macro fair value hedging). Where a derivative financial instrument hedges the exposure to changes in the fair value of the hedged item, the hedged item is adjusted in relation to the risk being hedged. Gains or losses on remeasurement of both the hedging instrument and the hedged item are recognised in the income statement within the result from financial transactions as part of other operating income. Hedge effectiveness for fair value hedges is measured as the amount by which the changes in the fair value of the hedging instrument are different from the changes in the fair value of the hedged item. When a fair value hedge of interest rate risk is terminated, any value adjustment to the carrying amount of the hedged item is amortised to profit or loss over the original designated hedging period, or taken directly to income if the hedged item is derecognised.
Micro fair value hedge accountingHedging instruments designated in individual fair value hedge relationships principally consist of interest rate swaps, interest rate options and cross-currency interest rate swaps that are used to protect against changes in the fair value of fixed-rate assets and fixed-rate liabilities due to changes in market interest rates.
IntroductionStrategy and perform
anceRisk, funding &
capitalLeadership &
governanceOther
Annual Financial Statements 2019

ABN AMRO Bank Annual Report 2019
IntroductionStrategy and perform
anceRisk, funding &
capitalLeadership structure
GovernanceAnnual Financial Statem
entsOther
IntroductionStrategy and perform
anceRisk, funding &
capitalLeadership &
governanceOther
212
Annual Financial Statements 2019
Annual Financial Statements 2019 / Notes to the Consolidated Annual Financial Statements
For qualifying fair value hedges, all changes in the fair value of the derivative and changes in the fair value of the hedged item for the risk being hedged are recognised in the income statement.
The main sources of hedge ineffectiveness in fair value hedges are: Å The effect of the counterparty and the bank’s own credit risk on the fair value of the interest rate swap that is not reflected in the fair value of the hedged item, which is only attributable to the change in the interest rate;
Å The difference in discounting between the hedged item and the hedging instrument; and Å Potential differences in maturities of the interest rate swap and the loans or notes.
There are no other sources of ineffectiveness in these hedge relationships.
Macro fair value hedge accountingABN AMRO manages the interest rate risk arising from fixed-rate mortgages by entering into interest rate swaps. The exposure from this portfolio frequently changes due to new loans originated, contractual repayments and prepayments made by customers in each period. More than one group (or portfolio) of mortgages can be identified as the hedged item within the fixed-rate mortgage portfolio. To ensure an effective matching of hedged items and hedging instruments, ABN AMRO applies a dynamic strategy in which hedged items are de-designated and re-designated on a monthly basis. The hedge accounting relationship is reviewed and re-designated on a monthly basis.
As a result of the macro fair value hedge, changes in the hedged item’s fair value due to changes in the appropriate benchmark interest rate are booked to the income statement and are offset by changes in the fair value of the hedging derivative financial instrument. This therefore reduces the profit or loss volatility that would otherwise arise from changes in the fair value of the interest rate swaps alone.
Hedged mortgages are fixed-rate mortgages with the following features: Å Denominated in local currency (euros); Å Fixed term to maturity or repricing; Å Pre-payable amortising or fixed principal amounts; Å Fixed interest payment dates; Å No interest rate options; Å Accounted for on an amortised cost basis.
At each designation, the mortgage cash flows are allocated to monthly time buckets, based on the expected maturity dates. ABN AMRO models the maturity dates of mortgages, taking into account the modelled prepayments applied to the contractual cash flows and the maturity dates of the mortgage portfolio. If the swap notional exceeds the expected mortgage notional in any given month, taking into account the uncertainty of the expected mortgage notional by applying a haircut, mortgages that mature in adjacent buckets are designated to the swaps.
Changes in the fair value of the mortgages that are attributable to the hedged interest rate risk are recorded under fair value adjustments from hedge accounting in order to adjust the carrying amount of the mortgages. The recognised fair value changes in the mortgages reduce the profit or loss volatility that would otherwise arise from changes in the fair value of the interest rate swaps.
The difference between the fair value attributable to the hedged interest rate risk and the carrying value of the hedged mortgages at de-designation of the hedge relationship is amortised over the remaining life of the hedged item.
In addition to the above sources of ineffectiveness for micro fair value hedges, the sources of ineffectiveness specifically for macro hedges are:
Å The difference between the expected and actual volume of prepayments for the mortgage portfolio to the extent the difference would lead to over-hedging; and
Å The difference in payment frequency between the fixed leg of the hedging instrument and the payment frequency of the hedged item (mortgages).
Cash flow hedgesABN AMRO applies macro cash flow hedge accounting by which it designates interest rate swaps as hedging instruments and future cash flows on non-trading assets and liabilities as hedged items. The hedge accounting relationship is reviewed on a monthly basis and the hedging instruments and hedged items are de-designated or re-designated, if necessary, to maintain an effective hedge accounting relationship.
ABN AMRO Bank Annual Report 2019
213Annual Financial Statements 2019 / Notes to the Consolidated Annual Financial Statements
When a derivative financial instrument hedges the exposure to variability in the cash flows from a hedged item, the effective part of any gain or loss on remeasurement of the hedging instrument is recognised directly in other comprehensive income. Hedge effectiveness for cash flow hedges is measured as the amount by which the changes in the fair value of the derivative are in excess of changes in the fair value of the expected cash flow in the cash flow hedge. Any ineffective part of the cash flow hedge is recognised in other operating income immediately. When a cash flow hedging instrument or hedge relationship is terminated but the hedged transaction is still expected to occur, the gains or losses are recognised in accumulated other comprehensive income.
The accumulated gains or losses recognised in other comprehensive income are transferred to the income statement when the hedged transaction affects net profit or loss and is included in the same line item as the hedged transaction. In the exceptional case that the hedged transaction is no longer expected to occur, the accumulated gains or losses recognised in other comprehensive income are recognised in the income statement immediately.
The main sources of hedge ineffectiveness for cash flow hedges are: Å The effect of the counterparty and the bank’s own credit risk on the fair value of the interest rate swap that is not reflected in the fair value of the hedged item, which is only attributable to the change in the interest rate; and
Å Potential differences in maturities of the interest rate swap and the loans or notes.
There are no other sources of ineffectiveness in these hedge relationships.
The hedged items in the macro cash flow hedge are future cash flows, which are derived from the projected balance sheet. This projected balance sheet takes the contractual terms and conditions of financial assets and liabilities and combines these with estimated prepayments, volume growth rates and interest scenarios.
Within the projected balance sheet, assets and liabilities are grouped on the basis of the specific interest rate index on which they reprice (e.g. one month, three months, six months, one year). For each repricing index, all assets and liabilities are allocated to monthly clusters in which they reprice up until their maturity.
The notional amounts of pay- or receive-floating swaps are designated to repricing all or a portion of current and forecasted assets and liabilities, respectively, in the clusters described above. These swap transactions are designated for hedge accounting purposes as a hedge of a gross position of a cluster of projected cash flows. In addition, the swap will only hedge the applicable floating swap rate portion of the interest repricing and reinvestment risk of the cluster. The availability of projected cash flows in the clusters is not constant over time and is therefore evaluated on a monthly basis. Changes in cash flow projections may lead to a revision of the designation. Back-testing is performed on the interest rate risk sensitivity models. Historical data are used to review the assumptions applied.
Hedging of net investments in foreign operationsABN AMRO may enter into foreign currency derivatives and currency borrowings to hedge various net investments in foreign operations. For such hedges, currency translation differences arising on translation of the currency of these instruments to euros are recognised directly in the currency translation reserve in other comprehensive income, insofar as they are effective. The accumulated gains or losses recognised in other comprehensive income are transferred to the income statement on the disposal of the foreign operation.
In previous years, ABN AMRO hedged its currency exposure to certain investments in foreign operations by hedging its net investment in these foreign operations with forward contracts. ABN AMRO currently still holds some currency translation reserve for these respective positions, but no longer applies net investment hedge accounting.
Hedges not qualifying for hedge accountingThe fair value changes of derivative transactions used to hedge against economic risk exposures that do not qualify for hedge accounting, or for which it is not cost-beneficial to apply hedge accounting, are recognised directly in profit or loss.
IntroductionStrategy and perform
anceRisk, funding &
capitalLeadership &
governanceOther
Annual Financial Statements 2019

ABN AMRO Bank Annual Report 2019
IntroductionStrategy and perform
anceRisk, funding &
capitalLeadership structure
GovernanceAnnual Financial Statem
entsOther
IntroductionStrategy and perform
anceRisk, funding &
capitalLeadership &
governanceOther
214
Annual Financial Statements 2019
Annual Financial Statements 2019 / Notes to the Consolidated Annual Financial Statements
Effect on financial position and performance - hedging instruments
Notional amount Carrying amount
Line item in the statement of
financial position
Changes in fair value used for calculation
hedge ineffectiveness for the year
(in millions) Assets Liabilities
31 December 2019Cash flow hedges - macroInterest rate 9,143 Derivatives -532Fair value hedges - macroInterest rate 22,111 Derivatives -862Fair value hedges - microInterest rate 97,210 820 665 Derivatives 787Economic hedgesTotal economic hedges 24,009 412 493 Derivatives n/a
31 December 2018Cash flow hedges - macroInterest rate 19,613 1 Derivatives -180
Fair value hedges - macroInterest rate 18,136 35 Derivatives 100
Fair value hedges - microInterest rate 100,496 942 1,397 Derivatives 204
Economic hedgesTotal economic hedges 32,190 408 724 Derivatives n/a
The total notional amount of the derivatives decreased by EUR 18.0 billion. The movements in the notional amounts are the result of movements in balance sheet items in a hedge and alignment with the bank’s risk appetite.

ABN AMRO Bank Annual Report 2019
215Annual Financial Statements 2019 / Notes to the Consolidated Annual Financial Statements
Effect on financial position and performance - hedged item
Carrying amount of the hedged item
Accumulated amount of fair
value hedge adjustments on
the hedged item
Line item in the statement of finan-
cial position
Change in value used for
calculating hedge
ineffectiveness for the year
Cash flow hedge reserve/Foreign
currency translation reserve
(in millions) Assets Liabilities Assets LiabilitiesContinuing
hedgesDiscontinued
hedges
31 December 2019Cash flow hedges – macroInterest rate 519 -917 -1,184Fair value hedges – macroInterest rate –
Financial assets at AC 24,906 2,795Residential mortgages 854
Fair value hedges – microInterest rate –
Financial assets at FVOCI 39,144 2,568Financial
investments 632
Interest rate – Financial assets at AC 1,193 548
Corporate & Other loans 306
Interest rate – Financial liabilities at AC 64,171 3,790
Issued debt & Sub-ordinated liabilities -1,751
Net investment hedgesCurrency -42
31 December 2018Cash flow hedges - macroInterest rate 185 -601 -850
Fair value hedges - macro
Interest rate – Financial assets at AC 20,238 2,101Residential mortgages -87
Fair value hedges - microInterest rate –
Financial assets at FVOCI 37,967 1,931Financial
investments -242
Interest rate – Financial assets at AC 3,030 1,084
Corporate & Other loans -281
Interest rate – Financial liabilities at AC 66,026 2,032
Issued debt & Sub-ordinated liabilities 289
Net investment hedgesCurrency -19
The carrying amount of the assets in a fair value hedge increased by EUR 4.0 billion. The movement is partly related to the decrease in interest rates and a higher amount of residential mortgages in a macro fair value hedge. The increase in notional amounts of hedged items is a result of alignment with the bank’s risk appetite.
The accumulated amount of fair value hedge adjustments remaining in the statement of financial position for hedged items that have ceased to be adjusted for hedging gains and losses amounted to EUR 0.6 billion at 31 December 2019 (2018: EUR 0.3 billion).
The carrying amount of the liabilities in a fair value hedge decreased by EUR 1.9 billion. The fair value of the issued debt and subordinated liabilities increased due to the decrease in interest rates. This movement was mostly offset by changes in the notional amount of issued debt and subordinated liabilties as a result of repayments.
The discontinued net investment hedges as stated in other comprehensive income decreased from EUR 19 million negative in 2018 to EUR 42 million negative in 2019. The decrease in the net investment hedge is mainly related to the sale of the activities in Guernsey, resulting in a release of this discontinued net investment hedge on Private Banking’s Channel Islands operations.
IntroductionStrategy and perform
anceRisk, funding &
capitalLeadership &
governanceOther
Annual Financial Statements 2019

ABN AMRO Bank Annual Report 2019
IntroductionStrategy and perform
anceRisk, funding &
capitalLeadership structure
GovernanceAnnual Financial Statem
entsOther
IntroductionStrategy and perform
anceRisk, funding &
capitalLeadership &
governanceOther
216
Annual Financial Statements 2019
Annual Financial Statements 2019 / Notes to the Consolidated Annual Financial Statements
Effect on financial position and performance - hedge ineffectiveness and hedging gains or lossesHedge ineffectiveness in all hedge accounting models is driven by changes in interest rate curves. In 2019, the yield curve of EUR tenors was flatter than the yield curve in 2018. Flattening of the yield curve leads to greater ineffectiveness of the hedge relationship.
(in millions)
Changes in fair value
used for calculation hedge inef-fectiveness
for the year - hedged item
Change in value used for
calculating hedge inef-fectiveness for the year
- hedging instrument
Hedge inef-fectivenes
recognised in profit or
loss
Line item in profit or loss (that
includes hedge ineffectiveness)
Change in the value of the hedging
instrument recognised
in OCI
Amount reclassified
from the Cash flow hedge reserve to
profit or loss - hedges item
affected profit or loss
Amount reclassified
from the Foreign
currency translation reserve to
profit or loss
Line item affected in profit or loss because of the reclassification
31 December 2019Cash flow hedges – macro
Interest rate 519 -532 -13Other operating
income -507 -143Net interest
income
Fair value hedges – macro
Interest rate 854 -862 -8Other operating
income
Fair value hedges – micro
Interest rate -813 787 -26Other operating
income
Net investment hedges
Currency -23Other operating
income
31 December 2018Cash flow hedges – macro
Interest rate 185 -180 1Other operating
income -352 127Net interest
income
Fair value hedges – macro
Interest rate -87 100 13Other operating
income
Fair value hedges – micro
Interest rate -234 204 -30Other operating
income
Net investment hedges
Currency -1Other operating
income
Effect on financial position and performance – reconciliationThe macro cash flow hedges are designed to mitigate the risk of changes in interest rates. The cash flow hedge reserve that is recognised in OCI (see the Consolidated statement of changes in equity) reconciles to the change in the value of the hedging instrument of the macro cash flow hedges and the amount reclassified from the cash flow hedge reserve to profit or loss (see the ‘Effect on financial position and performance - hedge ineffectiveness and hedging gains or losses’ table).
The change in the value of the hedging instrument in the macro cash flow hedges during 2019 was EUR 507 million negative (2018: EUR 352 million negative). The amount reclassified from the cash flow hedge reserve to profit or loss during 2019 was EUR 143 million negative (2018: EUR 127 million). The cash flow hedge reserve (net of tax) at 31 December 2019 was EUR 1.6 billion (31 December 2018: EUR 1.2 billion).

ABN AMRO Bank Annual Report 2019
217Annual Financial Statements 2019 / Notes to the Consolidated Annual Financial Statements
Amount, timing and uncertainty of future cash flows - hedging instruments
(in millions, nominal amounts)Within
3 months
More than 3 months but within 1 year
More than 1 year but
within 5 years
More than 5 years but
within 10 yearsMore than 10
years Total
31 December 2019Fair value hedges – microPayers – Interest rate 639 3,060 18,547 11,479 3,218 36,943
Receivers – Interest rate 365 8,516 25,204 8,982 17,200 60,267
31 December 2018Fair value hedges – microPayers – Interest rate 289 2,179 16,949 14,635 3,641 37,693
Receivers – Interest rate 3,653 3,185 30,043 9,933 15,988 62,803
The micro fair value hedge portfolio mainly comprises derivatives that hedge the interest rate risk on fixed-rate bonds in the liquidity buffer and fixed-rate issued debt. The weighted average fixed rate in the micro fair value hedge portfolio varied between 1.4% and 2.2% at 31 December 2019 (1.6% and 2.4% at 31 December 2018), depending on the origination date, currency, product type and original maturity. The interest rate range decreased in line with the market interest rate.
IBOR benchmark reformFor hedge accounting purposes specifically, ABN AMRO has analysed its significant hedging relationships directly affected by the benchmark reform and has concluded that it can continue existing hedging relationships without applying the exceptions provided for by the amendments made to IAS 39. Consequently, ABN AMRO has decided not to adopt the amendments early. Of the EUR 128.5 billion of notional derivatives that are part of hedging relationships, a total of EUR 99.7 billion expires after 1 January 2022 and is exposed to the benchmark reform. Of this total, EUR 89.6 billion is exposed to euro benchmarks, EUR 8.3 billion to USD, EUR 0.9 billion to GBP and EUR 0.7 billion to CHF, while EUR 0.1 billion is exposed to other non-euro benchmarks under reform. Fair value hedge accounting is applied to all non-euro exposures.
16 Financial investments
Accounting policy for financial investmentsFinancial investments include instruments measured at fair value through other comprehensive income (FVOCI) and instruments measured at fair value through profit or loss (FVTPL).
Accounting policy for instruments measured at fair value through other comprehensive incomeUnrealised gains and losses on FVOCI assets are recognised directly in other comprehensive income, net of applicable taxes. Interest earned, premiums, discounts and qualifying transaction costs of interest-earning FVOCI assets are amortised to income on an effective interest rate basis. When FVOCI debt instruments are sold, collected or impaired, the cumulative gain or loss recognised in other comprehensive income is transferred to other operating income in the income statement. Fair value changes in equity instruments that are irrevocably designated as FVOCI upon initial recognition are recognised in other comprehensive income and not subsequently reclassified to the income statement.
Accounting policy for financial instruments measured at fair value through profit and lossFinancial investments can be designated at FVTPL if doing so eliminates or significantly reduces a measurement or recognition inconsistency (an accounting mismatch). ABN AMRO also has financial instruments that are mandatorily measured at fair value because they do not meet the SPPI test.
IntroductionStrategy and perform
anceRisk, funding &
capitalLeadership &
governanceOther
Annual Financial Statements 2019

ABN AMRO Bank Annual Report 2019
IntroductionStrategy and perform
anceRisk, funding &
capitalLeadership structure
GovernanceAnnual Financial Statem
entsOther
IntroductionStrategy and perform
anceRisk, funding &
capitalLeadership &
governanceOther
218
Annual Financial Statements 2019
Annual Financial Statements 2019 / Notes to the Consolidated Annual Financial Statements
(in millions) 31 December 2019 31 December 2018
Financial investments:Debt securities held at fair value through other comprehensive income 44,437 41,180
Held at fair value through profit or loss 840 1,004
Total financial investments 45,277 42,184
Financial investments increased by EUR 3.1 billion to EUR 45.3 billion at 31 December 2019 (31 December 2018: EUR 42.2 billion). The increase in debt securities was mainly due to an increase in government bonds held. This increase was mainly attributable to investments in Japanese bonds.
Investments measured at fair value through other comprehensive incomeThe fair value of investments measured at FVOCI (including gross unrealised gains and losses) is specified in the following table.
(in millions) 31 December 2019 31 December 2018
Interest-earning securities:Dutch government 4,888 4,704
US Treasury and US government 7,097 6,919
Other OECD government 20,461 18,500
Non-OECD government 1,314 905
International bonds issued by the European Union 1,530 1,575
European Stability Mechanism 2,653 2,810
Mortgage- and other asset-backed securities 3,654 3,195
Financial institutions 2,828 2,444
Non-financial institutions 13 129
Total investments held at fair value through other comprehensive income 44,437 41,180
Most of these instruments are part of the liquidity buffer and are held for liquidity contingency purposes. More information on the composition of the liquidity buffer is provided in the Risk, funding & capital section.
Government bonds by country of origin
31 December 2019 31 December 2018
(in millions)
Accumulated unrealised gains/
(losses) and fair value hedges gains/(losses) Impairments Fair value
Accumulated unrealised gains/
(losses) and fair value hedges gains/(losses) Impairments Fair value
Dutch national government 611 4,888 585 4,704
French national government 158 2,786 177 3,034
German national government 541 6,009 474 5,594
Belgian national government 211 -1 2,755 217 3,064
Finnish national government 134 2,097 160 2,276
Austrian national government 254 1,911 257 1,905
USA national government 76 7,097 -84 6,919
Japanese national government -1 2,142 456
European Union bonds (excl. European Stability Mechanism) 114 1,530 103 1,575
Italian national governmentSpanish national governmentPolish national government 168 461 126 419
Swedish national government 29 30
Great Britain national government 110 287 88 256
Danish national government 4 184 1 182
Hong Kong 399 298
Luxembourg national government 49 1,010 19 582
Brazil national government 3 96 2 -1 114
Singapore national government 819 492
Australian national government 11
Canadian national government 35 778 25 703
Total government bonds 2,466 -1 35,289 2,152 -1 32,603

ABN AMRO Bank Annual Report 2019
219Annual Financial Statements 2019 / Notes to the Consolidated Annual Financial Statements
Impairments of EUR 1 million were recorded on government bonds. More information on the country risk positions is provided in the Risk, funding & capital section.
Critical accounting estimates and judgementsInterest-bearing debt securities classified as FVOCI investments are assessed at each reporting date to establish whether there are any expected credit losses. ABN AMRO has developed models to determine such credit losses. These are explained in more detail in the Risk, funding & capital section. Impairment charges on FVOCI instruments are recorded in (un)realised gains/(losses) fair value through OCI in the statement of comprehensive income.
Investments measured at fair value through profit or loss
(in millions) 31 December 2019 31 December 2018
Corporate debt securities 7 6
Investments designated held at fair value through profit or loss 7 6Private equities and venture capital 440 419
Equity securities 393 579
Investments mandatorily held at fair value through profit or loss 833 998
Total investments held at fair value through profit or loss 840 1,004
17 Securities financing
Accounting policy for securities financingSecurities financing is measured at amortised cost. Securities financing consists of securities borrowing and lending and sale and repurchase transactions. Securities borrowing and securities lending transactions are generally entered into on a collateralised basis, with securities usually advanced or received as collateral. The transfer of the securities themselves is not reflected in the statement of financial position unless the risks and rewards of ownership are also transferred. If cash is advanced or received, securities borrowing and lending activities are recorded at the amount of cash advanced (included in loans and advances) or received (due to banks or customers). The market value of the securities borrowed or lent is monitored on a daily basis, and the collateral levels are adjusted in accordance with the underlying transactions. Fees and interest received or paid are recognised on an effective interest rate basis and recorded as interest income or interest expense.
Sale and repurchase transactions involve purchases (or sales) of investments with agreements to resell (or repurchase) substantially identical investments at a certain date in the future at a fixed price. Investments purchased subject to commitments to resell them at future dates are not recognised. The amounts paid are recognised in loans and advances to either banks or customers and are shown as collateralised by the underlying security.
Investments sold under repurchase agreements continue to be recognised in the statement of financial position. Proceeds from the sale of the investments are reported as liabilities to either banks or customers. The difference between the sale and repurchase price is recognised over the period of the transaction and recorded as interest income or interest expense, using the effective interest rate method. If borrowed securities are sold to third parties, the proceeds from the sale and a liability for the obligation to return the collateral are recorded at fair value.
31 December 2019 31 December 2018
(in millions) Banks Customers Total Banks Customers Total
AssetsReverse repurchase agreements 2,713 7,736 10,449 2,412 5,119 7,531
Securities borrowing transactions 1,628 2,828 4,456 2,205 2,639 4,844
Total 4,341 10,564 14,905 4,617 7,758 12,375
LiabilitiesRepurchase agreements 91 6,277 6,368 694 4,725 5,419
Securities lending transactions 581 1,285 1,866 549 1,439 1,988
Total 672 7,562 8,234 1,243 6,164 7,407
IntroductionStrategy and perform
anceRisk, funding &
capitalLeadership &
governanceOther
Annual Financial Statements 2019

ABN AMRO Bank Annual Report 2019
IntroductionStrategy and perform
anceRisk, funding &
capitalLeadership structure
GovernanceAnnual Financial Statem
entsOther
IntroductionStrategy and perform
anceRisk, funding &
capitalLeadership &
governanceOther
220
Annual Financial Statements 2019
Annual Financial Statements 2019 / Notes to the Consolidated Annual Financial Statements
The total reverse repurchase agreements and total repurchase agreements increased at the year-end by EUR 2.9 billion and EUR 0.9 billion respectively, due to agreements with several large clients. Items of securities financing transactions that ABN AMRO can repledge or resell are included in Note 33 Transferred, pledged, encumbered and restricted assets.
18 Fair value of financial instruments carried at fair value
Accounting policy for fair value of financial instruments carried at fair valueThe fair value is defined as the price that would be received when selling an asset or paid when transferring a liability in an orderly transaction between market participants at the measurement date.
For financial instruments that are actively traded and for which quoted market prices or market parameters are readily available, the fair value is determined in a highly objective manner. However, when observable market prices and parameters do not exist, management judgement is necessary to estimate fair value.
For financial instruments where no active liquid market exists, or quoted prices are unobtainable, recent market transactions are used or the fair value is estimated using a variety of valuation techniques – including reference to similar instruments for which market prices do exist, or to valuation techniques such as discounted cash flow models or option pricing models (e.g. Black Scholes).
When portfolios of financial assets and liabilities are measured on the basis of the net exposure to the credit risk of a particular counterparty, any existing arrangements that mitigate the credit risk exposure (e.g. master netting agreements with the counterparty) are taken into account.
Unobservable inputs are estimated using a combination of management judgement, historical data, market practice and benchmarking to other relevant observable market data. The difference between the transaction price and the internal valuation at inception, calculated using a model, is reserved and amortised to profit or loss at appropriate points over the life of the instrument, typically taking account of the ability to obtain reliable external data, the passage of time and the use of offsetting transactions. Where inputs to the valuation of a new transaction cannot be reliably determined, the transaction is initially recognised at its transaction price. Subsequent changes in fair value as calculated by the valuation model are reported as profit or loss or in equity.
In order to determine a reliable fair value, where appropriate, management applies valuation adjustments to the pricing information derived from the above sources. These adjustments reflect management’s assessment of factors that market participants would consider in setting a price, to the extent that these factors have not already been included in the information from the above sources. The main valuation adjustments required to arrive at a fair value are as follows:
Å Credit and debit valuation adjustments. In addition to credit valuation for loans measured at fair value through profit or loss, credit valuation adjustments and debit valuation adjustments are incorporated into derivative valuations to reflect the impact on fair value of counterparty credit risk and how counterparties consider ABN AMRO’s creditworthiness respectively;
Å Funding valuation adjustment. The funding valuation adjustment incorporates the incremental cost of funding into the valuation of uncollateralised and partially collateralised derivatives;
Å Own credit adjustment. An own credit risk adjustment is applied to financial liabilities where it is believed that counterparties will consider ABN AMRO’s creditworthiness when pricing such instruments;
Å Model valuation adjustments for any known limitations. Management assesses the appropriateness of any model used on an ongoing basis. To the extent that the price provided by internal models does not represent the fair value of the instrument, for instance in highly stressed market conditions, management makes adjustments to the model valuation to calibrate to other available pricing sources.
We believe our estimates of the fair value are adequate. However, the use of different models or assumptions could result in changes to our reported results.

ABN AMRO Bank Annual Report 2019
221Annual Financial Statements 2019 / Notes to the Consolidated Annual Financial Statements
Valuation control frameworkABN AMRO has designated controls and processes for determining the fair value of financial instruments. A process has been designed to ensure there are formalised review protocols for independent review and validation of fair values separate from those businesses entering into the transactions. This includes specific controls to ensure consistent pricing policies and procedures, incorporating disciplined price verification for both market and counterparty risk trades.
The business entering into the transaction is responsible for the initial determination and recording of the fair value of the transaction. There are daily controls of the profit or loss recorded by trading and treasury front-office staff.
A key element of the control environment, segregated from the recording of the transaction’s valuation, is the independent price-verification process. Valuations are first calculated by the business. Such valuations may be current bid or offer prices in an active market, or may be derived using a model and variable model inputs. These valuations are reviewed and, if necessary, amended by the independent price-verification process. This process involves a team, independent of those trading the financial instruments, performing a review of valuations in the light of available pricing evidence. Independent price verification is frequently performed by matching the business valuations with independent data sources. For liquid instruments, the process is performed daily. The minimum frequency of review is monthly, both for trading positions and non-trading positions. The independent price-verification control includes formalised reporting and escalation to management of any valuation differences in breach of defined thresholds. When models are used to value products, those models are subject to a model review process. This process requires different levels of model documentation, testing and review, depending on the complexity of the model and the size of our exposure to the model.
Valuation techniquesA number of methodologies are used to determine the fair value of financial instruments for which observable prices in active markets for identical instruments are not available. Values between and beyond available data points are obtained by interpolation and/or extrapolation. When valuation techniques are used, the fair value can be significantly impacted by the choice of valuation model and underlying assumptions made concerning factors such as the amount and timing of cash flows, discount rates and credit risk.
Interest rate derivativesThis category includes interest rate swaps, cross-currency swaps, options and forward rate agreements. These products are valued by estimating future cash flows and discounting those cash flows, using appropriate interest rate curves. The exception is interest option contracts, which are valued using market standard option pricing models. The inputs for the discounting cash flow models are principally observable benchmark interest rates in active markets such as the interbank rates and quoted interest rates in the swap, bond and futures markets. The inputs for credit spreads – where available – are derived from prices of credit default swaps or other credit-based instruments, such as debt securities. In other cases, credit spreads are obtained from pricing services. The additional inputs for the option pricing models are price volatilities and correlations, which are obtained from broker quotations or pricing services or derived from option prices. Because of the observability of the inputs used in the valuation models, the majority of the interest rate derivative contracts are classified as level 2. If adjustments to interest rate curves, credit spreads, correlations or volatilities are based on significant unobservable inputs, the contracts are classified as level 3. Exchange traded options and futures are valued using quoted market prices and are hence classified as level 1.
Foreign exchange contractsForeign exchange contracts include foreign exchange forward contracts, foreign exchange options and foreign exchange swaps. The majority of the foreign exchange contracts at ABN AMRO are traded as over-the-counter derivatives. These instruments are valued using foreign currency exchange rates. There are observable markets both for spot and forward contracts and for futures in the world’s major currencies. Therefore the over-the-counter foreign exchange contracts are classified as level 2.
Government debt securitiesGovernment debt securities consist of government bonds and bills with fixed or floating rate interest payments issued by sovereign governments. These instruments are generally traded in active markets and prices can be derived directly from those markets. Therefore the instruments are classified as level 1. Highly liquid bonds are valued using exchange traded prices. Less liquid bonds are valued using observable market prices, which are sourced from broker quotes, inter-dealer prices or other reliable pricing services. For a minority of the government debt securities, active market prices are not available. In these cases ABN AMRO uses discounted cash flow valuation techniques that incorporate
IntroductionStrategy and perform
anceRisk, funding &
capitalLeadership &
governanceOther
Annual Financial Statements 2019

ABN AMRO Bank Annual Report 2019
IntroductionStrategy and perform
anceRisk, funding &
capitalLeadership structure
GovernanceAnnual Financial Statem
entsOther
IntroductionStrategy and perform
anceRisk, funding &
capitalLeadership &
governanceOther
222
Annual Financial Statements 2019
Annual Financial Statements 2019 / Notes to the Consolidated Annual Financial Statements
observable market data for similar government instruments. The main inputs are interest rate curves, liquidity spreads and credit spreads. The instruments for which this method applies are classified as level 2. If adjustments to any of the main inputs are made based on significant unobservable inputs, the instrument is classified as level 3.
Corporate debt securities Corporate debt securities primarily consist of corporate bonds and other debt securities issued by corporate entities. Most of these instruments are standard fixed or floating rate securities. Corporate debt securities are generally valued using observable market prices, which are sourced from broker quotes, inter-dealer prices or other reliable pricing services. These instruments are classified as level 1. If observable market prices are not available, ABN AMRO uses discounted cash flow valuation techniques, based on inputs derived from comparable instruments and credit default swap data of the issuer, to estimate credit spreads. These instruments are classified as level 2.
Equity instrumentsEquity instruments that are actively traded on public stock exchanges are valued using the readily available quoted prices and are therefore classified as level 1. Investments in private equity funds are initially recognised at their transaction price and remeasured to the extent reliable information is available on a case-by-case basis and are classified as level 3.
Loans and advances at fair value through profit or lossLoans and advances at fair value through profit or loss primarily consist of contracts with corporate clients where the contractual cash flows do not meet the SPPI requirements. The return on these contracts with embedded derivatives is based on the price of underlying commodity contracts or loans with a floating interest rate. Discounted cash flow models are used to value these contracts. The main inputs are interest rate curves, quoted commodity prices, liquidity spreads and credit spreads. The instruments are classified as level 2. If adjustments to interest rate curves, liquidity spreads and credit spreads are based on significant unobservable inputs, the instruments are classified as level 3.
Issued debtIssued debt securities are valued using discounted cash flow models, based on current interest rate curves that incorporate observable inputs. These instruments are classified as level 2. When there are no, or only limited, publicly quoted prices available for these instruments and unobservable inputs have a significant effect on the fair value calculation, these instruments are classified as level 3.
ABN AMRO refines and modifies its valuation techniques as markets and products develop and as the pricing for individual products becomes more or less readily available. While ABN AMRO believes its valuation techniques are appropriate and consistent with other market participants, the use of different methodologies or assumptions could result in different estimates of the fair value at the reporting date.
Fair value hierarchyABN AMRO analyses financial instruments held at fair value in the three categories described below.
Level 1 financial instruments are those that are valued using unadjusted quoted prices in active markets for identical financial instruments.
Level 2 financial instruments are those valued using techniques based primarily on observable market data. Instruments in this category are valued using quoted prices for similar instruments or identical instruments in markets that are not considered to be active, or using valuation techniques where all the inputs that have a significant effect on the valuation are directly or indirectly based on observable market data.
Level 3 financial instruments are those valued using a valuation technique where at least one input with a significant effect on the instrument’s valuation is not based on observable market data. The effect of fair value adjustments on the instrument’s valuation is included in the assessment.
ABN AMRO recognises transfers between levels of the fair value hierarchy at the end of the reporting period during which the change occurred.
The following table presents the valuation methods used in determining the fair values of financial instruments carried at fair value.

ABN AMRO Bank Annual Report 2019
223Annual Financial Statements 2019 / Notes to the Consolidated Annual Financial Statements
31 December 2019 31 December 2018
(in millions)
Quoted market prices
in active markets
Valuation techniques
- observable inputs
Valuation techniques
- significant unobservable
inputs
Total fair
value
Quoted market prices
in active markets
Valuation techniques
- observable inputs
Valuation techniques
- significant unobservable
inputs
Total fair
value
AssetsGovernment debt securities 486 486 272 273
Corporate debt securities 529 114 643 173 29 202
Equity securities 6 6 19 19
Other financial assets held for trading 2 2 1 1
Financial assets held for trading 1,021 116 1,137 465 31 495Interest rate derivatives 1 4,281 115 4,397 1 4,439 79 4,519
Foreign exchange contracts 1 823 10 834 751 18 769
Other derivatives 17 483 500 157 746 902
Derivatives 18 5,587 125 5,730 158 5,936 97 6,191Equity instruments 231 88 514 833 254 186 557 998
Other 7 7 6 6
Financial investments at fair value through profit or loss 239 88 514 840 260 186 557 1,004Government debt securities 37,431 50 461 37,942 34,994 419 35,413
Corporate debt securities 2,784 1 56 2,841 2,405 129 39 2,573
Other debt securities 3,654 3,654 3,174 20 3,195
Financial assets held at fair value through other comprehensive income 43,869 51 517 44,437 40,573 150 458 41,180Loans and advances at fair value through
profit or loss 1,254 13 1,267 787 787
Total financial assets 45,147 7,096 1,168 53,411 41,456 7,090 1,112 49,658
LiabilitiesShort positions in government debt
securities 185 185 53 53
Corporate debt securities 284 59 343 63 16 78
Equity securities 4 4
Other financial liabilities held for trading 147 147 117 117
Financial liabilities held for trading 469 206 675 120 133 253Interest rate derivatives 2 5,097 5,099 4 4,920 4,924
Foreign exchange contracts 1 883 884 1,673 1,673
Other derivatives 21 502 522 17 545 561
Derivatives 23 6,482 6,505 20 7,138 7,159Issued debt 1,024 1,024 889 156 1,045
Total financial liabilities 492 7,712 8,204 140 8,161 156 8,457
Transfers between levels 1 and 2There were no material transfers between levels 1 and 2 during the year.
Transfers from levels 1 and 2 to 3In 2018, there was a EUR 120 million transfer of equity instruments from level 3 to level 2. This amount related to the minority investment retained in the Capital A Funds, which are valued using the observable transaction price. In 2019, these instruments were transferred back to level 3.
For a number of derivatives held for trading, the significance of the unobservable valuation inputs changed during 2019, resulting in a net transfer of EUR 19 million from level 2 to level 3.
IntroductionStrategy and perform
anceRisk, funding &
capitalLeadership &
governanceOther
Annual Financial Statements 2019

ABN AMRO Bank Annual Report 2019
IntroductionStrategy and perform
anceRisk, funding &
capitalLeadership structure
GovernanceAnnual Financial Statem
entsOther
IntroductionStrategy and perform
anceRisk, funding &
capitalLeadership &
governanceOther
224
Annual Financial Statements 2019
Annual Financial Statements 2019 / Notes to the Consolidated Annual Financial Statements
Other transfersIn the financial investments at fair value through profit or loss, an amount of EUR 18 million was transferred from level 3 to level 2 as observable market data became available.
The issued debt notes were reported for EUR 156 million in level 3 in 2018. As there are quotations in the market for these types of notes that can be used for observable input to value these notes, the notes were transferred to level 2 in 2019.
Movements in level 3 financial instruments measured at fair valueThe following table shows a reconciliation of the opening and closing amounts of level 3 financial assets recorded at fair value.
Assets Liabilities
(in millions) Derivatives
Financial investments at fair value
through profit or loss
Financial assets held at fair value
through other comprehensive
income
Loans and advances at fair
value through profit or loss Issued debt
Balance at 1 January 2018 106 770 469 168Purchases 63
Sales -309
Gains/(losses) recorded in profit and loss1 233
Unrealised gains/(losses)2 -17 125 -12 -12
Transfer between levels 8 -120
Other movements -205
Balance at 31 December 2018 97 557 458 156Purchases 112 12
Sales -240
Redemptions -103
Gains/(losses) recorded in profit and loss1 39 1
Unrealised gains/(losses)2 9 53 47
Transfer between levels 19 102 -156
Other movements -5 13
Balance at 31 December 2019 125 514 517 13
1 Included in other operating income.2 Unrealised gains/(losses) on Derivatives held for trading are included in Net trading income, on instruments measured at FVtPL in Other operating income and on instruments measured
at FVOCI in Other comprehensive income.
Level 3 sensitivity informationInterest-earning securities - government bondsABN AMRO has a position in a Polish bond, denominated in euros (in Note 16 Financial investments, and part of Other OECD governments), for which the market is relatively illiquid. This bond is valued using a discounted cash flow model. The main inputs are the interest rate curve, liquidity spread and credit spread. The valuation spread is determined using an internal model. The sensitivity analysis is performed using a range of reasonable valuation spreads.
Interest-earning securities - otherPreference shares are shares for which the dividend is fixed for a period of ten years, after which the dividend is redetermined, and the shares can also be redeemed. The position is valued using a discounted cash flow model, for which the relevant inputs are the interest curve, liquidity spread and credit spread. The liquidity spread and credit spread are unobservable inputs and are derived from similar securities. The sensitivity of the preference shares is determined by using a range of reasonable spreads and by considering the call option held by the issuer.

ABN AMRO Bank Annual Report 2019
225Annual Financial Statements 2019 / Notes to the Consolidated Annual Financial Statements
Equity shares - Preferred sharesEquities measured at fair value through profit and loss and classified as level 3 mainly comprise private equity investments. Private equity shares are measured at fair value, with two calculation techniques being applied:
Å Using comparable pricing in accordance with the International Private Equity and Venture Capital Valuation Guidelines This valuation technique is based on earnings multiples of comparable listed and unlisted companies. The fair value calculation of an investment is strongly linked with movements on public equity markets;
Å Net Asset Value (NAV) for fund investments and asset-backed investments. This is determined by using audited and unaudited company financial statements and any other information available, publicly or otherwise. As a consequence, the net asset value calculation of an investment is strongly linked to movements in the quarterly performance of the company and can be used as an indicator of fair value.
New investments are initially valued at fair value. Subsequently, the fair value technique, either EVCA technique or NAV calculation, is applied for direct investments.
The sensitivity for using comparable pricing is determined by stressing the earnings multiples in a positive and negative market scenario, whereas sensitivity testing for the NAV calculation based upon the quarterly performance cannot be applied.
DerivativesABN AMRO applies a credit valuation adjustment (CVA) that reflects counterparty credit risk in the fair value measurement of uncollateralised and partially collateralised OTC derivatives. For counterparties that do not have an observable credit spread, ABN AMRO applies a proxied credit spread extracted from counterparties of comparable credit quality that do have an observable credit spread. ABN AMRO performs a probability of default assessment for each counterparty and allocates an appropriate internal credit risk measure known as a Uniform Counterparty Rating (UCR). This UCR, which is significant to the entire fair value measurement of the derivative contracts included in the following table of level 3 sensitivity information, is internally generated and is therefore an unobservable input.
Valuation technique
Unobservable data
Carrying value
Possible alternative assumptions
Unobservable data range
Unobservable data base
(in millions)Applying minimum
Applying maximum
Applying minimum
Applying maximum
31 December 2019
Equity sharesPrivate equity
valuationEBITDA
multiples 45 -5 5 5.0 6.0 5.5
Equity sharesPrivate equity
valuationNet asset
value 469 -47 29
Interest-earning securities – Government bonds
Discounted cash flow
Liquidity and credit spread 461 -12 14 7 66 39
Interest-earning securities – other
Discounted cash flow
Liquidity and credit spread 56 -4 135 397 164
Derivatives held for tradingDiscounted
cash flowProbability
of default 125 -7 10 0.2% 100.0% 54.0%
31 December 2018
Equity sharesPrivate equity
valuationEBITDA
multiples 59 -7 9 6.0 6.0 6.0
Equity sharesPrivate equity
valuationNet asset
value 498 -24 24
Interest-earning securities – Government bonds
Discounted cash flow
Liquidity and credit spread 419 -26 13 36 124 65
Interest-earning securities – other
Discounted cash flow
Liquidity and credit spread 39 2 408 515 496
Derivatives held for tradingDiscounted
cash flowProbability
of default 97 -5 10 0.2% 100.0% 27.3%
Issued debtDiscounted
cash flow Credit spread 156 -1 1 100 124 109
IntroductionStrategy and perform
anceRisk, funding &
capitalLeadership &
governanceOther
Annual Financial Statements 2019

ABN AMRO Bank Annual Report 2019
IntroductionStrategy and perform
anceRisk, funding &
capitalLeadership structure
GovernanceAnnual Financial Statem
entsOther
IntroductionStrategy and perform
anceRisk, funding &
capitalLeadership &
governanceOther
226
Annual Financial Statements 2019
Annual Financial Statements 2019 / Notes to the Consolidated Annual Financial Statements
19 Loans and advances banks
Accounting policy for loans and advances banks and loans and advances customersLoans and advances banks and loans and advances customers are held in a ‘hold to collect’ business model. Loans and advances where the contractual cash flows are solely payments of principal and interest (SPPI) are measured at amortised cost, i.e. fair value at initial recognition, adjusted for repayment and amortisation of coupon, fees and expenses to represent the effective interest rate of the asset. Loans and advances that do not pass the SPPI test are measured at fair value through profit or loss. Please refer to Note 1 Accounting policies in the Consolidated Annual Financial Statements and to the Credit Risk Management section (Acccounting policy for measuring allowances for credit losses).
(in millions) 31 December 2019 31 December 2018
Interest-bearing deposits1 1,508 2,144
Loans and advances 1,784 2,870
Mandatory reserve deposits with central banks 293 284
Other 1,431 1,490
Subtotal 5,016 6,789Less: loan impairment allowance 5 9
Loans and advances banks1 5,011 6,780
1 ABN AMRO has reclassified EUR 1.3 billion from loans and advances banks to cash and balances at central banks in the comparative figures for 2018. Please refer to Note 1 Accounting policies in the Consolidated Annual Financial Statements.
Loans and advances banks decreased by EUR 1.8 billion to EUR 5.0 billion at 31 December 2019. This decrease was mainly a result of a decrease in interest-bearing deposits and a decrease in loans and advances.
Interest-bearing deposits decreased by EUR 0.6 billion to EUR 1.5 billion at 31 December 2019, mainly as a result of the decrease in interbank deposits.
Loans and advances decreased by EUR 1.1 billion to EUR 1.8 billion at 31 December 2019, mainly due to lower interbank positions.
Mandatory reserve deposits are held with local central banks in accordance with statutory requirements. These deposits are not available to finance ABN AMRO’s day-to-day operations.
20 Loans and advances customers
Accounting policy for loans and advances customersThe accounting policy for loans and advances customers is included in loans and advances banks (Note 19). Please refer to Note 1 Accounting policies in the Consolidated Annual Financial Statements and to the Credit Risk Management section (Accounting policy for measuring allowances for credit losses).

ABN AMRO Bank Annual Report 2019
227Annual Financial Statements 2019 / Notes to the Consolidated Annual Financial Statements
(in millions) 31 December 2019 31 December 2018
Residential mortgages (excluding fair value adjustment) 148,225 148,791
Fair value adjustment from hedge accounting on residential mortgages 2,795 2,101
Residential mortgages, gross 151,020 150,892Less: loan impairment allowances - residential mortgage loans 140 108
Residential mortgages 150,880 150,784Consumer loans, gross 12,294 12,263
Less: loan impairment allowances - consumer loans 298 318
Consumer loans 11,997 11,945Corporate loans 89,879 92,533
Fair value adjustment from hedge accounting on corporate loans 547 1,071
Financial lease receivables 5,721 5,112
Factoring 3,507 3,519
Corporate loans, gross1 99,654 102,234Less: loan impairment allowances - corporate loans 1,982 1,825
Corporate loans at amortised cost 97,672 100,408Corporate loans at fair value through P&L 1,261 783
Corporate loans 98,933 101,191Government and official institutions 1,354 1,371
Other loans 4,938 5,586
Fair value adjustment from hedge accounting on other loans 1 13
Other loans and advances customers, gross1 6,292 6,970Less: loan impairment allowances - other 6 9
Other loans at amortised cost 6,287 6,961Other loans at fair value through P&L 5 5
Other loans and advances customers 6,292 6,966
Loans and advances customers 268,102 270,886
1 Excluding loans at fair value through P&L.
Loans and advances customers remained relatively stable, with a slight decrease of EUR 2.8 billion to EUR 268.1 billion at 31 December 2019.
Residential mortgages slightly increased by EUR 0.1 billion to EUR 150.9 billion at 31 December 2019.
Consumer loans slightly increased by EUR 0.1 billion to EUR 12.0 billion at 31 December 2019.
Corporate loans decreased by EUR 2.3 billion to EUR 98.9 billion at 31 December 2019. The decrease was mainly caused by a decrease in the corporate banking business, partly offset by an increase in collateral pledged.
Other loans and advances customers decreased by EUR 0.7 billion to EUR 6.3 billion at 31 December 2019.
21 Fair value of financial instruments not carried at fair value
Accounting policy for fair value of financial instruments not carried at fair valueThe categorisation and valuation of financial instruments not carried at fair value is determined in accordance with the accounting policies set out in Note 18.
Valuation methodologiesThe methods and assumptions described below have been applied to estimate the fair value of financial instruments not carried at fair value. These fair values were calculated for disclosure purposes only. Note that the fair value can be significantly impacted by the choice of valuation model and underlying assumptions concerning factors such as the amount and timing of cash flows, discount rates, credit risk and liquidity risk.
IntroductionStrategy and perform
anceRisk, funding &
capitalLeadership &
governanceOther
Annual Financial Statements 2019

ABN AMRO Bank Annual Report 2019
IntroductionStrategy and perform
anceRisk, funding &
capitalLeadership structure
GovernanceAnnual Financial Statem
entsOther
IntroductionStrategy and perform
anceRisk, funding &
capitalLeadership &
governanceOther
228
Annual Financial Statements 2019
Annual Financial Statements 2019 / Notes to the Consolidated Annual Financial Statements
Short-term financial instrumentsThe carrying amounts (net of impairment allowances) of financial instruments maturing within a period of less than three months or that have no contractual maturity are assumed to be a reasonable approximation of their fair value. For certain instruments, behavioural maturities are applied.
Short-term financial instruments are classified as level 2 as unobservable inputs (such as inputs to determine credit risk, prepayment risk and liquidity risk) do not have a significant influence in determining the fair value.
Cash and balances at central banksCash and balances at central banks are classified as level 1 as these instruments have a short-term nature, prices from an active market are available and no fair value adjustments are made to the carrying amounts.
Securities financingSecurities financing includes repurchase and reverse repurchase agreements and securities borrowing and lending transactions. Due to the short-term characteristics of these instruments and the value and liquidity of available collateral, the carrying amounts (net of impairment allowances) are considered to approximate the fair value. Securities financing amounts are classified as level 2.
Loans and advances banks and loans and advances customersThe fair value of loans and advances banks and loans and advances customers is estimated by a discounted cash flow model based on contractual cash flows, using actual yields and discounting by risk-free interest rates. Adjustments to reflect changes in liquidity spreads are applied and prepayment options are included in the estimated fair value. The calculations are adjusted for credit risk by incorporating the expected credit losses over the estimated lifetime of the loan, based on parameters including probability of default, loss given default and exposure at default. The loans and advances are classified as level 3 on the basis that unobservable inputs significantly influence the approximated fair values. The loans and advances for which unobservable inputs do not significantly influence the approximated fair values are classified as level 2. Behavioural maturities instead of contractual maturities are used to determine the level classification of a small part of the portfolio.
Cash collateral paid to counterparties in relation to Credit Support Annexes (CSA) is included in loans and advances banks and loans and advances customers. Due to the short-term characteristics of these instruments, fair value is considered to approximate the carrying amounts. The related amounts are classified as level 2.
Due to banks and customersThe fair value of instruments such as deposits and borrowings included in due to banks and customers is estimated by a discounted cash flow model based on risk-free interest rates. Adjustments to reflect changes in liquidity spreads are applied. Amounts due to banks and customers are classified as level 3 on the basis that unobservable inputs significantly influence the approximated fair values. The financial instruments for which unobservable inputs do not significantly influence the approximated fair values are classified as level 2. For the majority of the portfolio, behavioural maturities are used to determine the level classification.
Cash collateral liabilities in relation to Credit Support Annexes (CSA) are included in due to banks and customers. Due to the short-term characteristics of these instruments, fair value is considered to approximate the carrying amounts. The related amounts are classified as level 2.
Issued debt and subordinated liabilitiesThe fair value of issued debt securities and subordinated liabilities is based on quoted prices. If these are not available, the fair value is based on a market approach in which independent quotes from market participants are used for the debt issuance spreads above the average interbank offered rates (over a range of tenors) that the market would demand when purchasing new senior or subordinated debt from ABN AMRO. Where necessary, these quotes are interpolated, using a curve shape derived from CDS prices.

ABN AMRO Bank Annual Report 2019
229Annual Financial Statements 2019 / Notes to the Consolidated Annual Financial Statements
31 December 2019Carrying value Total fair value Difference
(in millions)
Quoted market prices in active
markets
Valuation techniques
-observable inputs
Valuation techniques -significant
unobservable inputs
AssetsCash and balances at central banks 27,061 27,061 27,061
Securities financing 14,905 14,905 14,905
Loans and advances banks 5,011 4,526 493 5,018 7
Loans and advances customers 266,835 23,924 247,271 271,195 4,361
Total 313,811 27,061 43,355 247,764 318,179 4,368
LiabilitiesSecurities financing 8,234 8,234 8,234
Due to banks 12,785 4,841 7,975 12,816 31
Due to customers 234,991 65,869 167,390 233,258 -1,733
Issued debt 74,252 48,629 30,055 78,684 4,432
Subordinated liabilities 10,041 8,705 2,081 10,786 745
Total 340,302 57,334 111,079 175,365 343,778 3,476
31 December 2018
Carrying value Total fair value Difference
(in millions)
Quoted market prices in active
markets
Valuation techniques
-observable inputs
Valuation techniques -significant
unobservable inputs
AssetsCash and balances at central banks1 35,716 35,716 35,716
Securities financing 12,375 12,375 12,375
Loans and advances banks1 6,780 6,296 491 6,787 8
Loans and advances customers 270,099 13,284 258,656 271,940 1,841
Total 324,969 35,716 31,955 259,147 326,818 1,849
LiabilitiesSecurities financing 7,407 7,407 7,407
Due to banks 13,437 1,472 11,914 13,386 -51
Due to customers 236,123 59,332 172,702 232,034 -4,089
Issued debt 79,739 47,882 33,730 81,612 1,873
Subordinated liabilities 9,805 9,547 803 10,350 545
Total 346,510 57,429 102,743 184,617 344,788 -1,722
1 ABN AMRO has reclassified EUR 1.3 billion from loans and advances banks to cash and balances at central banks in the comparative figures for 2018. Please refer to Note 1 Accounting policies in the Consolidated Annual Financial Statements.
22 Bank structure
Accounting policy for business combinationsThe bank accounts for business combinations using the acquisition method when control is transferred to the bank. All items of consideration, including contingent consideration, transferred by ABN AMRO are measured and recognised at fair value at the acquisition date. Transaction costs incurred by ABN AMRO in connection with the business combination, other than those associated with the issuance of debt and equity securities, do not form part of the cost of the business combination transaction but are expensed as incurred. The excess of the purchase consideration over ABN AMRO’s share of the fair value of the identifiable net assets acquired (including certain contingent liabilities) is recorded as goodwill. ABN AMRO measures the identifiable assets acquired and the liabilities assumed at the fair value at the acquisition date.
IntroductionStrategy and perform
anceRisk, funding &
capitalLeadership &
governanceOther
Annual Financial Statements 2019

ABN AMRO Bank Annual Report 2019
IntroductionStrategy and perform
anceRisk, funding &
capitalLeadership structure
GovernanceAnnual Financial Statem
entsOther
IntroductionStrategy and perform
anceRisk, funding &
capitalLeadership &
governanceOther
230
Annual Financial Statements 2019
Annual Financial Statements 2019 / Notes to the Consolidated Annual Financial Statements
In a step acquisition, where a business combination occurs in stages and control of the business is obtained in stages, the identifiable assets and liabilities of the acquiree are recognised at fair value when control is obtained. A gain or loss is recognised in profit or loss as the difference between the fair value of the previously held equity interest in the acquiree and its carrying amount. Changes in interests in subsidiaries that do not result in a change of control are treated as transactions between equity holders and are reported in equity.
Accounting policy for subsidiariesABN AMRO Bank’s subsidiaries are those entities which it directly or indirectly controls. Control over an entity is evidenced by ABN AMRO’s ability to exercise its power in order to affect the variable returns that it is exposed to through its involvement in the entity. The existence and effect of potential voting rights that are currently exercisable are taken into account when assessing whether control exists.
The assessment of control is based on consideration of all facts and circumstances. The bank reassesses whether it controls an investee if facts and circumstances indicate that there are changes to one or more of the three elements of control (power, exposure to variability in returns, and a link between the two).
ABN AMRO sponsors entities, including certain special purpose entities, which may or may not be directly owned, for the purpose of asset securitisation transactions and other specific and well-defined objectives. Particularly in the case of securitisations, these entities may acquire assets from ABN AMRO companies. Some of these entities hold assets that are not available to meet the claims of creditors of ABN AMRO or its subsidiaries. These entities are consolidated in ABN AMRO’s financial statements when the substance of the relationship between ABN AMRO and the entity indicates that control is held by ABN AMRO.
ABN AMRO is mainly involved in securitisations of own originated assets, such as various consumer and commercial financial assets. This process generally necessitates a sale of these assets to a special purpose entity (SPE), which in turn issues securities to investors. ABN AMRO’s interests in securitised assets may be retained in the form of senior or subordinated tranches, issued guarantees, interest-only strips or other residual interests, together referred to as retained interests. In many cases, these retained interests convey control, such that the SPE is consolidated and the securitised assets continue to be recognised in the consolidated statement of financial position.
The financial statements of subsidiaries and special purpose entities are included in the Consolidated Annual Financial Statements from the date on which control commences until the date on which control ceases.
Accounting policy for associates and joint venturesAssociates are those entities in which ABN AMRO has significant influence on, but no control or joint control over, the operating and financial policies. Significant influence is generally presumed when ABN AMRO holds between 20% and 50% of the voting rights. Potential voting rights that are currently exercisable are considered in assessing whether ABN AMRO has significant influence. Among other factors, representation on the board of directors, participation in the policy-making process and material transactions between the entity and the investee are considered to determine significant influence.
A joint venture is an investment in which two or more parties have contractually agreed to share control over the investment. Joint control exists only when decisions about the relevant activities require the unanimous consent of the parties sharing control. The activities conducted through joint ventures include cash transfers, insurance, finance and leasing.
Investments in associates and joint ventures, including strategic investments, are accounted for using the equity method. Under this method, the investment is initially recorded at cost and subsequently increased (or decreased) for post-acquisition net income (or loss), other movements impacting on the equity of the investee and any adjustments required for impairment. ABN AMRO’s share of the profit or loss of the investee is recognised in Share of result in equity accounted investements. If ABN AMRO’s share of losses exceeds the carrying amount of the investment, the carrying amount is reduced to zero, including any other unsecured receivables, and recognition of further losses is discontinued except if ABN AMRO has incurred obligations or made payments on behalf of the investee.
Equity investments held without significant influence and which are not held for trading are measured at fair value through profit or loss as ABN AMRO does not apply the option to measure such investments at fair value through other comprehensive income.

ABN AMRO Bank Annual Report 2019
231Annual Financial Statements 2019 / Notes to the Consolidated Annual Financial Statements
Assets and liabilities of acquisitions and divestmentsThe following table provides details of the assets and liabilities resulting from the acquisition or disposal of subsidiaries and equity accounted investments at the date of acquisition or disposal.
31 December 2019 31 December 2018
(in millions) Acquisitions Divestments Acquisitions Divestments
Assets and liabilities of acquisitions and divestmentsCash and balances at central banks 521 -246
Derivatives -3 -1
Financial investments 76 -35
Loans and advances banks 123 -2,668 -2,225
Loans and advances customers 519 -583 -274
Equity accounted investments 97 -11 129 -123
Property and equipment 8 -41
Goodwill and other intangible assets 19 -15
Other assets -90 -55 -2,435
Derivatives 3 1
Due to banks -5 1 99
Due to customers -1,144 3,085 2,115
Provisions -1 57
Tax liabilities -5 8
Other liabilities -23 91 2,690
Net assets acquired/Net assets divested 97 -196 129 -368Result on divestments, gross 103 42
Less: non-cash items 46
Taxes on gain on disposal
Result on disposal net of taxes 149 42
Cash used for acquisitions/received from divestments:Total purchase consideration/Proceeds from sale -97 345 -129 410
Cash and cash equivalents acquired/divested 531 -1,523 -86
Cash used for acquisitions/received from divestments 435 -1,179 -129 324
Acquisitions in 2019On 28 February 2019, ABN AMRO completed the acquisition of Societe Generale Private Banking N.V., the private banking subsidiary of Societe Generale in Belgium. By acquiring 100% of the shares, ABN AMRO strengthened its market position in Belgium and its position as a leading private bank in the eurozone.
The purchase includes a total of EUR 1.3 billion in assets and EUR 1.2 billion in liabilities, which is considered to be the fair value at acquisition date as these assets and liabilities are all short-term. In addition, ABN AMRO paid a purchase premium of EUR 47 million, which included EUR 19 million for the obtained client relationships. ABN AMRO recognised an amount of EUR 28 million as goodwill based on synergies expected from integrating the private banking activities of Societe Generale in Belgium with those of ABN AMRO. This goodwill was included in the annual impairment test. No impairment was recognised. The purchased private banking activities did not contribute significantly to ABN AMRO’s income statement for 2019. In September 2019, the acquired business merged with the ABN AMRO Belgium branch.
Acquisitions include several small investments in equity associates and joint ventures.
Divestments in 2019On 28 March 2019, ABN AMRO announced that it had reached agreement to sell 75% of its shares in Stater N.V. to Infosys. This transaction was completed on 23 May 2019. ABN AMRO retained a strategic interest of 25% in Stater N.V. The book gain amounted to EUR 130 million, the portion of gain attributable to measuring the investment retained in Stater N.V. at its fair value at the date when control was lost amounted to EUR 34 million.
On 15 July 2019, ABN AMRO announced the closing and finalisation of the sale of ABN AMRO Channel Islands Ltd to Bank of N.T. Butterfield & Son Ltd. With a loss of EUR 33 million, this sale had a modest impact on the income statement.
IntroductionStrategy and perform
anceRisk, funding &
capitalLeadership &
governanceOther
Annual Financial Statements 2019

ABN AMRO Bank Annual Report 2019
IntroductionStrategy and perform
anceRisk, funding &
capitalLeadership structure
GovernanceAnnual Financial Statem
entsOther
IntroductionStrategy and perform
anceRisk, funding &
capitalLeadership &
governanceOther
232
Annual Financial Statements 2019
Annual Financial Statements 2019 / Notes to the Consolidated Annual Financial Statements
On 23 December 2019, ABN AMRO announced the closing of the sale of the Duin & Kruidberg country estate, which was finalised the same day. The sale did not significantly impact the income statement.
Acquisitions in 2018Acquisitions include investments in several equity associates and joint ventures in 2018.
Divestments in 2018On 16 November 2018, ABN AMRO announced its plan to sell part of its stake in the investment funds of ABN AMRO Participaties Fund III, V, VI and VII. The transaction subsequently closed on 14 December 2018. ABN AMRO has retained a minority interest of approximately 47% in these funds. These interests are recorded at fair value. The portion of gain attributable to measuring the investment retained in the Capital A funds at its fair value at the date when control was lost amounted to EUR 7 million.
On 20 February 2018, BGL BNP Paribas and ABN AMRO Bank N.V. announced an agreement concerning the acquisition by BGL BNP Paribas of all outstanding shares in ABN AMRO Bank (Luxembourg) S.A. and its wholly owned subsidiary ABN AMRO Life S.A. After approval by the regulatory authorities, the transaction was completed on 3 September 2018. As part of this transaction, the activities of ABN AMRO Life S.A. were taken over by Cardif Lux Vie.
Composition of ABN AMRO BankThe following table provides an overview of the most significant investments in associates and joint ventures.
31 December 2019 31 December 2018
(in millions)
Principal place of
businessBusiness
lineCarrying amount
Equity interest
(in %)Carrying amount
Equity interest
(in %)
Joint ventures:Neuflize Vie S.A. France Private Banking 222 60% 210 60%
Richmond Preferente Aandelen C. B.V. The NetherlandsCorporate &
Institutional Banking 25 50% 25 50%
Nord Maas Feeders GmbH GermanyCorporate &
Institutional Banking 25 50%
MW Shipping B.V. The NetherlandsCorporate &
Institutional Banking 24 50% 22 50%
GriegMaas AS NorwayCorporate &
Institutional Banking 18 50%
Associates:Nationale-Nederlanden ABN AMRO
Verzekeringen Holding B.V.1 The Netherlands Retail Banking 98 49% 104 49%
Stater N.V. The Netherlands Retail Banking 50 25%
European Merchant Services B.V. The Netherlands Commercial Banking 27 49% 24 49%
Geldmaat B.V. The Netherlands Group Functions 25 33% 16 33%
Private Equity InvestmentsCorporate &
Institutional Banking 107 83
Other 19 39
Total equity associates and joint ventures 639 522
1 In 2018 Delta Lloyd ABN AMRO Verzekeringen Holding B.V. changed its name into Nationale-Nederlanden ABN AMRO Verzekeringen Holding B.V.
Neuflize Vie is a joint venture where the power to govern the financial and operating policies of the economic activity is subject to joint control.
The total amount of the investments in equity associates and joint ventures amounted to EUR 0.6 billion at 31 December 2019, representing an increase of EUR 0.1 billion compared with 31 December 2018. This increase in the total carrying amount was mainly the result of the retained stake in Stater N.V. and acquisitions of equity associates and joint ventures during 2019.
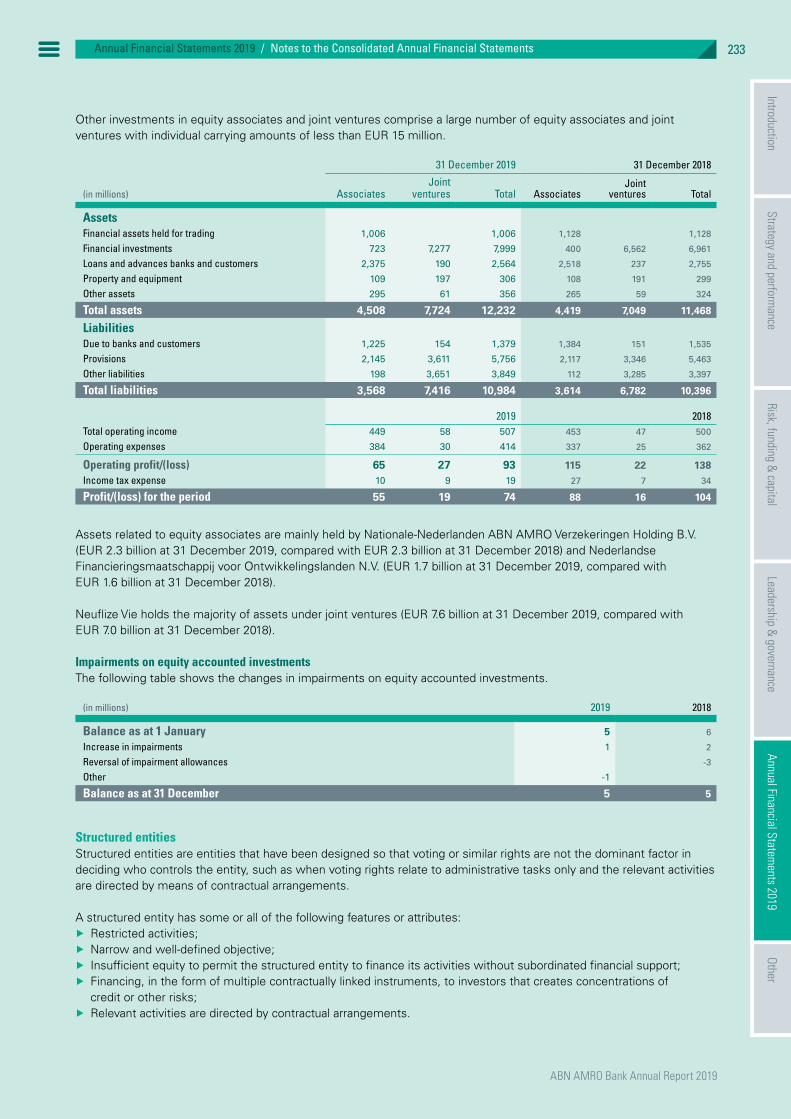
ABN AMRO Bank Annual Report 2019
233Annual Financial Statements 2019 / Notes to the Consolidated Annual Financial Statements
Other investments in equity associates and joint ventures comprise a large number of equity associates and joint ventures with individual carrying amounts of less than EUR 15 million.
31 December 2019 31 December 2018
(in millions) AssociatesJoint
ventures Total AssociatesJoint
ventures Total
AssetsFinancial assets held for trading 1,006 1,006 1,128 1,128
Financial investments 723 7,277 7,999 400 6,562 6,961
Loans and advances banks and customers 2,375 190 2,564 2,518 237 2,755
Property and equipment 109 197 306 108 191 299
Other assets 295 61 356 265 59 324
Total assets 4,508 7,724 12,232 4,419 7,049 11,468
LiabilitiesDue to banks and customers 1,225 154 1,379 1,384 151 1,535
Provisions 2,145 3,611 5,756 2,117 3,346 5,463
Other liabilities 198 3,651 3,849 112 3,285 3,397
Total liabilities 3,568 7,416 10,984 3,614 6,782 10,396
2019 2018Total operating income 449 58 507 453 47 500
Operating expenses 384 30 414 337 25 362
Operating profit/(loss) 65 27 93 115 22 138Income tax expense 10 9 19 27 7 34
Profit/(loss) for the period 55 19 74 88 16 104
Assets related to equity associates are mainly held by Nationale-Nederlanden ABN AMRO Verzekeringen Holding B.V. (EUR 2.3 billion at 31 December 2019, compared with EUR 2.3 billion at 31 December 2018) and Nederlandse Financieringsmaatschappij voor Ontwikkelingslanden N.V. (EUR 1.7 billion at 31 December 2019, compared with EUR 1.6 billion at 31 December 2018).
Neuflize Vie holds the majority of assets under joint ventures (EUR 7.6 billion at 31 December 2019, compared with EUR 7.0 billion at 31 December 2018).
Impairments on equity accounted investmentsThe following table shows the changes in impairments on equity accounted investments.
(in millions) 2019 2018
Balance as at 1 January 5 6
Increase in impairments 1 2
Reversal of impairment allowances -3
Other -1
Balance as at 31 December 5 5
Structured entitiesStructured entities are entities that have been designed so that voting or similar rights are not the dominant factor in deciding who controls the entity, such as when voting rights relate to administrative tasks only and the relevant activities are directed by means of contractual arrangements.
A structured entity has some or all of the following features or attributes: Å Restricted activities; Å Narrow and well-defined objective; Å Insufficient equity to permit the structured entity to finance its activities without subordinated financial support; Å Financing, in the form of multiple contractually linked instruments, to investors that creates concentrations of credit or other risks;
Å Relevant activities are directed by contractual arrangements.
IntroductionStrategy and perform
anceRisk, funding &
capitalLeadership &
governanceOther
Annual Financial Statements 2019
ABN AMRO Bank Annual Report 2019
IntroductionStrategy and perform
anceRisk, funding &
capitalLeadership structure
GovernanceAnnual Financial Statem
entsOther
IntroductionStrategy and perform
anceRisk, funding &
capitalLeadership &
governanceOther
234
Annual Financial Statements 2019
Annual Financial Statements 2019 / Notes to the Consolidated Annual Financial Statements
Consolidated structured entitiesThere were no notes sold to external parties at 31 December 2019 (31 December 2018: EUR 0.5 billion). Retained notes are used for repo transactions and TLTRO, for example.
The securitisation transactions were primarily used for funding and liquidity purposes. There was no RWA (REA) relief at 31 December 2019 (31 December 2018: no relief).
In 2019, ABN AMRO had only true sale (i.e. traditional) securitisation transactions outstanding. In such transactions, a foundation (stichting) incorporates a bankruptcy-remote, structured entity, to which the legal title of a portfolio of receivables is sold. As ABN AMRO continues to recognise the assets after the legal title has been sold, no derecognition takes place. The structured entity issues notes to fund the purchase. ABN AMRO performs key ancillary roles in all its securitisation transactions, including swap counterparty.
Risks associated with the roles in the securitisation processCredit riskCredit risk relates to the risk of credit losses on securitised assets. ABN AMRO retains part of the credit risk by retaining notes and other securitisation positions such as liquidity facilities, swaps and first loss tranches. Regulatory capital is held for all retained securitisation positions in accordance with the applicable regulation.
Liquidity riskLiquidity risk relates to the risk that ABN AMRO may incur additional cash outflows. Any potential future cash outflows relating to these positions, including collateral requirements, are taken into account within stress tests and are integrated into the liquidity ratios, where required. This includes the potential impact of the liquidity facilities or swap agreements which form part of certain securitisation transactions, most of which relate to transactions where ABN AMRO is the originator of the underlying assets.
Approaches to calculating risk exposure amountABN AMRO does not achieve significant risk transfers for any of the mortgage securitisations. Therefore, the look-through approach is used and RWA (REA) reduction is not applied.
Monitoring processABN AMRO periodically monitors changes in credit risk relating to securitisation exposures. The significance of the amount of credit risk transferred to third parties by securitisation of own originated assets is assessed on a monthly basis in accordance with the regulatory significant risk transfer test. For investments in third-party securitisations, the risk is monitored by reviewing the investor reports of these transactions. Additionally, third-party securitisation positions are included in the firm-wide comprehensive stress tests in which the downgrade and default risks under stressed market conditions are assessed.
Overview of securitisation positions and securitised assetsThe total amount of assets securitised in true sale securitisations decreased to EUR 17.2 billion at 31 December 2019 (31 December 2018: EUR 21.6 billion). No securitisation transactions for the purpose of capital relief were originated in 2019.
Details of retained and purchased securitisation positionsThe total amount of ABN AMRO’s exposure value on securitisation positions in which ABN AMRO acts as originator and/or investor decreased to EUR 257 million at 31 December 2019 (31 December 2018: EUR 421 million). These amounts are based on the regulatory exposure values calculated in accordance with the regulatory guidelines. Note that this includes not only the notes issued under the securitisation, but also the credit equivalent of interest rate swaps and first loss positions.

ABN AMRO Bank Annual Report 2019
235Annual Financial Statements 2019 / Notes to the Consolidated Annual Financial Statements
Details of total notes outstanding per structured entityThe following table provides details of the outstanding notes issued by consolidated structured entities which were established by ABN AMRO for securitisation purposes, exceeding 0.1% of the bank’s total assets.
31 December 2019 31 December 2018
(in millions) Total notes issued % of total assets Total notes issued % of total assets
CategoryDolphin Master Issuer B.V. 17,533 4.7% 22,033 5.8%
Total 17,533 22,033
Support to consolidated structured entitiesABN AMRO did not provide support, financial or otherwise, to a consolidated structured entity, including when ABN AMRO was not contractually obliged to do so, and nor does ABN AMRO intend to do so in the future.
Unconsolidated structured entitiesUnconsolidated structured entities are entities over which ABN AMRO has no control or significant influence. ABN AMRO is involved with structured entities through securitisation of financial assets and investments in structured entities. Structured entities generally finance the purchase of assets by issuing debt and equity securities that are collateralised by the assets held by the structured entities. The debt and equity securities issued by the structured entities may include tranches with varying levels of subordination. The interest in unconsolidated structured entities increased by EUR 0.3 billion to EUR 3.9 billion at year-end 2019 (2018: EUR 3.6 billion). The interests consist mainly of debt securities in corporate loans of EUR 257 million (2018: EUR 421 million) and mortgage- and other asset-backed securities recognised under financial investments of 3.7 billion (2018: EUR 3.2 billion). The maximum exposure to losses from these interests is equal to the total carrying amount.
Sponsoring of unconsolidated structured entitiesAn entity is considered a sponsor of an unconsolidated structured entity if it had a key role in establishing that entity so that the transaction that is the purpose of the entity could occur. No sponsoring occurred during 2019.
23 Property and equipment, leases, goodwill and other intangible assets
Accounting policy for property and equipmentProperty and equipment is stated at cost less accumulated depreciation and any impairment amount. At each balance sheet date, an assessment is performed to determine whether there is any indication of impairment. Subsequent costs are capitalised if these result in an enhancement to the asset. Depreciation is charged to the income statement on a straight-line basis over the estimated useful lives of items of property and equipment, and of major components that are accounted for separately. ABN AMRO generally uses the following useful lives in calculating depreciation:
Å Land: not depreciated; Å Buildings: 30 years; Å Leasehold improvements: 5 years; Å Equipment: 5 years; Å Installations (durable): 10 years; Å Computer installations: 2 to 5 years.
Impairment losses are recognised in the income statement as a component of depreciation and amortisation expense. Impairment losses are reversed only to the extent that the asset’s carrying amount does not exceed the carrying amount that would have been determined if no impairment loss had previously been recognised.
Depreciation rates and residual values are reviewed at least periodically to take into account any change in circumstances. Capitalised leasehold improvements are depreciated in a manner that takes into account the term and renewal conditions of the related lease.
Assets for which the bank acts as a lessor in an operational lease contract are included in property and equipment. The asset is depreciated on a straight-line basis, over its useful life, to its estimated residual value.
Accounting policy for leasesPlease refer to Note 1 Accounting policies in the Consolidated Annual Financial Statements, IFRS 16 Leases.
IntroductionStrategy and perform
anceRisk, funding &
capitalLeadership &
governanceOther
Annual Financial Statements 2019

ABN AMRO Bank Annual Report 2019
IntroductionStrategy and perform
anceRisk, funding &
capitalLeadership structure
GovernanceAnnual Financial Statem
entsOther
IntroductionStrategy and perform
anceRisk, funding &
capitalLeadership &
governanceOther
236
Annual Financial Statements 2019
Annual Financial Statements 2019 / Notes to the Consolidated Annual Financial Statements
Accounting policy for intangible assetsGoodwillGoodwill is capitalised and stated at cost, being the excess of the consideration paid over the fair value of ABN AMRO’s share of the acquired entity’s net identifiable assets at the acquisition date, less any accumulated impairment losses. For the purpose of calculating goodwill, the fair values of acquired assets, liabilities and contingent liabilities are determined by reference to market values or by discounting expected future cash flows to present value. Goodwill is not amortised, but is reviewed annually for impairment, or more frequently if there are indications that impairment may have occurred. In the test, the carrying amount of goodwill is compared with the higher of the fair value less costs to sell and the value in use, being the present value of the cash flows discounted at a pre-tax discount rate that reflects the risk of the cash-generating unit to which the goodwill relates. Impairment losses are recognised in the income statement as depreciation and amortisation expense and are irreversible.
Software and other intangible assetsThe accounting policy for software and other intangible assets is determined by IAS 38 Intangible assets. Software is amortised over a period of three years, unless it is classified as core application software, which is depreciated over its estimated useful life, set at a maximum of seven years. Only the development phase is capitalised for own-developed software.
Other intangible assets include separately identifiable items arising from acquisitions of subsidiaries, such as customer relationships, and certain purchased trademarks and similar items. In general, the estimated useful life does not exceed ten years. Amortisation rates and residual values are reviewed at least annually to take into account any change in circumstances.
(in millions) 31 December 2019 31 December 2018
Land and buildings held for own use 573 616
Leasehold improvements 54 46
Equipment 847 844
Right of use assets 231
Total property and equipment 1,706 1,506
Total property and equipment increased by EUR 0.2 billion to EUR 1.7 billion at 31 December 2019 (2018: EUR 1.5 billion). The increase is mainly due to the adoption of IFRS 16. For more information on the adoption of IFRS 16, please refer to Note 1 Accounting policies in the Consolidated Annual Financial Statements.
Right of use (ROU) assets include EUR 197 million related to leases of buildings, EUR 33 million related to leases of cars and EUR 1 million related to other leases.
(in millions) 31 December 2019 31 December 2018
Goodwill 110 103
Purchased software 27 30
Internally developed software 4 5
Other 38 27
Total goodwill and other intangible assets 178 164

ABN AMRO Bank Annual Report 2019
237Annual Financial Statements 2019 / Notes to the Consolidated Annual Financial Statements
2019
(in millions)
Land and Buildings
held for own use
Lease-hold
improve-ments
Equip-ment
Right of use assets
Other property
and equipment
Total property
and equipment Goodwill
Other intangible
assets
Total goodwill
and other intangible
assets
Acquisition costs as at 1 January 1,526 247 1,839 3,613 182 845 1,027Impact of adopting IFRS 16 272 272
Acquisitions/divestments of subsidiaries 1 -1 -6 -34 -40 -66 17 -49
Additions 15 27 294 89 426 28 17 45
Reversal of cost due to disposals -38 -23 -226 -8 -295 -3 -3
Foreign exchange differences 1 18 -1 18 5 1 5
Other -3 6 3
Acquisition costs as at 31 December 1,505 248 1,920 324 3,997 148 877 1,025
Accumulated depreciation/ amortisation as at 1 January -904 -200 -993 -2,096 -773 -773
Acquisitions/divestments of subsidiaries 1 6 2 8 1 1
Depreciation/amortisation -44 -16 -68 -73 -202 -28 -28
Depreciation of assets subject to operating lease -153 -153
Reversal of depreciation/amortisation due to disposals 22 22 146 1 191 3 3
Foreign exchange differences -6 -7 -1 -1
Other 2 1 3 1 1
Accumulated depreciation/amortisation as at 31 December -926 -194 -1,067 -70 -2,256 -798 -798
Impairments as at 1 January -7 -1 -3 -11 -79 -11 -89Impact of adopting IFRS 16 -23 -23
Acquisitions/divestments of subsidiaries 52 52
Increase of impairments charged to the income statement -1 -1 -9 -1 -9
Impairments on assets subject to operating lease -4 -4
Reversal of impairments due to disposals 1 1 1 3 1 1
Foreign exchange differences -3 -3
Other 1 1
Impairments as at 31 December -6 -6 -23 -34 -38 -11 -49
Total as at 31 December 573 54 847 231 1,706 110 68 178
The fair value of land and buildings held for own use is estimated at EUR 969 million at 31 December 2019 (2018: EUR 1,005 million). Of this fair value, 99% is based on external valuations performed in 2019, 2018 or 2017 and 1% is based on Dutch local government property tax valuations. There are some properties that have a lower fair value than the recorded carrying value. The value in use for the cash-generating units within ABN AMRO Bank is sufficient to cover the total value of all these assets.
IntroductionStrategy and perform
anceRisk, funding &
capitalLeadership &
governanceOther
Annual Financial Statements 2019

ABN AMRO Bank Annual Report 2019
IntroductionStrategy and perform
anceRisk, funding &
capitalLeadership structure
GovernanceAnnual Financial Statem
entsOther
IntroductionStrategy and perform
anceRisk, funding &
capitalLeadership &
governanceOther
238
Annual Financial Statements 2019
Annual Financial Statements 2019 / Notes to the Consolidated Annual Financial Statements
2018
(in millions)
Land and Buildings
held for own use
Leasehold improve-
ments Equipment
Other property
and equipment
Total property
and equipment Goodwill
Other intangible
assets
Total goodwill and other intangible
assets
Acquisition costs as at 1 January 1,559 242 1,749 1 3,551 183 917 1,100
Acquisitions/divestments of subsidiaries -8 -8 -16 -16
Additions 37 10 347 394 20 20
Reversal of cost due to disposals -72 -5 -243 -321 -2 -2
Foreign exchange differences 1 -2 -1 -1 -1
Other 2 -3 -1 -75 -75
Acquisition costs as at 31 December 1,526 247 1,839 3,613 182 845 1,027
Accumulated depreciation/ amortisation as at 1 January -900 -192 -988 -2,080 -813 -813
Acquisitions/divestments of subsidiaries 7 7 15 15
Depreciation/amortisation -45 -16 -73 -135 -34 -34
Depreciation of assets subject to operating lease -139 -139
Reversal of depreciation/amortisation due to disposals 42 5 192 239 2 2
Other 4 9 13 58 58
Accumulated depreciation/amortisation as at 31 December -904 -200 -993 -2,096 -773 -773
Impairments as at 1 January -11 -1 -12 -79 -24 -103
Increase of impairments charged to the income statement -1 -1 -1 -4
Reversal of impairments due to disposals 3 3
Other 2 1 -1 2 14 14
Impairments as at 31 December -7 -1 -3 -11 -79 -11 -89
Total as at 31 December 616 46 844 1,506 103 61 164
LeasesABN AMRO enters into leases both as lessor as well as lessee. In its capacity as lessee, ABN AMRO leases various assets, mainly office properties, cars and equipment that serve to support the bank’s operations. The leases have various terms, termination and renewal options. The majority of termination and renewal options are exercisable only by the bank and not by the respective lessor. There are no variable lease payments present in lease contracts where ABN AMRO acts as lessee. No covenants are present in the lease agreements and ABN AMRO is not allowed to use leased assets as security for financing purposes. The total cash outflow relating to leases in 2019 amounted to EUR 81 million.
The following table shows the maturity of lease liabilities for leases in which the bank acts as lessee, as well as the future undiscounted minimum lease receipts under operating and financial leases where ABN AMRO acts as lessor. It also reconciles the total future minimum lease receipts under financial leases and the net investment in the leases.
31 December 2019
(in millions)Within
3 months
More than 3 months but within 1 year
More than 1 year but
within 5 yearsMore than
5 years Total
Unearned finance income
Net investment
in the lease
Lease liabilities 13 51 171 67 302 n.a. n.a.
Future minimum lease receipts under financial leases 861 1,233 3,333 414 5,841 -121 5,721
Future minimum lease receipts under operating leases 42 117 344 30 533 n.a. n.a.
Future minimum lease receipts under non-cancellable operating leases totalled EUR 533 million at 31 December 2019, of which EUR 503 million matures within five years.
In its capacity as lessor, ABN AMRO leases out various assets. Operating leases in which the bank acts as lessor are included in Property and equipment - equipment. Financial leases in which the bank acts as lessor are included in corporate loans under loans and advances customers. Income from leases in which ABN AMRO acts as lessor is presented in the following table.
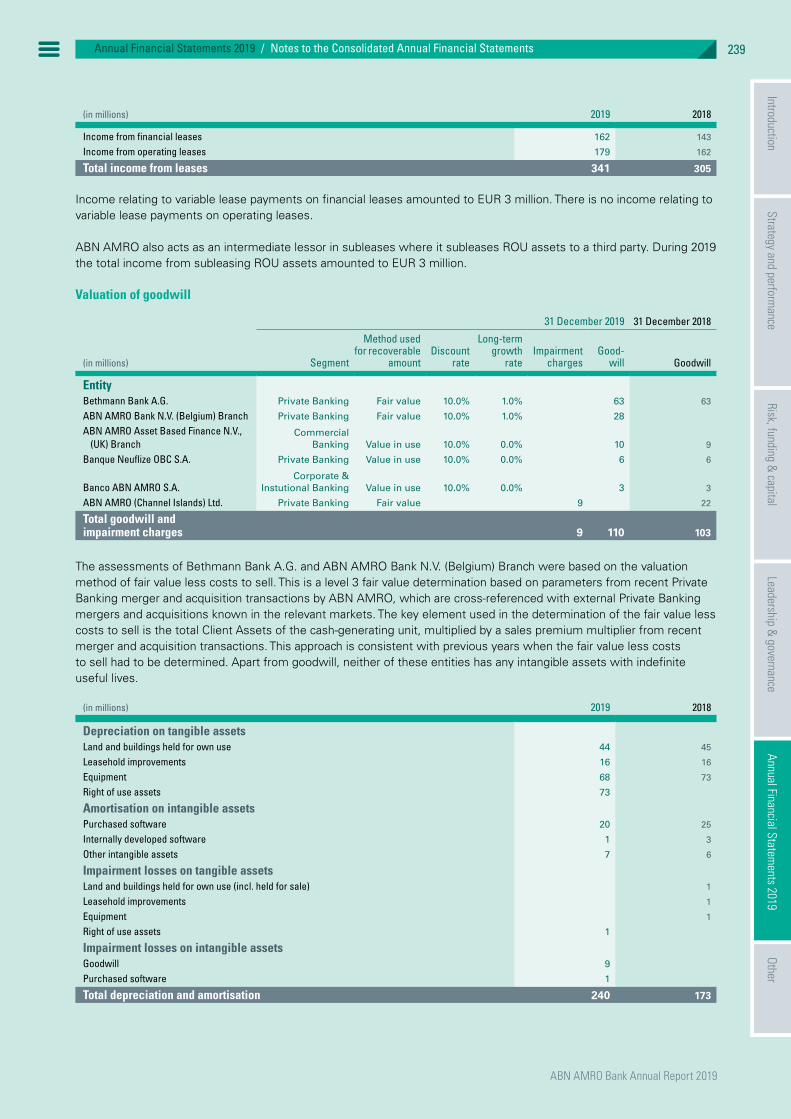
ABN AMRO Bank Annual Report 2019
239Annual Financial Statements 2019 / Notes to the Consolidated Annual Financial Statements
(in millions) 2019 2018
Income from financial leases 162 143
Income from operating leases 179 162
Total income from leases 341 305
Income relating to variable lease payments on financial leases amounted to EUR 3 million. There is no income relating to variable lease payments on operating leases.
ABN AMRO also acts as an intermediate lessor in subleases where it subleases ROU assets to a third party. During 2019 the total income from subleasing ROU assets amounted to EUR 3 million.
Valuation of goodwill
31 December 2019 31 December 2018
(in millions) Segment
Method used for recoverable
amountDiscount
rate
Long-term growth
rateImpairment
chargesGood-
will Goodwill
EntityBethmann Bank A.G. Private Banking Fair value 10.0% 1.0% 63 63
ABN AMRO Bank N.V. (Belgium) Branch Private Banking Fair value 10.0% 1.0% 28
ABN AMRO Asset Based Finance N.V., (UK) Branch
Commercial Banking Value in use 10.0% 0.0% 10 9
Banque Neuflize OBC S.A. Private Banking Value in use 10.0% 0.0% 6 6
Banco ABN AMRO S.A.Corporate &
Instutional Banking Value in use 10.0% 0.0% 3 3
ABN AMRO (Channel Islands) Ltd. Private Banking Fair value 9 22
Total goodwill and impairment charges 9 110 103
The assessments of Bethmann Bank A.G. and ABN AMRO Bank N.V. (Belgium) Branch were based on the valuation method of fair value less costs to sell. This is a level 3 fair value determination based on parameters from recent Private Banking merger and acquisition transactions by ABN AMRO, which are cross-referenced with external Private Banking mergers and acquisitions known in the relevant markets. The key element used in the determination of the fair value less costs to sell is the total Client Assets of the cash-generating unit, multiplied by a sales premium multiplier from recent merger and acquisition transactions. This approach is consistent with previous years when the fair value less costs to sell had to be determined. Apart from goodwill, neither of these entities has any intangible assets with indefinite useful lives.
(in millions) 2019 2018
Depreciation on tangible assetsLand and buildings held for own use 44 45
Leasehold improvements 16 16
Equipment 68 73
Right of use assets 73
Amortisation on intangible assetsPurchased software 20 25
Internally developed software 1 3
Other intangible assets 7 6
Impairment losses on tangible assetsLand and buildings held for own use (incl. held for sale) 1
Leasehold improvements 1
Equipment 1
Right of use assets 1
Impairment losses on intangible assetsGoodwill 9
Purchased software 1
Total depreciation and amortisation 240 173
IntroductionStrategy and perform
anceRisk, funding &
capitalLeadership &
governanceOther
Annual Financial Statements 2019

ABN AMRO Bank Annual Report 2019
IntroductionStrategy and perform
anceRisk, funding &
capitalLeadership structure
GovernanceAnnual Financial Statem
entsOther
IntroductionStrategy and perform
anceRisk, funding &
capitalLeadership &
governanceOther
240
Annual Financial Statements 2019
Annual Financial Statements 2019 / Notes to the Consolidated Annual Financial Statements
24 Non-current assets and disposal groups held for sale
Accounting policy for non-current assets and disposal groups held for saleNon-current assets and/or businesses are classified as held for sale if their carrying amount is to be recovered principally through a sale transaction planned to occur within 12 months, rather than through continuing use. Assets held for sale (other than financial instruments) are not depreciated and are measured at the lower of their carrying amount and fair value, less costs to sell. Assets and liabilities of a business held for sale are presented separately in the consolidated statement of financial position.
(in millions) 31 December 2019 31 December 2018
AssetsFinancial investmentsLoans and advances banks 4
Residential mortgagesConsumer LoansCorporate Loans 1
Property and equipment 5 20
Tax assetsOther assets 9 30
Assets of businesses held for sale 14 56
LiabilitiesDemand DepositsSaving DepositsTime DepositsCurrent accountsProvisions 4
Tax liabilities 4
Other liabilities 33
Liabilities of businesses held for sale 41
During 2019 Stater N.V. was divested for 75%. This partial sale of Stater N.V. was completed on 23 May 2019 and resulted in a EUR 130 million book gain. A decrease of EUR 42 million of assets held for sale and a decrease of EUR 41 million in liabilities held for sale was a result of the partial sale of Stater N.V.
The current held for sale position consists of EUR 5 million of property held for sale and EUR 9 million related to an equity accounted investment held for sale.
25 Other assets
Accounting policy for other assetsABN AMRO offers several products that relate to financing commodities. Some of these products are recognised as loans with commodities as collateral, others as loans with embedded derivatives and others as commodity inventory. The classification is mainly dependent on the transfer of risks and rewards of the commodity from the client to ABN AMRO. Commodity inventory is valued at the lower of cost or net realisable value.
(in millions) 31 December 2019 31 December 2018
Accrued other income 498 542
Prepaid expenses 32 29
Unsettled securities transactions 1,364 945
Trade and other receivables 1,837 1,506
Commodities 415
Other 800 467
Total other assets 4,530 3,904

ABN AMRO Bank Annual Report 2019
241Annual Financial Statements 2019 / Notes to the Consolidated Annual Financial Statements
Other assets increased by EUR 0.6 billion to EUR 4.5 billion at 31 December 2019. The increase is the result of an increase in unsettled securities transactions of EUR 0.4 billion, an increase in trade and other receivables of EUR 0.3 billion and an increase in other of EUR 0.3 billion. The increase is partially offset by a decrease in commodities of EUR 0.4 billion.
Unsettled securities transactions are related to reversed repurchase and securities borrowing transactions that are delivered but not settled. The increase of EUR 0.4 billion is a result of the clearing business that is fully based on the nature of the business to supply in the needs of their clients’ financing strategies.
Trade and other receivables include receivables purchased by ABN AMRO (the factor) from its clients under non-recourse factoring contracts. The increase of EUR 0.3 billion relates to higher amount receivables from factoring and funds transferred to notary offices due to mortgage production.
At 31 December 2018, commodities consisted of a commodity inventory of which the value was based on a delivery contract with an external party. The economic risk of the inventory was transferred during 2019.
Other assets in 2018 and 2019 includes a net receivable of EUR 0.2 billion related to the bankruptcy of DSB Bank.
26 Due to banks
Accounting policy for due to banks and due to customersAmounts due to banks and customers are held at amortised cost. That is, at fair value upon initial recognition, adjusted for repayment and amortisation of coupon, fees and expenses to represent the effective interest rate of the instrument.
(in millions) 31 December 2019 31 December 2018
Deposits from banks:Current accounts 2,201 1,670
Demand deposits 10 18
Time deposits 9,986 11,254
Cash collateral on securities lent 587 478
Other 16
Total due to banks 12,785 13,437
Due to banks decreased by EUR 0.7 billion to EUR 12.8 billion at 31 December 2019, mainly due to a decrease in time deposits. Time deposits decreased by EUR 1.3 billion to EUR 10.0 billion at 31 December 2019, mainly due to matured deposits with several central banks. Time deposits consist mainly of funding obtained under the TLTRO II programme. This programme has a maturity of four years, and interest payments will be settled in arrears. The interest rate, which is fixed for the entire maturity of TLTRO II, will be set in March 2021. Current accounts increased by EUR 0.5 billion to EUR 2.2 billion at 31 December 2019, mainly due to periodic current account balances with credit institutions.
27 Due to customers
Accounting policy for due to customersThe accounting policy for due to customers is included in Note 26.
(in millions) 31 December 2019 31 December 2018
Current accounts 91,900 84,192
Demand deposits1 120,892 126,063
Time deposits1 21,232 25,058
Other 967 810
Total due to customers 234,991 236,123
1 ABN AMRO has reclassified EUR 2.0 billion from time deposits to demand deposits in the comparative figures for 2018. Please refer to Note 1 Accounting policies in the Consolidated Annual Financial Statements.
IntroductionStrategy and perform
anceRisk, funding &
capitalLeadership &
governanceOther
Annual Financial Statements 2019

ABN AMRO Bank Annual Report 2019
IntroductionStrategy and perform
anceRisk, funding &
capitalLeadership structure
GovernanceAnnual Financial Statem
entsOther
IntroductionStrategy and perform
anceRisk, funding &
capitalLeadership &
governanceOther
242
Annual Financial Statements 2019
Annual Financial Statements 2019 / Notes to the Consolidated Annual Financial Statements
Due to customers decreased by EUR 1.1 billion to EUR 235 billion at 31 December 2019, mainly as a result of a decrease in demand deposits (EUR 5.2 billion) and time deposits (EUR 3.8 billion), partly offset by an increase in current accounts (EUR 7.7 billion) and other (EUR 0.2 billion).
Current accounts increased by EUR 7.7 billion to EUR 91.9 billion at 31 December 2019, mainly due to an inflow of clients and the acquisition of Societe Generale Private Banking N.V. in Belgium.
Demand deposits decreased by EUR 5.2 billion to EUR 120.9 billion at 31 December 2019. This was mainly due to the sale of the Moneyou Belgium portfolio and the divestment of ABN AMRO Channel Islands.
Time deposits decreased by EUR 3.8 billion to EUR 21.2 billion at 31 December 2019. The main drivers for this decrease were non-financial corporates and goverment-related institutions.
Other increased by EUR 0.2 billion to EUR 1.0 billion at 31 December 2019, mainly due to an increase in cash collateral received.
28 Issued debt and subordinated liabilities
Accounting policy for issued debt and subordinated liabilitiesIssued debt securities and subordinated liabilities are recorded at amortised cost using the effective interest rate method. Hybrid or structured financial liabilities are irrevocably designated upon initial recognition to be measured at fair value through profit or loss. The latter is applied when the instruments are held to reduce an accounting mismatch, are managed on the basis of their fair value or include terms that qualify as an embedded derivative that cannot be separated.
ABN AMRO applies IAS 32 Financial Instruments: Presentation to determine whether funding is a financial liability or equity. Issued financial instruments or their components are classified as financial liabilities where the substance of the contractual arrangement results in ABN AMRO having a present obligation to deliver either cash or another financial asset or to satisfy the obligation other than by the exchange of a fixed number of equity shares. Preference shares that carry a non-discretionary coupon or are redeemable on a specific date or at the option of the holder are classified as liabilities. Dividends and fees on preference shares classified as a liability are recognised as interest expense.
Issued liabilities qualify as subordinated debt if claims by the holders are subordinated to all other current and future liabilities of ABN AMRO and its subsidiaries.
The valuation of liabilities measured at fair value includes the effect of changes in own credit spreads. The change in fair value applies to those financial liabilities designated at fair value where own credit risk would be considered by market participants. The cumulative amount of changes in fair value attributable to credit risk of issued debt is presented as liability own credit risk reserve in equity. Exchange-traded own debt measured at fair value through profit or loss is valued against market prices.
Fair value changes are calculated based on a yield curve generated from observed external pricing for funding and quoted CDS spreads.
The following table shows the types of debt certificates issued by ABN AMRO and the amounts outstanding. Movements in these debt instruments involve a continual process of redemption and issuance of long-term and short-term funding.
Issued debt
(in millions) 31 December 2019 31 December 2018
Bonds and notes issued 59,585 63,932
Certificates of deposit and commercial paper 14,666 15,801
Saving certificates 6
Total at amortised cost 74,252 79,739Designated at fair value through profit or loss 1,024 1,045
Total issued debt 75,275 80,784– of which matures within one year 23,148 27,181

ABN AMRO Bank Annual Report 2019
243Annual Financial Statements 2019 / Notes to the Consolidated Annual Financial Statements
2019 2018
(in millions) Carrying amount Carrying amount
Balance as at 1 January 80,784 76,612
Cash flowsIssuance 27,437 40,196
Redemption -35,555 -36,396
Non-cash changesForeign exchange differences 1,000 587
Fair value changes own credit risk -5 -28
Other 1,615 -186
Balance as at 31 December 75,275 80,784
Total issued debt decreased by EUR 5.5 billion to EUR 75.3 billion at 31 December 2019. The decrease was due to lower funding need driven by a decline in the corporate loan book and an increase in corporate deposits. This allowed for a decrease in unsecured medium-term notes, commercial paper and certificates of deposits. No movement was seen in the long-term covered bond portfolio due to a stable mortgage book.
The amounts of debt issued and redeemed during the period are shown in the Consolidated statement of cash flows. Non-cash changes other mainly consists of unrealised gains and losses. Further details of the funding programmes are provided in the Funding section of the Risk, funding & capital review.
Financial liabilities designated at fair value through profit or loss
(in millions) 31 December 2019 31 December 2018
Cumulative change in fair value of the structured notes attributable to changes in credit risk 52 57
Change during the year in fair value of the structured notes attributable to changes in credit risk -5 -28
Difference between amount contractually required to pay at maturity and the carrying amount 154 76
During 2019 a total loss of EUR 1 million (2018: loss of EUR 18 million) relating to derecognition was recognised in the income statement.The amount realised in other comprehensive income at derecognition is a loss of EUR 0.5 million.
The change in fair value of the structured notes attributable to changes in credit risk is determined using the credit spread implicit in the fair value of similar bonds traded in active markets and issued by ABN AMRO.
Subordinated liabilitiesThe following table shows the outstanding subordinated liabilities.
(in millions) 31 December 2019 31 December 2018
Subordinated liabilities 10,041 9,805
2019 2018(in millions) Carrying amount Carrying amount
Balance as at 1 January 9,805 9,720
Cash flowsIssuance 19
Redemption -8 -25
Non-cash changesForeign exchange differences 102 177
Other 141 -86
Balance as at 31 December 10,041 9,805
Subordinated liabilities increased by EUR 0.2 billion to EUR 10.0 billion at 31 December 2019 , mainly due to foreign exchange differences and unrealised gains and losses. No perpetual loans are recorded at reporting date. The issued and outstanding loans qualifying as subordinated liabilities are subordinated to all other current and future liabilities.
IntroductionStrategy and perform
anceRisk, funding &
capitalLeadership &
governanceOther
Annual Financial Statements 2019

ABN AMRO Bank Annual Report 2019
IntroductionStrategy and perform
anceRisk, funding &
capitalLeadership structure
GovernanceAnnual Financial Statem
entsOther
IntroductionStrategy and perform
anceRisk, funding &
capitalLeadership &
governanceOther
244
Annual Financial Statements 2019
Annual Financial Statements 2019 / Notes to the Consolidated Annual Financial Statements
29 Provisions
Accounting policy for provisionsA provision is recognised in the balance sheet when ABN AMRO has a legal or constructive obligation as a result of a past event, and it is more likely than not that an outflow of economic benefits will be required to settle the obligation, and a reliable estimate of the amount of the obligation can be made. If the effect of time value is material, provisions are determined by discounting the expected future cash flows at a pre-tax rate that reflects current market rates and, where appropriate, the risks specific to the liability.
A provision for restructuring is recognised when an obligation exists. An obligation exists when ABN AMRO has approved a detailed plan and has raised a valid expectation in those affected by the plan by starting to implement the plan or by announcing its main features. Future operating costs are not provided for. Provisions for insurance risks are determined by actuarial methods, which include the use of statistics, interest rate data and settlement cost expectations.
Provisions are established for certain guarantee contracts for which ABN AMRO is responsible to pay upon default of payment. Expected credit loss allowances of loan commitments and financial guarantees are recognised as provisions under IFRS 9.
The following table shows the breakdown of provisions.
(in millions) 31 December 2019 31 December 2018
Insurance fund liabilities 4 11
Provision for pension commitments 74 66
Restructuring provision 172 294
Other staff provision 119 117
Legal provisions 234 475
Credit commitments provisions 79 63
Other provisions 301 178
Total provisions 983 1,204
Insurance fund liabilitiesInsurance fund liabilities include the insurance companies’ actuarial reserves, premium and claims reserves. The expected cash outflow for 2020 is nil and approximately EUR 7 million for the 2021-2024 period. The insurance fund liabilities decreased by EUR 7 million to EUR 4 million at 31 December 2019.
Provision for pension commitmentsProvision for pension commitments includes early retirement benefits payable to non-active employees. Further details are provided in Note 30.
RestructuringRestructuring provisions cover the costs of the restructuring plans for which implementation has been formally announced. The decrease in the restructuring provisions was mainly due to utilisations related to further digitalisation and process optimisation at ABN AMRO. Settlement of existing restructuring programmes may take up to five years. A new restructuring provision was recorded for Private Banking Belgium as a result of the integration of the private banking business with the acquired private banking business of Societe Generale. This restructuring is scheduled to be completed by the end of 2020.
Other staff provisionsOther staff provisions relate mainly to disability and other post-employee benefits.
Legal provisionsLegal provisions are based on best estimates available at the year-end and taking into account the opinion of legal specialists. The timing of the outflow of cash related to these provisions is by nature uncertain, given the unpredictability of the outcome and the time required to conclude litigation. Any provision recognised does not constitute an admission of wrongdoing or legal liability. Legal provisions decreased by EUR 0.2 billion to EUR 0.2 billion at 31 December 2019, mainly due to payments related to the provision for interest rate derivatives to SME clients.

ABN AMRO Bank Annual Report 2019
245Annual Financial Statements 2019 / Notes to the Consolidated Annual Financial Statements
Interest rate derivatives for SME clientsIn 2015 ABN AMRO started a review, at the request of the Netherlands Authority for the Financial Markets (AFM) and the Dutch Ministry of Finance, to determine whether the bank had acted in accordance with its duty of care obligations in respect of the sale of interest rate derivatives to SME clients. In the second quarter of 2015, ABN AMRO first recognised a provision for compensating clients who had been disadvantaged in this respect and suffered loss or damage.
ABN AMRO has set up its own client reassessment process and the related checks and balances with respect to the Uniform Recovery Framework devised by a committee of independent experts (‘the Committee’) appointed by the Dutch Minister of Finance. In the first quarter of 2020, all clients received a letter containing the outcome of the reassessment. At various points in the process, the reassessments have been and will be checked by an independent external file reviewer (in ABN AMRO’s case, by the audit firm PwC), supervised by the AFM. The total provision for SME derivatives-related issues amounted to EUR 0.1 billion at 31 December 2019. This comprised the total amount of client compensation (EUR 0.6 billion) and project costs (EUR 0.3 billion), after payments already made for both elements (EUR 0.8 billion).
Euribor-based mortgagesABN AMRO has sold mortgage loans with floating, often Euribor-based, interest rates to consumers (‘Euribor-Woning-hypotheek mortgages’). A margin charge is included in these rates. Based on the applicable terms and conditions, ABN AMRO has the right to unilaterally adjust the margin charge. After ABN AMRO increased the margin charge in 2012, two class actions, on top of multiple individual cases, were brought against ABN AMRO. The central question in these cases is whether ABN AMRO’s right contained in the terms and conditions to unilaterally adjust the margin charge is an unfair contractual clause.
ABN AMRO lost the class action cases in two instances and decided to appeal to the Dutch Supreme Court. On 22 November 2019 the Supreme Court quashed the ruling of the Amsterdam Court of Appeal in the Euribor collective cases. The case will be referred to another Court of Appeal (The Hague) in order to be dealt with further. This Court will need to take all relevant aspects into account to judge if the clauses are unfair. On 13 February 2020 ABN AMRO and the foundation Stichting Euribar reached an agreement on a settlement for clients with Euribor-Woninghypotheek mortgages. Key points of the agreement are 1) compensation for the past (62.5% of the increases in the margin charge in 2009 and 2012, calculated until 1 April 2019 at the latest and increased by statutory interest) and 2) certainty for the future margin charge (until 1/1/2025, the Euribor margin charge will remain fixed at the current Euribor margin charge of 1.0% (the rate from 2012), and beyond 1/1/2025 the margin charge may be raised, if justified, to a maximum of 1.2%). A large number of clients with a Euribor-Woninghypotheek mortgage will be eligible. These clients will receive a personal offer from ABN AMRO that reflects their situation, which they can accept or not. Meanwhile the other foundation, Stichting Stop de Banken, broke off the negotiations aimed at reaching an agreement and has announced it will proceed with the class action.
ABN AMRO has recognised a provision for the Euribor-based mortgage cases.
ICS redress schemeInternational Card Services B.V. (ICS), the credit card business of ABN AMRO, has identified certain issues from its past in respect of granting credit to consumers, as a result of which certain clients have been provided with loans above their lending capacity. This was reported to the AFM. In March 2017, ICS has drafted a redress scheme setting out remedial measures for clients who have been affected, including financial compensation for certain clients. During the first half of 2020 the final compensation payments will be made. The remaining part of the provision will be used for the execution of the revision policy, which will be started during 2020.
Credit commitment provisionsCredit commitment provisions increased by EUR 16 million to EUR 79 million at 31 December 2019. This is mainly due to deterioration of the credit portfolio.
Other provisionsOther provisions include provisions for tax purposes. The tax provisions are based on best estimates available at the year-end and taking into account the opinion of tax specialists. The timing of the outflow of cash related to these provisions is by nature uncertain, given the unpredictability of the outcome and the time involved.
IntroductionStrategy and perform
anceRisk, funding &
capitalLeadership &
governanceOther
Annual Financial Statements 2019

ABN AMRO Bank Annual Report 2019
IntroductionStrategy and perform
anceRisk, funding &
capitalLeadership structure
GovernanceAnnual Financial Statem
entsOther
IntroductionStrategy and perform
anceRisk, funding &
capitalLeadership &
governanceOther
246
Annual Financial Statements 2019
Annual Financial Statements 2019 / Notes to the Consolidated Annual Financial Statements
Customer Due DiligenceBanks are considered gatekeepers of the financial system, which is a responsibility that ABN AMRO takes very seriously. ABN AMRO invests significant resources to fulfil its role as gatekeeper in general and specifically in combating financial crime. We work closely with regulators, governments, other banks and other authorities. As a result of internal review and the latest supervisory findings ABN AMRO has decided to accelerate its Customer Due Diligence (CDD) programme in order to be compliant with anti-money laundering and terrorist financing legislation. ABN AMRO has developed several remediation programmes, amongst others to speed up remediation actions in relation to International Card Services (ICS), Retail Banking and Commercial Banking. In order to enable efficient execution we have centralised our CDD activities. The provided amounts are based on – among other things – the total number of files, the time needed to review each file and the percentage of files that will be reviewed using external resources. The total provision regarding the mentioned CDD programmes amounts to EUR 222 million at 31 December 2019. On a general note, all remedial actions necessary to ensure full compliance with legislation across the bank will be taken where such is needed. Additionally, sanctions (such as an instruction or fines) may be imposed by the authorities. Whilst there is a possibility that a fine may be imposed, a provision for such fine is currently not possible as both the likelihood as well as the possible amount is unclear at this time.
Changes in provisions during the year are specified in the following table.
(in millions)
Insurance fund
liabilities
Provision for pension
commitmentsRestructuring
provisionOther staff
provisionLegal
provisionsCredit
commitments Other Total
At 1 January 2018 62 76 404 122 692 67 167 1,590Acquisition and divestment of subsidiaries -55 -1 -57
Increase of provisions 147 89 25 98 358
Reversal of unused provisions -18 -14 -23 -19 -73
Utilised during the year -227 -293 -71 -591
Accretion of interest 2 2
Foreign exchange differences 1 1
Other 4 -9 -13 -5 -1 -6 4 -26
At 31 December 2018 11 66 294 117 475 63 178 1,204
Acquisition and divestment of subsidiaries 1 1
Increase of provisions 20 30 25 187 262
Reversal of unused provisions -24 -24 -14 -11 -74
Utilised during the year -104 -252 -49 -404
Accretion of interest -1 -1
Transfer between stages 4 4
Other -7 8 -15 2 5 2 -5 -11
At 31 December 2019 4 74 172 119 234 79 301 983
30 Pension and other employee benefits
Accounting policy for pension and other employee benefitsABN AMRO sponsors a number of pension schemes in the Netherlands and abroad. These schemes are mainly defined contribution plans. The majority of the beneficiaries of the plans are located in the Netherlands.
Defined contribution plansFor defined contribution plans, ABN AMRO pays annual contributions that have been determined by a fixed method and has no legal or constructive obligation to pay any further contributions. Contributions are recognised directly in the income statement in the year to which they relate. Actuarial and investment risk are for the account of the participants in the plan.
Defined benefit plansFor defined benefit plans, the net obligation of each plan is the difference between the present value of the defined benefit obligations and the fair value of the plan’s assets.
The actuarial assumptions used for calculating the present value of the defined benefit obligation include discount rates based on high-quality corporate bonds, the inflation rate, future salary increases, employee contributions, mortality assumptions and rates of employee turnover. The assumptions are based on available market data and management expectations at the end of the reporting period.

ABN AMRO Bank Annual Report 2019
247Annual Financial Statements 2019 / Notes to the Consolidated Annual Financial Statements
Plan assets are measured at fair value at balance sheet date and are netted against the defined benefit obligations.Pension costs recognised in the income statement for defined benefit plans consist of:
Å Service costs; Å Net interest costs determined by multiplying the net defined benefit liability (asset) by the discount rate, both as at the start of the annual reporting period, taking into account any changes in the net defined benefit liability (asset) during the period as a result of contributions and benefit payments; and
Å Curtailments or plan amendments.
Differences between pension costs and pension contributions payable are accounted for as provisions or prepayments.
RemeasurementRemeasurements of the net defined benefit liability (asset) are actuarial gains and losses resulting from changes in actuarial assumptions and experience adjustments (i.e. unexpectedly high or low rates of employee turnover). They are recognised in other comprehensive income and are not recycled to profit or loss in later periods. The actual return on the pension plan’s assets is determined after deduction of the costs of managing the assets and any tax payable by the pension plan itself.
Other employee benefitsSome group companies provide post-retirement benefits to their retirees, such as long-term service benefits and discounts on banking products. Entitlement to these benefits is usually conditional on the employee remaining in service up to retirement age and the completion of a minimum service period.
The expected costs of these benefits are accrued over the period of employment using the same accounting methodology as used for defined benefit pension plans. These obligations are calculated annually.
Plans in all countries comply with applicable local regulations concerning investments and minimum funding levels.
Pension and other employee benefitsAmounts recognised in the income statement for pensions and other employee benefits
2019 2018
(in millions) PensionsOther
employee benefits Total PensionsOther
employee benefits Total
Current service cost 4 5 9 4 16 20
Interest cost 3 1 5 4 1 5
Interest income -2 -2 -3 -3
Other 1 1 -1 -1 -2
Total defined benefit expenses in actuarial report 5 8 13 4 16 20Other expenses -6 -3 -9 -2 -11 -13
Total defined benefit expenses -1 5 4 2 5 7Defined contribution plans 372 372 338 338
Total Pension expenses and other post retirement employee benefits 371 5 376 340 5 345
Total pension and other employee benefits expenses increased by EUR 31 million to EUR 376 million in 2019 (2018: EUR 345 million). The increase in defined contribution plans of EUR 34 million is mainly related to a one-off pension contribution plan expense with ABN AMRO pension fund with an amount of EUR 30 million as a result of the new collective labour agreement and EUR 4 million as contribution costs. Pension expenses for defined contribution plans consist mainly of the cash contributions to the Dutch Collective Defined Contribution plan.
Dutch defined contribution planThe Dutch defined contribution plan is a Collective Defined Contribution plan, based on an average salary plan. The normal retirement age is set at 68 years. The contribution payable by pension fund participants is 5.5% (2018: 5.5%).
Plan participants contributions to the defined benefit plan in 2019 amounted to EUR 40 million (2018: EUR 40 million) and are included in pension expenses.
IntroductionStrategy and perform
anceRisk, funding &
capitalLeadership &
governanceOther
Annual Financial Statements 2019

ABN AMRO Bank Annual Report 2019
IntroductionStrategy and perform
anceRisk, funding &
capitalLeadership structure
GovernanceAnnual Financial Statem
entsOther
IntroductionStrategy and perform
anceRisk, funding &
capitalLeadership &
governanceOther
248
Annual Financial Statements 2019
Annual Financial Statements 2019 / Notes to the Consolidated Annual Financial Statements
Reconciliation to the statement of financial position and other comprehensive income
2019 2018
(in millions) Pensions
Other employee
benefits Total Pensions
Other employee
benefits Total
Present value of defined benefit obligations – funded with plan assets 242 242 228 228
Fair value of plan assets 176 176 172 172
66 66 56 56Present value of defined benefit obligations – unfunded 8 156 163 9 155 164
Unrecognised past service costs
Net liabilities/(assets) actuarial report at 31 December 74 156 229 66 155 221Other 1 1 1
Net liabilities/(assets) balance sheet at 31 December 74 156 229 66 156 222
- of which assets- of which liabilities 74 156 229 66 156 222
Experience adjustments -13 2 -11 1 9 10
Remeasurements arising from changes in demographic assumptions DBO 3 3
Remeasurements arising from changes in financial assumptions DBO -18 -4 -22 3 5 8
Remeasurements arising from changes in financial assumptions Plan assets 16 16 -1 -1
Remeasurements in Other comprehensive income -15 -2 -17 6 14 20
Of the EUR 156 million included in the Other employee benefits, EUR 119 million is included in balance sheet line item Other staff provisions and EUR 37 million in Other provisions.
Change in defined benefit obligation (DBO)
2019 2018
(in millions) PensionsOther
employee benefits Total PensionsOther
employee benefits Total
Defined benefit obligation as at 1 January 237 155 393 257 170 427
Current service cost 4 5 9 4 16 20
Interest cost 3 1 5 4 1 5
Losses/(gains) on settlements and curtailment -1 -1
Benefits paid -8 -4 -11 -14 -14
Benefits paid in from employer -3 -4 -1 -7 -8
Remeasurements arising from changes in demographic assumptions -3 -3
Experience adjustments 13 -2 11 -1 -9 -10
Remeasurements arising from changes in financial assumptions 18 4 22 -3 -5 -8
Other -18 -1 -20 -4 -12 -16
Defined benefit obligation as at 31 December 250 156 405 237 155 393
The net defined benefit liabilities/(assets) balance as at December 2019 consisted of pensioners with a profit share, the indexation of benefits insured with an insurance company and several small defined benefit plans outside the Netherlands.
Change in fair value of plan assets
2019 2018
(in millions) PensionsOther
employee benefits Total PensionsOther
employee benefits Total
Fair value of plan assets as at 1 January 172 172 182 182
Interest income 2 2 3 3
Remeasurements arising from changes in financial assumptions 16 16 -1 -1
Employer's contributions 4 4 8 7 7
Benefits paid -8 -4 -11 -14 -14
Other -11 -11 -3 -3
Fair value of plan assets as at 31 December 176 176 172 172
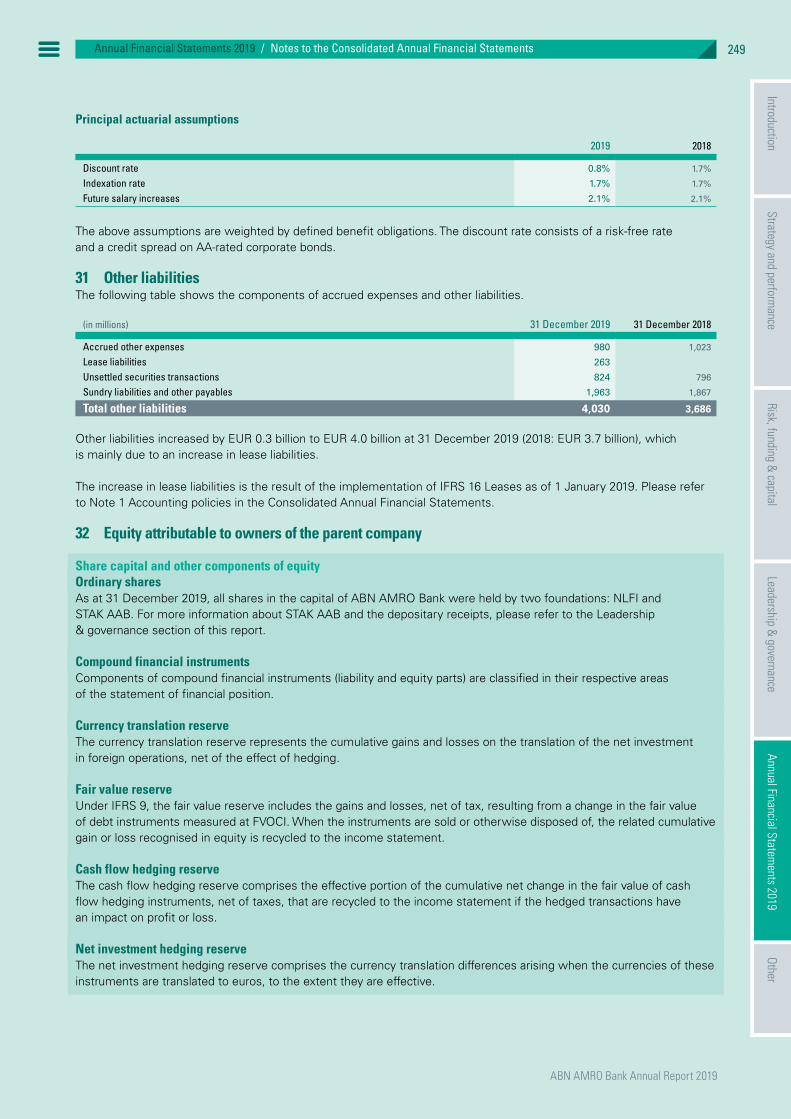
ABN AMRO Bank Annual Report 2019
249Annual Financial Statements 2019 / Notes to the Consolidated Annual Financial Statements
Principal actuarial assumptions
2019 2018
Discount rate 0.8% 1.7%
Indexation rate 1.7% 1.7%
Future salary increases 2.1% 2.1%
The above assumptions are weighted by defined benefit obligations. The discount rate consists of a risk-free rate and a credit spread on AA-rated corporate bonds.
31 Other liabilitiesThe following table shows the components of accrued expenses and other liabilities.
(in millions) 31 December 2019 31 December 2018
Accrued other expenses 980 1,023
Lease liabilities 263
Unsettled securities transactions 824 796
Sundry liabilities and other payables 1,963 1,867
Total other liabilities 4,030 3,686
Other liabilities increased by EUR 0.3 billion to EUR 4.0 billion at 31 December 2019 (2018: EUR 3.7 billion), which is mainly due to an increase in lease liabilities.
The increase in lease liabilities is the result of the implementation of IFRS 16 Leases as of 1 January 2019. Please refer to Note 1 Accounting policies in the Consolidated Annual Financial Statements.
32 Equity attributable to owners of the parent company
Share capital and other components of equityOrdinary sharesAs at 31 December 2019, all shares in the capital of ABN AMRO Bank were held by two foundations: NLFI and STAK AAB. For more information about STAK AAB and the depositary receipts, please refer to the Leadership & governance section of this report.
Compound financial instrumentsComponents of compound financial instruments (liability and equity parts) are classified in their respective areas of the statement of financial position.
Currency translation reserveThe currency translation reserve represents the cumulative gains and losses on the translation of the net investment in foreign operations, net of the effect of hedging.
Fair value reserveUnder IFRS 9, the fair value reserve includes the gains and losses, net of tax, resulting from a change in the fair value of debt instruments measured at FVOCI. When the instruments are sold or otherwise disposed of, the related cumulative gain or loss recognised in equity is recycled to the income statement.
Cash flow hedging reserveThe cash flow hedging reserve comprises the effective portion of the cumulative net change in the fair value of cash flow hedging instruments, net of taxes, that are recycled to the income statement if the hedged transactions have an impact on profit or loss.
Net investment hedging reserveThe net investment hedging reserve comprises the currency translation differences arising when the currencies of these instruments are translated to euros, to the extent they are effective.
IntroductionStrategy and perform
anceRisk, funding &
capitalLeadership &
governanceOther
Annual Financial Statements 2019

ABN AMRO Bank Annual Report 2019
IntroductionStrategy and perform
anceRisk, funding &
capitalLeadership structure
GovernanceAnnual Financial Statem
entsOther
IntroductionStrategy and perform
anceRisk, funding &
capitalLeadership &
governanceOther
250
Annual Financial Statements 2019
Annual Financial Statements 2019 / Notes to the Consolidated Annual Financial Statements
Liability own credit risk reserveUnder IFRS 9, the changes in fair value attributable to changes in the own credit risk of financial liabilities designated at FVTPL are presented in other comprehensive income. The cumulative amount of changes in fair value attributable to credit risk of such liabilities is presented as liability own credit risk reserve in equity.
Other reservesOther reserves mainly comprise retained earnings and profit for the period.
DividendsDividends on ordinary shares and preference shares classified as equity are recognised as a distribution of equity in the period in which they are approved by shareholders.
Capital securitiesUndated, deeply subordinated, resettable, callable capital securities are classified as additional tier 1 (AT1) capital, under total equity. ABN AMRO Bank has the European Central Bank’s permission to carry out limited repurchases from investors and to sell back in the market.
(in millions) 31 December 2019 31 December 2018
Share capital 940 800
Share premium 12,970 4,041
Other reserves (incl. retained earnings/profit for the period) 6,993 15,437
Other components of equity -1,419 -906
AT1 Capital securities 1,987 1,986
Equity attributable to owners of the parent company 21,471 21,357Equity attributable to non-controlling interests 2
Total equity 21,471 21,360
At December 31 2019, the authorised share capital of ABN AMRO Bank N.V. amounted to 2,400,000,000. The authorised share capital consists of 2,200,000,000 ordinary A-shares with a nominal value of EUR 1.00 and 200,000,000 ordinary B-shares with a nominal value of EUR 1.00. Every share is entitled to one vote during the General Meeting. During the financial year 200,000,000 new ordinary shares were authorised and 200,000,000 ordinary B-shares, due to the legal merger of ABN AMRO Bank N.V. and ABN AMRO Group N.V. 140,000,001 ordinary shares were issued and paid up due to the legal merger in June. Please refer to Note 1 Accounting policies in the Consolidated Annual Financial Statements. The total amount of issued shares at 31 December is 940,000,001 for 2019 (2018: 800,000,000). In 2019 a total dividend of EUR 1,316 million was paid to the owners of the parent company. The total dividend payment consisted of a final dividend payment of EUR 752 million and an interim dividend of EUR 564 million. The following tables show the equity of the ABN AMRO Bank N.V. and the outstanding and issued share capital.
31 December 2019 31 December 2018Class A
ordinary sharesClass B
ordinary sharesClass A
ordinary shares
Number of sharesAuthorised share capital 2,200,000,000 200,000,000 2,000,000,000
Unissued share capital 1,259,999,999 200,000,000 1,200,000,000
Issued share capital 940,000,001 800,000,000
Amount of sharesAuthorised share capital 2,200,000,000 200,000,000 2,000,000,000
Unissued share capital 1,259,999,999 200,000,000 1,200,000,000
Issued share capital 940,000,001 800,000,000
Par value 1.00 1.00 1.00
33 Transferred, pledged, encumbered and restricted assets
Accounting policy for transferred, pledged, encumbered and restricted assetsTransferred financial assets are arrangements/transactions for which ABN AMRO has:
Å Transferred the contractual rights to receive the cash flows of the financial asset to a third party; or

ABN AMRO Bank Annual Report 2019
251Annual Financial Statements 2019 / Notes to the Consolidated Annual Financial Statements
Å Retained the contractual rights to receive the cash flows of that financial asset, but has assumed a contractual obligation to pay the cash flows to a third party; or
Å Transferred a financial asset when the counterparty has the right to repledge or to resell the asset.
Depending on the circumstances, these transfers may result in financial assets that either are or are not derecognised in their entirety. Please refer to Note 1 Accounting policies in the Consolidated Annual Financial Statements.
Pledged assets are assets pledged as collateral for liabilities or contingent liabilities and the terms and conditions relating to the pledge. Encumbered assets are those that are pledged or other assets which we believe to be restricted in order to secure, credit-enhance or collateralise a transaction.
In principle, pledged assets are encumbered assets. The following differences apply to ABN AMRO: Å Encumbered assets include mandatory reserve requirements with central banks; Å Encumbered assets exclude assets pledged for unused credit facilities with central banks at the statement of financial position date, i.e. mainly retained mortgage-backed securities.
Significant restrictions on assets may arise from statutory, contractual or regulatory requirements such as: Å Those that restrict the ability of the parent or its subsidiaries to transfer cash or other financial assets to or from other entities within the bank;
Å Guarantees or other requirements that may restrict dividends and other capital distributions being paid, or loans and advances being made or repaid to other entities within the bank;
Å Protective rights of other non-controlling interests that may restrict the ability of the bank to access and transfer assets freely to or from other entities within the bank and to settle liabilities of the bank.
Transferred financial assetsThis disclosure provides insight into the relationship between these transferred financial assets and associated financial liabilities in order to show the risks the bank is exposed to when the assets are transferred. If transferred financial assets continue to be recognised in the balance sheet, ABN AMRO Bank is still exposed to changes in the fair value of the assets.
Transferred financial assets not derecognised in their entiretyThe following table shows transferred financial assets that are not derecognised in their entirety.
31 December 2019 31 December 2018
(in millions)
Loans and advances
(at amortised cost)
Financial assets held for trading (at fair value through
profit and loss) Total
Loans and advances
(at amortised cost)
Financial assets held for trading (at fair value through
profit and loss) Total
SecuritisationsCarrying amount Transferred assets 497 497
Carrying amount Associated liabilities 500 500
Fair value of assets 536 536
Fair value of associated liabilities 501 501
Net position 35 35
OtherCarrying amount Transferred assets 194 194 63 63
Carrying amount Associated liabilities 192 192 63 63
Fair value of assets 194 194 63 63
Fair value of associated liabilities 192 192 63 63
Net position 2 2
TotalsCarrying amount Transferred assets 194 194 497 63 560
Carrying amount Associated liabilities 192 192 500 63 563
Fair value of assets 194 194 536 63 599
Fair value of associated liabilities 192 192 501 63 564
Net position 2 2 35 35
IntroductionStrategy and perform
anceRisk, funding &
capitalLeadership &
governanceOther
Annual Financial Statements 2019

ABN AMRO Bank Annual Report 2019
IntroductionStrategy and perform
anceRisk, funding &
capitalLeadership structure
GovernanceAnnual Financial Statem
entsOther
IntroductionStrategy and perform
anceRisk, funding &
capitalLeadership &
governanceOther
252
Annual Financial Statements 2019
Annual Financial Statements 2019 / Notes to the Consolidated Annual Financial Statements
SecuritisationsThe bank uses securitisations as a source of funding, whereby the Special Purpose Entity (SPE) issues debt securities. In a securitisation transaction utilising true sale mechanics, the bank transfers the title of the assets to SPEs. When the cash flows are transferred to investors in the notes issued by consolidated securitisation vehicles, the assets (mainly residential mortgage loans) are considered to be transferred. Due to a redemption the bank does not have any transferred and associated securitisations at 31 December 2019.
Securities financingSecurities financing transactions are entered into on a collateralised basis for mitigating the bank’s credit risk exposure. In repurchase agreements and securities lending transactions, ABN AMRO gets the securities returned at maturity. The counterparty in the transactions holds the securities as collateral, but has no recourse to other assets of ABN AMRO. ABN AMRO transfers the securities and if the counterparty has the right to resell or repledge them, the bank considers these assets to be transferred assets.
Continuing involvement in transferred financial assets derecognised in their entiretyThe bank does not have any material transferred assets that are derecognised in their entirety, but where ABN AMRO has continuing involvement.
Pledged and encumbered assetsPledged and encumbered assets are no longer readily available to the bank to secure funding, satisfy collateral needs or be sold to reduce the funding requirement. The following activities conducted by ABN AMRO give rise to pledged assets:
Å Cash and securities provided as collateral to secure trading and other liabilities, mainly derivatives; Å Mortgages and SME loans pledged to secure funding transactions such as covered bonds and securitisations; Å Securities lent as part of repurchase and securities lending transactions.
The following table provides an overview of assets pledged as security and encumbered assets.
(in millions) 31 December 2019 31 December 2018
Assets pledgedCash and balances at central banks 3 3
Financial assets held for trading 421 81
Financial investments FVOCI 1,047 1,086
Loans and advances banks:- Interest bearing deposits 1,153 1,772
Loans and advances customers:- Residential mortgages 82,077 80,870
- Commercial loans 7,572 7,187
Other financial assets 16
Total assets pledged as security 92,274 91,014
Differences between pledged and encumbered assetsLoans and advances banks1 293 284
Loans and advances customers2 -27,814 -20,730
Other assets
Total differences between pledged and encumbered assets -27,521 -20,445
Total encumbered assets 64,754 70,569
Total assets 375,054 381,295
Total encumbered assets as percentage of total assets 17.3% 18.5%
1 Includes mandatory reserve deposits.2 Excludes mainly mortgage-backed securities.
Total encumbered assets decreased by EUR 5.8 billion to EUR 64.8 billion at 31 December 2019, mainly due to an increase in retained securities that are pledged but not encumbered and partly offset by more mandatory reserve deposits.
Off-balance sheet collateral held as security for assetsMainly as part of professional securities transactions, ABN AMRO obtains securities on terms which permit it to repledge or resell the securities to others. These transactions are conducted under terms that are usual and customary in standard professional securities transactions.

ABN AMRO Bank Annual Report 2019
253Annual Financial Statements 2019 / Notes to the Consolidated Annual Financial Statements
ABN AMRO controls the credit risk associated with these activities by monitoring counterparty credit exposure and collateral value on a daily basis and, when necessary, requiring additional collateral to be deposited with or returned to the bank. ABN AMRO has the obligation to return securities accepted as collateral to its counterparties.
(in millions) 31 December 2019 31 December 2018
Fair value of securities received which can be sold or repledged 59,478 62,572
- of which: fair value of securities repledged/sold to others 46,712 46,100
Significant restrictions on the ability to access or use the bank’s assetsRestricted financial assets consist of assets pledged as collateral against an existing or contingent liability and encumbered assets. Other restrictions impacting on the bank’s ability to use assets include:
Å Assets as a result of collateralising repurchase and borrowing agreements (31 December 2019: EUR 14.9 billion; 31 December 2018: EUR 12.4 billion);
Å Assets held in certain jurisdictions to comply with local liquidity requirements and that are subject to restrictions in terms of their transferability within the bank (31 December 2019: EUR 2.8 billion; 31 December 2018: EUR 2.4 billion);
Å ABN AMRO Bank N.V. is in general not subject to any significant restrictions that would prevent the transfer of dividends and capital within the bank, except for regulated subsidiaries that are required to maintain capital in order to comply with local regulations (31 December 2019: EUR 1.0 billion; 31 December 2018: EUR 1.0 billion).
34 Commitments and contingent liabilities
Accounting policy for off-balance sheet itemsCommitmentsLoan commitments that allow for draw-down of a loan within the timeframe generally established by regulation or convention in the marketplace are not recognised as derivative financial instruments. Acceptances comprise undertakings by ABN AMRO to pay bills of exchange drawn on clients. ABN AMRO expects most acceptances to be settled simultaneously with the reimbursement from clients. Acceptances are not recognised in the balance sheet and are disclosed as commitments.
Financial guarantee contractsA financial guarantee contract requires the issuer to make specified payments to reimburse the holder for a loss it incurs if a specified debtor fails to make payment when due under the original or modified terms of a debt instrument. Initial recognition of financial guarantee contracts is at their fair value. Subsequent measurement is at the higher of the amount of the expected credit loss and the amount initially recognised less, when appropriate, the cumulative amount of income recognised in the income statement.
ContingenciesContingent liabilities are possible obligations whose existence will be confirmed only by uncertain future events, and present obligations where the transfer of economic resources is uncertain or cannot be reliably measured. Contingent liabilities are not recognised in the balance sheet, but are disclosed unless the likelihood of an outflow of economic resources is remote.
Committed credit facilitiesCommitments to provide credit take the form of approved but undrawn loans, revolving and underwriting facilities. New loan offers have a commitment period that does not extend beyond the normal underwriting and settlement period.
Guarantees and other commitmentsABN AMRO provides financial guarantees and letters of credit to guarantee the performance of customers to third parties. These transactions have fixed limits and generally extend for periods of up to 5 years. Expirations are not concentrated in any particular period. ABN AMRO also provides guarantees by acting as a settlement agent in securities borrowing and lending transactions.
Many of the contingent liabilities and commitments are expected to expire without being paid out in whole or in part. This means that the amounts stated do not represent expected future cash flows. Additionally, guarantees and letters of credit are supported by varying levels of collateral.
IntroductionStrategy and perform
anceRisk, funding &
capitalLeadership &
governanceOther
Annual Financial Statements 2019

ABN AMRO Bank Annual Report 2019
IntroductionStrategy and perform
anceRisk, funding &
capitalLeadership structure
GovernanceAnnual Financial Statem
entsOther
IntroductionStrategy and perform
anceRisk, funding &
capitalLeadership &
governanceOther
254
Annual Financial Statements 2019
Annual Financial Statements 2019 / Notes to the Consolidated Annual Financial Statements
Furthermore, statements of liability within the meaning of Article 403, Book 2 of the Dutch Civil Code have been issued for a number of ABN AMRO’s affiliated companies (see also the chapter on Other information).
The committed credit facilities, guarantees and other commitments are summarised in the following table. The amounts stated in the table for commitments assume that amounts are fully paid out. The amounts shown in the table for guarantees and letters of credit represent the maximum amount ABN AMRO is exposed to if the contract parties completely fail to perform as contracted.
Payments due by period
(in millions)Less than one year
Between one and three years
Between three and five years After five years Total
31 December 2019Committed credit facilities 33,541 7,159 11,452 2,521 54,673
Guarantees and other commitments:Guarantees granted 2,051 228 46 82 2,407
Irrevocable letters of credit 4,268 1,330 852 283 6,733
Recourse risks arising from discounted bills 7,828 201 19 291 8,339
Total guarantees and other commitments 14,147 1,759 917 656 17,479
Total 47,688 8,919 12,369 3,177 72,152
31 December 2018Committed credit facilities 35,987 9,256 11,786 4,137 61,166
Guarantees and other commitments:Guarantees granted 329 191 60 1,894 2,473
Irrevocable letters of credit 4,041 1,324 239 342 5,946
Recourse risks arising from discounted bills 6,543 238 41 1 6,822
Total guarantees and other commitments 10,913 1,753 340 2,236 15,241
Total 46,900 11,008 12,126 6,373 76,408
Total committed credit facilities, guarantees and other commitments decreased by EUR 4.3 billion to EUR 72.2 billion at 31 December 2019 (31 December 2018: EUR 76.4 billion). This decrease was due to a decline of EUR 6.5 billion in committed credit facilities, partly offset by an increase of EUR 2.2 billion in guarantees and other commitments.
The decrease in committed credit facilities by EUR 6.5 billion to EUR 54.7 billion at 31 December 2019 (31 December 2018: EUR 61.2 billion) was mainly related to a decrease in credit lines granted to commercial clients and consumers and lower outstanding credit offers. This was partly offset by a rise in credit lines granted to credit institutions, government and official institutions and higher outstanding credit offers for residential mortgages.
LeasingFollowing the implementation of IFRS 16 on 1 January 2019, the lease commitments have been recognised on-balance. Please refer to Note 1 Accounting policies in the Consolidated Annual Financial Statements.
Other contingenciesABN AMRO is involved in a number of legal proceedings in the ordinary course of business in various jurisdictions. In presenting the Consolidated Financial Statements, management estimates the outcome of legal, regulatory and arbitration matters, and takes provisions to the income statement when losses with respect to such matters are more likely than not. Provisions are not recognised for matters for which an expected cash outflow cannot be reasonably estimated or that are not more likely than not to lead to a cash outflow. Some of these matters may be regarded as a contingency. In particular, the following matters are regarded as contingencies:
Å In September 2019, the Dutch public prosecutor informed ABN AMRO that it is subject of an investigation relating to requirements under the Dutch Act on the prevention of money laundering and financing of terrorism (in Dutch: Wwft). The scope of the investigation includes whether the bank has complied with the Wwft in relation to having client files in good order, timely reporting unusual transactions and discontinuing relationships with clients in good time. The timing of the completion of the investigation and the outcome are uncertain. Therefore, the financial impact of a potential fine, if any, cannot be reliably estimated at this time. ABN AMRO is cooperating fully.
Å Some years ago, certain hedge funds initiated legal proceedings in Belgium and claimed the re-issue of certain Ageas Mandatory Convertible Securities and payment of a 8.75% coupon from 7 December 2010 until 7 December 2030 (EUR 0.2 billion per annum) or, alternatively, cash compensation in the amount of EUR 1.75 billion from four

ABN AMRO Bank Annual Report 2019
255Annual Financial Statements 2019 / Notes to the Consolidated Annual Financial Statements
issuers, including ABN AMRO, in relation to the conversion of Ageas MCS. On 23 March 2012, the Commercial Court in Brussels (Belgium) rejected all the hedge funds’ claims. This judgement was in line with the earlier judgement in the summary proceedings in November 2010. On 1 February 2019, the Court of Appeal in Brussels rejected all the hedge funds’ claims and found in favour of Ageas and ABN AMRO. The hedge funds subsequently filed cassation proceedings. Pleadings closed in Q4 2019 and the Supreme Court’s judgement is now awaited.
Å ABN AMRO, certain of its subsidiaries and some of their client funds had exposure to funds that suffered losses (in some cases, significant losses) as a result of the Madoff fraud. The provision of custodial services resulted in several legal claims, including by the Bernard L. Madoff Investment Securities trustee in bankruptcy (Irving Picard) and the liquidators of certain funds, who are pursuing legal action in an attempt to recover payments made as a result of the fraud and/or to compensate their alleged losses. ABN AMRO and certain ABN AMRO subsidiaries are defendants in these proceedings. Even though these proceedings have been ongoing for several years, they are still in a preliminary stage. Hence, it is not possible to estimate the total amount of ABN AMRO’s potential liability, if any.
Å The Imtech Group was declared bankrupt in August 2015. ABN AMRO was one of the banks that extended financing to this group and participated in the second rights offering of October 2014. By letter of 20 January 2018, Stichting Imtechclaim and Imtech Shareholders Action Group B.V. held ING, Rabobank, Commerzbank and ABN AMRO liable for alleged misstatements in the prospectuses and for alleged actio pauliana (fraudulent preference). By letter of 28 March 2018 the VEB held parties including ABN AMRO liable for damage allegedly suffered by the Imtech investors. On 10 August 2018, ABN AMRO received formal notification from Imtech’s trustees that they were seeking to nullify a large number of transactions and claim various damages. The letter aimed to interrupt limitation periods in view of the possible claims on Imtech’s lenders, bondholders and underwriting banks. Two execution-only clients of ABN AMRO have commenced proceedings against ABN AMRO and are claiming an amount in excess of EUR 600,000. Their claim is based on alleged prospectus liability, together with an alleged breach of the duty of care. Judgement in these proceedings is scheduled for 11 March 2020.
Å On 18 October 2018, Eurostar Diamond Traders N.V. (EDT) filed a civil law complaint against ABN AMRO in the Antwerp Court, claiming a provisional amount of USD 720 million. The composition and substantiation of the amount claimed is not completely transparent; however, it appears to include an unsubstantiated claim for damages of EUR 600 million on the ground that ABN AMRO allegedly caused EDT’s demise deliberately. Damages of USD 73 million have also been claimed for the alleged sale of unsuitable derivatives over a long period of time. EDT has initiated legal fact-finding proceedings in the Netherlands against ABN AMRO. Although EDT has since been declared bankrupt, an appeal against this ruling has been lodged. This is also valid for EDI, EDT’s parent company.
Å On 22 August 2016, ABN AMRO received a writ of summons from the indirect shareholders of its former clients, the Partner Logistics Group. The claimants alleged that the defendants, including ABN AMRO, had acted wrongfully in relation to the bankruptcy of the Partner Logistics Group. Based on this, they claimed damages of EUR 205 million. After all their claims were rejected on 28 October 2018, the claimants filed for appeal. Pleadings have now closed and a date for an oral hearing in Q2 2020 has been set.
Å In 2019 there were several rulings on the interpretation and use of variable interest clauses in revolving credits for consumers. Rulings from the alternative dispute resolution entity KiFiD show different outcomes, based on different reasoning than in rulings from civil courts. The Supreme Court ruling of 22 November 2019 on the Euribor mortgages cases can be favourable in this debate. In other words, case law on this topic is still under development and at this point it is not practicable to predict the potential financial effect.
Å Other contingencies include EUR 78 million related to an irrevocable payment commitment (IPC) to the Single Resolution Board (SRB) in Brussels. In April 2016, the SRB provided credit institutions with the option to fulfil part of their obligation to pay the annual ex-ante contributions to the Single Resolution Fund (SRF) through IPCs. To secure full and punctual payment, when called by the SRB, credit institutions needed to constitute cash collateral and fully transfer legal ownership to the SRB.
Equity trading in Germany German authorities are conducting investigations into the involvement of individuals from various banks and other parties in equity trading extending over dividend record dates in Germany, including several forms of tainted dividend arbitrage, i.e. dividend stripping (including cum/ex). ABN AMRO’s legal predecessor, Fortis Bank (Nederland) N.V., ABN AMRO and several (former) subsidiaries were directly or indirectly involved in these transactions in the past. Certain criminal investigation proceedings relate to the activities of these entities and individuals involved at the time. This also resulted in search warrants being issued against ABN AMRO. Furthermore, ABN AMRO frequently receives information requests from German authorities in relation to other (criminal) investigations. ABN AMRO cooperates and provides the requested information to the fullest extent possible. Although a number of subsidiaries associated with these transactions have been sold by means of a management buy-out, legal risks remain for ABN AMRO, in particular relating to criminal and civil law.
IntroductionStrategy and perform
anceRisk, funding &
capitalLeadership &
governanceOther
Annual Financial Statements 2019

ABN AMRO Bank Annual Report 2019
IntroductionStrategy and perform
anceRisk, funding &
capitalLeadership structure
GovernanceAnnual Financial Statem
entsOther
IntroductionStrategy and perform
anceRisk, funding &
capitalLeadership &
governanceOther
256
Annual Financial Statements 2019
Annual Financial Statements 2019 / Notes to the Consolidated Annual Financial Statements
All material tax issues with respect to ABN AMRO’s reclaims for cum/ex transactions have been settled with the German tax authorities.
It cannot be excluded that ABN AMRO or subsidiaries will be faced with financial consequences as a result of their involvement in dividend stripping transactions, including penalties and other measures under criminal law and civil law claims. It is currently unclear, however, how the German prosecution authorities’ investigations will impact ABN AMRO and its subsidiaries and whether penalties or forfeiture orders will be imposed. It is also uncertain whether tax authorities or third parties will successfully claim amounts from ABN AMRO in (secondary) liability or other civil cases. Therefore, the financial impact cannot be reliably estimated at this time and no provision has been made.
Duty of care mattersA number of proceedings have been initiated against ABN AMRO for alleged breach of its duty of care in transparency-related standards. Where applicable, provisions for these matters have been made.
There can be no assurance that additional proceedings will not be brought or that amounts demanded in claims brought to date will not rise. Current proceedings are pending and their outcome, as well as the outcome of any threatened proceedings, is uncertain, as is the timing of reaching any finality on these legal claims and proceedings. Although the consequences could be substantial for ABN AMRO and potentially affect its reputation, results of operations, financial condition and prospects, it is not possible to reliably estimate or quantify ABN AMRO’s exposure at this time. These uncertainties are likely to continue for some time.
Interest rate derivatives sold to SME clientsA public debate has been ongoing in the Netherlands on a bank’s duty of care to SMEs with respect to interest rate derivatives (IRD). As explained in Note 29 Provisions, ABN AMRO entered into IRD with some SME clients. These clients entered into these derivatives with the purpose of fixing the interest rate risk on their floating rate loans. A combination of a floating interest rate loan and an interest rate swap was less expensive for them than the alternative of a loan with a fixed interest rate. While there are no negative consequences for clients if the loan is not repaid before its maturity date, the decline in interest rates means the interest rate swaps currently have a negative mark-to-market value.
Individual or class action complaints and litigationSome SME clients needed or wanted to repay their floating interest rate loans before their maturity date. Consequently, the interest rate swap needed to be unwound in order to avoid creating an overhedge. In line with standard market practice, the SME clients had to pay the bank the negative mark-to-market value of the interest rate swap, which may be compared to the penalty interest on a fixed rate loan. ABN AMRO received multiple complaints and some clients and/or interest groups instigated legal proceedings about the bank’s alleged violation of its duty of care. In most cases the client’s claim was rejected, while in some the bank paid compensation to the client. In the case of litigation relating to SME derivatives, ABN AMRO does not recognise provisions for claims that do not meet the recognition and/or measurement criteria.
Uniform Recovery FrameworkIn December 2015, the AFM concluded that some aspects of the reviews that banks were conducting with respect to their SME client files containing IRD would need to be amended. On 5 July 2016, the independent Uniform Recovery Framework (URF) on the reassessment of SME and middle-market IRD was presented. ABN AMRO has committed to this framework. As it is unclear how the URF will impact pending and future litigation, this is considered a contingency and no provision is made. Reference is made in this respect to Note 29 Provisions.
Cross-liabilityOn 6 February 2010, the former ABN AMRO Bank N.V. demerged into two entities: RBS N.V. and ABN AMRO Bank N.V. (the ‘2010 Demerger’), giving rise to cross-liabilities similar to the cross-liabilities described above. If ABN AMRO Bank N.V. fails to perform its obligations existing at the time of the 2010 Demerger, RBS N.V. is liable for the performance; if RBS N.V. fails to perform its obligations existing at the time of the 2010 Demerger, ABN AMRO Bank N.V. is liable. RBS N.V.’s contingent liability for divisible obligations as a result of the 2010 Demerger is limited to EUR 4.0 billion, whereas ABN AMRO Bank N.V.’s contingent liability is limited to EUR 1.8 billion (which amount remained unchanged compared to 31 December 2018). ABN AMRO Bank N.V. has put in place arrangements to mitigate the risks of such contingent liability and received collateral from RBS Plc amounting to EUR 0.9 billion (2018: EUR 1.8 billion). ABN AMRO Bank N.V. did not post any collateral with RBS N.V. or RBS Plc.
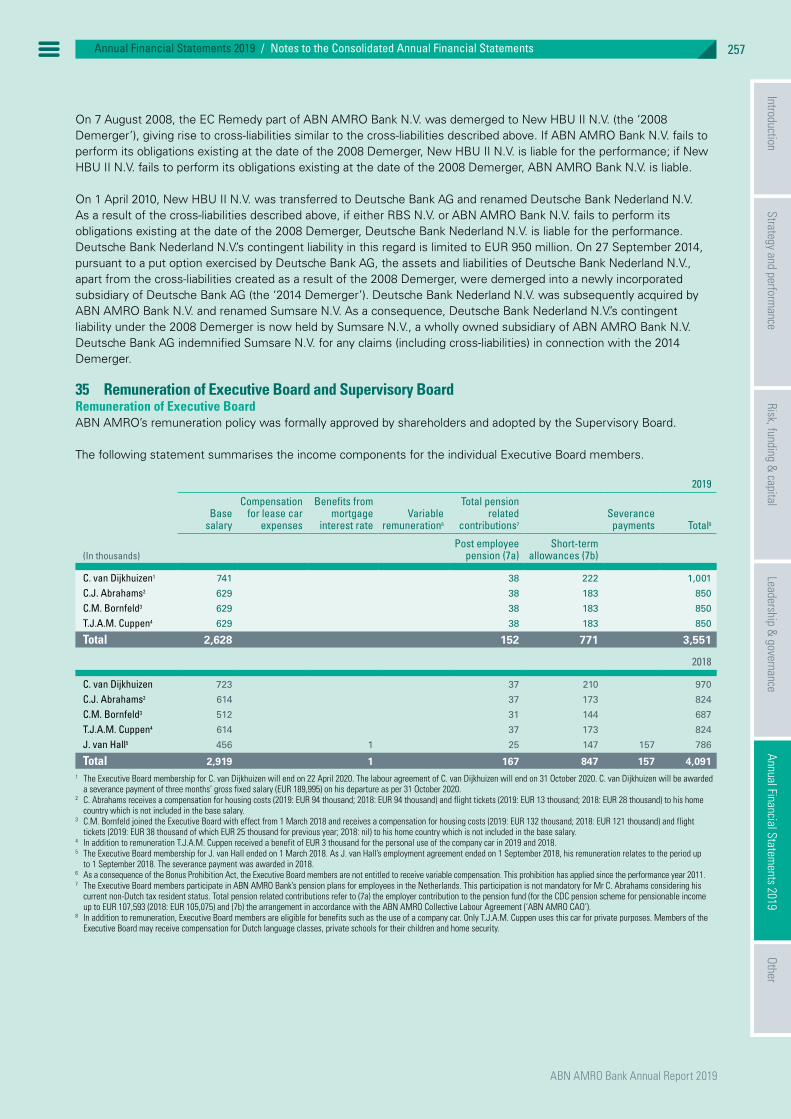
ABN AMRO Bank Annual Report 2019
257Annual Financial Statements 2019 / Notes to the Consolidated Annual Financial Statements
On 7 August 2008, the EC Remedy part of ABN AMRO Bank N.V. was demerged to New HBU II N.V. (the ‘2008 Demerger’), giving rise to cross-liabilities similar to the cross-liabilities described above. If ABN AMRO Bank N.V. fails to perform its obligations existing at the date of the 2008 Demerger, New HBU II N.V. is liable for the performance; if New HBU II N.V. fails to perform its obligations existing at the date of the 2008 Demerger, ABN AMRO Bank N.V. is liable.
On 1 April 2010, New HBU II N.V. was transferred to Deutsche Bank AG and renamed Deutsche Bank Nederland N.V. As a result of the cross-liabilities described above, if either RBS N.V. or ABN AMRO Bank N.V. fails to perform its obligations existing at the date of the 2008 Demerger, Deutsche Bank Nederland N.V. is liable for the performance. Deutsche Bank Nederland N.V.’s contingent liability in this regard is limited to EUR 950 million. On 27 September 2014, pursuant to a put option exercised by Deutsche Bank AG, the assets and liabilities of Deutsche Bank Nederland N.V., apart from the cross-liabilities created as a result of the 2008 Demerger, were demerged into a newly incorporated subsidiary of Deutsche Bank AG (the ‘2014 Demerger’). Deutsche Bank Nederland N.V. was subsequently acquired by ABN AMRO Bank N.V. and renamed Sumsare N.V. As a consequence, Deutsche Bank Nederland N.V.’s contingent liability under the 2008 Demerger is now held by Sumsare N.V., a wholly owned subsidiary of ABN AMRO Bank N.V. Deutsche Bank AG indemnified Sumsare N.V. for any claims (including cross-liabilities) in connection with the 2014 Demerger.
35 Remuneration of Executive Board and Supervisory BoardRemuneration of Executive BoardABN AMRO’s remuneration policy was formally approved by shareholders and adopted by the Supervisory Board.
The following statement summarises the income components for the individual Executive Board members.
2019
Base salary
Compensation for lease car
expenses
Benefits from mortgage
interest rateVariable
remuneration6
Total pension related
contributions7
Severance payments Total8
(In thousands)Post employee
pension (7a)Short-term
allowances (7b)
C. van Dijkhuizen1 741 38 222 1,001
C.J. Abrahams2 629 38 183 850
C.M. Bornfeld3 629 38 183 850
T.J.A.M. Cuppen4 629 38 183 850
Total 2,628 152 771 3,551
2018
C. van Dijkhuizen 723 37 210 970
C.J. Abrahams2 614 37 173 824
C.M. Bornfeld3 512 31 144 687
T.J.A.M. Cuppen4 614 37 173 824
J. van Hall5 456 1 25 147 157 786
Total 2,919 1 167 847 157 4,0911 The Executive Board membership for C. van Dijkhuizen will end on 22 April 2020. The labour agreement of C. van Dijkhuizen will end on 31 October 2020. C. van Dijkhuizen will be awarded
a severance payment of three months’ gross fixed salary (EUR 189,995) on his departure as per 31 October 2020.2 C. Abrahams receives a compensation for housing costs (2019: EUR 94 thousand; 2018: EUR 94 thousand) and flight tickets (2019: EUR 13 thousand; 2018: EUR 28 thousand) to his home
country which is not included in the base salary. 3 C.M. Bornfeld joined the Executive Board with effect from 1 March 2018 and receives a compensation for housing costs (2019: EUR 132 thousand; 2018: EUR 121 thousand) and flight
tickets (2019: EUR 38 thousand of which EUR 25 thousand for previous year; 2018: nil) to his home country which is not included in the base salary.4 In addition to remuneration T.J.A.M. Cuppen received a benefit of EUR 3 thousand for the personal use of the company car in 2019 and 2018.5 The Executive Board membership for J. van Hall ended on 1 March 2018. As J. van Hall’s employment agreement ended on 1 September 2018, his remuneration relates to the period up
to 1 September 2018. The severance payment was awarded in 2018.6 As a consequence of the Bonus Prohibition Act, the Executive Board members are not entitled to receive variable compensation. This prohibition has applied since the performance year 2011.7 The Executive Board members participate in ABN AMRO Bank’s pension plans for employees in the Netherlands. This participation is not mandatory for Mr C. Abrahams considering his
current non-Dutch tax resident status. Total pension related contributions refer to (7a) the employer contribution to the pension fund (for the CDC pension scheme for pensionable income up to EUR 107,593 (2018: EUR 105,075) and (7b) the arrangement in accordance with the ABN AMRO Collective Labour Agreement (‘ABN AMRO CAO’).
8 In addition to remuneration, Executive Board members are eligible for benefits such as the use of a company car. Only T.J.A.M. Cuppen uses this car for private purposes. Members of the Executive Board may receive compensation for Dutch language classes, private schools for their children and home security.
IntroductionStrategy and perform
anceRisk, funding &
capitalLeadership &
governanceOther
Annual Financial Statements 2019

ABN AMRO Bank Annual Report 2019
IntroductionStrategy and perform
anceRisk, funding &
capitalLeadership structure
GovernanceAnnual Financial Statem
entsOther
IntroductionStrategy and perform
anceRisk, funding &
capitalLeadership &
governanceOther
258
Annual Financial Statements 2019
Annual Financial Statements 2019 / Notes to the Consolidated Annual Financial Statements
Loans from ABN AMRO to Executive Board membersThe following table summarises the outstanding loans to members of the Executive Board.
2019 2018
(In thousands)Outstanding
31 December RedemptionsInterest
rateOutstanding
31 December RedemptionsInterest
rate
J. van Hall1 69 3.5%
1 Executive Board Membership for J. van Hall ended on 1 March 2018.
Remuneration of the Supervisory BoardThe following statement summarises the income components for the individual Supervisory Board members.
(In thousands) 20199 20189
T. de Swaan1 90 42
S. ten Have2 19 67
A.C. Dorland 75 75
L.J. Griffith3 3
M.P. Lap4 50
F.J. Leeflang5 23 73
J.M. Roobeek6 70 73
J.B.J. Stegmann 78 78
A.M. Storåkers7 43
J.S.T. Tiemstra 78 78
O.L. Zoutendijk8 39
Total 529 525
1 T. de Swaan was appointed as Chairman of the Supervisory Board with effect from 12 July 2018.2 S. ten Have stepped down as member of the Supervisory Board with effect from 24 April 2019.3 L.J. Griffith was appointed as member of the Supervisory Board with effect from 17 December 2019.4 M.P. Lap was appointed as member of the Supervisory Board with effect from 24 April 2019.5 F.J. Leeflang stepped down as a member from the Supervisory Board with effect from 24 April 2019.6 J.M. Roobeek stepped down as member of the Supervisory Board with effect from 17 December 2019.7 A.M. Storåkers was appointed as member of the Supervisory Board with effect from 24 April 2019.8 O.L. Zoutendijk stepped down as Chairman of the Supervisory Board with effect from 5 February 2018 and as member of the Supervisory Board with effect from 1 July 2018.9 Remuneration amounts excluding VAT.
Loans from ABN AMRO to Supervisory Board membersThe following table summarises the outstanding loans to members of the Supervisory Board.
2019 2018
(In thousands)Outstanding
31 December RedemptionsInterest
rateOutstanding
31 December RedemptionsInterest
rate
T. de Swaan1 1,407 2.8% 1,407 2.8%
L.J. Griffith2 522 1.8%
J.B.J. Stegmann 500 400 0.1% 900 0.1%
J.M. Roobeek3 1,600 3.0% 1,600 100 3.0%
S. ten Have4 564
1 T. de Swaan was appointed as Chairman of the Supervisory Board with effect from 12 July 2018.2 L.J. Griffith was appointed as member of the Supervisory Board with effect from 17 December 2019.3 J.M. Roobeek stepped down as member of the Supervisory Board with effect from 17 December 2019.4 S. ten Have stepped down as member of the Supervisory Board with effect from 24 April 2019.
36 Share-based payment
Accounting policy for share-based paymentEffective as of 2019, ABN AMRO has a share-based payment plan consisting of a cash bonus and a non-cash bonus. The non-cash bonus qualifies as a cash-settled share-based payment plan as defined by IFRS 2 Share-based payments. A liability is recognised for the fair value of cash-settled transactions. The fair value is measured initially and at each reporting date up to and including the settlement date, with changes in fair value recognised in employee benefits expense. The fair value is determined using an internally developed model based on the share price and market expectations of future dividends. Participants in the plan have the option to request depositary receipts (DR) rather than cash. This choice can be made during the quarter in which the settlement takes place and is subject to Supervisory Board approval. This equity component in the

ABN AMRO Bank Annual Report 2019
259Annual Financial Statements 2019 / Notes to the Consolidated Annual Financial Statements
plan is valued at nil until the request is approved. Participants receive the same amount of fair value, regardless of whether they choose cash or DRs. If participants choose DRs, the value of the depositary receipts is transferred from the liability in its entirety to an equity account. The actual delivery to the participant is expected to take place in the same quarter as the choice is made. Past practice shows that the number of participants that choose DRs rather than cash is very low. Therefore the impact on the accounting is limited. The cash bonus in this revised variable compensation plan is recorded based on IAS 19. ABN AMRO will not issue additional shares, but will buy shares in the market when needed. As the purchase of shares is expected to take place in the quarter during which the DRs are delivered, there is no impact on (diluted) earnings per share.
Identified staff as defined by CRD IV receive variable compensation. A performance award is granted for a certain performance year. This award is 50% in cash and 50% in a non-cash (depositary receipt) award. The non-cash award vests for 30% two years after the performance year. The remaining 20% vests in three equal tranches in the third, fourth and fifth year following the performance year. The vesting conditions include a retention period until the non-cash award is settled and performance conditions that apply until two years before settlement. Bad leaver conditions also apply. At the end of the vesting period, participants receive the cash value of the five-day average of an ABN AMRO listed DR. The carrying amount of the liability relating to the non-cash award at 31 December 2019 was EUR 11 million (2018: nil).
The expense recognised for the variable compensation plan during 2019 is EUR 14 million. The 2019 IFRS 2 expense includes the costs for 2016, 2017 and 2018 because the non-cash variable compensation for these years became a share-based payment plan, as defined by IFRS, when the Supervisory Board approved the variable compensation plan in the first quarter of 2019. The IAS 19 Employee benefit liability recorded to that date was released to the income statement. Consequently there was no significant impact on employee costs in 2019. There were no cancellations or modifications to the awards in 2018 or 2017.
The table below shows the number of depository receipts that have been awarded, forfeited and paid out in 2019.
(In thousands of DRs) 31 December 2019
Outstanding at 1 JanuaryGranted on appoval date 701
Granted during the year 295
Forfeited during the year 12
Paid out during the year cash 224
Paid out during the year DRs 9
Less: total paid out/forfeited -245
Outstanding at end of period 751
The table below shows the total number of granted depositary receipts, segmented by the respective vesting period, after which the award will be paid out.
(In thousands of DRs)Up to one
year
Between one and
two years
Between two and
three years
Between three and four years
Between four and
five years Total
31 December 2019Number of granted DRs by vesting period 233 268 131 80 39 751
37 Related partiesParties related to ABN AMRO Bank include NLFI with control, the Dutch State with significant influence, associates, pension funds, joint ventures, the Executive Board, the Executive Committee, the Supervisory Board, close family members of any person referred to above, entities controlled or significantly influenced by any person referred to above and any other related entities. ABN AMRO has applied the partial exemption for government-related entities as described in IAS 24 paragraphs 25-27.
As part of its business operations, ABN AMRO frequently enters into transactions with related parties. Transactions conducted with the Dutch State are limited to normal banking transactions, taxation and other administrative relationships, with the exception of items specifically disclosed in this note. Normal banking transactions relate to loans and deposits and are entered into under the same commercial and market terms that apply to non-related parties.
Loans and advances to the Executive Board, Executive Committee members and close family members, where applicable, consist mainly of residential mortgages granted under standard personnel conditions. For further information, see Note 35 of the Consolidated Annual Financial statements 2019.
IntroductionStrategy and perform
anceRisk, funding &
capitalLeadership &
governanceOther
Annual Financial Statements 2019

ABN AMRO Bank Annual Report 2019
IntroductionStrategy and perform
anceRisk, funding &
capitalLeadership structure
GovernanceAnnual Financial Statem
entsOther
IntroductionStrategy and perform
anceRisk, funding &
capitalLeadership &
governanceOther
260
Annual Financial Statements 2019
Annual Financial Statements 2019 / Notes to the Consolidated Annual Financial Statements
Balances with joint ventures, associates and other
(in millions) Joint ventures Associates Other Total
31 December 2019Assets 8 403 412
Liabilities 80 469 548
Guarantees given 15 15
Guarantees receivedIrrevocable facilities 56 56
2019Income received 33 24 57
Expenses paid 7 8 302 317
31 December 2018Assets 10 493 503
Liabilities 39 481 519
Guarantees given 15 15
Guarantees received 2 2
Irrevocable facilities 22 22
2018Income received 32 29 61
Expenses paid 7 7 282 295
Assets with associates decreased by EUR 90 million at 31 December 2019 compared with 31 December 2018, mainly due to lower balances on current accounts held by other financial institutions.
Liabilities with joint ventures increased by EUR 41 million at 31 December 2019 compared with 31 December 2018, mainly due to higher balances on deposit with other financial institutions.
Irrevocable facilities with associates increased by EUR 34 million at 31 December 2019 compared with 31 December 2018, due to the introduction of new ATM machines by Geldmaat. The irrevocable facilities mainly comprise facilities made available to Geldmaat through ATMs, but that have not yet been utilised.
Expenses in the column Other relate to pension contributions paid to the ABN AMRO pension fund.
Balances with the Dutch State
(in millions) 31 December 2019 31 December 2018
Assets:Financial assets held for trading 177 183
Derivatives 438 714
Financial investments 4,888 4,704
Loans and advances customers 1,007 722
Other assets 9
Liabilities:Financial liabilities held for trading 80 53
Derivatives 1,343 1,362
Due to customers 826 832
Other liabilities 1
2019 2018
Income statement:Interest income 100 109
Interest expense 39 38
Net trading income -289 -66

ABN AMRO Bank Annual Report 2019
261Annual Financial Statements 2019 / Notes to the Consolidated Annual Financial Statements
On 1 April 2010 ABN AMRO signed an indemnity agreement with the Dutch State (currently represented by NLFI) for a shortfall in capital above a certain amount related to specific assets and liabilities of RFS Holdings B.V. In 2019, Royal Bank of Scotland (RBS) acquired all the shares in RFS Holdings. However, NLFI has given certain warranties related to the shares it previously owned in RFS Holdings and this indemnity agreement continues to exit. As RFS Holdings is sufficiently capitalised, ABN AMRO has assessed the risk of any shortfall as remote.
Transactions conducted with the Dutch State are limited to normal banking transactions, taxation and other administrative relationships. Normal banking transactions relate to loans and deposits, financial assets held for trading and financial investments, and are entered into on the same commercial and market terms that apply to non-related parties.
Transactions and balances related to taxation, such as levies in the Netherlands, are excluded from the above table. Transactions and balances related to taxation are included in Note 10 Income tax expense, tax assets and tax liabilities. Most of the tax items in this note consist of transactions and balances with the Dutch tax authorities.
The regulatory charges relating to the Dutch State are included in Note 9 General and administrative expenses.
Derivatives related to assets decreased by EUR 0.3 billion at 31 December 2019 compared with 31 December 2018, mainly due to lower lending positions with the Dutch State. Derivatives transactions with the Dutch State relate to the normal course of business.
Loans and advances customers increased by EUR 0.3 billion at 31 December 2019 compared with 31 December 2018. This was due to higher cash collateral pledged as a result of an increase in financial liabilities held for trading.
Net trading income decreased by EUR 223 million to a loss of EUR 289 million at 31 December 2019 (31 December 2018: loss of EUR 66 million), mainly due to the sale of Dutch government bonds.
Key management personnel compensation
Base salary
Compensation for lease car
expenses
Benefits from mortgage
interest rate
Pre ExCo deferred
remuneration5
Variable remuneration
Total pension related contributions6
Severance payments Total7 , 8
(In thousands)
Post employee
pension (6a)
Short-term allowances
(6b)
2019Members ExBo 2,628 152 771 3,551
F.M.R. van der Horst1 609 12 21 24 38 175 879
D.C. de Kluis2 572 10 16 21 38 163 820
G.J. Meppelink3 319 20 5 31 22 90 487
P.H. van Mierlo4 572 4 5 9 38 163 791
R.F. van Nouhuijs 609 34 12 33 38 175 901
Total 5,309 79 59 118 326 1,537 7,428
2018Members ExBo 2,919 1 167 847 157 4,091
F.M.R. van der Horst1 597 12 22 70 37 167 905
D.C. de Kluis2 561 10 17 51 37 155 831
G.J. Meppelink 536 34 11 41 37 146 805
P.H. van Mierlo4 561 6 6 62 37 155 827
R.F. van Nouhuijs 597 34 12 76 37 167 922
Total 5,770 95 69 300 353 1,638 157 8,381
1 In addition to remuneration F.M.R. van der Horst received a benefit of EUR 13 thousand for the personal use of the company car in 2019 and 2018.2 In addition to remuneration D.C. de Kluis received a benefit of EUR 15 thousand for the personal use of the company car in 2019 and 2018.3 G.J. Meppelink stepped down from ExCo 1 August 2019 and worked on several assignments for ExCo till 31 December 2019. The labour agreement of G.J. Meppelink is agreed to end on
30 June 2020 and he will be awarded a severance payment of EUR 243,958 upon his departure. 4 In addition to remuneration P.H. van Mierlo received a benefit of EUR 6 thousand for the personal use of the company car in 2019 and 2018.5 Deferred remuneration related to variable remuneration of identified staff for the period before 1 March 2017, see also remuneration chapter.6 The Executive Committee members participate in ABN AMRO Bank’s pension plans as applicable to the employees in the Netherlands. Total pension related contributions as applicable
as of 2019 refer to (3a) the employer contribution to the pension fund (for the CDC pension scheme for pensionable income up to EUR 107,593 (2018: EUR 105,075) and (3b) the arrangement in accordance with the ABN AMRO Collective Labour Agreement (‘ABN AMRO CAO’).
7 Consistent with regular employees Other ExCo members are eligible for an employee mortgage discount.8 In addition to remuneration, other ExCo members are eligible for benefits such as the use of a company car.
IntroductionStrategy and perform
anceRisk, funding &
capitalLeadership &
governanceOther
Annual Financial Statements 2019

ABN AMRO Bank Annual Report 2019
IntroductionStrategy and perform
anceRisk, funding &
capitalLeadership structure
GovernanceAnnual Financial Statem
entsOther
IntroductionStrategy and perform
anceRisk, funding &
capitalLeadership &
governanceOther
262
Annual Financial Statements 2019
Annual Financial Statements 2019 / Notes to the Consolidated Annual Financial Statements
Key management loans and advances
2019 2018
(In thousands)Outstanding
31 December RedemptionsAverage
interest rateOutstanding
31 December RedemptionsAverage
interest rate
Executive Board 69 3.5%
Other ExCo members 4,988 588 2.8% 5,310 216 2.9%
38 Post balance sheet eventsOn 13 February 2020 ABN AMRO reached an agreement with the foundation Stichting Euribar on a settlement for clients with Euribor-based mortgages. Please refer to Note 29 Provisions in the Consolidated Annual Financial Statements for more information.
The current Covid-19 outbreak most likely impacts the global economy and ABN AMRO’s financial position and results. More specifically the impact is expected on instruments measured at fair value and on the expected credit losses. Currently ABN AMRO is closely monitoring any financial impact attributable to the Covid-19 outbreak on industry sectors, such as industrials, transportation & logistics and leisure. Given the uncertainties and ongoing developments the Bank cannot accurately and reliably estimate the quantitative impact.
Authorisation of the Consolidated Annual Financial Statements10 March 2020
Supervisory BoardT. (Tom) de Swaan, Chairman A.C. (Arjen) Dorland, Vice-Chairman L.J. (Laetitia) Griffith M.P. (Michiel) Lap J.B.J. (Jurgen) Stegmann A.M. (Anna) Storåkers J.S.T. (Tjalling) Tiemstra
Executive BoardC. (Kees) van Dijkhuizen, CEO and Chairman C. (Clifford) Abrahams, CFO and Vice-Chairman T.J.A.M. (Tanja) Cuppen, CRO C.M. (Christian) Bornfeld, CI&TO
ABN AMRO Bank Annual Report 2019
263
Company Financial Statements of ABN AMRO Bank N.V.
Company income statement 264
Company statement of financial position 265
Company statement of changes in equity 266
Notes to the Company Financial Statements of ABN AMRO Bank N.V. 2671 Accounting policies 2672 Net interest income 2673 Results from financial transactions 2684 Income from securities and participating interests 2685 Other operating income 2686 Personnel expenses 2687 Cash and balances at central banks 2698 Short-dated government paper 2699 Loans and advances banks 26910 Loans and advances customers 27011 Debt securities 27012 Equity securities 271
13 Participating interests in group companies 27114 Equity accounted investments 27215 Property, equipment and intangible assets 27216 Other assets 27317 Due to banks 27318 Due to customers 27319 Issued debt 27420 Subordinated liabilities 27421 Provisions 27522 Other liabilities 27623 Equity 27624 Maturity of selected assets and liabilities 27725 Contingent liabilities 27826 Assets pledged 27827 Segment information 27928 Remuneration 27929 Related parties 27930 Post balance sheet events 279
Authorisation of the Company Annual Financial Statements 279
IntroductionStrategy and perform
anceRisk, funding &
capitalLeadership &
governanceOther
Annual Financial Statements 2019
Company Financial Statements of ABN AMRO Bank N.V. Company Financial Statements of ABN AMRO Bank N.V.
Annual Financial Statements 2019
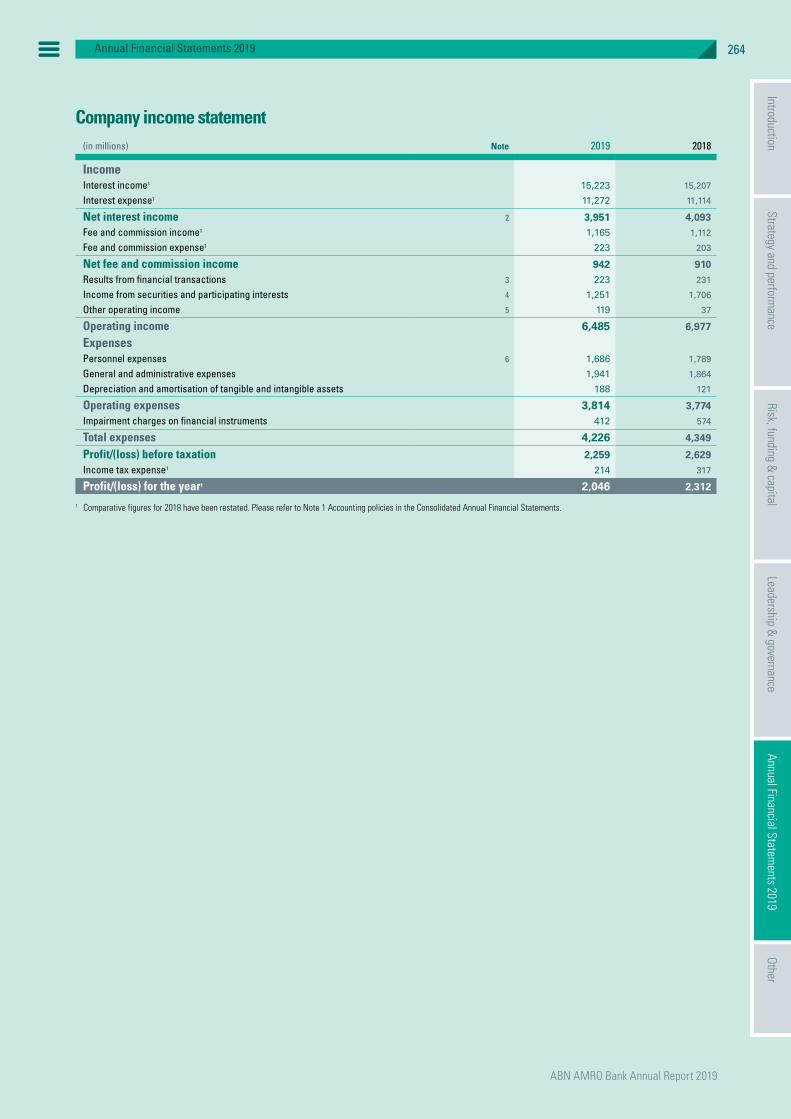
ABN AMRO Bank Annual Report 2019
IntroductionStrategy and perform
anceRisk, funding &
capitalLeadership structure
GovernanceAnnual Financial Statem
entsOther
IntroductionStrategy and perform
anceRisk, funding &
capitalLeadership &
governanceOther
264
Annual Financial Statements 2019
Annual Financial Statements 2019
Company income statement(in millions) Note 2019 2018
IncomeInterest income1 15,223 15,207
Interest expense1 11,272 11,114
Net interest income 2 3,951 4,093Fee and commission income1 1,165 1,112
Fee and commission expense1 223 203
Net fee and commission income 942 910Results from financial transactions 3 223 231
Income from securities and participating interests 4 1,251 1,706
Other operating income 5 119 37
Operating income 6,485 6,977
ExpensesPersonnel expenses 6 1,686 1,789
General and administrative expenses 1,941 1,864
Depreciation and amortisation of tangible and intangible assets 188 121
Operating expenses 3,814 3,774Impairment charges on financial instruments 412 574
Total expenses 4,226 4,349
Profit/(loss) before taxation 2,259 2,629Income tax expense1 214 317
Profit/(loss) for the year1 2,046 2,312
1 Comparative figures for 2018 have been restated. Please refer to Note 1 Accounting policies in the Consolidated Annual Financial Statements.

ABN AMRO Bank Annual Report 2019
265Annual Financial Statements 2019
Company statement of financial position(in millions) Note 31 December 2019 31 December 2018
AssetsCash and balances at central banks 7 25,590 32,383
Short-term government paper 8 37,505 34,711
Loans and advances banks 9 169,777 169,373
Loans and advances customers 10 128,655 133,656
Debt securities 11 6,723 5,601
Equity securities 12 57 227
Participating interests in group companies 13 8,180 7,600
Equity accounted investments 14 224 169
Intangible assets 15 59 18
Property and equipment 15 862 726
Other assets 16 7,201 8,261
Total assets 384,832 392,725
LiabilitiesDue to banks 17 48,745 55,773
Due to customers 18 224,161 219,310
Issued debt 19 70,757 76,341
Subordinated liabilities 20 10,041 9,805
Provisions 21 736 889
Other liabilities 22 8,921 9,249
Total liabilities 363,361 371,368
EquityShare capital 940 800
Share premium 12,970 4,041
Revaluation reserves -967 -372
Legal reserves 147 155
Other reserves1 , 2 4,348 12,436
AT1 Capital securities 1,987 1,986
Profit/(loss) for the period2 2,046 2,312
Total equity 23 21,471 21,357
Total liabilities and equity 384,832 392,725Committed credit facilities 25 65,495 76,849
Guarantees and other commitments 25 37,664 30,807
1 Consists of actuarial gains/(losses) on post-employee benefit plans and retained earnings.2 Comparative figures for 2018 have been restated. Please refer to Note 1 Accounting policies in the Consolidated Annual Financial Statements.
IntroductionStrategy and perform
anceRisk, funding &
capitalLeadership &
governanceOther
Annual Financial Statements 2019

ABN AMRO Bank Annual Report 2019
IntroductionStrategy and perform
anceRisk, funding &
capitalLeadership structure
GovernanceAnnual Financial Statem
entsOther
IntroductionStrategy and perform
anceRisk, funding &
capitalLeadership &
governanceOther
266
Annual Financial Statements 2019
Annual Financial Statements 2019
Company statement of changes in equity
(in millions)Share
capitalShare
premiumRevaluation
reservesLegal
reservesOther
reserves2
Capital securities Total
Balance at 1 January 2018 800 4,041 -414 100 14,477 1,987 20,991Total comprehensive income1 42 55 1,744 1,841
Dividend -1,363 -1,363
Interest AT1 capital securities1 -103 -103
Other changes in equity -8 -8
Balance at 31 December 2018 800 4,041 -372 155 14,747 1,986 21,357Total comprehensive income -595 -8 2,136 1,533
Dividend -1,316 -1,316
Interest AT1 capital securities -105 -105
Increase/(decrease) of capital 1 1
Capital restructuring 140 8,929 -9,069
Other changes in equity 1 1
Balance at 31 December 2019 940 12,970 -967 147 6,393 1,987 21,471
1 Comparative figures for 2018 have been restated. Please refer to Note 1 Accounting policies in the Consolidated Annual Financial Statements.
Total equity increased by EUR 114 million as at 31 December 2019. The addition of the total comprehensive income for 2019 resulted in an increase of EUR 1,533 million attributable to the owners of the parent company. The dividend payment to the shareholders of the parent company decreased equity by EUR 1,316 million. The dividend payment on the AT1 capital securities decreased equity by EUR 105 million.

ABN AMRO Bank Annual Report 2019
267Annual Financial Statements 2019 / Notes to the Company Financial Statements of ABN AMRO Bank N.V.
Notes to the Company Financial Statements of ABN AMRO Bank N.V.1 Accounting policiesThe Company Annual Financial Statements of ABN AMRO Bank N.V. have been prepared in accordance with the requirements in Title 9 of Book 2 of the Dutch Civil Code. ABN AMRO Bank N.V. applies the option as included in Section 2:362 paragraph 8. ABN AMRO Bank N.V. prepares its Consolidated Annual Financial Statements in accordance with International Financial Reporting Standards as adopted by the European Union (EU IFRS). Reference is made to the accounting policies section in the Consolidated Annual Financial Statements and the respective notes.
Corporate informationABN AMRO Bank N.V. is registered at Gustav Mahlerlaan 10, 1082 PP Amsterdam, the Netherlands (Chamber of Commerce number 34334259). On 29 June 2019, ABN AMRO Bank N.V. merged with its parent company, ABN AMRO Group N.V. As a result of the merger, ABN AMRO Group N.V. ceased to exist. The activities of ABN AMRO Group N.V. have been integrated into and continued in ABN AMRO Bank N.V. Shareholders of ABN AMRO Group N.V. became shareholders of ABN AMRO Bank N.V., while shares in ABN AMRO Bank N.V. are represented by depositary receipts, through which ABN AMRO’s listing on Euronext Amsterdam has been retained. Before completion of the merger, ABN AMRO Bank N.V. made a payment of EUR 9,069 million from its retained earnings to ABN AMRO Group N.V., and ABN AMRO Group N.V. contributed the same amount to ABN AMRO Bank N.V.’s share premium. Consequently, ABN AMRO Bank N.V.’s retained earnings decreased by EUR 9,069 million and its share premium increased by the same amount. As the number of shares outstanding at ABN AMRO Group N.V. was 140 million higher, ABN AMRO Bank N.V. issued 140 million additional shares of EUR 1 each. These shares were funded out of the share premium. As a result of these transactions, the equity components of ABN AMRO Bank N.V. match the pre-merger equity components of ABN AMRO Group N.V. Holders of debt instruments continue to hold instruments issued by ABN AMRO Bank N.V.
Basis of preparationThe impairment requirements of IFRS 9 are applicable to financial instruments measured at amortised cost and FVOCI. These requirements also apply to intercompany transactions, which are eliminated upon consolidation. In ABN AMRO Bank’s Company Annual Financial Statements, the elimination of expected credit losses on intercompany transactions with subsidiaries is recognised in the carrying amount of the loans and advances and participating interests in group companies. Participating interests in group companies are measured at net asset value, determined on the basis of EU IFRS. The share in the results of participating interests in group companies is reported in accordance with the principles of valuation and profit determination that apply to the Consolidated Annual Financial Statements. The financial statements are presented in euros, which is the presentation currency of the company, rounded to the nearest million (unless otherwise stated).
2 Net interest incomeNet interest income for 2019 amounted to EUR 3,951 million, a decrease of EUR 142 million compared with EUR 4,093 million in 2018.
Net interest income is comprised of interest income from loans, investments and other lending, interest expense on borrowings by ABN AMRO and client accounts, as well as the results from interest rate and foreign exchange contracts entered into for hedging purposes. Interest income from loans and advances - customers amounted to EUR 3,162 million (2018: EUR 3,214 million).
Notes to the Company Financial Statements
of ABN AMRO Bank N.V.
Notes to the Company Financial Statements
of ABN AMRO Bank N.V.
IntroductionStrategy and perform
anceRisk, funding &
capitalLeadership &
governanceOther
Annual Financial Statements 2019

ABN AMRO Bank Annual Report 2019
IntroductionStrategy and perform
anceRisk, funding &
capitalLeadership structure
GovernanceAnnual Financial Statem
entsOther
IntroductionStrategy and perform
anceRisk, funding &
capitalLeadership &
governanceOther
268
Annual Financial Statements 2019
Annual Financial Statements 2019 / Notes to the Company Financial Statements of ABN AMRO Bank N.V.
3 Results from financial transactions
(in millions) 2019 2018
Securities trading and derivatives transactions 119 258
Foreign exchange transaction results 26 9
Other 78 -35
Total results from financial transactions 223 231
Results from financial transactions decreased by EUR 8 million in 2019 to EUR 223 million. Securities trading and derivatives transactions decreased by EUR 139 million to EUR 119 million, mostly due to results from economic hedging activities. The other result from financial transactions increased by EUR 113 million to EUR 78 million, mostly due to sales of public sector loans.
4 Income from securities and participating interests
(in millions) 2019 2018
Shares and equity accounted investments 57 127
Participating interests 1,193 1,579
Total income from securities and participating interests 1,251 1,706
Total income from securities and participating interests decreased by EUR 456 million to EUR 1,251 million (2018: EUR 1,706 million). The decrease was driven by lower participating interest results at various subsidiaries and by lower income from shares and equity accounted investments.
5 Other operating income
(in millions) 2019 2018
Disposal of operating activities and equity accounted investments 106 27
Other 13 10
Total other operating income 119 37
Other operating income increased by EUR 82 million to EUR 119 million (2018: EUR 37 million). This was mainly due to the divestment of Stater N.V., partly offset by the result on the sale of ABN AMRO Channel Islands.
6 Personnel expenses
(in millions) 2019 2018
Salaries and wages 1,135 1,134
Social security charges 162 156
Pension expenses relating to defined benefit plans -3 2
Defined contribution plan expenses 314 278
Other 78 219
Total personnel expenses 1,686 1,789
Total personnel expenses decreased by EUR 103 million to EUR 1,686 million in 2019 (2018: EUR 1,789 million).
Salaries and wages increased by EUR 1 million to EUR 1,135 million in 2019 (2018: EUR 1,134 million). This was mainly driven by an increase of FTE in respect of Detecting Financial Crime and the acquisition of Societe Generale Private Banking NV, Belgium, which was merged with ABN AMRO Bank N.V.’s Belgian branch. The increase was largely offset by cost-saving programmes. Since 2019, ABN AMRO has had a share-based payment plan that consists of a cash bonus and a non-cash bonus. The non-cash bonus qualifies as a cash-settled share-based payment plan as defined by IFRS 2 Share-Based Payments and is included in Salaries and wages. Reference is made to Note 36 Share-based payment in the Consolidated Annual Financial Statements.
The defined contribution plan expenses increased by EUR 36 million to EUR 314 million (2018: EUR 278 million). This was mainly related to a one-off pension expense of EUR 30 million under a new agreement with the ABN AMRO pension fund.

ABN AMRO Bank Annual Report 2019
269Annual Financial Statements 2019 / Notes to the Company Financial Statements of ABN AMRO Bank N.V.
Other personnel expenses decreased by EUR 141 million to EUR 78 million due to lower staff restructuring provisions of EUR 1 million in 2019 (2018: EUR 119 milion) and a decline in car lease expenses following the introduction of IFRS 16 Lease.
7 Cash and balances at central banksCash and balances at central banks decreased by EUR 6.8 billion to EUR 25.6 billion at 31 December 2019, mainly due to lower outstanding overnight positions at the Dutch central bank.
8 Short-dated government paper
(in millions) 31 December 2019 31 December 2018
Short-term government paper held at fair value through other comprehensive income 37,018 34,439
Short-term government paper held for trading 486 273
Short-term government paper 37,505 34,711
Short-dated government paper increased by EUR 2.8 billion to EUR 37.5 billion at 31 December 2019. Most of these instruments are part of the liquidity buffer and are held for liquidity contingency purposes.
Changes in short-term government paper held at fair value through other comprehensive income
(in millions) 2019 2018
Balance at 1 January 34,439 32,180
Purchases 7,335 10,787
Proceeds from sales and redemptions -5,518 -9,412
Gains/(losses) recorded in profit and loss 542 -239
Unrealised gains/(losses) -161 -150
Foreign exchange differences 183 214
Other 200 1,059
Balance at 31 December 37,018 34,439
9 Loans and advances banks
(in millions) 31 December 2019 31 December 2018
Group companies 165,079 162,947
Third parties 4,698 6,425
Loans and advances banks 169,777 169,373
(in millions) 31 December 2019 31 December 2018
Interest-bearing deposits 165,612 164,038
Loans and advances 1,794 2,858
Mandatory reserve deposits with central banks 159 161
Securities financing 781 912
Other 1,431 1,403
Loans and advances banks 169,777 169,373
Loans and advances banks mainly consists of transactions with group companies. Loans and advances banks increased by EUR 0.4 billion to EUR 169.8 billion at 31 December 2019, mainly due to an increase in interest-bearing deposits, partly offset by a decrease in loans and advances.
None of the items in Loans and advances banks were subordinated at 31 December 2019.
Mandatory reserve deposits are held with local central banks in accordance with statutory requirements. These deposits are not available to finance ABN AMRO’s day-to-day operations.
IntroductionStrategy and perform
anceRisk, funding &
capitalLeadership &
governanceOther
Annual Financial Statements 2019

ABN AMRO Bank Annual Report 2019
IntroductionStrategy and perform
anceRisk, funding &
capitalLeadership structure
GovernanceAnnual Financial Statem
entsOther
IntroductionStrategy and perform
anceRisk, funding &
capitalLeadership &
governanceOther
270
Annual Financial Statements 2019
Annual Financial Statements 2019 / Notes to the Company Financial Statements of ABN AMRO Bank N.V.
(in millions) 31 December 2019 31 December 2018
The Netherlands 167,839 167,484
Rest of Europe 321 343
USA 280 350
Asia 1,335 1,196
Rest of the world 3
Loans and advances banks 169,777 169,373
10 Loans and advances customers
(in millions) 31 December 2019 31 December 2018
Group companies 40,646 40,876
Third parties 88,009 92,780
Loans and advances customers 128,655 133,656
Loans and advances customers decreased by EUR 5.0 billion to EUR 128.7 billion at 31 December 2019, mainly due to third parties.
(in millions) 31 December 2019 31 December 2018
Residential mortgages 795 2,686
Consumer loans 7,332 7,609
Corporate loans 108,077 114,101
Securities financing 7,257 4,709
Other loans and advances customers 5,194 4,551
Loans and advances customers 128,655 133,656
Residential mortgages decreased by EUR 1.9 billion to EUR 0.8 billion at 31 December 2019, mainly due to the transfer of mortgages from Private Banking Netherlands to ABN AMRO Hypotheken Groep for operational purposes.
Consumer loans decreased by EUR 0.3 billion to EUR 7.3 billion at 31 December 2019, mainly due to lower advances.
Corporate loans decreased by EUR 6.0 billion to EUR 108.1 billion at 31 December 2019. This decrease was mainly caused by the redemption of an intercompany loan to a structured entity as a result of a decrease in its notes issued.
Securities financing increased by EUR 2.5 billion to EUR 7.3 billion at 31 December 2019.
Other loans and advances customers increased by EUR 0.6 billion to EUR 5.2 billion at 31 December 2019.
Loans and advances customers includes subordinated loans of EUR 32 million (31 December 2018: EUR 32 million), recorded in corporate loans.
(in millions) 31 December 2019 31 December 2018
The Netherlands 108,001 114,474
Rest of Europe 5,617 5,524
USA 8,470 6,216
Asia 5,193 5,976
Rest of the world 1,374 1,467
Loans and advances customers 128,655 133,656
11 Debt securities
(in millions) 31 December 2019 31 December 2018
Group companiesThird parties 6,723 5,601
Debt securities 6,723 5,601

ABN AMRO Bank Annual Report 2019
271Annual Financial Statements 2019 / Notes to the Company Financial Statements of ABN AMRO Bank N.V.
(in millions) 31 December 2019 31 December 2018
Debt securities held at fair value through other comprehensive income 6,079 5,399
Debt securities held for trading 643 202
Debt securities 6,723 5,601
Debt securities increased by EUR 1.1 billion to EUR 6.7 billion at 31 December 2019. Most of these instruments are part of the liquidity buffer and are held for liquidity contingency purposes. At 31 December 2019, EUR 44 million of debt securities were subordinated (31 December 2018: EUR 38 million).
Changes in debt securities held at fair value through other comprehensive income
(in millions) 2019 2018
Balance at 1 January 5,399 6,287
Purchases 1,456 2,192
Proceeds from sales and redemptions -741 -1,971
Gains/(losses) recorded in profit and loss 81 -1
Unrealised gains/(losses) 13 -64
Foreign exchange differences 2 7
Other -130 -1,052
Balance at 31 December 6,079 5,399
12 Equity securities
(in millions) 31 December 2019 31 December 2018
Equity securities held for trading 1
Equity securities held at fair value through profit or loss 56 226
Equity securities 57 227
Equity securities decreased by EUR 0.2 billion to EUR 0.1 billion at 31 December 2019, mainly due to the sale of equity shares.
13 Participating interests in group companies
(in millions) 2019 2018
Balance at 1 January 7,600 8,248
Increase/(decrease) of capital 97 47
Proceeds from sales and redemptions -220 -584
Result from participating interests 1,193 1,579
Dividends -1,522 -1,569
Unrealised gains/(losses) 6 -17
Foreign exchange differences 27 39
Other 1,000 -143
Balance at 31 December 8,180 7,600
At 31 December 2019, participating interests in group companies amounted to EUR 8.2 billion (2018: EUR 7.6 billion). This item is mostly impacted by the result from these interests, which is largely offset by the dividend paid. The other movements related to the hedged risk of residential mortgages, which are accounted for as part of ABN AMRO Hypotheken Groep B.V.
IntroductionStrategy and perform
anceRisk, funding &
capitalLeadership &
governanceOther
Annual Financial Statements 2019

ABN AMRO Bank Annual Report 2019
IntroductionStrategy and perform
anceRisk, funding &
capitalLeadership structure
GovernanceAnnual Financial Statem
entsOther
IntroductionStrategy and perform
anceRisk, funding &
capitalLeadership &
governanceOther
272
Annual Financial Statements 2019
Annual Financial Statements 2019 / Notes to the Company Financial Statements of ABN AMRO Bank N.V.
14 Equity accounted investments
31 December 2019 31 December 2018
(in millions)Principle place
of business Business lineCarrying amount
Equity interest
Carrying amount
Equity interest
Nationale-Nederlanden ABN AMRO Verzekeringen Holding B.V. The Netherlands Retail Banking 98 49% 104 49%
Stater N.V. The Netherlands Retail Banking 50 25%
European Merchant Services B.V. The NetherlandsCommercial
Banking 44 49% 42 49%
Geldmaat B.V. The NetherlandsGroup
functions 25 33% 16 33%
Other 8 8
Total equity associates and joint ventures 224 169
(in millions) 2019 2018
Balance at 1 January 169 356
Purchases 59
Gains/(losses) recorded in profit and loss 19 29
Dividends -29 -95
Unrealised gains/(losses) 6 -122
Other 2
Balance at 31 December 224 169
Purchases includes Stater N.V. which constitutes a loss of control that resulted in a classification as an associate for EUR 51 million.
15 Property, equipment and intangible assetsThe following table shows the book value of property, equipment and intangible assets.
2019 2018
(in millions)Total property
and equipment Intangible assetsTotal property
and equipment Intangible assets
Acquisition costs at 1 January 2,365 671 2,397 657
Impact of adopting IFRS 16 131
Additions 185 39 79 14
Reversal of cost due to disposals -131 -1 -112
Foreign exchange differences 1 4 -1
Other 13 15 1
Acquisition costs at 31 December 2,564 728 2,365 671
Accumulated depreciation/amortisation at 1 January -1,620 -645 -1,615 -628
Depreciation/amortisation -161 -16 -102 -17
Reversal of depreciation/amortisation due to disposals 103 97
Other 1
Accumulated depreciation at 31 December -1,679 -662 -1,620 -645
Impairments at 1 January -18 -8 -21 -8
Impact of adopting IFRS 16 -8
Increase of impairments charged to the income statement -1 -9 -1
Reversal of impairments due to disposals 3 1 3
Foreign exchange differences -3
Other 1 12 2
Impairments at 31 December -22 -8 -18 -8
Total at 31 December 862 59 726 18
A total amount of EUR 5 million included in property and equipment was classified as held for sale at 31 December 2019 (31 December 2018: EUR 14 million).
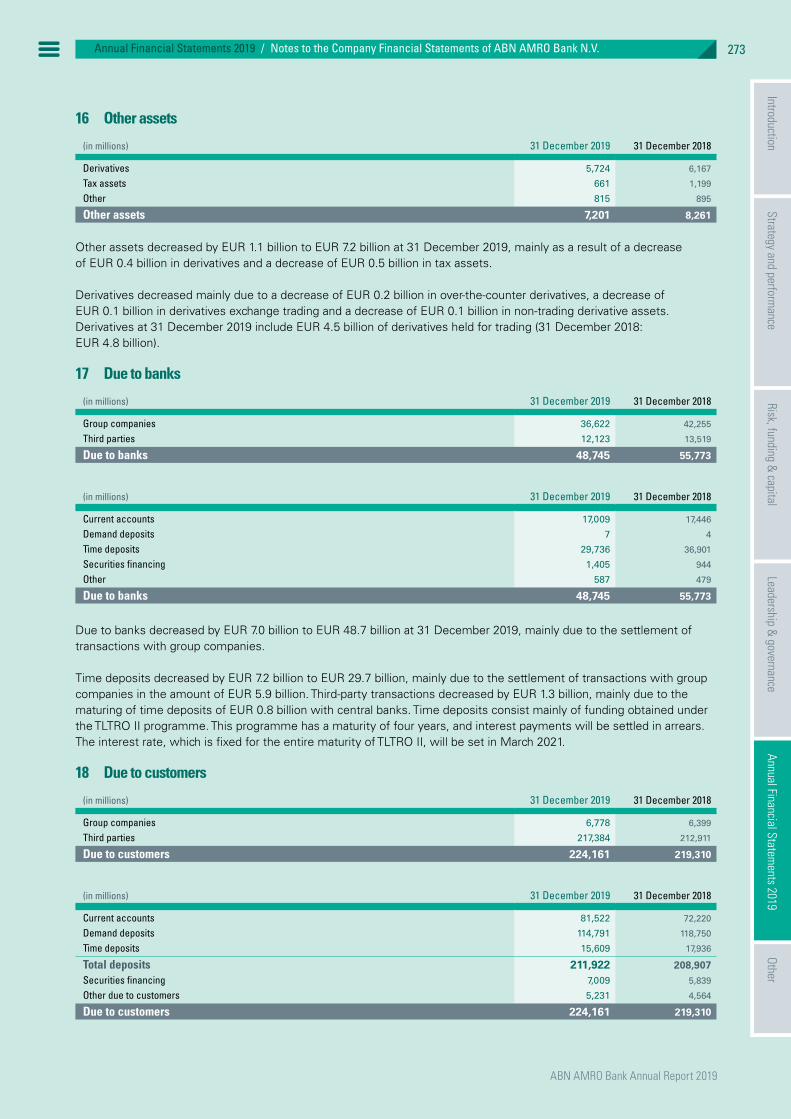
ABN AMRO Bank Annual Report 2019
273Annual Financial Statements 2019 / Notes to the Company Financial Statements of ABN AMRO Bank N.V.
16 Other assets
(in millions) 31 December 2019 31 December 2018
Derivatives 5,724 6,167
Tax assets 661 1,199
Other 815 895
Other assets 7,201 8,261
Other assets decreased by EUR 1.1 billion to EUR 7.2 billion at 31 December 2019, mainly as a result of a decrease of EUR 0.4 billion in derivatives and a decrease of EUR 0.5 billion in tax assets.
Derivatives decreased mainly due to a decrease of EUR 0.2 billion in over-the-counter derivatives, a decrease of EUR 0.1 billion in derivatives exchange trading and a decrease of EUR 0.1 billion in non-trading derivative assets. Derivatives at 31 December 2019 include EUR 4.5 billion of derivatives held for trading (31 December 2018: EUR 4.8 billion).
17 Due to banks
(in millions) 31 December 2019 31 December 2018
Group companies 36,622 42,255
Third parties 12,123 13,519
Due to banks 48,745 55,773
(in millions) 31 December 2019 31 December 2018
Current accounts 17,009 17,446
Demand deposits 7 4
Time deposits 29,736 36,901
Securities financing 1,405 944
Other 587 479
Due to banks 48,745 55,773
Due to banks decreased by EUR 7.0 billion to EUR 48.7 billion at 31 December 2019, mainly due to the settlement of transactions with group companies.
Time deposits decreased by EUR 7.2 billion to EUR 29.7 billion, mainly due to the settlement of transactions with group companies in the amount of EUR 5.9 billion. Third-party transactions decreased by EUR 1.3 billion, mainly due to the maturing of time deposits of EUR 0.8 billion with central banks. Time deposits consist mainly of funding obtained under the TLTRO II programme. This programme has a maturity of four years, and interest payments will be settled in arrears. The interest rate, which is fixed for the entire maturity of TLTRO II, will be set in March 2021.
18 Due to customers
(in millions) 31 December 2019 31 December 2018
Group companies 6,778 6,399
Third parties 217,384 212,911
Due to customers 224,161 219,310
(in millions) 31 December 2019 31 December 2018
Current accounts 81,522 72,220
Demand deposits 114,791 118,750
Time deposits 15,609 17,936
Total deposits 211,922 208,907Securities financing 7,009 5,839
Other due to customers 5,231 4,564
Due to customers 224,161 219,310
IntroductionStrategy and perform
anceRisk, funding &
capitalLeadership &
governanceOther
Annual Financial Statements 2019

ABN AMRO Bank Annual Report 2019
IntroductionStrategy and perform
anceRisk, funding &
capitalLeadership structure
GovernanceAnnual Financial Statem
entsOther
IntroductionStrategy and perform
anceRisk, funding &
capitalLeadership &
governanceOther
274
Annual Financial Statements 2019
Annual Financial Statements 2019 / Notes to the Company Financial Statements of ABN AMRO Bank N.V.
Due to customers increased by EUR 4.9 billion to EUR 224.2 billion at 31 December 2019, mainly as a result of an increase in current accounts (EUR 9.3 billion) and securities financing (EUR 1.2 billion). This was partly offset by a decrease in demand deposits (EUR 4.0 billion) and time deposits (EUR 2.3 billion).
Current accounts increased by EUR 9.3 billion to EUR 81.5 billion at 31 December 2019, mainly due to an inflow of clients and the acquisition of Societe Generale Private Banking N.V. in Belgium.
Demand deposits decreased by EUR 4.0 billion to EUR 114.8 billion at 31 December 2019. This was mainly due to the sale of a Belgian savings portfolio.
Time deposits decreased by EUR 2.3 billion to EUR 15.6 billion at 31 December 2019. The main drivers for this decrease were non-financial corporates and government-related institutions.
Other due to customers increased by EUR 0.7 billion to EUR 5.2 billion at 31 December 2019. This was mainly due to more deposits from other group companies.
19 Issued debtThe following table shows the debt issued by ABN AMRO Bank.
(in millions) 31 December 2019 31 December 2018
Group companiesThird parties 70,757 76,341
Issued debt 70,757 76,341
The following table shows the types of debt issued by ABN AMRO Bank.
(in millions) 31 December 2019 31 December 2018
Bonds and notes issued 59,474 63,319
Certificates of deposit and commercial paper 10,259 11,970
Saving certificates 6
Total at amortised cost 69,733 75,296Designated at fair value through profit or loss 1,024 1,045
Issued debt 70,757 76,341
Total issued debt decreased by EUR 5.6 billion to EUR 70.8 billion at 31 December 2019. This decrease was due to a lower funding need, driven by a decline in the corporate loan book and an increase in corporate deposits. This allowed for a decrease in unsecured medium-term notes, commercial paper and certificates of deposits. No movement was seen in the long-term covered bond portfolio due to a stable mortgage book.
20 Subordinated liabilitiesThe following table specifies the outstanding subordinated liabilities. The issued and outstanding loans qualifying as subordinated liabilities are subordinated to all other current and future liabilities.
(in millions) 31 December 2019 31 December 2018
Group companiesThird parties 10,041 9,805
Subordinated liabilities 10,041 9,805

ABN AMRO Bank Annual Report 2019
275Annual Financial Statements 2019 / Notes to the Company Financial Statements of ABN AMRO Bank N.V.
The following table shows the main types of subordinated liabilities issued by ABN AMRO Bank.
(in millions) 31 December 2019 31 December 2018
Subordinated liabilities 10,041 9,805
- of which EUR 1,228 million (6.375% per annum) 1,345 1,386
- of which USD 595 million (6.250% per annum) 559 541
- of which EUR 1,000 million (7.125% per annum) 1,096 1,109
- of which EUR 1,500 million (2.875% per annum) 1,522 1,538
- of which USD 1,500 million (4.75% per annum) 1,408 1,311
- of which EUR 1,000 million (2.875% per annum) 1,047 1,040
- of which USD 1,000 million (4.8% per annum) 891 818
- of which USD 1,500 million (4.4% per annum) 1,371 1,299
- of which SGD 450 million (4.7% per annum) 302 292
- of which USD 300 million (5.6% per annum) 275 244
Subordinated liabilities increased by EUR 0.2 billion to EUR 10.0 billion at 31 December 2019, mainly due to foreign exchange differences and unrealised gains and losses.
Interest expense on subordinated liabilities amounted to EUR 0.5 billion in 2019 (2018: EUR 0.5 billion).
21 ProvisionsThe following table shows a breakdown of provisions.
(in millions) 31 December 2019 31 December 2018
Provision for pension commitments 42 41
Restructuring 140 209
Other staff provision 111 109
Legal provisions 101 333
Deferred tax liabilities 19 38
Other 323 159
Provisions 736 889
RestructuringRestructuring provisions cover the costs of the restructuring plans for which implementation has been formally announced. The decrease in the restructuring provisions was mainly due to initiatives related to further digitalisation and process optimisation at ABN AMRO. Settlement of existing restructuring programmes may take up to five years. A new restructuring provision was recorded for Private Banking Belgium as a result of the integration of the private banking business with the private banking business acquired from Societe Generale. This restructuring is scheduled to be completed by the end of 2020.
Legal provisionsLegal provisions are based on best estimates available at the year-end and taking into account the opinion of legal specialists. The timing of the outflow of cash related to these provisions is by nature uncertain, given the unpredictability of the outcome and the time required to conclude litigation. Any provision recognised does not constitute an admission of wrongdoing or legal liability. Legal provisions decreased by EUR 0.2 billion to EUR 0.1 billion at 31 December 2019, mainly due to payments related to the provision for interest rate derivatives to SME clients.
Other provisionsOther provisions include provisions for tax purposes. The tax provisions are based on best estimates available at the year-end and taking into account the opinion of tax specialists. The timing of the outflow of cash related to these provisions is by nature uncertain, given the unpredictability of the outcome and the time involved.
Customer Due DiligenceBanks are considered gatekeepers of the financial system, which is a responsibility that ABN AMRO takes very seriously. ABN AMRO invests significant resources to fulfil its role as gatekeeper in general and specifically in combating financial crime. We work closely with regulators, governments, other banks and other authorities. As a result of internal review and the latest supervisory findings ABN AMRO has decided to accelerate its Customer Due Diligence (CDD) programme in order to be compliant with anti-money laundering and terrorist financing legislation. ABN AMRO has
IntroductionStrategy and perform
anceRisk, funding &
capitalLeadership &
governanceOther
Annual Financial Statements 2019

ABN AMRO Bank Annual Report 2019
IntroductionStrategy and perform
anceRisk, funding &
capitalLeadership structure
GovernanceAnnual Financial Statem
entsOther
IntroductionStrategy and perform
anceRisk, funding &
capitalLeadership &
governanceOther
276
Annual Financial Statements 2019
Annual Financial Statements 2019 / Notes to the Company Financial Statements of ABN AMRO Bank N.V.
developed several remediation programmes, amongst others to speed up remediation actions in relation to Retail Banking and Commercial Banking. In order to enable efficient execution we have centralised our CDD activities. The provided amounts are based on – among other things – the total number of files, the time needed to review each file and the percentage of files that will be reviewed using external resources. The total provision regarding the mentioned CDD programmes amounts to EUR 192 million at 31 December 2019. On a general note, all remedial actions necessary to ensure full compliance with legislation across the bank will be taken where such is needed. Additionally, sanctions (such as an instruction or fines) may be imposed by the authorities. Whilst there is a possibility that a fine may be imposed, a provision for such fine is currently not possible as both the likelihood as well as the possible amount is currently unclear.
22 Other liabilities
(in millions) 31 December 2019 31 December 2018
Financial liabilities held for trading 675 249
Derivatives 6,495 7,122
Current tax liabilities 10 512
Other 1,742 1,367
Other liabilities 8,921 9,249
Financial liabilities held for trading increased by EUR 0.4 billion to EUR 0.7 billion. This was due to higher short positions in bonds, primarily in Dutch and German sovereign debt. To a lesser extent, short positions were held in French and Belgian bonds and corporate debt securities.
Derivatives decreased by EUR 0.6 billion to EUR 6.5 billion at 31 December 2019, mainly due to the various types of transactions used by the bank to manage foreign currency and interest rate risk exposure.
Other increased by EUR 0.4 billion to EUR 1.7 billion at 31 December 2019, mainly due to unsettled trades of EUR 0.2 billion and the implementation of IFRS 16 Leases as at 1 January 2019. Please refer to Note 1 Accounting policies in the Consolidated Annual Financial Statements.
23 EquityIssued capital and reservesAt 31 December 2019, the authorised share capital of ABN AMRO Bank N.V. amounted to 2,400,000,000 shares, consisting of 2,200,000,000 ordinary A-shares with a nominal value of EUR 1.00 each and 200,000,000 ordinary B-shares with a nominal value of EUR 1.00 each. Every share is entitled to one vote during the General Meeting. During the financial year, 200,000,000 new ordinary shares and 200,000,000 ordinary B-shares were authorised as a result of the legal merger of ABN AMRO Bank N.V. and ABN AMRO Group N.V. A total of 140,000,001 ordinary shares were issued and paid up. Please refer to Note 1 Accounting policies in the Consolidated Annual Financial Statements. The total number of shares issued at 31 December 2019 was 940,000,001 (2018: 800,000,000).
Revaluation reserves
(in millions) 31 December 2019 31 December 2018
Currency translation reserve -15 54
Fair value reserve 170 273
Cash flow hedge reserve -1,648 -1,162
Accumulated share of OCI of associates and joint ventures 135 -20
Unrealised gains on FVTPL items 391 483
Revaluation reserves -967 -372
Legal reserves
(in millions) 31 December 2019 31 December 2018
Internally developed software 4 5
Accumulated share of result in equity accounted investments (net of dividends) 68 63
Statutory reserves 75 88
Legal reserves 147 155

ABN AMRO Bank Annual Report 2019
277Annual Financial Statements 2019 / Notes to the Company Financial Statements of ABN AMRO Bank N.V.
Distribution of the dividendsThe total dividend paid to ordinary shareholders in 2019 was EUR 1,316 million (2018: EUR 1,363 million). This comprised the final dividend for 2018 of EUR 752 million (2017: EUR 752 million) and the interim dividend for 2019 of EUR 564 million (2018: EUR 611 million).
Capital securitiesSecurities classified as Additional Tier 1 (AT1) capital are perpetual, junior, resettable securities that are callable and are considered part of equity. The payment of interest on the AT1 Capital Securities in 2019 amounted to EUR 105 million gross before tax (2018: EUR 103 million).
24 Maturity of selected assets and liabilities
31 December 2019
(in millions)On
demandUp to one
month
Between one and
three months
Between three
and six months
Between six and twelve
months
Between one and
two years
Between two and
five years
More than five
yearsNo
maturity Total
AssetsLoans and advances
banks 5,566 5,032 152,939 2,655 1,716 572 367 930 169,777
Loans and advances customers 13,372 18,674 6,608 2,925 10,591 16,299 40,431 19,753 128,655
Debt securities 29 190 139 406 415 2,687 2,858 6,723
Equity securities 57 57
Derivatives 13 58 132 207 430 756 975 3,153 5,724
LiabilitiesDue to banks 11,891 653 7,335 691 8,543 8,287 8,200 3,145 48,745
Due to customers 197,565 9,022 7,884 1,637 1,850 919 1,509 3,776 224,161
Issued debt 3,657 5,127 7,694 2,336 10,315 15,921 25,707 70,757
Subordinated liabilities 3 1,522 103 1,647 4,186 2,580 10,041
Derivatives 24 201 126 125 390 573 944 4,112 6,495
31 December 2018
(in millions)On de-
mandUp to one
month
Between one and
three months
Between three and
six months
Between six and twelve
months
Between one and
two years
Between two and
five yearsMore than five years
No matu-rity Total
AssetsLoans and advances
banks 8,541 5,465 150,808 1,045 682 830 1,079 922 169,373
Loans and advances customers 8,363 6,624 6,493 3,275 6,435 23,187 32,646 46,634 133,656
Debt securities 378 26 221 626 659 1,572 2,119 5,601
Equity securities 227 227
Derivatives 323 207 235 250 792 1,390 2,970 6,167
LiabilitiesDue to banks 10,615 1,515 10,520 479 4,976 8,332 16,437 2,898 55,773
Due to customers 200,139 1,370 8,749 2,024 1,333 519 2,058 3,117 219,310
Issued debt 6,634 9,613 2,731 3,873 8,495 21,350 23,645 76,341
Subordinated liabilities 7 1,644 5,773 2,380 9,805
Derivatives 264 77 458 231 292 664 1,535 3,600 7,122
IntroductionStrategy and perform
anceRisk, funding &
capitalLeadership &
governanceOther
Annual Financial Statements 2019
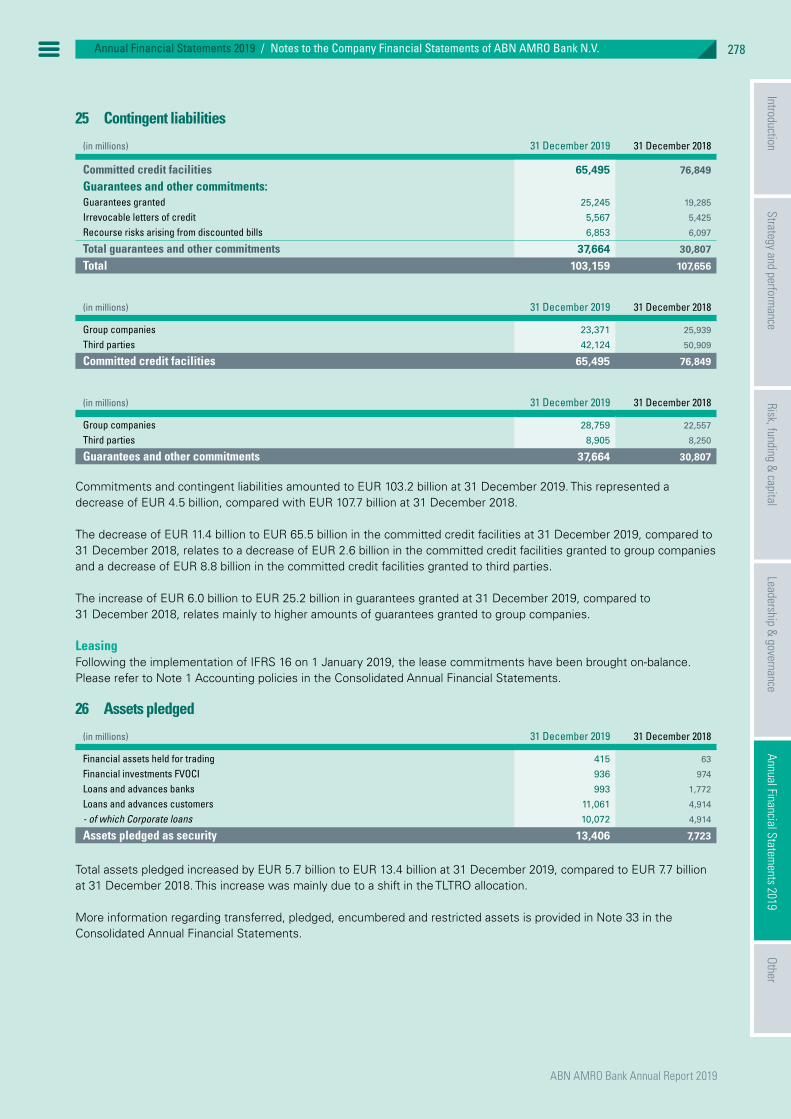
ABN AMRO Bank Annual Report 2019
IntroductionStrategy and perform
anceRisk, funding &
capitalLeadership structure
GovernanceAnnual Financial Statem
entsOther
IntroductionStrategy and perform
anceRisk, funding &
capitalLeadership &
governanceOther
278
Annual Financial Statements 2019
Annual Financial Statements 2019 / Notes to the Company Financial Statements of ABN AMRO Bank N.V.
25 Contingent liabilities
(in millions) 31 December 2019 31 December 2018
Committed credit facilities 65,495 76,849
Guarantees and other commitments:Guarantees granted 25,245 19,285
Irrevocable letters of credit 5,567 5,425
Recourse risks arising from discounted bills 6,853 6,097
Total guarantees and other commitments 37,664 30,807
Total 103,159 107,656
(in millions) 31 December 2019 31 December 2018
Group companies 23,371 25,939
Third parties 42,124 50,909
Committed credit facilities 65,495 76,849
(in millions) 31 December 2019 31 December 2018
Group companies 28,759 22,557
Third parties 8,905 8,250
Guarantees and other commitments 37,664 30,807
Commitments and contingent liabilities amounted to EUR 103.2 billion at 31 December 2019. This represented a decrease of EUR 4.5 billion, compared with EUR 107.7 billion at 31 December 2018.
The decrease of EUR 11.4 billion to EUR 65.5 billion in the committed credit facilities at 31 December 2019, compared to 31 December 2018, relates to a decrease of EUR 2.6 billion in the committed credit facilities granted to group companies and a decrease of EUR 8.8 billion in the committed credit facilities granted to third parties.
The increase of EUR 6.0 billion to EUR 25.2 billion in guarantees granted at 31 December 2019, compared to 31 December 2018, relates mainly to higher amounts of guarantees granted to group companies.
Leasing Following the implementation of IFRS 16 on 1 January 2019, the lease commitments have been brought on-balance. Please refer to Note 1 Accounting policies in the Consolidated Annual Financial Statements.
26 Assets pledged
(in millions) 31 December 2019 31 December 2018
Financial assets held for trading 415 63
Financial investments FVOCI 936 974
Loans and advances banks 993 1,772
Loans and advances customers 11,061 4,914
- of which Corporate loans 10,072 4,914
Assets pledged as security 13,406 7,723
Total assets pledged increased by EUR 5.7 billion to EUR 13.4 billion at 31 December 2019, compared to EUR 7.7 billion at 31 December 2018. This increase was mainly due to a shift in the TLTRO allocation.
More information regarding transferred, pledged, encumbered and restricted assets is provided in Note 33 in the Consolidated Annual Financial Statements.

ABN AMRO Bank Annual Report 2019
279Annual Financial Statements 2019 / Notes to the Company Financial Statements of ABN AMRO Bank N.V.
27 Segment informationThe total number of FTEs at 31 December 2019 was 14,430 (2018: 14,034). The total number of FTEs in Retail Banking was 3,087 (2018: 3,178), in Commercial Banking 1,855 (2018: 2,142), in Private Banking 1,696 (2018: 1,473), in Corporate & Institutional Banking 1,945 (2018: 1,987) and in Group Functions 5,846 (2018: 5,253).
The total number of FTEs increased by 396, mainly due to the additional staff recruited for detecting financial crime activities and those resulting from the acquisition of Societe Generale Private Banking N.V. in Belgium.
More financial information on the segments is provided in Note 2 Segment reporting in the Consolidated Annual Financial Statements.
The average number of FTEs per country is disclosed in the Consolidated Annual Financial Statements in Note 10 Income tax expense, tax assets and tax liabilities.
28 RemunerationFor more information, see Note 35 in the Consolidated Annual Financial Statements.
29 Related partiesAs part of its business operations, ABN AMRO frequently enters into transactions with related parties. Transactions conducted with the Dutch State are limited to normal banking transactions, taxation and other administrative relationships, with the exception of items specifically disclosed in the Consolidated Annual Financial Statements. Normal banking transactions relate to loans and deposits and are entered into under the same commercial and market terms that apply to non-related parties. Total assets with related parties amounted to EUR 6.5 billion at 31 December 2019 compared with EUR 6.3 billion at 31 December 2018. Total liabilities amounted to EUR 2.7 billion at 31 December 2019 compared with EUR 2.7 billion at 31 December 2018. For further information, see Note 35 and Note 37 in the Consolidated Annual Financial Statements.
30 Post balance sheet eventsOn 13 February 2020 ABN AMRO reached an agreement with the foundation Stichting Euribar on a settlement for clients with Euribor-based mortgages. Please refer to Note 29 Provisions in the Consolidated Annual Financial Statements for more information.
The current Covid-19 outbreak most likely impacts the global economy and ABN AMRO’s financial position and results. More specifically the impact is expected on instruments measured at fair value and on the expected credit losses.
Currently ABN AMRO is closely monitoring any financial impact attributable to the Covid-19 outbreak on industry sectors, such as industrials, transportation & logistics and leisure. Given the uncertainties and ongoing developments the Bank cannot accurately and reliably estimate the quantitative impact.
Authorisation of the Company Annual Financial Statements10 March 2020
Supervisory BoardT. (Tom) de Swaan, Chairman A.C. (Arjen) Dorland, Vice-Chairman L.J. (Laetitia) Griffith M.P. (Michiel) Lap J.B.J. (Jurgen) Stegmann A.M. (Anna) Storåkers J.S.T. (Tjalling) Tiemstra
Executive BoardC. (Kees) van Dijkhuizen, CEO and Chairman C. (Clifford) Abrahams, CFO and Vice-Chairman T.J.A.M. (Tanja) Cuppen, CRO C.M. (Christian) Bornfeld, CI&TO
IntroductionStrategy and perform
anceRisk, funding &
capitalLeadership &
governanceOther
Annual Financial Statements 2019

ABN AMRO Bank Annual Report 2019
IntroductionStrategy and perform
anceRisk, funding &
capitalLeadership structure
GovernanceAnnual Financial Statem
entsOther
IntroductionStrategy and perform
anceRisk, funding &
capitalLeadership &
governanceOther
280
Annual Financial Statements 2019
Annual Financial Statements 2019 / Notes to the Company Financial Statements of ABN AMRO Bank N.V.

Other
282 Independent auditor’s report
290 Other information
292 Cautionary statements
293 Enquiries
Other includes the Independent auditor’s statement, a list of major subsidiaries and participating interests, Cautionary statements and Enquiries.
The definitions and abbreviations used in this report can be found on the ABN AMRO website via abnamro.com/annualreport.
IntroductionStrategy and perform
anceRisk, funding &
capitalLeadership &
governanceAnnual Financial Statem
entsOther
Other
ABN AMRO Bank Annual Report 2019
IntroductionStrategy and perform
anceRisk, funding &
capitalLeadership structure
GovernanceAnnual Financial Statem
entsOther
IntroductionStrategy and perform
anceRisk, funding &
capitalLeadership &
governanceAnnual Financial Statem
ents
282
Other
Other / Independent auditor’s report
Independent auditor’s reportTo: the shareholders and Supervisory Board of ABN AMRO Bank N.V.
Report on the audit of the financial statements 2019 included in the annual reportOur opinionWe have audited the financial statements 2019 of ABN AMRO Bank N.V. (hereinafter: ABN AMRO or the bank), based in Amsterdam. The financial statements include the consolidated financial statements and the company financial statements.
In our opinion: Å The accompanying consolidated financial statements give a true and fair view of the financial position of ABN AMRO as at 31 December 2019 and of its result and its cash flows for 2019 in accordance with International Financial Reporting Standards as adopted by the European Union (EU-IFRS) and with Part 9 of Book 2 of the Dutch Civil Code.
Å The accompanying company financial statements give a true and fair view of the financial position of ABN AMRO as at 31 December 2019 and of its result for 2019 in accordance with Part 9 of Book 2 of the Dutch Civil Code.
The consolidated financial statements comprise: Å The consolidated statement of financial position as at 31 December 2019
Å The following statements for 2019: the consolidated income statement, the consolidated statements of comprehensive income, changes in equity and cash flows
Å The notes comprising a summary of the significant accounting policies and other explanatory information
The company financial statements comprise: Å The company statement of financial position as at 31 December 2019
Å The company income statement for 2019 Å The notes comprising a summary of the accounting policies and other explanatory information
Basis for our opinionWe conducted our audit in accordance with Dutch law, including the Dutch Standards on Auditing. Our responsibilities under those standards are further described in the Our responsibilities for the audit of the financial statements section of our report.
We are independent of ABN AMRO in accordance with the EU Regulation on specific requirements regarding statutory audit of public-interest entities, the “Wet toezicht accountantsorganisaties” (Wta, Audit firms supervision act), the “Verordening inzake de onafhankelijkheid van accountants bij assurance-opdrachten” (ViO, Code of Ethics for Professional Accountants, a regulation with respect to independence) and other relevant independence regulations in the Netherlands. Furthermore we have complied with the “Verordening gedrags- en beroepsregels accountants” (VGBA, Dutch Code of Ethics).
We believe the audit evidence we have obtained is sufficient and appropriate to provide a basis for our opinion.
Our audit approachOur understanding of the business ABN AMRO provides a broad range of financial services to retail, private and corporate banking clients. The group is structured in components and we tailored our group audit approach accordingly. We paid specific attention in our audit to a number of areas driven by the operations of the group and our risk assessment.
We start by determining materiality and identifying and assessing the risks of material misstatement of the financial statements, whether due to fraud, non-compliance with laws and regulations or error in order to design audit procedures responsive to those risks, and to obtain audit evidence that is sufficient and appropriate to provide a basis for our opinion. The risk of not detecting a material misstatement resulting from fraud is higher than for one resulting from error, as fraud may involve collusion, forgery, intentional omissions, misrepresentations, or the override of internal control.
Independent auditor’s report

ABN AMRO Bank Annual Report 2019
283Other / Independent auditor’s report
Materiality
Materiality EUR 140 million (2018: EUR 150 million)
Benchmark applied 5% of adjusted profit before taxation
Explanation Based on our professional judgment, a benchmark of 5% of adjusted profit before taxation is an appropriate quantitative indicator of materiality as it best reflects the financial performance of ABN AMRO. In our planning phase we have set the initial planning materiality at EUR 140 million. We reassessed the materiality based on the 2019 adjusted profit before taxation and concluded the initial planning materiality to be appropriate for the purpose of the audit of the financial statements 2019.
We have also taken into account misstatements and/or possible misstatements that in our opinion are material for the users of the financial statements for qualitative reasons.
We agreed with the Supervisory Board that misstatements in excess of EUR 7 million, which are identified during the audit, would be reported to them, as well as smaller misstatements that in our view must be reported on qualitative grounds.
Our focus on fraud and non-compliance with laws and regulationsOur responsibilityAlthough we are not responsible for preventing fraud or non-compliance and cannot be expected to detect non-compliance with all laws and regulations, it is our responsibility to obtain reasonable assurance that the financial statements, taken as a whole, are free from material misstatement, whether caused by fraud or error.Non-compliance with laws and regulations may result in fines, litigation or other consequences for the company that may have a material effect on the financial statements.
Our audit response related to fraud risksIn order to identify and assess the risks of material misstatements of the financial statements due to fraud, we obtained an understanding of the entity and its environment, including the entity’s internal control relevant to the audit and in order to design audit procedures that are appropriate in the circumstances. As in all of our audits, we addressed the risk of management override of internal control. We do not audit internal control per se for the purpose of expressing an opinion on the effectiveness of the company’s internal control.
We considered available information and made enquiries of relevant executives, directors (including internal audit, legal, compliance and risk management) and the Supervisory Board. As part of our process of identifying fraud risks, we evaluated fraud risk factors with respect to financial reporting fraud, misappropriation of assets and bribery and corruption in close co-operation with our forensic specialists.
We evaluated the design and the implementation and, where considered appropriate, tested the operating effectiveness of internal controls that mitigate fraud risks. In addition, we performed procedures to evaluate key accounting estimates for management bias in particular relating to important judgment areas and significant accounting estimates as disclosed in Note 1 to the financial statements. We have also used data analysis to identify and address high-risk journal entries.
We incorporated elements of unpredictability in our audit. We considered the outcome of our other audit procedures and evaluated whether any findings were indicative of fraud or non-compliance. If so, we re-evaluate our assessment of fraud risk and its resulting impact on our audit procedures.
Our audit response related to risks of non-compliance with laws and regulationsWe assessed factors related to the risks of non-compliance with laws and regulations that could reasonably be expected to have a material effect on the financial statements from our general industry experience, through discussions with the Executive Board, reading minutes, inspection of internal audit and compliance reports, and performing substantive tests of details of classes of transactions, account balances or disclosures.
We also inspected lawyers’ letters and correspondence with regulatory authorities and remained alert to any indication of (suspected) non-compliance throughout the audit. Finally we obtained written representations that all known instances of non-compliance with laws and regulations have been disclosed to us. We make reference to the key audit matters on provisions for legal claims and compliance matters and on the investigation on compliance with the Dutch Act on the prevention of money laundering and financing of terrorism.
Going concernIn order to identify and assess the risks of going concern and to conclude on the appropriateness of management’s use of the going concern basis of accounting, we consider based on the audit evidence obtained, whether a material uncertainty exists related to events or conditions that
IntroductionStrategy and perform
anceRisk, funding &
capitalLeadership &
governanceAnnual Financial Statem
entsOther

ABN AMRO Bank Annual Report 2019
IntroductionStrategy and perform
anceRisk, funding &
capitalLeadership structure
GovernanceAnnual Financial Statem
entsOther
IntroductionStrategy and perform
anceRisk, funding &
capitalLeadership &
governanceAnnual Financial Statem
ents
284
Other
Other / Independent auditor’s report
may cast significant doubt on the company’s ability to continue as a going concern. If we conclude that a material uncertainty exists, we are required to draw attention in our auditor’s report to the related disclosures in the financial statements or, if such disclosures are inadequate, to modify our opinion. Our conclusions are based on the audit evidence obtained up to the date of our auditor’s report. However, future events or conditions may cause a company to cease to continue as a going concern.
Scope of the group auditABN AMRO is at the head of a group of entities. The financial information of this group is included in the consolidated financial statements of ABN AMRO. Because we are ultimately responsible for the opinion, we are also responsible for directing, supervising and performing the group audit. In this respect we have determined the
nature and extent of the audit procedures to be carried out for group entities. Decisive were the size and/or the risk profile of the group entities or operations. On this basis, we selected group entities for which an audit or review had to be carried out on the complete set of financial information or specific items.
Our group audit mainly focused on significant group entities in the Netherlands, France, Germany and the United States based on size and risk. We have:
Å Performed audit procedures ourselves at the group entities in the Netherlands
Å Used the work of other EY offices when auditing the group entities in France, Germany and the United States
Å Performed review procedures or specific audit procedures at other group entities
In total these procedures represent 100% of profit before taxation and 91% of the group’s total assets.
Profit before taxation(in %)
Total assets(in %)
Full scope Specific scope Review scope Other
8980
6
5
983
We issued group audit instructions to the EY component auditors, assessed the audit deliverables and discussed the audit results obtained with the component auditors. Furthermore, we have visited the component auditor of the locations France, Germany and the United States to perform a review of their procedures and results.
By performing the procedures mentioned above at group entities, together with additional procedures at group level, we have been able to obtain sufficient and appropriate audit evidence about the group’s financial information to provide an opinion about the consolidated financial statements.
Teaming and use of specialistsWe ensured that the audit teams both at group and at component levels included the appropriate skills and competences which are needed for the audit of a listed client in the banking industry. We included specialists in
the areas of IT audit, forensics, and income tax and have made use of our own experts in the areas of valuations of derivatives, financial investments and actuaries.
General audit proceduresOur audit further included among others:
Å Performing audit procedures responsive to the risks identified, and obtaining audit evidence that is sufficient and appropriate to provide a basis for our opinion
Å Evaluating the appropriateness of accounting policies used and the reasonableness of accounting estimates and related disclosures made by management
Å Evaluating the overall presentation, structure and content of the financial statements, including the disclosures
Å Evaluating whether the financial statements represent the underlying transactions and events in a manner that achieves fair presentation

ABN AMRO Bank Annual Report 2019
285Other / Independent auditor’s report
Our key audit mattersKey audit matters are those matters that, in our professional judgment, were of most significance in our audit of the financial statements. We have communicated the key audit matters to the Supervisory Board. The key audit matters are not a comprehensive reflection of all matters discussed.
Following the attention related to compliance with the Dutch Act on the prevention of money laundering and financing of terrorism, a new key audit matter has been defined.
These matters were addressed in the context of our audit of the financial statements as a whole and in forming our opinion thereon, and we do not provide a separate opinion on these matters.
Impairment allowances for loans and advances customers Refer to note 20 (Loans and advances customers) and Credit risk management and Credit risk review in the Executive Board report
Risk At 31 December 2019, the loans and advances customers amounted to EUR 268.1 billion with an associated loan impairment allowance for loans and advances customers amounting to EUR 2.4 billion.
The impairment allowance represents the bank’s best estimate of expected credit losses (ECL) on the loans and advances customers at balance sheet date. The ECL of stage 1 and stage 2 loans is calculated collectively, as is the ECL of stage 3 loan portfolios of a similar nature and below a certain threshold. The ECL on the remaining stage 3 loan exposures is calculated individually.
The determination of the impairment allowance requires considerable management judgment. The most significant judgments in estimating the impairment allowance include the assessment of significant increase in credit risk and the identification of defaulted exposures. Furthermore, the ECL is calculated with complex models based on historical data, assumptions and forward-looking information, including multiple macro-economic scenarios; these models are updated and enhanced periodically.
For individually assessed impairments, multiple scenarios for future cashflow projections and collateral valuation are considered.
As the loans and advances customers and the associated loan impairment allowance are material to the bank’s balance sheet and income statement and due to the high estimation uncertainty on the loan impairment allowance, we consider this a key audit matter.
Our audit approach
We evaluated the accounting policies for compliance with IFRS 9 and challenged the criteria for assessing significant increase in credit risk and default.
We obtained an understanding of the processes and tested the design and operating effectiveness of internal controls related to loan origination, credit risk management and impairment allowance determination. This included testing data accuracy and completeness, data transfers, staging, impairment calculation and reporting.
We inspected and discussed internal model validation reports. We analysed the impairment allowance in relation to developments in the loan portfolio and the composition of the portfolio.
We performed testing on data, staging, models and impairment calculations. To verify data quality, we tested the data used in the calculation by reconciling to source systems and underlying documentation.
For collectively assessed loan impairment allowances, we involved EY modelling specialists to assess the appropriateness of the modelling methodology. We challenged the assumptions in the development and validation of ECL model updates. For a sample of ECL models, we reperformed parts of the model validation.
We assessed retrospective review procedures for comparing modelled predictions with actual results. For certain portfolios, we developed our independent estimate to address the estimation uncertainty inherent to expected credit loss estimations.
For macroeconomic variables, we challenged management’s macro-economic forecast and scenarios with the support of internal economic specialists through external benchmarks.
On a risk basis, we selected individual loans across all stages and performed detailed credit file reviews to assess whether the bank correctly applied its credit risk and staging policy.
For individually assessed loan impairment allowances, we challenged the recovery scenarios applied and the weighting of these scenarios. With the support of internal valuation specialists, we assessed the assumptions underlying the loan impairment calculation, such as estimated future cash flows and collateral valuations. Furthermore, we reperformed the impairment calculation based on those inputs.
Finally, we assessed whether the disclosures are accurate and in compliance with EU-IFRS requirements.
Key observations
Based on our procedures performed we consider the impairment allowance for loans and advances customers to be reasonable. The disclosures on loans and advances customers and loan impairment allowance are considered adequate and appropriate and meet the requirements under EU-IFRS. We highlighted the following items to the Audit Committee:
Å Our testing and sensitivity analysis on the staging criteria did not identify material differences and overall we concluded that the stage allocation as per 31 December 2019 was reasonable;
Å For individually assessed impairments we reported in a few instances judgmental differences in respect of the timing of the impairment identified, however none of these were considered material.
IntroductionStrategy and perform
anceRisk, funding &
capitalLeadership &
governanceAnnual Financial Statem
entsOther

ABN AMRO Bank Annual Report 2019
IntroductionStrategy and perform
anceRisk, funding &
capitalLeadership structure
GovernanceAnnual Financial Statem
entsOther
IntroductionStrategy and perform
anceRisk, funding &
capitalLeadership &
governanceAnnual Financial Statem
ents
286
Other
Other / Independent auditor’s report
Provisions for legal claims and compliance matters Refer to note 29 (Provisions)
Risk At 31 December 2019, an amount of EUR 234 million is recorded for legal provisions and EUR 301 million for other provisions which includes EUR 222 million relating to ABN AMRO’s Customer Due Diligence remediation programme in order to be compliant with anti-money laundering legislation.
The legal provisions include provisions related to interest rate derivatives sold to SME clients and adjusting interest margin charges on Euribor-based mortgages.
ABN AMRO has to comply with various laws and regulations, including those in relation to anti-money laundering and financing of terrorism. ABN AMRO has programs in place to remediate shortcomings in complying with these laws and regulations.
For the provision related to Customer Due Diligence, judgment is involved in the appropriateness of the assumptions on the number of files to be remediated, the time needed to remediate each file and the use of external resources in the remediation.
A provision is recognized when ABN AMRO has a legal or constructive obligation as a result of a past event, and it is more likely than not that an outflow of economic benefits will be required to settle the obligation, and a reliable estimate of the amount of the obligation can be made. Management judgment is needed to determine whether an obligation exists and a provision should be recorded at 31 December 2019 in accordance with the accounting standards.
Due to the high level of judgment and the significant amounts involved, we consider this a key audit matter.
Our audit approach
We obtained an understanding of the entity level controls and the legal and regulatory framework of the bank.
We inspected the correspondence with the relevant regulatory authorities to assess developments in regulatory matters.
On a periodic basis, we enquired with the Legal department and Compliance department of the bank to understand and discuss existing and potentially new constructive and legal obligations, and regulatory matters. Furthermore, we inspected ABN AMRO legal and compliance reports.
We obtained legal letters from external counsels to understand regulatory and legal matters ABN AMRO is involved in.
We inspected ABN AMRO investigation reports on non-compliance, including internal audit reports. Furthermore, we inspected the project plan for remediation, inspected and discussed progress reports of the remediation programs. EY compliance and forensic specialists were extensively involved in these procedures.
We obtained an understanding of the provisioning methodology and the process and internal controls over the identification, estimation, monitoring and disclosure of provisions for conduct, legal and compliance matters.
For the significant provisions recognized, in close cooperation with EY compliance and forensic specialists: Å We assessed whether these provisions meet the EU-IFRS recognition criteria. Å We challenged the underlying assumptions and tested the data used. Å We performed test of details on the provisioning level and assessed the assumptions and judgments made by the bank, including
the number of files to be remediated, the time needed to remediate each file and the use of external resources in the remediation. Å We assessed the reasonableness of the judgments applied by management by considering possible outcomes and sensitivity
of the judgments on the provision. Å We assessed historical data to verify the current estimation
We periodically enquired with the Executive Board members to understand the existing and potential obligations. We read the minutes of the Executive Board and Supervisory Board and reported our observations to the Executive and Supervisory Board.
Finally, we assessed the completeness and accuracy of the disclosures related to provisions and whether these disclosures are in compliance with EU-IFRS requirements.
Key observations
Based on our procedures performed we consider the provisions to be reasonable.The disclosure on provisions is considered adequate and appropriate and meets the requirements under EU-IFRS. We highlighted the following to the Audit Committee:
Å The Customer Due Diligence provision remains sensitive to key assumptions of which the most significant is estimated remediation time spent per file. Management’s estimate was within our range of outcomes based on the current information available.
Å We note that the required enhancement programs receive continuous attention from Executive Board, Audit Committee and Supervisory Board.
Å We are satisfied that the legal and other provisions are reasonable.

ABN AMRO Bank Annual Report 2019
287Other / Independent auditor’s report
Investigation on compliance with the Dutch Act on the prevention of money laundering and financing of terrorism Refer to note 34 (Commitments and contingent liabilities)
Risk ABN AMRO is subject of an investigation by the Dutch public prosecutor relating to requirements under the Dutch Act on the prevention of money laundering and financing of terrorism. The scope of the investigation includes whether the bank has complied with the applicable legislation related to client due diligence, timely reporting unusual transactions and timely discontinuing client relationships. As the timing of the completion of the investigation and the outcome are uncertain, a contingent liability has been disclosed.
Contingent liabilities are possible obligations whose existence will be confirmed only by uncertain future events, and present obligations where the transfer of economic resources is uncertain or cannot be reliably measured. Contingent liabilities are not recognized in the balance sheet but are disclosed unless the outflow of economic resources is remote.
Due to the significance of the investigation, we consider this a key audit matter.
Our audit approach
We periodically met with the Executive Board members to understand the potential obligations and the progress of the investigation of the public prosecutor.
We read the minutes of the Executive Board and Supervisory Board and attended the Risk & Capital Committee meetings throughout the year. We held regular bilateral meetings with the chairs of the Supervisory Board, Audit Committee and Risk & Capital Committee.
On a periodic basis, we enquired with the Legal department and Compliance department of the bank to understand and discuss existing and potentially new constructive and legal obligations following the investigation of the public prosecutor. Furthermore, we inspected ABN AMRO legal and compliance reports.
We obtained legal letters from external counsels to understand any potential obligation. Finally, we assessed the completeness and accuracy of the disclosures related to contingent liabilities and whether these disclosures are in compliance with EU-IFRS requirements.
Key observations
Based on our procedures performed, we concur that no provision is recorded as per 31 December 2019 due to the fact that the investigation is currently still ongoing and the outcome is uncertain. The disclosure on contingent liabilities related to the investigation is considered adequate and appropriate and meets the requirements under EU-IFRS.
Identity and access management to IT systems Refer to Operational risk management in the Executive Board report
Risk The bank and its financial reporting process are highly dependent on the reliability and the continuity of information technology due to the significant number of transactions that are processed daily. An adequate IT infrastructure ensures the reliability and continuity of the bank’s business processes and accuracy of financial reporting.
Although the bank implemented several remediation activities to reduce the risk over user access management in the financial reporting process, we identified and reported that controls on user access management for certain applications in the financial reporting process continue to require improvement.
As the reliability and continuity of the IT systems may have an impact on automated data processing and given the pervasive nature of IT general controls on the internal control environment, we consider this a key audit matter.
Our audit approach
We obtained an understanding of the IT organization and developments in the IT infrastructure to analyse the impact on the bank’s processes.
We also assessed the impact of changes during the year on the IT environment, either from ongoing internal restructuring initiatives or to meet external reporting requirements.
We tested the design and operating effectiveness of IT general controls related to user access management and change management across applications, databases and operating systems.
In some areas we performed additional procedures on access management for the related systems. Where applicable, we assessed internal controls related to cloud computing or third party service providers.
We tested application controls over automated data processing, data feeds and interfaces when relevant for financial reporting.
We assessed the reliability and continuity of automated data processing only to the extent necessary within the scope of the audit of the financial statements.
Key observations
For the audit of the financial statements we found the reliability and continuity of the information technology acceptable.
IntroductionStrategy and perform
anceRisk, funding &
capitalLeadership &
governanceAnnual Financial Statem
entsOther

ABN AMRO Bank Annual Report 2019
IntroductionStrategy and perform
anceRisk, funding &
capitalLeadership structure
GovernanceAnnual Financial Statem
entsOther
IntroductionStrategy and perform
anceRisk, funding &
capitalLeadership &
governanceAnnual Financial Statem
ents
288
Other
Other / Independent auditor’s report
Report on other information included in the annual reportIn addition to the financial statements and our auditor’s report thereon, the annual report contains other information that consists of:
Å The Executive Board report Å The remuneration report Å Other information as required by Part 9 of Book 2 of the Dutch Civil Code
Å Report of the Supervisory Board
Based on the following procedures performed, we conclude that the other information:
Å Is consistent with the financial statements and does not contain material misstatements
Å Contains the information as required by Part 9 of Book 2 and Section 2:135b of the Dutch Civil Code
We have read the other information. Based on our knowledge and understanding obtained through our audit of the financial statements or otherwise, we have considered whether the other information contains material misstatements. By performing these procedures, we comply with the requirements of Part 9 of Book 2 and Section 2:135b sub-Section 7 of the Dutch Civil Code and the Dutch Standard 720. The scope of the procedures performed is substantially less than the scope of those performed in our audit of the financial statements.
Management is responsible for the preparation of the other information, including the Executive Board report in accordance with Part 9 of Book 2 of the Dutch Civil Code, other information required by Part 9 of Book 2 of the Dutch Civil Code and the remuneration report in accordance with Section 2:135b of the Dutch Civil Code.
Report on other legal and regulatory requirementsEngagementWe were engaged by the Supervisory Board as auditor of ABN AMRO on 11 September 2015, as of the audit for the year 2016 and have operated as statutory auditor ever since that date.
No prohibited non-audit services We have not provided prohibited non-audit services as referred to in Article 5(1) of the EU Regulation on specific requirements regarding statutory audit of public-interest entities.
Description of responsibilities for the financial statementsResponsibilities of management and the Supervisory Board for the financial statementsManagement is responsible for the preparation and fair presentation of the financial statements in accordance with EU-IFRS and Part 9 of Book 2 of the Dutch Civil Code. Furthermore, management is responsible for such internal control as management determines is necessary to enable the preparation of the financial statements that are free from material misstatement, whether due to fraud or error.
As part of the preparation of the financial statements, management is responsible for assessing the company’s ability to continue as a going concern. Based on the financial reporting frameworks mentioned, management should prepare the financial statements using the going concern basis of accounting unless management either intends to liquidate the company or to cease operations, or has no realistic alternative but to do so. Management should disclose events and circumstances that may cast significant doubt on the company’s ability to continue as a going concern in the financial statements.
The Supervisory Board is responsible for overseeing the company’s financial reporting process.
Our responsibilities for the audit of the financial statementsOur objective is to plan and perform the audit engagement in a manner that allows us to obtain sufficient and appropriate audit evidence for our opinion.
Our audit has been performed with a high, but not absolute, level of assurance, which means we may not detect all material errors and fraud during our audit.
Misstatements can arise from fraud or error and are considered material if, individually or in the aggregate, they could reasonably be expected to influence the economic decisions of users taken on the basis of these financial statements. The materiality affects the nature, timing and extent of our audit procedures and the evaluation of the effect of identified misstatements on our opinion.
We have exercised professional judgment and have maintained professional skepticism throughout the audit, in accordance with Dutch Standards on Auditing, ethical requirements and independence requirements. The Our audit approach section above includes an informative summary of our responsibilities and the work performed as the basis for our opinion.
ABN AMRO Bank Annual Report 2019
289Other / Independent auditor’s report
CommunicationWe communicate with the Supervisory Board regarding, among other matters, the planned scope and timing of the audit and significant audit findings, including any significant findings in internal control that we identify during our audit.In this respect we also submit an additional report to the Audit Committee in accordance with Article 11 of the EU Regulation on specific requirements regarding statutory audit of public-interest entities. The information included in this additional report is consistent with our audit opinion in this auditor’s report.
We provide the Supervisory Board with a statement that we have complied with relevant ethical requirements regarding independence, and to communicate with them all relationships and other matters that may reasonably be thought to bear on our independence, and where applicable, related safeguards.
From the matters communicated with the Supervisory Board, we determine the key audit matters: those matters that were of most significance in the audit of the financial statements. We describe these matters in our auditor’s report unless law or regulation precludes public disclosure about the matter or when, in extremely rare circumstances, not communicating the matter is in the public interest.
Amsterdam, 10 March 2020
Ernst & Young Accountants LLPsigned by W.J. Smit
IntroductionStrategy and perform
anceRisk, funding &
capitalLeadership &
governanceAnnual Financial Statem
entsOther

ABN AMRO Bank Annual Report 2019
IntroductionStrategy and perform
anceRisk, funding &
capitalLeadership structure
GovernanceAnnual Financial Statem
entsOther
IntroductionStrategy and perform
anceRisk, funding &
capitalLeadership &
governanceAnnual Financial Statem
ents
290
Other
Other / Other information
Other informationMajor subsidiaries and participating interests
Retail BankingABN AMRO Assuradeuren B.V. 49% Zwolle, The Netherlands
ABN AMRO Digital Impact Fund B.V. Amsterdam, The Netherlands
ABN AMRO Hypotheken Groep B.V.1 Amersfoort, The Netherlands
ABN AMRO Kredieten B.V.1 Bunnik, The Netherlands
ABN AMRO Levensverzekering N.V. 49% Zwolle, The Netherlands
ABN AMRO Pensioeninstelling N.V. Amsterdam, The Netherlands
ABN AMRO Schadeverzekering N.V. 49% Zwolle, The Netherlands
ABN AMRO Verzekeringen B.V. 49% Zwolle, The Netherlands
ALFAM Holding N.V.1 Bunnik, The Netherlands
Alpha Credit Nederland B.V.1 Bunnik, The Netherlands
Credivance N.V.1 Bunnik, The Netherlands
DEFAM B.V.1 Bunnik, The Netherlands
International Card Services B.V.1 Diemen, The Netherlands
Moneyou B.V.1 Amsterdam, The Netherlands
Moneyou Kredieten B.V.1 Amsterdam, The Netherlands
Nationale-Nederlanden ABN AMRO Verzekeringen Holding B.V. 49% Zwolle, The Netherlands
Stater N.V. 25% Amersfoort, The Netherlands
Commercial BankingABN AMRO Asset Based Finance N.V.1 Utrecht, The Netherlands
ABN AMRO Commercial Finance S.A. Paris, France
ABN AMRO Groenbank B.V.1 Amsterdam, The Netherlands
ABN AMRO Strategic Partnership Fund B.V. Amsterdam, The Netherlands
European Merchant Services B.V. 49% Amsterdam, The Netherlands
New10 B.V. Amsterdam, The Netherlands
Private BankingABN AMRO Investment Solutions S.A. 99.9% Paris, France
ABN AMRO Social Impact Fund B.V. Amsterdam, The Netherlands
Banque Neuflize OBC S.A. 99.9% Paris, France
Bethmann Bank A.G. Frankfurt am Main, Germany
Bethmann Liegenschafts K.G. 50% Frankfurt am Main, Germany
Cofiloisirs S.A. 46% Paris, France
IFCIC S.A. 15.2% Paris, France
Neuflize Vie S.A. 60% Paris, France
Corporate & Institutional BankingABN AMRO Acquisition Finance Holding B.V. Amsterdam, The Netherlands
ABN AMRO Capital USA LLC New York, USA
ABN AMRO Clearing Bank N.V.1 Amsterdam, The Netherlands
ABN AMRO Clearing Chicago LLC Chicago, USA
ABN AMRO Clearing Hong Kong Ltd Hong Kong, China
ABN AMRO Clearing Investments B.V. Amsterdam, The Netherlands
ABN AMRO Clearing London Ltd London, United Kingdom
ABN AMRO Clearing Singapore Pte Ltd Singapore, Singapore
ABN AMRO Clearing Sydney Nominees Pty Ltd Sydney, Australia
ABN AMRO Clearing Sydney Pty Ltd Sydney, Australia
ABN AMRO Clearing Tokyo Co Ltd Tokyo, Japan
ABN AMRO Effecten Compagnie B.V.1 Amsterdam, The Netherlands
ABN AMRO Energy Transition Fund B.V. Rotterdam, The Netherlands
ABN AMRO Holdings USA LLC New York, USA
ABN AMRO Investment Holding B.V.1 Amsterdam, The Netherlands
ABN AMRO Jonge Bedrijven Fonds B.V. Amsterdam, The Netherlands
Other information

ABN AMRO Bank Annual Report 2019
291Other / Other information
ABN AMRO Participaties NPE Fund B.V.1 Amsterdam, The Netherlands
ABN AMRO Securities (USA) LLC New York, USA
Banco ABN AMRO S.A. São Paulo, Brazil
European Central Counterparty N.V. 20% Amsterdam, The Netherlands
Franx B.V. Amsterdam, The Netherlands
Maas Capital Investments B.V. Rotterdam, The Netherlands
Maas Capital Offshore B.V. Amsterdam, The Netherlands
Maas Capital Shipping B.V. Amsterdam, The Netherlands
Principal Finance Investments Holding B.V. Amsterdam, The Netherlands
Group functionsABN AMRO Arbo Services B.V.1 Amsterdam, The Netherlands
ABN AMRO Captive N.V. Amsterdam, The Netherlands
ABN AMRO Funding USA LLC New York, USA
Currence Holding B.V. 35% Amsterdam, The Netherlands
Geldmaat B.V. 33% Amsterdam, The Netherlands
Nederlandse Financieringsmij voor Ontwikkelingslanden N.V. 20% Den Haag, The Netherlands
Branches/Representative OfficesABN AMRO Asset Based Finance N.V., (UK) Branch1 London, United Kingdom
ABN AMRO Asset Based Finance N.V., Branch Deutschland1 Frankfurt am Main, Germany
ABN AMRO Bank N.V. (Belgium) Branch Berchem, Belgium
ABN AMRO Bank N.V. (Hong Kong) Branch Hong Kong, China
ABN AMRO Bank N.V. (Norway) Branch Oslo, Norway
ABN AMRO Bank N.V. (Singapore) Branch Singapore, Singapore
ABN AMRO Bank N.V. (UK) Branch London, United Kingdom
ABN AMRO Bank N.V. (Greece) Branch Athens, Greece
ABN AMRO Bank N.V. (Frankfurt) Branch Frankfurt am Main, Germany
ABN AMRO Bank N.V. (Shanghai) Branch Shanghai, China
ABN AMRO Bank N.V., Sydney Branch Sydney, Australia
ABN AMRO Bank N.V. Representative Office (Dubai Multi Commodities Centre) Dubai, United Arabic Emirates
ABN AMRO Bank N.V. Representative Office New York New York, USA
ABN AMRO Clearing Bank N.V. (Singapore) Branch Singapore, Singapore
ABN AMRO Clearing Bank N.V. (UK) Branch London, United KingdomInternational Card Services B.V. Branch Deutschland1 Düsseldorf, Germany1 A statement of liability within the meaning of Article 403, subsection 1, paragraph f, Book 2 of the Dutch Civil Code has been issued for these companies.
Provisions of the Articles of Association concerning profit appropriationThe provisions regarding the reservation and distribution of profits are set out in article 10 of the Articles of Association. In accordance with the reserve and dividend policy and subject to approval by the Supervisory Board, the Executive Board proposes to the General Meeting of Shareholders which part of the profit is to be reserved. The remainder of the profit will be at the free disposal of the General Meeting of Shareholders, pursuant to a proposal to this end by the Executive Board, subject to approval by the Supervisory Board.
Since 2018, the dividend payout policy has been set at 50% of net sustainable profit attributable to owners of
the parent company, excluding exceptional items that significantly distort profitability and excluding AT1 capital securities. Additional distributions of above 50%, which can either be special dividends or share buy-backs (subject to regulatory approval), will be considered if capital is within or above the target range and will be subject to other circumstances, including regulatory and commercial considerations. The combined distribution will be at least 50% of net sustainable profit.
Fiscal unityABN AMRO Bank N.V. forms a fiscal unity with several Dutch subsidiaries for corporate income tax purposes. All members of the fiscal unity are jointly and severally liable for the corporate income tax liabilities of the fiscal unity.
IntroductionStrategy and perform
anceRisk, funding &
capitalLeadership &
governanceAnnual Financial Statem
entsOther

ABN AMRO Bank Annual Report 2019
IntroductionStrategy and perform
anceRisk, funding &
capitalLeadership structure
GovernanceAnnual Financial Statem
entsOther
IntroductionStrategy and perform
anceRisk, funding &
capitalLeadership &
governanceAnnual Financial Statem
ents
292
Other
Other / Cautionary statements
The Bank has included in this Annual Report and may from time to time make certain statements in its public filings, press releases or other public statements that may constitute ‘forward-looking statements’ within the meaning of the safe-harbour provisions of the United States Private Securities Litigation Reform Act of 1995. This includes, without limitation, such statements that include the words ‘expect’, ‘estimate’, ‘project’, ‘anticipate’, ‘should’, ‘intend’, ‘plan’, ‘aim’, ‘desire’, ‘strive’, ‘probability’, ‘risk’, ‘Value at Risk’ (‘VaR’), ‘target’, ‘goal’, ‘objective’, ‘will’, ‘endeavour’, ‘outlook’, ‘optimistic’, ‘prospects’ and similar expressions or variations on such expressions. In particular, this document includes forward-looking statements relating, but not limited, to ABN AMRO’s potential exposures to various types of operational, credit and market risk, such as counterparty risk, interest rate risk, foreign exchange rate risk and commodity and equity price risk. Such statements are subject to risks and uncertainties. These forward-looking statements are not historical facts and represent only ABN AMRO’s beliefs regarding future events, many of which by their nature are inherently uncertain and beyond the bank’s control.
Other factors that could cause actual results to differ materially from those anticipated by the forward-looking statements contained in this document include, but are not limited to:
Å The extent and nature of future developments and continued volatility in the credit and financial markets and their impact on the financial industry in general and ABN AMRO in particular;
Å The effect on ABN AMRO’s capital of write-downs in respect of credit and other risk exposures;
Å Risks relating to ABN AMRO’s stock-exchange listing; Å Risks related to ABN AMRO’s corporate transactions (e.g. merger, separation and integration process);
Å General economic, social and political conditions in the Netherlands and in other countries in which ABN AMRO has significant business activities, investments or other exposures, including the impact of recessionary economic conditions on ABN AMRO’s performance, liquidity and financial position;
Å Macroeconomic and geopolitical risks; Å Reductions in ABN AMRO’s credit ratings; Å Actions taken by the European Commission, governments and their agencies to support individual banks and the banking system;
Å Monetary and interest rate policies of the ECB and G20 central banks;
Å Inflation or deflation; Å Unanticipated turbulence in interest rates, foreign currency exchange rates, commodity prices and equity prices;
Å Liquidity risks and related market risk losses; Å Potential losses associated with an increase in the level of substandard loans or non-performance by counterparties to other types of financial instruments, including systemic risk;
Å Changes in Dutch and foreign laws, regulations, policies and taxes, or the interpretation and monitoring thereof;
Å Changes in competition and pricing environments; Å Inability to hedge certain risks economically; Å Adequacy of loss reserves and impairment allowances; Å Technological changes; Å Changes in consumer spending, investment and saving habits;
Å Effective capital and liquidity management; Å The success of ABN AMRO in managing the risks involved in the foregoing.
The forward-looking statements made in this Annual Report are only applicable as from the date of publication of this document. ABN AMRO does not intend to publicly update or revise these forward-looking statements to reflect events or circumstances after the date of this report, and ABN AMRO does not assume any responsibility to do so. The reader should, however, take into account any further disclosures of a forward-looking nature that ABN AMRO may make in ABN AMRO’s interim reports.
Cautionary statements
Cautionary statements

IntroductionStrategy and perform
anceRisk, funding &
capitalLeadership &
governanceAnnual Financial Statem
ents
Other / Enquiries
Other
ABN AMRO Investor [email protected] +31 20 6282 282
ABN AMRO Press [email protected] +31 20 6288 900
ABN AMRO Bank N.V.Gustav Mahlerlaan 10 1082 PP Amsterdam The Netherlands
Mailing addressP.O. Box 283 1000 EA Amsterdam The Netherlands
Internetabnamro.com (corporate website in English) abnamro.nl (client website in Dutch) abnamro.nl/en (client website in English) abnamro.com/corporatereporting abnamro.com/annualreport
Information on our websites does not form part of this Annual Report, unless expressly stated otherwise.
AcknowledgementsGeneral coordinationFinance
Concepting and lay-outDartGroup, Amsterdam
Production and lithographyAltavia Sumis, Amstelveen
Enquiries
Enquiries
Other

abnamro.com/annualreport
AB
N 0
128
Ann
ual R
epor
t 20
19