4.1 KEY FEATURES OF SPREADSHEETS
41
Information Communication Technology — Grade 10 Student Textbook 75 APPLICATION SOFTWARE UNIT OUTCOME Students will be able to: know how to create charts and graphs in spreadsheet; apply spreadsheet for different applications; understand some common uses of database; recognize query, form and report in a database application. 4.1 KEY FEATURES OF SPREADSHEETS The spreadsheets are one of the most widely used application software in the world. These are used everywhere from a small store to a large manufacturing house. These can be used for calculating accounts, managing inventory, managing payroll, managing and analysing the sales and marketing. These software are also used to manage household data like recording expenditures. As spreadsheets are much easier to learn than programming languages, these can be operated by any user having a moderate knowledge of programming. In Grade 9, you have studied about spreadsheets. Let us revise some of the basic concepts. l Revision of Spreadsheet The spreadsheet is an application software which provides the users powerful tools and features to analyze, share, and manage the data with ease, for example, Microsoft Excel. Starting Spreadsheets MS-Excel 2007 is a GUI based spreadsheet package that is part of Microsoft Office 2007 suite of software. To start MS-Excel 2007, perform the following: Double-click on the MS-Excel 2007 icon on the desktop. OR Click Start → All P rograms → M icrosoft Office → M icrosoft Office E x cel 2 007 Screen Elements of Spreadsheets On starting spreadsheet i.e., MS-Excel 2007, a spreadsheet window appears. The screen elements of Excel spreadsheet are shown in Fig. 4.1. Unit 4
Transcript of 4.1 KEY FEATURES OF SPREADSHEETS

Unit 4 – Application Software
Information Communication Technology — Grade 10 Student Textbook 75
APPLICATION SOFTWARE
UNIT OUTCOME Students will be able to:
know how to create charts and graphs in spreadsheet;
apply spreadsheet for different applications;
understand some common uses of database;
recognize query, form and report in a database application.
4.1 KEY FEATURES OF SPREADSHEETS
The spreadsheets are one of the most widely used application software in the world. These are used everywhere from a small store to a large manufacturing house. These can be used for calculating accounts, managing inventory, managing payroll, managing and analysing the sales and marketing. These software are also used to manage household data like recording expenditures. As spreadsheets are much easier to learn than programming languages, these can be operated by any user having a moderate knowledge of programming. In Grade 9, you have studied about spreadsheets. Let us revise some of the basic concepts.
l Revision of SpreadsheetThe spreadsheet is an application software which provides the users powerful tools and features to analyze, share, and manage the data with ease, for example, Microsoft Excel.
Starting SpreadsheetsMS-Excel 2007 is a GUI based spreadsheet package that is part of Microsoft Office 2007 suite of software. To start MS-Excel 2007, perform the following: Double-click on the MS-Excel 2007 icon on the desktop.
OR Click Start → Al l P rograms → M icrosoft Office → M icrosoft Office E x cel 2 0 0 7
Screen Elements of SpreadsheetsOn starting spreadsheet i.e., MS-Excel 2007, a spreadsheet window appears. The screen elements of Excel spreadsheet are shown in Fig. 4.1.
Unit 4

Unit 4 – Application Software
76 Information Communication Technology — Grade 10 Student Textbook
Fig. 4.1: Screen elements of Spreadsheet—Excel 2007
For exploring massive amounts of data, Excel 2007 grid is 1,048,576 rows by 16,384 columns. The columns now start from A and end at X FD.
F il l handl e is a small black square displayed at the bottom right corner of the active cell. The fill handle is used to fill adjacent cells with the same data or consecutive data. The entries that are automatically inserted in the adjacent cells are dependent on the contents of the active cell.
Create and Use a Simple Spreadsheet
Creating a Wo rksheetTo create a worksheet, perform the following steps: 1. Click the Office Button. 2. Click the N ew option. 3. Double click the B lank W orkbook or click on the Create button. A new worksheet is created.
U sing a SpreadsheetAfter creating a worksheet, you can enter data (for example, words, a number, or a formula) in the active cell. The spreadsheet can be used as per your need.
Entering and Editing Text
E ntering DataFor entering data, perform the following steps: 1. Select the cell where the data has to be entered. 2. Type the data. To enter data in active cell, type the characters. Either press T ab key to go to the next cell
in the same row or press Enter key to go to the next cell in the same column.

Unit 4 – Application Software
Information Communication Technology — Grade 10 Student Textbook 77
E diting DataFor editing data (in case we have made mistakes or some changes are required), perform the following steps: 1. Double-click the cell, which has to be edited. 2. Use the B ackspace or Delete key to edit the content of the cell. 3. Press the Enter key.
Change Data in a CellAfter entering data into a cell, you can edit the data by pressing F2 while you are in the cell you wish to edit. For example, we wish to change “Shibra” shown in cell A1 (see Fig. 4.2) to “Shibru”.
Fig. 4.2: Changing data in a cell
To change data in a cell, perform the following steps: 1. Move to cell A1. 2. Press F2. 3. Use the Backspace key to delete the “a”. 4. Type “u”. 5. Press Enter key. The cell contents change to “Shibru” (see Fig. 4.3).
Fig. 4.3: Cell after changing data
You can also edit a cell by using the Formula Bar or by Double-Clicking in the cell or by typing in a cell.
Unit 4 – Application Software
78 Information Communication Technology — Grade 10 Student Textbook
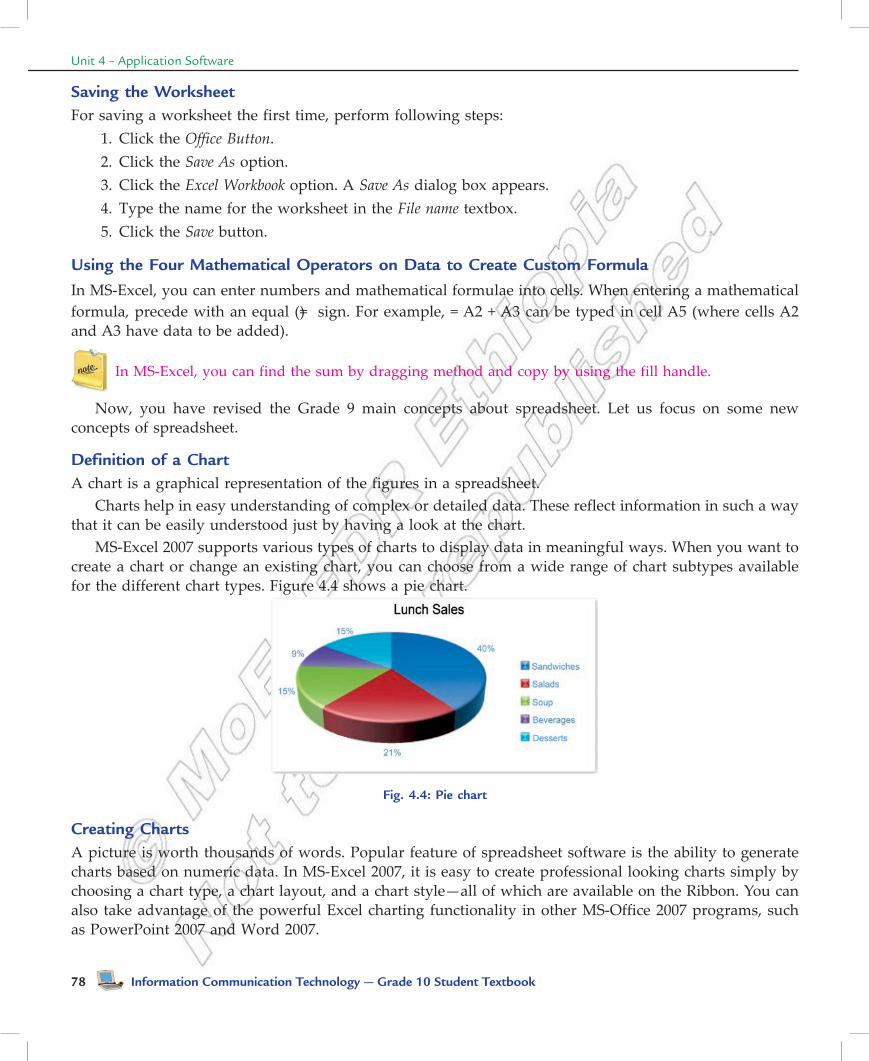
Saving the WorksheetFor saving a worksheet the first time, perform following steps: 1. Click the Office B utton. 2. Click the Save As option. 3. Click the Excel W orkbook option. A Save As dialog box appears. 4. Type the name for the worksheet in the File name textbox. 5. Click the Save button.
Using the Four Mathematical Operators on Data to Create Custom FormulaIn MS-Excel, you can enter numbers and mathematical formulae into cells. When entering a mathematical formula, precede with an equal (=) sign. For example, = A2 + A3 can be typed in cell A5 (where cells A2 and A3 have data to be added).
In MS-Excel, you can find the sum by dragging method and copy by using the fill handle.
Now, you have revised the Grade 9 main concepts about spreadsheet. Let us focus on some new concepts of spreadsheet.
Definition of a ChartA chart is a graphical representation of the figures in a spreadsheet. Charts help in easy understanding of complex or detailed data. These reflect information in such a way that it can be easily understood just by having a look at the chart. MS-Excel 2007 supports various types of charts to display data in meaningful ways. When you want to create a chart or change an existing chart, you can choose from a wide range of chart subtypes available for the different chart types. Figure 4.4 shows a pie chart.
Fig. 4.4: Pie chart
Creating ChartsA picture is worth thousands of words. Popular feature of spreadsheet software is the ability to generate charts based on numeric data. In MS-Excel 2007, it is easy to create professional looking charts simply by choosing a chart type, a chart layout, and a chart style—all of which are available on the Ribbon. You can also take advantage of the powerful Excel charting functionality in other MS-Office 2007 programs, such as PowerPoint 2007 and Word 2007.

Unit 4 – Application Software
Information Communication Technology — Grade 10 Student Textbook 79
Col umn ChartData that is arranged in columns or rows on a worksheet can be plotted in a column chart. Column charts are useful for showing data changes over a period of time or for illustrating comparisons among items. In column charts, categories are typically organized along the horizontal axis and values along the vertical axis. The subtypes of column charts are: Clustered column and clustered column in 3-D, Stacked column and stacked column in 3-D, 100% stacked column and 100% stacked column in 3-D, 3-D column, Cylinder, cone, and pyramid.
B ar ChartData that is arranged in columns or rows on a worksheet can be plotted in a bar chart. Bar charts illustrate comparisons among individual items. The bar charts are generally used when: 1. The axis labels are long. 2. The values that are shown are durations. The subtypes of bar charts are: Clustered bar and clustered bar in 3-D, Stacked bar and stacked bar in 3-D, 100% stacked bar and 100% stacked bar in 3-D, Horizontal cylinder, cone, and pyramid.
P ie ChartData that is arranged in one column or row only on a worksheet can be plotted in a pie chart. Pie charts show the size of items in one data series, proportional to the sum of the items. The data points in a pie chart are displayed as a percentage of the whole pie (see Fig. 4.4). The pie charts are generally used when: 1. You only have one data series that you want to plot. 2. None of the values that you want to plot are negative. 3. Almost none of the values that you want to plot are zero values. 4. You do not have more than seven categories. 5. The categories represent parts of the whole pie. The subtypes of pie charts are: Pie and pie in 3-D, Pie of pie and bar of pie, Exploded pie and exploded pie in 3-D.
l Presenting Data by ChartThe Chart W izard (which was composed of a series of dialog boxes that provided all the available options for creating a chart) of earlier versions is no longer available in Excel 2007. It has been replaced by chart options listed under the Insert ribbon. MS-Excel 2007 has tools for creating effective, dynamic charts to visually represent the data. The new Office 2007 Ribbon makes accessing these charting functions even easier and more efficient. To create a chart, perform the following steps: 1. Open Excel 2007 and either open an existing worksheet or use the default. Enter or create some data
that supports the creation of a chart, for example Students Marks in ICT (see Fig. 4.5). This data should be in the form of a table, with the element values to be charted populating the left hand column and the data series, or information about the elements, in the cells across from each element. More than one series can be included for each element. Title the data series across the top of the table and do not leave any blank spaces in the table.

Unit 4 – Application Software
80 Information Communication Technology — Grade 10 Student Textbook
Fig. 4.5: Data in a worksheet to be charted
2. Select the data to be charted (see Fig. 4.6). Left-click and drag a box around the data to select it. Make sure to include both the data and the labels.
Fig. 4.6: Selecting data to be charted
3. Choose the chart type. Select Insert on the Excel 2007 ribbon and then choose from the chart types listed in the Charts section (see Fig. 4.7). For a chart type that’s not visible, select the Other Charts icon. The chart will be placed on the worksheet near the table of data. By default, the series will be listed across the bottom, or “x-axis” and the elements will be listed to the side. The element values will be listed on the left, or “y-axis” of the chart.
Fig. 4.7: Selecting chart type
4. Position the chart. Left-click on any white space on the chart, and move it to the desired location (see Fig. 4.8).

Unit 4 – Application Software
Information Communication Technology — Grade 10 Student Textbook 81
Fig. 4.8: Column chart ready to be placed in the desired location
5. Now you can format the chart. Right-click on the chart and a variety of options will appear in a dialog. Change the font displayed within the chart, change the chart type and select different chart data by selecting the relevant item from the list. To change the chart’s appearance, select Format Chart Area and then select from the options to change the chart’s Fill, B order Color, B order Styles, Shadow and 3- D Format.
l Using Spreadsheet to Process DataSpreadsheet can be used to process data. In MS-Excel, you can enter numbers and mathematical formulae (formulae are equations that perform calculations on values) into cells. Whether you enter a number or a formula, you can reference the cell when you perform mathematical calculations such as addition, subtraction, multiplication, or division. A formula starts with an equal sign (=) . Before using custom formula, let us identify the difference between absolute and relative cell references.
Difference B etween R el ativ e and Absol ute Cel l R eferencesA reference identifies a cell or a range of cells on a worksheet and tells MS-Excel about where to look for the values or data that you want to use in a formula. With references, you can use data contained in different parts of a worksheet in one formula or use the value from one cell in several formulae. R el ativ e R eference: It is the default addressing used by Excel. A relative cell reference in a formula, such as A1, is based on the relative position of the cell that contains the formula and the cell the reference refers to. If the position of the cell that contains the formula changes, the reference is changed. If you copy or fill the formula across rows or down columns, the reference automatically adjusts. For example, if you copy or fill a relative reference in cell B2 to cell B3, it automatically adjusts from =A 1 to =A 2 (see Fig. 4.9). Absol ute R eference: Use absolute reference when you do not want Excel to change the cell addresses relatively, when you copy a formula. An absolute cell reference in a formula, such as $A $1, always refers
Fig. 4.9: Copied formula with relative reference

Unit 4 – Application Software
82 Information Communication Technology — Grade 10 Student Textbook
Fig. 4.10: Copied formula with absolute reference
to a cell in a specific location. If the position of the cell that contains the formula changes, the absolute reference remains the same. As mentioned earlier, by default, new formulae use relative references, and you may need to switch them to absolute references. For example, if you copy or fill an absolute reference in cell B2 to cell B3, it stays the same in both cells =$A $1 (see Fig. 4.10).
Using Custom FormulaUsing a custom formula is as simple as the other commands of Excel. To write the formula, click on the cell in which you want to have result of the calculation. Type = sign and write the formula using cell addresses and arithmetic and logical operators supported by Excel. A formula in Excel contains cell addresses, operators and built-in functions. Working with formulae is very easy in Excel and it does not require a high programming knowledge. For example, in Fig. 4.11, the total of marks scored by students has been calculated in cell B8 by using the custom formula =B 2+B 3+B 4+ B5+B 6. The cell B8 contains the sum of B2, B3, B4, B5, and B6 cells.
Fig. 4.11: Using custom formula
Using IF conditionIF function of Excel is a conditional construct that displays one or the other value in a cell based on the condition applied. If the condition is true, one value is displayed otherwise the other value is displayed. The syntax of IF function is: IF (Condition, Value if True, Value if False) The three items between the parentheses are the arguments of IF function. Here, Condition is what you want to test for.
V al ue if True is what you want to do if the answer to the first argument is TRUE.
V al ue if F al se is what you want to do if the answer to the first argument is FALSE.

Unit 4 – Application Software
Information Communication Technology — Grade 10 Student Textbook 83
For example, open a new spreadsheet, and perform the following steps: 1. Widen the B column, as we will be putting a message in cell B1. 2. Now click in cell A1 and type the number 7. 3. Type the following in cell B1. = IF (A1>=6 , “G reater than or E q ual to Six” , “L ess than Six” ) Press the Enter key and the spreadsheet should look as shown in Fig. 4.12.
Fig 4.12: Using IF condition
In the above example, make sure that all the commas and double quotes are in the correct place; otherwise Excel will give an error message.
Using Built-in FunctionsNow you are familiar with the formulae in Excel. It is very easy to write these formulae but, in some situations, we have to solve complex problems that are difficult to be solved with these basic formulae. Excel has several built-in functions to make your work easy and fast. There are many functions, grouped under various categories like: math and trigonometry functions, statistical functions, date functions, text functions, etc. Let us learn how to calculate using worksheets:
1. AutoSum : It calculates the sum of the selected contiguous cells directly after the selected cells. For example,
Start Excel and open a worksheet to enter some numbers for addition in a column or a row. Click a cell below the column of numbers or to the right of the row of numbers.
On the Home tab, in the Editing group, click AutoSum button (see Fig. 4.13).
Fig. 4.13: Selecting AutoSum
Unit 4 – Application Software
84 Information Communication Technology — Grade 10 Student Textbook
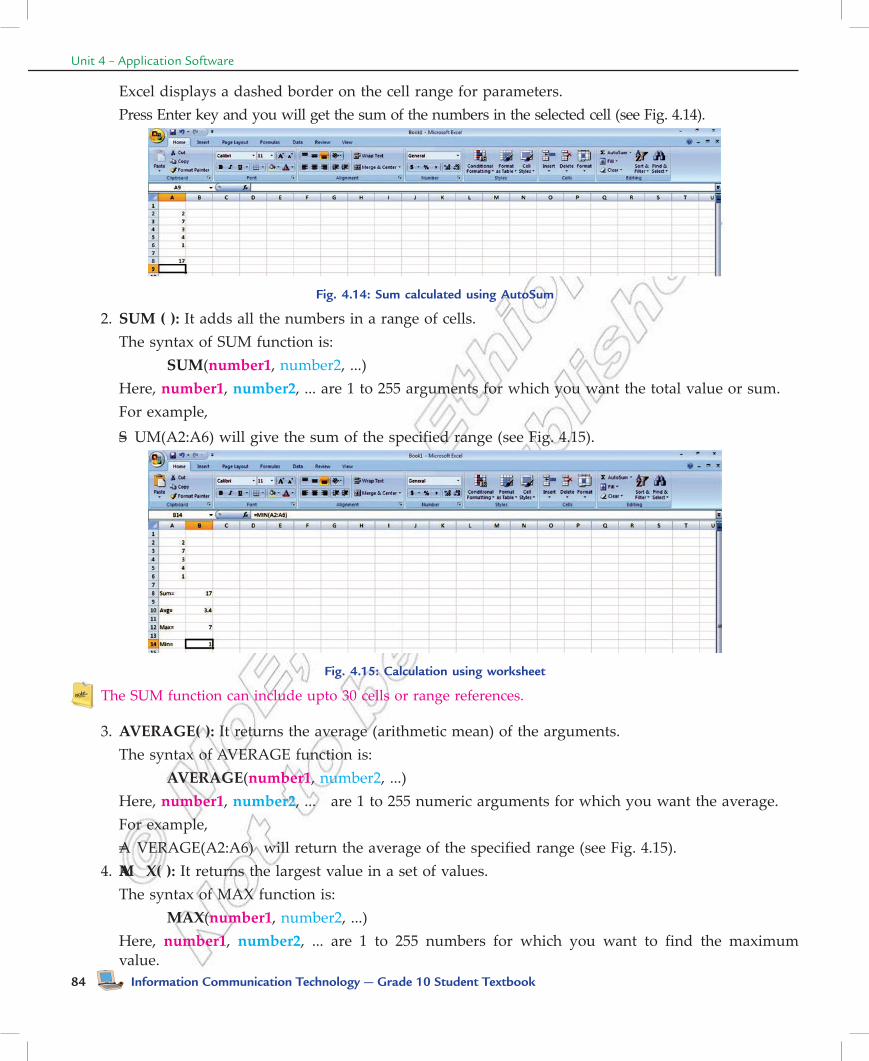
Excel displays a dashed border on the cell range for parameters. Press Enter key and you will get the sum of the numbers in the selected cell (see Fig. 4.14).
Fig. 4.14: Sum calculated using AutoSum
2. SU M ( ): It adds all the numbers in a range of cells. The syntax of SUM function is: SU M (number1 , number2, ...) Here, number1 , number2 , ... are 1 to 255 arguments for which you want the total value or sum. For example, =S UM(A2:A6) will give the sum of the specified range (see Fig. 4.15).
Fig. 4.15: Calculation using worksheet
The SUM function can include upto 30 cells or range references.
3. AV E R AGE ( ): It returns the average (arithmetic mean) of the arguments. The syntax of AVERAGE function is: AV E R AGE (number1 , number2, ...) Here, number1 , number2 , ... are 1 to 255 numeric arguments for which you want the average. For example, =A VERAGE(A2:A6) will return the average of the specified range (see Fig. 4.15). 4. MA X ( ): It returns the largest value in a set of values. The syntax of MAX function is: M AX (number1 , number2, ...) Here, number1 , number2 , ... are 1 to 255 numbers for which you want to find the maximum
value.
Unit 4 – Application Software
Information Communication Technology — Grade 10 Student Textbook 85
For example, =M AX (A2:A6) will return the largest value in the specified range (see Fig. 4.15). 5. MI N( ): It returns the smallest number in a set of values. The syntax of MIN function is: M IN(number1 , number2, ...) Here, number1 , number2 , ... are 1 to 255 numbers for which you want to find the minimum
value. For example, =M IN(A2:A6) will return the smallest value in the specified range (see Fig. 4.15).
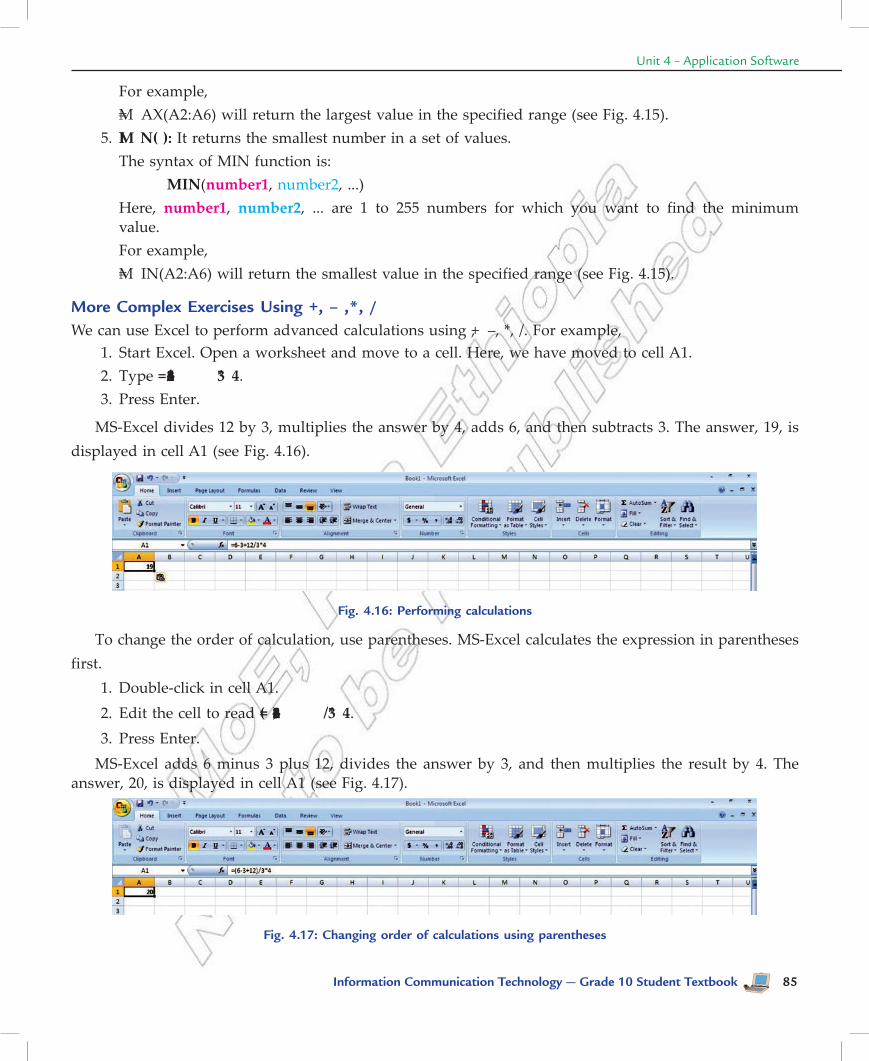
More Complex Exercises Using +, – ,*, /We can use Excel to perform advanced calculations using +, –, * , /. For example, 1. Start Excel. Open a worksheet and move to a cell. Here, we have moved to cell A1. 2. Type = 6–3+12/ 3* 4 . 3. Press Enter.
MS-Excel divides 12 by 3, multiplies the answer by 4, adds 6, and then subtracts 3. The answer, 19, is displayed in cell A1 (see Fig. 4.16).
Fig. 4.16: Performing calculations
To change the order of calculation, use parentheses. MS-Excel calculates the expression in parentheses first. 1. Double-click in cell A1. 2. Edit the cell to read =( 6–3+12) / 3* 4 . 3. Press Enter. MS-Excel adds 6 minus 3 plus 12, divides the answer by 3, and then multiplies the result by 4. The answer, 20, is displayed in cell A1 (see Fig. 4.17).
Fig. 4.17: Changing order of calculations using parentheses

Unit 4 – Application Software
86 Information Communication Technology — Grade 10 Student Textbook
l Formatting Worksheet
Formatting refers to the act of changing the appearance of data in cells. In MS-Excel, you can format text, format cells, adjust columns and rows and print worksheets. Let us apply formatting on a worksheet.
1. Start Excel. Open an existing worksheet (here we have opened Students Marks in ICT) and click cell A1.
2. In the Ribbon, click the B old button and the Italic button .
3. Click the drop-down arrow beside the Font Size box. 4. When the menu appears, click 20 (see Fig. 4.18). 5. In the Font list, click Arial B lack. 6. Highlight the text in range A3:A7.
Fig. 4.18: Formatting a worksheet
7. Click the B old button to make the text bold. The worksheet will look as shown in Fig. 4.19.
Fig. 4.19: Worksheet after formatting
Activity 4.1COMPUTE THE RANK USING THE RANK FUNCTION TAKING A GIVEN NUMERICAL
ITEM AS AN EXAMPLE
In small groups students will explain and demonstrate how to compute rank.

Unit 4 – Application Software
Information Communication Technology — Grade 10 Student Textbook 87
What is Rank?
The rank of a number is its position in a list of numbers.
RANK( ): This statistical function returns the rank of a number in a list of numbers.
The syntax of RANK function is:
RANK(Number, Ref, Order)
The three items between the parentheses are the arguments of RANK function. Here,
Number is the number whose rank you want to find.
Ref is a reference to, or a list of numbers. Nonnumeric values in ref are ignored.
Order is a number specifying how to rank number.
If order is 0 (zero) or omitted, Excel ranks number in descending order. If order is any nonzero value, Excel ranks number in ascending order.
RANK gives duplicate numbers the same rank. However, the presence of duplicate numbers affects the ranks of subsequent numbers. For example, in a list of integers sorted in ascending order, if the number 20 appears twice and has a rank of 5, then 21 would have a rank of 7 (no number would have a rank of 6).
Example of Computing Rank
To compute rank, perform the following steps:
1. Open an existing worksheet (see Fig. 4.19) or create a new one.
2. Click on cell D5—the location where the result will be displayed.
3. Click on the Formulas tab.
4. Select More Functions → Statistical from the ribbon to open the function drop down list (see Fig. 4.20).
Fig. 4.20: Selecting Statistical in More Functions
5. Click the drop-down arrow and select RANK from the list to bring up the function’s dialog box.
6. Click on cell B5 to choose the number to be ranked (95).

Unit 4 – Application Software
88 Information Communication Technology — Grade 10 Student Textbook
7. Click on the Ref line in the dialog box.
8. Drag select cells B3 to B7 in the spreadsheet to enter the range into the dialog box.
9. Click on the Order line in the dialog box.
10. Type 0 (zero) on this line to rank the number in descending order.
11. Click OK.
12. The number 1 should appear in cell D5 since the number 95 is the largest number.
13. The complete function = RANK (B5,B2:B7,0) appears in the formula bar above the worksheet when you
click on cell D5 (see Fig. 4.21).
Fig. 4.21: Computing rank
KEY CONCEPTS
Spreadsheet is an application software, which allows us to perform quick and easy calculations on our stored data.
Fill handle can be used for copying cells, copying formulae using relative references, generating series and generating auto lists.
A chart is a graphical representation of the figures in a spreadsheet.
IF function of Excel, is a conditional construct that displays one or the other value in a cell based on the condition applied.
Excel has several built-in functions to make your work easy and fast. For example, SUM( ), MAX( ), RANK( ), etc.
Assessment 4.1
Fill in the Blanks 1. The ........................... allows users to create tables and financial schedules by entering data and formulae
into rows and columns arranged as a grid on a display screen. 2. There are ........................... rows and ........................... columns in Excel 2007 worksheet. 3. ........................... charts are useful for showing data changes over a period of time or for illustrating
comparisons among items. 4. ........................... refers to the act of changing the appearance of data in cells.
Unit 4 – Application Software
Information Communication Technology — Grade 10 Student Textbook 89
State Whether True or False
1. Fill handle is a special utility in Excel, which is mainly used for copying formulas. 2. A chart is a graphical representation of the figures in a spreadsheet. 3. We cannot use spreadsheet to process data.
4. Rank function returns the average (arithmetic mean) of the arguments.
Answer the Following 1. Define a chart and explain the use of charts. 2. What are the various types of charts supported by Excel? Write steps to insert a chart. 3. Explain any four built-in functions of Excel. 4. What do you mean by formatting a worksheet? Write steps to format text and numbers in the cell of a
worksheet.
Suggested Activities 1. Master introductory parts of spreadsheet by revising the Grade 9 main contents. 2. Explain the use of charts. 3. Demonstrate how to create the listed charts in Excel. 4. In mathematics compare the growth of an arithmetic progression with a geometric progression.
Field Trip Using the Internet or computer magazines, look up information on Microsoft Excel 2010. List any features
you find. List which of these features appeal to you and describe why they do.
4.2 DATABASE APPLICATION
Every organization maintains data for its business, employees and finance. This data need to be maintained in such a manner that it is easily available and can be presented in desired formats. The data also needs to be updated regularly. Traditionally data were maintained in paper files. The following are the disadvantages of manual data maintenance by using paper files: 1. Data redundancy 2. Slow data access 3. Security problems 4. Integrity problems The advent of database management system paved a way to overcome these disadvantages.
lIntroduction to Database
What is Database?
A database is a collection of related data that is organized, so that it can easily be accessed, managed and updated.
Unit 4 – Application Software
90 Information Communication Technology — Grade 10 Student Textbook
For example, a database can contain data about all the students in a school, data about telephone numbers in a directory, data about all products in a manufacturing company, or data about weather conditions in an area or a city (say Addis Ababa). Microsoft Office Access 2007 is one of the database creation and management programs. It is a Database Management System (DBMS) included with Microsoft Office suite. Interacting with a DBMS occurs when one performs daily routine activities, for example, withdrawing cash from the ATM, or purchasing tickets using a credit card.
lUses of DatabaseA database stores information in an organized way, and makes it easy to get information in and out. In today’s world databases are used by websites such as Google.com and Yahoo.com, and in places such as banks, libraries and hospitals. The common areas where data bases are used are: 1. Gov ernment: The government uses a database to store records of people’s data for different purposes,
for example, census, income tax payments, etc. 2. B usiness: Today the business world depends on databases round the clock. Inventory, order
processing, payroll, accounting, shipping and transportation routing are often tracked within a main database that keeps the organization/company functioning.
3. E ducational Institutions: From elementary schools/colleges to universities, educational institutions use the database to keep track of students’ data. Specialized database packages for schools/colleges and universities are also available.
4. Non- P rofit Organizat ions: Most of the charities and other non-profit groups use a database for keeping track of donations, volunteers, hours served in the community, clients helped and other information related to the organization.
5. H ousehol d and F amil y Man agement: The database is very useful in household and family management for many individuals and families. Many individuals/families use a database to keep track of family birthdays, bills and expenses within a home; addresses of friends and relatives; movie/DVD collections; and other lists.
6. E v eryday L ife: Some departmental stores keep your information stored in a customer database. When you make a purchase, the sales clerk asks for your address or customer account number. These collections of data are used to send mailings of special offers, discounts and other deals.
lCommon Database ApplicationsDatabases are used in many applications, covering almost the entire range of computer software. Databases are the preferred method of storage for large multiuser applications, where coordination between many users is needed. Many electronic mail programs and personal organizers are based on standard database technology. Some examples of database applications are: Computerized library systems. Automated Teller Machines (ATMs). Flight reservation systems. Computerized inventory systems.

Unit 4 – Application Software
Information Communication Technology — Grade 10 Student Textbook 91
Any application that involves storing and maintaining a large amount of data in an organized manner can be set up as an Access database. For example, customers and invoices, suppliers and purchases, inventory and orders, etc.
lDatabase TerminologyLet us discuss some of the useful terms related to database: Tabl e: A table in a database is a predefined format of rows and columns that define an entity. It is also called a relation. For example, the STUDENT table shown in Table 4.1.
Table 4.1: STUDENT Table
I D Stud Name F ath er Name Sex Age Ph one Number
1 Abraham Nigatu Male 13 222222
2 Beza Yasin Female 12 111111
3 Hana Fuad Female 13 555555
4 Shibru Engda Male 14 444444
5 Maru Tariku Male 13 333333
R ecord: A database record consists of one set of tuples in a table. In other words, a row of information in a table is called a record. For example, Table 4.1 has five records. F iel d: A field is a single unit of data stored as part of a database record. Each record is made up of one or more fields, which correspond to the columns in a database table. Fields are often called attributes. For example, Table 4.1 has six fields. Data Type: A data type specifies the type of data that a column in a table represents in a database. For example, numeric, character or text, date, logical, etc. For example, in Table 4.1 Stud Name is of text type. P rimary K ey: Every table should contain a field that uniquely identifies each record stored in it. This field is called the primary key of the table. Primary keys may consist of a single field or multiple fields in combination. For example, in Table 4.1, the student’s unique ID number would be a good choice for a primary key. The Stud Name would not be a good choice, as there is always the chance that more than one student might have the same name.
lDesigning a Database StructureBefore you start creating a database, it is essential to create a good database design. Planning the design structure is important, as an improper design will cause changing the design structure. A good database design ensures that the database is easy to maintain and store data. To plan and design a database, the points to be considered are: 1. The purpose of the database. 2. The number of tables and the type of information each table will contain. 3. Columns that will form each table. 4. Relationship between tables.
You can decide your own database structure as per your requirement. For example, one table in a customer database might store names and addresses while another table stores the customer invoices and another table stores the customer payments.

Unit 4 – Application Software
92 Information Communication Technology — Grade 10 Student Textbook
lOpen an Existing DatabaseSuppose you are having MS-Access 2007 installed on your computer. There are different methods you can use to open existing Access 2007 databases. You can open databases from Windows Explorer or from within Access. You can open multiple databases at once, and you can also create desktop shortcuts that open database objects directly. To open an existing database from Access, perform the following steps: 1. Click Start → Al l P rograms → Mi crosoft Office → Mi crosoft Office Access 2007 (see Fig. 4.22).
Fig. 4.22: Starting MS-Access
2. Click the Microsoft Office B utton , and then click Open. 3. Click a shortcut in the Open dialog box, or in the L ook in box, click the drive or folder that contains
the database that you want to open. 4. In the folder list, browse to the folder that contains the database. 5. When you find the database, double-click the database to open it in the default mode specified in
the Access Options dialog box or the mode that was set by an administrative policy.
l O v erv iew of a T ableA database table contains data about a particular subject (see Table 4.1). In a table the data is arranged in rows and columns. To get the most flexibility out of a database; the data needs to be organized into tables so that redundancies do not occur. For example, if you are storing information about students, each student should only need to be entered once in a table that is set-up just to hold student data. Each row in a table is referred to as a record. Records are where the individual pieces of information are stored. Each record consists of one or more fields. Fields correspond to the columns in the table. Fields must have a certain data type, whether it is text, date or time, number, or some other type.
lCreating a TableOne must plan and design a table properly for a new database before creating it. You can use Design view to create an Access table. Using Design view is the preferred method for creating a table because it provides you with the most options and enables you to precisely define your table. In addition to selecting a data

Unit 4 – Application Software
Information Communication Technology — Grade 10 Student Textbook 93
type, you can set the other available options in Design view. Suppose we have to create Table 4.1 in Access. Perform the following steps: 1. Start Ms-Access and activate the Create tab. Click T able Design in the T ables group (see Fig. 4.23).
Fig. 4.23: Clicking Table Design
2. Access changes to Design view and the Table Tools become available. 3. Type the field name in the Field N ame field. 4. Press the T ab key. 5. Click the down-arrow that appears when you click in the Data T ype field and then select a data
type. 6. Click Primary K ey if the column you created is a primary key. A small key appears next to the field
name. 7. Press the T ab key. 8. Type a description. The description is optional. 9. Press the T ab key. Access moves to the Field N ame field. 10. Repeat steps 3 through 9 until you have created all of your fields (see Fig. 4.24).
Fig. 4.24: Creating a Table
11. To set field properties, click the field for which you want to set the field properties. Activate the General tab in the Field Properties area. Set the properties you want to set. Repeat until you have set all the properties for all fields.

Unit 4 – Application Software
94 Information Communication Technology — Grade 10 Student Textbook
12. After finishing the task, click the Save button on the Q uick Access T oolbar. Access saves the table unless you are saving for the first time. If you are saving for the first time, the Save As dialog box appears. Type the name you want to give your table. Here, we have saved the table as STUDENT (see Fig. 4.25).
13. Click OK . Access saves the table. You can use field names that include spaces, but this can affect how queries have to be written, so it is best not to do so.
lAdd, Edit, Delete and Sort RecordsAfter creating an Access table, you can add, edit, delete and sort records in it. Before you can perform an operation on a record, you must select it. To select a record, click the blank area to the left of the row. To select several records, click the blank area to the left of a row and then drag. To select the entire table, click the Select All button in the upper-left corner of the table. In Datasheet view, you can select the field or fields as: To select one field, click it’s header. To select more than one adjacent fields, click the header of one, hold down the Shift key, and then click the header of another. The two fields and any fields in between are selected. In Design view, you can select the field or fields as: To Select one field, click the row selector for the field you want. To select more than one field, hold down Ctrl key and then click the row selector for each field.
Adding RecordsAdding a new record to an existing Access 2007 database is quite simple. In fact, being able to modify the database in this way is one of the reasons why Access is so accessible and easy to use. To add record(s) in a table, perform the following steps: 1. Open the table. Here, we have opened the STUDENT table. Notice that the table contains an empty
record at the bottom of the table’s data with the word (NEW) in the first column. 2. Click on that cell in the table and then press the T AB key on your keyboard. 3. Type the new information you want in that field and then press T AB again. Now type the
information you want in that cell and continue in this way until you wish to add records to the table (see Fig. 4.26).
Fig. 4.26: Adding records
When you add a record in a table, the cursor in the row selector moves down to the next (new) record. When you move on to a new record, Access automatically saves the previous record.
Fig. 4.25: Save As dialog box
Unit 4 – Application Software
Information Communication Technology — Grade 10 Student Textbook 95
Editing RecordsData stored as records in tables can be modified at any point in time. To make changes to a record in a table, perform the following steps: 1. Open the table having the record(s) you want to edit. 2. Place the cursor in the required cell. 3. Remove the existing value. 4. Enter the new data.
The value in the field will be changed. Make other changes (if any) and save the table.
Deleting RecordsYou can delete record(s) from tables if it/they is/are not required. To delete a record from a table, perform the following steps: 1. Open the table and select the record you want to delete. 2. Activate the Home tab. 3. Click Delete in the Records group. A prompt appears. 4. Click the Y es button. The selected record will be deleted. Similarly delete the other records (if you wish) and save the table.
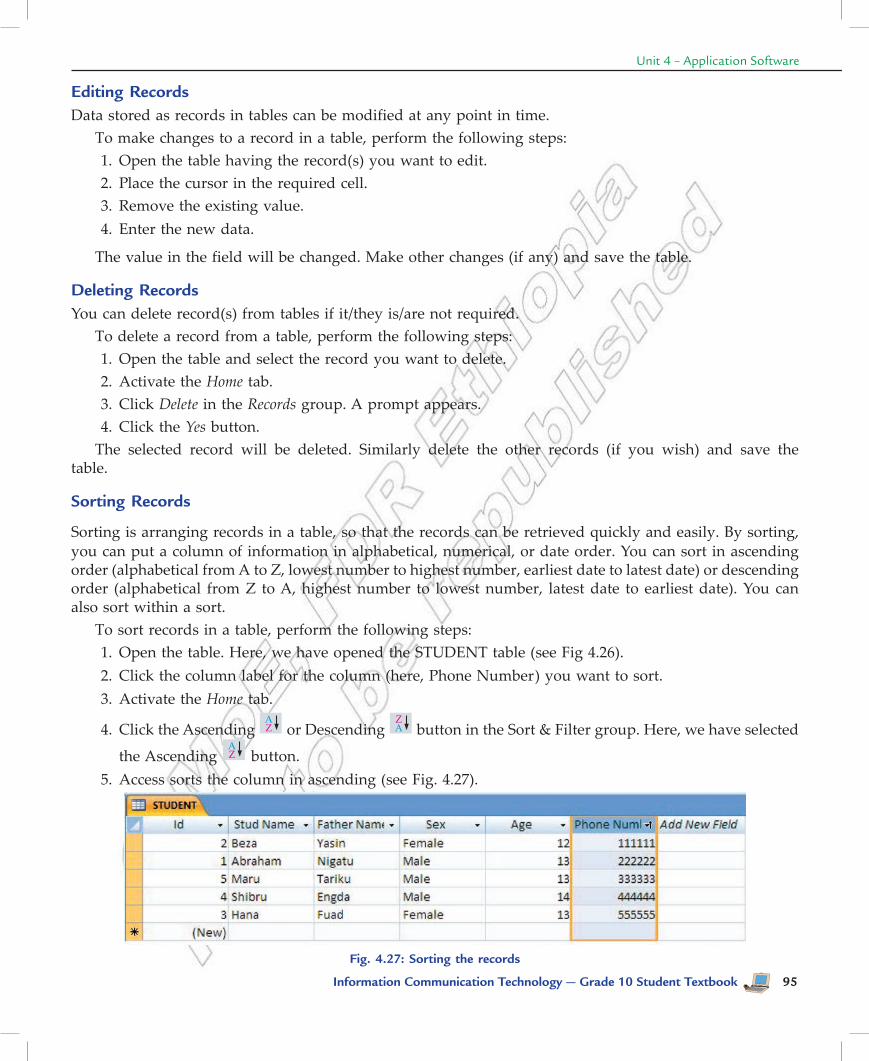
Sorting Records
Sorting is arranging records in a table, so that the records can be retrieved quickly and easily. By sorting, you can put a column of information in alphabetical, numerical, or date order. You can sort in ascending order (alphabetical from A to Z , lowest number to highest number, earliest date to latest date) or descending order (alphabetical from Z to A, highest number to lowest number, latest date to earliest date). You can also sort within a sort. To sort records in a table, perform the following steps: 1. Open the table. Here, we have opened the STUDENT table (see Fig 4.26). 2. Click the column label for the column (here, Phone Number) you want to sort. 3. Activate the Home tab.
4. Click the Ascending or Descending button in the Sort & Filter group. Here, we have selected
the Ascending button. 5. Access sorts the column in ascending (see Fig. 4.27).
Fig. 4.27: Sorting the records

Unit 4 – Application Software
96 Information Communication Technology — Grade 10 Student Textbook
l O v erv iew of Q ueryQ ueries are one of the most important features of database management system. The process of accessing the database and retrieving data selectively is known as querying. Q ueries often serve as the record source for forms and reports. Q uery is a database object, which is used for extracting data from one or more tables based on specific conditions. The set of records returned by a query is known as Dynaset.
Query TypesMS-Access supports many types of queries. The major categories are: 1. Sel ect Q ueries: Retrieve records or summaries (totals) across records. Also includes cross-
tabulations. 2. Mak e Tabl e Q ueries: Similar to Select Q ueries but results are placed in a new table. 3. Append Q ueries: Similar to Select Q ueries but results are added to an existing table. 4. U pdate Q ueries: Modify data in a table. 5. Del ete Q ueries: Records are deleted from a table. Select queries are the most common queries and can be used for viewing as well as a data source for forms, reports, controls, and other queries. The other queries create or change data and are known collectively as Action queries.
lCreating a QueryWhen you want to build a query for your database, there are two ways to create it. 1. Either use the Q uery Wizard, or 2. Use the Design View.
Creating a Query using Query WizardTo create a query using Q uery Wizard, perform the following steps: 1. Start MS-Access 2007. Click the Create tab on the Ribbon. Click Q uery W izard button in the Other
group (see Fig. 4.28).
Fig. 4.28: Clicking Query Wizard
2. When the N ew Q uery window appears, make sure Simple Q uery W izard is selected (see Fig. 4.29).
Fig. 4.29: Selecting Simple Query Wizard

Unit 4 – Application Software
Information Communication Technology — Grade 10 Student Textbook 97
Then click the button to open the Simple Q uery Wizard. 3. Choose table. Here, the STUDENT table is already selected in the T ables/ Q ueries list box (see
Fig. 4.30). Now you have to select the fields that you wish to display in query results datasheet. 4. Now double-click Stud N ame in the Available Fields list. Stud N ame should appear in the Selected Fields
column (see Fig. 4.30).
Fig. 4.30: Selecting fields from Available Fields list
5. Click the button. This should add the Father N ame field to the Selected Fields list (see Fig. 4.31).
Fig. 4.31: Adding more fields to Selected Fields
6. Double-click Phone N umber. This should add the Phone N umber field to the Selected Fields list (see Fig. 4.32).

Unit 4 – Application Software
98 Information Communication Technology — Grade 10 Student Textbook
Fig. 4.32: Adding the last field to Selected Fields
7. Click the button twice. 8. When the final screen appears, type: Select Q uery (see Fig. 4.33).
Fig. 4.33: Giving title for the query
9. Click the button. The query is automatically saved and executed. It should look as shown in Fig. 4.34.
Fig. 4.34: Result of query

Unit 4 – Application Software
Information Communication Technology — Grade 10 Student Textbook 99
The Simple Q uery Wizard does not allow you to include criteria to choose which records you want to include in the query datasheet. If you want to include criteria in your query, open it in the Design View and add the criteria.
Creating a Query in Design ViewTo create a query using Design View, perform the following steps: 1. Start MS-Access 2007. Click the Create tab on the Ribbon. Click Q uery Design button in the Other
group (see Fig. 4.35).
Fig. 4.35: Clicking Query Design
Access displays the Design View and the Show T able dialog box (see Fig. 4.36).
Fig. 4.36: Show Table dialog box
2. In the Show T able dialog box, select the table that contains the fields you want to display in the query datasheet (here, we select STUDENT table), and then click the dialog box’s Add button.
3. Click the Close button in the Show T able dialog box. 4. Double-click a field name in the top pane to display the field name in the bottom pane-the design
grid. Repeat this process to include any additional fields (see Fig. 4.37).
Fig. 4.37: Adding fields to query

Unit 4 – Application Software
100 Information Communication Technology — Grade 10 Student Textbook
5. Click the View button in Views group on Home tab to see the datasheet having the data selected with your query (see Fig. 4.38).
6. Click Save button on the Q uick Access T oolbar or press Ctrl + S. Type a name for the query in the Save As box (see Fig. 4.39).
Fig. 4.38: Datasheet showing the data Fig. 4.39: Saving a query
7. Click OK .Select queries display selected fields from table(s). Action queries make changes to a group of records.
l O v erv iew of a FormA form is a database object that you can use to enter, edit, or display data from a table or a query. Forms are sometimes called “data entry screens”. You can create a database without using forms by simply editing your data in the table datasheets. However, most database users prefer to use forms for viewing, entering, and editing data in the tables. Forms provide an easy-to-use format for working with the data, and you can also add functional elements, such as command buttons, to them. You can program the buttons to determine which data appears on the form, open other forms or reports, or perform a variety of other tasks. For example, you might have a form named “Student Form” in which you work with student data. The Student Form might have a button which opens a help form where you can enter various types of help for that student (say financial help). Forms also allow you to control how other users interact with the data in the database. For example, you can create a form that shows only certain fields and allows only certain operations to be performed. This helps protect data and to ensure that the data is entered properly.
lCreating a FormMS-Access 2007 gives you new tools (available in the Forms group on the Create tab) to help you create forms quickly, and provides new form types and features that improve the usability of your database (see Fig. 4.40).
Fig. 4.40: Forms group for creating forms

Unit 4 – Application Software
Information Communication Technology — Grade 10 Student Textbook 101
Different Methods of Creating a Form
In Access 2007, forms can be created using the following tools:
F orm Tool : It creates a form with a single mouse-click. When you use this tool, all the fields from the underlying data source are placed on the form. You can begin using the new form immediately, or you can modify it in Layout view or Design view to better suit your needs.
Spl it F orm Tool : It shows two views for a form, with the bottom half displaying the form using Form view while the same form displays in the top half using Datasheet view. The two views are synchronized so that scrolling one view causes the other view to scroll to the same location.
Mu l tipl e Items Tool : When you create a form by using the Simple Form tool, the form that Access creates displays a single record at a time. If you want a form that displays multiple records but is more customizable than a datasheet, you can use the Multiple Items tool.
F orm W izar d: It provides more choices for the form’s design than the Form tool. In the Form Wizard, available in More Forms, the user is guided through a series of dialog boxes to generate a form, including selecting the fields to be included and the form layout.
B l ank F orm Tool : You can use it to build a form if the wizard or the form-building tools do not fit your needs. This can be a very quick way to build a form, especially if you plan to put only a few fields on your form.
A view is a way of looking at an Access object. Forms have three views: Form view, Layout view, and Design view. You can enter, edit, and view data in Form view. You can modify a form in Layout view or Design view.
Creating a form using the Form tool
We assume that you have already created a table (or a query based on one or more tables), and that you want to build a form to view or manipulate the data.
To create a new form using the Form tool, perform the following steps:
1. Start Access. In the Navigation Pane (at the left of the database), double-click the table that contains the fields for your form. Here, we select STUDENT table.
2. On the Create tab, in the Forms group, click Form (see Fig. 4.41).
Fig. 4.41: Clicking Form in the Forms group
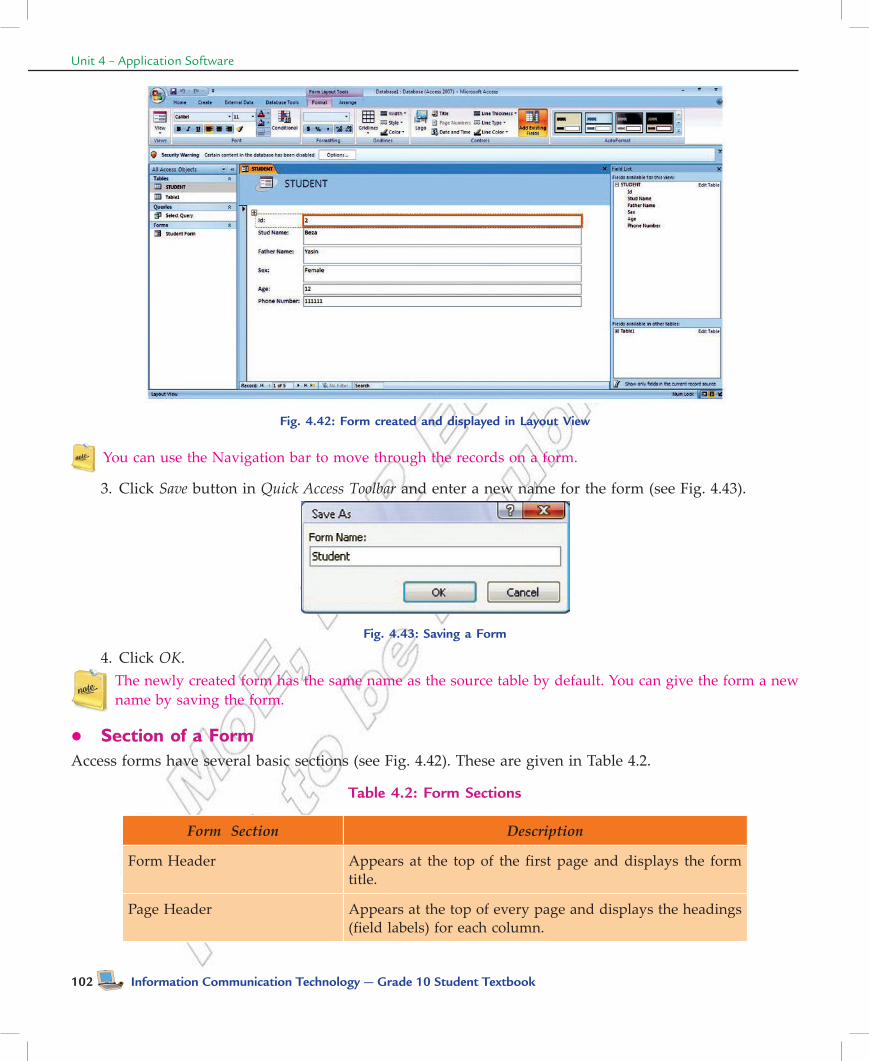
Access creates the form and displays it in L ayout View (see Fig. 4.42).
Unit 4 – Application Software
102 Information Communication Technology — Grade 10 Student Textbook
Fig. 4.42: Form created and displayed in Layout View
You can use the Navigation bar to move through the records on a form.
3. Click Save button in Q uick Access T oolbar and enter a new name for the form (see Fig. 4.43).
Fig. 4.43: Saving a Form
4. Click OK .The newly created form has the same name as the source table by default. You can give the form a new name by saving the form.
l Section of a FormAccess forms have several basic sections (see Fig. 4.42). These are given in Table 4.2.
Table 4.2: Form Sections
F orm Section D escription
Form Header Appears at the top of the first page and displays the form title.
Page Header Appears at the top of every page and displays the headings (field labels) for each column.
Unit 4 – Application Software
Information Communication Technology — Grade 10 Student Textbook 103
Page Footer Appears at the bottom of every page and displays the page number and total number of pages.
Detail Section Appears between the page header and page footer and displays the records from the table or query.
Form Footer This section is optional. Appears on the last page of the form and displays summary information such as grand totals.
You can switch the view on and off for an area. In Access 2007, locate the Arrange tab from the ribbon bar in the Form’s design view and toward the right (end) look for Show/ Hide section. You will see two on/off buttons one for a Form and the other for a Page.
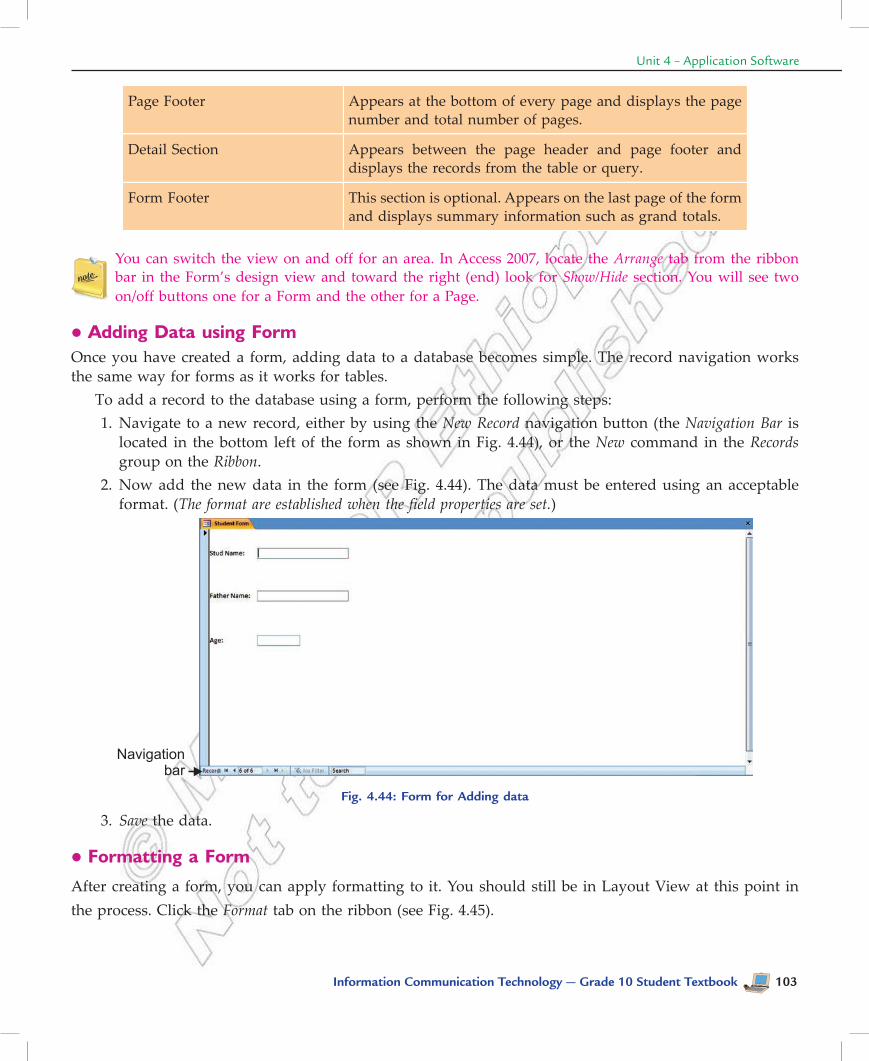
lAdding Data using FormOnce you have created a form, adding data to a database becomes simple. The record navigation works the same way for forms as it works for tables. To add a record to the database using a form, perform the following steps: 1. Navigate to a new record, either by using the N ew Record navigation button (the N avigation B ar is
located in the bottom left of the form as shown in Fig. 4.44), or the N ew command in the Records group on the Ribbon.
2. Now add the new data in the form (see Fig. 4.44). The data must be entered using an acceptable format. (T he format are established when the field properties are set.)
Fig. 4.44: Form for Adding data
3. Save the data.
lFormatting a Form
After creating a form, you can apply formatting to it. You should still be in Layout View at this point in the process. Click the Format tab on the ribbon (see Fig. 4.45).

Unit 4 – Application Software
104 Information Communication Technology — Grade 10 Student Textbook
Fig. 4.45: Tools to format a Form
Now use these icons to change the color and font of text, the style of gridlines around the fields, include a logo and many other formatting tasks. For example, you can adjust the size of the text boxes to fit the data, if necessary. To use the form, switch to Form View. Click the drop-down arrow on the Views section of the Ribbon and select Form View (see Fig. 4.46).
Fig. 4.46: Selecting Form View
Performing Calculations in a FormExpression: Any combination of mathematical or logical operators, constants, functions, and names of fields, controls, and properties that evaluates to a single value. Expressions can perform calculations, manipulate characters, or test data. Precede each expression with the = operator. In Access 2007, you can use calculation controls to display the results of a calculation. A calculation control object containing a formula is created using a text box control object. It is not stored as a field, each time the form is opened the results are calculated dynamically. Display a form in Design view to add text box control objects.
Text boxes are the most popular choice for a calculation control because they can display so many different types of data.

Unit 4 – Application Software
Information Communication Technology — Grade 10 Student Textbook 105
To add Calculation Control Object to form, perform the following steps:
1. Start Access. Open the form, for adding calculation, in Design view by right-clicking the form in the Navigation Pane, and then clicking Design View.
2. On the Design tab, in the Controls group, click T ext B ox (see Fig. 4.47).
Fig. 4.47: Controls group in Design tab
3. Position the pointer where you want the text box to be placed on the form, and then click to insert the text box.
4. Do one of the following: (i) Place the cursor in the text box, and then type an expression that calculates a total. (ii) Select the text box, press F4 to display the property sheet, and type the expression in the Control
Source property box. To use the Expression Builder to create the expression, click next to the Control Source property box.
5. Save the form and then switch to Form view to check the results.
1. Expression Builder is an Access tool that you can use to create an expression. It includes a list of common expressions that you can select.
2. If you need more room to type an expression in the Control Source property box, press SHIFT+F 2 to open the Z oom box.
3. When you sort on a calculation control in a form, ensure that the Format property of the control is set appropriately. Otherwise, calculated numeric or date values might sort alphabetically instead of numerically.
lMain/Subforms
Form is a graphical user interface for the database. Users can enter, edit and even delete data through a form. A subform is a form that is inserted in another form. The primary form is called the main form, and the form within the form is called the subform. A form/subform combination is sometimes called a hierarchical form, a master/detail form, or a parent/child form. Subforms are especially effective when you want to show data from tables or queries that have a one-to-many relationship (an association between two tables in which the primary key value of each record in the primary table corresponds to the value in the matching field or fields of many records in the related table). Subforms can be created along with the form or separately.
Creating Subform
To create a subform from an existing form, perform the following steps: 1. Start Access and right click the form, to which you want to add a subform, in the Navigation
Pane.

Unit 4 – Application Software
106 Information Communication Technology — Grade 10 Student Textbook
2. Select Design View. 3. Select the Design tab.
4. Select Subform/ Subreport in the Controls group. Before selecting any controls, make sure that Use Controls W izard is selected.
5. Click once on your form in the location you want to add the subform (see Fig. 4.48).
Fig. 4.48: Selecting location for Subform
6. Follow the subform wizard to add the subform. 7. If you already have a form created that you want to use as your subform, drag it from the Navigation
Pane to your open form. The main form must be open in Layout View. 8. Click on the Finish button to complete the SubForm wizard. 1. Adding a subform during the form creation process links the two more easily than adding the subform
in a different way. 2. You cannot create a subform in a form if no relationship exists between the two.
l O v erv iew of a ReportReports are what you use to summarize and present the data in the tables. A report usually answers a specific question, such as “What phone numbers are the students having?” Each report can be formatted to present the information in the most readable way possible. A report can be run at any time, and will always reflect the current data in the database. Reports are generally formatted to be printed out, but they can also be viewed on the screen, exported to another program, or sent as e-mail message.
Creating a ReportAccess 2007 has several report generation tools (Report tool, Report W izard, B lank Report tool) that you can use to create both detail and summary reports quickly. The Report button creates a simple report that lists the records in the selected table or query in a columnar format.

Unit 4 – Application Software
Information Communication Technology — Grade 10 Student Textbook 107
To create a report using the Report button, perform the following steps: 1. Start Access and open the Navigation pane. 2. Click the table or query on which you want to base your report. Here, we select STUDENT table. 3. Activate the Create tab. Click the Report button in the Reports group (see Fig. 4.49).
Fig. 4.49: Clicking the Report button in the Reports group
4. Access creates your report and displays your report in Layout view (see Fig. 4.50). You can modify the report if you want.
Fig. 4.50: Creating a Report

Unit 4 – Application Software
108 Information Communication Technology — Grade 10 Student Textbook
5. Click the Save button on the Q uick Access toolbar. Access saves the report unless you are saving for the first time. If you are saving for the first time, the Save As dialog box appears (see Fig. 4.51).
6. Type the name you want to give to your report.
Fig. 4.51: Saving the Report
7. Click OK . Access saves the report. You can now access the report by using the Navigation pane.Reports created by using the Report button are plain and simple. You can customize a report to meet your needs.
lSections of a ReportAccess reports have several sections (see Fig. 4.50). These are given in Table 4.3.
Table 4.3: Report Sections
Report Section D escriptionReport Header Appears at the top of the first page and displays the report title.Page Header Appears at the top of every page and displays the headings (field
labels) for each column.Page Footer Appears at the bottom of every page and displays the page number
and total number of pages.Detail Section Appears between the page header and page footer and displays the
records from the table or query.Report Footer This section is optional. Appears on the last page of the report and
displays summary information such as grand totals.
lAdding Controls to a ReportControls are objects that display data, perform actions, and let you view and work with information that enhances the user interface, such as labels and images. Some controls are created automatically, such as the bound text box control that is created when you add a field from the Field List pane to your report. Many other controls can be created in Design View by using the tools in the Controls group on the Design tab (see Fig. 4.52).
Fig. 4.52: Controls group in Design View
To determine the name of a tool, place the mouse pointer over the tool. Access displays the name of the tool.
Unit 4 – Application Software
Information Communication Technology — Grade 10 Student Textbook 109
To add a control by using the tools in the Controls group, perform the following steps: 1. Click the tool for the type of control that you want to add. For example, to create a check box, click
the Check Box tool. 2. Click in the report design grid where you want to position the upper-left corner of the control. Click
once to create a default-sized control, or click the tool and then drag in the report design grid to create a control of the size that you want.
3. If you do not position the control perfectly on the first try, you can move it by using the following procedure:
(i) Click the control to select it. (ii) Position the mouse pointer over the edge of the control until the pointer turns into a four-headed
arrow . (iii) Drag the control to the location that you want. This procedure creates an “unbound” control. If the control is the type that can display data (a text box or check box, for example), you need to enter a field name or expression in the Control Source property for the control before it will display any data.
To display the property sheet in Design view: On the Design tab, in the Show/ Hide group, click Property
Sheet Or Press F4.
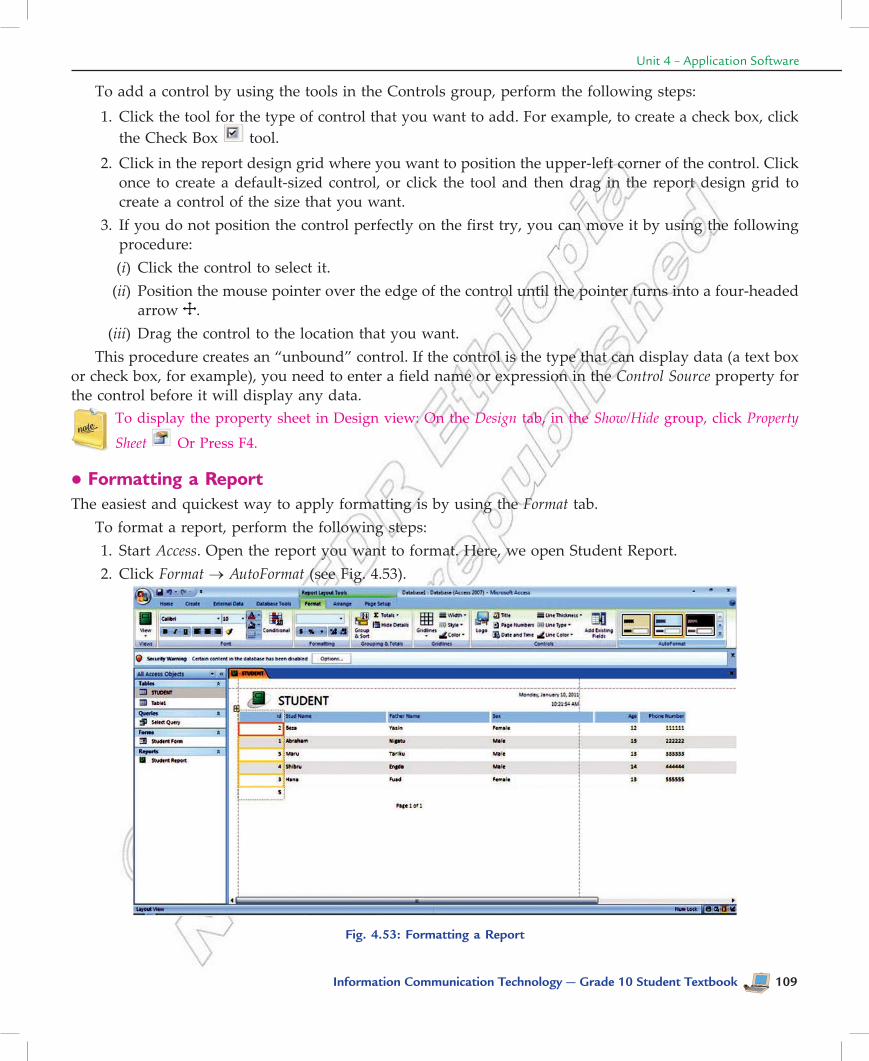
lFormatting a ReportThe easiest and quickest way to apply formatting is by using the Format tab. To format a report, perform the following steps: 1. Start Access. Open the report you want to format. Here, we open Student Report. 2. Click Format → AutoFormat (see Fig. 4.53).
Fig. 4.53: Formatting a Report

Unit 4 – Application Software
110 Information Communication Technology — Grade 10 Student Textbook
Each AutoFormat applies a combination of fonts, colors, and border settings. AutoFormat lets you change the entire look of your report in one step, but these do not provide you the fine-grained control to apply exactly the details you want. Format the report as you want.
3. Save the report.To format a report, open it in Layout View. If you double-click a report in the navigation pane, it opens in Report View. Right-click the tab title, and then choose Layout View to switch over.
Activity 4.2EXPLAIN ABOUT THE DATABASE OBJECT FORM, ITS PRIMARY USE, AND DEMONSTRATE
THE STEPS REQUIRED IN CREATING FORM IN DESIGN VIEW
In small groups students will explain about the database object form, its primary use, and demonstrate the steps required in creating form in design view.
Form and its Primary Use
A form is a database object that you can use to enter, edit, or display data from a table or a query. You can use forms to control access to data. A form makes easy to use the database. You can also add buttons and other functionality to a form to automate frequently performed actions.
Forms are like windows through which people see and reach your database. An effective form speeds the use of your database. A visually attractive form makes working with the database more pleasant and more efficient, and it can also help prevent incorrect data from being entered.
Creating Form in Design View
To create a form in Design View, perform the following steps:
1. Start MS-Access 2007 and open the database to which you would like to add a new form. Select Form Design in Forms group from the Create tab on the Access ribbon (see Fig. 4.54).
Fig. 4.54: Selecting Form Design
This will open a blank form in Design View as shown in Fig. 4.55.
Fig. 4.55: Design Tab in Access

Unit 4 – Application Software
Information Communication Technology — Grade 10 Student Textbook 111
2. Make sure that the Design tab under Form Design Tools is open on the Access ribbon. Click on Property Sheet. This will open the Property Sheet panel as shown in Fig. 4.56.
Fig. 4.56: Property Sheet shown in the Right Panel
3. In the Property Sheet window, click on the tab labeled Data. From the Record Source dropdown list, select the table that contains the fields you want to include in your form. Here, we select STUDENT table (see Fig. 4.57).
Fig. 4.57: Selecting a Record Source
4. Click on the Add Existing Fields button on the Access ribbon. Now, in the right panel, you will see a list of all available fields from the table you have selected in Step 3 (see Fig. 4.58).

Unit 4 – Application Software
112 Information Communication Technology — Grade 10 Student Textbook
Fig. 4.58: Selecting Add Existing Fields
5. Click on a field in the Field List panel that you wish to add to the form. Hold down the mouse key and drag the field to the position on the form where you want it to be located. After placing the field, you can resize both the field label and content boxes by clicking and dragging the boundary boxes around the field name. Repeat this process for each field you want to add to the form (see Fig. 4.59).
Fig. 4.59: Adding fields by clicking and dragging
At any time during this process, if you want to have an idea of how the final form will look, click on the View button on the Access ribbon and select Form View (see Fig. 4.60).

Unit 4 – Application Software
Information Communication Technology — Grade 10 Student Textbook 113
Fig. 4.60: Form View
To return to your form design in order to make some changes, click View again and choose Design View.
6. When finished designing the form, click the Save icon in the Quick Access Toolbar (or click the Office button and select Save). Enter a name for the form in the pop-up box that appears on the screen (see Fig. 4.61).
Fig. 4.61: Saving Form
7. Click OK and the new form will be visible in the Forms list.
KEY CONCEPTS A table contains data about a particular topic. In a table, data is arranged in row and column format.
A database is a collection of related data that is organized, so that it can easily be accessed, managed and updated.
Databases are used in many applications, covering almost the entire range of computer software. For example, computerized library systems, ATMs, flight reservation systems and computerized inventory systems etc.
Query is a database object, which is used for extracting data from one or more tables based on specific conditions.
A form is a database object that you can use to enter, edit, or display data from a table or a query.
MS-Access 2007 has several report generation tools (Report tool, Report Wizard, Blank Report tool) that you can use to create both detail and summary reports quickly.

Unit 4 – Application Software
114 Information Communication Technology — Grade 10 Student Textbook
Review Questions
Fill in the Blanks
1. A ........................... in a database is a predefined format of rows and columns that define an entity.
2. ........................... is a database object, which is used for extracting data from one or more tables based on specific conditions.
3. In Access, a ........................... is a form that is inserted in another form. 4. The ........................... button creates a simple report that lists the records in the selected table or query in
a columnar format.
State Whether True or False 1. A column of information in a table is called a record. 2. A data type specifies the type of data that a column in a table represents in a database. 3. A field that uniquely identifies each record stored in a table is called the foreign key of the table. 4. You cannot use the Navigation bar to move through the records on a form.
Multiple Choice Questions 1. The formula =$A $1 is using which type of reference? (a) Relative (b) Mixed (c) Absolute (d) None of these 2. Which of the following function will return the rank of a number in a list of numbers? (a) SUM( ) (b) RANK( ) (c) AVERAGE( ) (d) MIN( ) 3. Data duplication is also called (a) Data Recovery (b) Data Error (c) Data Reply (d) Data Redundancy 4. MS-Access 2007 database file names end with the file name extension (a) .pptx (b) .accdb (c) .xlsx (d) .docx
Match the Following
Column A Column B1. Extension of MS-Excel 2007 files (a) A simple expression created by using operators and
cell addresses2. Spreadsheet Formula (b) .xlsx 3. Q uery (c) Automated Teller Machines(ATMs)4. Database application (d) Used for extracting data from one or more tables
based on specific conditions

Unit 4 – Application Software
Information Communication Technology — Grade 10 Student Textbook 115
Answer the Following 1. Define a database and explain some common uses of database. 2. Define the following terms in context of a database system: (i) Table (ii) Record (iii) Field (iv) Data type (v) Primary key 3. What is a form? Explain the use of a form. Give the steps to create a form in Access 2007 using Design
View. 4. Explain the following in Access 2007: (i) Creating a query (ii) Manipulating Access Controls (iii) Performing calculation in a form (iv) Creating a subform
Suggested Activities 1. Decide three own database structures. 2. Add, edit, delete, and sort records in a table. 3. Explain about query in general and the different types of query and demonstrate methods of creating a
query. 4. Identify the options for creating a form such as Form tool, Split Form tool, Multiple Items tool, Form
Wizard and Blank Form tool. 5. Explain and demonstrate the sections of a form in a database. 6. Perform calculations in a form and create a subform. 7. Perform report by formatting.
Field Trip Using the Internet or computer magazines, look up information on Microsoft Access 2010. List any features
you find. List which of these features appeal to you and describe why they do.