29: ' # '8& *#2 & 3 - InTechcdn.intechopen.com/pdfs-wm/18277.pdf · Glass Ceramics with Para, Anti...
82
3,350+ OPEN ACCESS BOOKS 108,000+ INTERNATIONAL AUTHORS AND EDITORS 114+ MILLION DOWNLOADS BOOKS DELIVERED TO 151 COUNTRIES AUTHORS AMONG TOP 1% MOST CITED SCIENTIST 12.2% AUTHORS AND EDITORS FROM TOP 500 UNIVERSITIES Selection of our books indexed in the Book Citation Index in Web of Science™ Core Collection (BKCI) Chapter from the book Advances in Ceramics - Electric and Magnetic Ceramics, Bioceramics, Ceramics and Environment Downloaded from: http://www.intechopen.com/books/advances-in-ceramics-electric- and-magnetic-ceramics-bioceramics-ceramics-and-environment PUBLISHED BY World's largest Science, Technology & Medicine Open Access book publisher Interested in publishing with IntechOpen? Contact us at [email protected]
Transcript of 29: ' # '8& *#2 & 3 - InTechcdn.intechopen.com/pdfs-wm/18277.pdf · Glass Ceramics with Para, Anti...

3,350+OPEN ACCESS BOOKS
108,000+INTERNATIONAL
AUTHORS AND EDITORS114+ MILLION
DOWNLOADS
BOOKSDELIVERED TO
151 COUNTRIES
AUTHORS AMONG
TOP 1%MOST CITED SCIENTIST
12.2%AUTHORS AND EDITORS
FROM TOP 500 UNIVERSITIES
Selection of our books indexed in theBook Citation Index in Web of Science™
Core Collection (BKCI)
Chapter from the book Advances in Ceramics - Electric and Magnetic Ceramics ,Bioceramics , Ceramics and EnvironmentDownloaded from: http://www.intechopen.com/books/advances-in-ceramics-electric-and-magnetic-ceramics-bioceramics-ceramics-and-environment
PUBLISHED BY
World's largest Science,Technology & Medicine
Open Access book publisher
Interested in publishing with IntechOpen?Contact us at [email protected]

11
Glass Ceramics with Para, Anti or Ferroelectric Active Phases
Manuel Pedro Fernandes Graça and Manuel Almeida Valente University of Aveiro / I3N - Physics Department
Portugal
1. Introduction
The formation of glass ceramics shows, at technology level the great advantage, when compared to single crystals and sintered ceramics, the possibility of their main properties (optical, electrical, mechanical, chemical) be controlled via the volume fraction of the active phase dispersed in the glass matrix. The optical transparency is one example. To maintain this physic characteristic, the process of nucleation and crystal growth requires a high control being achieved when the size of crystals dispersed in the glass matrix is not high enough to cause light scattering. However, for most electric applications it is necessary that the crystals have a size sufficient to present, for example, a ferroelectric response. This commitment is not easy to perform. Another condition that can maintain the optical transparency of the glass ceramic is the small difference between the refractive indices of crystals and glass matrix. If this difference is negligible it allows, regardless of the size of the crystals, to maintain the optical transparency of the glass ceramic. In recent years there has been a growing interest in the preparation, characterization and technological implementation of glass and glass ceramics in new systems or substituting single crystals. However, it is important to note that, in general, the optical and electric properties of glass ceramics are not as good as their single crystals embedded in the matrix. This is because the glass ceramics present at least two distinct phases, the crystalline (considered the active phase) and the amorphous (support). The electric polarization of the crystals embedded in a glassy matrix is more difficult due to the low dielectric constant of the glass phase. Moreover, because of the growth processes of single crystals present extremely high economic costs, their substitution by glass ceramics is now an actual issue. Some glass ceramics have also the advantage of being a high density material and without porosity. In this chapter it is discussed the preparation method paraelectric (NaNbO3) and ferroelectric (LiNbO3 and KNbO3) crystal phases embedded in a glass matrix, through heat-treatments (HT) of a amorphous glass. The structural characterization was made using the techniques of differential thermal analysis, X-ray diffraction, scanning electronic microscopy and Raman spectroscopy. It was measured the dc and ac conductivity, thermally stimulated depolarization current (TSDC), complex impedance (Z*) and dielectric constant in function of temperature and frequency. The analysis of the network former effect and the conditions of thermal treatments, namely the parameters temperature, time and the simultaneous presence of the external electric field is the main topic of this chapter. From all analysed
www.intechopen.com

Advances in Ceramics – Electric and Magnetic Ceramics, Bioceramics, Ceramics and Environment
214
systems the borate system shows that the crystallites precipitate in volume. For the silicate system with sodium, the NaNbO3 particles crystallize at the sample surface. This behaviour does not occur when borate oxide is used as glass former or when the alkali ion is lithium. When using phosphate pentoxide the number of different crystalline phases that grows during the heat-treatment process is such that this glass former is, at this point of view, not suitable for prepare glass ceramics with one single crystal active phase. The electric and dielectric characteristic of all of the studied samples shows the important role of the thermal treatment conditions in their properties.
2. State of-the-art
Nowadays a lot of technological applications is based on the electrical characteristics of materials. From those characteristics, the ferroelectricity, antiferroelectricity and paraelectricity are the most important properties to be studied and controlled. Very briefly, the ferroelectric materials exhibit spontaneous polarization, i.e. a polarization in the absence of an external electric field. In the ferroelectric materials permanent electric dipoles exist, which origin is explained by the structural arrangement of the atoms in the unit cell. The most common ferroelectric material is barium titanate (BaTiO3), which spontaneous polarization is a consequence of the positioning of Ba2+, Ti4+ and O2- in the unit cell. In these materials, whose crystalline structure is a perovskite (ABO3 - fig. 2.1), where the cation A has an atomic radius too large for a compact packaging, the oxygen atoms move from the expected positions. In the case of BaTiO3, the Ba2+ ions are located in the corners (vertices) of the unit cell, which is of tetragonal symmetry (a cube that was slightly elongated in one direction). The apparent dipole moment results from the relative displacements of the Ti4+ and O2- ions from their symmetrical positions. The O2- ions are located near the centre (but slightly below) of each of the six faces, while the Ti4+ ion is displaced upward from the centre of the unit cell. Thus, a permanent ionic dipole moment is associated with each unit cell.
Fig. 2.1. Scheme of the elementary perovskite structure (ABO3) with ferroelectric characteristic.
www.intechopen.com

Glass Ceramics with Para, Anti or Ferroelectric Active Phases
215
However, when BaTiO3 is heated above its Curie ferroelectric temperature, the unit cell becomes cubic and all ions assume symmetrical positions within the cubic unit cell and the ferroelectric behavior ceases. An antiferroelectric state is defined as one in which lines of ions in the crystal are spontaneously polarized, but with neighbouring lines polarized in antiparallel directions, so that the spontaneous macroscopic polarization is zero. In simple cubic lattices the antiferroelectric state is likely to be more stable than the ferroelectric state. The antiferroelectric state will not be piezoelectric. Paraelectricity is the ability of some materials to become polarized under an applied electric field. Unlike ferroelectricity; this can happen even if there is no permanent electric dipole that exists in the material, and removal of the field results in the polarization in the material returning to zero. The mechanisms which give rise to paraelectric behavior are the distortion of individual ions (displacement of the electron cloud from the nucleus) and the polarization of molecules or combinations of ions or defects. Paraelectricity occurs in crystal phases in which electric dipoles are unaligned (i.e. unordered domains that are electrically charged) and thus have the potential to align in an external electric field and strengthen it. In comparison to the ferroelectric phase, the domains are unordered and the internal field is weak. Sodium niobate (NaNbO3) and Lithium niobate (LiNbO3) are dielectric materials of the perovskite group. The NaNbO3 has been the focus of special attention due to the interesting combination of the electrical and mechanical properties. At room temperature, NaNbO3 is antiferroelectric, with pseudoperovskite orthorhombic crystalline structure with high dielectric constant (2000-3000) at Curie temperature (360°C). Ferroelectricity has been observed below 0°C. One of its potential uses is as piezo transducer operating in the microwave region (high frequency). However, this requires a ferroelectric behavior and therefore the addition of other niobates, such as LiNbO3, KNbO3 and AgNbO3 in small quantities, as been studied because it induces in the NaNbO3 a ferroelectric behavior at ambient conditions. The main structural units of the NaNbO3 crystal are the NbO6 octahedrons, which are relatively rigid units and therefore there is, in the structure of NaNbO3, a joint distortion of all these units. For this reason, the NaNbO3 is characterized at room temperature, as antiferroelectric material, i.e. below its Curie temperature) has no electric dipole moment and no electrical hysteresis is observed. However the presence of an external electric field to induces a ferroelectric response on NaNbO3 featuring piezoelectric characteristics of high interest for applications in high frequency devices. Figure 2 shows the possible directions of twisting/distortion of the oxygen octahedron structure. The direction of distortion is privileged by the symmetry of the crystal structure. Thus, 3-axis of order 4 (A4) in the cubic phase, 6-axis of order 2 (A2) in the orthorhombic phase and 4-axis of order 3 (A3) in the rhombohedral phase. The increase in temperature causes a distortion in the NbO6 octahedron structure, which define the crystal structure of NaNbO3 in different axis of symmetry (Fig. 2.2b) giving rise to six successive phase transitions. These changes are low symmetry structural variations of the perovskite structure. The first studies about the structure and electrical properties of crystal NaNbO3 were conducted by Matthias and Remeika in Bell Laboratories. Nowadays, it is considered, at the structural level, one of the more complicated perovskites by having with increasing temperature, a sequence of phase transitions. These phase transitions are shown in table 2.1.
www.intechopen.com
Advances in Ceramics – Electric and Magnetic Ceramics, Bioceramics, Ceramics and Environment
216
(a)
(b)
Fig. 2.2. a) Scheme of the elementary perovskite structure (ABO3) b) Directions of distortion of the oxygen octahedron structure (A2, A3, A4) .
Temperature (ºC) Simetry Unit cell Electric characteristic
Rhombohedric a = b = c, α = β = γ < 90° ferroelectric
~ 80 ↓
Monoclinic a ≠ b > c, α = β = 90°, γ < 90° Antiferroelectric
370 ↓
Orthorhombic a ≠ b ≠ c, α = β = γ = 90° Antiferroelectric
480 ↓
Orthorhombic a ~ b ~ c, α = β = γ = 90° Antiferroelectric
520 ↓
Orthorhombic a < b < c, α = β = γ = 90° Antiferroelectric
575 ↓
Tetragonal a = b < c, α = β = γ = 90° Antiferroelectric
640 ↓
Cubic a = b = c , α = β = γ = 90° Paraelectric
Table 2.1. NaNbO3 characteristics in function of the temperature
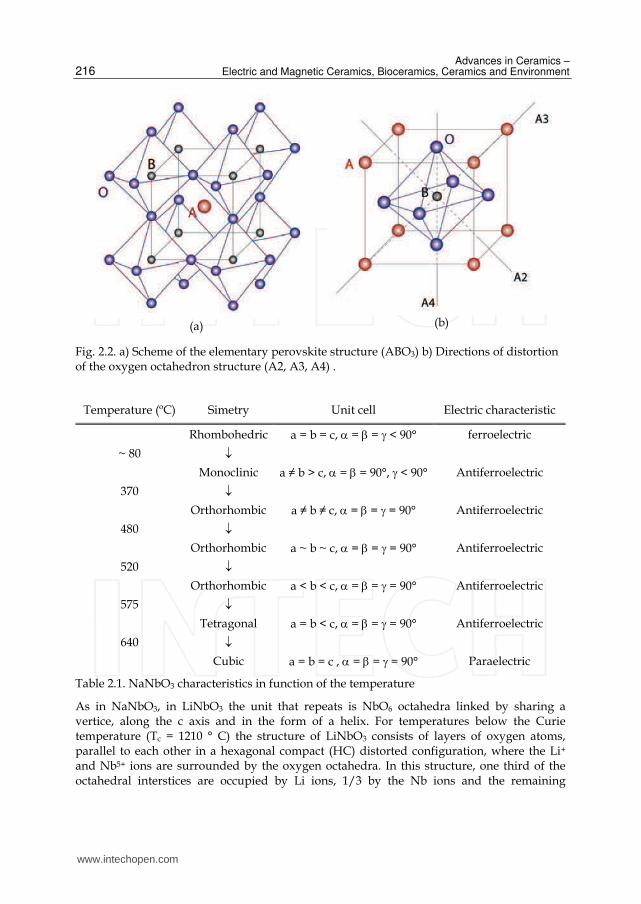
As in NaNbO3, in LiNbO3 the unit that repeats is NbO6 octahedra linked by sharing a vertice, along the c axis and in the form of a helix. For temperatures below the Curie temperature (Tc = 1210 ° C) the structure of LiNbO3 consists of layers of oxygen atoms, parallel to each other in a hexagonal compact (HC) distorted configuration, where the Li+ and Nb5+ ions are surrounded by the oxygen octahedra. In this structure, one third of the octahedral interstices are occupied by Li ions, 1/3 by the Nb ions and the remaining
www.intechopen.com
Glass Ceramics with Para, Anti or Ferroelectric Active Phases
217
interstices (1/3) by structural voids. The morphological appearance of these crystals is pyramidal. This crystal structure is represented in the following figure (Fig. 2.3).
Fig. 2.3. LiNbO3 atomic model ((● – oxigen; ● – niobium; ● – lithium, the horizontal lines represent layers of oxygen atoms).
The stability of the crystalline structure depends on the ionic radii of their constituents. When the cations are too small, such as lithium, when compared with the oxygen ion the maximum packaging gives rise to a distorted crystal structure. Thus, the LiNbO3 structure is similar to that of a perovskite, but distorted due to the low ionic radius of lithium, and therefore the unit cell contains no center of symmetry. The fact that the unit cell does not have a center of symmetry gives rise to a dipole moment which causes a spontaneous polarization that characterizes this class of materials (ferroelectric). The crystal structure of LiNbO3 is no longer distorted when placed at temperatures higher than Tc. In the next table are summarized the most relevant properties of LiNbO3 monocrystal, near-stoichiometric ([Li] / [Nb] = 0.95), obtained by the Czochralski method. The properties that LiNbO3 present, make it suitable for various applications in technological systems, namely at the optical level, presenting itself as an excellent candidate for optoelectronic devices due to its high birefringence (short for modification of refractive index due to variations in the direction of the beam from a strong incident field), high efficiency in nonlinear optics, especially in the second harmonic generation (SHG). It is currently used as a waveguide amplifier, modulator and optical switch systems, in nonvolatile memories, Surface-Acoustic-Wave (SAW) devices and frequency doublers. Both NaNbO3 and LiNbO3 crystals are usually grown by the Czochralski method. However, due to the technical and economical disadvantages that the Czochralski method presents, various processes for the preparation of these crystals, namely the LiNbO3, has been tested. The fact that the preparation of single crystals of NaNbO3, LiNbO3 and other niobates, the usual growth techniques (for example: Czochralski), be a difficult and costly process, scientific interest to study structural, electrical and optical glass and glass ceramics containing niobate crystals. In 1979, Nassau et al. showed the preparation of a LiNbO3 glass, using the twin-roller quenching method. The melting temperature used was 1550 °C and a cooling rate of the molten was estimated at ~ 107 ºC/s. The formation of the glass, with the LiNbO3 molar composition was possible because niobium ion is an intermediate specie. In
www.intechopen.com

Advances in Ceramics – Electric and Magnetic Ceramics, Bioceramics, Ceramics and Environment
218
any glass, the units that describe its structure can be divided into three categories, defined according to its structural function, network former; network modifier and/or intermediate specie. The network formers are units that without the addition of other components can form glass. Examples are SiO2, B2O3, P2O5 and GeO2. The network modifiers, do not form glass by itself, but are often combined with a former in order to facilitate the glass formation. Examples of modifying elements are the alkaline ions (Li, Na, K, etc.) and alkaline earth ions (Mg, Ca, etc.). Intermediate species are elements that can either have the role of network former or network modifier (ex.: Al, Nb, etc.).
Melting temperature (ºC) 1260
Curie temperature (ºC) 1210
Density (at 25ºC) (g/cm3) 4.64
Ordinary refraction index, n0 2,296 (a)
Extraordinary refraction índex, ne 2,208 (a)
Electro-optic coefficient, r33 (m/V) 30x10-12
Transparency window [μm] 0,4 – 5
Resistivity, ρ (along the c axis and at T(K) ) [Ω.cm] log ρ=(7150/Τ)−2,823 ρ (300 K)= 10+21
Dielectric constant (ε´) – along the c axis (at 25 ºC) > 1000 (at 1kHz) ~ 80 (at 100 kHz)
Dielectric losses (tan δ) – along the c axis (at 25 ºC and 100 kHz) ≈0
Coercive field (at 1210ºC) (V/m) 20
Spontaneous polarization (Ps [x10-2Cm-2] at 300 K) 70
Piezoelectric coefficient (d33 [pC/N]) 6
The ordinary refractive index, n0 is defined as n0=c/v⊥ and the extraordinary, ne, as ne=c/v//, where c is the speed of light in vacuum and v⊥ e v// the perpendicular and parallel components of the velocity of the wave that propagates in the material, respectively.
Table 2.2. Main properties of LiNbO3 monocrystal
According to A. Paul a glass is a material that shows the elastic behavior characteristic of the crystalline state and the viscous behavior of a liquid. The most common properties of glass are transparency to visible radiation, mechanical stability, biological inert and electrical insulator. However, due to the possibility of controlling the microstructure, from changing the initial composition or by applying treatments and therefore controlling the process of nucleation and crystallization [james95; rüssel97], the properties of glass can be modified. The initial chemical composition is a factor, controllable, allowing to mould some of the properties of the glass. The formation of glass ceramics, for example by thermal treatment of
www.intechopen.com
Glass Ceramics with Para, Anti or Ferroelectric Active Phases
219
base glass, shows at the technological level the great advantage, relatively to single crystals and sintered ceramics, the possibility of their properties (optical, electrical, mechanical, chemical, etc. ) be controlled via the volume fraction of the active phase dispersed in the network (matrix). For example, to maintain optical transparency, the process of nucleation and crystal growth requires a high control being achieved when the size of crystals dispersed in the glass matrix is not high enough to cause light scattering. However, for most electrical applications it is necessary that the crystals present a size sufficient to show, for example, a ferroelectric response. This commitment is not easy to perform. Another condition that can maintain the optical transparency of the glass ceramic is the difference between the refractive indices of crystals and glass matrix. If this difference is negligible it allows, regardless of the size of the crystals, to maintain the optical transparency of the glass ceramic. In recent years there has been a growing interest in the preparation, characterization and implementation technology of glass and glass ceramics. However, it is important to note that, in general, the optical and electrical properties of glass ceramics are not as good as their single crystals. This is because the glass ceramics present, at least, two distinct phases, the crystalline (considered the active phase) and the amorphous phase. The electric polarization of the crystals embedded in a glassy matrix is not so easier due to the low dielectric constant of the glass phase. In glasses, the crystal growth and crystal orientation can be generally achieved through different processes, such as: mechanical deformation; thermodynamic control, kinetic control (electrochemical induced nucleation). The use of thermodynamic control is the most common. However, control of crystallization, with the desirable crystalline phase is usually difficult because crystallization is a complex process affected by various factors such as composition, surface condition, heat treatment parameters, etc.
2.1 Glasses with NaNbO3 and LiNbO3 crystallites A significant amount of research in the field of preparation and crystallization of glass and glass ceramics containing LiNbO3 prepared by melt quenching currently exist. In 1980, Prasad and colleagues published a study about the preparation of glass ceramics of the system SiO2-Li2O-Nb2O5. The choice of SiO2 as a network former was because it is desirable that the glass former does not contain cations that can change the crystal structure of LiNbO3. The SiO2 satisfy this condition due to the reduced value of atomic radius and coordination number. They showed that transparent glasses without crystalline phases are achieved for a molar amount of SiO2 between 32 and 39% and using a equal molar amount of Li2O and Nb2O5. The glass-forming region of the glass system (SiO2-Al2O3)-Li2O-Nb2O5, using the fusion method is presented by Todorovic and colleagues. They found that when the molar ratio [Nb2O5]/[SiO2]> 1 and the molar amount of [Li2O]> 25%, the glasses obtained are transparent and homogeneous. The application of thermal treatments to this glass, allowed the crystallization of LiNbO3 particles with a size between 150 and 350 nm, while maintaining optical transparency. These glass ceramics have a refractive index of 1.84-1.93 and a dielectric constant of 155-185, measured at 1 kHz and room temperature. They observed that increasing the temperature and/or thermal treatment time leads to an increase in particle size and consequent opacity of the samples. Zeng and colleagues showed that the composition 50SiO2-25Li2O-25Nb2O5 (mole%) gives, through the melt quenching method, a transparent glass, and observed the
www.intechopen.com

Advances in Ceramics – Electric and Magnetic Ceramics, Bioceramics, Ceramics and Environment
220
devitrification/crystallization (LiNbO3 phase crystallization) with thermal treatment at 800 ° C for 30 minutes. Applying an electric field during the thermal process, and cooling the melt to room temperature, gives rise to the appearance of dark brown zones in the glass, which indicates the occurrence of chemical and structural transformations. It is suggested the occurrence of an oxidation-reduction reaction activated by the external electric field. A similar study was conducted by Gerth in a glass composition 35SiO2-45Li2O-20Nb2O5 (mole %), applying to the melt a dc electric current (50 mA). From the obtained results it is suggested that the presence of a external electric field favors nucleation and subsequent crystallization in areas close to the cathode ( 5 4Nb e Nb+ − ++ ↔ ). They found that the LiNbO3 crystallites are isotropically distributed and with the c-axis perpendicular to the electrode. One of the purposes of applying an electric field during the devitrification of the glass, is to control the crystal orientation, which is a very important parameter for glass-ceramics with ferroelectric properties. Ding and colleagues found that the introduction of K2O, replacing the Li2O, in the system SiO2-Li2O-Nb2O5 favors, during the heat treatment process, the growth of LiNbO3 particles along the c axis. These particles were only detected in the glassy surface. Using P2O5 as network former Chowdari and colleagues fabricated a series of glasses of the system P2O5-Li2O-Nb2O5, by melt quenching, identifying the glass formation region. The analysis of the electrical conductivity of these glasses showed ionic conductivity at the temperature of 25 ° C, of about 2x10⁻⁶ S/cm attributed to the high cation mobility. The silicate glasses with LiNbO3, prepared by Prasad shows that the mechanism of electrical conductivity is ionic due to the high mobility of Li+. The doping of niobiophosphate glasses with iron is presented by Allen and colleagues. The nucleation and crystal growth of ferroelectric LiNbO3, in the glass matrix composition [(50-x)P205-50Li20-xNb205]: yFe203, with 0 <x <50 (mole%) and y = 2 (mole%) occurs preferentially in samples with high concentration of niobium. In samples with lower amount of niobium is observed the formation of lithium phosphate phases, of different complexity. The analysis of the thermally stimulated depolarization currents (TSDC), of these glasses, shows the presence of at least two depolarization mechanisms dependent on the niobium concentration. The lower temperature is attributed to dipolar relaxation and the second to interfacial relaxation mechanisms. Singh and colleagues, show the preparation of lithium borate glasses with niobium. This study shows that the introduction of more than 15% of Nb2O5 to the 42.5Li2O -57.5B2O3 composition (mole%) gives origin to crystalline phases. The Nb5+ ions inserted will occupy sites where lithium ions were and thus the number of empty sites will increase to maintain the charge neutrality. According to Tuller, this type of structural rearrangement, where there are more empty sites than ions available to fill favors the increase of ionic conductivity. In glasses where the amount of LiNbO3 is above 5%, there is an increase of the conductivity attributed to the increased mobility of Li+ ion, which is related to the increased number of empty sites. However, if the random network model, proposed in 1932 by Warren and Zachariasen for silicate glasses, is suitable for lithium borate glasses is expected that the lithium ion will occupy the empty spaces in a random manner. If this occurs then it is expected a distribution of activation energies for the conduction process of lithium ion. Note that the concept proposed by Zachariasen and Warren was one of several, which does not entirely explain the experimental observations. In 1959, Porai-Koshits proposes the existence of a polymer-crystalline structure, i.e., the glassy network does not present an
www.intechopen.com
Glass Ceramics with Para, Anti or Ferroelectric Active Phases
221
absolute disorder. This theory is the one that sets, more precisely, the experimental observations. Huang and colleagues showed that using the melt quenching method, the molar composition 45Li2O+50B2O3+5MnOm (%mole), where M = Al, Ti, Zr, V, Nb, Ta, Cr, Mo and W, and using Li2CO3 and H3BO3 as a starting material, transparent and homogeneous glasses without crystalline phases are achieved. The application of thermal treatments to lithium borate glasses with niobium, with the aim of crystallize the LiNbO3 phase is presented by Prasad and colleagues for the system (100-x)-LiBO2-xNb2O5 (mole %) with 5 <x <25. The as-prepared glass was submitted to heat treatments at temperatures between 300 and 800 °C and the LiNbO3 phase was detected for treatments at temperatures above 500 ºC. In glasses with higher niobium content the heat treatment process also favors the formation of the Li3NbO8 phase. In these glasses it appears that the value of the dielectric constant increases with increasing volume fraction of LiNbO3. In glasses treated at temperatures above 500 °C, there is the presence of spherical particles, with an average size of 25 nm, which increases with the increase of the thermal treatment temperature. The pyroelectric and ferroelectric effects were observed on these glass-ceramics at room temperature. The glass with x = 10 presents second harmonic generation (SHG) when the glass is irradiated with a λ = 1064 nm laser and it was observed that the SHG intensity depends on the angle of incidence. Komatsu and colleagues showed the possibility of prepare glass-ceramics with LiNbO3 crystallites using tellurium oxide has network former. The tellurium glass matrix has the advantage over the SiO2, by possessing a refractive index of ~ 2.2 very close to the refractive index of many ferroelectric crystals and also a lower melting temperature. The glasses prepared by Komatsu and coworkers, contains the following molar composition 50TeO2-(50-x)Li2O-xNb2O5 (mole %). The precipitation of LiNbO3 crystals is obtained using heat treatments with two temperature steps. All the glasses after the heat treatments are no longer transparent. They found that the higher is the ratio [Li+]/[Nb5+] less difficult is the precipitation of the LiNbO3 crystals. Shankar and colleagues showed that the composition containing 50% molar of TeO2 and an equal amount of Li2O and Nb2O5, after heat treatment at 200 ºC for 12h, presents LiNbO3 crystals, which precipitates mainly on the glass surface. Ding and colleagues [ding94] present the study of the crystallization of the glass composition 55TeO2-25Li2O-20Nb2O5 (mole %) submitted to an ultrasonic treatment (28 kHz, 150 W), which promotes the nucleation and growth of LiNbO3 crystals on the glass surface. Using the method of embedding crystals in a glass matrix, obtaining transparent glass ceramics has been attempted by Kim and colleagues in the glass composition 80TeO2-(20-x)Li2O-xNb2O5 (mole%), where LiNbO3 crystals were incorporated. They found that adding to the glass 15%, in weight, of LiNbO3 after melting at 950 ºC, a transparent glass-ceramic containing lithium niobate crystalline phase was obtained. Unlike glasses containing LiNbO3 phase, few studies are published to our knowledge, on glasses containing NaNbO3. Herczog and colleagues, showed the preparation of glasses of the system xSiO2-(1-x)(Na2O-Nb2O5), verifying that the decrease of x from 24% to 14% translates into an increase in the optical transparency. The precipitation of the NaNbO3 crystalline phase is obtained by heat treatment at temperatures above 750 °C. Karapetyan and colleagues present a study of the preparation of silicate glass ceramics with NaNbO3 based on the molar composition 32SiO2-26Li2O-20Nb2O5-22(GeO2 + Ti2O + Ta2O5 + ZrO2 + BaO + Sb2O5), which gives rise, using the melt quenching method, to transparent glasses.
www.intechopen.com
Advances in Ceramics – Electric and Magnetic Ceramics, Bioceramics, Ceramics and Environment
222
They found that the total substitution of Li2O for Na2O does not favor the formation of a homogeneous glass. The glassy state is maintained until a replacement up to 5% of Li2O by Na2O. This glass was submitted to heat treatments with ion exchange, by placing it with NaNO3 powder into a steel crucible. After heat treatments at 650 °C for 4h, is was observed the formation of the NaNbO3 phase, verifying that this crystallization is mainly at the surface but, with increasing the treatment time (> 16h) the inner zone of the sample becomes translucent indicating the presence of inside particles.
3. Experimental methods
3.1 Glass preparation The preparation of the transparent glasses containing lithium or sodium and niobium ions was performed using the melt quenching method and after, LiNbO3 or NaNbO3 crystal phases were precipitated in the glass matrix by heat-treatment process (HT). The melt quenching method was used to prepare transparent glasses of the following ternary systems:
A. SiO2-Nb2O5-X2O (X = Li, Na);
B. B2O3-Nb2O5-X2O (X = Li, Na);
The raw materials used were: silicon oxide (SiO2), boron oxide (B2O3), lithium carbonate (Li2CO3), niobium oxide (Nb2O5) and sodium carbonate (Na2CO3). The molar composition used was chosen in order to validate the following criteria: i) transparent glasses must be obtained; ii) the glasses should not present initial crystalline phases, iii) glasses with similar molar compositions. Thus the composition prepared was: 60AO2-30X2O-10Nb2O5 (% mole) (A = SiO2, B2O3, X = Li, Na). The preparation of glasses followed the basic process outlined in Figure 3.1. The calcination step was performed in order to remove the CO2 from the Na2CO3 and Li2CO3 raw materials, getting Na2O and Li2O, respectively. The last step, which is the glass annealing, held immediately after the melt was poured into the molds or pressed between stainless steel plates is intended to minimize the stresses of the glass network, preventing its disruptions. The parameters: temperature, calcination time, temperature and melting time and temperature and time of heat treatment (annealing) are characteristic of each composition. Therefore, these parameters are described in the description section of each composition. The preparation of the glass with the molar composition 60SiO2-30Li2O-10Nb2O5 start from the weight of the appropriate amounts of the oxides (SiO2 and Nb2O5) and lithium carbonate (Li2CO3). These oxides were mixed in a planetary ball-mill system for 1 hour, obtaining a homogeneous mixture. The next step was the calcination of the mixture, at 700 °C for 3 hours. After this treatment, the mixture was placed in a platinum crucible, heated to 1450 °C and held at that temperature for 30 minutes, after which the melt was poured into a clean stainless steel plate. A second plate was used, immediately to press the melt. After this process the glass was heat treated (annealed), with the aim of reducing the mechanical stresses in the glass, in a preheated oven at 350 ºC for about 4 hours, after which the system is turned off leaving the glass cool down naturally within the oven. The preparation of glasses with a molar composition 60B2O3-30Li2O-10Nb2O5 followed the same process (Fig. 3.1). In summary form, the reagents (B2O3, Li2CO3 and Nb2O5) were
www.intechopen.com

Glass Ceramics with Para, Anti or Ferroelectric Active Phases
223
mixed and after calcinated with the same conditions used for the silicate composition. The melting temperature used was 1100 ºC, and the melted was kept at this temperature for 30 minutes. After, the melt was poured into a clean stainless steel plate and immediately compressed with a second plate. The obtained glasses, transparent and colorless, and with a thickness between 1-2 mm were annealed at 300 °C, maintaining this temperature for 4 hours, then letting them cool in the furnace, slowly.
Weighing of the chemicals in accordance with the desired composition
↓
Mixture of chemicals in a planetary mill (300 rpm) for 1h
↓
Calcination of the mixture in a platinum crucible
↓
Melting process
↓
The melt was pressed between two stainless steel plates
↓
Glass annealing (heat treatment)
Fig. 3.1. Diagram of the glass preparation method used.
In order to obtain glass ceramics with LiNbO3 crystallites controlled heat-treatments (HT) to the base glass were performed, previously polished in order to obtain samples with a thickness of about 1 mm and with faces the more parallel possible. The preparation of the glass composition 60SiO2-30Na2O-10Nb2O5 (mole %) followed the same procedure (Fig. 3.1). In a brief, the reagents (SiO2, Na2CO3 and Nb2O5) were mixed in a planetary mill for 1 hour in order to obtain a homogeneous mixture. This mixture, placed in a platinum crucible was maintained at a temperature of 650 ° C for 3 hours in order to decompose the Na2CO3 into Na2O, releasing the CO2. After this step the mixture was heated to 1400 °C, remaining at this temperature for 30 minutes. The melt was then poured into a clean stainless steel plate being used a second plate to press the melt, obtaining transparent and colorless glasses with a thickness of 1-2 mm. This samples were then annealed at 250 °C (3 hours - annealing), and cooled inside the oven slowly to room temperature.
www.intechopen.com
Advances in Ceramics – Electric and Magnetic Ceramics, Bioceramics, Ceramics and Environment
224
The preparation of the glass composition 60B2O3-30Na2O-10Nb2O5 followed the process shown previously. It must be noted that the melting temperature of the mixture of starting oxides (B2O3, Na2O and Nb2O5) used was 1200 °C for 30 minutes.
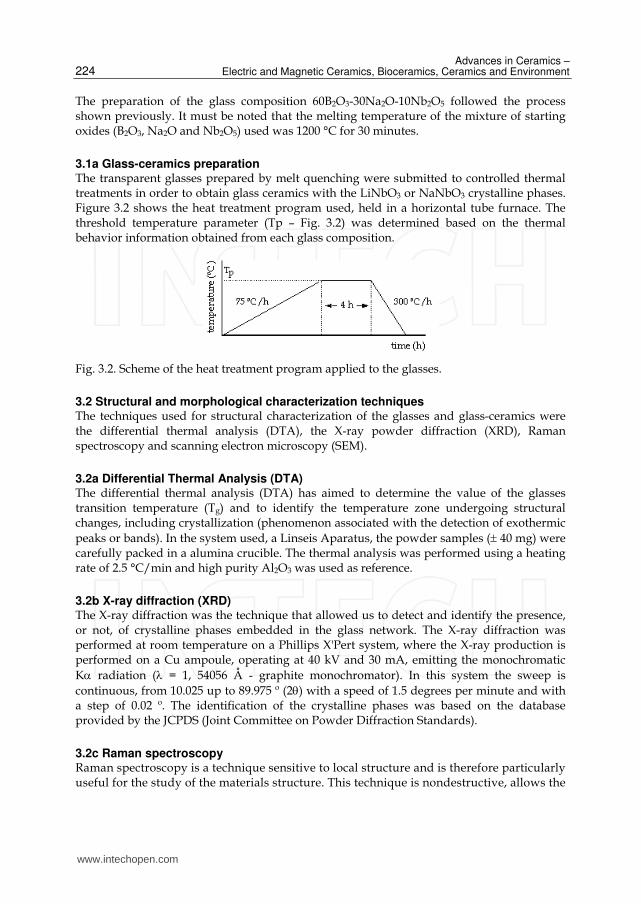
3.1a Glass-ceramics preparation The transparent glasses prepared by melt quenching were submitted to controlled thermal treatments in order to obtain glass ceramics with the LiNbO3 or NaNbO3 crystalline phases. Figure 3.2 shows the heat treatment program used, held in a horizontal tube furnace. The threshold temperature parameter (Tp – Fig. 3.2) was determined based on the thermal behavior information obtained from each glass composition.
Fig. 3.2. Scheme of the heat treatment program applied to the glasses.
3.2 Structural and morphological characterization techniques The techniques used for structural characterization of the glasses and glass-ceramics were the differential thermal analysis (DTA), the X-ray powder diffraction (XRD), Raman spectroscopy and scanning electron microscopy (SEM).
3.2a Differential Thermal Analysis (DTA) The differential thermal analysis (DTA) has aimed to determine the value of the glasses transition temperature (Tg) and to identify the temperature zone undergoing structural changes, including crystallization (phenomenon associated with the detection of exothermic peaks or bands). In the system used, a Linseis Aparatus, the powder samples (± 40 mg) were carefully packed in a alumina crucible. The thermal analysis was performed using a heating rate of 2.5 °C/min and high purity Al2O3 was used as reference.
3.2b X-ray diffraction (XRD) The X-ray diffraction was the technique that allowed us to detect and identify the presence, or not, of crystalline phases embedded in the glass network. The X-ray diffraction was performed at room temperature on a Phillips X'Pert system, where the X-ray production is performed on a Cu ampoule, operating at 40 kV and 30 mA, emitting the monochromatic Kα radiation (λ = 1, 54056 Å - graphite monochromator). In this system the sweep is continuous, from 10.025 up to 89.975 º (2θ) with a speed of 1.5 degrees per minute and with a step of 0.02 º. The identification of the crystalline phases was based on the database provided by the JCPDS (Joint Committee on Powder Diffraction Standards).
3.2c Raman spectroscopy Raman spectroscopy is a technique sensitive to local structure and is therefore particularly useful for the study of the materials structure. This technique is nondestructive, allows the
www.intechopen.com

Glass Ceramics with Para, Anti or Ferroelectric Active Phases
225
study of optical properties, vibrational, structural composition, crystallinity and/or amorphous state of samples. This analysis was performed on a spectrometer T64000, Jobin Yvon SPEX using an argon laser operating at 514.5 nm. The Raman spectrum was obtained with a back-scattering geometry (back-scattering) between 100 and 2000 cm-1. The amplitude of the lens used was of 50x which allows a laser spot diameter on the sample of about 5 mm.
3.2d Scanning Electron Microscopy (SEM) The main purpose of using this technique was to verify the existence of particles in the heat-treated samples and also analyzing their shapes, morphology, size, size distribution and orientations. It must be noticeD that using this technique the samples must possess three main characteristics: support high vacuum; support the energy of the incident electron beam and their surface must be conductive. Once the studied samples are electrically insulators, it was needed to perform a carbon deposition on the sample surface. In all samples it was observed the free surface and the fractured surfaces characteristics. Electron microscopy systems used were: Hitachi S4100-1 and Philips XL30.
3.3 Electric and dielectric characterization techniques The study of electrical and dielectric properties of the glasses and glass ceramics was performed by measuring the dc conductivity (σdc) and ac conductivity (σac) as function of the temperature (200 K - 370 K), the complex impedance (Z *= Z '+ jZ'') as a function of temperature (260 K - 315 K) and frequency (10-3 Hz - 106 Hz). All measurements were made using a bath cryostat system. For electrical measurements the sample surfaces, which present a thickness of about 1 mm were painted with silver paint, thus forming the electrodes on which are attached with the same paint the electrical terminals. In the following items, it will be described, in a summary form, the description of the systems of measurement used and the mathematical basis used for the analysis of the results. It also presented the mathematical formalism necessary to calculate the different quantities that can be obtained from the measurements.
3.3a Dc conductivity measurement
To measure the dc conductivity (σdc) it was used a system that, at a given and stable temperature, applies to the sample a known dc voltage (V) through a variable voltage source and measuring the current (I) through an electrometer (Keithley 617). Due to the high resistivity values of this samples a two terminal model was always used. The current measurements were made from the lowest temperature and the rise of the temperature was done using a heater controlled by a IT54-Oxford Research. The calculation of the σdc, based on this measurement method, can be achieved through the following deduction: based on Ohm's law for electrical circuits (where V represents the voltage, R the resistance and I the intensity of current that flows through the resistance) and knowing that the electrical resistance of a material is given by equation 1:
1
dcdc
d dR
A Aρ σ= = (1)
www.intechopen.com

Advances in Ceramics – Electric and Magnetic Ceramics, Bioceramics, Ceramics and Environment
226
where ρdc is the dc resistivity of the material, σdc the dc conductivity of the sample, d the thickness and A the area of the electrodes, it is concluded that the conductivity can be calculated using equation 2:
dc
I d
V Aσ = (2)
According to Hakim and colleagues, the variation of the dc conductivity with temperature, in glasses, can be adjusted through an Arrhenius equation (eq.3):
0
AE
kTdc eσ σ
⎛ ⎞−⎜ ⎟⎝ ⎠= (3)
where σo is the pre-exponential factor, EA is the activation energy, k is the Boltzmann constant (1.380658 x 10⁻²³ J/K) and T the temperature. Using the logarithmic function on the equation 3, the activation energy (EA) can be calculated through the slope of ln(σdc) versus 1/T (eq. 4):
ln( ) Adc
EC
kTσ = − + (4)
Sometimes, the ln (σdc) versus 1/T is not linear In these cases a better fit can be obtained using Mott's law (Eq. 4b):
ln( ) Adc
ET C
kTσ = − + (5)
Being the activation energy (EA) calculated from the slope of ln(σdcT) versus 1/T.
3.3b Dielectric spectroscopy measurements The complex impedance measurement (Z *= Z ' +j Z'') has temperature and frequency function allows us to conduct studies about the dependence of the ac conductivity, dielectric constant, dielectric loss and dielectric relaxation phenomena with those two variables. The measurement of Z*, was performed in the frequency range from 10 mHz to 32 MHz, by using a Solartron SI 1260 Impedance/gain-phase analyzer, which reads the real part (Z') and the imaginary part (Z'') of the sample impedance. The complex permittivity (ε*=ε´+jε´´) was calculated based on the values of Z * and knowing that Z *= 1 / (μ ε *) (where μ = jωC0,
1j = − , ω is the angular frequency and C0 the empty space capacity ( ( )0 0C A dε= , ε0 is
the vacuum permittivity 8.854 x10⁻¹² Fm, A the area of the electrode and d the sample thickness). The measured impedance was normalized by calculating Z*rel (eq. 6):
( )* *relZ Z A d= (6)
The ac conductivity (σac) for a given frequency and temperature was calculated using eq. 7:
0 ´´acσ ωε ε= (7)
www.intechopen.com

Glass Ceramics with Para, Anti or Ferroelectric Active Phases
227
The dependence of σac with temperature for a fixed frequency, allowed us, by using the Arrhenius expression (Eq. 3), to calculate the ac conductivity activation energy (EA(ac)).
3.3c Fit the experimental data to physical models The need to fit the experimental complex impedance (Z*) data, as function of frequency and temperature, to physical models is of great interest because the resulting information can enable a quantitative interpretation of the measurements. Usually, physical models used in such settings are associated with equivalent electrical circuits. Thus, this section aims to present and discuss the physical models and numerical method used to fit the experimental data obtained by impedance spectroscopy. The adjustment of this type of experimental data to theoretical functions is usually done through computational processes associated with numerical methods. Currently there are some commercial software that allows the realization of these settings (e.g. LEVM written by RS Macdonald, Equivalent Circuit written by BA Boukamp, Curvefit written by Graphpad Software, Inc, WinFit written by Novocontrol Inc). However, factors such as the theoretical model associated with the algorithm, the description of the method for calculating the adjustable parameters, the existence of limitations in terms of amount of experimental data that can be used in the adjustment process and the processing time led us to develop software that could make these adjustments. In the developed software the computational analysis of the experimental data was performed using the complex non-linear least squared deviations method (CNLLS). One advantage of this method is to allow the use of complex models containing many parameters to adjust, enabling calculation of the uncertainties associated with each parameter used. The ability to adjust both the real and imaginary part, which does not occur in other methods, such as the Kramers-Kronig (KK) method, or the Havriliak-Negami (HN) method, which assumes that knowing one part (real or imaginary) the other is calculable. However, this mathematical approach introduces, in the calculated part errors that result in a poor final adjustment. The CNLLS method was used based on the algorithm idealize by Levenberg-Marquardt and based in the Gauss-Newton numerical method. This method requires, necessarily, an estimation of the initial parameters to adjust. From these values the algorithm modifies all of them, or just some (this is one advantage), and simultaneously evaluates the result of the modification. If the result fit the experimental values better the modifications are accepted, otherwise the first remains. This process is repeated iteratively until the sum of the squared deviations is minimal. However, this algorithm has some limitations, and in some cases does not converge to an optimal fit. This can be assigned to factors such as: - A bad estimation of the initial parameters; - A high noise level associated with the experimental values; - Optimizing the fit for the whole spectrum, does not take in care if the fit is not good in a
certain region of the spectrum;
3.3d Physical model The analysis of the results of the impedance spectroscopy is normal the use of electrical equivalent circuits that can represent the dielectric behavior. The choice of a particular electrical circuit must be made according to the experimental data. The electrical circuit represents a physical model. However, it is important to mention the possibility of different equivalent circuits, fit the same experimental spectrum. Therefore, one should not assume
www.intechopen.com

Advances in Ceramics – Electric and Magnetic Ceramics, Bioceramics, Ceramics and Environment
228
that a given equivalent circuit, which produces a good experimental data adjustment, represents the exact physical model of the sample [EISnet]. The model used in the developed algorithm, shown schematically in fig. 3.3, was chosen based on the characteristics of the experimental spectra of the glasses and glass ceramics studied.
Fig. 3.3. Equivalent electric circuit.
R and R1 represent electric resistances and CPE a constant phase element. This constant phase element is characterized by keeping constant the angle of the impedance as a function of frequency, i.e. the ratio between the real and imaginary part of the impedance is constant across the all frequency range. The impedance of this intuitive element (ZCPE) can be
represented by ( )0
1CPE n
ZQ jω= , where Q0 and n are frequency independent parameters, but
usually are temperature dependent. The parameter n varies between 0 and 1, when n = 1 the CPE is reduced to a capacitance element and when n =0 to a resistive element. However, the main problem in using, the CPE element in a equivalent circuit, which may be associated with the existence of a heterogeneous charge distribution, is that the parameter Q0, obtained through the iterative process, does not present capacity (Farad) units. This issue was discussed by Hsu and Mansfeld for the case of an electrical circuit formed by the parallel between a resistance and a CPE and they concluded that eq. 8 present the correction of Q0 for the real capacity closer value.
( ) 10 max
nCPEC C ω −= (8)
where ωmax is the angular frequency where max is related with the Z'' peak, which is
independent of the exponent n while 0 0 sin2
nC Q
π⎛ ⎞= ⎜ ⎟⎝ ⎠ .
The impedance expression of the CPE element (eq. 9) can be rewritten, taking into account the Euler expressions (eq. 10)
1
12
0 0
1 1 cos
2 2
j
CPEZ e n jsen nQ Q
π π πω ω−
−⎛ ⎞ ⎛ ⎞⎛ ⎞ ⎛ ⎞⎜ ⎟= = −⎜ ⎟⎜ ⎟ ⎜ ⎟⎜ ⎟ ⎝ ⎠ ⎝ ⎠⎝ ⎠⎝ ⎠ (9)
where 2
nπ
represents the impedance angle.
( ) ( )2
cos
j
j
j e
e jsen
π
θ θ θ⎧⎪ =⎨⎪ = +⎩
(10)
Through an analysis of the equivalent circuit, the equivalent impedance can be described by equation 11:
www.intechopen.com
Glass Ceramics with Para, Anti or Ferroelectric Active Phases
229
1
.R CPEeq R
R CPE
Z ZZ Z
Z Z
⎡ ⎤= + ⎢ ⎥+⎣ ⎦ (11)
where ZR1=R1, ZR=R e ( )0
1CPE n
ZQ jω= . Therefore, rewritten equation 11:
1
01 cos2 2
eqn
RZ R
RQ n jsen nπ πω
= + ⎛ ⎞⎛ ⎞ ⎛ ⎞+ +⎜ ⎟ ⎜ ⎟⎜ ⎟⎝ ⎠ ⎝ ⎠⎝ ⎠ (12)
The equation 12 represents the function that will be used to fit the experimental data (Zeq represents the Z* function, mentioned previously). It must be noted that this function contains four parameters (R1, R, Q0 and n), to adjust.
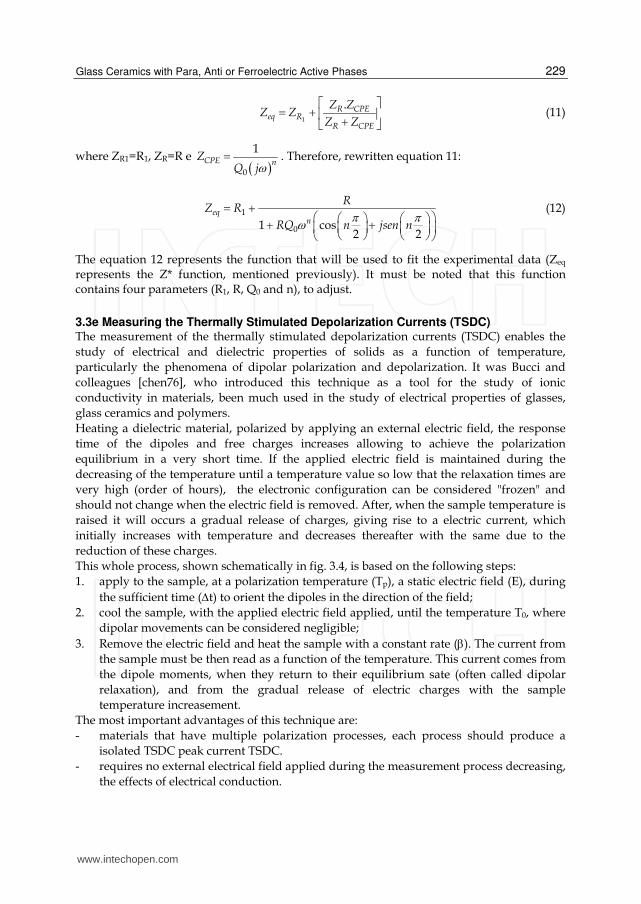
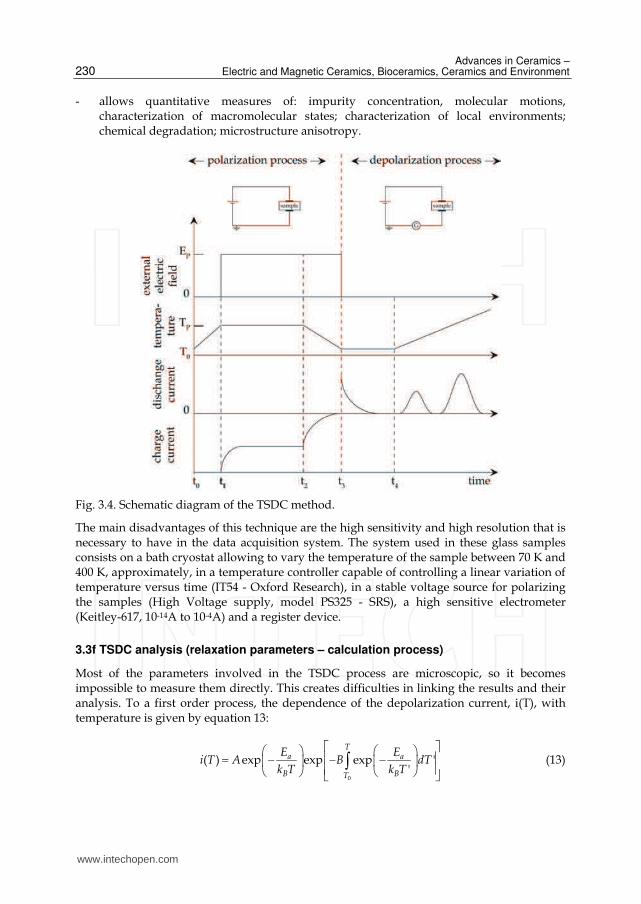
3.3e Measuring the Thermally Stimulated Depolarization Currents (TSDC) The measurement of the thermally stimulated depolarization currents (TSDC) enables the study of electrical and dielectric properties of solids as a function of temperature, particularly the phenomena of dipolar polarization and depolarization. It was Bucci and colleagues [chen76], who introduced this technique as a tool for the study of ionic conductivity in materials, been much used in the study of electrical properties of glasses, glass ceramics and polymers. Heating a dielectric material, polarized by applying an external electric field, the response time of the dipoles and free charges increases allowing to achieve the polarization equilibrium in a very short time. If the applied electric field is maintained during the decreasing of the temperature until a temperature value so low that the relaxation times are very high (order of hours), the electronic configuration can be considered "frozen" and should not change when the electric field is removed. After, when the sample temperature is raised it will occurs a gradual release of charges, giving rise to a electric current, which initially increases with temperature and decreases thereafter with the same due to the reduction of these charges. This whole process, shown schematically in fig. 3.4, is based on the following steps: 1. apply to the sample, at a polarization temperature (Tp), a static electric field (E), during
the sufficient time (Δt) to orient the dipoles in the direction of the field; 2. cool the sample, with the applied electric field applied, until the temperature T0, where
dipolar movements can be considered negligible; 3. Remove the electric field and heat the sample with a constant rate (β). The current from
the sample must be then read as a function of the temperature. This current comes from the dipole moments, when they return to their equilibrium sate (often called dipolar relaxation), and from the gradual release of electric charges with the sample temperature increasement.
The most important advantages of this technique are: - materials that have multiple polarization processes, each process should produce a
isolated TSDC peak current TSDC. - requires no external electrical field applied during the measurement process decreasing,
the effects of electrical conduction.
www.intechopen.com
Advances in Ceramics – Electric and Magnetic Ceramics, Bioceramics, Ceramics and Environment
230
- allows quantitative measures of: impurity concentration, molecular motions, characterization of macromolecular states; characterization of local environments; chemical degradation; microstructure anisotropy.
Fig. 3.4. Schematic diagram of the TSDC method.
The main disadvantages of this technique are the high sensitivity and high resolution that is necessary to have in the data acquisition system. The system used in these glass samples consists on a bath cryostat allowing to vary the temperature of the sample between 70 K and 400 K, approximately, in a temperature controller capable of controlling a linear variation of temperature versus time (IT54 - Oxford Research), in a stable voltage source for polarizing the samples (High Voltage supply, model PS325 - SRS), a high sensitive electrometer (Keitley-617, 10-14A to 10-4A) and a register device.
3.3f TSDC analysis (relaxation parameters – calculation process)
Most of the parameters involved in the TSDC process are microscopic, so it becomes impossible to measure them directly. This creates difficulties in linking the results and their analysis. To a first order process, the dependence of the depolarization current, i(T), with temperature is given by equation 13:
0
( ) exp exp exp ''
Ta a
B BT
E Ei T A B dT
k T k T
⎡ ⎤⎛ ⎞ ⎛ ⎞⎢ ⎥= − − −⎜ ⎟ ⎜ ⎟⎢ ⎥⎝ ⎠ ⎝ ⎠⎣ ⎦∫ (13)
www.intechopen.com

Glass Ceramics with Para, Anti or Ferroelectric Active Phases
231
where Ea is the activation energy, kB the Boltzmann constant, and A and B constants. However, the mathematical treatment of this expression is a difficult task, being the main problem the integration, which leads to series that converge to infinity, so it is necessary to use approximations. In the part of the i(T) curve referred to the temperatures below the TSDC peak, and because the heating rate (β) is constant, the integral (eq. 13) is small and can be approximated to zero. Therefore eq. 13 can be simplified (see eq. 14), making it possible to determine the value of the activation energy (Ea) related to the process that gives rise to the peak current.
( ) a
B
E
k Ti T Ae
⎛ ⎞−⎜ ⎟⎝ ⎠= (14)
This approach is legitimate and proved by several researchers through an asymptotic expansion of the exponential integral, in which for the simple case of the Arrhenius expression is (eq.15):
2 2
0
exp( ) 2! 3!exp( ) 1
Ty
y dyyy y
⎛ ⎞−− = − +⎜ ⎟⎜ ⎟⎝ ⎠∫ A (15)
where a
B
Ey
k T= . Mathematically manipulating equation 15 we can obtain equation 16:
( )( )ln ln( ) a
B
Ei T A
k T= − (16)
ln(A) represents a constant and Ea the activation energy calculated from the slope of the linear zone in the graphic representation of ln i(T) versus 1/T. This is the method which, although it has the drawback of using just the values of the initial part of the curve, is the most used due to the advantages that presents. To make the best possible theoretical fitting of the experimental data with the theoretical model represented by eq. 13, it is necessary to solve the integral. According to Chen and colleagues, for the case where 0T T β= + , where β represents the linear heating rate, the integral can be written as follows (eq. 17):
( ) ( )0
0, ,a
B
ETk T
a a
T
e dT F T E F T E
⎛ ⎞−⎜ ⎟⎝ ⎠ = −∫ (17)
where ( )0
,a
B
ET
k TaF T E e dT
⎛ ⎞−⎜ ⎟⎝ ⎠= ∫ . Since F(T, Ea) is a function that grows considerably with
increasing temperature, we can neglect F(T0,Ea). One way to calculate F(T, Ea) is via an asymptotic expansion of the integral, based on eq. 13. Thus the function F(T, Ea) can be rewritten (eq. 18):
( ) ( ) ( )1
1, exp 1 !
nNna B
aB an
E k TF T E T n
k T E
−=
⎛ ⎞⎛ ⎞= − −⎜ ⎟⎜ ⎟⎝ ⎠ ⎝ ⎠∑ (18)
www.intechopen.com

Advances in Ceramics – Electric and Magnetic Ceramics, Bioceramics, Ceramics and Environment
232
For N=1, we can write an approximation (eq. 19):
( ) 2
exp exp expa aB
B a B
E Ek Ti T A B
k T E k T
⎛ ⎞⎛ ⎞ ⎛ ⎞= − − −⎜ ⎟⎜ ⎟ ⎜ ⎟⎜ ⎟⎝ ⎠ ⎝ ⎠⎝ ⎠ (19)
Where A, B and Ea (A and B are constants and Ea is the activation energy) are fitting parameters. We used eq. 19 to fit the experimental spectra of the glasses presented in this chapter. The value of the parameters A, B and Ea were obtained as follows: parameters A and Ea are obtained by linear regression associated with eq.16 model. The parameter B can be calculated, according to J. Vanderschueren and J. Gasiot, based on the peak temperature (Tm) of the depolarization current and the activation energy (Ea) (eq. 20).
12
expa am
B B m
E ET
k B k T
⎡ ⎤⎛ ⎞= ⎢ ⎥⎜ ⎟⎢ ⎥⎝ ⎠⎣ ⎦ (20)
The calculus of the relaxation time associated with the TSDC current peak was obtained according to Neagu and co-workers work. They present a method for calculating the relaxation time, assuming that these depolarization processes can be explained based on eq. 22 (another way of writing eq. 13).
( ) ( ) ( )0
´0 1
expT
T
P dTT
j T Tτ β τ
⎛ ⎞⎜ ⎟= −⎜ ⎟⎝ ⎠∫ (22)
where P0 represents the polarization in the sample during the application of the external
electric field, j(T) represents the current density, β the constant heating rate (dT
dtβ = ) and T0
the initial temperature of measurement. At temperatures below the glass transition, which is our case, we can assume that the dependence of τ with temperature can be described by the Arrhenius equation (eq. 23):
( ) 0 exp a
B
ET
k Tτ τ ⎛ ⎞= ⎜ ⎟⎝ ⎠ (23)
τ0 is the pre-exponential factor and represents the relaxation time at infinite temperature.
Thus, knowing that the maximum current occurs when( ) 1d T
dT
τβ= − , expression 24 can be
achieved.
2
01
exp
B m
aa
B m
k T
EE
k T
τ β= ⎛ ⎞⎜ ⎟⎝ ⎠ (24)
Thus, known the value of τ0, the relaxation time τ can be obtained (eq. 23).
www.intechopen.com
Glass Ceramics with Para, Anti or Ferroelectric Active Phases
233
4. Results analysis
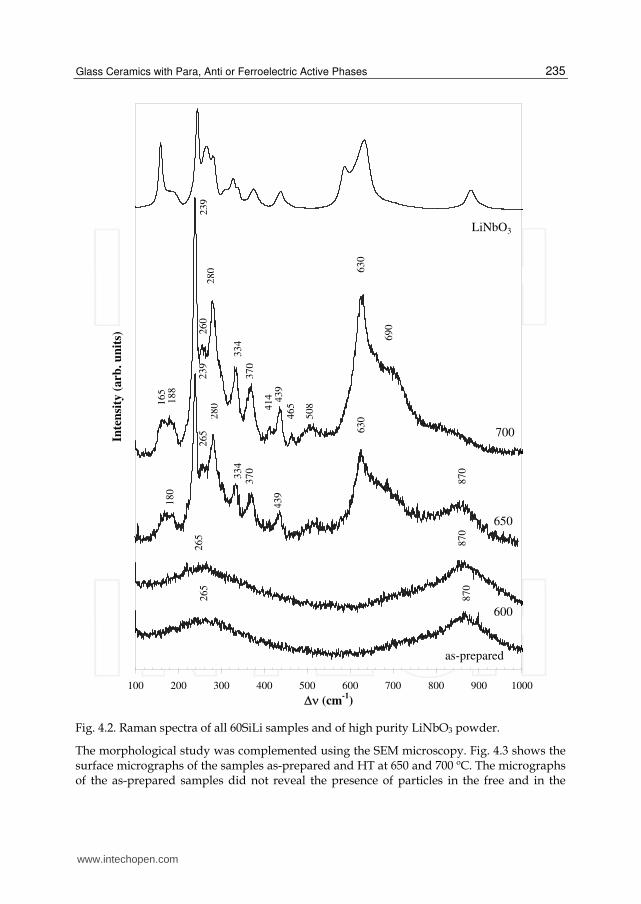
4.1 Silicate system 4.1.1 SiO2-Li2O-Nb2O5 composition The composition 60SiO2-Li2O-10Nb2O5 (named in the text as 60SiLi) gives origin to a transparent and yellow sample. This as-prepared sample was heat-treated using the program described in fig. 3.2. The dwell temperatures were (Tp) chosen in accordance to the DTA results. This thermal analysis showed the presence of one exothermic phenomenon center at 710 ºC and one endothermic phenomenon at 960 ºC. The glass transition temperature is approximately 665 ºC. Thus, the HT process was performed with Tp temperatures of 600, 650 and 700ºC. The XRD results (Fig. 4.1) showed the presence in the sample HT at 650 ºC of the LiNbO3 and Li2Si2O5 crystal phases. The exothermic phenomena detected by DTA should be assigned to this crystallization process. The spectrum of the sample HT at 700 ºC shows also the presence of Nb2O5 phase. At a macroscopic level, it was observed that the samples HT at 650 ºC became translucid and opaque with the HT at 700 ºC. The translucent appearance (and/or opaque) is a optical characteristic that may indicate the presence of particles dispersed in the glass matrix. However, it is important to note that an optically transparent glass may already contain particles dispersed in the glass matrix. According to Todorovic and colleagues, a glass ceramic is transparent when: i) the particles dispersed in the matrix have a minimum size such that the scattering of the visible light, in the particle-matrix boundary, is minimum; ii) the difference between the value of the refractive index of the particles and the glass matrix is minimal. The latter case is visible in transparent silicate glasses containing Li2Si2O5 particles, whose refractive index (n ~ 1.5) is very close to the index of SiO2 glass (n ~ 1.4). So, knowing that the XRD samples of the as-prepared and HT at 600 ºC (fig. 4.1), revealed the presence of LiNbO3 and Li2Si2O5 crystalline, it is therefore reasonable to assume that the translucent appearance observed in these samples is related to the presence of LiNbO3 crystallites, which are characterized by having a refractive index of ~ 2.2, quite distant from the SiO2. The XRD diffractogram of the sample HT at 650 ºC shows that the number and intensity of the XRD peaks indexed to the LiNbO3 phase are superior to those related to the Li2Si2O5 phase. This suggests the possible presence of a greater amount of LiNbO3 particles, than Li2Si2O5, dispersed in the glass matrix. However, the sample treated at 600 ºC, which is optically transparent, particles were observed by SEM with an average size of 1 μm, approximately (fig. 4.3), but not detected by XRD (fig. 4.1). This phenomenon may indicate that those particles have a incipient crystallinity or present an amorphous nature. The Raman spectra of all 60SiLi samples studied is shown in fig. 4.2. Analyzing the spectra it can be observed the existence, in the samples as-prepared and HT at 600 ºC, two large bands centered at 870 and 265 cm-1. In the samples HT at 650 and 700 ºC it were detected vibration bands at 690, 630, 465, 439, 414, 370, 334, 280, 239 e 165-188 cm-1. According to the literature the bands at 630, 439-437, 370, 335-334, 280, 265, 239 e 180 cm-1, are assigned to vibrations of the NbO6 octahedrons associated with the LiNbO3 crystal phase. Most research about the insertion of niobium ions in a glass matrix, is accomplished by comparison with the properties of the crystal whose structure is known, such as LiNbO3. Most of the crystals containing niobium are formed by NbO6 octahedral with different degrees of distortion. However, the detection of niobium crystals vibrations associated with NbO4 tetrahedral is rare, justified by the fact that Nb5+ presents a size too large to be
www.intechopen.com

Advances in Ceramics – Electric and Magnetic Ceramics, Bioceramics, Ceramics and Environment
234
inserted in a tetrahedron of oxygen ions. Cardinal and colleagues reported that the progressive introduction of Nb2O5 in boron-phosphate glasses gives rise to a Raman band close to 900 cm-1, attributed to vibrations of free NbO6 octahedral and with increasing the concentration of Nb2O5 shifts to lower wave numbers, suggesting the formation of a network of NbO6 octahedrons linked by the vertices. Thus, most authors assign the Raman band between 800 and 940 cm-1, detected in glasses containing niobium, to vibrations of isolated NbO6 octahedrons. However, this analysis does not consider the possibility of the niobium ion be structurally inserted in the glass matrix as a network former. Studies of Alekseeva and coworkers in glasses of the system K2O-Nb2O5-SiO2, suggest that for molar quantities of Nb2O5 below 20%, the Raman band between 800 and 950 cm-1 should be related to vibrations of NbO4 tetrahedrons. For higher concentrations of Nb2O5, the band is assigned to vibrations of NbO6 octahedrons. Increasing the degree of distortion of these octahedral, the band should shift to higher wave numbers. This band can be also linked to the NbO6 octahedral containing at least one Nb-O terminal bond. Lipovski relate this band to vibrations of non-bridging Nb-O bonds. The same trend was observed in SiO2:Nb2O5 binary glasses, where a certain amount of niobium is introduced as network former. Therefore, the detection in Raman spectra (fig. 4.2) of the band at 870 cm-1 indicates that some niobium ions are probably introduced into the glass matrix as network formers. Considering that some niobium ions are in the glass matrix as network modifiers, the increase of the HT temperature promotes a decrease in their number due to the inclusion in the LiNbO3 crystal structure. Consequently the volume ratio between the particles and the glass matrix increases.
10 20 30 40 50 60 70
2 θ
inte
ns
ity (
arb
. u
nit
s)
600
650
700
xo
o
o
x
x
x
+
+
x
x
x xx
x
x x x
x
x
x
o
o
o
o
o
o
Fig. 4.1 DRX spectra of the 60SiLi heat-treated samples (x LiNbO3; o Li2Si2O5; + Nb2O5).
www.intechopen.com
Glass Ceramics with Para, Anti or Ferroelectric Active Phases
235
100 200 300 400 500 600 700 800 900 1000Δν (cm-1
)
Inte
nsi
ty (
arb
. u
nit
s)
870
as-prepared
600
650
700
265
165
188
239
280
334
370
439
465
630
260
690
180
414
870
870
265
508
280
334
370
439
630
239
265
LiNbO3
Fig. 4.2. Raman spectra of all 60SiLi samples and of high purity LiNbO3 powder.
The morphological study was complemented using the SEM microscopy. Fig. 4.3 shows the surface micrographs of the samples as-prepared and HT at 650 and 700 ºC. The micrographs of the as-prepared samples did not reveal the presence of particles in the free and in the
www.intechopen.com
Advances in Ceramics – Electric and Magnetic Ceramics, Bioceramics, Ceramics and Environment
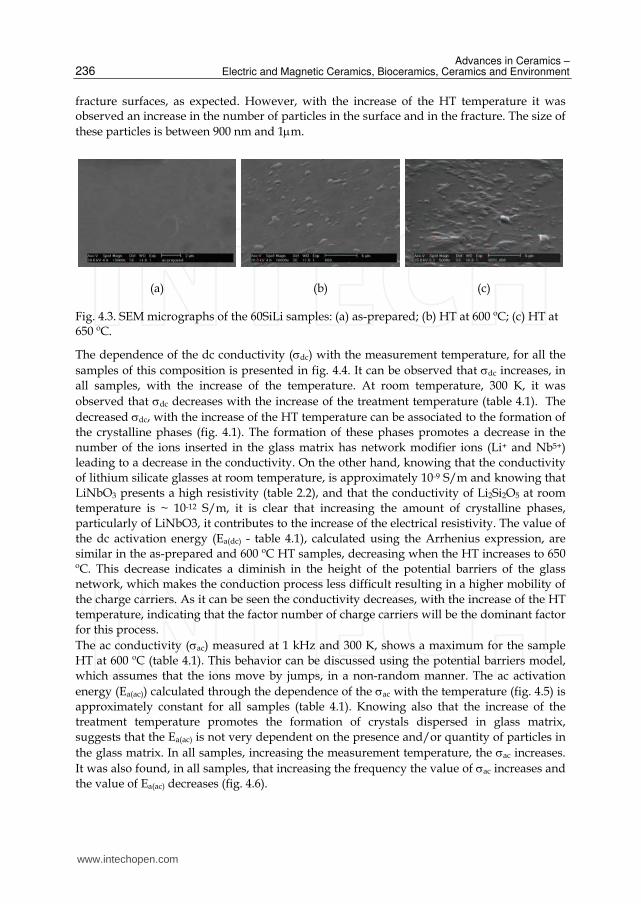
236
fracture surfaces, as expected. However, with the increase of the HT temperature it was observed an increase in the number of particles in the surface and in the fracture. The size of these particles is between 900 nm and 1μm.
(a) (b) (c)
Fig. 4.3. SEM micrographs of the 60SiLi samples: (a) as-prepared; (b) HT at 600 ºC; (c) HT at 650 ºC.
The dependence of the dc conductivity (σdc) with the measurement temperature, for all the samples of this composition is presented in fig. 4.4. It can be observed that σdc increases, in all samples, with the increase of the temperature. At room temperature, 300 K, it was observed that σdc decreases with the increase of the treatment temperature (table 4.1). The decreased σdc, with the increase of the HT temperature can be associated to the formation of the crystalline phases (fig. 4.1). The formation of these phases promotes a decrease in the number of the ions inserted in the glass matrix has network modifier ions (Li+ and Nb5+) leading to a decrease in the conductivity. On the other hand, knowing that the conductivity of lithium silicate glasses at room temperature, is approximately 10-9 S/m and knowing that LiNbO3 presents a high resistivity (table 2.2), and that the conductivity of Li2Si2O5 at room temperature is ~ 10-12 S/m, it is clear that increasing the amount of crystalline phases, particularly of LiNbO3, it contributes to the increase of the electrical resistivity. The value of the dc activation energy (Ea(dc) - table 4.1), calculated using the Arrhenius expression, are similar in the as-prepared and 600 ºC HT samples, decreasing when the HT increases to 650 ºC. This decrease indicates a diminish in the height of the potential barriers of the glass network, which makes the conduction process less difficult resulting in a higher mobility of the charge carriers. As it can be seen the conductivity decreases, with the increase of the HT temperature, indicating that the factor number of charge carriers will be the dominant factor for this process. The ac conductivity (σac) measured at 1 kHz and 300 K, shows a maximum for the sample HT at 600 ºC (table 4.1). This behavior can be discussed using the potential barriers model, which assumes that the ions move by jumps, in a non-random manner. The ac activation energy (Ea(ac)) calculated through the dependence of the σac with the temperature (fig. 4.5) is approximately constant for all samples (table 4.1). Knowing also that the increase of the treatment temperature promotes the formation of crystals dispersed in glass matrix, suggests that the Ea(ac) is not very dependent on the presence and/or quantity of particles in the glass matrix. In all samples, increasing the measurement temperature, the σac increases. It was also found, in all samples, that increasing the frequency the value of σac increases and the value of Ea(ac) decreases (fig. 4.6).
www.intechopen.com

Glass Ceramics with Para, Anti or Ferroelectric Active Phases
237
-25
-23
-21
-19
-17
-15
-13
-11
-9
2.6 2.8 3 3.2 3.4 3.6 3.8 4 4.2
1000/T (K-1
)
ln( σ d
c)
(Sm
-1)
as-prepared
HT 600ºC
HT 650ºC
Fig. 4.4. σdc temperature dependence for all 60SiLi samples.
-15.5
-15
-14.5
-14
-13.5
-13
-12.5
3.3 3.4 3.5 3.6 3.7 3.8 3.9
1000/T [K-1
]
ln( σ a
c) [
Sm
-1]
as-prep
600
650
Fig. 4.5. σac temperature dependence for all 60SiLi samples, at 1 kHz.
www.intechopen.com

Advances in Ceramics – Electric and Magnetic Ceramics, Bioceramics, Ceramics and Environment
238
-14
-13
-12
-11
-10
-9
-8
3.1 3.2 3.3 3.4 3.5 3.6 3.7 3.8
1000/T [K-1
]
ln (
σ ac) [S
m-1
]
1 kHz
10 kHz
100 kHz
1 MHz 39.64 kJ/mol
29.86 kJ/mol
19.62 kJ/mol
15.82 kJ/mol
Fig. 4.6. σac temperature dependence for all 60SiLi samples, at 1 k, 10 k, 100 k and 1 MHz.
0.0E+00
5.0E+04
1.0E+05
1.5E+05
2.0E+05
2.5E+05
3.0E+05
3.5E+05
0.0E+00 1.0E+05 2.0E+05 3.0E+05 4.0E+05 5.0E+05 6.0E+05 7.0E+05
Z´
Z´´
as-prep600 650
Fig. 4.7. Z´´ versu Z´ spectra for all 60SiLi samples, at 300 K.
www.intechopen.com

Glass Ceramics with Para, Anti or Ferroelectric Active Phases
239
Sample σdc (x10-8)
[Sm-1]
Ea(dc)
[kJ/mol] σac (x10-7)
[Sm-1]
Ea(ac)
[kJ/mol]
As-prepared 29,4 ± 0,4 58,47 ± 0,66 26,02 ± 0,58 37,37 ± 2,56
600 19,4 ± 0,2 59,03 ± 0,41 31,98 ± 0,71 39,04 ± 1,20
650 1,30 ± 0,01 54,10 ± 0,63 29,01 ± 0,69 38,52 ± 1,62
Table 4.1. dc conductivity (σdc), at 300 K, dc activation energy (Ea(dc)), ac conductivity (σac), at 300 K and 1 kHz, ac activation energy (Ea(ac)) of the as-prepared, HT at 600 and 650 ºC samples.
0.0E+00
5.0E+05
1.0E+06
0.0E+00 5.0E+05 1.0E+06 1.5E+06 2.0E+06
Z´
Z´´
300 295 285 280290
Fig. 4.8. Z´´ versus Z´, of the as-prepared samples at several measuring temperatures.
Figure 4.7 shows the Cole-Cole spectrum, using the impedance formalism (Z*) for all samples, in the frequency range from 10-2 Hz and 106 Hz and at 300 K. This spectrum shows semi-arches whose centers are below the Z' axis, indicating the existence of a distribution of relaxation times, which in these glasses should be related to the presence of various components such as the glass matrix, the crystalline phases and the dipoles from other electrical units, such as the network modifier ions, which contribute to dielectric response. In the low frequencies region (< 10 Hz), and for all samples, a Maxwell / Wagner polarization type is observed and attributed to interfacial polarization between the sample surfaces and the electrodes. The theoretical fitting of impedance data for all these samples showed that the electrical circuit formed by the parallel between the resistance (R) and the CPE element (fig. 3.3) can describe the experimental data (these results are represented in fig. 4.7 by the lines). However, the correlation between the calculated values and the structural characteristics of the samples is not entirely clear due to the presence of the CPE empirical element, which can be associated with a relaxation time distribution. Typically, this element is related to the presence of electrical inhomogeneities in the sample surface. The main problem in using the
www.intechopen.com
Advances in Ceramics – Electric and Magnetic Ceramics, Bioceramics, Ceramics and Environment
240
CPE element is that the parameter Q0 does not have capacity dimensions. In fact, the parameter Q0, has units of Ω-1m-2Sn, which implies that its physical meaning depends on the value of the exponent n. For these 60SiLi samples the value of the parameter n is around 0.80, which indicates that the CPE element is approaching a capacitor. It was verified that the behavior of the CCPE
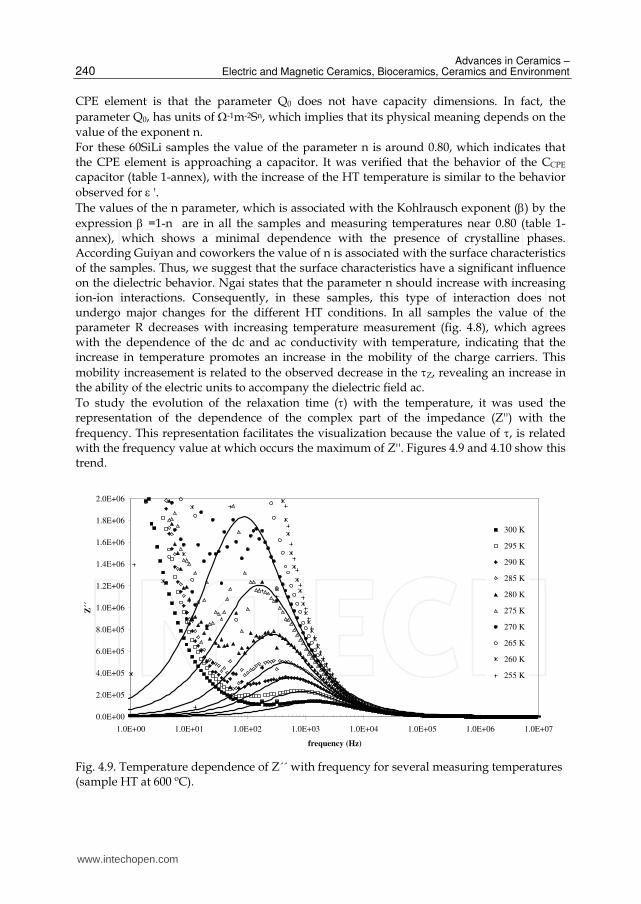
capacitor (table 1-annex), with the increase of the HT temperature is similar to the behavior observed for ε '. The values of the n parameter, which is associated with the Kohlrausch exponent (β) by the expression β =1-n are in all the samples and measuring temperatures near 0.80 (table 1-annex), which shows a minimal dependence with the presence of crystalline phases. According Guiyan and coworkers the value of n is associated with the surface characteristics of the samples. Thus, we suggest that the surface characteristics have a significant influence on the dielectric behavior. Ngai states that the parameter n should increase with increasing ion-ion interactions. Consequently, in these samples, this type of interaction does not undergo major changes for the different HT conditions. In all samples the value of the parameter R decreases with increasing temperature measurement (fig. 4.8), which agrees with the dependence of the dc and ac conductivity with temperature, indicating that the increase in temperature promotes an increase in the mobility of the charge carriers. This mobility increasement is related to the observed decrease in the τZ, revealing an increase in the ability of the electric units to accompany the dielectric field ac. To study the evolution of the relaxation time (τ) with the temperature, it was used the representation of the dependence of the complex part of the impedance (Z'') with the frequency. This representation facilitates the visualization because the value of τ, is related with the frequency value at which occurs the maximum of Z''. Figures 4.9 and 4.10 show this trend.
0.0E+00
2.0E+05
4.0E+05
6.0E+05
8.0E+05
1.0E+06
1.2E+06
1.4E+06
1.6E+06
1.8E+06
2.0E+06
1.0E+00 1.0E+01 1.0E+02 1.0E+03 1.0E+04 1.0E+05 1.0E+06 1.0E+07
frequency (Hz)
Z´´
300 K
295 K
290 K
285 K
280 K
275 K
270 K
265 K
260 K
255 K
Fig. 4.9. Temperature dependence of Z´´ with frequency for several measuring temperatures (sample HT at 600 ºC).
www.intechopen.com

Glass Ceramics with Para, Anti or Ferroelectric Active Phases
241
0.0E+00
1.0E+05
2.0E+05
3.0E+05
4.0E+05
5.0E+05
6.0E+05
7.0E+05
8.0E+05
9.0E+05
1.0E+06
1.0E+00 1.0E+01 1.0E+02 1.0E+03 1.0E+04 1.0E+05 1.0E+06 1.0E+07
frequency (Hz)
Z´´
300 k
295 K
290 K
285 K
280 K
275 K
270 K
265 K
260 K
Fig. 4.10. Temperature dependence of Z´´ with frequency for several measuring temperatures (sample HT at 650 ºC).
Based on the impedance data the dielectric permittivity was calculated. Table 1-annex shows the values of ε* and of the dielectric loss (tan δ ) for all temperatures of measurement. In table 4.2 we highlight the values of the dielectric permittivity and dielectric loss measured at 300 K and 1 kHz. Based on those values it is observed that the value of dielectric constant (ε ') increases with the increase of the HT temperature. The sample HT at 650 ºC presents the lowest value of dielectric loss.
Sample ε´ ε´´ tanδ
As-prepared 30,23 ± 0,67 46,24 ± 1,03 1,53 ± 0,05
600 35,07 ± 0,78 56,84 ± 1,26 1,62 ± 0,05
650 48,20 ± 1,15 51,55 ± 1,23 1,07 ± 0,04
Table 4.2 Real and imaginary part of the dielectric permittivity and the dielectric loss value measured at 1 kHz and 300 K.
Figures 4.11 to 4.13 show the TSDC spectra of the as-prepared sample and of the samples HT at 600 and 650 ºC, respectively. For a better view of the TSDC spectrum, is presented in each figure a zoom of the low temperature zone. All samples were polarized at the temperature of 350 K for 10 minutes, applying an electric field of 50 kV/m. In all spectra, the lines represent the theoretical fitting based on the process described in section 3.3.3.a. The as-prepared glass presents only one depolarization peak thermally activated while the samples heat treated show two peaks, the first center at low temperatures (< 230 K) and the second at higher temperatures (> 290 K). The characteristics of these peaks, visible in the figures, are registered in table 4.3. It is observed that the temperature of the peaks shift to
www.intechopen.com

Advances in Ceramics – Electric and Magnetic Ceramics, Bioceramics, Ceramics and Environment
242
higher temperatures with the increase of the thermal treatment temperature. The current value of both peaks, also decreases from the as-prepared sample to the sample HT at 650 ºC. The low temperature TSDC peak (P1) is attributed to localized movements of the network modifier ions. This movement gives rise to a orientated dipole formed by the network ion (Li + and / or Nb5 +) and the non-bridging oxygen (NBO-) to which it is connected. Note that in this situation the network modifier ion, structurally inserted in the glass matrix, is not in the more favorable energetically position. According to Agarwal and colleagues, applying an electric field it results in a ion transfer in the field direction, thus creating electrical heterogeneity, i.e., electric dipoles. With increasing temperature, these ions tend to return to its original position thereby creating a depolarization current that give origin to the low-temperature peak (P1). The activation energy associated with the orientation of this dipoles consists mostly on the energy required for the movement of these ions to different positions within the hollow structure in which it is. The values obtained for the activation energy associated with P1 (table 4.3), are lower than the values obtained for the dc process (Ea(dc) - table 4.1) but close to those obtained for ac conductivity (Ea(ac) - table 4.1) which suggests a possible relationship. Thus, the decrease in the P1 peak current (table 4.3), with the increase of the HT temperature, is due to the decrease of the number of dipoles related with the network modifier ions structurally inserted in the glass network. The temperature of the peak current corresponds to the transition temperature of the "freezing" state (non-equilibrium state), to the equilibrium state, analogous to what occurs in the glasses with the glass transition temperature. The shift of the temperature of the peak P1, with the increase of the HT temperature (table 4.3) should be, according to Agarwal results, associated with the reduction of the network modifier ions number. In this type of glasses, containing alkali ions, a second depolarization peak, centered at higher temperatures are attributed to dipolar depolarization from the movements of the charge carriers in limited pathways, which result from the presence in the glass of micro-heterogeneities. According to Hong these movements are mainly associated with the jumps of the network modifier ions within, between different positions, in the structural vacancies where it is. Thus, the dipoles formed between these ions and the NBO closer to each ion, it must produce a higher activation energy when compared with the one related with P1. This movement is generally associated with the dc conductivity, resulting in a spatial polarization (space-charge polarization). However, Agarwal states that this process must have activation energy lower than the dc activation energy, which in this case it was not verified. Thus, based on the values of the activation energy, we do not ascribe the peak P2 to space-charge depolarization but to the depolarization of the interfacial dipoles formed between the sample surfaces and the electrodes. The decrease of the temperature at which the peak P2 is detected, with the increase of the HT temperature, can be related to the observed decrease of the dielectric loss factor, which should reveal an increase in the number of dipoles. It is suggested that, in the as-prepared sample, this P2 peak should be detected at temperatures higher than the upper limit of our measurement system. Besides the P2 peak and with increasing temperature, is observed in all samples, an increasing of the current. This current, commonly referred as background current, was fitted to an Arrhenius expression (table 4.4) allowing to obtain the activation energy of this process, which decreases with the increase of the HT temperature (similar to that observed in the dc conductivity), indicating that in this temperature range the charge carriers present a higher mobility.
www.intechopen.com
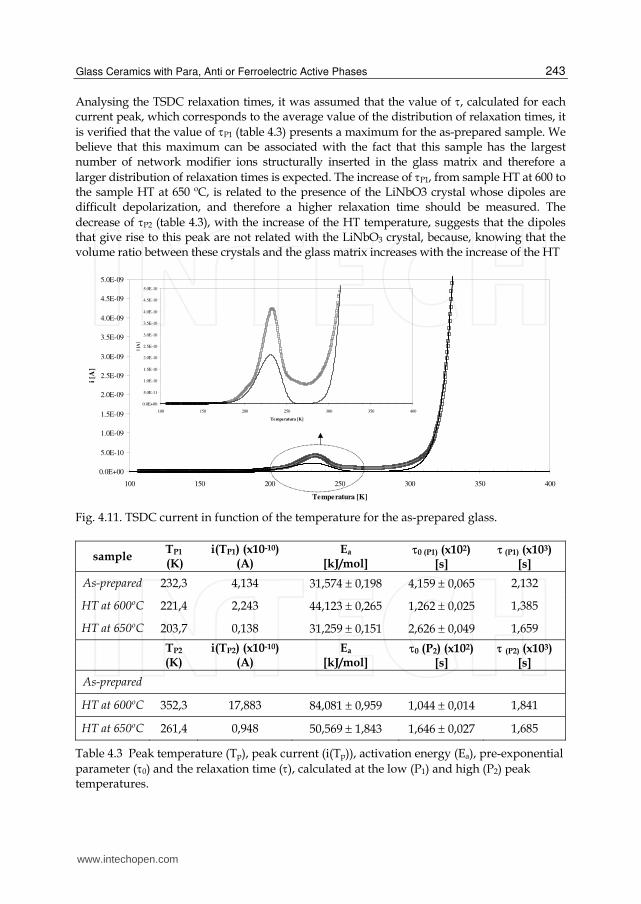
Glass Ceramics with Para, Anti or Ferroelectric Active Phases
243
Analysing the TSDC relaxation times, it was assumed that the value of τ, calculated for each current peak, which corresponds to the average value of the distribution of relaxation times, it is verified that the value of τP1 (table 4.3) presents a maximum for the as-prepared sample. We believe that this maximum can be associated with the fact that this sample has the largest number of network modifier ions structurally inserted in the glass matrix and therefore a larger distribution of relaxation times is expected. The increase of τP1, from sample HT at 600 to the sample HT at 650 ºC, is related to the presence of the LiNbO3 crystal whose dipoles are difficult depolarization, and therefore a higher relaxation time should be measured. The decrease of τP2 (table 4.3), with the increase of the HT temperature, suggests that the dipoles that give rise to this peak are not related with the LiNbO3 crystal, because, knowing that the volume ratio between these crystals and the glass matrix increases with the increase of the HT
0.0E+00
5.0E-10
1.0E-09
1.5E-09
2.0E-09
2.5E-09
3.0E-09
3.5E-09
4.0E-09
4.5E-09
5.0E-09
100 150 200 250 300 350 400
Temperatura [K]
i [A
]
0.0E+00
5.0E-11
1.0E-10
1.5E-10
2.0E-10
2.5E-10
3.0E-10
3.5E-10
4.0E-10
4.5E-10
5.0E-10
100 150 200 250 300 350 400
Temperatura [K]
i [A
]
Fig. 4.11. TSDC current in function of the temperature for the as-prepared glass.
sample TP1
(K) i(TP1) (x10-10)
(A) Ea
[kJ/mol] τ0 (P1) (x102)
[s] τ (P1) (x103)
[s]
As-prepared 232,3 4,134 31,574 ± 0,198 4,159 ± 0,065 2,132
HT at 600ºC 221,4 2,243 44,123 ± 0,265 1,262 ± 0,025 1,385
HT at 650ºC 203,7 0,138 31,259 ± 0,151 2,626 ± 0,049 1,659
TP2 (K)
i(TP2) (x10-10) (A)
Ea [kJ/mol]
τ0 (P2) (x102) [s]
τ (P2) (x103) [s]
As-prepared
HT at 600ºC 352,3 17,883 84,081 ± 0,959 1,044 ± 0,014 1,841
HT at 650ºC 261,4 0,948 50,569 ± 1,843 1,646 ± 0,027 1,685
Table 4.3 Peak temperature (Tp), peak current (i(Tp)), activation energy (Ea), pre-exponential parameter (τ0) and the relaxation time (τ), calculated at the low (P1) and high (P2) peak temperatures.
www.intechopen.com

Advances in Ceramics – Electric and Magnetic Ceramics, Bioceramics, Ceramics and Environment
244
temperature and that these crystals are difficult to depolarization, the relaxation time would be larger than the τP1. Thus, this relaxation time (τP2) should, as indicated, be associated with the depolarization produced by interfacial dipoles sample surface-electrode.
0.0E+00
5.0E-10
1.0E-09
1.5E-09
2.0E-09
2.5E-09
100 150 200 250 300 350 400
Temperatura [K]
i [A
]
0.0E+00
5.0E-11
1.0E-10
1.5E-10
2.0E-10
2.5E-10
100 150 200 250 300 350 400
Temperatura [K]
i [A
]
Fig. 4.12. TSDC current in function of the temperature for the sample HT at 600 ºC.
0.0E+00
2.0E-10
4.0E-10
6.0E-10
8.0E-10
1.0E-09
1.2E-09
1.4E-09
1.6E-09
1.8E-09
2.0E-09
100 150 200 250 300 350 400
Temperatura [K]
i [A
]
0.0E+00
1.0E-11
2.0E-11
3.0E-11
4.0E-11
5.0E-11
6.0E-11
7.0E-11
8.0E-11
9.0E-11
1.0E-10
150 170 190 210 230 250 270 290 310 330 350
Temperatura [K]
i [A
]
0.0E+00
2.0E-12
4.0E-12
6.0E-12
8.0E-12
1.0E-11
1.2E-11
1.4E-11
1.6E-11
1.8E-11
2.0E-11
150 170 190 210 230 250 270 290 310 330 350
Temperatura [K]
i [A
]
Fig. 4.13. TSDC current in function of the temperature for the sample HT at 650 ºC.
www.intechopen.com
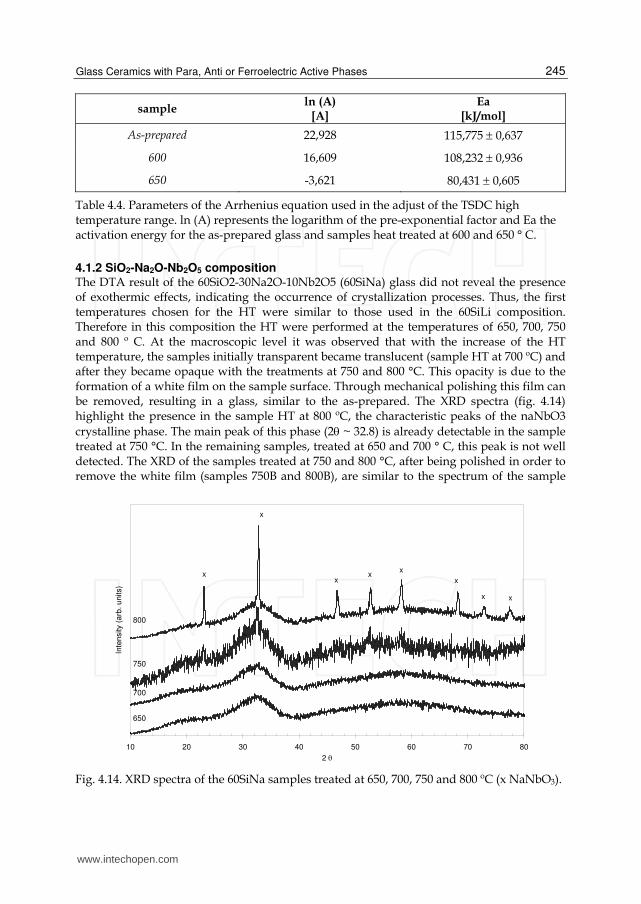
Glass Ceramics with Para, Anti or Ferroelectric Active Phases
245
sample ln (A)
[A] Ea
[kJ/mol]
As-prepared 22,928 115,775 ± 0,637
600 16,609 108,232 ± 0,936
650 -3,621 80,431 ± 0,605
Table 4.4. Parameters of the Arrhenius equation used in the adjust of the TSDC high temperature range. ln (A) represents the logarithm of the pre-exponential factor and Ea the activation energy for the as-prepared glass and samples heat treated at 600 and 650 ° C.
4.1.2 SiO2-Na2O-Nb2O5 composition The DTA result of the 60SiO2-30Na2O-10Nb2O5 (60SiNa) glass did not reveal the presence of exothermic effects, indicating the occurrence of crystallization processes. Thus, the first temperatures chosen for the HT were similar to those used in the 60SiLi composition. Therefore in this composition the HT were performed at the temperatures of 650, 700, 750 and 800 º C. At the macroscopic level it was observed that with the increase of the HT temperature, the samples initially transparent became translucent (sample HT at 700 ºC) and after they became opaque with the treatments at 750 and 800 °C. This opacity is due to the formation of a white film on the sample surface. Through mechanical polishing this film can be removed, resulting in a glass, similar to the as-prepared. The XRD spectra (fig. 4.14) highlight the presence in the sample HT at 800 ºC, the characteristic peaks of the naNbO3 crystalline phase. The main peak of this phase (2θ ~ 32.8) is already detectable in the sample treated at 750 °C. In the remaining samples, treated at 650 and 700 ° C, this peak is not well detected. The XRD of the samples treated at 750 and 800 °C, after being polished in order to remove the white film (samples 750B and 800B), are similar to the spectrum of the sample
10 20 30 40 50 60 70 80
2 θ
Inte
nsity (
arb
. u
nits)
700
650
800
750
x
x
xx
x
x
x x
Fig. 4.14. XRD spectra of the 60SiNa samples treated at 650, 700, 750 and 800 ºC (x NaNbO3).
www.intechopen.com

Advances in Ceramics – Electric and Magnetic Ceramics, Bioceramics, Ceramics and Environment
246
HT at 650 ºC. Thus it was found that the white film is due to the crystallization of NaNbO3 crystals. In these samples the XRD peak width at half height decreases with the increase of the HT temperature, indicating that the amount of crystalline phase precipitated in the glass matrix increases with the increase of the treatment temperature. Figure 4.15 shows the Raman spectra of all samples. In the samples spectra it was observe the existence of a band at 900-905 cm-1. A broad band centred at 288 cm-1, which disappears with the increase of the HT temperature, was observed in the as-prepared and 650 ºC HT samples. The spectrum of the sample HT at 700 ºC shows a band at 635-637 cm-1, which increases in intensity with the increase of the HT temperature. Similar behavior was observed for the band at 257-260 cm-1. In the sample HT at 750 ºC, Raman bands were detected at 291, 148 and 124 cm-1. In the Raman spectrum of the sample HT at 800 ºC were observed all bands detected in the sample HT at 750 ºC and also bands at 600, 455, 240, 215, and 192 cm-1. The SEM micrographs (fig. 4.16) showed the presence of particles with a size of about 200 nm dispersed on the surface of the sample HT at 650 ºC. These particles, with a cubic morphology increase in size and number with the increase of the HT temperature up to 750 º C. The sample treated at 800 °C shows, comparatively to the sample treated at 750 °C, a decrease in the number of particles but an increase in their size. These particles were only detected in the samples surface Figure 4.17 presents the optical appearance of 750 and 800 ºC HT samples cross section. In these images it is visible that the optical thickness of the white film increases with the increase of the HT temperature. The dependence of the dc conductivity (σdc) with temperature for all samples is shown in figures 4.18 and 4.19. In all samples, there is an increase in the σdc with the increase of the measurement temperature, characteristic of a thermal stimulated process. The σdc measured at 300 K (table 4.5), decreases with the increase of the heat-treatment temperature up to 750 ºC. The sample treated at 800 °C showed a σdc increasement. The σdc registered for the samples 750B and 800B (polished) is greater than that recorded for the samples HT at 750 and 800 ºC. The increase of the measurement temperature promotes an increase in energy of the charge carriers, which makes their jumping movement (hopping) through the potential barriers associated with the glass matrix easier, justifying the increase of the conductivity. At 300 K the decrease of σdc with the increase of the HT temperature up to 750 ºC (table 4.5), can be attributed to the decrease of the number of network modifier ions structurally inserted in the glass matrix (Na+ and Nb5+), main responsible for the charge carrier. It must be noticed that the non-observation in the Raman spectrum, of the band between 800-850 cm-1 (fig. 4.15), associated with the vibrations of Nb-O-Si bonds indicates that the niobium ions are inserted in glass matrix as network modifiers. The Raman spectrum of the crystalline NaNbO3 at room temperature, is characterized by the presence of bands associated with the vibration of octahedral NbO6 units, linked by the vertices, which is the case of the band at 630 cm-1 observed in the spectrum of the sample HT at 700 ºC. This band, attributed to vibrations of NbO6 octahedral connected by Nb-O-Nb bonds, indicates the early formation of the NaNbO3crystalline phase. The band in the region 900-905 cm-1 observed in all samples of the composition 60SiNa, but not detected in the spectrum of the NaNbO3 crystal, is typical of the vibrations of NbO6 isolated units. The decrease in the intensity of these bands, with the increase of the HT temperature, shows a progressive disappearance of these isolated units. The bands at 192, 148 and 124 cm-1, observed in the samples HT at 750 and
www.intechopen.com
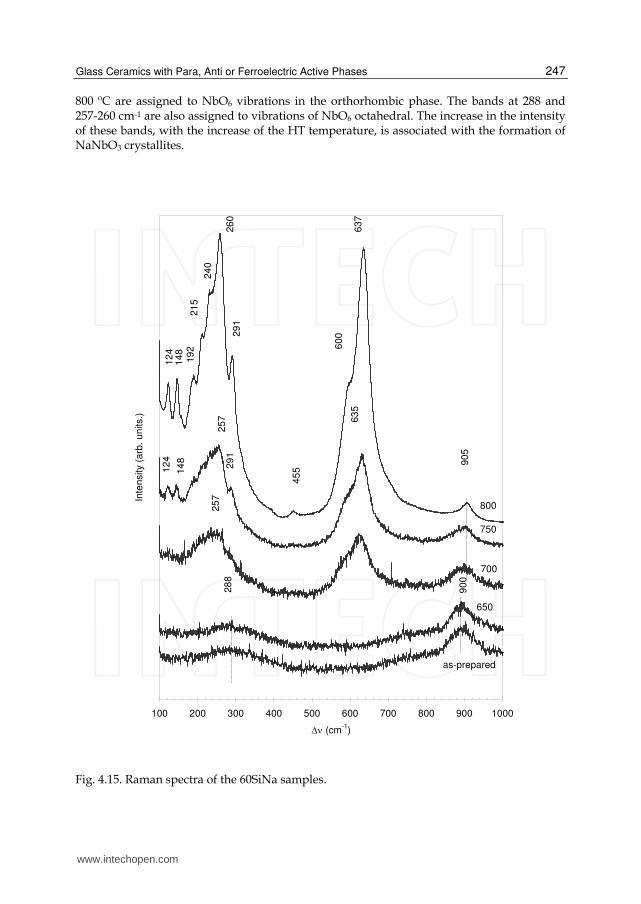
Glass Ceramics with Para, Anti or Ferroelectric Active Phases
247
800 ºC are assigned to NbO6 vibrations in the orthorhombic phase. The bands at 288 and 257-260 cm-1 are also assigned to vibrations of NbO6 octahedral. The increase in the intensity of these bands, with the increase of the HT temperature, is associated with the formation of NaNbO3 crystallites.
100 200 300 400 500 600 700 800 900 1000
Δν (cm-1
)
Inte
nsity (
arb
. u
nits.)
12
4
26
0
21
51
92
14
8
45
5
60
029
1
90
5
63
7
90
0
24
0
63
5
28
8
as-prepared
650
750
700
800
12
4
14
8
25
72
57
29
1
Fig. 4.15. Raman spectra of the 60SiNa samples.
www.intechopen.com

Advances in Ceramics – Electric and Magnetic Ceramics, Bioceramics, Ceramics and Environment
248
The calculated Ea(dc) showed that it decreases with the increase of the HT temperature up to the sample HT at 750 °C. The observed decrease of the Ea(dc), with the increase of the HT temperature, indicates a decrease in the height of the potential barriers, which strengthens the proposed justification for the main responsible factor for the σdc behavior, which is the number of network modifier ions structurally inserted in the glass matrix. The σdc is higher in the sample treated at 800 ºC than in the sample treated at 750 ºC indicating the presence of a higher number, in the sample HT at 800 ºC, of charge carriers. The SEM micrographs (fig. 4.16) shows that the particles observed in the sample surface of the sample HT at 800 ºC, when compared with the surface of the sample HT at 750 ºC, presents a higher size but in a lower number. A comparative analysis between these two samples suggests that the
(a) (b) (c)
(d) (e)
Fig. 4.16. SEM micrographs of: (a) as-prepared; (b) HT 650; (c) HT 700; (d) HT 750; (e) HT 800 ºC.
Fig. 4.17. Optical photographs of the cross section of the 60SiNa samples surface treated at 750 and 800 ºC (a - crystalline zone (film), b - glass matrix). 20x magnification.
www.intechopen.com
Glass Ceramics with Para, Anti or Ferroelectric Active Phases
249
volume ratio between particles and glass matrix decreases from the sample HT at 750 to the sample HT at 800 ºC. Thus, the sample HT at 800 ºC, should have a greater number of network modifier ions, structurally inserted in the glass matrix, justifying the increase in the conductivity and as well in the dielectric constant value (table 4.6). The samples that, after the heat treatment, were polished in order to remove the white surface film (sample 750B and 800B), show an increase in the dc conductivity from the sample 750B to the sample 800B, suggesting the existence of a higher number of charge carriers in the second sample. When compared with the correspondent samples, not polished, the 750B and 800B samples show a higher conductivity which can be related with the absence on the surface of NaNbO3 crystals which will facilitate the conduction process. The samples 750B and 800B have a Ea(dc)
similar to the sample HT at 750 ºC but below the value obtained for the sample HT at 800 ºC. The ac conductivity (σac), at 300 K and 1 kHz, decreases with the increase of the HT temperature up to 750 ºC (table 4.5). Samples 750B and 800B have similar σac but different from the value measured in the correspondent samples without being polished. With the increase of the measuring temperature there is, in all samples, an increase in the σac. The ac activation energy (Ea(ac)), calculated based on the dependence of ln(σac) with 1/T (fig. 4.20), is maximum for the as-prepared sample. The samples HT at 650 and 700 ºc have similar values of Ea(ac). The same behavior was observed for the samples HT at 750 and 800 ºC (table 4.5). The samples 750B and 800B present values of Ea(ac) similar but higher than the correspondent samples without the surface polishing. Figure 4.20 shows the variation of ac conductivity with the temperature of measurement for the as-prepared sample, at several frequencies. It is observed that with the increase of the frequency the value of σac increases and the value of Ea(ac) decreases. This behavior is similar to all the other samples. In materials where the conduction process is essentially the ionic, the ac conduction mechanism can also be reproduced by the “jump” model of the charge carriers over potential barriers. From the dependence of the σac with the temperature of measurement (fig. 4.20), we obtained the values of Ea(ac) and it was observed that it decreases from the as-prepared sample to the sample HT at 650 ºC (table 4.5). In the other samples the value of Ea(ac) is very similar, i.e., it varies between 33 and 35 kJ/mol. This indicates that with the increase of the thermal treatment temperature, there is an initial decrease in the height of the potential barriers, which then remain almost independent of the treatment temperature. From this we can deduce that the samples heat treated, the network modifier ions structurally inserted in the glass matrix present a similar mobility suggesting that the observed decrease of σac, with the increase of the HT temperature, is due to the decrease of those ions number. It is also verified that in each sample the value of Ea(ac) is less than the value of Ea(dc) for the same sample. This shows that the electrons have to overcome different potential barriers when they relax (ac process) or when they participate in a long range process (dc process). The optical photographs (fig. 4.17) show that increasing the thermal treatment temperature promotes an increase in the thickness of the surface film. These structural characteristic suggests that the electrical equivalent circuit model, shown in figure 4.22, can describe the electrical and dielectric properties of these samples. In the dielectric analysis, the electric circuit comes down to a combination of three capacitors in series: two related with the sample surfaces and the third with the bulk characteristics. Knowing that the thickness of the samples are about 1.0 mm, the thickness of the film is about 150μ m (observed in sample HT at 800 ºC), the dielectric constant (ε ') of NaNbO3 is
www.intechopen.com

Advances in Ceramics – Electric and Magnetic Ceramics, Bioceramics, Ceramics and Environment
250
-24
-22
-20
-18
-16
-14
-12
-10
2.6 2.8 3 3.2 3.4 3.6 3.8 4 4.2
1000/T (K-1
)
ln( σ d
c) (S
m-1
)
as-prepared
700
750
800
i (
Fig. 4.18. ln(σdc) versus 1000/T for the 60SiNa samples: as-prepared and HT at temperatures between 650 and 800 ºC.
-20
-19
-18
-17
-16
-15
-14
-13
2.9 3.0 3.1 3.2 3.3 3.4 3.5 3.6 3.7
1000/T [K-1
]
ln( σ d
c)
[Sm
-1]
750
750B
800
800B
Linear (800B)
Linear (750B)
Linear (750)
Linear (800)
Fig. 4.19. ln(σdc) versus 1000/T for the 60SiNa samples HT at 750 and 800, with and without the white film (this samples are named 750B and 800B, respectively).
www.intechopen.com

Glass Ceramics with Para, Anti or Ferroelectric Active Phases
251
-16
-15.5
-15
-14.5
-14
-13.5
-13
-12.5
-12
3.1 3.2 3.3 3.4 3.5 3.6 3.7
1000/T [K-1
]
ln( σ a
c) [
Sm
-1]
as-prep
650
700
750
800
750B
800B
Fig. 4.20. ln(σac) versus 1000/T for all the 60SiNa composition samples.
-16
-15
-14
-13
-12
-11
-10
-9
-8
3.1 3.2 3.3 3.4 3.5 3.6 3.7
1000/T [K-1
]
ln (
σ ac) [
S/m
]
1 kHz
10 kHz
100 kHz
1 MHz
Li (1
39,31 kJ/mol
31,55 kJ/mol
15,46 kJ/mol
4,74 kJ/mol
Fig. 4.21. ln(σac) versus 1000/T for the as-prepared sample, at several frequencies.
www.intechopen.com

Advances in Ceramics – Electric and Magnetic Ceramics, Bioceramics, Ceramics and Environment
252
Sample σdc (x10-8)
[Sm-1]
Ea(dc)
[kJ/mol] σac (x10-7)
[Sm-1]
Ea(ac)
[kJ/mol]
as-prepared 10,55 ± 0,24 64,63 ± 0,91 12,2 ± 0,27 39,31 ± 0,98
650 7,25 ± 0,27 62,48 ± 0,74 7,37 ± 0,28 35,27 ± 0,17
700 6,56 ± 0,16 59,65 ± 0,71 6,59 ± 0,16 35,43 ± 0,97
750 4,76 ± 0,15 58,34 ± 0,67 5,57 ± 0,17 32,13 ± 0,66
800 8,17 ± 0,24 62,90 ± 0,67 8,36 ± 0,28 33,05 ± 0,64
750B 8,82 ± 0,23 59,63 ± 0,59 6,47 ± 0,17 35,83 ± 0,96
800B 10,30 ± 0,33 58,38 ± 0,63 7,07 ± 0,22 36,12 ± 1,50
Table 4.5. dc conductivity (σdc), at 300 K, dc activation energy (Ea(dc)), ac conductivity, at 300 K and 1 kHz, ac activation energy (Ea(ac)) for all 60SiNa samples.
Fig. 4.22. Equivalent electric circuit model: i) sample (a – surface; b – bulk); ii) electric model where Ra and Ca represent the resistance and the capacity related with the sample surface characteristics, Rb and Cb the resistance and capacity related to the bulk characteristics; iii) approximate model.
approximately 600 at 300 K and 1 kHz, being much higher than the ε ' of the bulk sample zone, assumed to consist mainly on glass matrix (
2
´ 4.0SiOε ≈ ), it is reasonable consider that
the dielectric behavior can be controlled by the characteristics of the bulk. Briefly, the analysis of the electrical circuit consisting of three capacitors in series shows that the
equivalent capacity is 2
a beq
a b
C CC
C C= + . If we consider that Ca >> Cb than eq bC C≈ .
The decrease of the dielectric constant (ε'), with the increase of the HT temperature up to 750 º C (table 4.5), can be related to the decrease of the number of dipoles existing in the bulk. The similarity between the values of ε' of the samples treated at 750 and 800 ºC with and without the surface film indicates that the surface film, associated with NaNbO3 crystal precipitation does not exert great influence on the dielectric properties, which corroborates the equivalent electrical circuit model proposed (fig. 4.22). The dielectric constant of the sample HT 800 ºC is, at room temperature, the highest of all samples of this composition (table 4.5). This result should be expected due to the NaNbO3 layer thickness increase, decreasing the thickness of the bulk zone and therefore increasing the capacity. Furthermore, according to the analysis of the dc and ac conductivities, it is assumed the
www.intechopen.com

Glass Ceramics with Para, Anti or Ferroelectric Active Phases
253
existence in the bulk zone of the sample HT at 800 ºC of a larger number of network modifier ions, structurally inserted in the glass network, resulting in an increase of the ε' value. The remotion of the white surface film of the sample treated at 800 ºC leads to a decrease of ε ', justified by the sample thickness decreasement.
Sample ε´ ε´´ tanδ
As-prepared 25,21 ± 0,57 21,86 ± 0,49 0,87 ± 0,03
650 23,50 ± 0,88 13,26 ± 0,50 0,56 ± 0,03
700 22,01 ± 0,55 11,85 ± 0,29 0,54 ± 0,02
750 20,19 ± 0,63 11,65 ± 0,30 0,50 ± 0,02
800 28,47 ± 0,96 15,04 ± 0,51 0,53 ± 0,03
750B 20,37 ± 0,52 11,65 ± 0,30 0,57 ± 0,02
800B 21,37 ± 0,68 12,71 ± 0,40 0,60 ± 0,03
Table 4.5. Real and imaginary part of the permittivity and the dielectric loss, for all samples, measured at 300 K and 1 kHz.
Figure 4.23 presents the Z´´ versus Z’ spectrum, measured at 300 K, for all samples. This spectrum shows semi-arches whose centers are under the Z´ axis, which indicates the existence of a distribution of relaxation time. The existence of this distribution must be connected to the fact that the dielectric response of these samples presents several contributions. Among these contributions we have the glass matrix, the crystalline phase and the dipoles associated with other electrical units (ions) present in the matrix. For frequencies < 10 Hz the samples show dispersion in the impedance spectra. This phenomenon, attributed to the presence of interfacial dipoles sample/electrode (Maxwell-Wagner effect). The theoretical fitting of the frequency dependence of the complex impedance (Z*), using the CNLLS algorithm, reveals that the electrical circuit formed by the parallel between a resistance (R) and a CPE element is an equivalent circuit which describes reasonably well the measured data. However, the correlation between the characteristic parameters of this circuit (R, Q0 and n - table 2-annex) and the structural characteristics of the samples is not evident due to the presence of the CPE element. This element is a parameter dependent on the frequency and associated with a distribution of relaxation times is usually related to the presence of electrical inhomogeneities in the sample surface. In these samples, these surface heterogeneities can be related to the simultaneous presence on the surface of particles and glass matrix. Nevertheless, the behavior of the parameter R, with increasing annealing temperature (fig. 4.24), is similar to that observed in electrical conductivity (table 4.5). Thus, the increase of the R parameter with the increase of the HT temperature up to 750 ºC can be associated with the decrease of the number of network modifier ions and consequent increase in the number of surface particles. Therefore, and according to the electric model assumed (fig. 4.22), an increase in the resistivity of the bulk is mainly justified by a decrease in the number of modifier ions structurally inserted in the glass matrix. Please note that the logarithmic representation of the parameter R as a function of measurement temperature (fig. 4.24), for all samples is almost linear. However, it
www.intechopen.com

Advances in Ceramics – Electric and Magnetic Ceramics, Bioceramics, Ceramics and Environment
254
increases with the increase of the measuring temperature, which indicates that this temperature increasement promotes an increase of the charge carriers energy, thereby increasing their mobility. This hypothesis is also supported by the decreased of τZ (fig. 4.28), in the same experimental conditions (table 2-annex), indicating an increased capacity of the dielectric units to follow the ac electric field. The calculated values of all parameters are registered in table 2-annex. From those results, it was also observed that the Q0 parameter is between 3.78x10⁻⁹ and 6.16x10 9 and the n parameter is between 0.80 and 0.85. Moreover, the value of the CCPE capacitor is between 1.0 nF and 1.8 nF, approximately. One approach to analyze the dielectric relaxation phenomena can be by using the Z´´ versus frequency representation (figs. 4.25 to 4.27). In these figures the lines represent the result of the CNLLS adjustment of the experimental data to the R//CPE equivalent electrical circuit. The frequency at which the Z´´ peak appears is associated with the parameter τZ (table 2-annex). This parameter corresponds to the most probable relaxation time or, in other words, to the relaxation time distribution average. It was observed that the value of τZ for the samples 750B and 800B is higher than that the one for the correspondent samples with the white film. This indicates that the dipoles associated with the NaNbO3 crystallites, have a relaxation time higher than the dipoles present in the sample bulk. The τZ of the sample HT at 750 ºC is smaller than the one of the sample HT at 800 ºC, suggesting the existence of a larger number of dipoles associated with the NaNbO3 crystalline phase in the sample HT 750. This assumption is consistent with the SEM micrographs, which shows a larger number of particles in the sample HT 750. Nevertheless, the values of τZ are very high (~10-4 s - table 2-annex) when compared with the relaxation times of dipoles associated with network modifier ions structurally inserted in the glass matrix (~ 10-11s), showing the large influence of the glass matrix on the electrical properties.
0.0E+00
2.0E+05
4.0E+05
6.0E+05
8.0E+05
1.0E+06
1.2E+06
1.4E+06
1.6E+06
1.8E+06
2.0E+06
0.0E+00 5.0E+05 1.0E+06 1.5E+06 2.0E+06 2.5E+06 3.0E+06 3.5E+06 4.0E+06
Z´
Z´´
as-prep.
650
700
750
800
750B
800B
Theoric
Theoric
Theoric
Fig. 4.23. Z´versus Z´´, at 300K, for all 60SiNa samples.
www.intechopen.com

Glass Ceramics with Para, Anti or Ferroelectric Active Phases
255
5.6
5.8
6
6.2
6.4
6.6
6.8
3.15 3.2 3.25 3.3 3.35 3.4 3.45 3.5 3.55
1000/T [K-1
]
log (
R)
as-prepared
650
700
750
800
750B
800B
Fig. 4.24. log(R) versus 1000/T for all 60SiNa samples.
0.0E+00
5.0E+05
1.0E+06
1.5E+06
2.0E+06
2.5E+06
1.E-01 1.E+00 1.E+01 1.E+02 1.E+03 1.E+04 1.E+05 1.E+06 1.E+07
frequência [Hz]
Z´´
315 K
310 K
305 K
300 K
295 K
290 K
285 K
280 K
Série2
Série9
Theoric
Theoric
Theoric
Theoric
Fig. 4.25. Z´´ versus frequency of the sample HT at 650 ºC, for several measuring temperatures.
www.intechopen.com

Advances in Ceramics – Electric and Magnetic Ceramics, Bioceramics, Ceramics and Environment
256
0.0E+00
5.0E+05
1.0E+06
1.5E+06
2.0E+06
2.5E+06
1.0E-01 1.0E+00 1.0E+01 1.0E+02 1.0E+03 1.0E+04 1.0E+05 1.0E+06 1.0E+07
frequência [Hz]
Z´´
315 K
310 K
305 K
300 K
295 K
290 K
285 K
280 K
275 K
270 K
Série11
Série12
Série13
Série14
Série15
Série16
Fig. 4.26. Z´´ versus frequency of the sample HT at 800 ºC, for several measuring temperatures.
0.0E+00
2.0E+05
4.0E+05
6.0E+05
8.0E+05
1.0E+06
1.2E+06
1.4E+06
1.6E+06
1.8E+06
2.0E+06
1.0E-01 1.0E+00 1.0E+01 1.0E+02 1.0E+03 1.0E+04 1.0E+05 1.0E+06 1.0E+07
frequência [Hz]
Z´´
315 K
310 K
305 K
300 K
295 K
290 K
285 K
280 K
275 K
Série10
Série11
Série12
Série13
Série14
Série15
Fig. 4.27. Z´´ versus frequency of the sample 800B, for several measuring temperatures.
www.intechopen.com

Glass Ceramics with Para, Anti or Ferroelectric Active Phases
257
-4
-3.8
-3.6
-3.4
-3.2
-3
-2.8
-2.6
3.15 3.2 3.25 3.3 3.35 3.4 3.45 3.5 3.55
1000/T [K-1
]
log
(τ Z)
as-prepared
650
700
750
800
750B
800B
Fig. 4.28. ln(τZ) versus 1000/T for all 60SiNa composition samples.
Figures 4.29 to 4.33 show the TSDC spectra of samples of the 60SiNa composition. All samples were polarized at the temperature of 350 K, for 10 minutes, applying a dc electric field of 100 kV/m. The heating rate used was 4 °C/min. In all spectra, the lines represent the theoretical fit result. The TSDC results showed that the samples HT at 650, 750 ºC and 800B present two thermally stimulated depolarization peaks. In the other samples, it was registered only one current peak. However, it is important to note that in these samples after reaching the peak, the current decreases very slowly, i.e., the slope is smaller than one would expect theoretically. This suggests the possible existence of at least one second peak current masked by the high value of the first. The hypothesis of the presence of depolarization mechanisms not observed is also justified by the bad adjustment of the theoretical model used to the experimental data. This bad adjustment indicates the presence of other depolarization mechanism(s), which corroborates the results obtained as a function of the frequency in which it was detected the existence of a relaxation times distribution. The characteristics of these peaks can be found in table 4.6. It was observed that the temperature at which the peak current occurs increases with the increase of the HT temperature, except for the sample HT at 750 °C which shows the minimum value of current. The temperature of this peak decreases from sample 750B to sample 800B. The obtained values (table 4.6) do not allow a correspondence between the relaxation peak to a particular type of dipole. It is known that in these glasses and glass ceramics, the "units" that can give rise to peaks of thermally stimulated depolarization are the network modifier ions (Na+ and Nb5+), the particles and the glass network itself. We therefore believe that the most likely hypothesis that can explain the origin of the peaks observed is the dipoles formed by the network modifier ions because the glass matrix should present a thermally stimulated relaxation time very high, not giving rise to
www.intechopen.com

Advances in Ceramics – Electric and Magnetic Ceramics, Bioceramics, Ceramics and Environment
258
relaxation peak but to a broad band. The particles, which are associated with NaNbO3 crystals should also not contribute significantly to the depolarization current peaks because in the sample 800B, which does not contain the surface film (i.e., does not contain NaNbO3 particles), were also detected two depolarization peaks. The activation energy (Ea) for each current peak, can be found in table 4.6. For the low temperature current peak, the value of Ea is larger in the as-prepared sample than in the sample HT at 650 ºC. With the increase of the HT temperature up to 750 ºC, there is a decrease in Ea. In the samples where two depolarization peaks were observed (HT 650, HT 750 and 800B) the activation energy associated with the first peak is always higher than that associated with the second. The relaxation time (τ), associated with the low current TSDC peak decreases from the as-prepared glass to the sample HT at 650 ºC and the increases with the increase of the HT temperature up to 750 ºC (table 4.6). The relaxation time associated with the first peak of depolarization is always smaller than the relaxation time associated with the peak depolarization of the higher temperature. With increasing measurement temperature the depolarization current increases in a way that can be adjusted to an Arrhenius expression. The characteristics of this adjustment are recorded in table 4.7. The Ea associated with this high temperature process is superior to any other TSDC process detected.
0.0E+00
5.0E-09
1.0E-08
1.5E-08
2.0E-08
2.5E-08
3.0E-08
3.5E-08
4.0E-08
4.5E-08
5.0E-08
100 150 200 250 300 350 400
Temperatura [K]
i [A
]
0.0E+00
1.0E-10
2.0E-10
3.0E-10
4.0E-10
5.0E-10
6.0E-10
7.0E-10
8.0E-10
9.0E-10
100 150 200 250 300 350 400
Temperatura [K]
i [A
]
0.0E+00
5.0E-09
1.0E-08
1.5E-08
2.0E-08
2.5E-08
3.0E-08
3.5E-08
4.0E-08
4.5E-08
5.0E-08
100 150 200 250 300 350 400
Temperatura [K]
i [A
]
0.0E+00
1.0E-10
2.0E-10
3.0E-10
4.0E-10
5.0E-10
6.0E-10
7.0E-10
8.0E-10
9.0E-10
100 150 200 250 300 350 400
Temperatura [K]
i [A
]
0.0E+00
1.0E-10
2.0E-10
3.0E-10
4.0E-10
5.0E-10
6.0E-10
7.0E-10
8.0E-10
9.0E-10
100 150 200 250 300 350 400
Temperatura [K]
i [A
]
Fig. 4.29. TSDC spectra of the as-prepared sample (60SiNa composition).
www.intechopen.com

Glass Ceramics with Para, Anti or Ferroelectric Active Phases
259
0.0E+00
1.0E-09
2.0E-09
3.0E-09
4.0E-09
5.0E-09
6.0E-09
7.0E-09
8.0E-09
9.0E-09
1.0E-08
100 150 200 250 300 350 400
Temperatura [K]
i [A
]
0.0E+00
1.0E-11
2.0E-11
3.0E-11
4.0E-11
5.0E-11
6.0E-11
7.0E-11
8.0E-11
9.0E-11
1.0E-10
100 150 200 250 300 350 400
Temperatura [K]
i [A
]
0.0E+00
1.0E-09
2.0E-09
3.0E-09
4.0E-09
5.0E-09
6.0E-09
7.0E-09
8.0E-09
9.0E-09
1.0E-08
100 150 200 250 300 350 400
Temperatura [K]
i [A
]
0.0E+00
1.0E-11
2.0E-11
3.0E-11
4.0E-11
5.0E-11
6.0E-11
7.0E-11
8.0E-11
9.0E-11
1.0E-10
100 150 200 250 300 350 400
Temperatura [K]
i [A
]
Fig. 4.30. TSDC spectra of the HT 750 ºC sample (60SiNa composition).
0.0E+00
5.0E-08
1.0E-07
1.5E-07
2.0E-07
2.5E-07
3.0E-07
3.5E-07
4.0E-07
4.5E-07
5.0E-07
100 150 200 250 300 350 400
Temperatura [K]
i [A
]
0.0E+00
2.0E-10
4.0E-10
6.0E-10
8.0E-10
1.0E-09
1.2E-09
1.4E-09
100 150 200 250 300 350 400
Temperatura [K]
i [A
]
0.0E+00
5.0E-08
1.0E-07
1.5E-07
2.0E-07
2.5E-07
3.0E-07
3.5E-07
4.0E-07
4.5E-07
5.0E-07
100 150 200 250 300 350 400
Temperatura [K]
i [A
]
0.0E+00
2.0E-10
4.0E-10
6.0E-10
8.0E-10
1.0E-09
1.2E-09
1.4E-09
100 150 200 250 300 350 400
Temperatura [K]
i [A
]
Fig. 4.31. TSDC spectra of the HT at 800 ºC sample (60SiNa composition).
www.intechopen.com

Advances in Ceramics – Electric and Magnetic Ceramics, Bioceramics, Ceramics and Environment
260
0.0E+00
2.0E-09
4.0E-09
6.0E-09
8.0E-09
1.0E-08
1.2E-08
1.4E-08
1.6E-08
1.8E-08
2.0E-08
100 150 200 250 300 350 400
Temperatura [K]
i [A
]
0.0E+00
2.0E-10
4.0E-10
6.0E-10
8.0E-10
1.0E-09
1.2E-09
1.4E-09
100 150 200 250 300 350 400
Temperatura [K]
i [A
]
Fig. 4.32. TSDC spectra of the 750B sample (60SiNa composition).
0.0E+00
2.0E-08
4.0E-08
6.0E-08
8.0E-08
1.0E-07
1.2E-07
1.4E-07
1.6E-07
1.8E-07
2.0E-07
100 150 200 250 300 350 400
Temperatura [K]
i [A
]
0.0E+00
2.0E-10
4.0E-10
6.0E-10
8.0E-10
1.0E-09
1.2E-09
100 150 200 250 300 350 400
Temperatura [K]
i [A
]
Fig. 4.33. TSDC spectra of the 800B sample (60SiNa composition).
www.intechopen.com

Glass Ceramics with Para, Anti or Ferroelectric Active Phases
261
Sample TP1 (K)
i(TP1) x10-10 (A)
Ea [kJ/mol]
τ0 (P1) (x102) [s]
τ(P1) (x103) [s]
as-prepared 259,8 6,43 45,17 ± 0,59 2,30 ± 0,04 1,86
650 263,9 5,11 51,27 ± 0,15 1,64 ± 0,03 1,69
700 271,7 5,40 47,72 ± 0,21 2,34 ± 0,04 1,93
750 246,3 0,47 36,72 ± 0,38 3,43 ± 0,05 2,06
800 278,3 13,37 50,80 ± 0,36 2,12 ± 0,03 1,90
750B 279,0 11,16 57,44 ± 0,37 1,42 ± 0,02 1,69
800B 262,0 9,80 52,69 ± 0,34 1,45 ± 0,02 1,63
TP2 (K)
i(TP2) x10-10 (A)
Ea [kJ/mol]
τ0 (P2) (x103) [s]
τ(P2) (x104) [s]
as-prepared -- -- -- -- --
650 317,2 1,82 11,35 ± 3,56 7,20 ± 0,05 1,11
700 -- -- -- -- --
750 263,6 0,63 12,71 ± 1,01 4,16 ± 0,04 0,72
800 -- -- -- -- --
750B -- -- -- -- --
800B 315,9 5,89 16,61 ± 0,19 3,98 ± 0,03 0,75
Table 4.6. Peak temperature (Tp), peak current (i(Tp)), activation energy (Ea), pré-exponential parameter (τ0) and relaxation time (τ), calculated on the low temperature peak (TP1) and in the high temperature peak (TP2).
Sample ln (A)
[A] Ea
[kJ/mol]
as-prepared 20,79 ± 0,28 122,88 ± 0,92
650 20,67 ± 0,45 119,80 ± 1,35
700 26,60 ± 1,04 143,66 ± 3,26
750 8,92 ± 0,23 89,63 ± 0,69
800 26,62 ± 0,39 134,44 ± 1,23
750B 13,07 ± 0,44 97,73 ± 1,30
800B 33,92 ± 0,11 157,87 ± 0,33
Table 4.7. Parameters of the Arrhenius equation used in the adjust of the TSDC high temperature range. ln (A) represents the logarithm of the pre-exponential factor and Ea the activation energy
www.intechopen.com
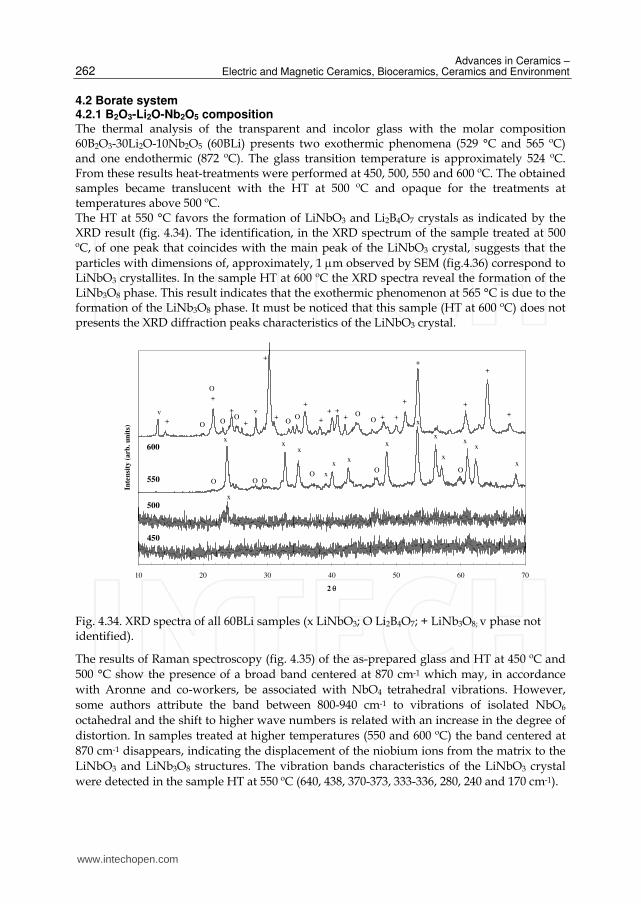
Advances in Ceramics – Electric and Magnetic Ceramics, Bioceramics, Ceramics and Environment
262
4.2 Borate system 4.2.1 B2O3-Li2O-Nb2O5 composition The thermal analysis of the transparent and incolor glass with the molar composition 60B2O3-30Li2O-10Nb2O5 (60BLi) presents two exothermic phenomena (529 °C and 565 ºC) and one endothermic (872 ºC). The glass transition temperature is approximately 524 ºC. From these results heat-treatments were performed at 450, 500, 550 and 600 ºC. The obtained samples became translucent with the HT at 500 ºC and opaque for the treatments at temperatures above 500 ºC. The HT at 550 °C favors the formation of LiNbO3 and Li2B4O7 crystals as indicated by the XRD result (fig. 4.34). The identification, in the XRD spectrum of the sample treated at 500 ºC, of one peak that coincides with the main peak of the LiNbO3 crystal, suggests that the particles with dimensions of, approximately, 1 μm observed by SEM (fig.4.36) correspond to LiNbO3 crystallites. In the sample HT at 600 ºC the XRD spectra reveal the formation of the LiNb3O8 phase. This result indicates that the exothermic phenomenon at 565 °C is due to the formation of the LiNb3O8 phase. It must be noticed that this sample (HT at 600 ºC) does not presents the XRD diffraction peaks characteristics of the LiNbO3 crystal.
10 20 30 40 50 60 70
2 θ
Inte
nsi
ty (
arb
. u
nit
s)
450
500
550
x
xx
x
x
xx
x
x
x
x
xx
x
O OO
O O
O
+
+
+
+
+
++
+ + ++
600
OO
OO
O OO
+
+
++
++
O
+v v
Fig. 4.34. XRD spectra of all 60BLi samples (x LiNbO3; O Li2B4O7; + LiNb3O8; v phase not identified).
The results of Raman spectroscopy (fig. 4.35) of the as-prepared glass and HT at 450 ºC and 500 °C show the presence of a broad band centered at 870 cm-1 which may, in accordance with Aronne and co-workers, be associated with NbO4 tetrahedral vibrations. However, some authors attribute the band between 800-940 cm-1 to vibrations of isolated NbO6 octahedral and the shift to higher wave numbers is related with an increase in the degree of distortion. In samples treated at higher temperatures (550 and 600 ºC) the band centered at 870 cm-1 disappears, indicating the displacement of the niobium ions from the matrix to the LiNbO3 and LiNb3O8 structures. The vibration bands characteristics of the LiNbO3 crystal were detected in the sample HT at 550 ºC (640, 438, 370-373, 333-336, 280, 240 and 170 cm-1).
www.intechopen.com

Glass Ceramics with Para, Anti or Ferroelectric Active Phases
263
100 200 300 400 500 600 700 800 900 1000
Raman Shift (cm-1
)
Inte
nsi
ty (
arb.
un
its)
35
0
240
140
162
199 20
92
24
26
328
0
361
383
42
3
547
631
684
704
730
78
3
82
3
900
24
0
66
0
710
870
955
17
0 336
280
438
640
370
24
0
as-prepared
450
500
550
600
LiNbO3
Fig. 4.35. Raman spectra of the 60BLi samples and of high-purity LiNbO3 powder.
www.intechopen.com
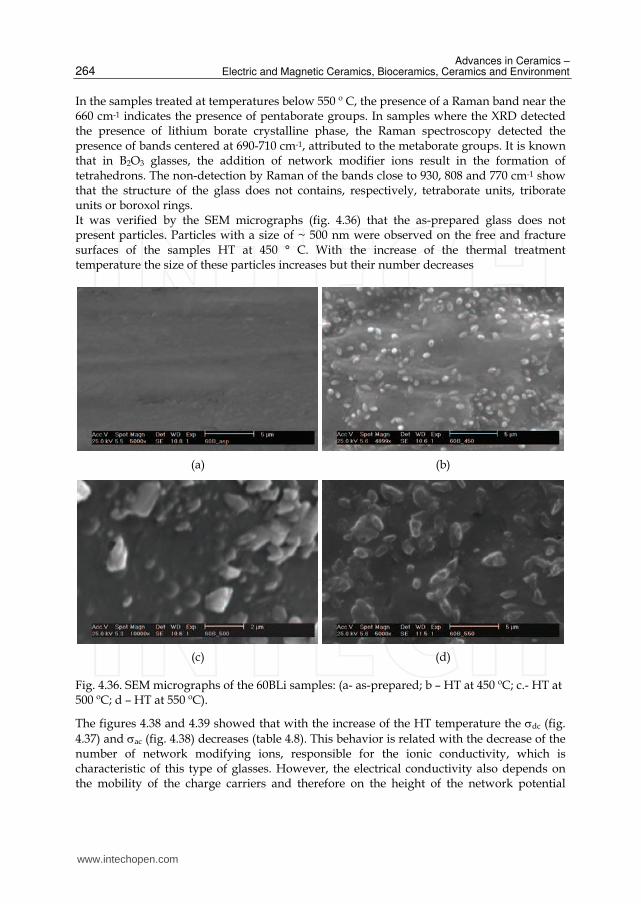
Advances in Ceramics – Electric and Magnetic Ceramics, Bioceramics, Ceramics and Environment
264
In the samples treated at temperatures below 550 º C, the presence of a Raman band near the 660 cm-1 indicates the presence of pentaborate groups. In samples where the XRD detected the presence of lithium borate crystalline phase, the Raman spectroscopy detected the presence of bands centered at 690-710 cm-1, attributed to the metaborate groups. It is known that in B2O3 glasses, the addition of network modifier ions result in the formation of tetrahedrons. The non-detection by Raman of the bands close to 930, 808 and 770 cm-1 show that the structure of the glass does not contains, respectively, tetraborate units, triborate units or boroxol rings. It was verified by the SEM micrographs (fig. 4.36) that the as-prepared glass does not present particles. Particles with a size of ~ 500 nm were observed on the free and fracture surfaces of the samples HT at 450 ° C. With the increase of the thermal treatment temperature the size of these particles increases but their number decreases
(a) (b)
(c) (d)
Fig. 4.36. SEM micrographs of the 60BLi samples: (a- as-prepared; b – HT at 450 ºC; c.- HT at 500 ºC; d – HT at 550 ºC).
The figures 4.38 and 4.39 showed that with the increase of the HT temperature the σdc (fig. 4.37) and σac (fig. 4.38) decreases (table 4.8). This behavior is related with the decrease of the number of network modifying ions, responsible for the ionic conductivity, which is characteristic of this type of glasses. However, the electrical conductivity also depends on the mobility of the charge carriers and therefore on the height of the network potential
www.intechopen.com

Glass Ceramics with Para, Anti or Ferroelectric Active Phases
265
barriers. This characteristic is related with the activation energy, which for the dc conduction process revealed to be similar for the as-prepared, HT at 450 and HT at 500 ºC samples (table 4.8). Thus, the decrease of the σdc, with the increase of the HT temperature, should be attributed to the decrease of the charge carriers number. These carriers should be related mainly to the number of Li+, because from the results of Raman spectroscopy some Nb5+ ions, are introduced as network formers in the as-prepared, HT at 450 and HT at 500 ºC samples, due to the presence of band center at 870 cm-1 (fig. 4.36), which is related with the presence of NbO4 tetrahedral. The formation of the Li2B4O7 crystal, which is characterized by a low electrical conductivity (σ ~ 10-10 Sm-1), and the presence of high resistivity LiNbO3 crystals, indicates that the presence of this crystallite contributes to the observed decrease of the conductivity.
-35
-30
-25
-20
-15
2.5 3 3.5 4 4.5
1000/T [K-1
]
ln( σ d
c) [
Sm
-1]
as-prep.
450
500
550
Fig. 4.37. σdc versus 1000/T for all 60BLiNa samples.
The decrease of the σac (fig. 4.38), with the increase of the HT temperature, should be related with the decrease of the number of charge carriers because the activation energy (Ea(ac) – table 4.8) is almost constant for the HT samples. Figure 4.39 shows the σac dependence with the temperature at several frequencies for the as-prepared sample. This behaviour is similar for all samples. It is observed that the increase of the frequency promotes an increase of σac and a decrease in the Ea(ac). The "jump" of the potential barriers by the ions, or their oscillation between structurally close sites in response to an ac electric field, contribute to the behavior of the dielectric constant (ε '). Knowing that the ε' of the as-prepared sample, of the HT at 450 and HT at 500 ºC (table 4.9) present similar values, the increase of ε' for the sample HT at 550 ºC should be assigned to the presence of LiNbO3 crystallites, being the main contribution to the ε' value, because with the increase of the HT temperature there is a decrease in the number of
www.intechopen.com
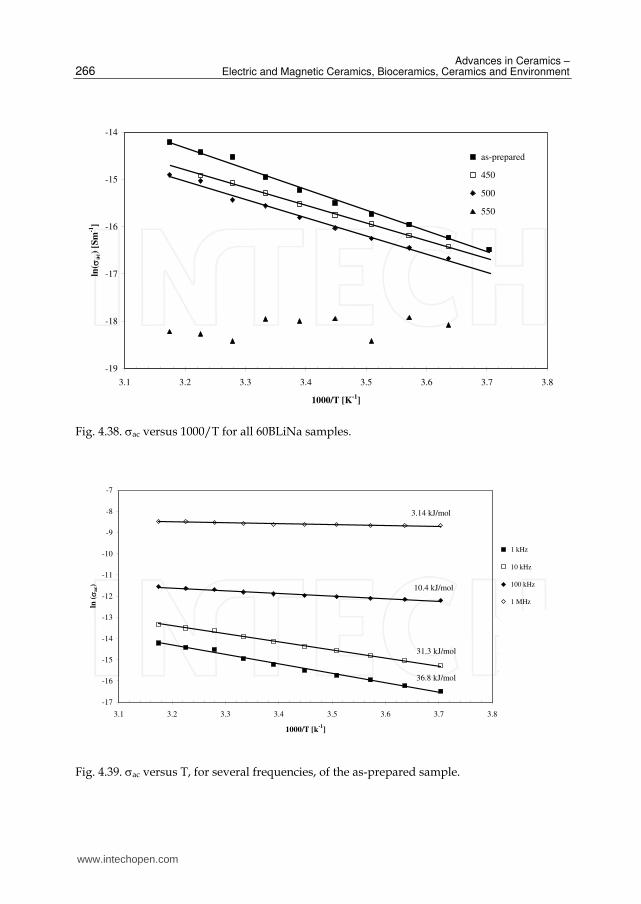
Advances in Ceramics – Electric and Magnetic Ceramics, Bioceramics, Ceramics and Environment
266
-19
-18
-17
-16
-15
-14
3.1 3.2 3.3 3.4 3.5 3.6 3.7 3.8
1000/T [K-1
]
ln( σ a
c) [
Sm
-1]
as-prepared
450
500
550
i (
Fig. 4.38. σac versus 1000/T for all 60BLiNa samples.
-17
-16
-15
-14
-13
-12
-11
-10
-9
-8
-7
3.1 3.2 3.3 3.4 3.5 3.6 3.7 3.8
1000/T [k-1
]
ln (
σ ac)
1 kHz
10 kHz
100 kHz
1 MHz
Linear (1 kHz)
Linear (10 kHz)
Linear (100 kHz)
Linear (1 MHz)
31.3 kJ/mol
10.4 kJ/mol
3.14 kJ/mol
36.8 kJ/mol
Fig. 4.39. σac versus T, for several frequencies, of the as-prepared sample.
www.intechopen.com

Glass Ceramics with Para, Anti or Ferroelectric Active Phases
267
Sample σdc (x10-8)
[Sm-1]
Ea(dc)
[kJ/mol] σac (x10-7)
[Sm-1]
Ea(ac)
[kJ/mol]
As-prepared 259,05±3,48 62,54±0,67 32,05±1,12 36,78±1,11
450 171,86±2,37 62,40±0,60 22,95±1,07 30,87±0,44
500 58,17±0,74 63,34±0,58 17,53±5,71 32,19±1,16
550 1,17±0,02 66,11±1,10 0,997±0,047 --
Table 4.8 dc conductivity (σdc) at 300 K, dc activation energy (Ea(dc)), ac conductivity (σac), at 1 kHz and 300 K and ac activation energy (Ea(ac)).
network modifier ions structurally inserted in the glass matrix and thus their contribution to the dipole moment decreases. The decrease of the ε' from the sample HT at 500 to the sample HT at 550 ºC (table 4.9), is associated with an increase of the volume ratio between the crystals and the glass matrix and therefore it can be suggested that in this glass network the LiNbO3 crystallites present a preferential grow orientation. The presence, in this sample, of the Li2B4O7 ferroelectric phase, which has a ε' ~ 80, smaller than that the one of LiNbO3 (> 1000), should not influence significantly the dielectric behavior. The increase of ε' in all samples, with the increase of the measurement temperature indicates that the increase of the temperature facilitates the dipole orientation. The same type of dependence was observed with the relaxation time τZ (table 3-annex), which decreases with the increase of the measurement temperature, indicating a decrease in the mobility difficulty of the electric dipoles. The decrease of σac, related with the decrease of the charge carrier number, explains the decrease of the tan δ value (table 4.9). The impedance spectra (fig. 4.41), show single semi-circles whose center are under the Z' axis, which indicates that the ac response can be represented by an equivalent electrical circuit comprising the parallel between a resistance (R) and an CPE element. The correlation between the circuit parameters (table 3-annex), and the sample characteristics are not entirely clear due to the presence of the CPE element, usually associated with the presence of a distribution of relaxation times and related to the presence of electrical heterogeneities on the samples surface. However, the increase of the parameter R, calculated at 300 K, with the increase of the HT temperature, is consistent with the decrease of the conductivity (table 4.8). In the sample HT at 550 ºC, the Z* formalism (fig. 4.42), the ε* (dielectric permittivity) formalism or the M * (dielectric module) formalism did not reveal the formation of semi-arches, associated with the presence of dielectric relaxation mechanism(s). This behavior may be due to the increase of the volume ratio between the crystallites (mainly LiNbO3) and the glass matrix, as confirmed by XRD (fig. 4.34), by the SEM micrographs (fig. 4.36) and by the results of electrical conductivity (table 4.8). In the samples where it was detected the presence of a dielectric relaxation mechanism, it was found that the value of τZ increases, with the increase of the HT temperature (table 3-annex), which is another indication of the increased amount of LiNbO3 crystals in the glass matrix, because the electric dipoles associated with LiNbO3 are difficult to depolarize at room temperature. The spectra represented in fig. 4.42 can be adjusted by the Curie-Von Schweidler model. This model assumes that for periods of time longer than two decades, it can follows a functional form of the type ( ) si t t−∝ . The inverse Fourier transform of the above expression, leads to impedance expressions of the type (eq. 25)
www.intechopen.com

Advances in Ceramics – Electric and Magnetic Ceramics, Bioceramics, Ceramics and Environment
268
´´ . nZ k f −= (25)
where Z'' is the imaginary part of complex impedance, k a constant of proportionality, and f the frequency and n a adjustable parameter that, according to Jonsher, is associated with the type of polarization system (dipoles, charges, etc.). For the 550 ºC HT sample spectra (fig. 4.42) it was observed that the parameters k and n (table 4.10), decrease with the increase of the temperature of measurement. However, this decrease, for the parameter n, is very smooth. Figures 4.42 and 4.43 show the result of the TSDC measurements on the as-prepared and in the sample HT at 550 ºC, respectively. All samples were polarized at the temperature of 350 K, for 10 minutes, by applying an electric field of 100 kV/m. In all spectra, the lines represent the theoretical fit. The TSDC results show that with the increase of the HT temperature, the depolarization current peak temperature (TP1) shifts to higher temperatures (table 4.11), indicating that the electrical units, responsible for this depolarization, requires a higher energy to depolarize when the HT temperature is increased. The value of relaxation time (τP1) associated with this current peak, increases from sample HT at 450 to the sample HT at 550 ºC. This behavior is similar to that observed in dielectric relaxation, which shows a progressive difficulty of the electrical units to return to their normal position. The value of the peak current iP1 (table 4.11) decreases, with the exception of the sample HT at 450 ºC, with the increase of the treatment temperature. The sample HT at 450 ºC show a value of iP1 lower than the one of the sample HT at 500 ºC, which could be related to the value of Ea (table 4.11) which has a maximum for that sample. However, with increasing the HT temperature it is verified that the value of Ea decreases, which indicates, based on the model of potential barriers, a larger easiness of the ionic motion.
0.0E+00
2.0E+06
4.0E+06
6.0E+06
8.0E+06
1.0E+07
1.2E+07
1.4E+07
1.6E+07
0.0E+00 5.0E+06 1.0E+07 1.5E+07 2.0E+07 2.5E+07 3.0E+07 3.5E+07
Z´
Z´´
as-prepared 500450
550
Fig. 4.40. Z´´ versus Z´ for all 60BLi samples, at 300 K.
www.intechopen.com

Glass Ceramics with Para, Anti or Ferroelectric Active Phases
269
0.0E+00
5.0E+06
1.0E+07
1.5E+07
2.0E+07
2.5E+07
3.0E+07
3.5E+07
4.0E+07
1 10 100 1000 10000 100000 1000000 10000000
frequência (Hz)
Z´´
315 K
310 K
305 K
300 K
295 K
290 K
285 K
Theoric
Theoric
Theoric
Theoric
Theoric
Theoric
Fig. 4.41. Z´´ versus frequency, for the sample HT at 500 ºC.
1.0E+00
1.0E+01
1.0E+02
1.0E+03
1.0E+04
1.0E+05
1.0E+06
1.0E+07
1.0E+08
100 1000 10000 100000 1000000 10000000
frequência (Hz)
Z´´
315 K
310 K
305 K
300 K
295 K
290 K
285 K
280 K
Fig. 4.42. Z´´ versus frequency, for the sample HT at 550 ºC.
www.intechopen.com

Advances in Ceramics – Electric and Magnetic Ceramics, Bioceramics, Ceramics and Environment
270
Sample ε´ ε´´ tanδ
as-prepared 18,83±0,66 5,76 ± 0,20 0,31±0,02
450 17,16±0,76 4,13 ± 0,18 0,24±0,02
500 17,93±0,59 3,15 ± 0,10 0,18±0,01
550 11,39±0,53 0,18 ± 0,01 0,02±0,001
Table 4.9. Real and imaginary parts of the permittivity and the dielectric loss, at 300 K and 1 kHz.
Temperature [K]
k (x108) n
315 1,677 1,015
310 1,715 1,016
305 1,730 1,017
300 1,743 1,017
295 1,750 1,017
290 1,762 1,018
285 1,764 1,017
280 1,769 1,018
275 1,774 1,018
Table 4.10. k and n parameters for the sample HT at 550 ºC, at several measurement temperatures
According to Rysiakiewicz and co-workers studies in lithium borate glasses, it is possible to detect two TSDC peaks, one related with different types of motion of the alkali ion. The TSDC peak at low temperatures can be attributed to the movement of the Li+ ions around the non-bridging oxygen ions. In borate glasses where the amount of alkaline ion is high, a second TSDC peak can be observed and attributed to translational movements of the Li+ ions, for example, in conduction paths. Thus, we assign the P1 peak, observed in all samples to the depolarization of the dipoles formed by the Li+ structurally inserted in the glass matrix. The increase in the TP1 value, decreased of iP1 (with the exception of the sample HT at 450 ºC) and the increase of the relaxation time, corroborates this hypothesis, because the results of σdc and σac show that with the increase of the HT temperature, the number of free ions decreases justifying, therefore, the decreasing of iP1. The second depolarization peak, only observed in the sample HT at 550 ºC (fig. 4.43) should be associated with the presence of the LiNbO3 and Li2B4O7 crystalline phases. Assuming, based on the results of XRD, Raman and dielectric characterization of the sample HT at 550 ºC, that the volume amount of LiNbO3 is higher than the one of Li2B4O7, the P2 peak can be
www.intechopen.com

Glass Ceramics with Para, Anti or Ferroelectric Active Phases
271
attributed to the dipoles associated with the LiNbO3 crystallites. These dipoles are by nature difficult to depolarization, which justifies the fact that τP2> τ P1. The fact that TP2> TP1 for the sample (table 4.11), shows that the energy required to depolarize the dipoles associated with the second peak is greater than that required by the first.
0.0E+00
5.0E-08
1.0E-07
1.5E-07
2.0E-07
2.5E-07
3.0E-07
3.5E-07
200 220 240 260 280 300 320 340 360 380 400
Temperatura [K]
i [A
]
0.0E+00
2.0E-10
4.0E-10
6.0E-10
8.0E-10
1.0E-09
1.2E-09
1.4E-09
1.6E-09
1.8E-09
2.0E-09
200 220 240 260 280 300 320 340 360 380 400
Temperatura [K]
i [A
]
Fig. 4.43. TSDC spectra of the as-prepared sample (the lines represent the theoretical adjust).
0.0E+00
2.0E-11
4.0E-11
6.0E-11
8.0E-11
1.0E-10
1.2E-10
1.4E-10
1.6E-10
1.8E-10
2.0E-10
200 220 240 260 280 300 320 340 360 380 400
Temperatura [K]
i [A
]
Fig. 4.43. TSDC spectra of the sample HT at 550 ºC (the lines represent the theoretical adjust).
www.intechopen.com

Advances in Ceramics – Electric and Magnetic Ceramics, Bioceramics, Ceramics and Environment
272
sample TP1 (K)
i(TP1) x10-9 (A)
Ea [kJ/mol]
τ0 (P1) (x102) [s]
τ (P1) (x103) [s]
as-prepared 260,8 1,509 55,35 ± 0,45 1,194 ± 0,021 1,533
450 263,5 1,063 58,85 ± 0,30 1,004 ± 0,017 1,472
500 271,8 1,222 53,47 ± 0,62 1,619 ± 0,026 1,724
550 315,4 0,069 50,91 ± 0,21 3,499 ± 0,041 2,437
TP2 (K)
i(TP2) x10-11 (A)
Ea [kJ/mol]
τ0 (P2) (x102) [s]
τ (P2) (x103) [s]
as-prepared -- -- -- -- --
450 -- -- -- -- --
500 -- -- -- -- --
550 353,4 6,647 30,97 ± 0,62 17,54 ± 0,15 5,03
Table 4.11. TSDC peak temperature (Tp), peak current (i(Tp)), activation energy (Ea), pre-exponential parameter (τ0) and relaxation time (τ), calculated on the low temperature peak (TP1) and in the high temperature peak (TP2).
sample ln (A) [A]
Ea [kJ/mol]
as-prepared 11,01 ± 0,16 85,77 ± 0,48
450 16,50 ± 0,24 102,31 ± 0,75
500 8,12 ± 0,29 77,81 ± 0,88
550 2,32 ± 0,25 65,89 ± 0,81
Table 4.12. Parameters of the Arrhenius equation used in the adjust of the TSDC high temperature range. ln (A) represents the logarithm of the pre-exponential factor and Ea the activation energy.
4.2.2 B2O3-Na2O-Nb2O5 composition The DTA analysis to this glass composition (60B2O3-30Na2O-10Nb2O5 – named in this text as 60BNa) reveled the presence of two exothermic effects at 570 ºC and 683 °C, the glass transition temperature (Tg) is about 550 °C and two endothermic effects at 710 and 786 °C. Thus, the HT temperatures chosen were: 475, 500, 550, 600 and 700 º C. From the XRD results (fig. 4.44) the HT at 500 °C gives rise to a glass-ceramic, with the NaNbO3 crystalline phase. For treatments above 600 ºC there is also the formation of Nb2O5 and Na2B4O7 phases. In opposition to what occurs in the composition 60SiNa, the use of borate favors the bulk crystallization. We think that the reason for this phenomenon is the different structure of the two arrays. In pure borate glasses the boron ions present triangular coordination and, contrary to what occurs in SiO2 glasses, the addition of network modifier ions (R2O) is reflected, in an early stage, to a strengthening of the glass network, i.e., an increase in the number of cross links, to a maximum value occurring at the concentration of
www.intechopen.com

Glass Ceramics with Para, Anti or Ferroelectric Active Phases
273
~ 30% (mole) of R2O. At this concentration of R2O the borate glass shows the maximum number of boron ions tetrahedrally coordinated. With further increase of R2O, these units and decreases and for molar concentrations above 70 % the boron ions are only with triangular coordination.
10 20 30 40 50 60 70
2 theta
Inte
nsity (
arb
. units)
500
as-prepared
550
x
x
xx x
x
475
x
xx x
xx x
x
600
700x x x
xx x xx
oo
oo o
o
o
o
x x
o
oo
x
* *
*
* **
* *
** *
*
Fig. 4.44. XRD patterns of the 60BNa samples (x NaNbO3; o Nb2O5; * Na2B4O7).
Analyzing the Raman spectroscopy results (fig. 4.45) of the as-prepared and of the sample HT at 475 ºC, it was observed the presence of a broad band at 900 cm-1, which shifts to lower wave numbers with the increase of the HT temperature to 500 ºC (885 cm-1), and decreasing in intensity. This band, which according to Cardinal can be assigned to vibrations of isolated NbO6 octahedrons in the glass network, is clearly detected in the sample treated at 550 °C. The decrease in the intensity of this band with the increase of the thermal treatment temperature can be related to a decrease in the number of isolated NbO6 octahedrons, mainly due to the formation of NaNbO3 particles. The detection in the Raman spectra of the sample treated at 550 °C, the band at 620 cm-1, attributed to vibrations of NbO6 octahedrons connected by oxygen bridges (Nb-O-Nb) reflects the presence of the NaNbO3 phase. The bands at 450, 280, 250 and 210 cm-1 are due to NbO6 vibrations associated with the NaNbO3 crystalline phase. The vibrations at 194 and 123cm-1 are assigned to nbO6 vibrations in the orthorhombic phase. Note that in the samples where SiO2 is the glass former, these bands were also detected. In the samples HT at 500 and 550 °C, the presence of the band centred at 780 cm-1, reveals the existence in the vitreous network, of tetraborate units. So, the presence in the glass network of boron ion with triangular and tetrahedral coordination should favour the bulk crystallization. The following figure (fig. 4.46) show the micrographs of the surface and fracture of the HT samples. From those micrographs it was verified that the sample HT at 475 ºC presents, in the free and fracture surface, particles with a maximum size of 600 nm. With the increase of
www.intechopen.com

Advances in Ceramics – Electric and Magnetic Ceramics, Bioceramics, Ceramics and Environment
274
the HT temperature to 500 ºC, the number of particles increases. In the sample HT at 500 ºC the particles have a size of ~ 300 nm. The surface of the sample HT at 550 ºc shows two types of particles that differ in size and number. The larger particles, with a size ~ 3 μm have a lower number when compared with the particles with a size of ~ 100 nm.
100 200 300 400 500 600 700 800 900 1000
Raman Shift (cm-1
)
Inte
nsi
ty (
arb
. u
nit
s)
as-prepared
475
500
550
62
0
620
25
02
50
45
0
78
07
80
1441
23
28
0
21
0
88
5
90
0
Fig. 4.45. Raman spectra of the 60BNa composition samples.
Figure 4.47 shows the dc conductivity in function of the temperature. It shows that σdc increases with the increase of the measurement temperature measurement, suggesting that the increase in temperature induces an increase in the mobility of the charge carriers. The increase of the HT temperature promotes a decrease of σdc (table 4.13), which should be related to the decrease of the charge carriers number, since the Ea(dc) (table 4.13), decreases from the as-prepared to the 550 ºC HT sample. In these glasses, the charge carriers are the network modifier ions (Na+ and Nb5+), structurally inserted in the glass matrix, that, by participating in the formation of the NaNbO3 crystalline structure, become no longer available to contribute to the conductivity. On the other hand, the increase of the volume ratio between the crystalline phase NaNbO3 (NaNbO3 presents, according Molak and co-workers, a electrical conductivity of ~ 10-7 S/m at 300 K) and the glass matrix, comproved by the XRD and SEM results, indicates that the number of “free” network modifier ions is the main factor in the electrical conductivity of these glass ceramics. For the same sample, it was verified that the Ea(ac) is lower than the Ea(dc) (table 4.13), which shows that the electrical units have to overcome different potential barriers when they relax (ac process) or when they participate in a long range process (dc conductivity). The σac values, recorded at room temperature (table 4.13), are similar to those obtained by Singh and colleagues, in NaNbO3 sintered ceramics (<10-8 S/m), indicating that the increase of the ac conductivity is due to the
www.intechopen.com

Glass Ceramics with Para, Anti or Ferroelectric Active Phases
275
(a) (b)
(c) (d)
(e)
Fig. 4.46. SEM micrographs of the 60BNa samples:: a- as-prepared; b – HT at 475 ºC; c.- HT at 500 ºC; d – HT at 550 ºC; e – HT at 550 ºC - fracture.
www.intechopen.com

Advances in Ceramics – Electric and Magnetic Ceramics, Bioceramics, Ceramics and Environment
276
increase of the quantity of NaNbO3 crystals embedded in the glass matrix. Moreover, the decrease of the Ea(ac) (table 4.13), with the increase of the HT temperature, shows a decrease in the height of the potential barriers and hence an increase of the electrical units mobility. The σac behavior, related to the number of NaNbO3 crystals embedded in the glass matrix, is consistent with the results obtained for the 60SiNa composition. The ac conductivity (σac), measured at 1 kHz and 300 K is similar in the as-prepared glass and in the sample HT at 475 ºC, increasing with the increase of the HT temperature (table 4.13). The ac activation energy (Ea(ac)), calculated based on the dependence of σac with temperature (fig. 4.48), revealed similar values for the as-prepared and the sample HT at 475 ºC, decreasing for the sample HT at 500 ºC, which has a value close to that obtained for the sample treated at 550 ºC.
-28
-26
-24
-22
-20
-18
-16
2.6 2.8 3 3.2 3.4 3.6
1000/T [K-1
]
ln( σ d
c) [
Sm
-1]
as-prepared
475
500
550
Linear (as-prepared)Linear (475)
Fig. 4.47. ln(σdc) versus 1000/T for the 60BNa samples.
www.intechopen.com

Glass Ceramics with Para, Anti or Ferroelectric Active Phases
277
-19.5
-19
-18.5
-18
-17.5
-17
-16.5
3.1 3.2 3.3 3.4 3.5 3.6 3.7 3.8
1000/T [K-1]
ln (
σ ac) [Sm
-1]
vidro base
475
500
550
Linear (vidrobase)
As-prepared
-19.5
-19
-18.5
-18
-17.5
-17
-16.5
3.1 3.2 3.3 3.4 3.5 3.6 3.7 3.8
1000/T [K-1]
ln (
σ ac) [Sm
-1]
vidro base
475
500
550
Linear (vidrobase)
As-prepared
Fig. 4.48. ln(σac) versus 1000/T for the 60BNa samples.
sample σdc (x10-11)
[Sm-1]
Ea(dc)
[kJ/mol] σac (x10-8)
[Sm-1]
Ea(ac)
[kJ/mol]
As-prepared 9,03 ± 0,15 77,90 ± 1,33 1,19 ± 0,05 17,06 ± 0,44
475 9,44 ± 0,17 76,27 ± 1,17 1,17 ± 0,07 17,12 ± 0,37
500 3,20 ± 0,06 68,42 ± 1,69 1,60 ± 0,07 14,56 ± 0,37
550 3,08 ± 0,05 66,53 ± 1,91 3,71 ± 0,12 14,91 ± 0,68
Table 4.13 dc conductivity (σdc), at 300 K, dc activation energy (Ea(dc)), ac conductivity (σac), at 300 K and 1 kHz and the ac activation energy (Ea(ac)).
Singh and coworkers present, for NaNbO3 ceramic pellets sintered, values of dielectric constant (ε') of ~ 20, at 1 kHz and 305 K, much lower than the value of 600 measured in NaNbO3 single crystals. The reason for this high difference can be the existence, either in glasses or in ceramics, of crystals with different dipolar orientations, which lowers the dipolar moment. In these glasses (60BNa), the increase of the HT temperature promotes an increase of ε' (table 4.14) which should be associated with the number of NaNbO3 crystals precipitated in the glass matrix. The values obtained (between 10 and 36, table 4.14) are not comparable with those of the single crystals, indicating a random growth of crystals in the glass matrix. The dependence of ε', with the temperature of measurement is, in all samples, practically constant (fig. 4.49). This shows that, in the temperature range used, the NaNbO3 does not suffers structural modifications, remaining antiferroelectric. It must be noticed that the dielectric losses (tan δ) are < 0.05, close to the value presented by Singh (~ 0.01), for the NaNbO3 ceramic. The dielectric results of all samples, exemplified in figures 4.50 and 4.51, did not reveal the presence of dielectric relaxation mechanisms, in the frequency and
As-prepared
www.intechopen.com

Advances in Ceramics – Electric and Magnetic Ceramics, Bioceramics, Ceramics and Environment
278
temperatures used, even using other dielectric formalisms (ε*, Y* or M*) beyond the Z*. This behavior is similar to that observed in the sample HT at 550 ºC of the 60BLi system (fig. 4.42). These data can be fitted to the Curie-Von Schweidler model (eq. 25), which corroborates the absence of dielectric relaxation in this frequency range. The results of these adjustments (table 4.15) shows that the n parameter is ~1.0, for all samples, and remains almost constant with the measuring temperature, which, according Jonsher, indicates that the electrical units responsible for this behavior are the same in all samples
Sample ε´ ε´´ tanδ
(x 10-3)
As-prepared 10.34 ± 0.43 0.15 ± 0.01 14.21 ± 0.84
475 11.77 ± 0.66 0.052 ± 0.003 4.46 ± 0.35
500 18.49 ± 0.77 0.13 ± 0.01 7.11 ± 0.41
550 36.94 ± 1.53 0.78 ± 0.03 21.06 ± 1.23
Table 4.14. Real and imaginary parts of the permittivity and the dielectric loss, at 300 K and 1 kHz.
0
5
10
15
20
25
30
35
40
270 275 280 285 290 295 300 305 310 315 320
Temperature [K]
ε´
as-prepared
475
500
550
Fig. 4.49. ε´ versus temperature, measured at 1 kHz, for all 60BNa samples.
www.intechopen.com

Glass Ceramics with Para, Anti or Ferroelectric Active Phases
279
1.0E+00
1.0E+01
1.0E+02
1.0E+03
1.0E+04
1.0E+05
1.0E+06
1.0E+07
1.0E+08
10 100 1000 10000 100000 1000000 10000000
frequência [Hz]
Z´´
315 K
310 K
305 K
300 K
295 K
290 K
285 K
280 K
275 K
Fig. 4.50. Z´´ versus frequency for the as-prepared sample, at several temperatures.
1.0E+00
1.0E+01
1.0E+02
1.0E+03
1.0E+04
1.0E+05
1.0E+06
1.0E+07
1.0E+08
1.00E+01 1.00E+02 1.00E+03 1.00E+04 1.00E+05 1.00E+06 1.00E+07
frequência [Hz]
Z´´
315 K
310 K
305 K
300 K
295 K
290 K
285 K
280 K
275 K
Fig. 4.51. Z´´ versus frequency for the sample treated at 550 ºC.
www.intechopen.com

Advances in Ceramics – Electric and Magnetic Ceramics, Bioceramics, Ceramics and Environment
280
As-prepared HT 475 HT 500 HT 550 Temper.
[K] k
(x109) n
k (x109)
n k
(x109) n
k (x108)
n
315 1,735 1,005 1,653 1,015 0,952 1,001 4,579 0,998
310 1,761 1,006 1,653 1,015 0,970 1,002 4,653 0,999
305 1,786 1,007 1,678 1,016 0,983 1,003 4,730 1,000
300 1,802 1,008 1,674 1,016 0,998 1,004 4,775 1,000
295 1,837 1,008 1,718 1,018 1,012 1,005 4,834 1,001
290 1,853 1,009 1,714 1,018 1,021 1,005 4,880 1,001
285 1,874 1,010 1,765 1,020 1,032 1,006 4,928 1,002
280 1,896 1,010 1,737 1,019 1,042 1,006 4,959 1,002
275 1,906 1,000 1,777 1,020 1,049 1,006 4,993 1,002
Table 4.15. k and n parameters for the sample HT at 550 ºC, at several measurement temperatures
The TSDC measurements reveal the presence of depolarization mechanisms indicating the possibility of dielectric relaxation mechanisms at low frequencies. In this particular case the 100 Hz represent, for this glass, the maximum frequency from which, due to sample-electrode interfacial polarization and the decreased sensitivity of the measuring apparatus, one begins to observe dispersion in measured values. Figures 5.3.7 to 5.3.10 present in the region of high frequency (> 1 MHz), a decrease of Z'' which suggests the possible presence of relaxation phenomena in the region of high frequencies. Note that the 30 MHz is the upper limit of the measuring apparatus used.
0.0E+00
5.0E-10
1.0E-09
1.5E-09
2.0E-09
2.5E-09
3.0E-09
3.5E-09
4.0E-09
4.5E-09
5.0E-09
100 150 200 250 300 350 400
Temperatura [K]
i [A
]
0.0E+00
1.0E-11
2.0E-11
3.0E-11
4.0E-11
5.0E-11
100 150 200 250 300 350 400
Temperatura [K]
i [A
]
Fig. 4.52. TSDC spectra of the as-prepared glass.
www.intechopen.com

Glass Ceramics with Para, Anti or Ferroelectric Active Phases
281
0.0E+00
1.0E-10
2.0E-10
3.0E-10
4.0E-10
5.0E-10
6.0E-10
100 150 200 250 300 350 400
Temperatura [K]
i [A
]
Fig. 4.53. TSDC spectra of the sample treated at 550ºC.
Sample TP1 [K]
i(TP1) x10-11 [A]
Ea [kJ/mol]
τ0 (P1) (x102) [s]
τ (P1) (x103) [s]
as-prepared 262,3 2,43 21,68 ± 0,14 14,65 ± 0,16 3,96
475 281,0 1,14 22,46 ± 0,09 16,77 ± 0,18 4,39
500 305,8 24,11 34,17 ± 0,19 8,91 ± 0,09 3,41
550 320,3 24,87 38,86 ± 0,47 7,65 ± 0,08 3,29
TP2 [K]
i(TP2) x10-10 [A]
Ea [kJ/mol]
τ0 (P2) (x103) [s]
τ (P2) (x103) [s]
as-prepared -- -- -- -- --
475 -- -- -- -- --
500 -- -- -- -- --
550 352,3 5,16 33,12 ± 0,59 1,51 ± 0,01 4,67
Table 4.16. TSDC peak temperature (Tp), peak current (i(Tp)), activation energy (Ea), pré-exponential parameter (τ0) and relaxation time (τ), calculated on the low temperature peak (TP1) and in the high temperature peak (TP2).
www.intechopen.com
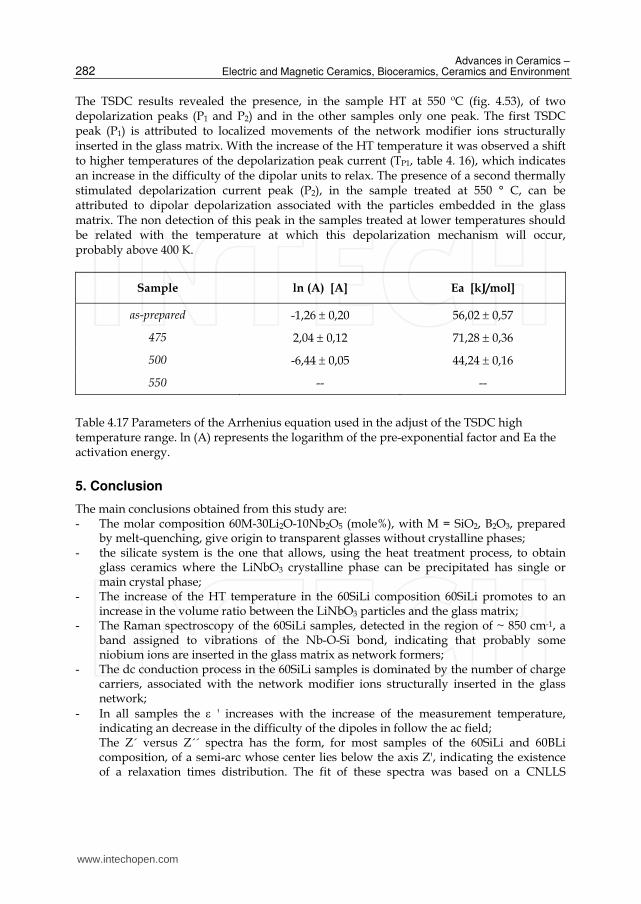
Advances in Ceramics – Electric and Magnetic Ceramics, Bioceramics, Ceramics and Environment
282
The TSDC results revealed the presence, in the sample HT at 550 ºC (fig. 4.53), of two depolarization peaks (P1 and P2) and in the other samples only one peak. The first TSDC peak (P1) is attributed to localized movements of the network modifier ions structurally inserted in the glass matrix. With the increase of the HT temperature it was observed a shift to higher temperatures of the depolarization peak current (TP1, table 4. 16), which indicates an increase in the difficulty of the dipolar units to relax. The presence of a second thermally stimulated depolarization current peak (P2), in the sample treated at 550 ° C, can be attributed to dipolar depolarization associated with the particles embedded in the glass matrix. The non detection of this peak in the samples treated at lower temperatures should be related with the temperature at which this depolarization mechanism will occur, probably above 400 K.
Sample ln (A) [A] Ea [kJ/mol]
as-prepared -1,26 ± 0,20 56,02 ± 0,57
475 2,04 ± 0,12 71,28 ± 0,36
500 -6,44 ± 0,05 44,24 ± 0,16
550 -- --
Table 4.17 Parameters of the Arrhenius equation used in the adjust of the TSDC high temperature range. ln (A) represents the logarithm of the pre-exponential factor and Ea the activation energy.
5. Conclusion
The main conclusions obtained from this study are: - The molar composition 60M-30Li2O-10Nb2O5 (mole%), with M = SiO2, B2O3, prepared
by melt-quenching, give origin to transparent glasses without crystalline phases; - the silicate system is the one that allows, using the heat treatment process, to obtain
glass ceramics where the LiNbO3 crystalline phase can be precipitated has single or main crystal phase;
- The increase of the HT temperature in the 60SiLi composition 60SiLi promotes to an increase in the volume ratio between the LiNbO3 particles and the glass matrix;
- The Raman spectroscopy of the 60SiLi samples, detected in the region of ~ 850 cm-1, a band assigned to vibrations of the Nb-O-Si bond, indicating that probably some niobium ions are inserted in the glass matrix as network formers;
- The dc conduction process in the 60SiLi samples is dominated by the number of charge carriers, associated with the network modifier ions structurally inserted in the glass network;
- In all samples the ε ' increases with the increase of the measurement temperature, indicating an decrease in the difficulty of the dipoles in follow the ac field;
- The Z´ versus Z´´ spectra has the form, for most samples of the 60SiLi and 60BLi composition, of a semi-arc whose center lies below the axis Z', indicating the existence of a relaxation times distribution. The fit of these spectra was based on a CNLLS
www.intechopen.com

Glass Ceramics with Para, Anti or Ferroelectric Active Phases
283
sam
ple
Temp. (K)
R
[MΩ]
Q0 (x10-9)
[Ω-1m-2sn]
n τz
(x10-4) [s]
CCPE
(x10-9) [F]
ε´ ε´´ tan δ
As-
prep
ared
300 0,49 7,58 0,78 1,29 1,04 30,23 46,24 1,53 295 0,63 7,28 0,78 1,65 1,05 28,62 38,40 1,34 290 0,82 6,44 0,79 2,13 1,06 26,66 30,70 1,15 285 1,14 5,90 0,80 3,06 1,11 24,80 23,93 0,96 280 1,58 5,16 0,81 4,21 1,13 22,96 18,60 0,81 275 4,27 5,06 0,77 15,60 1,06 18,69 8,92 0,48 270 5,59 4,89 0,77 17,51 1,06 18,32 8,25 0,45 265 7,28 4,26 0,79 19,60 1,10 17,57 6,85 0,39 260 10,60 3,15 0,82 25,71 1,06 16,57 5,52 0,33
600
300 0,38 7,72 0,80 1,09 1,18 35,07 56,84 1,62 295 0,62 6,61 0,81 1,80 1,20 30,84 37,69 1,22 290 0,96 5,78 0,82 2,74 1,23 28,01 27,15 0,97 285 1,30 4,99 0,83 3,61 1,22 25,90 20,59 0,80 280 2,03 5,19 0,82 6,01 1,27 23,87 15,65 0,66 275 3,54 5,92 0,76 9,95 1,06 22,26 12,08 0,54 270 5,54 6,52 0,75 18,50 1,21 20,80 9,09 0,44 265 19,52 6,86 0,35 260 17,59 4,41 0,25
650
300 0,37 9,81 0,80 1,40 1,53 47,05 59,27 1,26 295 0,47 8,99 0,81 1,88 1,67 41,85 41,61 0,99 290 0,56 6,38 0,84 2,04 1,65 39,73 43,59 1,10 285 0,97 5,84 0,83 3,25 1,49 33,19 25,55 0,77 280 1,69 4,42 0,85 5,07 1,39 27,75 15,93 0,57 275 2,51 3,90 0,86 7,51 1,43 25,72 12,19 0,47 270 23,90 9,39 0,39 265 22,37 7,29 0,33 260 21,02 5,37 0,26
Table 1-annex. Electrical equivalent circuit parameters (R, Q0, n), relaxation time (τz), capacitor CCPE, real part (ε ') and imaginary (ε'') of the permittivity and the dielectric loss (tan δ) off all 60SiLi samples, at various temperatures of measurement.
www.intechopen.com

Advances in Ceramics – Electric and Magnetic Ceramics, Bioceramics, Ceramics and Environment
284
sam
ple
Temp. (K)
R
[MΩ]
Q0 (x10-9)
[Ω-1m-2sn]
n τz
(x10-4) [s]
CCPE
(x10-9) [F]
ε´ ε´´ tan δ
As-
prep
ared
315 0,44 6,17 0,82 1,19 1,17 32,14 49,32 1,53 310 0,58 4,92 0,84 1,52 1,20 29,72 38,57 1,30 305 0,83 5,10 0,83 2,25 1,21 27,43 29,44 1,07 300 1,28 6,15 0,81 3,91 1,28 25,21 21,86 0,87 295 1,92 6,04 0,80 6,03 1,29 23,23 16,17 0,70 290 3,09 6,16 0,77 9,36 1,18 21,54 12,28 0,57 285 4,62 4,88 0,80 14,01 1,25 20,14 9,40 0,47 280 18,90 7,34 0,39 275 17,93 5,82 0,32
650
315 0,97 5,08 0,84 2,89 1,35 27,81 26,09 0,94 310 1,30 4,85 0,83 3,68 1,27 26,39 20,92 0,79 305 1,84 5,21 0,82 5,34 1,24 24,81 16,60 0,67 300 2,44 4,45 0,83 6,98 1,28 23,50 13,26 0,56 295 3,94 5,12 0,80 12,20 1,29 22,12 10,41 0,47 290 5,83 5,33 0,78 18,31 1,24 21,09 8,04 0,38 285 19,69 6,40 0,32 280 18,84 4,79 0,25 275 17,95 3,68 0,20
700
315 1,07 7,99 0,76 3,15 1,12 27,51 26,58 0,97 310 1,73 9,50 0,73 5,85 1,18 25,85 20,08 0,78 305 2,37 7,13 0,76 7,58 1,21 23,68 15,23 0,64 300 2,90 4,12 0,83 7,65 1,17 22,01 11,85 0,54 295 4,52 4,39 0,81 12,50 1,18 21,04 9,15 0,44 290 19,82 7,50 0,38 285 18,91 5,79 0,31 280 17,78 4,68 0,26 275 16,97 3,59 0,21
750
315 1,45 4,83 0,82 3,88 1,17 23,81 20,93 0,88 310 2,07 5,35 0,81 5,96 1,21 22,67 17,53 0,77 305 2,65 4,69 0,81 7,04 1,12 21,54 14,27 0,66 300 3,58 4,59 0,80 9,53 1,11 20,37 11,65 0,57 295 4,99 3,76 0,83 13,01 1,16 19,51 9,00 0,46 290 18,27 7,22 0,40
www.intechopen.com

Glass Ceramics with Para, Anti or Ferroelectric Active Phases
285
sam
ple
Temp. (K)
R
[MΩ]
Q0 (x10-9)
[Ω-1m-2sn]
n τz
(x10-4) [s]
CCPE
(x10-9) [F]
ε´ ε´´ tan δ
285 17,29 5,59 0,32 280 16,34 3,79 0,23 275 15,48 2,89 0,19
800
315 0,85 5,98 0,85 3,25 1,79 33,67 30,39 0,90 310 1,15 5,49 0,85 4,17 1,69 31,90 23,99 0,75 305 1,62 5,16 0,85 5,77 1,65 30,12 18,94 0,63 300 2,36 4,90 0,85 8,51 1,68 28,47 15,04 0,53 295 3,53 5,72 0,80 12,30 1,46 26,96 12,09 0,45 290 5,63 6,37 0,78 22,71 1,62 25,57 9,49 0,37 285 24,50 7,64 0,31 280 23,24 5,90 0,25 275 22,17 4,91 0,22
750B
315 1,23 4,04 0,85 3,04 1,14 23,81 20,93 0,88 310 1,78 6,49 0,77 4,85 1,05 22,67 17,53 0,77 305 2,29 4,90 0,80 6,01 1,09 21,54 14,27 0,66 300 2,99 4,27 0,82 7,65 1,10 20,37 11,65 0,57 295 4,59 4,49 0,80 12,50 1,13 19,51 9,00 0,46 290 18,27 7,22 0,40 285 17,29 5,59 0,32 280 16,34 3,79 0,23 275 15,48 2,89 0,19
800B
315 0,73 4,24 0,85 1,78 1,13 26,45 31,17 1,18 310 1,18 4,32 0,84 3,06 1,19 24,43 21,59 0,88 305 1,77 3,84 0,85 4,48 1,18 22,68 16,02 0,71 300 2,54 3,78 0,84 6,44 1,16 21,37 12,71 0,60 295 3,69 4,13 0,82 9,59 1,12 20,18 9,89 0,49 290 5,17 3,52 0,83 13,20 1,14 19,17 7,94 0,41 285 18,14 6,27 0,35 280 17,22 4,76 0,28 275 16,55 4,01 0,24
Table 2-annex. Electrical equivalent circuit parameters (R, Q0, n), relaxation time (τz), capacitor CCPE, real part (ε ') and imaginary (ε'') of the permittivity and the dielectric loss (tan δ) off all 60SiNa samples, at various temperatures of measurement.
www.intechopen.com

Advances in Ceramics – Electric and Magnetic Ceramics, Bioceramics, Ceramics and Environment
286
sam
ple
Temp. (K)
R
[MΩ]
Q0 (x10-9)
[Ω-1m-2sn]n
τz
(x10-3) [s]
CCPE
(x10-9) [F]
ε´ ε´´ tan δ
As-
prep
ared
315 2,83 4,60 0,81 0,77 1,16 22,01 12,07 0,55 310 3,92 4,16 0,82 1,05 1,17 20,94 9,78 0,47 305 4,57 4,39 0,81 1,27 1,17 20,28 8,86 0,44 300 9,08 3,37 0,82 2,21 1,06 18,83 5,76 0,31 295 15,06 3,59 0,81 4,30 1,22 17,92 4,40 0,25 290 21,30 2,85 0,84 5,68 1,21 17,15 3,34 0,19 285 31,00 2,30 0,86 7,58 1,13 16,56 2,63 0,16 280 16,06 2,12 0,13 275 15,51 1,60 0,10
450
315 8,82 2,67 0,87 2,07 1,13 18,69 5,49 0,29 310 7,39 3,20 0,84 1,85 1,16 18,52 5,95 0,32 305 10,62 3,35 0,83 2,84 1,19 17,97 5,11 0,28 300 13,99 2,82 0,85 3,54 1,19 17,16 4,13 0,24 295 23,18 3,48 0,79 6,37 1,12 16,61 3,28 0,20 290 32,78 2,85 0,82 8,84 1,15 16,09 2,57 0,16 285 15,68 2,14 0,14 280 15,13 1,67 0,11 275 14,79 1,33 0,09
500
315 9,86 4,66 0,76 2,79 1,08 19,97 6,04 0,30 310 10,42 3,33 0,85 3,06 1,32 19,46 5,32 0,27 305 25,77 2,69 0,86 7,23 1,34 18,38 3,56 0,19 300 35,46 3,23 0,82 11,42 1,36 17,93 3,15 0,18 295 50,91 2,63 0,84 14,50 1,33 17,20 2,45 0,14 290 95,46 2,55 0,82 31,82 1,32 16,69 1,96 0,12 285 16,26 1,57 0,10 280 15,88 1,29 0,08 275 15,50 1,03 0,07
550
315 11,82 0,22 0,02 310 11,57 0,21 0,02 305 11,48 0,29 0,03 300 11,39 0,18 0,02 295 11,42 0,27 0,02 290 11,42 0,29 0,03 285 11,42 0,18 0,02 280 11,35 0,30 0,03 275 11,28 0,25 0,02
Table 3-annex. Electrical equivalent circuit parameters (R, Q0, n), relaxation time (τz), capacitor CCPE, real part (ε ') and imaginary (ε'') of the permittivity and the dielectric loss (tan δ) off all 60BLi samples, at various temperatures of measurement.
www.intechopen.com

Glass Ceramics with Para, Anti or Ferroelectric Active Phases
287
- algorithm associated with an equivalent circuit model composed by the parallel between an R and a CPE;
- In the samples of the 60SiLi composition the parameter R has a similar behavior to that of the dc conductivity and the parameter n, being close to 0.80, allowed to approach the empirical element CPE to a capacitor;
- In the samples where it was not observed using various representations (Z*, Y*, M*, etc.), the formation of semi-circles, the spectra of Z* was adjustable to the Curie-Von Schweidler model.
- The TSDC results of the 60SiLi composition reveal the presence of at least two depolarization mechanisms. The current peak detected at lower temperatures (<250 K) is due to the depolarization of the dipoles associated with the “free” network modifier ions. The second depolarization peak, centered at temperatures >250 K, is due to dipolar depolarization from the movements of the electrical units responsible for the charge carrier in limited paths. The presence of depolarization current peaks at temperatures higher than the second peak must be associated with the dipoles formed between the sample surface and the electrodes;
- In the 60BLi composition, the precipitation of LiNbO3 crystallites occurs with the HT at temperatures above 500 ºC;
- The increase of the HT temperature favors the increase in size and the decrease in the number of particles.
- The results of the Raman spectroscopy in the 60BLi samples, show that the as-prepared glass, composed by pentaborate groups, undergoes a structural transformation, with the increase of the HT temperature, to a metaborate structure type;
- In the 60BLi samples the dc and ac conduction processes depend mainly on the number of network modifiers ions structurally inserted in the glass network. The dielectric analysis showed that the main contribution to the dipole moment is the amount of LiNbO3 crystals embedded in the boron matrix;
- The equivalent electrical circuit formed by the parallel between R and CPE, adjusts the dielectric response of the 60BLi samples.
- It was found in the 60BLi samples that the increase of the relaxation time (τZ), with the increase of the HT temperature, indicates the increase of the volume ratio between particles of LiNbO3 and the glass matrix;
- The preparation of glass ceramics containing NaNbO3 crystals is possible through heat treatment of the as-prepared glass of the compositions 60M-30Na2O-10Nb2O5 (mole%), with M = SiO2, B2O3;
- The NaNbO3 crystalline phase was detected in the 60SiNa composition samples treated at temperatures above 750 °C and in the 60BNa composition for temperatures above 500 ºC;
- In the 60SiNa composition it was not detected the presence of other crystalline phases with increasing the HT temperature up to 800 º C;
- In the samples of the 60BNa composition, the HT for temperatures above 600 ºC also favors the formation of the secondary phases (Nb2O5 and Na2B4O7);
- The crystallization in the 60SiNa composition is superficial and can be removed by a mechanical polishing process. In the borate matrix, the crystallization occurs in volume and the increase of the HT temperature promotes an increase in the volume amount of particles embedded in the glass matrix. This increase is a consequence of the decrease of the number of “free” network modifier ions which also causes the observed decrease in the conductivity.
www.intechopen.com
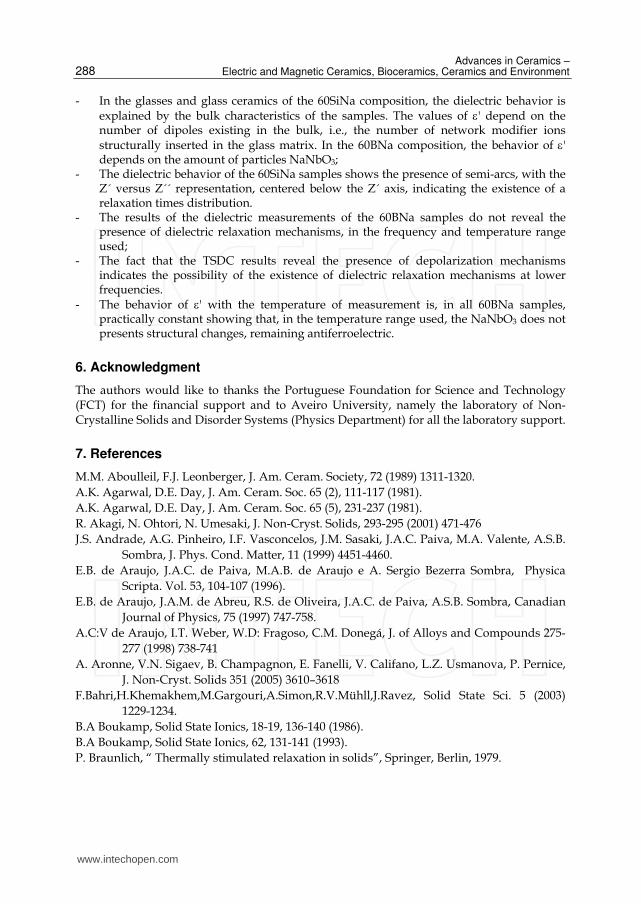
Advances in Ceramics – Electric and Magnetic Ceramics, Bioceramics, Ceramics and Environment
288
- In the glasses and glass ceramics of the 60SiNa composition, the dielectric behavior is explained by the bulk characteristics of the samples. The values of ε' depend on the number of dipoles existing in the bulk, i.e., the number of network modifier ions structurally inserted in the glass matrix. In the 60BNa composition, the behavior of ε' depends on the amount of particles NaNbO3;
- The dielectric behavior of the 60SiNa samples shows the presence of semi-arcs, with the Z´ versus Z´´ representation, centered below the Z´ axis, indicating the existence of a relaxation times distribution.
- The results of the dielectric measurements of the 60BNa samples do not reveal the presence of dielectric relaxation mechanisms, in the frequency and temperature range used;
- The fact that the TSDC results reveal the presence of depolarization mechanisms indicates the possibility of the existence of dielectric relaxation mechanisms at lower frequencies.
- The behavior of ε' with the temperature of measurement is, in all 60BNa samples, practically constant showing that, in the temperature range used, the NaNbO3 does not presents structural changes, remaining antiferroelectric.
6. Acknowledgment
The authors would like to thanks the Portuguese Foundation for Science and Technology (FCT) for the financial support and to Aveiro University, namely the laboratory of Non-Crystalline Solids and Disorder Systems (Physics Department) for all the laboratory support.
7. References
M.M. Aboulleil, F.J. Leonberger, J. Am. Ceram. Society, 72 (1989) 1311-1320. A.K. Agarwal, D.E. Day, J. Am. Ceram. Soc. 65 (2), 111-117 (1981). A.K. Agarwal, D.E. Day, J. Am. Ceram. Soc. 65 (5), 231-237 (1981). R. Akagi, N. Ohtori, N. Umesaki, J. Non-Cryst. Solids, 293-295 (2001) 471-476 J.S. Andrade, A.G. Pinheiro, I.F. Vasconcelos, J.M. Sasaki, J.A.C. Paiva, M.A. Valente, A.S.B.
Sombra, J. Phys. Cond. Matter, 11 (1999) 4451-4460. E.B. de Araujo, J.A.C. de Paiva, M.A.B. de Araujo e A. Sergio Bezerra Sombra, Physica
Scripta. Vol. 53, 104-107 (1996). E.B. de Araujo, J.A.M. de Abreu, R.S. de Oliveira, J.A.C. de Paiva, A.S.B. Sombra, Canadian
Journal of Physics, 75 (1997) 747-758. A.C:V de Araujo, I.T. Weber, W.D: Fragoso, C.M. Donegá, J. of Alloys and Compounds 275-
277 (1998) 738-741 A. Aronne, V.N. Sigaev, B. Champagnon, E. Fanelli, V. Califano, L.Z. Usmanova, P. Pernice,
J. Non-Cryst. Solids 351 (2005) 3610–3618 F.Bahri,H.Khemakhem,M.Gargouri,A.Simon,R.V.Mühll,J.Ravez, Solid State Sci. 5 (2003)
1229-1234. B.A Boukamp, Solid State Ionics, 18-19, 136-140 (1986). B.A Boukamp, Solid State Ionics, 62, 131-141 (1993). P. Braunlich, “ Thermally stimulated relaxation in solids”, Springer, Berlin, 1979.
www.intechopen.com

Glass Ceramics with Para, Anti or Ferroelectric Active Phases
289
R.K. Brow, “Introduction to Glass Science” Cer103 (2004), University of Missouri-Rolla, EUA ( www.umr.edu/~brow/index.html).
T. Cardinal, E. Fargin, G. Le Flem, S. Leboiteux, J. Non-Cryst. Solids 222 (1997) 228-234. S.H. Carr, "Electrical Properties of Polimers", Academic Press, 1982, N.Y. F. Cavalier, Le contrôle global de VIRGO, Mémoire d'habilitation soutenu le 14/09/2001, Le
Laboratoire de l'Accélérateur Linéaire - Université Paris-Sud, http://www.lal.in2p3.fr/presentation/bibliotheque/publications/2001/web/habilitation.html
R. Chen, J. Mater. Sci., 11, 1521-1541 (1976). K. Chou, J. Non-Cryst. Solids, 110 (1989) 122-124. L.M. Cadillon M. Costa, “Propriedades eléctricas de vidros com alguns iões de terras raras”,
Tese de Doutoramento, Universidade de Aveiro, Aveiro (1995). M. Cutroni, A. Mandanici, Solid Sate Ionics, 105 (1998) 149-157. A Dan, D. Chakravorty, J. Mater. Res., 15(6), 1324-1330 (2000) C.N.W. Darlington, K.S. Knight, Physica B 266 (1999) 368-372. M.M. El-Desoky, S.M.Salem, I.Kashif, J. Mat. Sci, 10 (1999) 279-283. Y. Ding, Y. Miura, S. Nakaoka, T. Nanba, J. Non-Crist. Solids, 259, 132-138 (1999). A Doi, Solid State Ionics, 107, 81-88 (1998) H.L. Downing, N.L. Peterson, H. Jain, J. Non-Cryst. Solids, 50(2), 203-13 (1982) AM. Efimov, J. Non-Cryst. Solids, 253 (1999) 95-118. V.C. Farmer, “The infrared spectra of minerals”, Mineralogical Society, London, 1974. K. Fukumi, S. Sakka, J. Mater. Sci., 23 (1988) 2819-2823. T. Fuss, C.S. Ray, N. Kitamura, M. Makihara, D.E. Day, J. Non-Cryst. Solids 318 (2003) 157–
167. K.Gerth, C.Rüsell, R.Kending, P.Schleevoigt, H.Dunken, Phys.Chem. Glasses, 40(3) (1999)
135-9. M.P.F.Graça, M.A.Valente, M.G.F.Silva, J. Non-Cryst. Solids, 325 (2003) 267-274. M.P.F. Graça, M.G.F. da Silva, A.S.B. Sombra, M.A. Valente, Journal of Non-Crystalline
Solids 353 (2007) 4390-4394 MPF Graça, MGF Silva, ASB Sombra and MA Valente, Journal of Non-Crystalline Solids,
352 (42-49) 2006, Pages 5199-5204. M.P.F. Graça, M.G.F. Silva, M.A. Valente – Journal of Non-Crystalline Solids, 351 (33-36)
(2005) 2951-2957 M.P.F. Graça, M.A. Valente, M.G. Ferreira da Silva – Journal of Materials Science, 41 (2006)
1137-1141 M.P.F. Graça, M.G. Ferreira da Silva, M.A. Valente, Advanced Materials Forum III, 2005,
pp274 M.P.F. Graça, M.G. Ferreira da Silva, A.S.B. Sombra and M.A. Valente Physica B 396 (2007)
62-69 G.H. Haertling, J. Am. Ceram. Soc., 82 (4), 797-818 (1999). R.M. Hakim, D.R. Uhlmanh, Phys. Chem. of Glasses, 12 (5), 132-138 (1971). A. Halliyal, A.S. Bhalla, R.E. Newnham, Materials Research Bulletin, 18, 1007-1019 (1983). E. Hecht, “Óptica”, Fundação Calouste Gulbenkian, 1991. A. Herczog, J. Am. Ceram. Soc. 73(9) (1990) 2743-2746.
www.intechopen.com

Advances in Ceramics – Electric and Magnetic Ceramics, Bioceramics, Ceramics and Environment
290
S. Hirano, T. Yogo, K. Kikuta, Y. Isobe, J. Mater. Sci., 28 (1993) 4188-4192. C. Hong, D.E. Day, J. Am. Ceram. Soc., 64:2, 61-67 (1981). C. Hong, D.E. Day, J. Mater. Sci., 14, 2493-2499 (1979). P. Huang, X. Huang, Solid State Ionics 36 (1989) 59-63. T. Hungría, L. Pardo, A. Moure, A. Castro, J. of Alloys and Compounds 395 (2005) 166–173. R. Jenkins, R.L. Snyder, “Introduction to X-ray powder diffractometry” , John Wiley, N.Y.
1996. A.K. Jonscher, “Dielectric relaxation in solids”, Chelsea Dielectrics Press, London, 1983. V.D. Jovic, B.M. Jovic, J. Electroanalytical Chemistry 541 (2003) 13-/21; V. D. Jovic,
“Determination of the correct value of Cdl from the impedance results fitted by the commercially available software ”, Research Solutions and Resources (http://www.consultrsr.com).
Y.D. Juang, S.B. Dai, Y.C. Wang, W.Y. Chou, J.S. Hwang, M.L. Hu, w.S. Tse, Solid State Communications 111 (1999) 723-728
G.O. Karapetyan, V.V. Loboda, D.K. Tagantsev, J. Non-Cryst. Solids, 283, 114-118 (2001). C. Kim, Y. Hwang, H.K. Kim, J.N. Kim, Phys.Chem. Glasses, 44(2) (2003), 166-9. H.G. Kim, T. Komatsu, R. Sato and K. Matusita , J. Non-Cryst. Solids, 162, 201-204 (1993). Y.S. Kim, R.E. Tressler, J. Mat. Sci., 29, 2531-2535 (1994). T. Komatsu, R. Ike, R. Sato, K. Matusita, Phys. Chem. Glasses, 36(5) (1995) 216-221 H.G. Kim, T. Komatsu, R. Sato, K. Matusita, J. Mat. Sci. 31 (1996) 2159-2164. T. Komatsu, H. Tawarayama, H. Mohri and K. Matusita , J. Non-Cryst. Solids, 135, 105-113
(1991). A.Koné, B.Barrau, J.L.Souquet, M.Ribes, Mat. Res. Bull, 14 (1979) 393-399. F.Kremer, A.Schönhals, “Broadband Dielectric Spectroscopy”, Springer, Germany, 2002. C.D.E. Lakeman, Y. Xia, J. Kim, X. Wu, H.G. Eckert, F.F. Lange, J. Mater. Res. 13(6) (1998)
1596-1606. S. Lanfredi, L. Dessemond, ACM Rodrigues, Journal of the European Ceramic Society, 20 (7)
(2000) 983-990 G. Li, H. Ma, Y. Jiao, S. Chen, J. Serb. Chem. Soc. 69 (10) (2004) 791-805. R.J.C. Lima, P.T.C. Freire, J.M. Sasaki, A.P. Ayala, F.E.A. Melo, J.M. Filho, K. C. Serra, S.
Lanfredi, M.H. Lente, J.A. Eiras, J. Raman Spect. 33 (2002) 669-674. S. Lin, Y. Tanaka, M. Aono, T. Suzuki, J. Appl. Phys., 36, 3510-3514 (1997). A A Lipovskii, V.D. Petrikov, V.G. Melehin, D.K. Tagantsev, B.V. Tatarintsev, Solid State
Comunications, 117, 733-737 (2001). A.A. Lipovskii, D.K. Tagantsev, A.A. Vetrov, O.V. Yanush, Optical Materials 21 (2003) 749-
757 P.B. Macedo, C.T. Moynihan and R. Bose, Phys. Chem. Glasses, 13:6 (1972) 171-179. J.R. Macdonald, “Impedance spectroscopy”, John Wiley & Sons, New York, 1987. D. Maniu, T. Iliescu, I. Ardelean, S. Cinta-Pinzaru, N. Tarcea, W. Kiefer, J. of Molecular
Structure 651–653 (2003) 485–488 M.L.F. Nascimento “Condutividade elétrica de vidros boratos, silicatos e sílico-sulfatos de
íons alcalinos”, Tese de Mestrado (2000), Univ. de São-Paulo, Brasil (http://www.teses.usp.br/teses/disponiveis/43/43133/tde-09122002-
www.intechopen.com
Glass Ceramics with Para, Anti or Ferroelectric Active Phases
291
161054/publico/dissertacao.pdf) B.T. Matthias, J.P. Remaika, Physical Review, 82 (5), 1951, 727-731
F. Mehran, B.A. Scott, Solid State Communications, 11, 15-19 (1972). A.M.Milankovic and D.E.Day, J. Non-Cryst. Solids, 162 (1993) 275-286. A. Molak, J. Kubacki, Cryst.Res. Technol, 36 (8-10) (2001) 893-902. A Molak, M Paluch, S Pawlus, J Klimontko, Z Ujma, I Gruszka, J. Phys. D: Appl. Phys. 38
(2005) 1450–1460. H.I. Motulsky and A. Christopoulos, Fitting models to biological data using linear and
nonlinear regression. A practical guide to curve fitting, GraphPad Software Inc., San Diego CA, http://www.graphpad.com, (2003).
K. Nassau, C.A. Wang, M. Grasso, J. Am. Ceram. Society, 62 (1978) 503-510. K. Nassau, C.A. Wang, M. Grasso, J. Am. Ceram. Society, 62(1-2) (1978) 74-79 J.M.F. Navarro, “El Vidrio” (CSIC-Fundación Centro Nacional del Vidrio, Madrid 1991). E.R. Neagu, R.M. Neagu, C. Botez, P. Pissis, Fizica Starii Condensate, 1999-2000, p. 249-259. T.J. Negran, A.M. Glass, Phys. Chem. of Glasses, 20, 140-141 (1979). Kia L. Ngai and Ronald W. Rendell in “Handbook of conducting polymers”, vol II, Marcel
Dekker, N.Y., 1986. K.L. Ngai, S.W. Martin, Physical Review B, 40(15) (1989) 10550-56. T. Nozawa, S. Miyazawa, J. Appl. Phys.s, 35, 107-113 (1996). J. Palma, J.R Jurado, P. Duran, C. Pascual, Bol. Soc. Esp. Ceram. Vidrio, 30 (6), 472-475
(1991). A. Paul, “Chemistry of Glasses”, Chapman & Hall, London, 1982 N. Syam Prasad, K.B.R. Varma, J. Non-Cryst. Solids 351 (2005) 1455–1465. E. Prasad, M. Sayer, H.M. Vyas, J. Non-Cryst. Solids, 40, 119-134 (1980). K.J.Rao, K.C. Sobha, S. Kumar, Proc. Indian. Acad. Sci. (Chem. Sci.), 113 (5-6) (2001) 497-514 L. Rebouta, J.C. Soares, M.F. Da Silva, J.A. Sanz-Garcia, E. Dieguez, F. Agullo-Lopez, Mat.
Res. Soc. Symp. Proc., 244 (1992) 311-316; Luis M.F. Rebouta, “Localização de dopantes e caracterização microscópica de dopantes em Niobato de Lítio”, Tese de Doutoramento, Lisboa (1992)
R. Keding, C. Rüssel, J. Non-Cryst. Solids, 219 (1997) 136-141 E.Rysiakiewicz-Pasek, 10th International Symposium on Electrets, 1999 IEEE M.V. Shankar, K.B.R. Varma, J. Non-Cryst. Solids, 243 (1999) 192-203. Z.X. Shen, X.B. Wang, M.H. Kuok, S.H.Tang, J. Raman spectroscopy, 29 (1998) 379-384. G. Shirane, R. Newnham, R. Pepinsky, Phys. Ver. 96(1) (1954) 581-588 N. Shibata, M. Horigudhi, T. Edahino, J. Non-Cryst. Solids, 45 (1981) 115-126. C.J. Simmons, O.H. El-Bayoumi, “Experimental Techniques of Glass Science”, The American
Ceramic Society, Ohio, 1993. K. Singh, P.R. Gandhi, B.M. Chaudhari, Solid State Ionics, 28-30 (1988) 752-755. W.J. Smothers, Y. Chiang, "Handbook of Differential Thermal Analysis", chemical
Publishing Company, Inc., New York (1966). J.Tanaka, M. Tsukioka, Y. Miyazawa, Y. Mori, S. Shimazu, Solid State Comm. 34 (1980) 221-
224
www.intechopen.com
Advances in Ceramics – Electric and Magnetic Ceramics, Bioceramics, Ceramics and Environment
292
J.P. Fillard, J. Van Turnhout, “Thermally stimulated processes in solids:new prospects”, Elsevier Scientific, 1977; P. Braunlich, “ Thermally stimulated relaxation in solids”, Springer, Berlin, 1979.
M. Todorovic, L. Radonjic, Ceramics International, 23 (1997) 55-60. N. Umesaki, N. Iwamoto, M. Tatsumisago, T. Minami, J. Non-Cryst. Solids, 106 (1988) 77-
80. B.H. Venkatareman, N.S. Prasad, K.B.R. Varma, V. Rodriguez, M. Maglione, R.
Vondermuhll, J. Etourneau, App. Phys. Lett. 87 (2005) 091113 E.M. Vogel, J. Am. Ceram. Society, 72 (1989) 719-724 G.H. Weiss, J.T. Bendler, M. Dishon, J. Chem. Phys. 83-3, 1424-1427 (1985); R.S. Weis, T.K.
Gaylord, Applied Physics A, 37 (1985) 191-203. A. J. Moulson, J. M. Herbert, “Electroceramics, Materials _ Properties _ Applications”, 2nd
Edition, Wiley (2003), England. D. Xue, K. Kitamura, Ferroelectrics, 296 (2003) 1-9. T. Yagi, M. Susa, K. Nagata, J. Non-Cryst. Solids 315 (2003) 54–62. Y.I Yuzyuk, P Simon, E Gagarina, L Hennet, D Thiaudi`ere,V I Torgashev, S I Raevskaya, I P
Raevskii, L A Reznitchenko, J L Sauvajol, J. Phys.: Condens. Matter 17 (2005) 4977–4990.
HC Zeng, K Tanaka, K Hiaro, N Soga, J. of Non-Cryst. Solids, 209 (1997) 112-121. N D Zhigadlo, M Zhang, E K H Salje, J. Phys.: Condens. Matter 13 (2001) 6551–6561.
www.intechopen.com

Advances in Ceramics - Electric and Magnetic Ceramics,Bioceramics, Ceramics and EnvironmentEdited by Prof. Costas Sikalidis
ISBN 978-953-307-350-7Hard cover, 550 pagesPublisher InTechPublished online 06, September, 2011Published in print edition September, 2011
InTech EuropeUniversity Campus STeP Ri Slavka Krautzeka 83/A 51000 Rijeka, Croatia Phone: +385 (51) 770 447 Fax: +385 (51) 686 166www.intechopen.com
InTech ChinaUnit 405, Office Block, Hotel Equatorial Shanghai No.65, Yan An Road (West), Shanghai, 200040, China
Phone: +86-21-62489820 Fax: +86-21-62489821
The current book consists of twenty-four chapters divided into three sections. Section I includes fourteenchapters in electric and magnetic ceramics which deal with modern specific research on dielectrics and theirapplications, on nanodielectrics, on piezoceramics, on glass ceramics with para-, anti- or ferro-electric activephases, of varistors ceramics and magnetic ceramics. Section II includes seven chapters in bioceramics whichinclude review information and research results/data on biocompatibility, on medical applications of alumina,zirconia, silicon nitride, ZrO2, bioglass, apatite-wollastonite glass ceramic and b-tri-calcium phosphate. SectionIII includes three chapters in applications of ceramics in environmental improvement and protection, in watercleaning, in metal bearing wastes stabilization and in utilization of wastes from ceramic industry in concreteand concrete products.
How to referenceIn order to correctly reference this scholarly work, feel free to copy and paste the following:
Manuel Pedro Fernandes Grac ̧a and Manuel Almeida Valente (2011). Glass Ceramics with Para, Anti orFerroelectric Active Phases, Advances in Ceramics - Electric and Magnetic Ceramics, Bioceramics, Ceramicsand Environment, Prof. Costas Sikalidis (Ed.), ISBN: 978-953-307-350-7, InTech, Available from:http://www.intechopen.com/books/advances-in-ceramics-electric-and-magnetic-ceramics-bioceramics-ceramics-and-environment/glass-ceramics-with-para-anti-or-ferroelectric-active-phases