21, rue d’Artois, F-75008 PARIS A1-107 CIGRE 2008 http ... rue d’Artois, F-75008 PARIS A1-107...
32
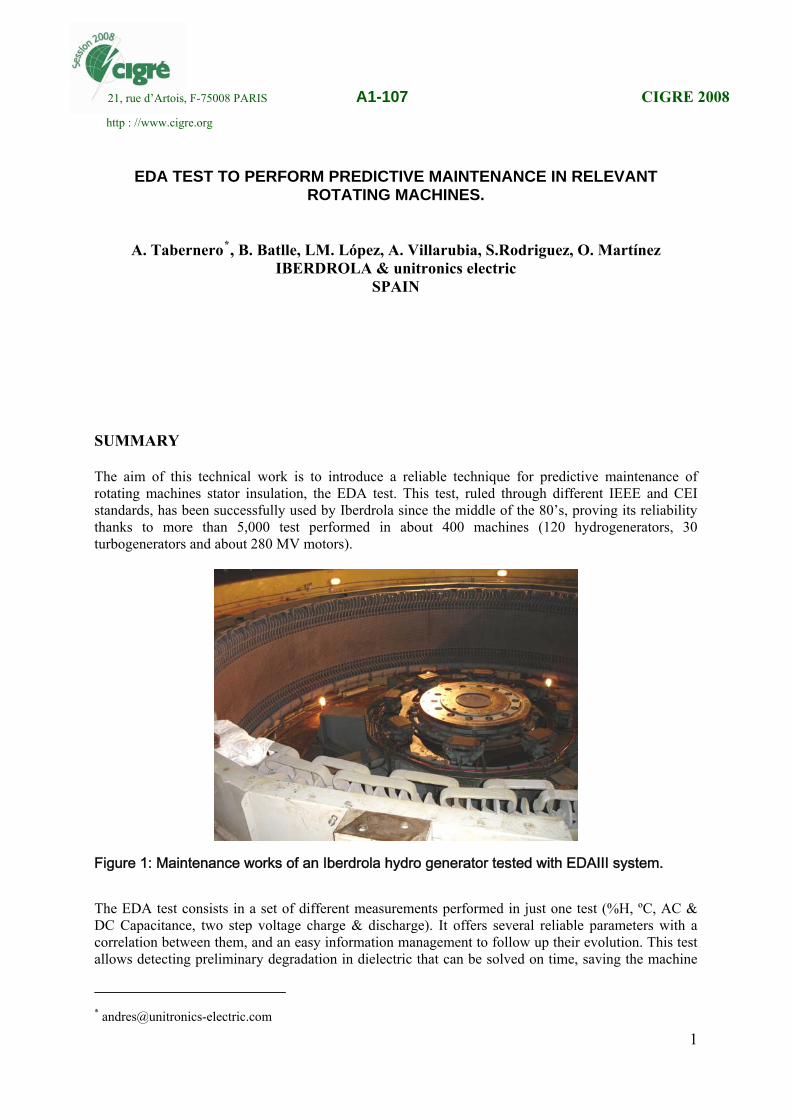
21, rue d’Artois, F-75008 PARIS A1-107 CIGRE 2008 http : //www.cigre.org EDA TEST TO PERFORM PREDICTIVE MAINTENANCE IN RELEVANT ROTATING MACHINES. A. Tabernero * , B. Batlle, LM. López, A. Villarubia, S.Rodriguez, O. Martínez IBERDROLA & unitronics electric SPAIN SUMMARY The aim of this technical work is to introduce a reliable technique for predictive maintenance of rotating machines stator insulation, the EDA test. This test, ruled through different IEEE and CEI standards, has been successfully used by Iberdrola since the middle of the 80’s, proving its reliability thanks to more than 5,000 test performed in about 400 machines (120 hydrogenerators, 30 turbogenerators and about 280 MV motors). Figure 1: Maintenance works of an Iberdrola hydro generator tested with EDAIII system. The EDA test consists in a set of different measurements performed in just one test (%H, ºC, AC & DC Capacitance, two step voltage charge & discharge). It offers several reliable parameters with a correlation between them, and an easy information management to follow up their evolution. This test allows detecting preliminary degradation in dielectric that can be solved on time, saving the machine * [email protected] 1
Transcript of 21, rue d’Artois, F-75008 PARIS A1-107 CIGRE 2008 http ... rue d’Artois, F-75008 PARIS A1-107...
21, rue d’Artois, F-75008 PARIS A1-107 CIGRE 2008http : //www.cigre.org
EDA TEST TO PERFORM PREDICTIVE MAINTENANCE IN RELEVANT
ROTATING MACHINES.
A. Tabernero*, B. Batlle, LM. López, A. Villarubia, S.Rodriguez, O. Martínez
IBERDROLA & unitronics electric SPAIN
SUMMARY The aim of this technical work is to introduce a reliable technique for predictive maintenance of rotating machines stator insulation, the EDA test. This test, ruled through different IEEE and CEI standards, has been successfully used by Iberdrola since the middle of the 80’s, proving its reliability thanks to more than 5,000 test performed in about 400 machines (120 hydrogenerators, 30 turbogenerators and about 280 MV motors).
Figure 1: Maintenance works of an Iberdrola hydro generator tested with EDAIII system.
The EDA test consists in a set of different measurements performed in just one test (%H, ºC, AC & DC Capacitance, two step voltage charge & discharge). It offers several reliable parameters with a correlation between them, and an easy information management to follow up their evolution. This test allows detecting preliminary degradation in dielectric that can be solved on time, saving the machine
1

from premature faults and regaining it to service, some times with low cost maintenance. The EDA test is an easy to perform process that allowed Iberdrola defining it as the first level of the electrical maintenance policy. Nowadays Iberdrola owns 41.001 MW of power installed in Spain, Latin-America and United Kingdom (Scottish Power), corresponding to different generation technologies. In Spain, the 26.509 MW of power installed are distributed as:
Hydraulic: 8.842 MW Thermal Coal: 1.253 MW Thermal Gas-Fuel: 2.889 MW Nuclear: 3.344 MW Wind & Mini-Hydraulic: 4.977 MW Combined Cycle: 4.800 MW Co-generation: 404 MW
In terms of production centers it means:
One nuclear power plant owned 100% and different percentages in another 5 plants 3 coal fired power plants 4 fuel-oil & gas fired power plants 9 combined-cycle power plants 80 large and 93 small hydro-power plants The first company in the world about wind-generation power installed with more than
3.800 MW In terms of relevant machines it means:
29 turbo generators from 148 to 514 MW, cooled by H2 and air 1 turbo of about 1.000MW water cooled 156 large hydrogenerators, 33 of them with more than 100MW
In order to manage the predictive maintenance of these number of machines, the EDA test has been established as the first level of electrical maintenance policy. That means it can be performed once a year or every two years by the plant technicians, without need of a specialized test engineer. This test gives information about the general state of the insulation and indicates the risk of more critical problems that will be confirmed with a second instance test or visual inspections. The easy test process and its traceability, where the results of the test are not affected by the operator, make EDA an excellent tool for trending. Iberdrola defines the following types of predictive inspections of rotating machines. They depend of its aim and situation. There, EDA is considered as the main routine test for all rotating machines: Hydrogenerators, Turbogenerators and MV Motors.
2

Table I: Description of the Maintenance program of Iberdrola for Rotating Machines.
A Basic or first level inspection inside of Maintenance program. Routine tests. EDA On-Line Partial Discharge
B Specific or second level inspection inside of Maintenance program. Special or type tests. Internal Visual Inspection Stator Windings
Power Factor Off-Line Partial Discharge
Winding Resistance Surge Test (If multiturn coils)
Generators Rotor Windings Insulation Resistance and
Polarization Index Winding Resistance
Impedance Surge Test
RSO
C
After repair (cleaning or rewinding) or first test on new machines / intensive inspection when the rotor is disassembled. Intensive Tests. These inspections on regular bases are only performed in Generators. In motors, these kinds of tests are only carried out during repair or fault investigation.
Stator Windings TVA Test.
Core tests EL CID
Wedge Tap Test. The periodic bases of these inspections will depend of machine characteristics, running hours, operation characteristics, machine importance for operation, machine status, if there is redundancy, etc. Anyway, as a general basis, following periodicity is established for Turbo generators, Large hydro and MV motors, in years:
Table II: Periodicity of Maintenance Works per rotating machine in Iberdrola facilities.
YEARS TURBO HYDRO MOTOR
MACHINE INSPECTION A B C A B C A B
<20 2 2 6 2 4 12 2 10 20…40 1 1 5 1 3 9 1 5 Age
(years) >40 1 1 5 1 2 6 As you can appreciate, in order to reduce assembling and disassembling works and time consumption, as well as have bigger information as possible in each inspection, type A is always performed at the same time that B and A+B when inspection type C is carried out. In this paper we present the results of a technical work performed only in a wide group of motors. This sample is chosen because of the large amount of motors available in any thermal production center. In such locations there are a lot of machines with similar characteristics and similar working conditions (load, contamination, running hours… ) making the study more uniform. KEYWORDS EDA - Predictive Maintenance - Insulation testing - Stator insulation – Electrical insulation
3
1.- TEST DESCRIPTION It is an off-line, DC test that obtains information concerning overall status of the insulation. It consists first in the measure and comparison of the capacitance of the insulation submitted at low AC and DC voltage, and second in the analysis of the current through the insulation during two charge and discharge cycles performed at two different test voltages. In this case, the behavior should be linear when the machine status is good. If this is not the case, we have an indication of degradation. EDA test is a non destructive DC voltage Test. The test consists in the following sequence of data acquiring:
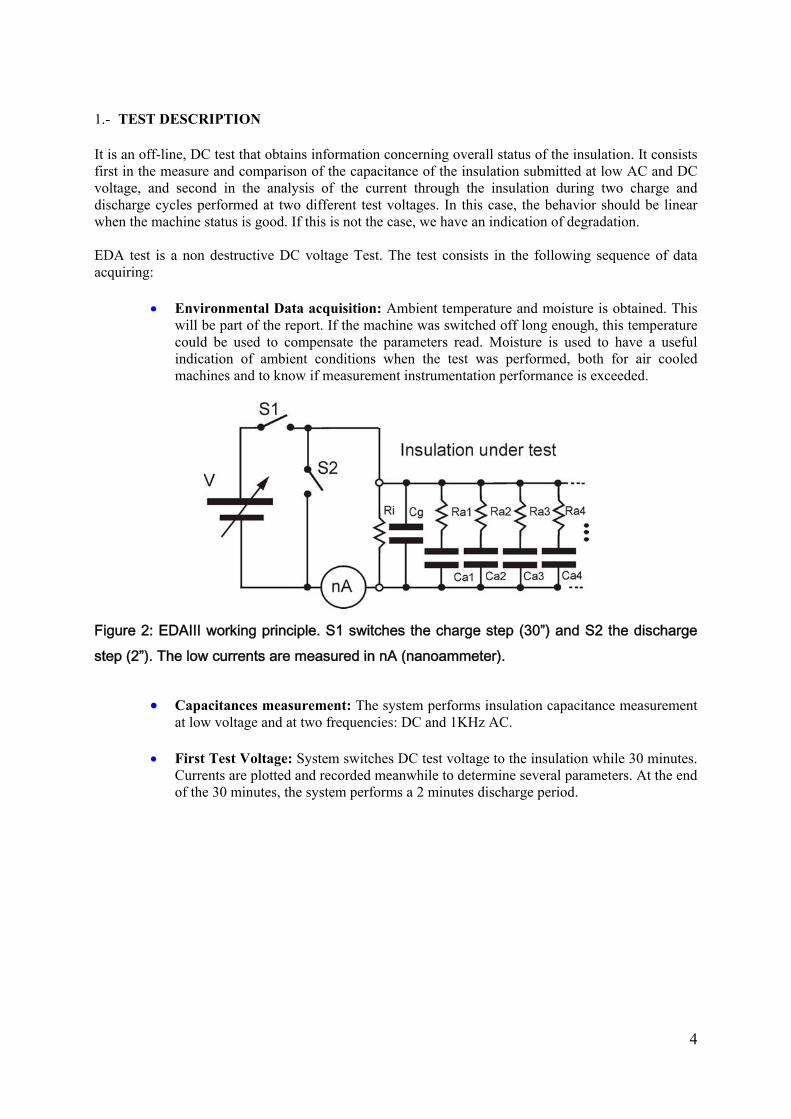
• Environmental Data acquisition: Ambient temperature and moisture is obtained. This will be part of the report. If the machine was switched off long enough, this temperature could be used to compensate the parameters read. Moisture is used to have a useful indication of ambient conditions when the test was performed, both for air cooled machines and to know if measurement instrumentation performance is exceeded.
Figure 2: EDAIII working principle. S1 switches the charge step (30”) and S2 the discharge step (2”). The low currents are measured in nA (nanoammeter).
• Capacitances measurement: The system performs insulation capacitance measurement
at low voltage and at two frequencies: DC and 1KHz AC. • First Test Voltage: System switches DC test voltage to the insulation while 30 minutes.
Currents are plotted and recorded meanwhile to determine several parameters. At the end of the 30 minutes, the system performs a 2 minutes discharge period.
4

Figure 3: Measured direct current (IT) is made up by the sum of three currents: Conductance (IG), Leakage (IL), Capacitance (IC) and Absorption (IA). “Extracted from IEEE Std 43-2000”.
• Second Test Voltage: After complete discharge of the insulation from 1st test voltage, a
second test voltage with a value above the 1st is applied to the machine. The procedure is the same. This step is made to check for possible problems in insulation at a high voltage and second to check about linearity of insulation with voltage.
Figure 4: Currents flowing while the test. In black is the first voltage’s current and in red the second voltage one. First 30 minutes is the charge step and follows 2 minutes discharge step.
• Diagnosis: The diagnosis management works in two steps: First and as reference of
initial values, an electrical engineer performs and EDA test during machine commissioning or after any refurbishment, stating so that the reference values are those of health insulation. After that and during routine maintenance, once finished the test, the inspector can immediately check the numeric values of all the parameters and their comparison with previous test done and the initial reference values and have so that a punctual view of the status of the machine insulation.
5
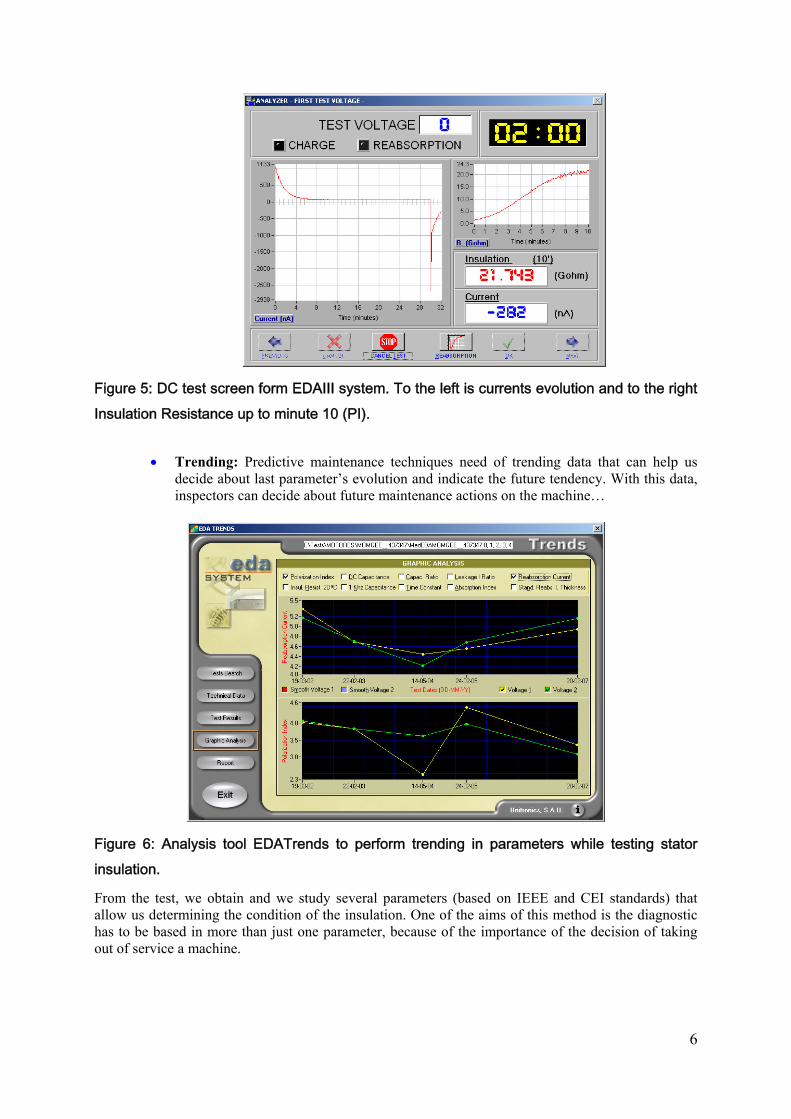
Figure 5: DC test screen form EDAIII system. To the left is currents evolution and to the right Insulation Resistance up to minute 10 (PI).
• Trending: Predictive maintenance techniques need of trending data that can help us
decide about last parameter’s evolution and indicate the future tendency. With this data, inspectors can decide about future maintenance actions on the machine…
Figure 6: Analysis tool EDATrends to perform trending in parameters while testing stator insulation.
From the test, we obtain and we study several parameters (based on IEEE and CEI standards) that allow us determining the condition of the insulation. One of the aims of this method is the diagnostic has to be based in more than just one parameter, because of the importance of the decision of taking out of service a machine.
6
2.- TEST PARAMETERS AND INTERPRETATION EDA system offers a group of parameters that when analyzed together give a very good approach of insulation status. Now we indicate each parameter, what does the parameter indicate and how it changes because of different problems with a simple explanation. The main parameters we analyze are:
• Capacitance Ratio (CR). This is the ratio between DC and AC (1KHz) capacitances.
This ratio allows detect contamination and moisture problems.
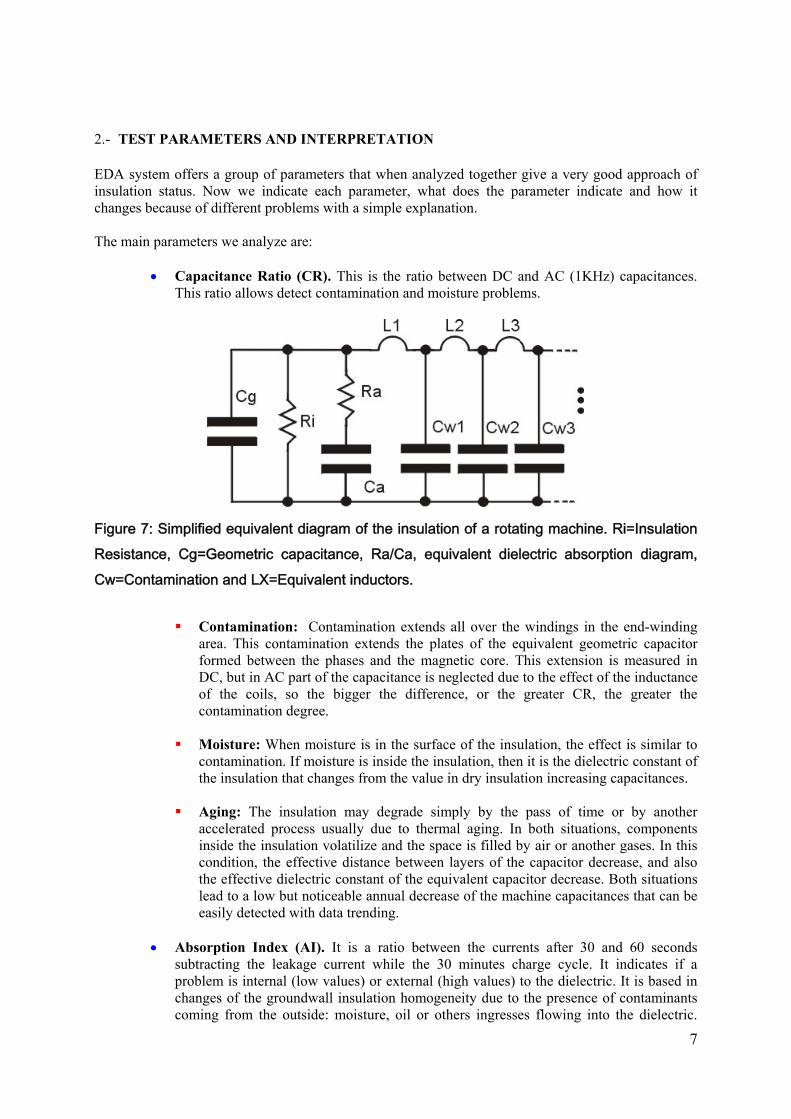
Figure 7: Simplified equivalent diagram of the insulation of a rotating machine. Ri=Insulation Resistance, Cg=Geometric capacitance, Ra/Ca, equivalent dielectric absorption diagram, Cw=Contamination and LX=Equivalent inductors.
Contamination: Contamination extends all over the windings in the end-winding
area. This contamination extends the plates of the equivalent geometric capacitor formed between the phases and the magnetic core. This extension is measured in DC, but in AC part of the capacitance is neglected due to the effect of the inductance of the coils, so the bigger the difference, or the greater CR, the greater the contamination degree.
Moisture: When moisture is in the surface of the insulation, the effect is similar to
contamination. If moisture is inside the insulation, then it is the dielectric constant of the insulation that changes from the value in dry insulation increasing capacitances.
Aging: The insulation may degrade simply by the pass of time or by another
accelerated process usually due to thermal aging. In both situations, components inside the insulation volatilize and the space is filled by air or another gases. In this condition, the effective distance between layers of the capacitor decrease, and also the effective dielectric constant of the equivalent capacitor decrease. Both situations lead to a low but noticeable annual decrease of the machine capacitances that can be easily detected with data trending.
• Absorption Index (AI). It is a ratio between the currents after 30 and 60 seconds
subtracting the leakage current while the 30 minutes charge cycle. It indicates if a problem is internal (low values) or external (high values) to the dielectric. It is based in changes of the groundwall insulation homogeneity due to the presence of contaminants coming from the outside: moisture, oil or others ingresses flowing into the dielectric.
7

This behavior can be appreciated again from figure 7 because: Cg gets charged before the 30 seconds and in 30 minutes leakage current is most contributed from Ri, so Ri influence is neglected. What remains?, only the effect of the equivalents Ra/Ca and Cwx., If the plot of the current gives a defined corner slope it gives high AI values indicating external contamination, if the slope is slow it means that the insulation has problems in the Ra/Ca component indicating through low AI values internal problems.
• Reabsorption Current (RC). After 30 minutes, the insulation is considered fully
charged. Then a short-circuit is made and flows the Re-turned absorption current that was acquired while the absorption period but this time without the influence of the other currents. The value is taken after one minute of the discharge cycle. If there is a bigger heterogeneity inside the dielectric (water, vapor, oil, dust…), it has more areas to store energy as polarized dipoles, leading to bigger repolarization currents. From previous tests, if RC goes up, it is possibly due to the degradation of the insulation (delamination, increase of voids, etc). It’s possible to detect uncured resin if we compare this parameter with test results from similar machines.
• Time Constant (TC). It is the product of an Insulation Resistance (IR) value and the AC
Capacitance. New machines must show high initial values because of the high IR expected initial values. In a normal life and degradation, both IR and CAC decrease, so throughout the life of the machine TC descends slightly. Therefore, if the value falls faster than expected, it indicates a faster aging, and so an abnormal degradation. It confirms contamination or delamination problems, depending of the case. It must be temperature normalized.
• Leakage Current Ratio (LCR). It’s the ratio between the leakage current (current after
the 30 minutes of charge process) measured at the first voltage and at the second voltage. The result is made comparable through the voltage ratio between the two processes. The ideal value is 1,0: This value would mean that the insulation behavior is linear with voltage. If the value is far from the ideal value, it should confirm a problem detected with the other parameters.
• Insulation Resistance (IR). Every machine should be above a minimum value,
depending on the machine voltage. The decrement of this value indicates insulation contamination or degradation. After external cleaning it should increase noticeably. As can be seen in figure 7, Ri is made up from surface resistance influenced by contamination and internal resistance that includes internal insulation contamination and possible aging. It requires temperature correction.
• Polarization Index (PI). It indicates together with IR different problems like
contamination and moisture absorption. If PI tendency is going down from previous tests, the machine has one of the described problems. Otherwise, if PI increases in excess, it can indicate brittle insulation in some older types of insulation.
8

3.- SECOND INSTANCE STATOR INSULATION TEST TECHNIQUES When EDA test gives evidences of one or more insulation problem, it’s the time to confirm this issue with 2nd instance techniques, before taking the decision of opening the machine. These techniques usually need more expensive or complex equipment and needs better trained people not just for the testing but for the interpretation of the results as well, so they are only performed when the first instance tests recommends a deeper study. These techniques are also non destructive tests and could be:
• Internal Visual Inspection. The scope of this inspection will depend on the accessibility to the winding of the machine, performed by expert personnel. This will be the most valuable tool to detect the effects of the different degradation mechanisms, especially if those happen in the end-winding area.
• Power factor or Dissipation factor (tan δ) and tip-up. Tan delta gives a global
indication of losses in the dielectric and can give a clue of the thermal aging status of the machine. Also, this test could give information about end-winding area with UST Test Techniques.
• Capacitance and capacitance tip-up. High voltage capacitance deduced from tan δ test
also gives clear indication of changes in the insulation system. It monitors moisture and other abnormal conditions. The tip-up indicates how changes the equivalent capacitance with voltage, this says us how changes the amount of PD (Partial Discharges) voids activated by voltage increase. It also monitors moisture ingress and delamination.
• Partial discharge analysis. Monitors degradation of the insulation system. It can be on
or off-line. It can also give an indication of the possible location of the discharges inside the dielectric (next to the coil, in the groundwall or in the interface to the core).
• TVA probe. TVA Probe testing (Tennessee Valley Authority Probe) allows physical
location of the partial discharge activity, mainly if it is a slot discharge problem.
• Surge Test. It is intended to test turn-to-turn insulation in form-wound multiturn coils.
• Hi-pot. It is a destructive test that should be performed with extreme caution. It must be evaluated the convenience of the performance of this test.
9

4.- TEST DESCRIPTION
Here we present a study of some real cases to show how the value and the trends of these parameters are reliable and help to detect evolving problems in several situations. The cases are taken from Iberdrola testing files and describe problem detection through different EDA test results and how the described 2nd instance techniques confirm the problems. Base information about the sample and study follows in the table:
Table III: Description of the study.
Description of the study: Sample, machine data, how tests are performed and diagnosed. Ages:1,8,26,40,42 Tests from: 7 years
2001…2007 Machines: 33 Motors named:
[00]…[32] Mean age:37,3 Test population is located in a Thermal Power Plant. It is an IBERDROLA utility producing around 580MW. Conditions: Next to the sea (moisture & salt), next to industrial area, fuel central.
Sample
Contaminants: Dust, moisture from ambient or leaks and oil from bearings. Machines Voltage: 4,16kV Power:0,1…3,68MVA Insulation: Epoxi-
Mica Performed: 204 Validated: 181 (~89%) Tester: EDAIII 30min charge (usual: 1500 / 3000V), 2 min discharge
Low voltage DC / AC (1KHz) capacitances
% moisture, ambient and machine ºC
Tests
Performed at two voltages in order to check insulation linearity with voltage. Diagnosis is taken from the maintenance records of the real status of the machine at
the date of each test. OK, Operable: 43
Surface Contam.: 24
Internal Degradation: 107 Internal Contamination: 07
Diagnosis of Tests
Parameters for diagnosis are taken from High voltage results, so that any kind of problem will be hardly marked because of the bigger electric field stress.
All test performed were validated before being processed. Test system (EDAIII) is intended to eliminate most of human error, but apart from this, many test were invalidated because of very high moisture in ambient or machine. This could cause moisture deposit in machine’s surface, most of failed tests were repeated after the machine was dried and results changed to normal values.
After validation, and although more complex intermediate results could be defined, for this
study, tests diagnosis are only classified in four categories, the most usual in the test environment and corresponding to the records on machine maintenance history:
[1] Healthy machines, suitable for operation. The insulation is in good condition, there
is no serious contamination level. If the unit is old (>30years), the degradation degree is according to normal aging and doesn’t show symptoms of accelerated or abnormal thermal aging.
[2] Surface contamination problems. Due to dust, insects, oil or simply moisture or also
to a combination of several of these factors. If nothing was done, it could lead to electrical tracking and contamination ingress in the insulation decreasing its useful life. It is most of the times easily reversible with cleaning & drying works.
10

[3] Internal degradation problems. Usually due to thermal aging. It is irreversible and
makes necessary a more intensive trending up to the rewinding of the machine be needed. Insulation exceeds usual aging values; it is losing its properties and can support less stress. The machine is subject to a greater probability of failure in service.
[4] Internal contamination problems. This situation is not very usual in epoxy
insulation, but sometimes and due to cracks or fissures in insulation, delamination and ingress of moisture, dirty or oil can also flow inside the coil insulation. It is most of the times hardly to reverse.
It is obvious that some machines can have (normally) more than one problem at a time. For
this study, only one problem is allowed in each diagnose, the usual preference is: First Health machines, Contaminated & Degraded as the last. Take note that both contaminations can change Degraded values and change Degradation diagnosis, so the user should first try to solve this easy to reverse problems in Contaminated machines before evaluating other hardly to solve problems related to Degradation. It is also logic that most of the times that Internal Contamination happens; it will also show External Contamination traces.
The last step of the investigation was to execute histograms for the different test parameters
under study: For each parameter, the first histogram presents data distribution from low voltage / high voltage test. The second histogram presents data classification for this four diagnosis categories.
5.- TEST CONCLUSIONS After the investigation of each parameter, their relationship with their different degradation mechanism and correlation between the parameters, here are the conclusions that could be extracted. For each problem mode not all the results answer always in the limited ranges, a few tests show values out of range that should be further investigated. Some values are given as an approximation and another with no relevant influence are marked as [??], and the units of each parameter are: CR[%], AI[Dimensionless], RC[mA/FV], TC[seconds], LCR[Dimensionless], IR[GΩ@20ºC], PI[Dimensionless].
Machine in correct conditions.
• Punctual Data: Good values for machines in good conditions are: CR[<10%], AI[>1,56], RC[>5,0], TC[>300], LCR[0,9…1,2], IR[>1], PI[>2].
• Trending data: Correct machines don’t show large evolution changes in any parameters. If the machine is in a good aging status, CAC shouldn’t increase and have a decrease rhythm below 1% / year. For the machine not to show contamination signs, CDC should not go 10% above CAC.
Surface contamination.
• Punctual Data: The set of values that can monitor this condition are: CR[>10%],
AI[>1,56], RC[??], TC[<400], LCR[<0,9 or >1,2], IR[<5], PI[<2,5]. If moisture is present the changes in parameters are more noticeable.
• Trending data: Machines with surface contamination will show increase in CR values. Watching tendency CR will show an increase coming from an increase of CDC with no noticeable change in CAC. If it also increases, CAC it means that some moisture can have gone inside the insulation.
11

Internal contamination.
• Punctual Data: The parameters and values that give clues to monitor this problem will be: CR[??] AI[<1,56], RC[??], TC[<400], LCR[<0,9 or >1,2], IR[<5], PI[<2,5].
• Trending Data: CAC should only go down with aging. When contamination goes inside the insulation, CAC will go up because of the change of the dielectric constant, the effect will be more pronounced when contamination goes with water. It is usual that internal contamination goes together with surface contamination, so we should also expect an increase of CDC in this situation.
Thermal Aging.
• Punctual Data: The values that should be monitored to check this problem are:
CR[??], AI[??], RC[>5], TC[<400], LCR[???], IR[??], PI[??]. It is relevant to say that both IR and PI don’t give any indication of this problem.
• Trending Data: Two relevant parameters indicate this effect: CAC : when it has an decrease rhythm above 1% / year and RC when it has an increase rhythm above than 0,5+(0,2*year). The usual trend of TC is to keep at low values [<400] or decrease.
12

6.- TEST RESULTS As previously explained, the test is performed in a sample of motors in a thermal central. Now we present all the parameters subject to analysis. For each one an introductory table is presented, and after follows numerical results and each parameter conclusions.
Table IV: Insulation Resistance description.
PARAMETER: Acronym = IR Insulation Resistance Units [GΩ] Formula
min1min1 I
VKIR ⋅= [01]
K= Temperature compensation
V= Test voltage, named Low V & High V
I1min= Current measured after 1 minute in load period
Minimum: 0,202GΩ Mean: 3,689GΩ Maximum: 51,604GΩ Recommended minimum values for operation or hipot from standard IEEE 43-2000 are…: Minimum IR MΩ (40ºC)
Test specimen Minimum IR tolerable for tested 4,16kV motors
IR1min=(kV+1)MΩ Most windings before 1970, all field windings and others not described below
0,00516GΩ
IR1min=100MΩ Most dc armature and ac windings after 1970 (form wound coils)
0,100GΩ ~0,500GΩ @ 20ºC
Insulation Resistance Histogram
0
2
4
6
8
10
12
14
16
18
0 0,2 0,4 0,6 0,8 1 1,2 1,4 1,6 1,8 2 2,2 2,4 2,6 2,8 3 3,2 3,4 3,6 3,8 4 4,2 4,4 4,6 4,8 5 5,2 5,4 5,6 5,8 6 7 8 9 10 20 30 40 51,6
Gohm (20ºC)
# Tests
Low V High V
Figure 8: Histogram with IR values distribution of Tests performed.
The histogram with all valid samples indicates that almost all samples concentrate between 0,6GΩ and 7GΩ. Note that to include most samples in the plot, it is presented with a no lineal step change ranging: 0,2Gohm step between [0…6GΩ], 1GΩ step between [6GΩ…10GΩ] and 10GΩ step between [10GΩ…50GΩ].
13
Insulation Resistance Histogram
0
1
2
3
4
5
6
7
8
9
10
0 0,2 0,4 0,6 0,8 1 1,2 1,4 1,6 1,8 2 2,2 2,4 2,6 2,8 3 3,2 3,4 3,6 3,8 4 4,2 4,4 4,6 4,8 5 5,2 5,4 5,6 5,8 6 7 8 9 10 20 30 40 51,6
Gohm (20ºC)
# Tests
OK operation Surface Contamination Internal Degradation Internal Contamination
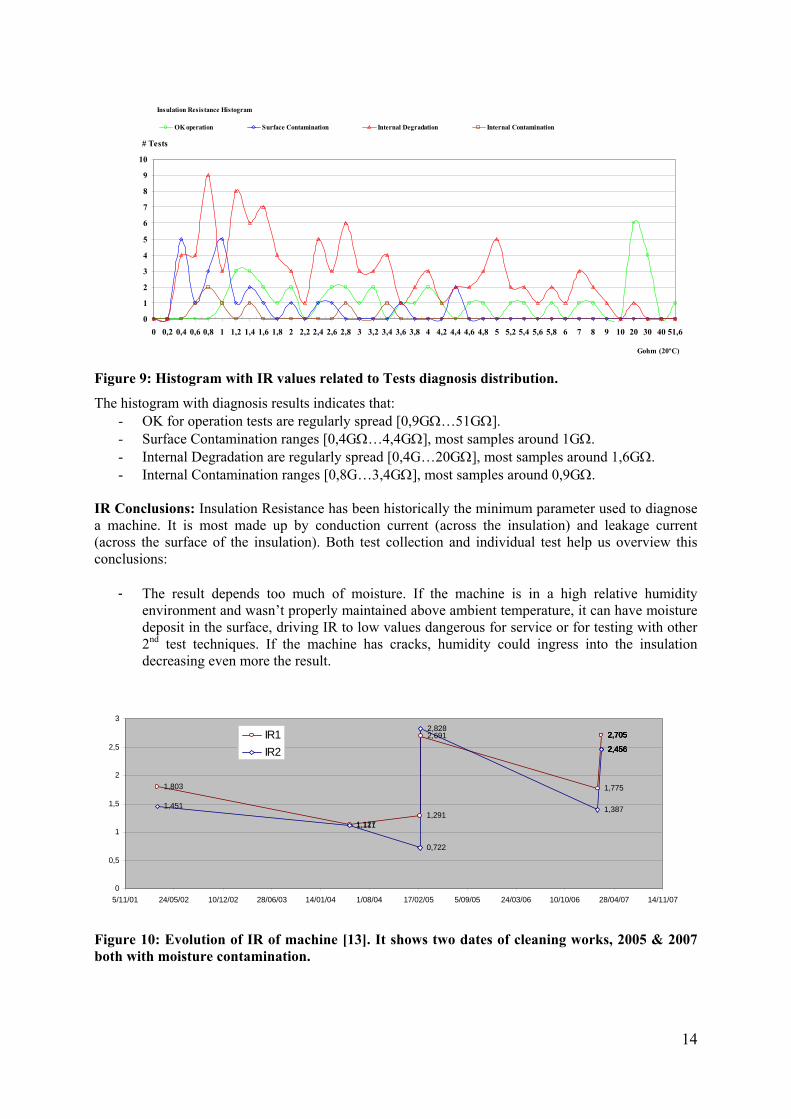
Figure 9: Histogram with IR values related to Tests diagnosis distribution.
The histogram with diagnosis results indicates that: - OK for operation tests are regularly spread [0,9GΩ…51GΩ]. - Surface Contamination ranges [0,4GΩ…4,4GΩ], most samples around 1GΩ. - Internal Degradation are regularly spread [0,4G…20GΩ], most samples around 1,6GΩ. - Internal Contamination ranges [0,8G…3,4GΩ], most samples around 0,9GΩ.
IR Conclusions: Insulation Resistance has been historically the minimum parameter used to diagnose a machine. It is most made up by conduction current (across the insulation) and leakage current (across the surface of the insulation). Both test collection and individual test help us overview this conclusions:
- The result depends too much of moisture. If the machine is in a high relative humidity environment and wasn’t properly maintained above ambient temperature, it can have moisture deposit in the surface, driving IR to low values dangerous for service or for testing with other 2nd test techniques. If the machine has cracks, humidity could ingress into the insulation decreasing even more the result.
1,803
1,1271,291
2,691
1,775
2,7052,7052,7052,705
1,451
1,111
0,722
2,828
1,387
2,4562,4562,4562,456
0
0,5
1
1,5
2
2,5
3
5/11/01 24/05/02 10/12/02 28/06/03 14/01/04 1/08/04 17/02/05 5/09/05 24/03/06 10/10/06 28/04/07 14/11/07
IR1IR2
Figure 10: Evolution of IR of machine [13]. It shows two dates of cleaning works, 2005 & 2007 both with moisture contamination.
14

Figure 11: Photo of machine [13] before cleaning works in March, 05 of 2007 (see previous
figure).
- For dry-good “OK operation” insulation status, the machine should be above 0,5GΩ at 20ºC.
Different Machines show values from 0,9GΩ to 51GΩ depending on machine age, size, temperature, moisture and others.
- Both “Surface contamination” and “Internal contamination” problems decrease IR values down to 1GΩ area, but no minimum value to indicate this problems can be defined because there are also healthy machines with similar values. In order to discern these problems it is necessary to correlate this data with Polarization Index. Also, trending data can be used to detect this effect and check the efficiency of cleaning works.
- “Internal degradation” doesn’t necessary change much IR values except if there are conduction paths inside the insulation, then values go down to 1GΩ area.
- Changes: IR decreases with temperature increase (so the data should be temperature corrected), decreases with pollution, moisture (results can’t be corrected with moisture, but moisture should be measured), oil or other contaminants either internal or external. After maintenance works like cleaning, drying, etc IR should increase again.
15

Table V: Polarization Index description.
PARAMETER: Acronym = PI Polarization Index Units [Dimensionless] Formula
min1
min10
IRIR
PI = [02]
IR10min= Current measured after 10 minutes in load period
IR1min= Current measured after 1 minute in load Period
Minimum: 0,48 Mean: 3,298 Maximum: 6,6 Recommended minimum values for operation or hipot from standard IEEE 43-2000 are…: Thermal class rating Minimum P.I. Minimum tolerable for
tested 4,16kV motors Class A 1,5 Not the case Class B, F & H 2,0 2,0
Polarization Index Histogram
0
2
4
6
8
10
12
14
16
0,1 0,4 0,7 1 1,3 1,6 1,9 2,2 2,5 2,8 3,1 3,4 3,7 4 4,3 4,6 4,9 5,2 5,5 5,8 6,1 6,4 6,7 7,1
Adimensional
# Tests
High_V Low_V
Figure 12: Histogram with PI values distribution of Tests performed.
The histogram with all valid samples indicates that almost all samples concentrate between 2 and 5, with a mean around 3,6. The step is linear in all range of 0,1.
16
Polarization Index Histogram
0
1
2
3
4
5
6
7
8
9
0,1 0,4 0,7 1 1,3 1,6 1,9 2,2 2,5 2,8 3,1 3,4 3,7 4 4,3 4,6 4,9 5,2 5,5 5,8 6,1 6,4 6,7 7,1
Adimensional
# Tests
OK operation Surface Contamination Internal Degradation Internal Contamination
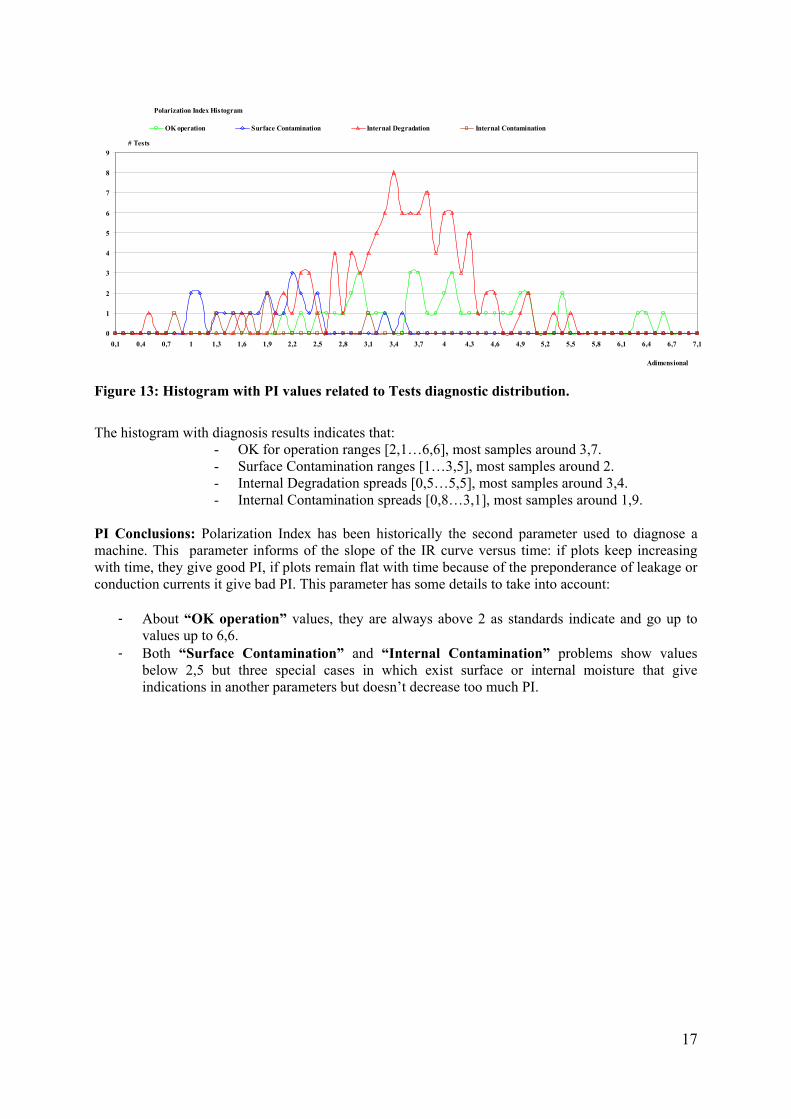
Figure 13: Histogram with PI values related to Tests diagnostic distribution.
The histogram with diagnosis results indicates that:
- OK for operation ranges [2,1…6,6], most samples around 3,7. - Surface Contamination ranges [1…3,5], most samples around 2. - Internal Degradation spreads [0,5…5,5], most samples around 3,4. - Internal Contamination spreads [0,8…3,1], most samples around 1,9.
PI Conclusions: Polarization Index has been historically the second parameter used to diagnose a machine. This parameter informs of the slope of the IR curve versus time: if plots keep increasing with time, they give good PI, if plots remain flat with time because of the preponderance of leakage or conduction currents it give bad PI. This parameter has some details to take into account:
- About “OK operation” values, they are always above 2 as standards indicate and go up to values up to 6,6.
- Both “Surface Contamination” and “Internal Contamination” problems show values below 2,5 but three special cases in which exist surface or internal moisture that give indications in another parameters but doesn’t decrease too much PI.
17

Figure 14: Evolution of PI of motor [13]: It shows clean works in 2005 and 2007.
- For “Internal Degradation”, the results don’t necessary show values under 2. Even more,
most of the values seem very good and around 3, so to estimate this problem this parameter is not significant and should be used another parameter like Reabsorption Current.
- Changes: PI has almost no change with temperature; it decreases with pollution, most of the times also with moisture, oil or other contaminants either internal or external. After maintenance cleaning, drying, etc PI should increase again.
18

Table VI: Capacitance Ratio Description.
PARAMETER: Acronym = CR Capacitance Ratio Units [Dimensionless, %] Formula
DC
ACDC
CCC
CR−
⋅= 100 [03]
Inside Formula
dSpFC ε=)( [04]
CDC= Low voltage direct current capacitance
CAC= Low voltage alternate current (1KHz) capacitance
Where C = [Pico Farads], ε=εr*ε0=8,854(pF/mm)* ε0
ε0 aire=1, ε0 epoxi-mica=4, ε0 agua=80
S=area of one plate (mm2) d=distance between plates (mm)
CR Minimum: -5,25% CR Mean: 7,172% CR Maximum: 57,89% CDC Minimum: 19nF CDC Mean: 89,7nF CDC Maximum: 351nF CAC Minimum: 16nF CAC Mean: 83,1nF CAC Maximum: 332nF
Capacitance Ratio
0
2
4
6
8
10
12
14
-5,25 0,5 1,25 2 2,75 3,5 4,25 5 5,75 6,5 7,25 8 8,75 9,5 11 14 17 20 23 26 29 32 35 38 41 44
Adimensional %
# Tests Low_V
Figure 15: Histogram with CR values related to Tests performed.
The histogram with all valid samples shows some values around 0 (equal capacitances) and the remaining results range from 2 to 17 with a mean around 8. Step is of 0,25 up to 10 and of 1 up to 46.
19

Capacitance Ratio
0
1
2
3
4
5
6
7
8
9
10
-5,25 0,5 1,25 2 2,75 3,5 4,25 5 5,75 6,5 7,25 8 8,75 9,5 11 14 17 20 23 26 29 32 35 38 41 44
Adimensional %
# Tests
OK operation Surface Contamination Internal Degradation Internal Contamination
Figure 16: Histogram with CR values related to Tests diagnostic distribution.
The histogram with diagnosis results indicates that: - OK for operation range [0…10], most samples around 3,7. - Surface Contamination ranges [2…41], most samples around 11. - Internal Degradation spreads [0…21], most samples around 5. - Internal Contamination spreads [6…22], most samples around 8.
CR Conclusions: DC & AC capacitances, Capacitance Ratio and trending of them are good tools to help discern and confirm surface / internal contamination.
Figure 17: Diagram that explains CAC / CDC variations: LS & CS are the slot components, LE & CE are the end-winding components and RE is the end-winding contamination effect.
The diagram in figure 17 explains why CAC and CDC measurements are performed. The capacitance evaluated with the capacimeter is the geometric capacitance. With the aid of the DC & AC measurement options, we can discern some effects related with contamination. In general, CG (Geometric) can be expanded into this complex model including CS (slot component) and CE (end winding component). In general, when external contamination appears, a layer deposit on the end winding area extends the ground plate of CE capacitor (effect simulated in the figure as RE) increasing DC measured capacitance. When AC capacitance is taken, both LS and LE begin to open at test frequency (standard 1KHz) and decrease the measurement of this capacitances.
- The “OK operation” results show values of CR up to 10 (all range), so good machines are
discerned with the aid of PI>2. As can be seen from figure 17, any new machine will have CDC > CAC because LS will also decrease CS (CR mean value in ok machines is ~4%). About trending, the important is that although CDC >CAC, both shouldn’t change much in time as seen
20

in the first 3 tests in Figure 18. - For the problems “Surface Contamination” and “Internal Contamination”, it is necessary
to discern problematic machines with the aid of PI<2. - “Surface Contamination”: From the explanation before, 1KHz measurement takes apart
contamination influence, so when CDC >> CAC (CR goes from 4% to above 10%) a surface contamination problem exist. In trending the observable effect is that CAC doesn’t almost change and CDC increases as in figure 18, some time after the contamination is taken out and CDC returns to normal values.
107 107 106
142140
108
177 178178
104 104 103106105103
167 169169
100
110
120
130
140
150
160
170
180
6/12/99 19/04/01 1/09/02 14/01/04 28/05/05 10/10/06 22/02/08
Cdc
Cac
Figure 18: Effect of Contamination in machine [17]. CDC remains almost flat. After four days maintenance works finally take contamination out. Next year the unit is rewound.
- “Internal Contamination”: In epoxy based insulation it is no usual water ingress, but in the event of degraded machines with cracks and some delamination degree, water flows inside spaces in the insulation and increases permittivity from near 4 to around 80 finally increasing capacitance both in DC and AC. It is the same situation if some strange material like oil enters inside the insulation. This increase of AC capacitance is usually greater than the relative decrease relative to aging. Watching trending, it is usual to see a slow decrease both in AC & DC capacitances because of aging. When the machine admits water inside the insulation, both capacitances change and show a large increase.
Cac Ageing indication (Relevant Samples)
-9,00
-8,00
-7,00
-6,00
-5,00
-4,00
-3,00
-2,00
-1,00
0,00
1,00
0,00 1,00 2,00 3,00 4,00 5,00 6,00
Years% Decrease
Motor 0
Motor 3
Motor 5
Motor 13
Motor 19
Motor 22
Figure 19: CAC aging decay related with time of work for some relevant samples.
- The problem “Internal Degradation” can only be discerned with trending of AC capacitance
along time. The usual increase per year is around 0,5…1%. Values above this top level
21

correspond to machines under serious risk of failure and should be taken into account to check for thermal aging. Aging processes delaminates insulation material and replaces this space with air decreasing capacitance with time; permittivity goes from 4 (epoxy) to 1 (air), it also decreases the distance between plates. The insulation degrades, losses electric, mechanical and thermal properties and is less resistant to stress. Think about the CAC decay along the life of the machine: with a 1% of decay per year, after 40 years a machine will have decreased its geometric capacitance a 40%. This mean two things:
A decrease in the dielectric constant that leads to a lower breakdown voltage. A shrink effect in the groundwall that also decreases breakdown characteristic and
that can compromise semi-conductive coating layer by vibration. - Changes: Geometric capacitance has a different value for each machine because of its
different design, power, working voltage and insulation chosen. The value of capacity itself can only give an indication of the size of the machine. The important is to compare AC to DC capacitances and its tendencies. Note that AC capacitance is part of TC, so CR will also affect TC. It follows a table with a resume of all changes.
Table VII: Capacitances diagnosis criteria.
Trending from an OK status
Punctual value
Diagnosis
CDC CAC CR Values for CR are based from test sample mean values = = <6% No problem in the machine ↑ = >10% External contamination problem. RE↓ makes CDC↑. LS & LE try to open
at 1KHz & CAC shows less influence ↑ ↑ >6% Internal contamination problem. Water goes inside the insulation and
CAC increases too much to be reduced with frequency effect. ↑ ↑↑ <0 Possible moisture effect. Monitored in some situations out of this
sample. Good theories about it but no definitive explanation. ↕ ↓ Depends Usual aging effect. Because CDC is very sensitive to other effects, its
better to use CAC to correlate this decrease.
22

Table VIII: Absorption Index description.
PARAMETER: Acronym = AI Absorption Index Units [Dimensionless] Formula
min30.sec60
min30.sec30
IIII
AI−−
= [05]
I30,60sec= Current measured 30 or 60 seconds after the begin of the load period
I30min= Current measured at 30 minutes (the end of the load period)
Minimum: -0,14 Mean: 1,594 Maximum: 3,98
Absorption Index
0
5
10
15
20
25
-0,23 1,32 1,36 1,4 1,44 1,48 1,52 1,56 1,6 1,64 1,68 1,72 1,76 1,8 1,84 1,88 1,92 1,96 2
Adimensional
# TestsLow__V High_V
Figure 20: Histogram with AI values related to Tests performed.
The “All valid test” histogram indicates that almost all samples concentrate in a very close range from 1.4 to 1.74, so 1,3…2 area is plotted in the graphs. The step is linear and of 0,02 in all range.
Absorption Index
0
2
4
6
8
10
12
14
16
-0,23 1,32 1,36 1,4 1,44 1,48 1,52 1,56 1,6 1,64 1,68 1,72 1,76 1,8 1,84 1,88 1,92 1,96 2
Adimensional
# Tests
OK operation Surface Contamination Internal Degradation Internal Contamination
Figure 21: Histogram with AI values related to Tests diagnostic distribution.
The “Diagnose test” histogram indicates that: - OK for operation range [1,40…1,88]. Most samples around 1,56. - Surface Contamination ranges [1,38…1,92]. Most samples around 1,64.
23

- Internal Contamination ranges [0…1,62]. Most samples around 1,48. - Internal Degradation ranges [1,34…1,82]. Most samples around 1,56.
AI Conclusions: Polarization Index takes data from minutes 1 and 10 to get a wide part of the IR variation. Another approach is to use Absorption Index to check the insulation. This parameter focuses the attention in the area of the first part of the IR variation (0…60sec.). There, it is located the most important component of the exponential decay of the absorption current. If the decay is fast it gives good >1,56 =high AI, if the decay is slow it is an indication of irregularities present in the insulation, so it gives bad <1,4=low AI values. So, with AI we can detect the homogeneity of the machine and the amount of contamination that ingresses inside the insulation. It is a degree to differentiate if the contamination is out in the surface (AI=high) or could enter inside the insulation (AI=low).
- “OK operation”. This results keep in a close range 1,43 to 1,88. It gives the idea of a minimum “healthy” value of 1,43.
- “Surface & Internal Contamination”. Both problems seem to be between 1,34 to 1,92 going down with the degree of contamination in the machine. This parameter should be correlated with PI & capacitance trending. Internal degradation problems seem to be below 1,62. It does also exist some Surface contamination problems below 1,6. It seems logic that both surface & internal contamination will decrease this parameter and the bigger the decrease, the most internal the problem should be. After cleaning, the parameter should recover again up to good values >1,56. This is the point where seems to be the limit for diagnosis.
- “Internal Degradation”. Aged or deteriorated machines with age show no clear tendency in this parameter, most machines are around 1,56 but there are both healthy (1,82) and contaminated machines (1,34) in the sample.
- Changes: AI decreases with any kind of pollution, oil, water or solid. As with PI it shows less variation with temperature.
Figure 22: Evolution of AI of machine [00] related to CR. CR indicates contamination and AI decreases to values indicative of an internal problem.
24

Table IX: Reabsorption Current description.
PARAMETER: Acronym = RC Reabsorption Current Units [mA/FV] Formula
KCVIRC
AC
R
⋅⋅⋅−
= .sec601000 [06]
I60secR= Reabsorption period V= Test voltage CAC= Low voltage alternate current (1KHz) capacitance
K= Temperature compensation
Minimum: 0,32 Mean: 7,646 Maximum: 34,48
Reabsorption Current
0
2
4
6
8
10
12
14
16
0 0,3 0,6 0,9 2 3,5 5 6,5 8 9,5 11 12,5 14 15,5 17 18,5 20
mA/FV
# Tests
Low_V High_V
Figure 23: Histogram with RC values related to Tests performed.
The “All valid test” histogram indicates that almost all samples concentrate 0,9 to 19 with a mean around 6. Note that for representation there are two steps: 0,1 up to 1 and 0,5 to the end.
Reabsorption Current
0
2
4
6
8
10
12
14
16
0 0,3 0,6 0,9 2 3,5 5 6,5 8 9,5 11 12,5 14 15,5 17 18,5 20
mA/FV
# TestsOK operation Surface Contamination Internal Degradation Internal Contamination
Figure 24: Histogram with RC values related to Tests diagnostic distribution.
25

The “Diagnose test” histogram indicates that:
- OK for operation range [0,4…5], with mean around 2,2. - Surface Contamination spreads [1…20]. No defined mean. - Internal Contamination range [2,5…7,5]. Mean around 6. - Internal Degradation ranges [4,5…20]. Mean around 9
RC Conclusions: Returned Absorption Current (RC) is taken 1 minute after the begin of reabsorption period. It is temperature, voltage and capacitance normalized in order to obtain a similar range of variation in different size of machines.
- The results for “OK operation” show that values keep under 5. Only two cases are above: 5,63 related with high ambient moisture (83%) and another of 5,91 where maintenance reports indicate begin of aging.
- Results for “Surface Contamination” and “Internal Contamination”, Both problems seem to increase the value of this currents beginning from 2, but don’t show any correlation.
- “Internal Degradation”. The results are all above 4,5. Well cured new insulation shows very low values 0…2. As the units degrade, the value begins to grow. In this sample of 33 machines, 29 are 40 or more years old. In the next plot, “OK operation” machines are pictured in red. Note how aging changes up this value up to a value below 5…7 for good machines. Aged machines increase this value more because more internal discontinuities inside the insulation are created. This process is irreversible and defines the design life limit of the machine. This differentiates from surface contamination because IR and PI have good values. From the mean values result of this test, a very clean and well cured insulation should not have a value greater than 0,5+(0,2*year) to be in a good condition of aging.
Reabsorption Currents / Ageing
0
5
10
15
20
25
30
35
0,00 5,00 10,00 15,00 20,00 25,00 30,00 35,00 40,00 45,00
Years of life
mA
/FV
Low V High VGood
Figure 25:Distribution of RC with aging of the machines.
- Changes: RC is temperature compensated. Anyway, it will increase with moisture, aging,
excess of heat in the unit or other degradation process.
26

Table X: Time Constant description.
PARAMETER: Acronym = TC Time Constant Units [seconds] Formula
ACCIRTC ⋅= min2 [07] IR2min= Load Period CAC= Low voltage alternate
current (1KHz) capacitance
Minimum: 10,96 Mean: 344,21 Maximum: 6411,9
Time Constant
0
10
20
30
40
50
60
0 30 60 90 300 600 900 3000 6000
Seconds
# Tests
Low_V High_V
Figure 26: Histogram with TC values related to Tests performed.
The “All valid test” histogram indicates that samples spread from 30 to 3000seg. Note that for representation there are three steps: 10 up to 100, 100 up to 1000 and 1000 up to 7000.
Time Constant
0
5
10
15
20
25
30
35
40
45
50
0 30 60 90 300 600 900 3000 6000
Seconds
# TestsOK operation Surface Contamination Internal Degradation Internal Contamination
Figure 27: Histogram with TC values related to Tests diagnostic distribution.
The “Diagnose test” histogram indicates that: - OK for operation range [300…7000], with mean around 400. - Surface Contamination spreads [20…1000]. Mean around 50.
27
- Internal Contamination ranges [60…600]. Mean around 200. - Internal Degradation ranges [40…400]. Mean around 200.
TC Conclusions: This parameter is much related with CR, because uses CAC in its equation. TC should remain above a minimum value of ~300 for good machines. Machines with low capacitance (less insulation weight), usually have high IR2, and those with high capacitance could have IR2 somehow reduced. About aging, TC is most influenced by IR2, as CAC changes in an inferior degree with the pass of the years.
- “OK operation” values should be above 300. Fully new machines well cured give values of up to 3000…7000. IR2 shows a clear influence.
- “Surface Contamination”. Usually below 400. There are three samples from 400 to 1000 related with good machines with light surface contamination problems.
- “Internal Contamination”. Usually below 400. There is a value of 600 related to a light water contaminated machine where CAC increases and the surface of the machine is clean giving also a good IR2.
- “Internal Degradation”. All degraded samples are at or below 400, and concentrate around 200. The degradation decreases CAC and also IR2. TC is again a good way to monitor aging.
- Changes: TC has a small change with temperature depending from IR2, so it will decrease with temperature. It will also decrease with contamination, aging and should increase after cleaning works.
28

Table XI: Leakage Current Ratio description.
PARAMETER: Acronym = LCR Leakage Current Ratio Units [No] Formula
1
2
LEAKV
LEAKV
II
LCR = [08]
Inside Formula
KCVII
ACLEAK ⋅⋅
⋅−= min301000
[09]
I30min= After load period V= Test voltage CAC= Low voltage alternate current (1KHz) capacitance
K= Temperature compensation
Minimum: 0 Mean: 1,230 Maximum: 10,6
Leakage Current Ratio
0
5
10
15
20
25
30
35
0 0,6 0,75 0,9 1,05 1,2 1,35 1,5 1,65 1,8 1,95 2,1 2,25 2,4
Adimensional
# Tests High V / Low V
Figure 28: Histogram with LCR values related to Tests performed.
The “All valid test” histogram indicates that samples range from 0,75 to 1,5 with a mean around 1. The step is linear, of 0,05 in all range.
Leakage Current Ratio
0
5
10
15
20
25
0 0,6 0,75 0,9 1,05 1,2 1,35 1,5 1,65 1,8 1,95 2,1 2,25 2,4
Adimensional
# Tests
OK operation Surface Contamination Internal Degradation Internal Contamination
Figure 29: Histogram with LCR values related to Tests diagnostic distribution.
29

The “Diagnose test” histogram indicates that:
- OK for operation range [0,55…1,65], with mean around 1. - Surface Contamination spreads [0,75…3,89]. Mean around 1,2. - Internal Contamination ranges [0,75…10,6]. Mean around 1,2. - Internal Degradation ranges [0,62…8,96]. Mean around 0,95.
Figure 30: IR change with test voltage. Tests on machine #24, [#24/5] Date 05/April/2005 with LCR=1,00 & [#24/6] Date 25/August/2005 with LCR=1,24. Values for LCR are taken after 30 minutes but IR plot gives good view of the effect.
LCR Conclusions: LCR is the parameter that talks about linearity with test voltage. It should be near 1 because insulation behavior should be linear with voltage. As IEEE Std-43-2000 says IR can decrease somewhat with an increase in applied voltage. Dry good insulation should give the same IR with test voltage up to the peak value of rated voltage. Significant decrease may indicate imperfections or fractures in insulation, aggravated if presence of dirt or moisture.
- “OK operation” . As from LCR, from the sample and IEEE we should tolerate 10% below 1 but 20% above 1. So the range is 0,9…1,2. Elements out of range are all either with high IR & PI>3 or those combined with a little moisture. So with PI>2 it should not be necessary to check this parameter.
- For “Surface Contamination” or “Internal Contamination”, the sample goes out of the range for most samples. The effect is based in that surface resistance is very sensitive to test voltage increase. This parameter can be used to corroborate contamination with the aid of the other parameters.
- “Internal Degradation”. Does not necessary change this parameter. Even more, there are a big number of cases without problems. This is that the degeneration can degrade the insulation but only sometimes open cracks or spaces for water or contamination to go inside changing LCR.
- Changes: Because it is again a ratio of currents, it is expected not to change too much with temperature. It will change with contamination and degradation of the insulation related with cracks.
30

7.- CONCLUSIONS About of the process of diagnosis, several things to take into account:
• Test performance: Ambient and machine temperatures & moisture must be monitored. Test system should be properly grounded both for safety and better noise performance of
test instrumentation. It is important to use a comments sheet or software remarks screen in order to include test
variations (rain, moisture excess, measurements from control cabinet…) that could distort test results. This way, diagnosis could also be aided when data appeared incongruent.
Test should include all the relevant information around the machine, running hours, install date, rewind date, kind of insulation… It is also of importance to have detailed information about maintenance history of the machine.
After a problem is detected in a machine and if the problem can be solved (as is the case of moisture or contamination), a new test should be done to check the good solution of the problem and to have new data baseline for trending.
• Test validation: Although test are usually performed by automatic equipment, it always exist chances to
commit errors that could change test results or make them inconsistent. Each test should be checked by an expert looking for irregular plots, extreme temperature
& moisture conditions, measurement oscillations, out of usual range parameters, etc If the machine was at ambient temperature without space heating elements, it could absorb
moisture making dangerous to perform another 2nd test techniques or restart the machine again (as recommended by regulations). In order to check degradation of the insulation it is best to eliminate moisture and other surface contamination problems that could mask parameters related with aging.
• Punctual Diagnosis: Diagnosis priorities: CR, RC, TC, LCR & PI give a fast idea of the possibility of
problems in the insulation. It is risky to asses a diagnosis on a single parameter, it is best to use two parameters to distinguish the problem in the machine. The correlation between them as we saw along the paper gives an idea of the kind of problem. IR & AI give an idea of the degree of the degradation that the contamination is causing and how inside the insulation it has progressed.
Contamination. Either surface or internal will be detected both in punctual diagnosis or trending with the aid of CR. CR should be checked carefully if the contamination was internal: in this situation the increase of both CAC & CDC could mask the change of CR. TC & LCR will confirm the problem together with low IR & PI. AI can indicate how much the problem is inside the insulation.
Aging. It won’t necessary decrease IR & PI, so older techniques based in these values won’t detect this effect. The best parameters used to confirm this problem are RC, CAC evolution and TC. Because of that surface & internal contamination could mask aging diagnosis in punctual diagnosis, it is better to diagnose first for inexistence of both contaminations after the machine is dry and clean. If no problem was detected, then aging problems of the machine could be better evaluated.
• About Trending: Most important than punctual data is trending because you get a better figure of the actual
situation. It is important to have a zero test (baseline data performed in commissioning or when this methodology is first applied in order to have good data guidance).
Capacitance variation both DC and AC at 1KHz is a good mean to check contamination & degradation of insulation.
EDA is a good tool to perform a 1st approach to machine diagnosis. If everything goes well, parameters show good, when something goes wrong several parameters indicate the most possible
31

32
problem. After that, the user decides to continue testing with 2nd test techniques like partial discharge, tan delta, surge test,.. This paper described the EDA test through the Iberdrola experience using it as the first level operation test within their predictive maintenance policy, helping the decision making process or determining the need of second instance tests. It’s then the easiest way to analyze the evolution of the external and internal evolution of the insulation. Nowadays, EDA test has been adopted by some of the main utilities and motors manufacturers and workshops in Europe, and everyday new companies worldwide decide to take advantage of it. 8.- BIBLIOGRAPHY Next are given different references from EDAIII, from other 2nd instance test and about related international normative.
[1] IEEE Guide for Diagnostic Field Testing of Electric Power Apparatus-Electrical Machinery. IEEE Std. 62.2-2000.
[2] IEEE Guide for Operation and Maintenance of Hydro-Generators. IEEE Std. 492-1999.
[3] IEEE Guide: Test Procedures for Synchronous Machines. IEEE Std. 115-1995. [4] IEEE Guide for Insulation Maintenance of Large Alternating-Current Rotating
Machinery (10 000 kVA and Larger). IEEE Std. 56-1997. [5] IEEE Recommended practice for Testing Insulation Resistance of Rotating
Machinery. IEEE Std. 43-2000. [6] A. Tabernero and B. Batlle. “EDAIII: STATOR INSULATION DIAGNOSIS &
PREDICTIVE MAINTENANCE”. UNITRONICS, S.A. Spain. 10th Insucon International Conference Birmingham 2006.
[7] A. Tabernero and B. Batlle. “Predictive Maintenance in Hydrogenerators”. Hydro 2007. Granada, Spain, October 2007.
[8] Manés Fernández Cabanas, Manuel García Melero, “Técnicas para el mantenimiento y diagnóstico de máquinas eléctricas rotativas” ABB Service, S.A. Marcombo 1998, pp235-248.
[9] Óscar Duque & Marcelo Pérez, “Motores de Inducción. Técnicas de Mantenimiento Predictivo”. Abecedario Sept. 2005, pp248-150.
[10] Emilio Sierra, “Mantenimiento del bobinado estatórico de MT basado en el estado. Método EDA” Magazine Mantenimiento, No.146, Julio-Agosto 2001.
[11] Luis Odriozola Arteaga, “Evaluación del estado del aislamiento en bobinados de máquinas eléctricas rotativas” Anales de mecánica y electricidad, Enero-Febrero 2004, pp26-33.
[12] Joan Puigmal Pairot, “Diagnóstico del estado del aislante en grandes máquinas eléctricas rotativas mediante el estudio de la capacidad del bobinado” Magazine Mantenimiento, No.81 Enero-Febrero 1995. pp31-36.
[13] Salvador Carreras. “Mantenimiento predictivo en los devanados de las máquinas eléctricas rotativas de alta tension” Magazine Mantenimiento, No.119, Noviembre 1998, pp13-22.
[14] IEEE Recommended Practice for Insulation Testing of AC Electric Machinery (2300V and Above) with High Direct Voltage, IEEE Std. 95-2002.
[15] Isidor Kerszenbaum. “Inspection of Large Synchronous Machines. Checklists, Failure Identification, and Troubleshooting”. IEEE Power Engineering Series. 1996.
[16] Greg C. Stone. Edward A. Boulter, Ian Culbert, Hussein Dhirani. “Electrical Insulation for Rotating Machines. Design, evaluation, aging, testing and repair”. IEEE Press. Wiley-Interscience. 2004.
[17] Geoff Klempner & Isidor Kerszenbaum. “Operation and Maintenance of Large Turbo-Generators”. IEEE Press. Wiley-Interscience. 2004.


![21, rue d’Artois, F-75008 PARIS International Colloquium ... · images method (SCIM) [10] and the modified images method (MIM) [9] has been used respectively. If these coefficients](https://static.fdocuments.net/doc/165x107/5e735307ca5f9445f463503b/21-rue-daartois-f-75008-paris-international-colloquium-images-method-scim.jpg)