21, rue d’Artois, F-75008 PARIS C2-117 CIGRE 2018 http ...
13
[email protected] Voltage collapse assessment of the Lufubu – Kasama 330kV planned overhead line and power transfer capacity on the Zambia – Tanzania cross-border corridor S. GALANTINO 1 , I. COLUCCI 1 , A. S. NYIRENDA 2 1 Studio Ing. G. Pietrangeli, Rome (Italy) 2 LPC – Lufubu Power Company, Zambia SUMMARY The development of the Lufubu Hydropower Cascade Project in Zambia comprises three cascade plants totalling 326 MW (Phase 2). The project is being promoted by the Lufubu Power Company (LPC) a private Zambian company which, with the support of consulting engineers Studio Pietrangeli (SP) and transaction advisors Fieldstone South Africa, is developing the design, environmental and social impact assessments (ESIA), obtaining concessions and licences, and negotiating with other interested parties (off-takers, civil works contractors, operation and maintenance contractors, etc.). Moreover, LPC is currently in negotiations with the Zambian government for the Implementation Agreement (IA) and with national electricity utility, ZESCO, for the Power Purchase Agreement (PPA). The paper presents the main technical features of the project, its interconnection to the national grid as well as methodology and results of the voltage stability analysis, performed in CYME PSAF environment, of the Zambian power system with the target year 2030. The study is part of the feasibility design for the Lufubu Hydropower Cascade project development, carried out by SP, with the scope of assessing system operation behaviour synchronously interconnected with the neighbouring countries as the DR Congo, Tanzania, Malawi, Mozambique, Namibia, Angola, Zimbabwe and within the South African Power Pool (SAPP). The paper provides an illustration of the general background of Zambia’s electrical system and the selected electrical scheme for the evacuation of the Lufubu Project power output, as well as the planning criteria, methodology of the voltage collapse assessment. Voltage collapse prediction analysis is described, and stability assessment results reported. Finally, total transfer capacity (TTC) evaluation is also illustrated. KEYWORDS Transmission system, voltage collapse, voltage stability margin, proximity indicator, stability analysis, power flow, security assessment, system operation, total transfer capacity, SAPP, Zambia, Tanzania, cross-border corridor, hydropower 21, rue d’Artois, F-75008 PARIS C2-117 CIGRE 2018 http : //www.cigre.org
Transcript of 21, rue d’Artois, F-75008 PARIS C2-117 CIGRE 2018 http ...

Voltage collapse assessment of the Lufubu – Kasama 330kV planned overhead line and power transfer capacity on the Zambia – Tanzania cross-border
corridor
S. GALANTINO1, I. COLUCCI1, A. S. NYIRENDA2
1Studio Ing. G. Pietrangeli, Rome (Italy) 2LPC – Lufubu Power Company, Zambia
SUMMARY The development of the Lufubu Hydropower Cascade Project in Zambia comprises three cascade
plants totalling 326 MW (Phase 2). The project is being promoted by the Lufubu Power Company
(LPC) a private Zambian company which, with the support of consulting engineers Studio Pietrangeli
(SP) and transaction advisors Fieldstone South Africa, is developing the design, environmental and
social impact assessments (ESIA), obtaining concessions and licences, and negotiating with other
interested parties (off-takers, civil works contractors, operation and maintenance contractors, etc.).
Moreover, LPC is currently in negotiations with the Zambian government for the Implementation
Agreement (IA) and with national electricity utility, ZESCO, for the Power Purchase Agreement
(PPA).
The paper presents the main technical features of the project, its interconnection to the national grid as
well as methodology and results of the voltage stability analysis, performed in CYME PSAF
environment, of the Zambian power system with the target year 2030. The study is part of the
feasibility design for the Lufubu Hydropower Cascade project development, carried out by SP, with
the scope of assessing system operation behaviour synchronously interconnected with the
neighbouring countries as the DR Congo, Tanzania, Malawi, Mozambique, Namibia, Angola,
Zimbabwe and within the South African Power Pool (SAPP).
The paper provides an illustration of the general background of Zambia’s electrical system and the
selected electrical scheme for the evacuation of the Lufubu Project power output, as well as the
planning criteria, methodology of the voltage collapse assessment. Voltage collapse prediction
analysis is described, and stability assessment results reported.
Finally, total transfer capacity (TTC) evaluation is also illustrated.
KEYWORDS
Transmission system, voltage collapse, voltage stability margin, proximity indicator, stability analysis,
power flow, security assessment, system operation, total transfer capacity, SAPP, Zambia, Tanzania,
cross-border corridor, hydropower
21, rue d’Artois, F-75008 PARIS C2-117 CIGRE 2018
http : //www.cigre.org

1
1. INTRODUCTION
The Northern Province of Zambia is a predominantly rural province, with agriculture being
fundamental for the population’s livelihood. The province has lagged behind in terms of development
due to poor and inadequate growth-enhancing infrastructure and access to social services that have
posed a challenge for development.
At the time of this study (2014 - 2015) [1], the Zambian national grid still applied an extensive plan of
load shedding since the previous decade, mainly due to the inadequacy of the existing electricity
generating capacity and the weakness of the transmission system. In fact, the country’s electricity
production is heavily dependent on hydroelectric generation (~90% of the total installed capacity)
strongly affected by seasonal variation of water inflows [4, 5].
The Lufubu Power Company is developing a 163 MW hydropower cascade on the Lufubu River in the
Northern Province of Zambia. ZESCO will be the project’s off-taker backed by an Implementation
Agreement (IA) with Government. The first phase of the project will see the construction of a cascade
of three hydropower plants on the Lufubu River with an aggregate installed capacity of 163MW along
with a 330kV transmission line (“Phase 1”). The second phase of the project will see a doubling of the
aggregate installed capacity to 326MW (“Phase 2”).
The Project is currently the most advanced base-load greenfield project under development in Zambia.
The plant is expected to supply local demand and add grid stability. The Lufubu Cascade project finds
ground on the planned strategy of the Zambian government, who is progressively carrying into effect
the hydropower potential of the country, opening to IPPs and strengthening the transmission system on
a vast scale looking at the neighbouring countries for energy exchange and trade purposes [2].
The exploitation of a new energy source, whatever its nature, through the development of an
integrated system, is based on needs to be validated by the most suitable means. In the case of power
systems, the study of the network behaviour by performing a technical analysis with the so-called
“network study” represents the instrument and methodology applied worldwide in the last decades.
The study is intended as a technical assessment of the capability of the future Zambian electric grid to
receive the power production of the Lufubu hydropower cascade in an electrical safe manner, as
represented by its full-developed stage with about 326MW of capacity. In doing so, Studio Pietrangeli
has prepared accurate models representing the Zambian power system, and has conducted an analysis
to assess the adequacy of the planned network infrastructures, identifying the need for improvements
to ensure safe operation of the new project within the rules of the regional electric code.
This study was conducted based on the generation and transmission data available at the beginning of
2015, considering a load demand scenario as per target year 2030, and tuned along with ZESCO’s
expansion plans. A unit commitment schedule was proposed and agreed with LPC for each analysed
scenario, based on an economic merit order ranking – say, the cheaper plants in terms of specific
generation cost come first, wherein Lufubu Cascade is ranked 8th out of more than fifteen plants.
In the target year 2030, the peak load demand forecast of Zambia is to increase from today (2015)
1,900MW up to 4,300MW and energy demand ~ 29,000GWh/y. In this scenario, Lufubu HPP will
substantially contribute to cover the base load at its initial stage (plant factor 0.85) and peak hours load
at its full development stage (p.f. 0.45), as well as reducing energy import. On the contrary, the
vicinity of the project site to the 330kV Kasama – Mbeya corridor soon to be constructed provides a
valuable, short path towards the Tanzanian boundary for power export purposes.
2. SCOPE OF THE STUDY
The paper illustrates the methodology and results of the voltage collapse assessment performed on the
Zambian power system, with the scope of highlighting potential criticalities of the Lufubu Cascade
operation with the national grid, synchronously interconnected with the power systems of the
2
neighbouring countries as DR Congo, Tanzania, Malawi, Mozambique, Namibia, Angola, Zimbabwe
and within the SAPP. For this purpose, a complete model of the Zambian system for the target year
2030 was prepared, taking into account the inputs provided by the Client (LPC) and the national utility
(ZESCO). The system is considered as a medium meshed interconnected system, due to several trans-
boundary links, namely with Namibia, Botswana, Tanzania, Zimbabwe, Mozambique, South Africa,
DR of Congo.
Multiple simulations were carried out to test the system and assess its stability limits. The study covers
aspects such as security analysis, reactive compensation study, short-circuits assessment, (n-1)
contingency, calculation and monitoring of overloads on international tie-lines, of possible regional
voltage collapses. All the simulations performed revealed the weaknesses of the system and permitted
us to conclude on how to extend its operation limits up to the desired level.
This paper focuses on the voltage stability assessment, with Lufubu Project at its full development
stage.
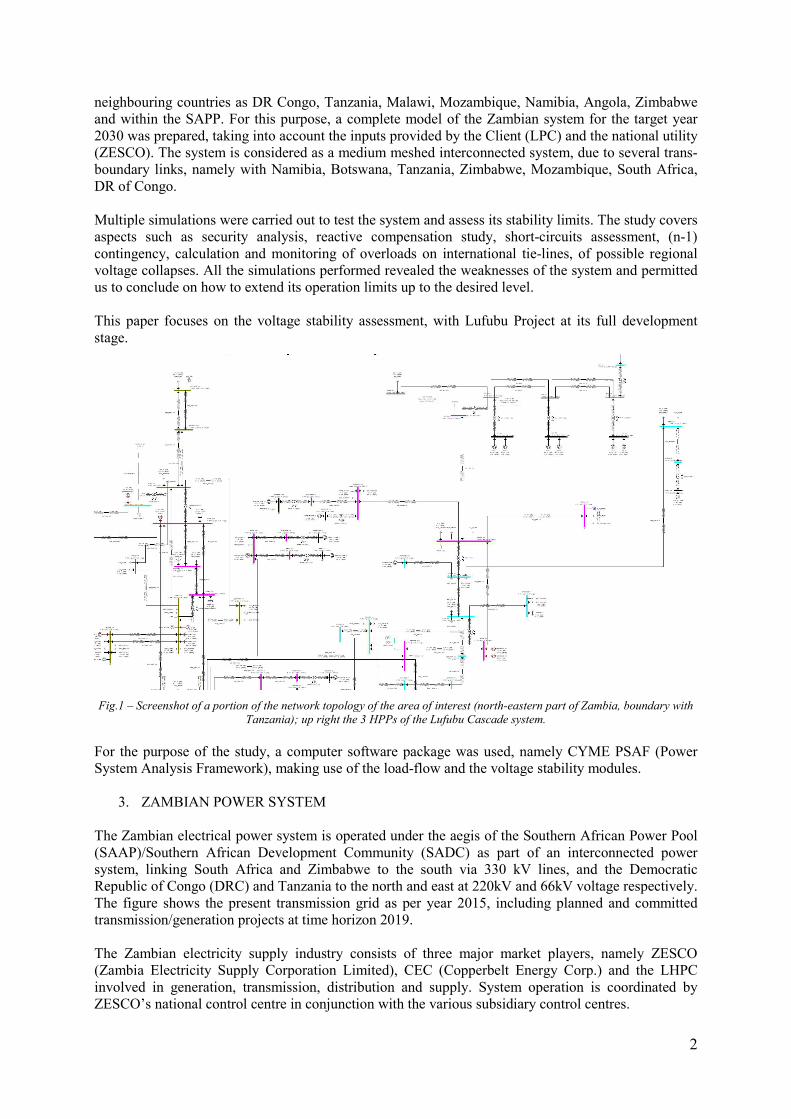
Fig.1 – Screenshot of a portion of the network topology of the area of interest (north-eastern part of Zambia, boundary with
Tanzania); up right the 3 HPPs of the Lufubu Cascade system.
For the purpose of the study, a computer software package was used, namely CYME PSAF (Power
System Analysis Framework), making use of the load-flow and the voltage stability modules.
3. ZAMBIAN POWER SYSTEM
The Zambian electrical power system is operated under the aegis of the Southern African Power Pool
(SAAP)/Southern African Development Community (SADC) as part of an interconnected power
system, linking South Africa and Zimbabwe to the south via 330 kV lines, and the Democratic
Republic of Congo (DRC) and Tanzania to the north and east at 220kV and 66kV voltage respectively.
The figure shows the present transmission grid as per year 2015, including planned and committed
transmission/generation projects at time horizon 2019.
The Zambian electricity supply industry consists of three major market players, namely ZESCO
(Zambia Electricity Supply Corporation Limited), CEC (Copperbelt Energy Corp.) and the LHPC
involved in generation, transmission, distribution and supply. System operation is coordinated by
ZESCO’s national control centre in conjunction with the various subsidiary control centres.

3
The mining sector and domestic consumers
account for 82% of total electricity
consumption. Zambia is also faced with the
challenge of satisfying the demand of more
than 80% of its population with renewable
forms of energy. Presently, the system is
operated with heavy load shedding
schedules due to insufficient generating
capability to cover the increasing load
demand, as per the expected growth in the
next few years between 150 to 200 MW
per annum, with a severe and immediate
shortfall in supply. Therefore, both
increasing the country’s electricity
generating capacity and reinforcing the
transmission infrastructures are priorities
for fulfilling the short and medium term
energy needs, as several projects are
planned, mostly in the south (medium and
large hydropower plants such as Itezhi
Tezhi recently commissioned, and Batoka
Gorge, Kafue Gorge Lower as well as
thermal plants such as Maamba, a newly
connected plant). Fig.2 – Interconnected countries in SAPP with relevant exchange
capacity (source: SAPP website)
Fig.3 – Zambian grid including planned and committed transmission/generation projects as per year 2019 (source: ZESCO)
In the north, the Lufubu Cascade (as marked by the red circle in the figure above) will fill a
geographical gap, providing a substantial input of about 330 MW to the grid, boosting by 13% the
present 2,500MW installed capacity (95% hydro) targeting the planned 7,350MW in 2030.
As far as the transmission system is concerned, the 330kV system links the two major power stations
of Kariba North Bank and Kafue Gorge. At the time of writing, the Extra High Voltage (EHV) system
4
is composed of about 650km of 220kV lines and 3,700km of 330kV lines (existing and under
construction), while 132kV and 88kV network in operation is interconnected mostly at regional level.
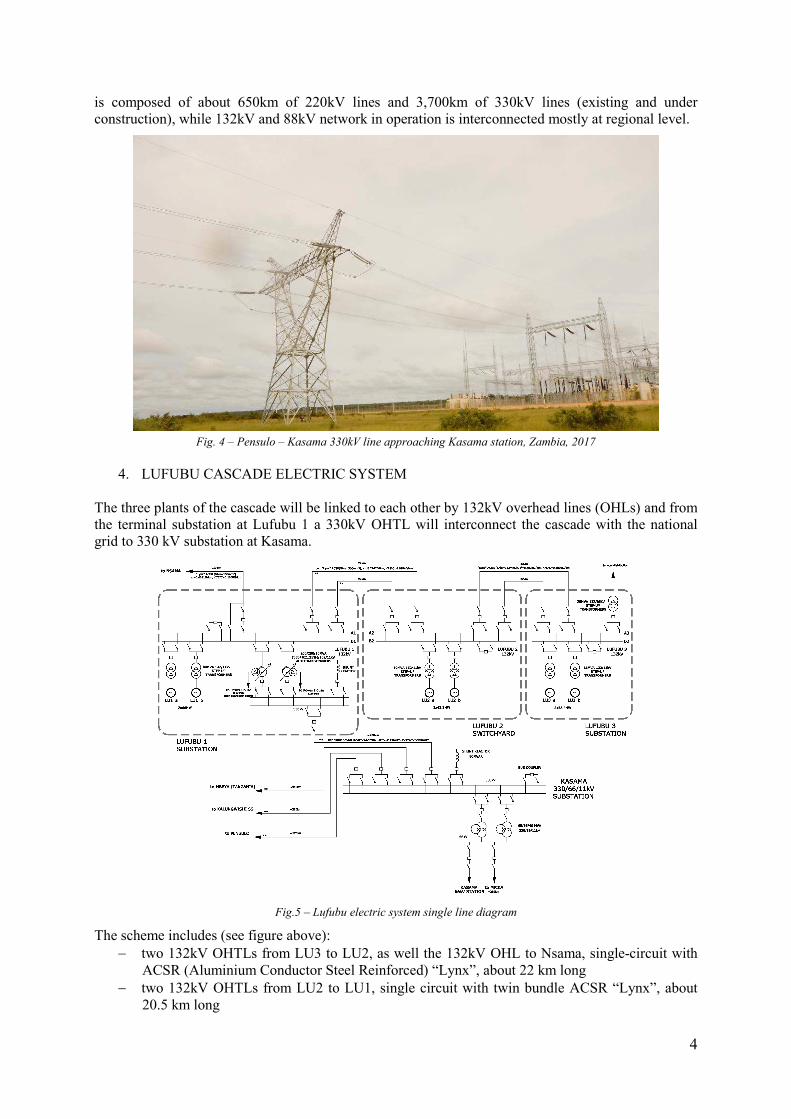
Fig. 4 – Pensulo – Kasama 330kV line approaching Kasama station, Zambia, 2017
4. LUFUBU CASCADE ELECTRIC SYSTEM
The three plants of the cascade will be linked to each other by 132kV overhead lines (OHLs) and from
the terminal substation at Lufubu 1 a 330kV OHTL will interconnect the cascade with the national
grid to 330 kV substation at Kasama.
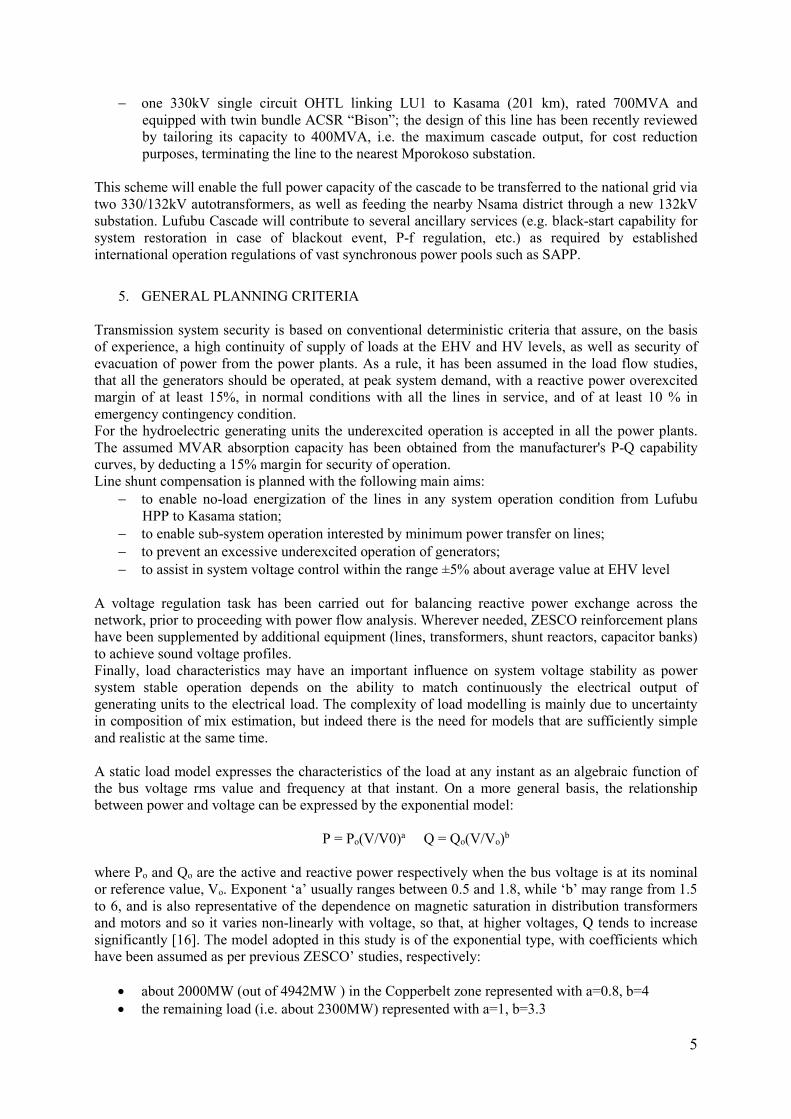
Fig.5 – Lufubu electric system single line diagram
The scheme includes (see figure above):
− two 132kV OHTLs from LU3 to LU2, as well the 132kV OHL to Nsama, single-circuit with
ACSR (Aluminium Conductor Steel Reinforced) “Lynx”, about 22 km long
− two 132kV OHTLs from LU2 to LU1, single circuit with twin bundle ACSR “Lynx”, about
20.5 km long
5
− one 330kV single circuit OHTL linking LU1 to Kasama (201 km), rated 700MVA and
equipped with twin bundle ACSR “Bison”; the design of this line has been recently reviewed
by tailoring its capacity to 400MVA, i.e. the maximum cascade output, for cost reduction
purposes, terminating the line to the nearest Mporokoso substation.
This scheme will enable the full power capacity of the cascade to be transferred to the national grid via
two 330/132kV autotransformers, as well as feeding the nearby Nsama district through a new 132kV
substation. Lufubu Cascade will contribute to several ancillary services (e.g. black-start capability for
system restoration in case of blackout event, P-f regulation, etc.) as required by established
international operation regulations of vast synchronous power pools such as SAPP.
5. GENERAL PLANNING CRITERIA
Transmission system security is based on conventional deterministic criteria that assure, on the basis
of experience, a high continuity of supply of loads at the EHV and HV levels, as well as security of
evacuation of power from the power plants. As a rule, it has been assumed in the load flow studies,
that all the generators should be operated, at peak system demand, with a reactive power overexcited
margin of at least 15%, in normal conditions with all the lines in service, and of at least 10 % in
emergency contingency condition.
For the hydroelectric generating units the underexcited operation is accepted in all the power plants.
The assumed MVAR absorption capacity has been obtained from the manufacturer's P-Q capability
curves, by deducting a 15% margin for security of operation.
Line shunt compensation is planned with the following main aims:
− to enable no-load energization of the lines in any system operation condition from Lufubu
HPP to Kasama station;
− to enable sub-system operation interested by minimum power transfer on lines;
− to prevent an excessive underexcited operation of generators;
− to assist in system voltage control within the range ±5% about average value at EHV level
A voltage regulation task has been carried out for balancing reactive power exchange across the
network, prior to proceeding with power flow analysis. Wherever needed, ZESCO reinforcement plans
have been supplemented by additional equipment (lines, transformers, shunt reactors, capacitor banks)
to achieve sound voltage profiles.
Finally, load characteristics may have an important influence on system voltage stability as power
system stable operation depends on the ability to match continuously the electrical output of
generating units to the electrical load. The complexity of load modelling is mainly due to uncertainty
in composition of mix estimation, but indeed there is the need for models that are sufficiently simple
and realistic at the same time.
A static load model expresses the characteristics of the load at any instant as an algebraic function of
the bus voltage rms value and frequency at that instant. On a more general basis, the relationship
between power and voltage can be expressed by the exponential model:
P = Po(V/V0)a Q = Qo(V/Vo)b
where Po and Qo are the active and reactive power respectively when the bus voltage is at its nominal
or reference value, Vo. Exponent ‘a’ usually ranges between 0.5 and 1.8, while ‘b’ may range from 1.5
to 6, and is also representative of the dependence on magnetic saturation in distribution transformers
and motors and so it varies non-linearly with voltage, so that, at higher voltages, Q tends to increase
significantly [16]. The model adopted in this study is of the exponential type, with coefficients which
have been assumed as per previous ZESCO’ studies, respectively:
• about 2000MW (out of 4942MW ) in the Copperbelt zone represented with a=0.8, b=4
• the remaining load (i.e. about 2300MW) represented with a=1, b=3.3
6
Load export is represented as constant power (a=b=0), except for Namibia (a=b=2), at constant
impedance.
The extensive load flow and voltage regulation analysis performed tailored to the voltage stability
assessment shows that the infrastructures planned at the target year allow the forecasted internal peak
demand to be covered providing a reserve margin sufficient to allocate more than 600MW for export
purposes, as it has been considered in the scenarios of this study.
6. VOLTAGE STABILITY STUDY METHODOLOGY
Whenever a disturbance – e.g. an increase in load – causes progressive and uncontrollable decline in
voltage, the system enters a state of “voltage collapse”. This state is associated with saddle node
bifurcation and reactive power limitations of the power system.
Voltage stability assessment aims at verifying the capability of the interconnected system to maintain
steady acceptable voltage profile at load buses under normal and contingency conditions, and any
margin against the incipient entering into this state.
The main factor affecting this phenomenon is the inability of the system in meeting reactive power
balance which generators, transformers tap-changers operation, load recovery dynamics concur to.
Voltage drop is also followed by increased current and reactive power consumption by lines and
transformers inductance, reduced reactive supply by compensating capacitor banks and lines
capacitance. After generators short-time overexcitation (seconds to minutes), the AVRs reduce its field
current within tolerable limits, and hence the reactive power supplied to the grid, therefore that portion
of the grid undergoes voltage collapse and could be consequently tripped by undervoltage and
overcurrent protection relays.
The aim of this part of the study was then to assess the collapse risk, which may occur in a specific
area of the grid, say the nearest 330kV load bus to the Lufubu Cascade. The bus is identified in the
330kV Kasama station, along the corridor towards Tanzania, ~200km from the border. The assessment
investigates the event whenever, in presence of increasing power export across the Kasama bus, the
synchronous generators of that area (e.g. Lufubu HPPs units) reach upper limits of reactive power
continuous supply in overexcited condition and, therefore, cannot support the bus voltage profile.
As mentioned, the voltage collapse risk has been evaluated for a specific network area affected by
Lufubu power transfer. The assessment has been done applying the criterion of the variation of the
reactive power generation as the load active/reactive demand varies. This simple criterion is
particularly suitable if implemented by a load flow program to analyse a multi-node system, such as
the one composed by the subject network [11, 15, 18]. The application of a static stability criterion is
widely justified in literature [14, 17, 18], i.e. how static power system models can be used to compute
the loading margin to voltage collapse due to fold or saddle node and its sensitivities to parameters and
controls. The static models are understood to have underlying dynamics, responsible for the dynamic
voltage collapse because of the so-called fold bifurcation. By computing load power margins and their
sensitivities with static power system equations, it has been demonstrated that the results are accurate
for a general and sensible class of underlying dynamic representation of the phenomenon, thus
enabling commercial software to evaluate and provide indication about voltage collapse blackouts and
related proximity.
For the purpose of the study, a “Voltage Collapse Proximity Indicator” (VCPI), derived from the
above criterion, is hereby referred to in the analysis, carried out by running several load flow
simulations in AC [14, 15, 16]. The definition of the index at the ith node (bus) is:

7
where:
is the sum of all the generated reactive power increments;
is the sum of the increments of the reactive load demand at the examined node (i.e.
Mbeya).
It is worthwhile recalling that when the system approaches the critical state the index tends to infinity.
The non-convergence of the Newton-Raphson method is retained as the identification of the critical
state condition, i.e., there is no more equilibrium beyond this point between reactive demand and
generation and the network is no longer within a steady-state voltage stability area.
Once the instability risk is identified, preventive measures will have to be adopted such as:
• power factor (p.f.) improvement;
• identification and availability of those generating units with reactive power margins;
• setting the transmission buses affected by heavy power flows at the highest operating voltage.
Extreme measures can be implemented after a disturbance to bring the system from emergency to
normal state, prior to falling into collapse state, with evident impact on customers [12, 13]:
• automatic blocking of the distribution transformers OLTCs;
• load shedding initiated by under-frequency protection relays.
A common practice is to assess the system ability to survive credible contingencies with the sole help
of controls which have no impact on customers. Complementary to this, the adequacy of stronger
controls is checked against more severe disturbances not covered under usual security criteria [11, 12,
18].
The scope of the study was to assess a security margin, a measure of the above defined proximity to a
loadability limit, by stressing the system along the specified direction of load increase. In doing this,
the Q margin was thereby assessed as the distance to a particular loadability limit, obtained by varying
the active and reactive power injection at a single bus.
The analysis was applied to a weak area identified as the corridor to Tanzania, which is considered to
be most prone to voltage instability, by increasing the lumped load at Mbeya 330kV bus from the
forecasted 200MW of the target year up to a maximum allowable by the system at constant power
factor.
The multiple load flow solutions allows construction of a PV curve (bus voltage vs. increasing power),
showing a “nose” – the sought limit, which is the ultimate operating point corresponding to the
incipient instability, beyond which it is no longer possible to achieve power flow solutions.
7. DISCUSSION OF RESULTS
The analysis covered the area of interest in the north-eastern part of the country, where the Lufubu
power output is likely to be wheeled towards Tanzania, across the shortest available corridor – through
Mbeya – thus minimizing transmission losses. As mentioned before, a power flow-based analysis has
been adopted, by increasing the power export towards Mbeya up to an amount to identify its feasible
maximum, wherein allowed to run power flow iterations.
The following table illustrates the results of the analysis with numerical outputs. It includes, per each
step of simulation, Lufubu generators V and Q variation (and 330kV autotransformer tap changer
position) vs. exported load increase towards Tanzania (Mbeya), with V p.u. at Kasama and Mbeya
buses. Local and global VCPI values are also reported. The load at the end of the corridor area
(Mbeya) was increased in variable steps progressively to a level where there was system collapse.

8
Global p.f. Kasama
step Ptot Qtot Ptot Qtot cos fi Vluf
TAP
AutoTR
330/132
Vlu1,2_
11kV
Vlu2_11
kV
Vlu3_11
kV
ΔQgen,l
ufPlu1_kas Vkas Vmbey ΔPexp ΔQexp P_EXP,tot VCPILUF
VCPI
global
VCPI,
Mbeya
# MW MVAR MW MVAR p.u. % kV kV MVAR MW p.u. p.u. MW MVAR MW
0 5340.0 1160.7 4920.0 866.9 0.985 1.071 101 11.6 11.6 11.5 37 297.3 1.051 0.993 0 0 200 0 0 0
1 5390.7 1163.8 4975.7 890.4 0.984 1.061 102 11.6 11.6 11.5 12 297.2 1.033 0.943 50 22 250 0.5 0.1 0.1
2 5409.4 1171 4995.0 898 0.984 1.063 103 11.6 11.6 11.5 29 297.2 1.027 0.923 70 30 270 1.0 0.9 0.9
3 5430.6 1174.3 5017.0 907 0.984 1.072 104 11.6 11.7 11.8 45 297.2 1.026 0.908 90 38 290 1.2 0.4 0.4
4 5440.0 1179.6 5026.6 911.2 0.984 1.076 105 11.6 11.7 11.8 55 297.1 1.025 0.899 100 43 300 1.3 1.3 1.2
5 5462.0 1192.7 5048.3 920.5 0.984 1.086 105 11.9 11.9 11.9 75 296.9 1.023 0.879 120 51 320 1.5 1.4 1.6
6 5494.5 1227.8 5078.8 933 0.984 1.103 106 12.0 12.0 12.0 116 296.2 1.018 0.846 150 64 350 1.8 2.8 2.7
7 5507.0 1282.6 5087.5 935 0.984 1.091 106 11.9 12.0 12.0 134 295.6 0.997 0.802 160 68 360 2.0 27.4 13.7
8 5523.0 1392.2 5094.6 935.1 0.984 1.064 106 11.9 12.0 12.0 165 294.5 0.956 0.714 170 72 370 2.3 1096.0 25.1
GEN TOT LOAD TOT Lufubu Mbeya
Table 1 – Set of input and output data of the multiple power flows run for the voltage stability margin
0.7
0.75
0.8
0.85
0.9
0.95
1
1.05
200 225 250 275 300 325 350 375
Vo
lta
ge
[p
.u.]
Total power export [MW]
PV-curve for load increas at Mbeya bus
Vmbey
In this analysis, the PQ load increase at Mbeya bus is
accompanied by the action of the OLTC of the Lufubu
autotransformer, which operates trying to keep the
sending end bus as high as possible.
Acceptable VCPI (~≤2) are gained up to 320÷350MW
of power export (step 5-6). The Kasama – Mbeya sub-
system enters in an unstable behavior at step 7,
wherein VCPI start increasing to infinity and Vmbey
falls down to 0.8p.u. The loadability limit is identified
as somewhat close to 360MW, hence 180% of the
initially planned export (200MW). The “nose” shown
by the curve corresponds to step 8, beyond which no
further stable operating points can be found. System
operation in the high slope stretch of the VP-curve
must be avoided.
Fig 6 – VP-curve for stability margin assessment at Mbeya
The next graph (left side) shows the VCPI plotted with VQ-curve at each bus, together with the
“global” one relevant to the overall system. As can be seen, the operation of the OLTC at Lufubu
temporarily attempts to improve the voltage, by increasing Vluf. The graph on the right shows VQ-
curve at Kasama bus.
0
1
10
100
1000
0
15
30
45
60
75
0.7 0.75 0.8 0.85 0.9 0.95 1
VC
PI
(
log
10
sca
le)
Re
act
ive
Po
we
r [
MV
AR
]
Voltage [p.u.]
Reactive power increase and VCPI at Mbeya bus vs. voltage
Vmbey VCPI, Mbeya VCPI global
200
250
300
350
400
0
10
20
30
40
50
60
70
80
0.7 0.8 0.9 1 1.1
Act
ive
po
we
r e
xp
ort
[M
W]
Re
act
ive
Po
we
r @
Ka
sam
a3
30
kV
[M
VA
R]
Voltage [p.u.]
Voltage and Power transfer to Mbeya vs. Reactive power
Vkas Vmbey P_EXP,tot
Fig 7 and 8 – VQ-curve at Mbeya with global VCPI (left) and at Kasama with active power export (right)
8. TOTAL TRANSFER CAPACITY EVALUATION
An additional result of the analysis was the maximum transfer capacity assessment towards Tanzania,
without any further compensating measure.

9
Transmission System Operators provide procedures on how to assess transfer capacities between
countries [19]. The maximum amount of power that can be transferred across the borders of two
neighboring countries – without violating any security criterion – is called the Total Transfer Capacity
(TTC). A security margin is properly introduced in practice to account for uncertain conditions and
input data mismatching, thus resulting in the Net Transfer Capacity (NTC).
It is generally accepted that the maximum transfer capacity assessment is mainly carried out with
respect to thermal capacity of the interconnections against maximum power flow. Indeed, the main
issue with which this task has been undertaken under the present study is the voltage stability.
The common set of programs of cross-border transactions and the net balances of each TSO area at the
target year considered is the one supposed for, represented by the base case (BCE) of 624MW.
Starting from the BCE, the power flow can be increased by an extra amount (over the base case) ΔE
that can be exchanged continuously from one country to another while ensuring the safe operation of
both interconnected systems. This amount has been taken in correspondence with the first occurrence
of any bus operating voltage falling down to 0.85 p.u. In this regard, it is worthwhile mentioning that
this threshold is much slacker with respect to what is recommended in SAPP [6], i.e. the so-called
maximum power transfer as determined when “any busbar voltage drops below 0.95 p.u. for system
healthy conditions, unless agreed between utilities”. On the other hand, the condition “power flow on
the corridor exceeds 95% of the maximum power transferred at the knee point of the PV curve for that
corridor (Pmax)” is met.
The margin ΔE, added to the initial transaction value BCE taken in account between the concerned
countries or zones, gives the total transfer capacity (TTC) between these countries:
TTC = BCE + ΔE
The (n-1) contingency prescribed by some regional regulations (SAPP, ENTSO-E, etc., [20]) could be
fulfilled only if the regional plans account for doubling the line of the export corridor towards
Tanzania (i.e. the Kasama – Mbeya line).
The analysis has been performed by means of the CYME PSAF voltage stability module, with the
aforementioned continuation power flow method, which finds a continuum of power flow solutions
using a given load direction change. Three scenarios have been investigated. The first one, addressed
in the previous paragraph, deals with P,Q variation at Mbeya bus. The other two deal with an increase
of all the cross-boundary export power and the overall load demand of the network.
The attention given to the Mbeya bus is dictated by its vicinity to the nearest dispatching point of
Lufubu, as the Kasama – Mbeya line is the nearest and shortest cross-border corridor.
It is evident from the results, illustrated in the following paragraphs, how the transfer limits are not
dictated by the lines’ thermal limits at all (still very far on the 330kV interconnecting lines), the
voltage stability being the main issue.
TTC VS. EXPORT INCREASE
Freezing the intervention of the transformers OLTCs, the analysis was run in two different modes: i)
load increasing at constant p.f., and ii) load increasing by active power only (p.f. increasing
accordingly). The increase of loads covers the export to boundaries only.
In case i), the assessed voltage stability limit is 32%. It means that the system is able to supply a power
export increase up to 32% (i.e. +202MW, totaling 826MW), equally distributed on the boundary
buses, up to the collapse of any bus as this happens at Mbeya (0.75 p.u.). The voltage stability margin
applied for the TTC computation is the value corresponding to the operating voltage of any bus not
below 0.85 p.u. In this case, as Mbeya bus exhibits 0.85 p.u. with 760MW power flow, the adopted
margin is 22% (136MW) and therefore the computed transfer capacity (TTC = BCE + ΔE = 624 +
136) is 760MW.

10
In case ii), the limit evidently increases to 81% (+506MW, totaling 1130MW) due to the improved p.f.
Mbeya bus is affected by collapse down to 0.78 p.u. Therefore, the adopted margin is 75% (466MW),
and the computed transfer capacity (TTC = BCE + ΔE = 624 + 466) is 1090MW.
Fig 9 and 10 – Voltage at 330kV buses of boundary interconnection in case i) (left), and ii) (right)
TTC vs. OVERALL LOAD DEMAND INCREASE
The last task deals with a step increase of active power equally distributed on the overall load demand
(export included). The analysis was performed by freezing the intervention of the transformers
OLTCs, with load increasing by active power only (p.f. increasing accordingly). The voltage margin
limit was assessed at 7.2%, i.e. the system is capable to operate within constraints up to an increase of
+356MW of the load demand, thus totaling about 5298MW.
Fig 11 and 12 – Voltage at 330kV buses of the network, south and centre zones (left), centre to north-eastern (right)
The monitored voltage buses, shown in the charts, still maintain healthy voltage profiles.
9. CONCLUSIONS
The paper outlines the need to consider, at the planning stage of transmission systems, some of the
major issues troubling TSO, i.e. achieving both maximum power transfer capability and optimal
voltage stability margin, not to mention how this matter deals also with procurement, installation,
operation and maintenance of the equipment pertaining to the transmission grid.
In the framework of the transmission system engineering relevant to the Lufubu hydropower cascade
interconnection to the Zambian national grid, the consultant has focused the network stability studies
on the robustness of the grid against voltage collapse behaviour. The main findings of the study are as
follows:
11
• The load flow analysis shows that the infrastructures planned in the target year allow covering
the forecasted internal peak demand providing reserve margin (against peak load) sufficient to
allocate more than 600MW for export purposes
• The majority of the internal main corridors are operated within their thermal limits with
adequate margins. The south-to-north backbone from Batoka, Kariba and Kafue HPPs
transfers about 3800MW (76% of the entire load demand) with the higher loading around
80%, peaking on the Muzuma – Kafue lines (88%), in the investigated scenario. On the
contrary, the western links to Angola and Namibia are underloaded.
• Voltage stability investigation finds acceptable operation up to ~350MW of export to Mbeya
bus (Tanzania). In fact, VCPI ~≤2 is obtained up to 320÷350MW of power export, while the
Kasama – Mbeya sub-system enters in an unstable behavior suddenly after, wherein VCPI
start increasing to infinity and Vmbey falls down to 0.8p.u. The loadability limit is identified in
about 360MW, hence 180% of the initially planned export (200MW at Mbeya bus).
• The assessed total transfer capacity (TTC) to boundary interconnections is approx. 760MW,
without any additional reactive compensation measure, with a margin of 22% against the
export program, while TTC increases up to 1090MW by adopting p.f. correction, with a
widely higher margin.
• The assessed TTC to the overall network (internal load buses and export), with load increasing
by active power only (p.f. increasing accordingly), results in a voltage margin limit at 7.2%,
i.e. the system is capable to operate within constraints up to an increase of +356MW of the
load demand (up to 5298MW).
The study has shown that, even conservatively ignoring boundary countries participation to voltage
regulation, the calculation of the stability margin is notably valuable if both the extension of the grid
(spanning more than 2000km) and the exiguous generation park in the vicinity of the node of interest,
which is more than 1000km far from the electric center of the national grid (approx. in Lusaka), are
considered.
In addition to that, despite further improvement, it is believed that the assessed total transfer capability
is realistically conservative and underline the foundation of the power exchange framework presently
progressing with Tanzania between ZESCO and TANESCO.
For sakes of record, as per today there are two interconnecting projects at advanced stage of
implementation, namely the Kasama – Mbeya line to Tanzania and the Pensulo – Chipata – Songo to
Mozambique.
In this regards, it is worthwhile mentioning that, real-time monitoring means of voltage criticalities are
currently available and of easy implementation, in particular, worthy for the case studied:
− identification of areas/sub-regions/buses in Zambian power systems prone to voltage
instability under particular operating conditions and contingencies; this is indeed recognized
as true in the north-eastern region, where the Lufubu interconnection will be realized, due to
the lack of regulating generating stations and the length of the 330kV point-to-point lines
without intermediate stations
− determination of reactive power reserve requirements to ensure secure system operation
− determination of a set of contingencies that spans the range of credible failure events
− performance of typical on-line steady state (n-1) contingency scenarios in the identified areas
− coordination with SAPP and boundary dispatching/TSO centers to ensure efficient and rapid
corrective measures in case of incipient instability
In conclusion, the coming on line of the Lufubu Cascade provides a valuable power input into the
ZESCO grid, readily available not only for supporting the internal demand concentrated in the middle
of the country, but also for export through the nearby corridor to Tanzania, avoiding power transfer

12
from other far plants, and promoting trading among the neighbouring countries. Among the main
benefits, to highlight:
� strengthening and improvement of north-eastern generation and power transfer capacity
� improvement of grid voltage regulation, due to an additional dispatching point in Kasama;
therefore, system control and reliability is significantly improved
� strategic features in case of re-energization of the entire electric grid from an additional
resource, during black-outs
It is also worth to mention the role of the project also in meeting the local communities load demand
(the Lufubu site neighbouring areas), achieved by sustainable green energy production (hydropower).
BIBLIOGRAPHY
[1] “Lufubu Hydroelectric Project Transmission System Feasibility Study Report”, Studio Ing. G.
Pietrangeli, 2015
[2] “Scoping Mission Report, Zambia”, Africa-EU Renewable Energy Cooperation Programme,
EUEI Energy for Development Partnership Dialogue Facility, August 2016
[3] “The Electricity (Grid Code) Regulations, 2013”, Government of Zambia, Aug 2013
[4] “Zambia nation-wide power blackout of June 4, 2006”, Report by the expert team constituted to
investigate the power outage, Energy Regulation Board, July 2006, Lusaka, Zambia
[5] “Nation-wide blackouts of 19th, 21st and 22nd January 2008”, Report of the Committee, Energy
Regulation Board, March 2008, Lusaka, Zambia
[6] “Transmission planning criteria”, Southern Africa Power Pool, SAPP-SADC, January 2012
[7] “Zambia Energy Sector Profile”, Zambia Development Agency, 2014”
[8] M. Larsson, C. Rehtanz, J. Bertsch, “Monitoring and operation of transmission corridors” (IEEE
Bologna PowerTech Conference, 2003, Italy)
[9] Working Group SC 22-12 CIGRE. “The thermal behaviour of overhead conductors – Section 1
and 2: Mathematical model for evaluation of conductor temperature in the steady state and the
application thereof” (Electra number 144 October 1992 pages 107-125)
[10] “Definition And Classification Of Power System Stability”, IEEE/CIGRE Joint Task Force,
June 2003
[11] “Modelling Of Voltage Collapse Including Dynamic Phenoma”, CIGRE Task Force 38.02.10 of
Study Committee 38 (Power System Analysis and techniques), 2000
[12] “Criteria And Countermeasures For Voltage Collapse”, CIGRE Task Force 38.02.12, October
1995
[13] “Voltage Collapse Mitigation”, IEEE Power System Relaying Committee, WG K12, December
1996
[14] “Impianti Elettrici”, F. Iliceto, Pàtron, Bologna 1981
[15] “Power System Stability and Control”, P. Kundur, McGraw-Hill, New York, 1994
[16] “Behaviour of loads during voltage dips encountered in stability studies. Field and laboratory
tests”, F. Iliceto, A. Ceyhan, G. Ruckstuhl, IEEE Transactions on Power Apparatus and
Systems., Vol. PAS-91, n°6, 1972
[17] “The irrelevance of electric power system dynamic for the loading margin to voltage collapse
and its sensitivities”, I. Dobson, NOLTA, IEICE, July 2011
[18] “Voltage stability indicator at the proximity of the voltage collapse point and its implication on
margin”, G. Singh Deol, S. Sao, H. Singh, V. Gupta, Asian Journal of Computer Science and
Information Technology, 2011
[19] “Definitions of Transfer Capacities in Liberalized Electricity Markets”, Organization of
European Transmission System Operators (ETSO), April 2001
[20] “Procedures for cross-border transmission capacity assessment”, ETSO, October 2001
![21, rue d’Artois, F-75008 PARIS International Colloquium ... · images method (SCIM) [10] and the modified images method (MIM) [9] has been used respectively. If these coefficients](https://static.fdocuments.net/doc/165x107/5e735307ca5f9445f463503b/21-rue-daartois-f-75008-paris-international-colloquium-images-method-scim.jpg)


![21, rue d’Artois, F-75008 PARIS - cigre.org.br · Mrs. Martinato, Mr. Miethke, Mr. Asano, Mr. Alaor, Dr. Knorr, Mrs. Höhlein [3] Copper Strip Corrosion Standards – ASTM Method](https://static.fdocuments.net/doc/165x107/5b8ee41c09d3f2c7748b8dbe/21-rue-dartois-f-75008-paris-cigreorgbr-mrs-martinato-mr-miethke.jpg)