2011 Review Water Quality Standards for Salinity Colorado River
88
2011 Review Water Quality Standards for Salinity Colorado River System June 2011 Draft Colorado River Basin Salinity Control Forum
Transcript of 2011 Review Water Quality Standards for Salinity Colorado River

2011 Review Water Quality Standards for Salinity
Colorado River System
June 2011 Draft Colorado River Basin Salinity Control Forum

2011 Review
WATER QUALITY STANDARDS FOR SALINITY
COLORADO RIVER SYSTEM
June 2011
Prepared by
Colorado River Basin Salinity Control Forum

i
COLORADO RIVER BASIN SALINITY CONTROL FORUM
MEMBERS
ARIZONA
Perri Benemelis, Manager, Office of Colorado River Management Department of Water Resources
Linda Taunt, Deputy Director, Water Quality Division Department of Environmental Quality
Larry R. Dozier, Deputy General Manager Central Arizona Water Conservation District
CALIFORNIA
Gerald R. Zimmerman, Executive Director Colorado River Board of California
Dorothy Rice, Executive Director State Water Resources Control Board
COLORADO Jennifer L. Gimbel, Director, Colorado Water Conservation Board Department of Natural Resources
Steven H. Gunderson, Director, Water Quality Control Division Department of Public Health and Environment
David W. Robbins, Attorney at Law NEVADA
McClain Peterson, Manager, Natural Resource Division Colorado River Commission of Nevada Leo M. Drozdoff, Director
Department of Conservation and Natural Resources John J. Entsminger, Assistant General Manager
Southern Nevada Water Authority NEW MEXICO
John R. D’Antonio, Jr., P.E., State Engineer New Mexico State Engineer Office
UTAH
Dennis J. Strong, Director, Division of Water Resources Department of Natural Resources
John Whitehead, Assistant Director, Water Quality Division Department of Environmental Quality
Randy Crozier, General Manager Duchesne County Water Conservancy District
WYOMING
Patrick T. Tyrrell, State Engineer State Engineer's Office
John F. Wagner, Administrator, Water Quality Division Department of Environmental Quality
Dan S. Budd, Interstate Stream Commissioner FORUM
Don A. Barnett, Executive Director Colorado River Basin Salinity Control Forum
ii

iii
TRANSMITTAL LETTERS
The Federal Water Pollution Control Act requires that at least once every three years the Basin States
review water quality standards relating to the salinity of the waters of the Colorado River. The states
collectively initiated this review under the auspices of the Forum, prepared a proposed Review and,
after holding public meetings, prepared this final Review.
Upon the Forum's adoption of the final Review, it is transmitted by letter to the governors of the
individual states for their independent action. The following governors in each of the seven Basin
States shall receive this Review: Honorable Janice K. Brewer Governor of Arizona State Capitol Phoenix, AZ 85007 Honorable Jerry Brown Governor of California State Capitol Sacramento, CA 95814 Honorable John W. Hickenlooper Governor of Colorado State Capitol Denver, CO 80203 Honorable Brian Sandoval Governor of Nevada State Capitol Carson City, NV 89701
Honorable Susana Martinez Governor of New Mexico State Capitol Santa Fe, NM 87503 Honorable Gary R. Herbert Governor of Utah State Capitol Salt Lake City, UT 84114 Honorable Matthew H. Mead Governor of Wyoming State Capitol Cheyenne, WY 82002

iv
SUMMARY
This Review is a review of the water quality standards for salinity for the Colorado River. Section
303 of the Clean Water Act requires that water quality standards be reviewed from time to time, but
at least once during each three-year period. Accordingly, the seven-state Colorado River Basin
Salinity Control Forum has reviewed the existing state-adopted and EPA approved water quality
standards for salinity consisting of numeric criteria and a Plan of Implementation. During the period
of the 2008 Review, the Colorado River Basin Salinity Control Act was amended to include the
Basin States Program. The salinity model continues to be improved in order to provide the best
salinity projections for this Review. Upon adoption by the Forum, this Review will be submitted to
each of the Basin States for consideration as each state proceeds with its three-year water quality
review process.
The Forum recommends no change in the numeric salinity criteria at the three stations located on the
lower main stem of the Colorado River. The numeric criteria at these stations will remain:
Station Salinity in mg/L1
Below Hoover Dam 723
Below Parker Dam 747
At Imperial Dam 879
1Flow-weighted average annual salinity.
The Plan of Implementation is intended to maintain the salinity concentrations at or below the
numeric criteria while the Basin States continue to develop their compact-apportioned waters.
Reclamation’s computer model runs indicate there is little probability of the numeric criteria being
exceeded in the next three years. The Act requires the implementation of salinity control programs to
reduce the salinity of the Colorado River. Reducing the salinity of the Colorado River reduces
economic damages. The Plan of Implementation included in this Review, while insuring the numeric
criteria will not be exceeded during the review period, also recognizes additional salinity control
further reduces economic damages in the Lower Basin, as well as providing additional benefits in the
Upper Basin.
The Forum’s Plan of Implementation includes:
1. Construction of salinity control measures by Reclamation, USDA, the Basin States Program and
BLM to the extent that those measures remain viable and appropriately cost-effective.
2. Application of the Forum-adopted policies by each of the states (the text of the policies are
included in Appendix A of this Review).
3. Implementation of non-point source management plans developed by the states and approved by
EPA.
The Colorado River Basin Salinity Control Program is a unique cooperative watershed effort
between several federal agencies and seven states designated to meet national, international and state

v
water quality objectives. The Forum participates with federal, state, local agencies and private
participants to ensure the Plan of Implementation is implemented. The Forum also urges Congress to
appropriate the funds needed for implementation and recommends legislative changes when
necessary.
The water quality standards involve both a Plan of Implementation and numeric criteria. With the
Plan of Implementation as proposed in this Review in place, the probability of exceeding the numeric
criteria is low based on Reclamation computer model simulations. The analysis indicates the
probability of exceedance of the numeric criteria with the Plan of Implementation in place in the next
three years at the Hoover Dam, Parker Dam and Imperial Dam stations is 1 percent or less and, with
the Plan in place, probabilities stay below 5 percent through the 20-year evaluation period. This low
probability of exceedance opportunity was an important factor in the Forum’s decision to adopt the
Plan of Implementation accompanying this Review.

vi
TABLE OF CONTENTS
COLORADO RIVER BASIN SALINITY CONTROL FORUM MEMBERS ............................................. i
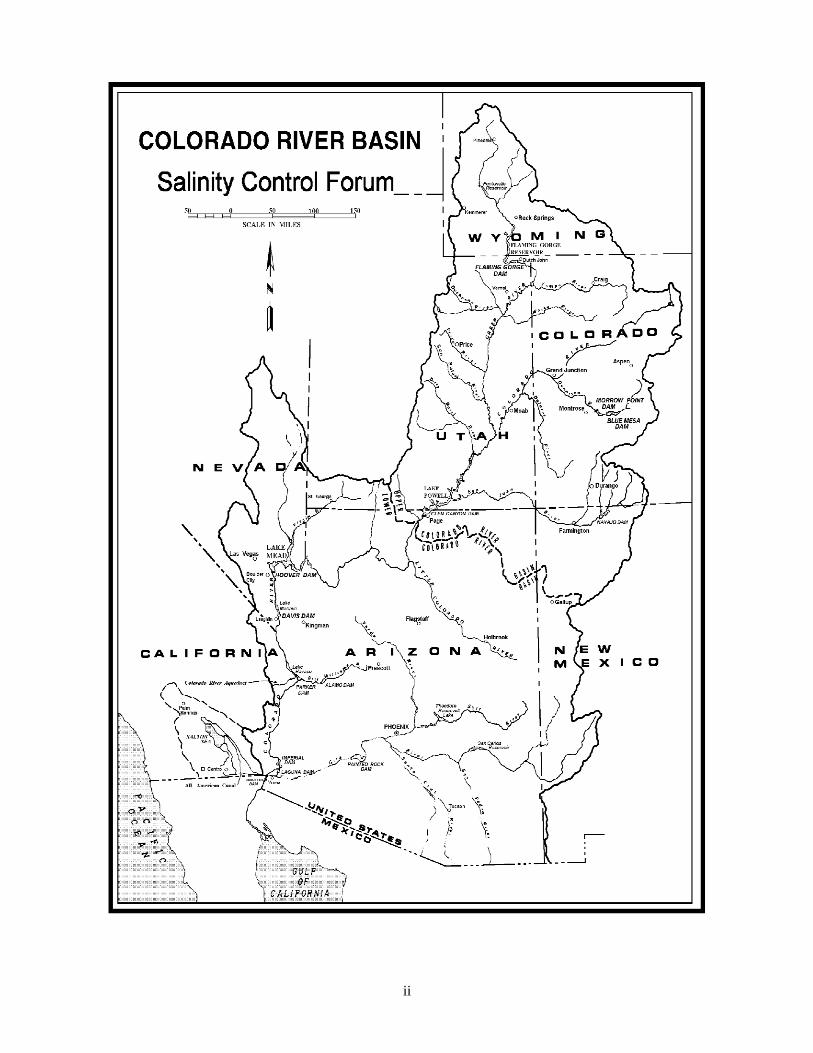
COLORADO RIVER BASIN MAP ............................................................................................................. ii
TRANSMITTAL LETTERS ....................................................................................................................... iii
SUMMARY ................................................................................................................................................. iv
TABLE OF CONTENTS ............................................................................................................................. vi
LIST OF ABBREVIATIONS ................................................................................................................... viii
PURPOSE OF THE REVIEW ...................................................................................................................... 1
HISTORY AND BACKGROUND ............................................................................................................... 2
UNDERSTANDING THE SALINITY OF THE COLORADO RIVER ...................................................... 4
PROVISION FOR REVIEWING AND REVISING THE STANDARD ..................................................... 8
NUMERIC CRITERIA ................................................................................................................................. 9
PLAN OF IMPLEMENTATION ................................................................................................................ 10
General .............................................................................................................................. 10
Constructed Measures ...................................................................................................... 12
Accomplishments and Future Control .............................................................................. 14
Forum Policies and NPDES Permits ................................................................................. 16
State Water Quality Management Plans ............................................................................ 16
CONCLUSION AND ADOPTION OF THE STANDARDS .................................................................... 24
TABLES
Table 1 Observed Flow-Weighted Average Salinity at the Numeric Criteria Stations ..................... 7
Table 2 Measures in Place ............................................................................................................. 14
Table 3 Plan of Implementation .................................................................................................... 15
Table 4 Potential Areas of Future Implementation ........................................................................ 15
FIGURES
Figure 1 2009 (Calendar Year) Generalized Flow and Salinity Concentrations Across the
Colorado River Basin .................................................................................................... 5
Figure 2 Salt Concentrations at Numeric Criteria Stations ............................................................... 6
Figure 3 Probability of Exceeding Numeric Criteria – Without Additional Controls ..................... 10
Figure 4 Probability of Exceeding Numeric Criteria – With Plan of Implementation .................... 12

vii
APPENDICES
Appendix A Forum Policies
Policy for Implementation of Colorado River Salinity Standards Through the
NPDES Permit Program .......................................................................................... A-1
NPDES Permit Program Policy for Implementation of Colorado River
Salinity Standards .................................................................................................... A-5
Attachment 1 - Guidance on New Construction Determination ................. A-15
Policy for Use of Brackish and/or Saline Waters for Industrial Purposes .................... A-16
Policy for Implementation of Colorado River Salinity Standards Through the
NPDES Permit Program for Intercepted Groundwater .......................................... A-18
Policy for Implementation of Colorado River Salinity Standards Through the
NPDES Permit Program for Fish Hatcheries ......................................................... A-21
Appendix B States NPDES Permits List
Legend .......................................................................................................... B-1
List of NPDES Permits ................................................................................. B-3
Appendix C EPA NPDES Permits List
Legend .......................................................................................................... C-1
List of NPDES Permits ................................................................................. C-3
Appendix D Colorado Simulation System Model Description ........................................................... D-1
Appendix E Colorado River Salinity Damage Model ........................................................................ E-1

viii
LIST OF ABBREVIATIONS
208 Plan Section 208 of the Clean Water Act amendments of 1972 and 1977
requiring integrated area-wide plans and programs for dealing with
water pollution problems
Basin Colorado River Basin
Basin Funds Lower Colorado River Basin Development Fund and Upper Colorado
River Basin Fund
Basin States Arizona, California, Colorado, Nevada, New Mexico, Utah, Wyoming
BSP Basin States Program
Basinwide Program Basinwide Salinity Control Program
BLM United States Bureau of Land Management
Clean Water Act P.L. 92-500
Congress United States Congress
CRSS Colorado River Simulation System
EQIP Environmental Quality Incentives Program
EPA United States Environmental Protection Agency
Forum Colorado River Basin Salinity Control Forum
maf million acre-feet
mgd million gallons per day
mg/L milligrams per liter
NPDES National Pollutant Discharge Elimination System
NRCS Natural Resources Conservation Service
Program Colorado River Basin Salinity Control Program
Reclamation United States Bureau of Reclamation
Review 2011 Review, Water Quality Standards for Salinity, Colorado River
System
TDS Total dissolved solids
The Act The Colorado River Basin Salinity Control Act (P.L. 93-320) (1974),
as amended by P.L. 98-569 (1984), P.L. 104-20 (1995), P.L. 104-127
(1996), P.L. 106-459 (2000), P.L. 107-171 (2002) and P.L. 110-246
(2008)
TMDL Total Maximum Daily Load
USDA United States Department of Agriculture
1
PURPOSE OF THE REVIEW
This 2011 Review, Water Quality Standards for Salinity, Colorado River System, (Review) is
prepared and submitted in response to Section 303(c) of Public Law (P.L.) 92-500 (Clean Water Act)
by the seven-state Colorado River Basin Salinity Control Forum (Forum) on behalf of the governors
of their respective states. This Review of the water quality standards includes the numeric criteria
and the Plan of Implementation developed and adopted by the Forum. This is the twelfth Triennial
Review conducted by the Forum. Section 303(c)(1) of the Clean Water Act requires that:
The governor of a state or the state water pollution control agency of such state shall
from time to time (but at least once each three-year period beginning with the date of
enactment of the Federal Water Pollution Control Act Amendments of 1972) hold
public hearings for the purpose of reviewing applicable water quality standards and,
as appropriate, modifying and adopting standards. Results of such review shall be
made available to the Administrator.
This Review is consistent with the United States Environmental Protection Agency (EPA) approved
1975 standards and deals only with that portion of the Colorado River Basin (Basin) above Imperial
Dam. This Review focuses on the 2011 to 2014 period and evaluates the appropriateness of the
standards. Background information and activities regarding historical actions relative to the
development and adoption of salinity standards is contained in the Forum report, Water Quality
Standards for Salinity, Including Numeric Criteria and Plan of Implementation for Salinity Control,
Colorado River System, Colorado River Basin Salinity Control Forum, June 1975.
Below Imperial Dam, salinity is controlled as a federal responsibility to meet the terms of the
agreement with Mexico contained within Minute No. 242 of the International Boundary and Water
Commission entitled "Permanent and Definitive Solution to the International Problem of the Salinity
of the Colorado River." Minute No. 242 requires that measures be taken to assure that Colorado
River water delivered to Mexico upstream from Morelos Dam will have an average annual salinity
concentration of no more than 115 ± 30 parts per million TDS higher than the average annual flow-
weighted salinity concentration of the Colorado River water arriving at Imperial Dam.
Nothing in this Review shall be construed to alter, amend, repeal, interpret, modify, or be in conflict
with the provisions of the Boulder Canyon Project Act (45 Stat. 1057), the Boulder Canyon Project
Adjustment Act (54 Stat. 774), the Colorado River Basin Project Act (82 Stat. 885), the Colorado
River Compact, the Colorado River Storage Project Act (70 Stat. 105), the Upper Colorado River
Basin Compact, or the Treaty with the United Mexican States (Treaty Series 994).

2
HISTORY AND BACKGROUND
The Basin is 242,000 square miles2 (approximately 155 million acres) of the western United States
and a small portion of northern Mexico. Its waters serve some 7.5 million people within the United
States' portion of the Basin, and through export provides full or supplemental water supply to another
25.4 million people outside the Basin. The regional economy is based on irrigated agriculture,
livestock grazing, mining, forestry, manufacturing, oil and gas production, recreation and tourism.
The Colorado River provides irrigation water to about 4 million acres within the United States.
Hydroelectric power facilities along the Colorado River and its tributaries generate approximately 12
billion kilowatt hours annually which is used both inside and outside of the Basin. The Colorado
River also serves about 3 million people and 500,000 irrigated acres in Mexico.
Salinity-caused impacts have long been a major concern in the United States and Mexico. The
salinity in the river increases as it flows downstream. The Colorado River has carried an average salt
load of approximately 9 million tons annually past Hoover Dam, the uppermost location at which
numeric criteria have been established.
The salts in the Colorado River system are naturally occurring and pervasive. Many of the saline
sediments of the Basin were deposited in prehistoric marine environments. Salts contained within the
sedimentary rocks are easily eroded, dissolved, and transported into the river system.
In the 1960s and early 1970s, the seven Basin States and representatives of the federal government
discussed the problem of salinity concentrations increasing in the lower reaches of the Colorado
River. In a 1971 study3, EPA analyzed salt loading in the Basin and divided it into two categories,
naturally occurring and human-caused. EPA concluded that about half (47 percent) of the salinity
concentration measured in water arriving at Hoover Dam is from natural causes, including salt
contributions from saline springs, groundwater discharge into the river system (excluding irrigation
return flows), erosion and dissolution of sediments, and the concentrating effects of evaporation and
transpiration. The natural causes category also included salt contributions from non-point (excluding
irrigated agriculture) or unidentified sources or from the vast, sparsely populated regions of the
drainage, much of which are administered by the United States Bureau of Land Management (BLM)
or other governmental agencies. Of the land within the Basin, about 75 percent is owned and
administered by the federal government or held in trust for Indian tribes. The greatest portion of the
naturally occurring salt load originates on these federally owned and administered lands. Human
activities can influence the rate of natural salt movement from rock formations and soils to the river
system and include livestock grazing, wildlife management, logging, mining, oil exploration, road
building, recreation and urbanization.
Approximately 53 percent of the salinity concentration in the water arriving at Hoover Dam, as
identified by EPA, results from various human activities. EPA estimated that out-of-Basin exports
account for about 3 percent of the salt concentration at Hoover Dam, with irrigation accounting for
37 percent, reservoir evaporation and phreatophyte use accounting for about 12 percent, and about 1
percent attributed to municipal and industrial uses. Much of the salt load contribution from irrigated
2Colorado River System, Consumptive Uses and Losses Report, 1996-2000, Bureau of Reclamation
3The Mineral Quality Problem in the Colorado River, Summary Report, Environmental Protection Agency, Regions
VIII and IX, 65pp., 1971

3
agriculture is from federally developed irrigation projects. In 1972, the federal government enacted
the Clean Water Act that mandated efforts to maintain water quality standards in the United States.
At the same time, Mexico and the United States were discussing the increasing salinity of the
Colorado River water being delivered to Mexico.
The Basin States established the Forum in 1973. The Forum is composed of representatives from
each of the seven Basin States appointed by the governors of the respective states. The Forum was
created for interstate cooperation and to provide the states with the information necessary to comply
with Section 303(a) and (b) of the Clean Water Act.
EPA promulgated a regulation in December 1974 which set forth a basinwide salinity control policy
for the Basin. The regulation specifically stated that salinity control was to be implemented while the
Basin States continue to develop their compact-apportioned water. This regulation also established a
standards procedure and required the Basin States to adopt and submit for approval to EPA water
quality standards for salinity, including numeric criteria and a Plan of Implementation, consistent
with the policy stated in the regulation.
In 1975, the Forum proposed, the states adopted, and EPA approved water quality standards which
included numeric criteria and a Plan of Implementation to control salinity increases in the Colorado
River. The plan was designed to maintain the flow-weighted average annual salinity concentrations
at or below the 1972 levels while the Basin States continued to develop their compact-apportioned
water supply. Average annual salinity concentrations and salt loads were determined on a flow-
weighted basis. The flow-weighted average annual salinity concentration is determined by dividing
the flow-weighted average annual salt load passing a measuring station by the total annual volume of
water passing the same point during a calendar year. The flow-weighted average annual salt load is
calculated by first multiplying the daily salinity concentration values by the daily flow rates. These
values are then summed over a calendar year. The total annual volume of water is calculated by
calculating the sum of the daily flow rate.
The Forum selected three numeric criteria stations on the main stem of the lower Colorado River as
being appropriate points to measure the salinity concentrations of the river. These stations are located
at the following points: 1) below Hoover Dam, 2) below Parker Dam, and 3) at Imperial Dam.
The Colorado River Basin Salinity Control Act (P.L. 93-320) (1974) (Act), established the Colorado
River Basin Salinity Control Program (Program) under Title II to address the concerns raised by
EPA. P.L. 93-320 has been amended several times since its original enactment. P.L. 98-569 (1984)
authorized the United States Department of Agriculture’s (USDA) on-farm program. P.L. 104-20
(1995) created the United States Bureau of Reclamation’s (Reclamation) Basinwide Salinity Control
Program (Basinwide Program). The Federal Agriculture Improvement and Reform Act (P.L. 104-
127) (1996) (1996 Farm Bill) authorized up-front cost sharing by the Basin States and modified the
USDA authorities, including the use of the Environmental Quality Incentives Program (EQIP). P.L.
106-459 (2000) increased the appropriation ceiling. The Farm Security and Rural Investment Act
(P.L. 107-171) (2002) continued the authorization of EQIP. The Food, Conservation, and Energy
Act of 2008 (P.L. 110-246) (2008 Farm Bill) created the Basin States Program (BSP).

4
UNDERSTANDING THE SALINITY OF THE COLORADO RIVER
As with most large rivers, the natural flow of the Colorado River increases from its headwaters to its
terminus. Today, however, the flow of the Colorado River decreases below Hoover Dam as it is
decreased by diversions. Imperial Dam is the last major diversion point for uses in the United States.
In normal years, only 1.5 maf is scheduled to pass Imperial Dam for deliveries to Mexico. In general,
the salinity concentration of the water in the Colorado River increases from the headwaters to the
terminus. Much of the salt is picked up in the Upper Basin and some of the tributary streams average
higher concentrations of salt. Reclamation has developed a map of the Basin reflecting the relative
flows and the corresponding salinity concentrations of the water across the Basin in the calendar year
2009. This map is provided for general illustrative purposes as Figure 1. The average flow of the
Colorado River and its important tributaries are indicated by the width of the line and the salinity
concentrations are illustrated by colors coded to ranges in TDS.

5
Figure 1 – 2009 (Calendar Year) Generalized Flow and Salinity Concentrations
Across the Colorado River Basin

6
In general, over the last thirty years the salinity concentrations have decreased at all three of the
numeric criteria stations (see Figure 2 and Table 1). In 1970, the concentrations of all three stations
were at or above the concentrations which were later adopted as the numeric criteria for those
stations. Now the concentrations are well below the numeric criteria. Salinity concentrations are
based on TDS as the sum of constituents whenever possible. The sum of constituents is defined to
include calcium, magnesium, sodium, chloride, sulfate, a measure of the carbonate equivalent of
alkalinity and, if measured, silica and potassium. If a sum of constituents could not be computed,
TDS as residue on evaporation (at 180 degrees Celsius) is substituted. In this Review, the terms
"salinity," "TDS" and "concentration" in mg/L are used interchangeably.
During extreme drought which began about 2000, the concentrations of salts measured at Hoover
and Parker Dams numeric criteria stations increased sharply. Those concentrations have been
decreasing over the last few years. These trends can be observed in Figure 2. Relief from extreme
drought conditions in recent years might be a factor with respect to these decreases. The
concentration of salts measured at the Imperial numeric criteria station has exhibited no trend since
2006, remaining relatively unchanged.
Figure 2 – Salt Concentrations at Numeric Criteria Stations
400
500
600
700
800
900
1000
TD
S (m
g/L
)
Calendar Year
Below Hoover Below Parker At Imperial
Hoover Criteria Parker Criteria Imperial Criteria

7
Table 1
Observed Flow-Weighted Average Salinity
at the Numeric Criteria Stations
(Total Dissolved Solids in mg/L)4
Calendar Year Below Hoover Dam Below Parker Dam At Imperial Dam
(Numeric Criteria) (723 mg/L) (747 mg/L) (879 mg/L)
1970 743 760 896
1971 748 758 892
1972 724 734 861
1973 675 709 843
1974 681 702 834
1975 680 702 829
1976 674 690 822
1977 665 687 819
1978 678 688 812
1979 688 701 802
1980 691 712 760
1981 681 716 821
1982 679 713 827
1983 659 678 727
1984 598 611 675
1985 556 561 615
1986 517 535 577
1987 519 538 612
1988 529 540 648
1989 564 559 683
1990 587 600 702
1991 629 624 749
1992 657 651 767
1993 665 631 785
1994 667 673 796
1995 654 671 803
1996 618 648 768
1997 585 612 710
1998 559 559 655
1999 549 550 670
2000 539 549 661
2001 550 549 680
2002 561 572 689
2003 584 592 695
2004 625 644 729
2005 643 668 710
2006 646 671 720
2007 632 657 715
2008 622 646 717
2009 provisional 602 623 717
4 Determined by the USGS from data collected by Reclamation and USGS.

8
PROVISION FOR REVIEWING AND REVISING THE STANDARD
The Colorado River water quality standards for salinity and the approach taken by the Basin States in
complying with the standards are unique. The salinity concentrations that are projected in the future
have not been shown to have adverse effects on human health or wildlife. Thus, the Program is
different from most other water quality standard compliance programs. The standards adopted by the
Forum and the Basin States and approved by EPA consist of the numeric criteria and the Plan of
Implementation. The numeric criteria portion of the water quality standards are established to protect
against increases in economic damages to infrastructure and crop production. The Plan of
Implementation is designed to maintain the flow-weighted average annual salinity at or below the
numeric criteria while the Basin States continue to develop their compact-apportioned water supply
through projects and programs to meet water supply needs.
The Program is a basinwide coordinated effort among federal, state and local agencies and
participants to control salt loading. The Forum, in its statement of “Principles and Assumptions for
Development of Colorado River Salinity Standards and Implementation Plan,” approved by the
Forum on September 20, 1974, stated, under Principle 7:
The Plan of Implementation shall be reviewed and modified as appropriate from time
to time, but at least once every three years. At the same time, the (numeric) standards,
as required by Section 303 (c) (1) of P.L. 92-500 shall be reviewed for the purpose of
modifying and adopting standards consistent with the plan so that the Basin States
may continue to develop their compact-apportioned waters while providing the best
practicable water quality in the Colorado River Basin.
The Plan of Implementation is not intended to offset the salinity fluctuations that are a result of the
Colorado River’s highly variable annual flows (natural variations in the hydrologic cycle). Analyses
have shown that the impact of natural variations in the hydrologic cycle can have a significant impact
on salinity. These natural variations in runoff can cause a fluctuation in average annual salinity
concentration of as much as 350 mg/L TDS at Imperial Dam. Recognizing the variability of the
Colorado River, the plan for maintaining the criteria is developed using a long-term mean water
supply of 15 maf. When the Colorado River flows are at or above the long-term mean and reservoirs
are full, concentrations are expected and have been observed to be below the numeric criteria.
Conversely, when flows are dramatically below the long-term mean and reservoirs are depleted,
salinities may increase above the numeric criteria.
Considerable knowledge has been gained through a wide range of research and technical studies
since the Forum took this position. Procedures for reducing the volume of saline irrigation return
flows have been developed. Reclamation, Natural Resources Conservation Service (NRCS) and the
Basin States are funding salinity control measures with irrigation districts, canal companies and
individual farmers to accomplish salt loading reductions to the Colorado River system by improving
off-farm and on-farm water delivery systems and water management practices. Additionally, BLM is
investigating and implementing measures for reducing salt load contributions from the vast areas of
public lands within the Basin managed by the agency.

9
NUMERIC CRITERIA
As discussed earlier in this Review, EPA promulgated a regulation that set forth a basinwide salinity
control policy for the Basin. This policy required that the flow-weighted average annual salinity in
the lower main stem of the Colorado River be maintained at or below the 1972 levels. Three stations:
1) below Hoover Dam, (2) below Parker Dam, and (3) at Imperial Dam are the points in the lower
main stem of the Colorado River where the flow-weighted average annual salinity is measured. The
basis for selecting these stations is their proximity to key diversion facilities on the lower Colorado
River. Nevada diverts main stem water from Lake Mead for use in the Las Vegas area. The
Metropolitan Water District of Southern California and the Central Arizona Project divert water
from Lake Havasu, impounded behind Parker Dam, for millions of water users in southern California
and central Arizona, respectively. The large agricultural areas in the Imperial and Coachella Valleys
in California and the Yuma area in Arizona are served by diversions at Imperial Dam.
The numeric criteria for each of those stations as established in 1972 are as follows:
Below Hoover Dam 723 mg/L
Below Parker Dam 747 mg/L
At Imperial Dam 879 mg/L
The federal regulations provide for temporary increases above the numeric criteria levels if sufficient
control measures are included in the Plan of Implementation. Should additional water development
projects take place beyond those anticipated to occur before control measures are brought on line,
temporary increases above the numeric criteria could result. However, these increases will be
deemed in conformance with the standards if appropriate salinity control measures are included in
the plan. During the next three years, or the period of this Review, no increases above the 1972
levels are anticipated.
Since the numeric criteria were adopted in 1974, shifts in water use patterns have occurred in the
Lower Basin. While agriculture still remains the predominant user, there has been a shift within this
sector from growing mostly low value, salt tolerant crops to growing higher value, less salt tolerant
crops. Changing markets, increasing land values, escalating production costs, and competition for
water supplies drives agricultural producers to higher value crops per unit of land area. Continued
control of salinity levels allows the trend to plant and harvest higher value crops to continue. These
higher value crops tend to be less salt tolerant overall or are particularly susceptible to some of the
salt constituents such as sodium or boron. Because of this shift, the need for water conservation and
efficiency within the agricultural sector continues to put an emphasis on reducing salinity. Because
of the economic benefit to the Basin, the Forum believes there is justification to maintain salinity
levels below the numeric criteria and remove additional salt from the Colorado River, thus saving
several hundred million dollars in annual damages.
The Forum believes the Review is the appropriate setting to recommend any changes to the numeric
criteria. Based on the ongoing progress toward accomplishing all measures identified in the Plan of
Implementation as described in this Review and recognizing the numeric criteria are threshold limits,
the Forum finds the current numeric criteria are adequate for the next three years and recommends no
changes at this time.

10
PLAN OF IMPLEMENTATION
General
A purpose of the Plan of Implementation is to offset the salinity effects of future water resource
development that will occur in the Basin. The Plan of Implementation is not intended to address the
fluctuations in Colorado River salinity resulting from natural variations in river flows.
Figure 3 was created based on Reclamation’s long-term planning model, the Colorado River
Simulation System (CRSS). One hundred and three different flow scenarios were evaluated and the
probability of exceeding the numeric criteria in any year was calculated by dividing the number of
scenarios that exceeded the criteria in any year by 103. Probabilities are shown over the review
period (2011-2030) and include the current year (2011) and the year of the next Review (2014).
This figure shows the calculated probability of exceeding the numeric criteria if the only salinity
control measures completed are those that are now in process. Out year construction of salinity
control measures that might be contemplated by the Plan of Implementation were not included in the
analysis that led to the creation of Figure 3.
Figure 3

11
The Plan of Implementation is designed to keep the flow-weighted average annual salinity
concentrations at or below the 1972 numeric criteria levels while the Basin States continue to
develop their compact-apportioned water supply. The Plan of Implementation is based on
maintaining the numeric criteria under a long-term mean water supply of 15 maf per year as
represented by the natural flow database. The Plan of Implementation is based on the need to control
annually an additional 644,000 tons of salt by the year 2030. Based on present and projected
conditions, there is no probability that the numeric criteria will be exceeded given mean water supply
any time in the next 20 years. However, recognizing the variability in the flow of the Colorado River,
during periods of reduced flow there is an increasing probability of approaching or exceeding the
numeric criteria by 10 percent near the end of the review period.
The Plan of Implementation is composed of many actions contemplated by the federal government
and many of its agencies, and by each of the seven Basin States and many of their agencies. The plan
includes projects that remove the required salt tonnage. This will principally be accomplished by
reducing the salt contributions to the Colorado River from existing sources and minimizing future
increases in salt load caused by human activities. For this Review, the Plan of Implementation can be
briefly summarized as follows:
1. Implementation of salinity control measures by Reclamation, NRCS, the BSP and BLM to the
extent that those measures remain viable and appropriately cost-effective.
2. Application of the Forum adopted policies by each of the states (the text of the policies are
included in Appendix A, and a list of National Pollutant Discharge Elimination System (NPDES)
permits issued pursuant to these policies are found in Appendices B and C of this Review).
3. Implementation of non-point source management plans developed by the states and approved by
EPA (see State Water Quality Management Plans section of this Review).
The Forum participates with federal, state and local agencies and private participants to ensure the
Plan of Implementation is implemented. The Forum also urges Congress to appropriate the funds
needed for implementation and recommends legislative changes when necessary.
To evaluate the effectiveness of the Plan of Implementation, the probability of exceeding the numeric
criteria with the Plan of Implementation in place was calculated. Figure 4 provides the results of that
calculation. Comparing Figure 4 with Figure 3, it can be seen that the probability of exceeding the
numeric criteria is greatly reduced by the implementation of the plan. For example, the figure shows
the probability of exceeding the numeric criteria in any year remains fairly constant over the review
period with minimal increases. In fact the probabilities for the first three years of this Review are less
than 1 percent and stay below 5 percent for the full review period.

12
Figure 4
Constructed Measures
Congress enacted Public Law 93-320 in June of 1974 with the Forum's support. Title I of the Public
Law addressed the United States' commitment to Mexico and provided the means for the United
States to comply with the provisions of Minute No. 242. Title II of the Public Law created a water
quality program for addressing salinity in the Colorado River in the United States above Imperial
Dam. Primary responsibility for Title II was given to the Secretary of the Interior, with Reclamation
being instructed to investigate and build several salinity control units. The Secretary of Agriculture
was also instructed to support the effort within existing authorities.
Public Law 93-320 was amended in 1984 by P.L. 98-569 to authorize two additional units for
construction by Reclamation and directed BLM to implement a comprehensive program to minimize
salt loading in the Basin. The amendments directed the Secretary of the Interior and the Secretary of
Agriculture to give preference to the salinity control units with the least cost per unit of salinity
reduction. Public Law 93-320 was also amended to establish a voluntary on-farm salinity control
program to be implemented by USDA and provided for voluntary replacement of incidental fish and
wildlife values foregone on account of the on-farm measures. Many cost-effective salt-load reducing
activities have been accomplished since that authorization.

13
Reclamation
The Act was amended by P.L. 104-20 to authorize the Basinwide Program. The Basinwide Program
uses a competitive process that has greatly increased the federal cost effectiveness of salinity control.
Reclamation may implement a variety of effective salinity control measures, but most projects
concentrate on improving the efficiency of off-farm irrigation delivery systems. Reclamation solicits
applications through a Funding Opportunity Announcement (FOA) for projects that will reduce the
salinity of the Colorado River. Reclamation evaluates and ranks each application and awards grants
to the highest ranking applications. Cost effectiveness is the prime criteria in the evaluation. The
timing of the FOA is based on the need and the amount of federal appropriation Reclamation
receives to implement its portion of the Program. P.L. 106-459 increased the authorization ceiling
for Reclamation’s salinity control program.
USDA NRCS
The NRCS program generally concentrates on improving on-farm systems. NRCS salinity activities
fall mainly under the authorities of EQIP. EQIP was initially authorized under the 1996 Farm Bill
and reauthorized by the 2008 Farm Bill. While the 2008 Farm Bill is set to expire in late 2012, this
Review assumes that, as in the past, some comparable authorization will be available for NRCS to
continue its salinity control activities.
NRCS accepts applications under EQIP and evaluates, ranks and selects those applications that best
meet the goals of the salinity control program. Based on the application, NRCS provides technical
and financial assistance to the producers. NRCS also offers financial assistance for voluntary
replacement of fish and wildlife values forgone.
Basin States Program
The Act requires cost share on federal appropriations expended by both Reclamation and NRCS for
salinity control in the Basin. The Act further authorizes that the Lower Colorado River Basin
Development Fund and the Upper Colorado River Basin Fund (Basin Funds) be used to provide the
required cost sharing. The moneys for the Basin Funds come from a levy assessed on power
revenues on the Colorado River. Public Law 110-246 amended the Act and created the BSP through
which all moneys from the Basin Funds used for cost sharing in Reclamation and NRCS salinity
control programs are administered by Reclamation in consultation with the Colorado River Basin
Salinity Control Advisory Council. The required cost share on the original salinity control units of
Paradox, Grand Valley, and Las Vegas Wash is 25 percent of the project cost. The required cost
share on the original units of McElmo Creek and Lower Gunnison, the Basinwide Program, and the
NRCS EQIP is 30 percent of the project costs.
For cost share dollars generated by the federal expenditures under the Basinwide Program,
Reclamation expends the required cost share moneys together with appropriated funds in the
Basinwide Program using the FOA process. BSP moneys generated by federal appropriations
expended in EQIP are managed by Reclamation to administer the BSP and to enter into the following
agreements: 1) NRCS for technical assistance, 2) other federal agencies for studies and research, 3)
the states of Colorado, Utah, and Wyoming to fund approved salinity control activities and projects,
and 4) other entities for approved salinity control activities and salinity control projects. Cost share
funds received by the states allow the states to enter into contracts with other local entities to achieve

14
salinity control. Each of the state agencies have the same goal of providing salinity control in the
most cost-effective manner. The cost share aspects of the Basin States Program have proven very
useful as a means of achieving additional cost effective salinity control.
BLM
The goal of the BLM program is to reduce the mobilization of salts to the Colorado River from BLM
administered public lands. Salt reduction is achieved by controlling both point and non-point sources
of salt contributions; however, the majority of salt derived from public lands is of non-point-source
origin. Salt loading from non-point sources is mainly reduced by minimizing soil erosion. BLM
uses mainly appropriated funds to achieve salinity control goals.
Accomplishments and Future Control
The Plan of Implementation recognizes that the Forum, participating federal agencies, and the Basin
States each have specific responsibilities for furthering the Program. The Forum, in conjunction with
the Colorado River Basin Salinity Control Advisory Council, will continue to provide overall
coordination and a continuing review of salinity changes, program effectiveness, and the need to
make further program changes and improvements.
To date, it is estimated that the Program has reduced the salt loading in the Colorado River by
approximately 1,206,000 tons per year. Table 2 gives a brief summary of the measures that have
been implemented to date, the areas where those measures have occurred and the tons of salt
controlled per year associated with each area.
Table 2
Measures in Place
Tons/Year Tons/Year
Agricultural Measures 932,000 Other Measures 274,000 Big Sandy 68,000 Paradox Valley Unit 113,000
Grand Valley 271,000 Meeker Dome 48,000
Green River 0 Las Vegas Wash 4,000
Lower Gunnison 167,000 Ashley Valley WWTP 9,000
Mancos 4,000 Nonpoint Sources 85,000
Manila 13,000 Well-Plugging 15,000
McElmo 50,000
Muddy Creek 0
Price-San Rafael 126,000
Silt 4,000
Uinta 179,000
Non-project areas 50,000
TOTAL 1,206,000
The Plan of Implementation included in this Review anticipates the continuation of the Program
through the period of the Review. As shown in Table 3, it is anticipated that an additional 644,000
tons per year will be removed by the Plan of Implementation, resulting in a total of 1,850,000 tons
per year reduction by 2030. The Plan of Implementation also assumes that the reductions occurring at

15
the Paradox Valley Unit, as it may be modified in the future, will continue through the review period.
The table identifies the tons to be controlled by each of the four funding sources.
Table 3
Plan of Implementation
Funding Source Tons/Year
RECLAMATION (Basinwide Program) 258,000
USDA NRCS (EQIP) 186,000
BLM 10,000
BASIN STATES PROGRAM (Cost Share) 190,000
Basinwide Program 110,000
EQIP Related 80,000
TOTAL 644,000
The Plan of Implementation includes measures similar to those used in past Plans of Implementation.
This Plan of Implementation mainly focuses on the improvement of agricultural practices in the
Upper Colorado River Basin. These improvements include both on-farm and off-farm activities.
Table 4 summarizes the areas in which these improvements will most likely occur. The majority of
the salt reduction will occur in historically established salinity project areas, but some will occur in
areas that are outside those historic areas and have not been included in previous Plans of
Implementation. Table 4 provides the areas and an estimate of the potential salt reductions for both
on-farm and off-farm that could occur in those areas. The potential additional controllable salt
remaining in all of the identified areas is estimated to be 1,362,000 tons per year, and thus the
potential available tons exceed the 644,000 tons required by the Plan of Implementation.
Table 4
Potential Areas of Future Implementation
Tons/Year Tons/Year
Projects Areas 1,182,000
Big Sandy 39,000
Grand Valley 234,000
Green River 14,000
Lower Gunnison 585,000
Mancos 20,000
Manila 22,000
McElmo 39,000
Muddy Creek 13,000
Price-San Rafael 90,000
Silt 18,000
Uinta 108,000
Non-project Areas 20,000
Saline Groundwater Sources 150,000
Nonpoint Sources 10,000
TOTAL 1,362,000

16
Forum Policies and NPDES Permits
An important component of the Plan of Implementation for salinity control is the Basin States'
activities associated with the control of salt discharge to the Colorado River through Forum policies
and NPDES permits. In 1977, the Forum adopted the Policy for Implementation of Colorado River
Salinity Standards through the NPDES Permit Program. This policy provides guidance for the
regulation of municipal and industrial point source discharges of saline water. The Forum approved
needed changes to its NPDES policy on October 30, 2002. In 1980, the Forum adopted a policy to
encourage the use of brackish and/or saline waters for industrial purposes where it is environmentally
sound and economically feasible. A third policy dealing with intercepted groundwater was adopted
by the Forum in 1982. In 1988, the Forum adopted a fourth policy which addresses the salinity of
water discharges from fish hatcheries. These policies are found in Appendix A of this report.
Each of the states has adopted the Forum policies presented in Appendix A. A listing of NPDES
permits in force within the Basin is presented in Appendix B. Some NPDES permits are issued by
EPA for federal facilities and on Indian reservations. NPDES permits are issued by EPA for New
Mexico. Salinity discharge requirements for these permits are reviewed and added where needed
during the permit re-issuance process. The Forum policies also apply to these EPA permits and
hence, this EPA effort is a part of the Plan of Implementation. The permits issued by EPA can be
found in Appendix C of this report. During the period of this Review, the status of implementation of
NPDES permits and water quality management plans in each of the states is as follows:
State Water Quality Management Plans
Arizona
Scope
The Colorado River enters Arizona, and the Lower Basin, near Page, travels through the Grand
Canyon before turning southward at Lake Mead (Hoover Dam) and flowing to the Gulf of California.
There are four major drainages entering the river as it passes through Arizona: 1) the Little Colorado
River which drains east-central Arizona, crosses the Navajo Reservation before emptying into the
Colorado River approximately 50 miles south of the Utah border; 2) the Virgin River which cuts
across the northwest corner of Arizona from Utah before entering Lake Mead; 3) the Bill Williams
River, formed by the Big Sandy and the Santa Maria Rivers at Alamo Lake, which empties into the
Colorado River above Parker Dam, and lastly 4) the Gila River, which drains central and southern
Arizona and joins the Colorado River near Yuma, below Imperial Dam. Because this latter reach
enters the river below Imperial Dam, facilities discharges to the Gila River or tributaries do not
require conformance with the Forum policies.
NPDES Permitting
The Water Quality Division of the Arizona Department of Environmental Quality administers the
Arizona Pollutant Discharge Elimination System (AZPDES) program on non-Indian country lands.
All major permits for municipal and industrial discharges, with direct river discharges, are written in
conformance with the associated Forum policies. The agency continues to evaluate and revise other
discharge permits as information becomes available.

17
Currently there are 32 active, individual Arizona discharge permit holders in the non-tribal portion of
the River system. Of these, 3 are for industrial discharges related to mining and fueling stations.
There are 24 permits associated with discharges from municipal and domestic wastewater and/or
water treatment facilities. These facilities serve a total population of approximately 115,000 people.
A specific listing of the individual permits and the status of compliance with Forum policy is
contained in Appendix B.
Of the 21 federally recognized tribes in Arizona, 7 tribes have lands within the drainage of the Basin
and 3 tribes currently hold a total of 19 NPDES permits. Six of these permits are issued and
administered by EPA Region 9 in San Francisco. The balance are issued and administered by the
Navajo Nation. Of the 19 permits on tribal lands, twelve permits are for community wastewater
treatment facilities and five are for domestic wastewater discharges from boarding schools. There are
two other permits issued to non-tribal entities with facilities located on tribal lands. One is a mining
operation, the other a trading post.
Water Quality Assessments and TMDLs
In general, water quality in the Arizona portion of the Basin is good to very good. There are currently
only 9 stream segments in the Basin that are listed in the state’s 2006/2008 Section 303(d) report as
impaired (2 – Bill Williams, 5 – Colorado River Mainstem, 2 – Little Colorado River). No waters are
currently listed for salinity related impacts. The primary causes of impairment (a water body may be
impaired for more than one pollutant) are sediment (4), selenium (4), pathogens (2) and trace metals
(2), including mercury. Complete assessment information can be found on the agency’s website at:
http://www.azdeq.gov/environ/water/assessment/assess.html
Watershed Planning
Some of these water quality issues are being addressed through locally-led watershed management
efforts funded through Arizona’s 319 grant program. The Arizona Department of Environmental
Quality Water Quality Improvement Grant Program utilizes comprehensive watershed-based plans,
which contain EPA’s required nine elements, to help focus funding to those areas and projects that
have the greatest chance for improving water quality. These plans contain implementation strategies
for many of the impaired waters, as well as Best Management Practices to address existing and
potential issues in the watershed.
California
NPDES Permitting
The California Regional Water Quality Control Board, Colorado River Basin Region (Regional
Board), issues NPDES permits for navigable waters and Waste Discharge Requirements for land
discharges within the Colorado River drainage portion of the state. The only NPDES permit issued
by the Regional Board is R7-2007-0037 which is for the United States Bureau of Reclamation Parker
Dam and Power Plant Drinking Water Facility. The permit was updated on June 26, 2007, and will
expire on June 26, 2012. In issuing and reissuing waste discharge requirements, the Regional Board
complies with all Forum policies. In addition, the Regional Board has included in the discharge
permit requirements for land discharges a prohibition against brine backwash from water softeners

18
into evapo-percolation ponds which overlie groundwaters which are in hydraulic continuity with the
Colorado River System. Industrial discharges are to be confined in impervious evaporation basins.
Water Quality Management Planning
The Water Quality Control Plan for the Colorado River Basin was adopted by the Regional Board in
November 1993. Following public hearings, the updated plan was adopted by the Regional Board
and approved by the State Water Resources Control Board in February 1994. The revised plan
became effective upon approval of the Office of Administrative Law in August 1994. The salinity
control component of the Water Quality Control Plan is consistent with the Forum's Plan of
Implementation for salinity control. The Regional Board is working with local entities and the
Colorado River Board of California to ensure that implementation of the water quality plan is
achieved.
In March 2008, the Regional Board completed the 2007 Triennial Review of the Water Quality
Control Plan. The purpose of this Review is to reaffirm and/or revise water quality objectives and
beneficial uses for ground and surface waters, and evaluate the adequacy of the Basin Plan for
protecting water quality. Several projects that require Basin Plan amendments are underway and
include TMDLs for the Salton Sea, New River, Alamo River, Coachella Valley Stormwater Channel,
and the Palo Verde Outfall Drain. Recently adopted amendments include a Silt TMDL for the
Imperial Valley Drains and a Trash TMDL for the New River.
Other Activities
State Water Resources Control Board Policy on the Use and Disposal of Inland Waters Used for
Powerplant Cooling, Resolution No. 75-58 establishes priorities for the use of poor quality waters for
cooling of inland power plants, and has been in effect since 1975. The State Water Resources
Control Board has included salinity control in the Colorado River among its top priority items.
Colorado
Scope
Colorado’s portion of the Colorado River Basin is comprised of six major drainages: 1) the main
stem of the Colorado River from the continental divide to the Utah border, 2) the Roaring Fork River
Basin, 3) the Yampa/White River Basin which flows to the Green River in Utah, 4) the Gunnison
River Basin, 5) the Dolores River which flows to the main stem in Utah, and 6) the San Juan Basin
which flows into New Mexico and then to the main stem in Utah.
NPDES Permitting
The Colorado Department of Public Health and Environment, Water Quality Control Division,
administers the NPDES permitting program in the Colorado River Basin, with the exception that
EPA issues permits for point source discharges on the Southern Ute and Ute Mountain Ute
Reservations as well as for federally owned lands such as National Parks. This would include
permits for discharges to groundwater that would contribute salinity to the Colorado River system
through a hydrologic connection to surface waters. Permits for industrial and municipal discharges
are written in conformance with the associated Forum policies. Colorado continues to issue

19
stormwater permits to construction of oil and gas development sites and related infrastructure (e.g.
roads) of one or more acres of disturbance, even though the Energy Policy Act had exempted this
activity from the requirement to obtain a permit at the federal level.
Currently there are more than 350 active discharge permits in the Colorado portion of the Colorado
River Basin. A specific listing of the individual permits and compliance status is contained in
Appendix B.
Water Quality Assessments and TMDLs
The waters in Colorado’s portion of the Colorado River Basin, particularly at higher elevation, are
generally of good quality. There are 63 stream segments in the Colorado River Basin in Colorado (
24 – Gunnison, 33 – main stem and tributaries of the Colorado River, and 6 – San Juan) which are
included on the 2010 303d List of Impaired Waters. Of these, a significant majority in the lower
ends of these basins are impaired for selenium. Water quality impairments in the mountainous
portions of these basins are due to high concentrations of metals, primarily caused by the remnants of
historic mining activities. No waters are currently listed for salinity related impacts.
The lower portions of each of these basins are underlain by bedrock deposits of the cretaceous
period, most notably Mancos Shale and Dakota Sandstone. The Mancos Shale is a marine deposit
and, as such, contains significant amounts of readily soluble constituent materials, including
selenium. Groundwater which leaches to the relatively impermeable shale deposits tends to dissolve
selenium and, as it flows atop the bedrock strata towards surface drainages, carries elevated levels of
dissolved selenium with it. Various anthropogenic activities like sand and gravel extraction,
agricultural and urban landscape irrigation accelerate the mobilization and transport of selenium
from shale and shale derived soil to surface water.
Watershed Planning - Colorado River Basin Selenium/Salinity NPS Activities
Recent activities in the Basin have ranged from planning to implementation projects for selenium
and salinity reduction. The Lower Gunnison and Grand Valley Watershed Plan update has been
tracking the Selenium Management Plan as required by the Final Gunnison Basin Biological
Opinion, December 2009. A working draft of the watershed plan will be available in July 2011. A
Middle Colorado watershed group has formed and received preliminary Nonpoint Source (NPS)
section 319 funding to develop a watershed plan for the area from Glenwood Canyon to DeBeque
Canyon, a watershed with selenium impaired segments. The Water Quality Control Division has
also completed the state’s first selenium TMDLs for 12 segments in the Gunnison River Basin. The
Water Quality Control Division will begin monitoring of streams and lakes on or tributary to the
main stem of the Colorado River in preparation for developing TMDLs for impaired water bodies
from DeBeque Canyon to the Utah state line. A very substantial accomplishment has been the piping
of irrigation laterals in the Uncompahgre Basin with NPS and Bureau of Reclamation funding. This
particular EF lateral project involved 6.5 miles of piping that will reduce loading by an estimated
171-214 lbs/year of selenium and 2,138 tons/year of salt. Construction is complete and the project is
currently being evaluated by USGS. Additional funding is being sought for other piping projects,
basin-wide monitoring, and conservation efforts.

20
Nevada
Scope
The Basin within Nevada consists of three major tributaries: 1) the Virgin River, 2) the Muddy
River, and 3) the Las Vegas Wash. All of these tributaries flow into Lake Mead and provide nearly
all of the inflow to the Colorado River from Nevada.
NPDES Permitting
The Nevada Division of Environmental Protection is the EPA delegated authority for the issuance of
NPDES Permits. As of December 31, 2010, there were 56 active discharge permits in the Nevada
portion of the Colorado River System. The largest dischargers, the City of Las Vegas, the Clark
County Water Reclamation District, and the City of Henderson are permitted to discharge a
maximum flow up to 91 mgd, 150 mgd, and 40 mgd respectively. The qualities of the waters
affected by these permits are closely monitored and all necessary programs to protect water quality
standards are being implemented. Nevada continues to apply the policies adopted by the Forum.
Water Quality Management Planning
Area-wide water quality management planning duties and powers have been vested to certain
counties and entities. The Clark County Board of Commissioners was designated the Area-Wide
Water Quality Management Planning organization within Clark County. The initial 208 Plan was
adopted by the Clark County Board of Commissioners in 1978 and was approved by EPA. Since
that time, several 208 Plan revisions have been made as needed to address changing needs.
TMDLs
In 1987, the Nevada Division of Environmental Protection established total phosphorus and total
ammonia Waste Load Allocations (WLAs) in the Las Vegas Wash at Northshore Road as needed to
meet the Las Vegas Bay water quality standards. The WLAs set are applicable for only April
through September and were based upon target concentrations (0.64 mg/L – total phosphorus, 1.43
mg/L total ammonia) and average stream flows.
New Mexico
Scope
New Mexico’s portion of the Basin above Imperial Dam is comprised of two major drainages: 1) the
Rio Puerco, which is a tributary of the Little Colorado River, and 2) the San Juan River, which is a
major tributary of the Colorado River.
NPDES Permitting
In New Mexico, authority for issuing permits is administered by EPA Region 6, except for facilities
located on the Navajo Indian Reservation, which are administered by Region 9. All permits for
industrial and municipal discharges are written in conformance with the associated Forum policies.
Currently, there are 28 active discharge permits in the New Mexico portion of the Colorado River

21
system, of which Region 6 administers 16 permits and Region 9 administers 12 Navajo Reservation
permits. Of these, 13 permits (9 non-Indian, 4 Navajo) are for industrial discharges and 15 permits (6
non-Indian, 1 Jicarilla Apache, 8 Navajo) are associated with municipal wastewater discharges.
Water Quality Assessment and TMDLs
The New Mexico Water Quality Control Commission has adopted the framework for water quality in
New Mexico, which includes the State of New Mexico Water Quality Management Plan and the
New Mexico Nonpoint Source Management Plan. Both plans cover the entire state, except for that
portion of the Navajo Reservation lying therein. Planning within the reservation is the sole
responsibility of the Navajo Tribe. Much of the Basin in New Mexico falls within the boundaries of
the reservation.
The following TMDLs have been adopted by the New Mexico Water Quality Control Commission
and approved by EPA within the New Mexico portion of the Basin at this time:
• Animas River: E. coli, nutrients
• Gallegos Canyon: selenium
• La Plata River: E. coli, siltation, dissolved oxygen
• San Juan River: E. coli, sedimentation/siltation
Sample collection for the most recent San Juan Basin Surface Water Quality Survey was completed
in 2010 by the Surface Water Quality Bureau of the New Mexico Environment Department. An
updated list of impairments is scheduled to be released in 2012, to be followed by an updated TMDL
list.
Watershed Planning
Work plans are developed and grant funding secured under Clean Water Act Section 319(h) for
watershed-associated development, riparian area restoration, certification of Section 404 permits,
spill response, and treatment of abandoned mines. The work plans identify and coordinate efforts by
state, federal, and local agencies, along with other groups and private citizens to reduce or prevent
non-point source pollution and implement Best Management Practices to reduce non-point source
pollutants. The New Mexico Environment Department and the San Juan Watershed Group, an
unincorporated citizen and interagency group funded by the Section 319(h) program, are working to
improve water quality in the San Juan River by implementing Best Management Practices for non-
point source contributors of nutrients and E. coli. State Revolving Loan Funds and other funds are
authorized and available for use in funding salinity control projects. State actions in support of
salinity control include: 1) inclusion of salinity control measures in the Section 208 plans, 2)
dissemination of information on salinity sources and control, 3) consultation with industries on
potential salinity reduction measures, 4) implementation of Forum policy through NPDES permits,
and 5) maintaining a continuous water quality planning program whereby new or additional salinity
control measures can be addressed.

22
Utah
Scope
Utah’s portion of the Colorado River Basin is comprised of ten major sections: 1) the main stem of
the Colorado River from the Colorado border to the Arizona Border in Lake Powell, 2) the Green
River Basin from the Wyoming state line in Flaming Gorge Reservoir to the confluence with the
Colorado River, 3) the Duchesne River Basin, 4) the lower Yampa and White River Basins which
flow to the Green River in Utah, 5) the Price and San Rafael River Basins, 6) the Dirty Devil and
Escalante Rivers, 7) the lower portion of the San Juan River Basin which flows into the main stem of
the Colorado River in Utah, 8) the Paria River, 9) the Kanab Creek Basin to the Arizona State Line,
and 10) the Virgin River Basin to the Arizona state line.
NPDES Permitting
The Utah Division of Water Quality (DWQ) within the Utah Department of Environmental Quality
administers the NPDES permitting program in Utah. Permits for industrial and municipal discharges
within the Colorado River Basin are written in conformance with the associated Forum policies and
are available for viewing on line at www.waterquality.utah.gov/permits/index.htm.
As of December 31, 2010, there are 79 active discharge permits issued by DWQ in the Utah portion
of the Colorado River Basin. Of these, 34 are for municipal discharges and 45 are for industrial
discharges. A specific listing of the individual permits and their compliance status is contained in
Appendix B. By 2006, a total of 5 discharge permits for coal mining operations in Utah were
developed to offset salinity contributions from industrial sources in accordance with the Forum
policy adopted as part of the 2002 Triennial Review. The salinity-offset project plans for all 5 coal
mine facilities have been finalized and all projects have been implemented as of 2010 to offset
salinity contributions in excess of the one ton per day requirement from those facilities.
Water Quality Assessments and TMDLs
The waters in Utah’s portion of the Colorado River Basin are generally of good quality. There have
been 23 stream segments listed for impacts from salinity/TDS/chlorides. These segments are
generally in the lower reaches of the respective basins and are the result of a combination of natural
salt loadings as well as agricultural drainage. TMDLs have been developed to address these
salinity/TDS/chloride impairments. For information about the completed studies and to view the
current Utah 303(d) list of impaired water bodies please visit www.waterquality.utah.gov/TMDL.
Watershed Planning
Utah's Watershed Management and Planning program is focused on protecting and restoring the
water quality of its streams, lakes and groundwater resources by employing the following key
elements: Stewardship, Monitoring and Assessment, Coordination and Watershed Planning.
Although projects exist in other regions, currently the Upper Colorado Basin region in Utah has no
watershed planning projects in progress for water quality. The Basin Plans for the Utah State Water
Plan include water quality as part of the process and these plans are updated periodically.

23
Wyoming
Scope
Wyoming’s portion of the Basin is comprised of two major main stream drainages: 1) the Little
Snake River, which is a tributary of the Yampa River in Colorado, and 2) the Green River which
empties into Flaming Gorge Reservoir on the Wyoming-Utah border.
NPDES Permits
Currently there are 37 active discharge permits in the Wyoming portion of the Colorado River
system. Of these, 15 are for industrial discharges related to fish hatcheries, coal mines, power plants
or oil and gas production facilities. The largest discharge is from the City of Rock Springs
Wastewater Treatment Plant which discharges approximately 7.67 tons/day of salt into Bitter Creek,
a tributary of the Green River near Rock Springs. There are 22 permits associated with municipal
wastewater discharges. These facilities serve a total population of approximately 50,000 people. A
specific listing of the individual permits and compliance status is contained in Appendix B.
Water Quality Assessments and TMDLs
In general, water quality in the Wyoming portion of the Basin is good to very good. There are
currently only 12 streams and rivers identified as either impaired or threatened in the state’s 2010
Section 303(d) List (10 pollutant/segment combinations on 6 streams/rivers in the Green River
Basin, 13 pollutant/segment combinations on 6 streams in the Little Snake River Basin). Of these
impaired waters, Bitter Creek in the Green River Basin and Muddy Creek in the Little Snake River
Basin are listed for salinity related impacts (chloride). The Bitter Creek TMDL is scheduled to begin
in 2012. The Muddy Creek TMDL is not scheduled for development at this time. Complete
assessment information can be found at http://deq.state.wy.us/wqd/watershed/index.asp.
Watershed Planning
Local watershed groups have written watershed plans for the majority of the impaired waters within
the Green River and Little Snake River Basins. These groups have worked to implement the
watershed plans through Wyoming’s Clean Water Act Section 319 Grant Program and other state
and federal cost share programs. In addition, the Wyoming Department of Environmental Quality
(WDEQ) is currently in the process of developing TMDLs for five of the 23 water quality
impairments in the two basins that are listed on the 2010 303(d) list. These TMDLs include one
impairment listing on the Ham’s Fork River and four impairment listings on Haggerty and West Fork
Battle Creeks. Furthermore, the WDEQ plans to initiate TMDLs on the Blacks Fork River, Smiths
Fork River, Willow Creek, Bitter Creek, and Killpecker Creek within the next two to three years. In
2010, the Wyoming Water Development Commission revised the river basin water plan for the
Green River and Little Snake River drainages. This report updates information about the current uses
and projected future uses of water in the basin, and includes other useful information such as
irrigated lands delineation, hydrologic modeling of major streams, estimated availability of surface
and groundwater for future use, and recommendations and strategies for facing current and future
water use challenges. Detailed information can be accessed at: http://waterplan.state.wy.us .

24
CONCLUSION AND ADOPTION OF THE STANDARDS
The Standards consist of two components, the numeric criteria and the Plan of Implementation. No
change has been made in the numeric criteria since their adoption in 1975 by the Basin States and
approval by EPA. After having conducted this Review, the Forum has again found the numeric
criteria to be appropriate and recommends no changes in these criteria. The Forum also finds that
the updated Plan of Implementation is adequate to keep the salinity concentration of the Colorado
River below the numeric criteria through 2030, thus providing significant benefits to the Basin. The
effect of the Plan of Implementation on the Standard is that the probability of exceeding the numeric
criteria is extremely low, less than 5 percent in any given year, for the review period and provides a
measurable improvement to quality of the Colorado River.
The Forum and the states remain committed to continued improvement of the water quality of the
Colorado River.
As water development occurs throughout the Basin, salinity concentrations and the associated
economic damages will increase. The Forum’s understanding of the anticipated salinity
concentration increases, with and without control measures, is largely based on predictions made by
Reclamation’s CRSS model. That model is briefly described in Appendix D. As to economic
damages, the Forum is also dependent on Reclamation’s economic damage model. That model is
briefly described in Appendix E. An aggressive salinity control program is needed to reduce these
damages. The Program, while continuing to maintain salinity concentrations at or below the numeric
criteria, will focus on the opportunities to further reduce future economic damages. The Forum will
continue to advance an aggressive program over the next decade to continue to control as much salt
loading as economically justifiable.
The Program is truly a unique program and it cannot be successful without the cooperation of a
multitude of agencies and governments involved at the local, state and federal levels. First, the
Program is reliant upon the cooperation of land owners in implementing important and cost-effective
salinity control measures. Secondly, the Program is dependent on a multitude of agreements among
the seven Basin States which have always been accomplished by consensus. Lastly, the Program
depends upon the cooperation of a number of federal agencies for its success. In addition to the three
federal implementing agencies, there are other federal agencies which are involved in the Program,
and cooperation and coordination with these agencies is also essential. Three agencies are notable:
United States Fish & Wildlife Service, United States Geological Survey and EPA. All the federal
agencies are a critical part of the Program. It is expected that by their involvement in the preparation
of this Review, those federal agencies will support the Plan of Implementation and its programs.
In May of 2011, the Forum adopted their proposed 2011 Review. During the summer of 2011
comments on the proposed 2011 Review were solicited. Each state sent out notice of the proposed
2011 Review and the proposed 2011 Review was posted on the Forum’s website. No comments were
received requesting modification of the draft 2011 Review. At a Forum meeting held in Santa Fe,
New Mexico, the Forum approved the 2011 Review document.
Each of the seven Basin States will now include the Review as a part of its own water quality
standards and, through procedures established by each state, consider the Review for adoption and
submittal to the appropriate regional office of EPA for approval. Because the Basin contains portions
of three EPA regions, the States of Utah, Colorado and Wyoming will make submittals to EPA

25
Region 8 in Denver, Colorado; New Mexico to EPA Region 6 in Dallas, Texas; and Nevada,
Arizona and California to EPA Region 9 in San Francisco, California. It is anticipated that EPA, by
approval of the states’ submittals, will fully support this salinity control effort.

APPENDIX A
Forum Policies

A-1
POLICY FOR IMPLEMENTATION OF
COLORADO RIVER SALINITY STANDARDS
THROUGH THE NPDES PERMIT PROGRAM
Adopted by
The Colorado River Basin Salinity Control Forum
February 28, 1977
Revised October 30, 2002
In November 1976, the United States Environmental Protection Agency Regional Administrators
notified each of the seven Colorado River Basin states of the approval of the water quality
standards for salinity for the Colorado River System as contained in the document entitled
"Proposed Water Quality Standards for Salinity Including Numeric Criteria and Plan of
Implementation for Salinity Control, Colorado River System, June 1975, and the supplement
dated August 25, 1975. The salinity standards including numeric criteria and a plan of
implementation provide for a flow weighted average annual numeric criteria for three stations in
the lower main stem of the Colorado River: below Hoover Dam, below Parker Dam, and at
Imperial Dam.
In 1977, the states of the Colorado River Basin adopted the "Policy for Implementation of
Colorado River Salinity Standards through the NPDES Permit Program." The plan of
implementation is comprised of a number of Federal and non-Federal projects and measures to
maintain the flow- weighted average annual salinity in the Lower Colorado River at or below
numeric criteria at the three stations as the Upper and Lower Basin states continue to develop
their compact-apportioned waters. One of the components of the Plan consists of the placing of
effluent limitations, through the National Pollutant Discharge Elimination System (NPDES)
permit program, on industrial and municipal discharges.
NPDES Policy for Municipal and Industrial Discharges of Salinity in the Colorado River
The purpose of this policy is to provide more detailed guidance in the application of salinity
standards developed pursuant to Section 303 and through the NPDES permitting authority in the
regulation of municipal and industrial sources. (See Section 402 of the Federal Water Pollution
Control Act.) The objective of the policy, as provided in Sections I.A. and I.B., is to achieve "no
salt return" whenever practicable for industrial discharges and an incremental increase in salinity
over the supply water for municipal discharges. This policy is applicable to discharges that
would have an impact, either direct or indirect on the lower main stem of the Colorado River
System. The lower main stem is defined as that portion of the River from Hoover Dam to
Imperial Dam.
In October, 2002, the Forum substantially amended the NPDES policies relating to industrial
discharges but made no changes to the procedures for municipal discharges. In the printing of
the 2002 Review, however, the section relating to municipal discharges and an additional
appendix entitled “Guidance on New Construction Determination” were inadvertently omitted.

A-2
Both errors have been corrected in this printing and the Forum reaffirms the validity of all of the
policies as they appear in this document.
NPDES Policies Separately Adopted by the Forum
The Forum developed a separate and specific policy for the use of brackish and/or saline waters
for industrial purposes on September 11, 1980. The Forum addressed the issue of intercepted
ground water and adopted a specific policy dealing with that type of discharge on October 20,
1982. On October 28, 1988, the Forum adopted a specific policy addressing the water use and
discharge associated with fish hatcheries. Each of these separately adopted policies is attached
hereto.
NPDES Policies for Specified Industrial Discharges – 2002 Amendments
On October 30, 2002, the Forum amended this policy for implementation of Colorado River
salinity standards through the NPDES permit program in order to address the following three
additional types of industrial discharges: (1) water that has been used for once-through
noncontact cooling water purposes; (2) new industrial sources that have operations and
associated discharges at multiple locations; and (3) "fresh water industrial discharges" where the
discharged water does not cause or contribute to exceedances of the salinity standards for the
Colorado River System. This policy was also amended to encourage new industrial sources to
conduct or finance one or more salinity-offset projects in cases where the permittee has
demonstrated that it is not practicable to prevent the discharge of all salt from proposed new
construction.
Discharges Of Once-Through Noncontact Cooling Water
Section I.C. of this policy has been added to address discharges of water that has been
used for once-through noncontact cooling water purposes. The policy for such discharges
shall be to permit these uses based upon a finding that the returned water does not
contribute to the loading or the concentration of salts in the waters of the receiving stream
beyond a de minimis amount. A de minimis amount is considered, for purposes of this
policy, as an average annual increase of not more than 25 milligrams per liter (mg/L) in
total dissolved solids measured at the discharge point or outfall prior to any mixing with
the receiving stream in comparison to the total dissolved solids concentration measured at
the intake monitoring point of the cooling process or facility. This policy is not intended
to supersede any other water quality standard that applies to the receiving stream,
including but not limited to narrative standards promulgated to prohibit impairment of
designated uses of the stream. It is the intent of the Forum to permit the return of
once-through noncontact cooling water only to the same stream from which the water
was diverted. Noncontact cooling water is distinguished from blowdown water, and this
policy specifically excludes blowdown or any commingling of once-through noncontact
cooling water with another waste stream prior to discharge to the receiving stream.
Sections I.A. and I.B. of this policy govern discharges of blowdown or commingled
water.

A-3
New Industrial Sources with Operations and Discharges at Multiple Locations
under Common or Affiliated Ownership or Management
Recently there has been a proliferation of new industrial sources that have operations and
associated discharges at multiple locations. An example is the recent growth in the
development of energy fuel and mineral resources that has occurred in the Upper
Colorado River Basin. This type of industrial development may involve the drilling of
relatively closely spaced wells into one or more geological formations for the purpose of
extracting oil, gas or minerals in solution. Large-scale ground water remediation efforts
involving multiple pump and treat systems operating for longer than one year may share
similar characteristics. With such energy and mineral development and ground water
remediation efforts there is the possibility of a single major industrial operation being
comprised of numerous individual point source discharges under common or affiliated
ownership or management that produce significant quantities of water as a waste product
or byproduct over a long period. Given the large areal scope of these types of major
industrial sources and the often elevated concentrations of salinity in their produced
water, the total amount of salt loading that they could generate may be very large in
comparison to the Forum's past and present salt removal projects. Relatively small
quantities of this produced water could generate one ton per day in discharges to surface
waters. Since salinity is a conservative water quality constituent, such discharges of
produced water, if uncontrolled, could have an adverse effect on achieving the adopted
numeric salinity standards for the Colorado River System.
These kinds of major industrial sources strain the conventional interpretation of the
industrial source waiver for new construction set forth in Section I.A.1.a. of this policy,
which authorizes a discharge of salinity from a single point source of up to one ton per
day in certain circumstances. The Forum adopted this provision in 1977, well before most
of the new major industrial sources that have operations and discharges at multiple
locations began to appear in the Colorado River Basin. A new category of industrial
sources is, therefore, warranted. NPDES permit requirements for New Industrial Sources
with Operations and Discharges at Multiple Locations under Common or Affiliated
Ownership or Management are set forth in Section I.D. of this policy. These new
requirements are intended to apply to new industrial sources with operations that
commence discharging after October 30, 2002.
For purposes of interpreting this policy, "common or affiliated ownership or
management" involves the authority to manage, direct, superintend, restrict, regulate,
govern, administer, or oversee, or to otherwise exercise a restraining or directing
influence over activities at one or more locations that result in a discharge of salinity into
the Colorado River System. Common or affiliated ownership or management may be
through the ownership of voting securities or may be indicated where individual sources
are related through one or more joint ventures, contractual relationships, landlord/tenant
or lessor/lessee arrangements. Other factors that indicate two or more discharging
facilities are under common or affiliated ownership or management include: sharing
corporate executive officers, pollution control equipment and responsibilities, common

A-4
workforces, administrative functions, and/or payroll activities among operational
facilities at different locations.
Fresh Water Industrial Discharges
Sections I.A. and I.B. of this policy have been amended to allow the permitting authority
to authorize "fresh water industrial discharges" where the discharged water does not
cause or contribute to exceedances of the adopted numeric salinity standards for the
Colorado River System. Different end-of-pipe concentrations of salinity as shown in
Table 1 of the policy, are appropriate for discharges to tributaries depending upon their
location within the Basin. The concept of "benchmark concentrations" has been
developed in order to address this need for different end-of-pipe concentrations. These
benchmark concentrations are not to be interpreted as water quality standards. Rather,
they are intended to serve solely for the establishment of effluent limits for implementing
the waiver for "fresh water discharges." The allowance for freshwater discharges is
intended to preserve flows from discharges in the Basin, which do not cause significant
degradation of existing ambient quality with respect to salinity. Operations or individual
discharges that qualify for the freshwater waiver shall not be subject to any further
limitation on salt loading under this policy.
Salinity-Offset Projects
This policy has been amended to allow the permitting authority to authorize industrial
sources of salinity to conduct or finance one or more salinity-offset projects when the
permittee has determined that it is not practicable: (i) to prevent the discharge of all salt
from proposed new construction; (ii) to reduce the salt loading to the Colorado River to
less than one ton per day or 366 tons per year; or (iii) the proposed discharge is of
insufficient quality in terms of TDS concentrations that it could be considered "fresh
water" as defined below. Presently, the permitting authority can consider the costs and
availability of implementing off-site salinity control measures to mitigate the adverse
impacts of the permitted salt load. It is not intended that the applicant be required to
develop or design an off-site salinity control project or establish a salt bank, but rather to
assess the costs of conducting or buying into such projects where they are available. In
the future the Forum or another entity may create a trading/banking institution to
facilitate the implementation of a salinity-offset program, basin-wide. This would allow
industrial sources to conduct or finance the most cost effective project available at the
time an offset project is needed regardless of the project's location in the Basin.

A-5
NPDES PERMIT PROGRAM POLICY
FOR IMPLEMENTATION OF COLORADO RIVER SALINITY STANDARDS
I. Industrial Sources
The Salinity Standards state that "The objective for discharges shall be a no-salt return
policy whenever practicable." This is the policy that shall be followed in issuing NPDES
discharge permits for all new industrial sources, and upon the reissuance of permits for
all existing industrial sources, except as provided herein. The following addresses those
cases where "no discharge of salt@ may be deemed not to be practicable.
A. New Construction
1. "New construction@ is defined as any facility from which a discharge may occur,
the construction of which is commenced after October 18, 1975. (Date of
submittal of water quality standards as required by 40 CFR 120, December 11,
1974.) Attachment 1 provides guidance on new construction determination. "A
new industrial source with operations and discharging facilities at multiple
locations under common or affiliated ownership or management@ shall be defined
for purposes of NPDES permitting, as an industrial source that commenced
construction on a pilot, development or production scale on or after October 30,
2002.
a. The permitting authority may permit the discharge of salt upon a
satisfactory demonstration by the permittee that:
i. It is not practicable to prevent the discharge of all salt from the
new construction or,
ii. In cases where the salt loading to the Colorado River from the new
construction is less than one ton per day or 366 tons per year, or
iii. The proposed discharge from the new construction is of sufficient
quality in terms of TDS concentrations that it can be considered
"fresh water" that would have no adverse effect on achieving the
adopted numeric standards for the Colorado River System. The
permitting authority may consider a discharge to be fresh water if
the maximum TDS concentration is: (i) 500 mg/L for discharges
into the Colorado River and its tributaries upstream of Lees Ferry,
Arizona; or, (ii) 90% of the applicable in-stream salinity standard
at the appropriate benchmark monitoring station for discharges into
the Colorado River downstream of Lees Ferry as shown in Table 1,
below

A-6
Table 1
Benchmark
Monitoring
Station
Applicable
Criteria
Freshwater
Discharge (mg/L)
1
Colorado River at
Lees Ferry,
Arizona
N/A
500
2
Colorado River
below Hoover Dam
723
650
3
Colorado River
below Parker Dam
747
675
4
Colorado River at
Imperial Dam
879
790
b. Unless exempted under Sections I.A.1.a.ii. or iii., above, the
demonstration by the applicant must include information on the following
factors relating to the potential discharge:
(i) Description of the proposed new construction.
(ii) Description of the quantity and salinity of the water supply.
(iii) Description of water rights, including diversions and consumptive
use quantities.
(iv) Alternative plans that could reduce or eliminate salt discharge.
Alternative plans shall include:
(A) Description of alternative water supplies, including
provisions for water reuse, if any;
(B) Description of quantity and quality of proposed discharge;
(C) Description of how salts removed from discharges shall be
disposed of to prevent such salts from entering surface
waters or groundwater aquifers;
(D) Costs of alternative plans in dollars per ton of salt removed;
and

A-7
(E) Unless the permitting authority has previously determined
through prior permitting or permit renewal actions that it is
not practicable to prevent the discharge of all salt from the
new construction in accordance with Section I.A.1.a.i., the
applicant must include information on project options that
would offset all or part of the salt loading to the Colorado
River associated with the proposed discharge or that would
contribute to state or interstate salinity control projects or
salt banking programs.
(v) A statement as to the one plan among the alternatives for reduction
of salt discharge that is recommended by the applicant and also
information as to which of the other evaluated alternatives are
economically infeasible.
(vi) Such other information pertinent to demonstration of non-
practicability as the permitting authority may deem necessary.
c. In determining what permit conditions shall be required under I.A.1.a.i.,
above, the permit issuing authority shall consider, but not be limited to the
following:
(i) The practicability of achieving no-discharge of salt from the new
construction.
(ii) Where "no discharge" is determined not to be practicable:
(A) The impact of the total proposed salt discharge of each
alternative on the lower main stem in terms of both tons per
year and concentration.
(B) Costs per ton of salt removed from the discharge for each
plan alternative.
(C) Capability of minimizing salinity discharge.
(D) If applicable under I.A.1.b.(iv)(E), costs and practicability
of offsetting all or part of the salt load by the
implementation of salt removal or salinity control projects
elsewhere in the Colorado River Basin. The permittee shall
evaluate the practicability of offsetting all or part of the salt
load by comparing such factors as the cost per ton of salt
removal for projects undertaken by the Colorado River
Basin Salinity Control Forum and the costs in damages
associated with increases in salinity concentration against
the permittee's cost in conducting or buying into such
projects where they are available.

A-8
(iii) With regard to subparagraphs, (b) and (c) above, the permit issuing
authority shall consider the compatibility of state water laws with
either the complete elimination of a salt discharge or any plan for
minimizing a salt discharge.
B. Existing Facilities or any discharging facility, the construction of which was commenced
before October 18, 1975
1. The permitting authority may permit the discharge of salt upon a satisfactory
demonstration by the permittee that it is not practicable to prevent the discharge
of all salt from an existing facility.
2. The demonstration by the applicant must include, in addition to that required
under Section I.A.1.b the following factors relating to the potential discharge:
a. Existing tonnage of salt discharged and volume of effluent.
b. Cost of modifying existing industrial plant to provide for no salt discharge.
c. Cost of salt minimization.
3. In determining what permit conditions shall be required, the permit issuing
authority shall consider the items presented under I.A.1.c.(ii), and in addition; the
annual costs of plant modification in terms of dollars per ton of salt removed for:
a. No salt return.
b. Minimizing salt return.
4. The no-salt discharge requirement may be waived in those cases where:
a. The discharge of salt is less than one ton per day or 366 tons per year; or
b. The permitting authority determines that a discharge qualifies for a "fresh
water waiver" irrespective of the total daily or annual salt load. The
maximum TDS concentration considered to be fresh water is 500 mg/L for
discharges into the Colorado River and its tributaries upstream of Lees
Ferry, Arizona. For discharges into the Colorado River downstream of
Lees Ferry the maximum TDS concentration considered to be afresh water
shall be 90% of the applicable in-stream standard at the appropriate
benchmark monitoring station shown in Table 1, above.
C. Discharge of Once-Through Noncontact Cooling Water
1. Definitions:

A-9
a. The terms "noncontact cooling water" and "blowdown@ are defined as per
40CFR 401.11 (m) and (n).
b. "Noncontact cooling water" means water used for cooling that does not
come into direct contact with any raw material, intermediate product,
waste product or finished product.
c. "Blowdown" means the minimum discharge of recirculating water for the
purpose of discharging materials contained in the water, the further
buildup of which would cause concentration in amounts exceeding limits
established by best engineering practice.
d. "Salinity" shall mean total dissolved solids as the sum of constituents.
2. Permits shall be authorized for discharges of water that has been used for
once-through noncontact cooling purposes based upon a finding that the returned
water does not contribute to the loading of salts or the concentration of salts in the
waters of the receiving stream in excess of a de minimis amount.
3. This policy shall not supplant nor supersede any other water quality standard of
the receiving stream adopted pursuant to the Federal Clean Water Act, including
but not limited to impairment of designated uses of the stream as established by
the governing water quality authority having jurisdiction over the waters of the
receiving stream.
4. Noncontact cooling water shall be distinguished from blowdown, and
Section 1.C. of this policy specifically excludes blowdown or any commingling of
once-through noncontact cooling water with another waste stream prior to
discharge to the receiving stream. Sections I.A. and I.B of this policy shall in all
cases govern discharge of blowdown or commingled water.
5. Once-through noncontact cooling water shall be permitted to return only to the
same stream from which the water was diverted.
6. Because the increase in temperature of the cooling water will result in some
evaporation, a de minimis increase in the concentration of dissolved salts in the
receiving water may occur. An annual average increase in total dissolved solids
of not more than 25 milligrams per liter (mg/L) measured at the intake monitoring
point, as defined below, of the cooling process or facility, subtracted from the
effluent total dissolved solids immediately upstream of the discharge point to the
receiving stream, shall be considered de minimis.
7. At the time of NPDES discharge permit issuance or reissuance, the permitting
authority may permit a discharge in excess of the 25 mg/L increase based upon a
satisfactory demonstration by the permittee pursuant to Section 1.A.1.a.

A-10
8. Once-through demonstration data requirements:
a. Description of the facility and the cooling process component of the
facility.
b. Description of the quantity, salinity concentration and salt load of intake
water sources.
c. Description of the discharge, covering location, receiving waters, quantity
of salt load and salinity concentration of both the receiving waters and the
discharge.
d. Alternative plans for minimizing salt discharge from the facility which
shall include:
(i) Description of alternative means to attain no discharge of salt.
(ii) Cost of alternative plans in dollars per ton of salt removed from
discharge.
(iii) Such other information pertinent to demonstration of non-
practicability as the permitting authority may deem necessary.
9. If, in the opinion of the permitting authority, the database for the salinity
characteristics of the water source and the discharge is inadequate, the permit will
require that the permittee monitor the water supply and the discharge for salinity.
Such monitoring program shall be completed in two years and the permittee shall
then present the once-through demonstration data as specified above.
10. All new and reissued NPDES permits for once-through noncontact cooling water
discharges shall require at a minimum semiannual monitoring of the salinity of
the intake water supply and the effluent, as provided below.
a. The intake monitoring point shall be the point immediately before the
point of use of the water.
b. The effluent monitoring point shall be prior to the discharge point at the
receiving stream or prior to commingling with another waste stream or
discharge source.
c. Discrete or composite samples may be required at the discretion of the
permitting authority, depending on the relative uniformity of the salinity
of the water supply.
d. Analysis for salinity may be either total dissolved solids or electrical
conductivity where a satisfactory correlation with total dissolved solids

A-11
has been established. The correlation shall be based on a minimum of five
different samples.
D. Discharges of Salinity from a New Industrial Source with Operations and Discharging
Facilities at Multiple Locations
1. The objective for discharges to surface waters from a new industrial source with
operations and discharging facilities at multiple locations shall be to assure that
such operations will have no adverse effect on achieving the adopted numeric
salinity standards for the Colorado River System.
2. NPDES permit requirements for a new industrial source with operations and
discharging facilities at multiple locations shall be defined, for purposes of
establishing effluent limitations for salinity, as a single industrial source if these
facilities meet the criteria:
a. The discharging facilities are interrelated or integrated in any way
including being engaged in a primary activity or the production of a
principle product; and
b. The discharging facilities are located on contiguous or adjacent properties
or are within a single production area e.g. geologic basin, geohydrologic
basin, coal or gas field or 8 digit hydrologic unit watershed area; and
c. The discharging facilities are owned or operated by the same person or by
persons under common or affiliated ownership or management.
3. The permitting authority may permit the discharge of salt from a new industrial
source with operations and discharging facilities at multiple locations if one or
more of the following requirements are met:
a. The permittee has demonstrated that it is not practicable to prevent the
discharge of all salt from the industrial source. This demonstration by the
applicant must include detailed information on the factors set forth in
Section I.A.1.b of the Policy for implementation of Colorado River
Salinity Standards through the NPDES permit program; with particular
emphasis on an assessment of salinity off-set options that would contribute
to state or interstate salinity control projects or salt banking programs and
offset all or part of the salt loading to the Colorado River associated with
the proposed discharge.
b. In determining what permit conditions shall be required under I.A.1.a.i.,
above, the permit issuing authority shall consider the requirement for an
offset project to be feasible if the cost per ton of salt removal in the offset
project options ( i.e. the permittee's cost in conducting or buying into such
projects where they are available) is less than or equal to the cost per ton

A-12
of salt removal for projects undertaken by the Colorado River Basin
Salinity Control Forum or less than the cost per ton in damages caused by
salinity that would otherwise be cumulatively discharged from the outfalls
at the various locations with operations controlled by the industrial source;
or
c. The pemittee has demonstrated that one or more of the proposed
discharges is of sufficient quality in terms of TDS concentrations to
qualify for a "fresh water waiver" from the policy of "no salt return,
whenever practical.@ An individual discharge that can qualify for a fresh
water waiver shall be considered to have no adverse effect on achieving
the adopted numeric salinity standards for the Colorado River System.
4. For the purpose of determining whether a freshwater waiver can be granted, the
quality of water discharged from the new industrial source with operations and
discharging facilities at multiple locations, determined as the flow weighted
average of salinity measurements at all outfall points, must meet the applicable
benchmark concentration in accordance with Section I.A.1.a.iii., as set forth
above.
5. Very small-scale pilot activities, involving 5 or fewer outfalls, that are sited in
areas not previously developed or placed into production by a new industrial
source operations and discharges at multiple locations under common or affiliated
ownership or management, may be permitted in cases where the discharge of salt
from each outfall is less than one ton per day or 366 tons per year. However, no
later than the date of the first permit renewal after the pilot activities have become
part of a larger industrial development or production scale effort, all discharging
facilities shall be addressed for permitting purposes as a single industrial source
with operations and discharges at multiple locations under common or affiliated
ownership or management.
6. The public notice for NPDES permits authorizing discharges from operations at
multiple locations with associated outfalls shall be provided promptly and in the
most efficient manner to all member states in the Colorado River Basin Salinity
Control Forum in relation to this policy.
II. Municipal Discharges
The basic policy is that a reasonable increase in salinity shall be established for municipal
discharges to any portion of the Colorado River stream system that has an impact on the
lower main stem. The incremental increase in salinity shall be 400 mg/L or less, which is
considered to be a reasonable incremental increase above the flow weighted average
salinity of the intake water supply.
A. The permitting authority may permit a discharge in excess of the 400 mg/L
incremental increase at the time of issuance or reissuance of a NPDES discharge

A-13
permit, upon satisfactory demonstration by the permittee that it is not practicable
to attain the 400 mg/L limit.
B. Demonstration by the applicant must include information on the following factors
relating to the potential discharge:
1. Description of the municipal entity and facilities.
2. Description of the quantity and salinity of intake water sources.
3. Description of significant salt sources of the municipal wastewater
collection system, and identification of entities responsible for each
source, if available.
4. Description of water rights, including diversions and consumptive use
quantities.
5. Description of the wastewater discharge, covering location, receiving
waters, quantity, salt load, and salinity.
6. Alternative plans for minimizing salt contribution from the municipal
discharge. Alternative plans should include:
a. Description of system salt sources and alternative means of
control.
b. Cost of alternative plans in dollars per ton, of salt removed from
discharge.
7. Such other information pertinent to demonstration of non-practicability as
the permitting authority may deem necessary.
C. In determining what permit conditions shall be required, the permit issuing
authority shall consider the following criteria including, but not limited to:
1. The practicability of achieving the 400 mg/L incremental increase.
2. Where the 400 mg/L incremental increase is not determined to be
practicable:
a. The impact of the proposed salt input of each alternative on the
lower main stem in terms of tons per year and concentration.
b. Costs per ton of salt removed from discharge of each alternative
plan.

A-14
c. Capability of minimizing the salt discharge.
D. If, in the opinion of the permitting authority, the data base for the municipal waste
discharger is inadequate, the permit will contain the requirement that the
municipal waste discharger monitor the water supply and the wastewater
discharge for salinity. Such monitoring program shall be completed within 2
years and the discharger shall then present the information as specified above.
E. Requirements for establishing incremental increases may be waived in those cases
where the incremental salt load reaching the main stem of the Colorado River is
less than one ton per day or 366 tons per year. Evaluation will be made on a case-
by-case basis.
F. All new and reissued NPDES permits for all municipalities shall require
monitoring of the salinity of the intake water supply and the wastewater treatment
plant effluent in accordance with the following guidelines:
Treatment Plant Monitoring Type of
Design Capacity Frequency Sample
<1.0 MGD* Quarterly Discrete
1.0 - 5.0 MGD Monthly Composite
>5.0 - 50.0 MGD Weekly Composite
50.0 MGD Daily Composite
1. Analysis for salinity may be either as total dissolved solids (TDS) or be
electrical conductivity where a satisfactory correlation with TDS has been
established. The correlation should be based on a minimum of five
different samples.
2. Monitoring of the intake water supply may be at a reduced frequency
where the salinity of the water supply is relatively uniform.

A-15
Attachment 1
Guidance on New Construction Determination
For purposes of determining a new construction, a source should be considered new if by October 18, 1975, there has not been:
I. Significant site preparation work such as major clearing or excavation; and/or
II. Placement, assembly or installation of unique facilities or equipment at the premises where such
facilities or equipment will be used; and/or
III. Any contractual obligation to purchase unique facilities or equipment. Facilities and equipment
shall include only the major items listed below, provided that the value of such items represents a substantial commitment to construct the facility:
A. structures; or
B. structural materials; or
C. machinery; or
D. process equipment; or
E. construction equipment.
IV. Contractual obligation with a firm to design, engineer, and erect a completed facility (i.e., a
turnkey plant).

A-16
POLICY FOR USE OF
BRACKISH AND/OR SALINE WATERS
FOR INDUSTRIAL PURPOSES
Adopted by
The Colorado River Basin Salinity Control Forum
September 11, 1980
The states of the Colorado River Basin, the federal Executive Department, and the Congress
have all adopted as a policy that the salinity in the lower main stem of the Colorado River shall
be maintained at or below the flow-weighted average values found during 1972, while the Basin
states continue to develop their compact-apportioned waters. In order to achieve this policy, all
steps which are practical and within the framework of the administration of states’ water rights
must be taken to reduce the salt load of the river. One such step was the adoption in 1975 by the
Forum of a policy regarding effluent limitations for industrial discharges with the objective of
Ano-salt return@ wherever practicable. Another step was the Forum’s adoption in 1977 of the
APolicy for Implementation of Colorado River Salinity Standards through the NPDES Permit
Program.@ These policies are part of the basinwide plan of implementation for salinity control
which has been adopted by the seven Basin states.
The Forum finds that the objective of maintaining 1972 salinity levels would be served by the
exercise of all feasible measures including, wherever practicable, the use of brackish and/or
saline waters for industrial purposes.
The summary and page 32 of the Forum’s 1978 Revision of the Water Quality Standards for
Salinity state: AThe plan also contemplates the use of saline water for industrial purposes
whenever practicable,...@ In order to implement this concept and thereby further extend the
Forum’s basic salinity policies, the Colorado River Basin states support the Water and Power
Resources Service (WPRS) appraisal study of saline water collection, pretreatment and potential
industrial use.
The Colorado River Basin contains large energy resources which are in the early stages of
development. The WPRS study should investigate the technical and financial feasibility of
serving a significant portion of the water requirements of the energy industry and any other
industries by the use of Basin brackish and/or saline waters. The Forum recommends that:
I. The Colorado River Basin states, working with federal agencies, identify, locate and
quantify such brackish and/or saline water sources.
II. Information on the availability of these waters be made available to all potential users.
III. Each state encourage and promote the use of such brackish and/or saline waters, except
where it would not be environmentally sound or economically feasible, or would

A-17
significantly increase consumptive use of Colorado River System water in the state above
that which would otherwise occur.
IV. The WPRS, with the assistance of the states, encourages and promotes the use of brackish
return flows from federal irrigation projects in lieu of fresh water sources, except where it
would not be environmentally sound or economically feasible, or would significantly
increase consumptive use of Colorado River System water.
V. The WPRS considers a federal contribution to the costs of industrial use of brackish
and/or saline water, where cost-effective, as a joint private-government salinity control
measure. Such activities shall not delay the implementation of the salinity control
projects identified in Title II of P.L. 93-320.

A-18
POLICY FOR IMPLEMENTATION OF
COLORADO RIVER SALINITY STANDARDS
THROUGH THE NPDES PERMIT PROGRAM
FOR INTERCEPTED GROUND WATER
Adopted by
The Colorado River Basin Salinity Control Forum
October 20, 1982
The States of the Colorado River Basin in 1977 agreed to the APolicy for Implementation of
Colorado River Salinity Standards through the NPDES Permit Program@ with the objective for
industrial discharge being Ano-salt return@ whenever practicable. That policy required the
submittal of information by the applicant on alternatives, water rights, quantity, quality, and
costs to eliminate or minimize the salt discharge. The information is for use by the NPDES
permit-issuing agency in evaluating the practicability of achieving Ano-salt@ discharge.
There are mines and wells in the Basin which discharge intercepted ground waters. The factors
involved in those situations differ somewhat from those encountered in other industrial
discharges. Continued development will undoubtedly result in additional instances in which
permit conditions must deal with intercepted ground water.
The discharge of 1intercepted ground water needs to be evaluated in a manner consistent with the
overall objective of Ano-salt return@ whenever practical. The following provides more detailed
guidance for those situations where ground waters are intercepted with resultant changes in
ground-water flow regime.
I. The Ano-salt@ discharge requirement may be waived at the option of the permitting
authority in those cases where the discharged salt load reaching the main stem of the
Colorado River is less than one ton per day or 366 tons per year. Evaluation will be made
on a case-by-case basis.
II. Consideration should be given to the possibility that the ground water, if not intercepted,
normally would reach the Colorado River System in a reasonable time frame. An industry
desiring such consideration must provide detailed information including a description of
the topography, geology, and hydrology. Such information must include direction and
rate of ground-water flow; chemical quality and quantity of ground water; and the
location, quality, and quantity of surface streams and springs that might be affected. If the
information adequately demonstrates that the ground water to be intercepted normally
would reach the river system in a reasonable time frame and would contain
approximately the same or greater salt load than if intercepted, and if no significant
localized problems would be created, then the permitting agency may waive the Ano-salt@ discharge requirement.
1
The term Aintercepted ground water@ means all ground water encountered during mining or other industrial
operations.

A-19
III. In those situations where the discharge does not meet the criteria in I or II above, the
applicant will be required to submit the following information for consideration:
A. Description of the topography, geology, and hydrology. Such information must
include the location of the development, direction and rate of ground-water flow,
chemical quality and quantity of ground water, and relevant data on surface
streams and springs that are or might be affected. This information should be
provided for the conditions with and without the project.
B. Alternative plans that could substantially reduce or eliminate salt discharge.
Alternative plans must include:
1. Description of water rights, including beneficial uses, diversions, and
consumptive use quantities.
2. Description of alternative water supplies, including provisions for water
reuse, if any.
3. Description of quantity and quality of proposed discharge.
4. Description of how salts removed from discharges shall be disposed of to
prevent their entering surface waters or ground-water aquifers.
5. Technical feasibility of the alternatives.
6. Total construction, operation, and maintenance costs; and costs in dollars
per ton of salt removed from the discharge.
7. Closure plans to ensure termination of any proposed discharge at the end
of the economic life of the project.
8. A statement as to the one alternative plan for reduction of salt discharge
that the applicant recommends be adopted, including an evaluation of the
technical, economic, and legal Practicability of achieving no discharge of
salt.
9. Such information as the permitting authority may deem necessary.
IV. In determining whether a Ano-salt@ discharge is Practicable, the Permit-issuing authority
shall consider, but not be limited to, the water rights and the technical, economic, and
legal practicability of achieving no discharge of salt.
V. Where Ano-salt@ discharge is determined not to be Practicable the permitting authority
shall, in determining permit conditions, consider:

A-20
A. The impact of the total proposed salt discharge of each alternative on the lower
main stem in terms of both tons per year and concentration.
B. Costs per ton of salt removed from the discharge for each plan alternative.
C. The compatibility of state water laws with each alternative.
D. Capability of minimizing salinity discharge.
E. The localized impact of the discharge.
F. Minimization of salt discharges and the preservation of fresh water by using
intercepted ground water for industrial processes, dust control, etc. whenever it is
economically feasible and environmentally sound.

A-21
POLICY FOR IMPLEMENTATION OF
COLORADO RIVER SALINITY STANDARDS
THROUGH THE NPDES PERMIT PROGRAM
FOR FISH HATCHERIES
Adopted by
The Colorado River Basin Salinity Control Forum
October 28, 1988
The states of the Colorado River Basin in 1977 adopted the APolicy for Implementation of
Colorado River Salinity Standards through the NPDES Permit Program.@ The objective was for
Ano-salt return@ whenever practicable for industrial discharges and an incremental increase in
salinity over the supply water for municipal discharges. The Forum addressed the issue of
intercepted ground water under the 1977 policy, and adopted a specific policy dealing with that
type of discharge.
A specific water use and associated discharge which has not been here-to-fore considered is
discharges from fish hatcheries. This policy is limited exclusively to discharges from fish
hatcheries within the Colorado River Basin. The discharges from fish hatcheries need to be
addressed in a manner consistent with the 1977 and 1980 Forum policies.
The basic policy for discharges from fish hatcheries shall permit an incremental increase in
salinity of 100 mg/L or less above the flow weighted average salinity of the intake supply water.
The 100 mg/L incremental increase may be waived if the discharged salt load reaching the
Colorado River system is less than one ton per day, or 366 tons per year. Evaluation is to be
made on a case-by-case basis.
I. The permitting authority may permit a discharge in excess of the 100 mg/L incremental
increase at the time of issuance or reissuance of a NPDES discharge permit. Upon
satisfactory demonstration by the permittee that it is not practicable to attain the 100
mg/L limit.
II. Demonstration by the applicant must include information on the following factors
relating to the potential discharge:
A. Description of the fish hatchery and facilities.
B. Description of the quantity and salinity of intake water sources.
C. Description of salt sources in the hatchery.
D. Description of water rights, including diversions and consumptive use quantities.
E. Description of the discharge, covering location, receiving waters, quantity salt
load, and salinity.
A-22
F. Alternative plans for minimizing salt discharge from the hatchery. Alternative plans
should include:
1. Description of alternative means of salt control.
2. Cost of alternative plans in dollars per ton, of salt removed from
discharge.
G. Such other information pertinent to demonstration of non-practicability as the
permitting authority may deem necessary.
III. In determining what permit conditions shall be required, the permit-issuing authority
shall consider the following criteria including, but not limited to:
A. The practicability of achieving the 100 mg/L incremental increase.
B. Where the 100 mg/L incremental increase is not determined to be practicable:
1. The impact of the proposed salt input of each alternative on the lower
main stem in terms of tons per year and concentration.
2. Costs per ton of salt removed from discharge of each alternative plan.
3. Capability of minimizing the salt discharge.
IV. If, in the opinion of the permitting authority, the database for the hatchery is inadequate,
the permit will contain the requirement that the discharger monitor the water supply and
the discharge for salinity. Such monitoring program shall be completed within two years
and the discharger shall then present the information as specified above.
V. All new and reissued NPDES permits for all hatcheries shall require monitoring of the
salinity of the intake water supply and the effluent at the time of peak fish population.
A. Analysis for salinity may be either as total dissolved solids (TDS) or be electrical
conductivity where a satisfactory correlation with TDS has been established. The
correlation should be based on a minimum of five different samples

APPENDIX B
States NPDES Permits List

B-1
LEGEND
NPDES PERMITS
EXPLANATION CODES
COLORADO RIVER BASIN SALINITY CONTROL FORUM
Through December 31, 2010
NPDES permits are reviewed under two different criteria under Forum policy; these being municipal and industrial. In order for a permittee
to be in compliance under the municipal criteria, the increase in concentration between inflow and outflow cannot be greater than 400 mg/L.
Forum industrial criteria requires that no industrial user discharges more than 1.00 ton/day. Under Forum policy there can be granted
exceptions to these limitations by the states. The following gives an explanation of the current status of the NPDES permits. Because at any
given time many of the approximate 600 permits identified in this list are being reviewed, reissued, and/or terminated, and new discharge
permits are being filed, this list must be considered as being subject to frequent change.
MUNICIPAL
(M) Municipal user in compliance with Forum policy.
(M-1) Permit has expired or been revoked. No discharge.
(M-2) Permittee did not discharge during the reporting period.
(M-3) Measurement of TDS is not currently required, but the
state and/or EPA plans to require measurements of both
inflow and outflow when the permit is reissued.
Measurements of inflow are not consistent with Forum policy;
(M-4A) Therefore, it is not known whether or not this municipal
user is in compliance.
(M-4B) However, since outflow concentration is less than 500
mg/L it is presumed that this permit is not in violation of
the ≤400 mg/L increase.
(M-5) Permittee is in violation of Forum policy in that there is an
increase in concentration of >400 mg/L over the source
waters.
(M-5A) The state is currently working to bring permittee into
compliance.
(M-6) This permit requires no discharge or discharge only under
rare and extreme hydrologic conditions. Thus, flow and
concentration measurements are not required.
(M-7) Insufficient data to know the status of this permit.
* Permits shown for New Mexico are prepared by the state’s
environmental department and then issued by USEPA.
INDUSTRIAL
(I) Industrial user in compliance with Forum policy.
(I-A) Industrial user in compliance with the Forum’s salinity
offset policy.
(I-1) Permit has expired or been revoked. No discharge.
(I-2) Permittee did not discharge during the reporting period.
(I-3) Measurement of TDS is not currently required, but the
state and/or EPA plans to require measurements of both
volume and concentration of outflow when the permit is
reissued.
(I-4) Either concentration or volume of outflow are not
currently being reported, thus the permittee is in violation
of Forum policy. It is not known if the discharge is in
excess of the <1.00 ton/day requirement.
Permittee appears to be in violation of Forum policy in that
discharge of salts is >1.00 ton/day.
(I-5A) No provision has been made allowing this violation of
Forum policy.
(I-5B) Though discharge is >1.00 ton/day, in keeping with Forum
policy the permittee has demonstrated the salt reduction is
not practicable and the requirement has been waived.
(I-5C) The use of ground water under this permit is for
geothermal energy and only heat is extracted. The
intercepted salt and water are naturally tributary to the
Colorado River System and hence, this discharge does not
increase salt in the river. The permit is covered by the
Forum's policy on intercepted ground waters.
(I-5D) This permit is in compliance with the Forum’s policy for
fish hatcheries. The use of the water is a one-time pass
through, and the incremental increase in salinity is ≤ 100
mg/l.
(I-5E) This permit is for the interception and passage of ground
waters and thus is excepted under the Forum's policy on
intercepted ground waters .
(I-6) This permit requires no discharge or discharge only under
rare and extreme hydrologic conditions. Thus, flow and
concentration measurements are not required.
(I-7) Insufficient data to know the current status of this permit.

B-2
LEGEND (continued)
NPDES PERMITS
REACH DEMARCATIONS
COLORADO RIVER BASIN SALINITY CONTROL FORUM
In order to provide a better understanding of the location of the various NPDES permits and the geographical sequence in the Colorado River
System, each of the following NPDES permits is identified with a Colorado River reach number. The reach numbers have their origin in the old
CRSS river model. Though this model is no longer used, the reach numbers assist in understanding the general location of the permits. The
reaches are defined as:
100 Upper Main Stem from headwaters of Colorado River to Colorado River near Cameo
190 Taylor Park from headwaters of Gunnison River to above Blue Mesa Reservoir
200 Blue Mesa from above Blue Mesa Reservoir to below Blue Mesa Dam
210 Morrow Point from below Blue Mesa Dam to Crystal Reservoir
220 Lower Gunnison from Crystal Reservoir to confluence with Colorado River
300 Grand Valley from Colorado River near Cameo to confluence with Green River
310 Dolores River from headwaters of Dolores River to confluence with Colorado River
401 Fontenelle from headwaters of Green River to Green River near Green River, WY
411 Flaming Gorge from Green River near Green River, WY to confluence with White and Duchesne Rivers
500 Yampa River from headwaters of Yampa River to confluence with Green River
510 White River from headwaters of White River to confluence with Green River
600 Green River Green River from confluence with White and Duchesne Rivers to confluence with Colorado
River
610 Duchesne River from headwaters of Duchesne River to confluence with Green River
700 Lake Powell Colorado River from confluence of with Green River to Lees Ferry
710 San Rafael River from headwaters of San Rafael River to confluence with Green River
801 Upper San Juan River from headwaters of San Juan River to San Juan near Bluff
802 Lower San Juan River from San Juan near Bluff to confluence with Lake Powell
900 Glen Canyon to Lake Mead Colorado River from Lees Ferry to backwaters of Lake Mead
905 Virgin River from headwaters of Virgin River to backwaters of Lake Mead
910 Lake Mead from backwaters of Lake Mead to Colorado River below Hoover Dam
920 Lake Mohave Colorado River from below Hoover Dam down to I-40 bridge
930 Lake Havasu Colorado River from I-40 bridge to below Parker Dam
940 Parker Dam to Imperial Dam Colorado River from below Parker Dam to above Imperial Dam
945 Imperial Dam Colorado River from above Imperial Dam to Gila and Yuma users

B-3
NPDES PERMIT# Salt Load
Tons/Day
NPDES PERMITSColorado River Basin Salinity Control Forum
January 1, 2008 through December 31, 2010
REACH Explanantion Code
NAME of Discharging Facility TDS Conc. AVG.(Mg/L)
Flow Rate AVG.(MGD)
ArizonaAZ0000132 910 UNITED STATES FISH AND WILDLIFE SERVICE, WILLOW
BEACH NATIONAL FISH HATCHERY 610 6.79 15.677 I
AZ0020427 900 FLAGSTAFF, CITY OF WILDCAT HILL POTW 430 3.57 5.810 MAZ0022152 900 USNPS/GRAND CANYON/SOUTH RIM WWTP 552 0.228 0.476 MAZ0022268 930 PHELPS DODGE BAGDAD COPPER DIV - - - IAZ0022489 930 KINGMAN, CITY OF DOWNTOWN POTW 760 0.198 0.570 MAZ0022756 930 PETRO STOP CENTER/KINGMAN - 0.0431 - M-3AZ0023035 930 BLUE BEACON OF KINGMAN - - - IAZ0023477 900 SOUTH GRAND CANYON SANITARY DISTRICT WWTP,
TUSAYAN WASTEWATER TREATMENT RECLAMATION FACILITY
575 0.081 0.176 M
AZ0023523 920 USNPS/KATHERINE'S LANDING WTP 8.3 0.0574 0.002 IAZ0023612 900 USNPS/GRAND CANYON/ DESERT VIEW 759 0.104 0.299 MAZ0023621 900 USNPS/GRAND CANYON/INDIAN GARDENS 163 0.5336 0.329 IAZ0023639 900 FLAGSTAFF, CITY OF RIO DE FLAG POTW 280 1.711 1.813 M-4BAZ0023655 905 VIRGIN RIVER DOMESTIC WW ID 700 0.04 0.106 MAZ0023752 940 QUARTZSITE, CITY OF POTW 1413.3 0.1801 0.963 MAZ0023833 900 WINSLOW, CITY OF POTW 1200 0.97 4.406 M-7AZ0023841 900 SHOW LOW, CITY OF POTW 539 0.903 1.842 MAZ0023990 930 CAWCD-HAVASU PUMPING PLANT 639 0.046 0.111 IAZ0024015 900 CANYON-VALLE AIRPORT WWTP - - - M-2AZ0024279 900 HIGH COUNTRY PINES <400 0.0034 - MAZ0024287 (replaced by AZ0026034)
SNOWFLAKE, CITY OF POTW - - - M-1
AZ0026034 900 SNOWFLAKE, CITY OF POTW 590 0.271 0.605 MAZ0024356 (replaced by AZ0025755)
900 WILLIAMS, CITY OF POTW - - - M-1
AZ0024422 900 SANDERS SCHOOL DISTRICT NO. 6 WWTP <400 0.0107 - MAZ0025160 910 USBR/HOOVER DAM 703 0.0613 0.163 M-2AZ0025224 900 APACHE-SITGREAVES NATIONAL FOREST BLACK MESA
RANGER STATION WASTEWATER TREATMENT PLANT290 0.00195 0.002 M
AZ0025399 900 BISON RANCH 353 0.0064 0.009 MAZ0025437 900 PINETOP LAKESIDE SANITARY DISTRICT WWTP - - - M-2AZ0025542 900 HOLBROOK, CITY OF PAINTED MESA POTW - 0.801 - M-2AZ0025666 900 USBR/GLEN CANYON SUMPS - - - I-3AZ0110019 900 USBR/GLEN CANYON CRSP 1075 0.015 0.061 MAZ0110248 920 USBR/DAVIS DAM - - - IAZ0110426 900 USNPS/GRAND CANYON/NORTH RIM 471 0.0432 0.077 MAZ 0025755 CITY OF WILLIAMS - WASTEWATER TREATMENT
PLANT- - - M-7
CaliforniaCA7000005 940 USBR Parker Dam & Power Plant DWF(R7-2007-0037) 560 0.009 0.02 M

B-4
NPDES PERMIT# Salt Load
Tons/Day
NPDES PERMITSColorado River Basin Salinity Control Forum
January 1, 2008 through December 31, 2010
REACH Explanantion Code
NAME of Discharging Facility TDS Conc. AVG.(Mg/L)
Flow Rate AVG.(MGD)
ColoradoCOG500419 500 3B ENTERPRISES 2386 0.539 5.36 ICOG072739 100 ALDER CONSTRUCTION CO.. 4041 0.055 0.93 ICOG588012 190 ALMONT WWTP 437 0.012 0.02 MCOG600476 510 ANDRIKOPOULOS, A.G., RESOURCES 4724 0.552 10.87 I-5ACO0026387 100 ASPEN CONSOLIDATED SAN DISTRCT 567 1.458 3.45 MCOG588085 100 ASPEN VILLAGE, INC. 335 0.034 0.05 MCOG600993 300 ASPEN WELL OPERATING, LLC I-7COG603050 100 ASPEN, CITY OF 390 0.002 0.00 I-1COG641066 100 ASPEN, CITY OF 321 0.038 0.05 ICOG600426 100 ASPEN, CITY OF - WATER DEPT. 194 0.000 ICOG603119 100 BANK OF THE WEST I-2COG588063 100 BASALT SANITATION DISTRICT 306 2.493 3.18 MCOG641095 100 BASALT, TOWN OF 96 0.004 0.00 ICOG589086 100 BATTLEMENT MESA METRO DISTRICT 507 0.471 1.00 MCO0044377 220 BEAR COAL COMPANY 3061 0.010 0.13 ICOG603012 100 BIG SKI PROPERTIES LLC 296 ICOG588074 100 BLUE CREEK RANCH LLC 603 0.007 0.02 MCO0038024 510 BLUE MOUNTAIN ENERGY, INC. 1064 0.028 0.12 ICO0020826 100 BLUE RIVER WASTEWATER T.P. 400 1.832 3.06 MCO0044776 220 BOWIE RESOURCES LIMITED 1130 0.117 0.55 ICO0021539 100 BRECKENRIDGE SAN DISTRICT 0.976 M-4BCOG641119 100 BRECKENRIDGE SKI RESORT 29 0.001 0.00 I-7COG641020 100 BRECKENRIDGE, TOWN OF I-2COG641053 100 BRECKENRIDGE, TOWN OF 137 0.186 0.11 ICO0045217 190 BROOKWAY IRWIN, LLC M-2CO0034142 500 BTU EMPIRE CORPORATION 1403 0.925 5.41 I-5ACOG588072 100 C LAZY U RANCH, INC. 219 0.005 0.00 MCO0047376 310 CAMP RED CLOUD 411 0.002 0.00 MCOG588112 220 CAMP GUNNISON INC. 304 0.003 0.00 MCOG588081 100 CANYON CREEK ESTATES WWTF 1173 0.064 0.31 MCOG641094 100 CARBONDALE, CITY OF I-2COG588050 100 CARBONDALE, TOWN OF 294 0.508 0.62 MCOG641027 100 CARBONDALE, TOWN OF I-2CO0042480 100 CBS OPERATIONS, INC. 2824 0.170 2.00 I-5ACO0031984 220 CEDAREDGE, TOWN OF 388 0.153 0.25 MCOG641015 220 CEDAREDGE, TOWN OF 85 0.016 0.01 ICOG589066 100 CENTER SANITATION DISTRICT 217 0.035 0.03 MCO0040827 100 CENTRAL APPALACHIA MINING, LLC I-2CO0032638 500 CHEVRON MINING INC, THE 4339 0.368 6.66 ICOG603105 CHEVRON USA, INC. I-2CO0033791 300 CLIFTON SANITATION DISTRICT #2 740 0.936 2.89 MCOG588076 100 CO DEPT OF TRANSPORTATION 504 0.001 0.00 MCOG588075 100 CO. DEPT OF TRANSPORTATION 1168 0.000 MCOX042731 200 CO. DEPT. OF TRANSPORTATION 992 0.003 0.01 I-7CO0046566 100 CO. MTN. RESORT INVESTORS, LLC 436 0.012 0.02 M-7CO0040487 100 COLLBRAN, TOWN OF 861 0.074 0.27 MCOG588032 220 COLO DEPARTMENT OF CORRECTIONS 426 0.018 0.03 MCOG600141 500 COLO DEPT OF TRANSPORTATION I-2COG588067 100 COLO. DEPT. OF TRANSPORTATION 779 0.001 0.00 MCOG600393 300 COLO. DIVISION OF WILDLIFE 0.001 I-7COG130001 100 COLORADO DIVISION OF WILDLIFE 300 8.511 10.65 I-5DCOG130004 190 COLORADO DIVISION OF WILDLIFE 118 4.212 2.07 I-5DCOG130005 801 COLORADO DIVISION OF WILDLIFE I-5DCOG130006 190 COLORADO DIVISION OF WILDLIFE 203 5.001 4.23 I-5DCOG130007 100 COLORADO DIVISION OF WILDLIFE 166 2.571 1.78 I-5DCOG130011 100 COLORADO DIVISION OF WILDLIFE 351 6.301 9.22 I-5DCO0045161 500 COLOWYO COAL COMPANY L.P. 1605 0.168 1.12 I

B-5
NPDES PERMIT# Salt Load
Tons/Day
NPDES PERMITSColorado River Basin Salinity Control Forum
January 1, 2008 through December 31, 2010
REACH Explanantion Code
NAME of Discharging Facility TDS Conc. AVG.(Mg/L)
Flow Rate AVG.(MGD)
COG600757 500 COLOWYO COAL COMPANY L.P. 1959 0.005 0.04 ICOG500350 500 CONNELL RESOURCES, INC. 241 1.240 1.25 1-5ACOG500475 500 CONNELL RESOURCES, INC. I-2COG500484 510 CONNELL RESOURCES, INC. 298 0.137 0.17 ICOG501522 500 CONNELL RESOURCES, INC. 734 0.607 0.19 ICOG584028 300 CONSOLIDATED METROPOLITAN DIST 763 0.493 1.57 ICOG641068 300 CONSOLIDATED METROPOLITAN DIST 307 0.267 0.34 I-2COG600036 100 COPPER MOUNTAIN, INC I-2COG603140 100 COPPER MOUNTAIN INC. I-2CO0021598 100 COPPER MTN CONS METRO DISTRICT 342 0.249 0.36 MCO0036251 310 COTTER CORPORATION I-2COG589001 100 COTTONWOOD WASTEWATER TREATMENT 848 0.977 3.45 MCOG605009 100 COVERED BRIDGE BUILDING ASSN. 0.387 I-7CO0040037 500 CRAIG, CITY OF 534 0.625 1.39 MCO0037729 220 CRAWFORD, TOWN OF 343 0.208 0.30 MCOG588045 190 CRESTED BUTTE SOUTH METRO DIST 341 0.081 0.12 MCO0020443 190 CRESTED BUTTE, TOWN OF 187 0.202 0.16 MCOG072823 100 CROSSROAD REDEVELOPMENT INC 588 0.140 0.34 ICOG584043 100 DEBEQUE, TOWN OF 953 0.872 3.47 MCO0048135 100 DEBEQUE, TOWN OF 754 0.030 0.09 MCO0039641 220 DELTA, CITY OF 1671 1.050 7.32 MCOG500458 220 DIAMOND LAZY L RANCH 1541 0.135 0.87 ICOG641006 100 DILLON, TOWN OF 79 0.079 0.03 ICO0023876 100 DUNDEE REALTY USA, LLC 653 0.007 0.02 MCO0021369 100 EAGLE RIVER WATER & SAN. DIST. 402 1.272 2.13 MCO0024431 100 EAGLE RIVER WATER & SAN. DIST. 462 1.971 3.80 MCO0037311 100 EAGLE RIVER WATER & SAN. DIST. 579 1.094 2.64 MCO0021059 100 EAGLE, TOWN OF M-4BCOG588080 100 EAGLE, TOWN OF 691 3.157 9.10 MCOG641031 100 EAGLE, TOWN OF I-2COG588079 100 EAST RIVER REGIONAL SAN. DIST. 248 0.056 0.06 MCOG588029 100 EL ROCKO MOBILE HOME PARK 498 0.003 0.01 MCOG500427 220 ELAM CONSTRUCTION, INC. I-2COG500429 100 ELAM CONSTRUCTION, INC. I-2COG600633 100 ENCANA OIL & GAS (USA), INC. I-2CO0047562 300 ENERGY FUELS RESOURCES CORP. 420 0.003 0.01 ICOG600951 510 ENTERPRISE PRODUCTS OPERATING I-2COG500433 100 EVERIST MATERIALS, LLC 1316 1.000 5.49 I-7COG850046 100 EXXON COMPANY, USA I-2COG603022 300 FMC PROPERTIES, LLC I-2COG603008 100 FOUNDERS PARKING ASSOCIATION 386 0.001 0.00 I-5ACOG603167 100 FRASER CROSSING/FOUNDERS POINTE I-2CO0040142 100 FRASER SANITATION DISTRICT 291 0.731 0.89 MCO0020451 100 FRISCO SANITATION DISTRICT 0.572 I-7COG600916 100 FRISCO SANITATION DISTRICT 0.153 i-7COG641067 100 FRISCO, TOWN OF I-2COG603117 100 FRISCO SANITATION DISTRICT 271 0.518 0.59 ICO0046175 100 FRUITA MARKETING & MANAGEMENT I-2COG589094 100 FRUITA, CITY OF 681 0.691 1.96 MCOG583002 100 FRUITA, TOWN OF 856 0.835 2.98 MCOG641072 100 GATEWAY METRO DIST. 1171 0.005 0.02 ICOG600744 100 GE JOHNSON CONSTRUCTION CO. 622 3.163 8.20 I-5ACOG600308 100 GLENWOOD HOT SPGS LODGE & POOL 20305 2.648 224.21 I-5ACO0020516 100 GLENWOOD SPRINGS, CITY OF 790 0.220 0.72 MCOG641052 100 GLENWOOD SPRINGS, CITY OF 79 0.048 0.02 I-2CO0020699 100 GRANBY SANITATION DISTRICT 357 0.315 0.47 MCOG600965 100 GRAND COUNTY 0.004 I-7COG603111 100 GRAND COUNTY I-2COG641087 100 GRAND COUNTY W&SD #1 I-2
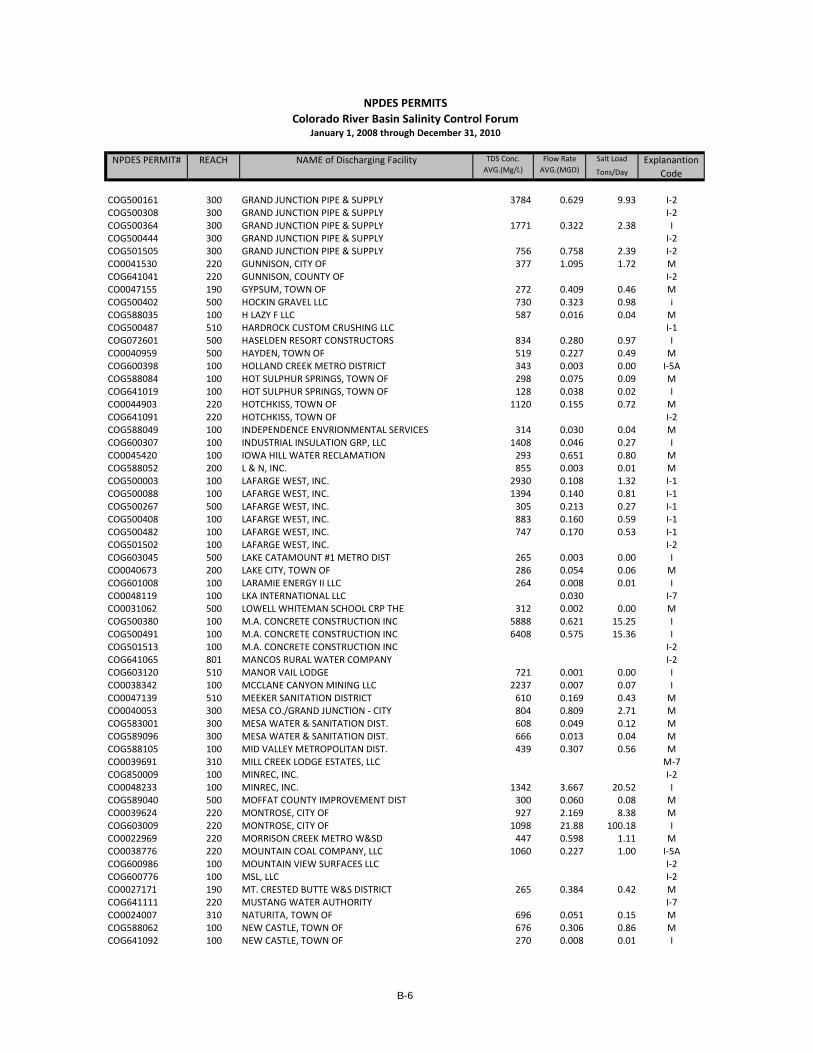
B-6
NPDES PERMIT# Salt Load
Tons/Day
NPDES PERMITSColorado River Basin Salinity Control Forum
January 1, 2008 through December 31, 2010
REACH Explanantion Code
NAME of Discharging Facility TDS Conc. AVG.(Mg/L)
Flow Rate AVG.(MGD)
COG500161 300 GRAND JUNCTION PIPE & SUPPLY 3784 0.629 9.93 I-2COG500308 300 GRAND JUNCTION PIPE & SUPPLY I-2COG500364 300 GRAND JUNCTION PIPE & SUPPLY 1771 0.322 2.38 ICOG500444 300 GRAND JUNCTION PIPE & SUPPLY I-2COG501505 300 GRAND JUNCTION PIPE & SUPPLY 756 0.758 2.39 I-2CO0041530 220 GUNNISON, CITY OF 377 1.095 1.72 MCOG641041 220 GUNNISON, COUNTY OF I-2CO0047155 190 GYPSUM, TOWN OF 272 0.409 0.46 MCOG500402 500 HOCKIN GRAVEL LLC 730 0.323 0.98 iCOG588035 100 H LAZY F LLC 587 0.016 0.04 MCOG500487 510 HARDROCK CUSTOM CRUSHING LLC I-1COG072601 500 HASELDEN RESORT CONSTRUCTORS 834 0.280 0.97 ICO0040959 500 HAYDEN, TOWN OF 519 0.227 0.49 MCOG600398 100 HOLLAND CREEK METRO DISTRICT 343 0.003 0.00 I-5ACOG588084 100 HOT SULPHUR SPRINGS, TOWN OF 298 0.075 0.09 MCOG641019 100 HOT SULPHUR SPRINGS, TOWN OF 128 0.038 0.02 ICO0044903 220 HOTCHKISS, TOWN OF 1120 0.155 0.72 MCOG641091 220 HOTCHKISS, TOWN OF I-2COG588049 100 INDEPENDENCE ENVRIONMENTAL SERVICES 314 0.030 0.04 MCOG600307 100 INDUSTRIAL INSULATION GRP, LLC 1408 0.046 0.27 ICO0045420 100 IOWA HILL WATER RECLAMATION 293 0.651 0.80 MCOG588052 200 L & N, INC. 855 0.003 0.01 MCOG500003 100 LAFARGE WEST, INC. 2930 0.108 1.32 I-1COG500088 100 LAFARGE WEST, INC. 1394 0.140 0.81 I-1COG500267 500 LAFARGE WEST, INC. 305 0.213 0.27 I-1COG500408 100 LAFARGE WEST, INC. 883 0.160 0.59 I-1COG500482 100 LAFARGE WEST, INC. 747 0.170 0.53 I-1COG501502 100 LAFARGE WEST, INC. I-2COG603045 500 LAKE CATAMOUNT #1 METRO DIST 265 0.003 0.00 ICO0040673 200 LAKE CITY, TOWN OF 286 0.054 0.06 MCOG601008 100 LARAMIE ENERGY II LLC 264 0.008 0.01 ICO0048119 100 LKA INTERNATIONAL LLC 0.030 I-7CO0031062 500 LOWELL WHITEMAN SCHOOL CRP THE 312 0.002 0.00 MCOG500380 100 M.A. CONCRETE CONSTRUCTION INC 5888 0.621 15.25 ICOG500491 100 M.A. CONCRETE CONSTRUCTION INC 6408 0.575 15.36 ICOG501513 100 M.A. CONCRETE CONSTRUCTION INC I-2COG641065 801 MANCOS RURAL WATER COMPANY I-2COG603120 510 MANOR VAIL LODGE 721 0.001 0.00 ICO0038342 100 MCCLANE CANYON MINING LLC 2237 0.007 0.07 ICO0047139 510 MEEKER SANITATION DISTRICT 610 0.169 0.43 MCO0040053 300 MESA CO./GRAND JUNCTION - CITY 804 0.809 2.71 MCOG583001 300 MESA WATER & SANITATION DIST. 608 0.049 0.12 MCOG589096 300 MESA WATER & SANITATION DIST. 666 0.013 0.04 MCOG588105 100 MID VALLEY METROPOLITAN DIST. 439 0.307 0.56 MCO0039691 310 MILL CREEK LODGE ESTATES, LLC M-7COG850009 100 MINREC, INC. I-2CO0048233 100 MINREC, INC. 1342 3.667 20.52 ICOG589040 500 MOFFAT COUNTY IMPROVEMENT DIST 300 0.060 0.08 MCO0039624 220 MONTROSE, CITY OF 927 2.169 8.38 MCOG603009 220 MONTROSE, CITY OF 1098 21.88 100.18 ICO0022969 220 MORRISON CREEK METRO W&SD 447 0.598 1.11 MCO0038776 220 MOUNTAIN COAL COMPANY, LLC 1060 0.227 1.00 I-5ACOG600986 100 MOUNTAIN VIEW SURFACES LLC I-2COG600776 100 MSL, LLC I-2CO0027171 190 MT. CRESTED BUTTE W&S DISTRICT 265 0.384 0.42 MCOG641111 220 MUSTANG WATER AUTHORITY I-7CO0024007 310 NATURITA, TOWN OF 696 0.051 0.15 MCOG588062 100 NEW CASTLE, TOWN OF 676 0.306 0.86 MCOG641092 100 NEW CASTLE, TOWN OF 270 0.008 0.01 I

B-7
NPDES PERMIT# Salt Load
Tons/Day
NPDES PERMITSColorado River Basin Salinity Control Forum
January 1, 2008 through December 31, 2010
REACH Explanantion Code
NAME of Discharging Facility TDS Conc. AVG.(Mg/L)
Flow Rate AVG.(MGD)
COG900010 500 NORTH FINN LLC ICOG501524 500 NORTHWEST AGGREGATES INC. 160 0.350 0.23 ICOG589067 100 NUCLA, TOWN OF 1158 0.035 0.17 MCOG582002 310 NUCLA SANITATION DISTRICT 1206 0.230 1.16 MCO0041106 500 OAK CREEK, TOWN OF 198 0.192 0.16 MCOG641057 500 OAK CREEK, TOWN OF 209 0.019 0.02 ICO0045802 100 OAK MEADOWS SERVICE COMPANY 1215 0.010 0.05 MCOG600452 100 OCCIDENTAL OIL SHALE, INC. I-2CO0020907 220 OLATHE, TOWN OF 1869 0.354 2.76 MCOG500010 190 OLDCASTLE SW GROUP INC. 331 1.750 2.42 I-1COG500119 100 OLDCASTLE SW GROUP INC. 515 0.349 0.75 I-1COG500136 190 OLDCASTLE SW GROUP INC. 1430 0.300 1.79 I-1COG500437 100 OLDCASTLE SW GROUP INC. 2397 0.450 4.50 ICOG500216 100 OLDCASTLE SW GROUP, INC. 4110 0.264 4.52 ICOG500243 500 OLDCASTLE SW GROUP, INC. 300 0.000 0.00 ICOG500299 100 OLDCASTLE SW GROUP, INC. 7453 0.266 8.27 ICOG500397 190 OLDCASTLE SW GROUP, INC. 468 0.362 0.71 ICOG500400 190 OLDCASTLE SW GROUP, INC. 1388 0.145 0.84 ICOG500420 190 OLDCASTLE SW GROUP, INC. I-2COG500441 300 OLDCASTLE SW GROUP, INC. 985 I-7COG500464 190 OLDCASTLE SW GROUP, INC. 2416 0.974 9.81 ICOG500467 100 OLDCASTLE SW GROUP, INC. 985 0.438 1.80 ICOG500497 100 OLDCASTLE SW GROUP, INC. 1604 0.715 4.78 ICOG500498 190 OLDCASTLE SW GROUP, INC. 2304 0.628 6.03 ICOG501510 190 OLDCASTLE SW GROUP, INC. 881 0.860 3.16 ICOG641081 220 ORCHARD CITY, TOWN OF 77 0.020 0.01 ICOG603147 100 OSP CONDOMINIUMS AT APRES SKI WAY 912 0.006 0.02 ICOG588041 100 OURAY RANCH HOMEOWNERS ASSN. 180 0,002 0.75 MCO0043397 220 OURAY, CITY OF 474 2.780 5.49 MCOG600544 220 OURAY, CITY OF 1560 0.402 2.62 I-5ACO0000132 220 OXBOW MINING, LLC 1234 0.595 3.06 I-2COG641007 801 PAGOSA AREA WATER & SAN DIST I-7COG641022 801 PAGOSA AREA WATER & SAN DIST I-7COG641085 801 PAGOSA AREA WATER & SAN DIST I-7CO0031755 801 PAGOSA AREA WATER & SAN. DIST. M-7COG641077 801 PAGOSA AREA WATER & SAN. DIST. I-2COG584004 300 PALISADE, TOWN OF 465 0.198 0.38 MCOG589083 300 PALISADE, TOWN OF 500 0.207 0.43 MCOG641037 300 PALISADE, TOWN OF I-2CO0021709 220 PAONIA, TOWN OF 796 0.176 0.58 MCO0047431 220 PAONIA, TOWN OF 1053 1.450 6.37 MCOG600908 100 PCL CONSTRUCTION SERVICES, INC 0.006 I-7COG600178 500 PETE LIEN & SONS I-2COG900011 100 PIONEER NATURAL RESOURCES USA 0.425 I-5ACOG600534 100 PITKIN IRON CORPORATION I-2COG500356 100 POLYCOR COLORADO STONEQUARRIES 130 0.011 0.01 ICO0023485 300 POWDERHORN METRO DISTRICT NO 1 363 0.103 0.16 MCOG500396 500 PRECISION EXCAVATING 305 1.790 2.28 ICO0000027 300 PUBLIC SERVICE CO. OF COLORADO 909 19.525 74.01 ICOG600536 500 PUBLIC SERVICE CO. OF COLORADO 304 0.029 0.04 ICOG588051 100 RANCH AT ROARING FORK HOA 415 0.036 0.06 MCOG589088 510 RANGELY, TOWN OF 380 0.157 0.25 MCO0021385 100 RED CLIFF, TOWN OF 203 0.054 0.05 MCO0046370 100 REDSTONE WATER & SAN DISTRICT 472 0.021 0.04 MCOG603031 100 RELATED WESTPAC 550 0.038 0.09 ICOG588047 310 RIDGWAY, TOWN OF 492 0.085 0.17 MCOG584024 100 RIFLE, CITY OF 1187 0.673 3.33 MCOG584053 100 RIFLE, CITY OF 899 0.187 0.70 MCOG589092 100 RIFLE, CITY OF SOUTH 1082 0.147 0.66 M

B-8
NPDES PERMIT# Salt Load
Tons/Day
NPDES PERMITSColorado River Basin Salinity Control Forum
January 1, 2008 through December 31, 2010
REACH Explanantion Code
NAME of Discharging Facility TDS Conc. AVG.(Mg/L)
Flow Rate AVG.(MGD)
CO0048151 100 RIFLE REGIONAL WASTEWATER RECLAMATION 843 0.738 2.59COG589093 100 RIFLE, CITY OF 1013 0.648 2.74 MCOG641107 100 RIFLE, CITY OF I-2COG641108 100 RIFLE, CITY OF 197 0.053 0.04 ICOG501517 510 RIO BLANCO I-2COG603127 100 RITZ CARLTON RESIDENCES AND CLUB AT VAIL 492 0.004 0.01 ICOG588006 100 RIVERBEND SUBDIVISION WWTF 1759 0.272 2.00 MCOG588066 220 RIVERSBEND APARTMENTS WWTF 590 0.002 0.00 MCO0044750 100 ROARING FORK WATER & SAN DIST 741 0.055 0.17 M-4ACOG588083 100 ROCK GARDENS MHP & CAMPGROUND 633 0.008 0.02 MCOG603151 100 ROCK RESORTS INTL 679 1.224 3.47 ICOG589026 500 ROUTT CO. FOR PHIPPSBURG COMM. 545 0.012 0.03 MCOG588037 500 ROUTT COUNTY FOR MILNER COMM. 650 0.011 0.03 MCO0047449 500 ROUTT COUNTY 554 0.015 0.03 MCOG588013 801 SAN JUAN RIVER VILLAGE METRO M-7COG603031 200 SANCTUARY/SNOWMASS CONDO ASSOC 260 0.013 0.01 I-5ACO0043753 310 SAVAGE MINING & OIL CO., INC. NONE NONE i-2CO0000221 500 SENECA COAL COMPANY 2360 0.394 3.88 I-5ACOG500312 500 SENECA COAL COMPANY 160 0.141 0.09 ICOG600162 510 SHELL FRONTIER OIL & GAS, INC. 1421 0.108 0.64 I-5ACOG603102 100 SHELL FRONTIER OIL & GAS, INC. 0.001 0.00 I-2COG600677 500 SIDNEY PEAK RANCH 2483 0.014 0.14 ICOG641112 100 SILT TOWN OF 524 0.017 0.04 ICOG588046 100 SILT, TOWN OF 724 0.237 0.72 MCOG500493 100 SILT SAND AND GRAVEL 1027 1.017 4.36 ICOG070867 200 SILVERTHORNE/DILLON JSA 198 1.263 1.04 I-1CO0020311 801 SILVERTON, TOWN OF M-7COG641008 801 SILVERTON, TOWN OF I-7CO0027146 300 SNOWCAP COAL COMPANY, INC. 1252 0.390 2.04 I-5ACO0023086 100 SNOWMASS WATER & SAN DISTRICT 301 0.816 1.02 MCOG603155 100 SOLARIS PROPERTY OWNER LLC 700 0.175 0.51 ICOG603014 100 SONNENALP RESORT OF VAIL I-2COG588057 801 SOUTH DURANGO SANITATION DIST M-7CO0046124 100 SPRING VALLEY SANITATION DIST. 820 0.048 0.16 MCOG588033 310 ST. BARNAVAS CHURCH CAMPS, INC M-7COG072678 STANEK CONSTUCTORS INC. 4041 0.197 3.32 ICOG600603 500 STEAMBOAT HEALTH & REC ASSOC. 1552 0.012 0.08 ICO0035556 500 STEAMBOAT LAKE W&SD 451 0.035 0.07 MCO0020834 500 STEAMBOAT SPRINGS, CITY OF 322 1.996 2.68 MCOG600127 500 STEAMBOAT SPRINGS, CITY OF I-2COG603096 500 STEAMBOAT SPRINGS, CITY OF I-2CO0038598 100 SUNLIGHT, INC. 262 0.005 0.01 ICOG588086 300 SW MESA CO RURAL PUB IMP DIST 1175 0.013 0.06 MCO0045501 100 TABERNASH MEADOWS W&SD 266 0.032 0.04 MCOG603053 100 TABERNASH MEADOWS W&SD I-2COG588061 100 TALBOTT ENTERPRISES, INC. 1631 0.061 0.41 MCO0041840 310 TELLURIDE, TOWN OF M-7COG641024 310 TELLURIDE, TOWN OF I-7CO0037681 100 THREE LAKES WATER AND SANITATION DIST 240 0.465 0.47 MCO0032115 500 TRAPPER MINING, INC. 1785 0.263 1.96 ICO0042447 100 TRI-STATE GEN & TRANS ASSN. 1473 0.014 0.09 ICO0000540 310 TRI-STATE GENERATN &TRANSMISSN 1421 0.295 1.75 I-5ACO0027154 500 TWENTYMILE COAL COMPANY 2272 0.074 0.70 ICO0036684 500 TWENTYMILE COAL COMPANY 3666 0.015 0.23 ICO0042161 500 TWENTYMILE COAL COMPANY 4106 0.015 0.26 I-2COG588070 100 TWO RIVERS VILLAGE METRO DIST 663 0.018 0.05 MCO0041548 300 U.S. DEPARTMENT OF ENERGY I-2CO0035394 190 U.S. MOLY CORP. 813 0.470 1.59 I-5ACOG641105 100 UPPER EAGLE REG WATER AUTH. 199 0.022 0.02 I

B-9
NPDES PERMIT# Salt Load
Tons/Day
NPDES PERMITSColorado River Basin Salinity Control Forum
January 1, 2008 through December 31, 2010
REACH Explanantion Code
NAME of Discharging Facility TDS Conc. AVG.(Mg/L)
Flow Rate AVG.(MGD)
COG641058 100 UPPER EAGLE REG WATER AUTHORTY 219 0.001 0.00 ICO0047147 801 UPPER VALLEY WATER & SAN DIST. M-7COG641104 220 USCDWUA 104 0.035 0.02 ICOG588109 190 UTE TRAIL RANCH FOUNDATION 358 0.002 0.00 MCOG641070 300 UTE WATER CONSERVANCY DISTRICT I-2COG600381 100 VAIL ASSOCIATES, INC. I-2COG603076 100 VAIL RESORTS INC. 304 0.663 0.84 ICOG500134 220 VALCO, INC. I-1COG588026 801 VALLECITO RESORT, LLC M-7COG600409 100 VILLAGE AT COPPER ASSOCIATION I-2CO0037702 801 VISTA VERDE VILLAGE, LLC M-7CO0042617 220 VOLUNTEERS OF AMERICA CARE FAC 360 0.007 0.01 MCO0037206 220 WALKER RUBY MINING COMPANY,INC 102 5.758 2.45 I-5ACOG600706 100 WEITZ COMPANY I-2COG588008 100 WEST GLENWOOD SPRINGS SAN DIST 344 MCO0030449 220 WEST MONTROSE SANITATION DIST 580 0.151 0.37 MCO0000213 310 WESTERN FUELS-COLORADO, LLC 2061 0.196 1.68 I-5ACOG500451 190 WESTERN GRAVEL INC. I-2COG500486 100 WESTERN GRAVEL INC. I-2COG500473 510 WHITE RIVER AGGREGATES I-2COG588048 510 WHITERIVER RV, LLC M-2CO0026051 100 WINTER PARK WATER & SAN DIST 309 0.179 0.23 MCO0000051 100 WINTER RIDGE ENERGY, LLC 0.920 I-5ACOG603042 100 WOODRUN PLACE CONDOS HOA BOARD 116 0.409 0.20 I-1COG588103 100 WOODY CREEK MOBILE HOA 303 0.015 0.02 MCO0046931 310 WYNNE, LEE I-7COG603167 100 XCEL ENERGY 6900 0.007 0.21 ICO0030635 500 YAMPA, TOWN OF 335 0.034 0.05 MCO0045411 100 YOUNG LIFE CAMPAIGN, INC. 773 0.009 0.03 M
NevadaNV0000060 910 Titanium Metals Corp 1083 1.789 8.08 INV0000078 910 TRONOX - LLC-Kerr McGee Corporation 569 0.021 0.05 INV0020133 910 City of Las Vegas Water Pollution Control Facility 1100 61.233 281.14 M-4BNV0020192 910 NDOW - Lake Mead Fish Hatchery 642 0.248 0.66 I-5DNV0021261 910 CCWRD - AWT Plant 1155 44.685 215.29 M-4BNV0021563 910 CCWRD Laughlin 1108 2.027 9.37 M-4BNV0021750 910 Hilton, Las Vegas 2009 0.001 0.01 INV0021911 910 Las Vegas Valley Municipal Stormwater Permit 0 0.000 0.00 M-2NV0022098 910 City of Henderson 1238 12.168 62.88 M-4BNV0022195 910 Valley Hospital Medical Center 2425 0.001 0.01 I-5ENV0022420 910 Union Oil Company 0 0.000 0.00 I-5ENV0022691 910 Lake Las Vegas Resort 0 0.000 0.00 I-2NV0022748 910 Bonneville Ave Underpass 1768 0.016 0.12 I-5ENV0022772 910 Sterling/Squire/Crescendo HOAs (fomerly Saxton) 5407 0.118 2.66 I-5ENV0022781 910 Shanghai Partners - 7030 Tomiyasu Lane 2767 0.112 1.29 I-5ENV0022837 910 Circle K Store #0695 1800 0.000 0.00 I-5ENV0022845 910 Harrah's Las Vegas Hotel/Casino 0 0.000 0.00 INV0022870 910 7-Eleven, Inc Store #19653 0 0.000 0.00 I-5ENV0022888 910 Venetian Casino Resort 1557 0.003 0.02 I-5ENV0022942 910 US General Services Administration 2269 0.000 0.00 I-7NV0022985 910 Planet Hollywood (formerly Aladdin Resort) 184 0.000 0.00 I-7
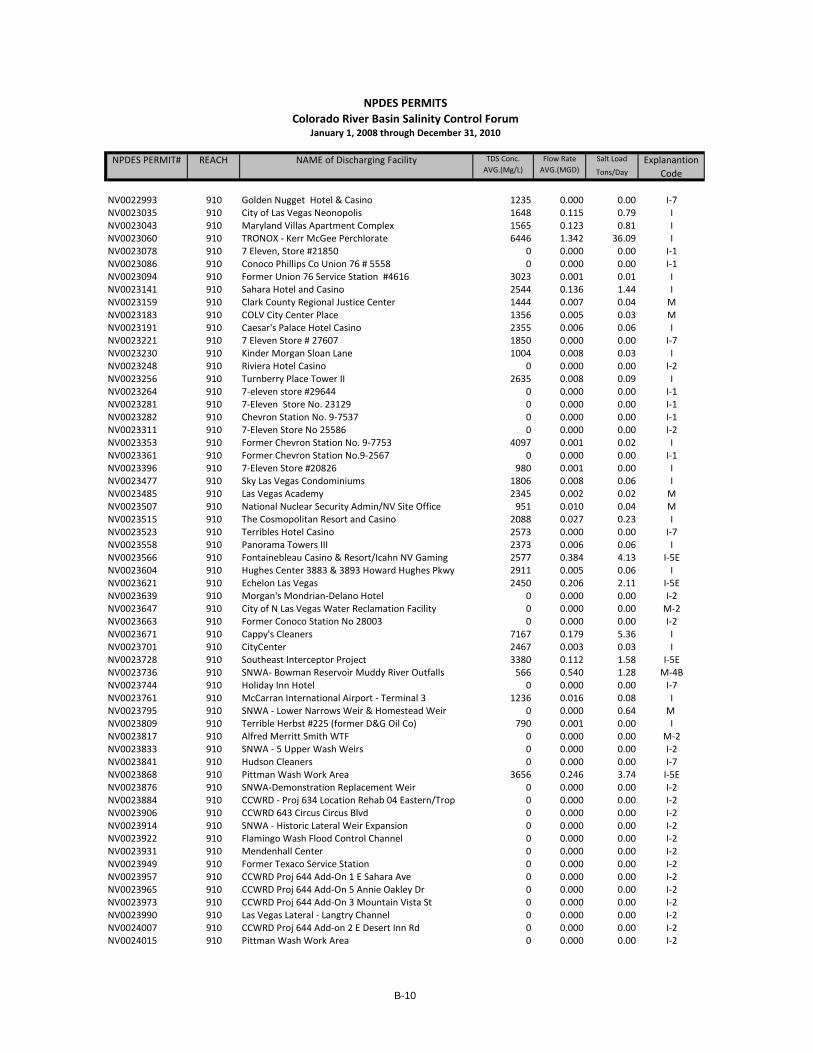
B-10
NPDES PERMIT# Salt Load
Tons/Day
NPDES PERMITSColorado River Basin Salinity Control Forum
January 1, 2008 through December 31, 2010
REACH Explanantion Code
NAME of Discharging Facility TDS Conc. AVG.(Mg/L)
Flow Rate AVG.(MGD)
NV0022993 910 Golden Nugget Hotel & Casino 1235 0.000 0.00 I-7NV0023035 910 City of Las Vegas Neonopolis 1648 0.115 0.79 INV0023043 910 Maryland Villas Apartment Complex 1565 0.123 0.81 INV0023060 910 TRONOX - Kerr McGee Perchlorate 6446 1.342 36.09 INV0023078 910 7 Eleven, Store #21850 0 0.000 0.00 I-1NV0023086 910 Conoco Phillips Co Union 76 # 5558 0 0.000 0.00 I-1NV0023094 910 Former Union 76 Service Station #4616 3023 0.001 0.01 INV0023141 910 Sahara Hotel and Casino 2544 0.136 1.44 INV0023159 910 Clark County Regional Justice Center 1444 0.007 0.04 MNV0023183 910 COLV City Center Place 1356 0.005 0.03 MNV0023191 910 Caesar's Palace Hotel Casino 2355 0.006 0.06 INV0023221 910 7 Eleven Store # 27607 1850 0.000 0.00 I-7NV0023230 910 Kinder Morgan Sloan Lane 1004 0.008 0.03 INV0023248 910 Riviera Hotel Casino 0 0.000 0.00 I-2NV0023256 910 Turnberry Place Tower II 2635 0.008 0.09 INV0023264 910 7-eleven store #29644 0 0.000 0.00 I-1NV0023281 910 7-Eleven Store No. 23129 0 0.000 0.00 I-1NV0023282 910 Chevron Station No. 9-7537 0 0.000 0.00 I-1NV0023311 910 7-Eleven Store No 25586 0 0.000 0.00 I-2NV0023353 910 Former Chevron Station No. 9-7753 4097 0.001 0.02 INV0023361 910 Former Chevron Station No.9-2567 0 0.000 0.00 I-1NV0023396 910 7-Eleven Store #20826 980 0.001 0.00 INV0023477 910 Sky Las Vegas Condominiums 1806 0.008 0.06 INV0023485 910 Las Vegas Academy 2345 0.002 0.02 MNV0023507 910 National Nuclear Security Admin/NV Site Office 951 0.010 0.04 MNV0023515 910 The Cosmopolitan Resort and Casino 2088 0.027 0.23 INV0023523 910 Terribles Hotel Casino 2573 0.000 0.00 I-7NV0023558 910 Panorama Towers III 2373 0.006 0.06 INV0023566 910 Fontainebleau Casino & Resort/Icahn NV Gaming 2577 0.384 4.13 I-5ENV0023604 910 Hughes Center 3883 & 3893 Howard Hughes Pkwy 2911 0.005 0.06 INV0023621 910 Echelon Las Vegas 2450 0.206 2.11 I-5ENV0023639 910 Morgan's Mondrian-Delano Hotel 0 0.000 0.00 I-2NV0023647 910 City of N Las Vegas Water Reclamation Facility 0 0.000 0.00 M-2NV0023663 910 Former Conoco Station No 28003 0 0.000 0.00 I-2NV0023671 910 Cappy's Cleaners 7167 0.179 5.36 INV0023701 910 CityCenter 2467 0.003 0.03 INV0023728 910 Southeast Interceptor Project 3380 0.112 1.58 I-5ENV0023736 910 SNWA- Bowman Reservoir Muddy River Outfalls 566 0.540 1.28 M-4BNV0023744 910 Holiday Inn Hotel 0 0.000 0.00 I-7NV0023761 910 McCarran International Airport - Terminal 3 1236 0.016 0.08 INV0023795 910 SNWA - Lower Narrows Weir & Homestead Weir 0 0.000 0.64 M NV0023809 910 Terrible Herbst #225 (former D&G Oil Co) 790 0.001 0.00 INV0023817 910 Alfred Merritt Smith WTF 0 0.000 0.00 M-2NV0023833 910 SNWA - 5 Upper Wash Weirs 0 0.000 0.00 I-2NV0023841 910 Hudson Cleaners 0 0.000 0.00 I-7NV0023868 910 Pittman Wash Work Area 3656 0.246 3.74 I-5ENV0023876 910 SNWA-Demonstration Replacement Weir 0 0.000 0.00 I-2NV0023884 910 CCWRD - Proj 634 Location Rehab 04 Eastern/Trop 0 0.000 0.00 I-2NV0023906 910 CCWRD 643 Circus Circus Blvd 0 0.000 0.00 I-2NV0023914 910 SNWA - Historic Lateral Weir Expansion 0 0.000 0.00 I-2NV0023922 910 Flamingo Wash Flood Control Channel 0 0.000 0.00 I-2NV0023931 910 Mendenhall Center 0 0.000 0.00 I-2NV0023949 910 Former Texaco Service Station 0 0.000 0.00 I-2NV0023957 910 CCWRD Proj 644 Add-On 1 E Sahara Ave 0 0.000 0.00 I-2NV0023965 910 CCWRD Proj 644 Add-On 5 Annie Oakley Dr 0 0.000 0.00 I-2NV0023973 910 CCWRD Proj 644 Add-On 3 Mountain Vista St 0 0.000 0.00 I-2NV0023990 910 Las Vegas Lateral - Langtry Channel 0 0.000 0.00 I-2NV0024007 910 CCWRD Proj 644 Add-on 2 E Desert Inn Rd 0 0.000 0.00 I-2NV0024015 910 Pittman Wash Work Area 0 0.000 0.00 I-2

B-11
NPDES PERMIT# Salt Load
Tons/Day
NPDES PERMITSColorado River Basin Salinity Control Forum
January 1, 2008 through December 31, 2010
REACH Explanantion Code
NAME of Discharging Facility TDS Conc. AVG.(Mg/L)
Flow Rate AVG.(MGD)
New MexicoNM0028762 801 Aztec, City of / WTP 407.5 0.1625 0.1614 INM0020168 801 Aztec, City of / WWTP 253 0.584 0.61 M NM0030317 801 Blanco MDWA / WTP 0 0 0 I-1NM0028142 801 Bloomfield Municipal Schools 0 0 0 I-1NM0030902 801 Bloomfield Water 0 0 0 I-2NM0029319 801 Central Consolidated School District 385 0.033 0.05 INM0020770 801 Bloomfield, City of / WWTP 315 0.85 1.11 MNM0000043 801 Farmington, City of / Animas Steam Plant 471.33 11.56 22.59 I-7NM0028258 801 Farmington Sand & Gravel Co. 0 0 0 I-2NM0020583 801 Farmington WWTP 398 5.15 8.95 M-5ANM0020672 900 Gallup WWTP - 2.25 9.97 M-4ANM0029025 801 Harper Valley Subd. 372.4 0.4 0.05 MNM0030953 801 Navajo Dam DWC & NSW, Inc 0 0 0 I-2NM0027995 801 Oldcastle SW Group, Inc. 0.7 1.5 I-1NM0028606 801 Public Service Co of NM - San Juan 0 0 0 I-2NM0020524 900 Quivira Mining Company - Church Rock 0 0 0 I-1NM0023396 900 Ramah Water & Sanitation Dist. 580 0.03 0.045 M-5NM0029505 801 San Juan Coal Company - La Plata 0 0 0 I-2NM0028746 801 San Juan Coal Company - San Juan 0 0 0 I-2NM0030473 801 San Juan County McGee Park WWTP 0 0 0 I-1NM0029432 801 Yampa Mining Co. (De-na-zin Mine) 0 0 0 I-1NM0029475 801 Yampa Mining Co. (Gatew.) 0 0 0 I-1
UtahUTG040027 900 Alton Coal Development - 0 0 I-2UTG040007 600 Andalex Wildcat Loadout - 0 0 I-2UT0025674 600 Andalex-Pinnacle Coal Mine 1698 0.959 6.7 I-AUTG640027 411 Ashely Valley WTP - - - M-6UTG640003 411 Ashley Springs WTP - - - M-6UT0025348 411 Ashley Valley Water & Sewer, Mechanical 522 2.5 5.44 MUTG640019 802 Blanding Culinary Water Treatment - - - M-6UTG040011 600 Canyon Fuel Co.- Banning Loadout - 0 0 I-2UT0024759 600 Canyon Fuel Co.- Dugout Mine 880 1 3.66 I-AUT0023540 600 Canyon Fuel Co.- Skyline Mine 539 5.2 11.8 I-AUT0022918 700 Canyon Fuel Co.- SUFCo Mine 661 4 11 I-5BUT0023680 600 Canyon Fuel Co.-Soldier Creek Coal - 0 0 I-2UT0025828 300 Canyonlands by Night 3000 0.005 0.06 IUT0025798 700 Capital Reef National Park - - - I-2UTG040028 600 Carbon Resources-Kinney No. 2 Mine - 0 0 I-2UT0023663 710 Castle Valley SSD-Castle Dale 2188 0.08 0.73 MUT0020052 710 Castle Valley SSD-Ferron - 0 0 M-2UT0021296 710 Castle Valley SSD-Huntington 1291 0.13 0.7 MUTG040026 700 Consolodated Coal Co.-Hidden Valley Mine Site - 0 0 I-2UT0022616 700 Consolodated Coal Co.-Underground 3858 0.98 15.76 I-5BUTG040006 700 Hiawatha Coal Co.-Bear Canyon Mine 1160 0.172 0.83 IUT0020095 610 Duchesne City Corp. 961 0.082 0.33 MUT0025801 610 Duchesne Valley - - - M-7UTG640028 610 Duchesne Valley WTP - - - M-6UTG640014 411 Dutch John WTP - - - M-6UTG640012 600 E. Carbon City-Sunnyside CWTP - - - M-6UTG640030 710 Emery WTP - - - M-6UT0025712 300 Energy Queen Mine - 0 0 I-2UTG640039 710 Ferron WTP - - - M-6UT0024368 710 Genwal Resources, Inc.-Crandall Canyon Mine 776 0.678 2.21 I-AUTG640017 600 Green River WTP - - - M-6UT0025232 600 Green River, City of - 0 0 M-1

B-12
NPDES PERMIT# Salt Load
Tons/Day
NPDES PERMITSColorado River Basin Salinity Control Forum
January 1, 2008 through December 31, 2010
REACH Explanantion Code
NAME of Discharging Facility TDS Conc. AVG.(Mg/L)
Flow Rate AVG.(MGD)
UT0025771 600 Green River, City of 5395 1.05 23.6 MUTG790021 905 Haycock Petroleum Remediation Site 4800 0.0075 0.15 IUT0023094 600 Hiawatha Coal Co. 747 0.48 1.495 I-5BUTG040019 600 Horizon Coal 367 0.48 0.735 IUTG640040 710 Huntington WTP - - - M-6UT0024015 411 Intermountain Concrete 1800 0.07 0.5 IUT0023922 300 International Uranium Dension Mines - 0 0 I-2UTG040013 600 UEI Horse Canyon Mine (reclaimed) - 0 0 I-1UTG040024 600 UEI Lila Canyon Mine - 0 0 I-2UT0025488 600 J.W. Operating Corp. - 0 0 I-1UT0025534 710 James Canyon Well System - 0 0 I-2UTG640023 411 Manilla WTP - - - M-6UT0020419 300 Moab, City of 407 0.954 1.81 MUT0024503 802 Monticello - 0 0 M-2UTG640015 802 Monticello City (Culinary WTP) - - - M-6UTG040004 600 Mountain Coal Co.-Gordon Cr. Mine (reclaimed) 0 0 0 I-1UTG640008 610 Myton Community Water System - - - M-6UTG040010 600 NEICO - 0 0 I-2UT0023001 610 Neola Town Water & Sewer Assoc. - 0 0 M-2, M-3UTG790014 600 Olsen-Durrant (Former Bulk Fuel Facility) - 0 0 I-2UTG790029 600 Former Circle C Store In Price - 0 0 I-2UTG790028 600 Bill Barrett Corp-Nine Mile Compressor Station 427 0.026 0.046 IUTG640031 710 Orangeville WTP - - - M-6UT0000094 600 PacifiCorp-Carbon Plant 2467 0.25 2.57 I-5BUT0023604 710 PacifiCorp-Deer Creek Mine 472 0.5 0.98 IUTG040009 710 PacifiCorp-Hunter Plant Coal Prep & Blend Facility - 0 0 I-2UT0025607 710 PacifiCorp-Huntington Plant - 0 0 I-2UT0023728 710 PacifiCorp-Trail Mountain Mine - 0 0 I-2UT0022896 710 PacifiCorp-Wilberg Mine 755 0.04 0.126 IUTG640035 600 Price City WTP - - - M-6UT0021814 600 Price River Water Imp. Dist. 1232 1.57 8.06 MUTG640034 600 Price River WID - - - M-6UTG040012 600 RAG Plateau Mining Corp.(reclaimed) - 0 0 I-1UTG040005 600 Savage Industries Coal Terminal (CV-Spur) - 0 0 I-2UT0025224 905 Springdale 815 0.2 0.68 MUTG640021 905 St. George WTP - - - M-6UT0024686 905 St. George, City of 1182 9.1 44.8 MUTG040025 600 Star Point Refuse Pile(Sunnyside Cogen) - 0 0 I-2UT0024759 600 Sunnyside Cogen. - 0 0 I-2UTG070309 905 The Industrial Company (Millcreek project) - 0 0 I-1UTG640002 610 Tridell-Lapoint Water IDWTP - - - M-6UTG130003 700 UDWR-Egan/Bicknell Fish Hatchery 186 10.14 7.87 I-5DUTG130007 700 UDWR-Loa Fish Hatchery 174 8.9 4.17 I-5DUTG130012 610 UDWR-Whiterocks Fish Hatchery 234 5.4 5.27 I-5DUT0020338 411 USBOR-Flaming Gorge Dam - 0.00265 - M-3UTG130001 411 USFWS-Jones Hole Fish Hatchery 185 7 5.4 I-5DUTG640006 700 USNPS-Capitol Reef WTP 0 0 0 M-6UTG640004 700 USNPS-Glen Canyon Hite WTP 0 0 0 M-6UT0025810 300 Velvet Mine - 0 0 I-2UT0025640 600 West Ridge Resources Mine 1595 1.2 7.98 I-AUTG040021 600 White Oak Mine (reclaimed) - - - I-1UT0000035 411 Western Energy Operating-Ashley Valley Lease 1262 1.16 6.1 I-5BUT0000124 411 Western Energy Operating-Pan American Lease 1354 0.9 5.08 I-5BUT0021768 411 Western Energy Operating-T.Hall Lease 1800 0.4 3 I-5B

B-13
NPDES PERMIT# Salt Load
Tons/Day
NPDES PERMITSColorado River Basin Salinity Control Forum
January 1, 2008 through December 31, 2010
REACH Explanantion Code
NAME of Discharging Facility TDS Conc. AVG.(Mg/L)
Flow Rate AVG.(MGD)
WyomingWY0026671 401 American Family Inn 0.00 M-1WY0022128 401 B & R Mobile Home Village 239 0.22 0.22 MWY0022888 500 Baggs Wastewater Lagoons 500 0.06 0.13 MWY0020133 401 Big Piney Wastewater Lagoon 93.3 0.029 0.01 MWY0030261 401 Black Butte Mine 0 0.00 M-2WY0052515 401 Boulder Oilfield Waste Recycling Facility 0.00 M-2WY0000094 401 Boulder Rearing Station 0 0.00 I-5DWY0032697 411 Carter Creek Gas Plant 0.00 I-1WY0023132 411 Company's Green River Plant(Church & Dwight) 0.00 I-6WY0035301 401 County (Sweetwater) Picnic Grounds WTP 0.00 M-1WY0035858 500 Cow Creek #1-X-12 I-1WY0054038 500 Cow Creek CBNG Project 0.00 I-1WY0042145 500 Cow Creek Unit 1800 0.03 0.23 IWY0000086 401 Daniel Fish Hatchery 10 0.00 I-5DWY0023124 401 Daniels Mobile Home Park 0.00 M-2WY0021938 500 Dixon Wastewater Lagoon 200 0.05 0.04 MWY0036021 500 Dixon Water Treatment Plant 0.00 M-1WY0048437 500 Doty Mountain CBM Project 0.00 I-1WY0035947 500 Dripping Rock Unit Well No 1 0.00 I-1WY0022071 411 Fort Bridger Sewer District 345 0.2 0.29 MWY0036153 411 Ft. Bridger Travel Stop 0 0.00 M-2WY0022373 411 Granger Wastewater Lagoon 0.00 M-2WY0020443 401 Green River Wastewater Lagoon 400 1.2 2.00 MWY0000027 401 Green River-Rock Springs JPB Water Plant 0.00 M-2WY0051152 401 James Hodder Feed Lot 0.00 I-2WY0054224 401 Jensen Disposal Facility - New Fork Discharge 50 0.00 IWY0054232 401 Jensen Disposal Facility - Sand Draw Discharge 0.00 I-2WY0030350 401 Jim Bridger Mine 1200 0.26 IWY0000051 411 Kemmerer Mine 1.00 IWY0020320 411 Kemmerer Wastewater Treatment 506 0.45 0.95 MWY0000116 411 Kemmerer Water Treatment Plant 262 0.1 0.11 MWY0032689 401 Labarge Project Field 0.00 I-1WY0032450 401 Labarge Project Shute Creek Site 0.00 I-1WY0022080 401 LaBarge Wastewater Lagoon <500 0.06 0.13 M-4BWY0028886 401 Leucite Hills Mine 0.00 I-2WY0020117 411 Lyman Wastewater Lagoon 547 0.3 0.68 MWY0021997 401 Marbleton Wastewater Lagoon 100 0.4 0.17 MWY0056847 500 Morgan Run Unit II 0.00 I--2WY0022896 401 Mountain View Wastewater Lagoon 390 0.26 0.42 MWY0020311 411 Naughton Plant 1300 3 12.50 I-5BWY0033111 411 Phosphate Slurry Pump Station 0.00 I-1WY0020656 401 Pinedale Wastewater Lagoons 166 0.875 0.61 M-4BWY0056499 401 Pioneer Cryogenic Gas Plant 1250 0.02 0.10 IWY0022357 401 Rock Springs WWTP 742 2.48 7.67 M-5WY0044199 401 Silver Eagle Refinery 0.00 I-2WY0027626 401 Skull Point Mine 0.00 I-1WY0033448 401 Skull Point Sulphur Terminal 0.00 I-1WY0023825 401 Stansbury Mine 0.00 I-2WY0021806 401 Superior Waste Water Lagoon <500 0.00 M-4BWY0032727 401 Table Rock Village Wastewater 0.00 M-1WY0052311 401 Wyoming Lodge 550 0.003 0.01 M

APPENDIX C
EPA NPDES Permits List

C-1
LEGEND
NPDES PERMITS
EXPLANATION CODES
COLORADO RIVER BASIN SALINITY CONTROL FORUM
Through December 31, 2010
NPDES permits are reviewed under two different criteria under Forum policy; these being municipal and industrial. In order for a permittee to
be in compliance under the municipal criteria, the increase in concentration between inflow and outflow can not be greater than 400 mg/L.
Forum industrial criteria requires that no industrial user discharges more than 1.00 ton/day. Under Forum policy there can be granted exceptions
to these limitations by the states. The following gives an explanation of the current status of the NPDES permits. Because at any given time
many of the approximate 600 permits identified in this list are being reviewed, reissued, and/or terminated, and new discharge permits are being
filed, this list must be considered as being subject to frequent change.
MUNICIPAL
(M) Municipal user in compliance with Forum policy.
(M-1) Permit has expired or been revoked. No discharge.
(M-2) Permittee did not discharge during the reporting period.
(M-3) Measurement of TDS is not currently required, but the
state and/or EPA plans to require measurements of both
inflow and outflow when the permit is reissued.
Measurements of inflow are not consistent with Forum policy;
(M-4A) Therefore, it is not known whether or not this municipal
user is in compliance.
(M-4B) However, since outflow concentration is less than 500
mg/L it is presumed that this permit is not in violation of
the ≤400 mg/L increase.
(M-5) Permittee is in violation of Forum policy in that there is an
increase in concentration of >400 mg/L over the source
waters.
(M-5A) The state is currently working to bring permittee into
compliance.
(M-6) This permit requires no discharge or discharge only under
rare and extreme hydrologic conditions. Thus, flow and
concentration measurements are not required.
(M-7) Insufficient data to know the status of this permit.
INDUSTRIAL
(I) Industrial user in compliance with Forum policy.
(I-A) Industrial user in compliance with the Forum’s salinity
offset policy.
(I-1) Permit has expired or been revoked. No discharge.
(I-2) Permittee did not discharge during the reporting period.
(I-3) Measurement of TDS is not currently required, but the
state and/or EPA plans to require measurements of both
volume and concentration of outflow when the permit is
reissued.
(I-4) Either concentration or volume of outflow are not
currently being reported, thus the permittee is in violation
of Forum policy. It is not known if the discharge is in
excess of the <1.00 ton/day requirement.
Permittee appears to be in violation of Forum policy in that
discharge of salts is >1.00 ton/day.
(I-5A) No provision has been made allowing this violation of
Forum policy.
(I-5B) Though discharge is >1.00 ton/day, in keeping with Forum
policy the permittee has demonstrated the salt reduction is
not practicable and the requirement has been waived.
(I-5C) The use of ground water under this permit is for
geothermal energy and only heat is extracted. The
intercepted salt and water are naturally tributary to the
Colorado River System and hence, this discharge does not
increase salt in the river. The permit is covered by the
Forum's policy on intercepted ground waters.
(I-5D) This permit is in compliance with the Forum’s policy for
fish hatcheries. The use of the water is a one-time pass
through, and the incremental increase in salinity is ≤ 100
mg/l.
(I-5E) This permit is for the interception and passage of ground
waters and thus is excepted under the Forum's policy on
intercepted ground waters .
(I-6) This permit requires no discharge or discharge only under
rare and extreme hydrologic conditions. Thus, flow and
concentration measurements are not required.
(I-7) Insufficient data to know the current status of this permit.

C-2
LEGEND (continued)
NPDES PERMITS
REACH DEMARCATIONS
COLORADO RIVER BASIN SALINITY CONTROL FORUM
In order to provide a better understanding of the location of the various NPDES permits and the geographical sequence in the Colorado River
System, each of the following NPDES permits is identified with a Colorado River reach number. The reach numbers have their origin in the old
CRSS river model. Though this model is no longer used, the reach numbers assist in understanding the general location of the permits. The
reaches are defined as:
100 Upper Main Stem from headwaters of Colorado River to Colorado River near Cameo
190 Taylor Park from headwaters of Gunnison River to above Blue Mesa Reservoir
200 Blue Mesa from above Blue Mesa Reservoir to below Blue Mesa Dam
210 Morrow Point from below Blue Mesa Dam to Crystal Reservoir
220 Lower Gunnison from Crystal Reservoir to confluence with Colorado River
300 Grand Valley from Colorado River near Cameo to confluence with Green River
310 Dolores River from headwaters of Dolores River to confluence with Colorado River
401 Fontenelle from headwaters of Green River to Green River near Green River, WY
411 Flaming Gorge from Green River near Green River, WY to confluence with White and Duchesne Rivers
500 Yampa River from headwaters of Yampa River to confluence with Green River
510 White River from headwaters of White River to confluence with Green River
600 Green River Green River from confluence with White and Duchesne Rivers to confluence with Colorado River
610 Duchesne River from headwaters of Duchesne River to confluence with Green River
700 Lake Powell Colorado River from confluence of with Green River to Lees Ferry
710 San Rafael River from headwaters of San Rafael River to confluence with Green River
801 Upper San Juan River from headwaters of San Juan River to San Juan near Bluff
802 Lower San Juan River from San Juan near Bluff to confluence with Lake Powell
900 Glen Canyon to Lake Mead Colorado River from Lees Ferry to backwaters of Lake Mead
905 Virgin River from headwaters of Virgin River to backwaters of Lake Mead
910 Lake Mead from backwaters of Lake Mead to Colorado River below Hoover Dam
920 Lake Mohave Colorado River from below Hoover Dam down to I-40 bridge
930 Lake Havasu Colorado River from I-40 bridge to below Parker Dam
940 Parker Dam to Imperial Dam Colorado River from below Parker Dam to above Imperial Dam
945 Imperial Dam Colorado River from above Imperial Dam to Gila and Yuma users

C-3
NPDES PERMIT# Salt Load
Tons/Day
Flow Rate AVG.(MGD)
Explanantion Code
EPA ADMINISTERED NPDES PERMITSColorado River Basin Salinity Control Forum
January 1, 2008 through December 31, 2010
REACH NAME of Discharging Facility TDS Conc. AVG.(Mg/L)
** Issued by a tribal entity with delegation of the NPDES program
CO0000086 HOTCHKISS NTL. FISH HATCHERYCO0022853 SOUTHERN UTE INDIAN TRIBE(E)CO0034398 USDINPS-MESA VERDE NAT PARK (E)CO0034622 USDINPS-MESA VERDE NAT PARK (E)CO0034665 FOUR CORNER MATERIALSCO0034959 IGNACIA PEAK WASTEWATER LAGOONCO0034967 SOUTHERN UTE WATER TRTMNT PLNTCO0034975 USNPS - Colorado National MonumentCO0048178 Southern Ute Utilities Division Raw WaterCO0048186 Southern Ute Bean PitCOG589201 TOWAOC WASTEWATER LAGOONCOG589202 WHITE MESA WASTEWATER LAGOONSCOG589203 TAWAOC WASTEWATER LAGOON 2
UT0000167 510 American Gilsonite Co. 2330 0.285 2.77 I-7UT0025259 510 American Gilsonite Co. 2710 0.02 0.23 IUT0024945 802 MK-Ferguson (Mexican Hat Umtra) I-1UT0025496 411 White Mesa Waste Water Lagoon M-7UT0023868 510 Ziegler Chemical and Mineral I-1
AZ0021415* 940 COLORADO RIVER JOINT VENTURE <400 1.2 MAZ0021920* 802 NTUA/MANY FARMS 0.07 M-6AZ0022471* 802 NTUA/KAIBETO 0.1 M-6AZ0022560* 900 BIA/KEAMS CANYON 0.03 M-6AZ0022802* 900 NTUA/ROUGH ROCK LAGOONS 0.007 M-6AZ0024619* 900 HOPI INDIAN NATION/ UPPER VILLAGE OF MOENKOPI WWTP M
NN0020133 803 Mountain States Petroleum I-1NN0020265** 802 NTUA/CHINLE <400 0.783 M-NN0020281** 802 NTUA/KAYENTA <400 0.9 MNN0020290** 900 NTUA/TUBA CITY <400 1.1 M-6NN0021555** 900 NTUA/WINDOW ROCK-FT.DEFIANCE <400 1.32 M-6NN0021610** 900 CAMERON TRADING POST 0.054 M-6NN0022179** 900 PEABODY WESTERN COAL COMPANY/BLACK MESA COMPLEX INN0022195** 900 NTUA/GANADO <400 0.4 MNN0024228** 900 NTUA/PINON WWTP MNN0030337** 900 BIA/LOW MOUNTAIN BOARDING SCHOOL <400 0.014 MNN0030339** BIA/LUKACHUKAI COMMUNITY SCHOOL M-6NN0030341** BIA/TORREON DAY SCHOOL M-6NN0110043** 802 BIA/NAZLINI BOARDING SCHOOL <400 0.013 MNN0110094** 801 BIA/TEEC NOS POS SCHOOL <400 0.08 MNN0110167** 900 BIA/HUNTERS POINT SCHOOL <400 0.014 MNN0110183** 900 BIA/SEBA DALKAI BOARDING SCHOOL <400 0.01 MNM0030520 801 Dulce, Village of 0.6 M-6NN0000019 801 APS Four Corners Power Plant I-7NN0028193 801 BHP Navajo Mine I-7NN0020869 801 BIA Crystal Boarding School 0.015 M-6NN0021016 801 BIA Lake Valley Boarding School 0.012 M-6NN0020800 801 BIA Nenahnezad Community School 0.024 M-6NN0020991 801 BIA Pueblo Pintado 0.016 M-6NN0020958 900 BIA Wingate School 0.1 M-6NN0029386 900 Chevron Mining, Inc. / McKinley Mine I-7NN0028584 801 Consolidation Coal Co Burnham Mine I-7NN0020621 801 NTUA Shiprock 1 M-6NN0030335 900 NTUA Navajo Townsite 0.32 M-6NN0030325 900 Ramah Navajo School Board - Pine Hill 0.035 M-6
* Permit issued to a federal agency or an Indian tribe and the responsibility of EPA

APPENDIX D
Colorado River Simulation System Model Description

D-1
COLORADO RIVER SIMULATION SYSTEM MODEL DESCRIPTION
The Colorado River Simulation System (CRSS) is the official long-term basin-wide
planning model used by Reclamation’s Upper Colorado and Lower Colorado Regions to
simulate future Colorado River system conditions. The model framework used for this
process is a commercial river modeling software called RiverWare™; a generalized river
basin modeling software package developed by the University of Colorado through a
cooperative arrangement with Reclamation, the Tennessee Valley Authority and the U.S.
Army Corps of Engineers.
CRSS was originally developed by Reclamation in the early 1970s and was implemented
in RiverWare™ in 1996. The model projects future river and reservoir conditions on a
monthly timestep over a period of decades into the future. CRSS has been used for most
major modeling studies on the Colorado River, including several National Environmental
Policy Act Environmental Impact Statements (EIS), most recently the Colorado River
Interim Guidelines for Lower Basin Shortages and Coordinated Operations for Lake
Powell and Lake Mead EIS. CRSS will be the primary modeling tool for system
projections in Reclamation’s Colorado River Basin Study under Water SMART.
There are numerous inputs to, and assumptions made by, CRSS with respect to future
conditions on the Colorado River. The input data for CRSS includes hydrologic inflows,
various physical process parameters such as the evaporation rates for each reservoir,
initial reservoir conditions, and the future diversion and depletion schedules for entities in
the Basin States and for Mexico. These future schedules are based on demand and
depletion projections prepared and submitted by the Basin States. The rules of operation
of the Colorado River mainstream reservoirs, including Lake Powell and Lake Mead, are
also provided as input to the model. These sets of operating rules describe how water is
released and delivered under various hydrologic conditions.
As the period of analysis increases, the uncertainty in these inputs and assumptions also
increases. Therefore, a large amount of uncertainty in the corresponding outputs is
expected. Consequently, CRSS is not used to predict future conditions, but rather to
project what might occur. CRSS is particularly useful in making a relative comparison
between hydrologic impacts from different operational alternatives by holding constant
most inputs, as well as other key modeling assumptions, so as to isolate the differences
due to each alternative. Also, sensitivity analyses that answer the question, “What is the
sensitivity of the output to a particular set of inputs or assumptions?” are commonly
performed.
Future conditions of the Colorado River system are most sensitive to assumptions with
respect to future inflows. Because it is impossible to predict the actual future inflows into
the system, a range of possible future inflows are analyzed and used to quantify the
probability of occurrences of particular events (e.g., higher or lower lake elevations). This
technique involves running multiple hydrologic sequences for each scenario or
operational alternative. These sequences can be derived from a number of techniques.
Reclamation has used techniques based on the historic observed flow record (1906-2007),

D-2
the paleo record derived from tree-rings (762-2005) and is currently working to develop
techniques that will use 112 downscaled Global Climate Model (GCM) projections based
on 16 unique GCMs.
The CRSS RiverWare™ model includes a salinity module to analyze salinity
concentration throughout the Colorado River Basin. The salinity model simulates the
effects of water development projects and the salinity control program (SCP) on future
salinity concentration levels in the Colorado River. The salinity control criteria are
purposely designed to be long-term and non-degradational goals, rather than exceedence
standards such as those used for industry or drinking water. Efforts of the SCP are
designed to meet the criteria by implementing, as needed, the most cost effective salinity
control projects. This ensures that the salinity control criteria will continue to be met in
the future, even with the salinity impacts produced by increasing Upper Basin depletions.
Salinity module inputs include salinity accompanying hydrologic inflows, initial reservoir
salinity concentrations and estimates of salt loading due to agricultural return flows.
Model results simulate annual average salinity concentrations at the numeric criteria
stations downstream of Hoover Dam and Parker Dam and at Imperial Dam and can be
used to analyze the probability of exceeding the numeric criteria in future years.
The salinity module within CRSS is intended for long-term (15 to 20 years) simulation
and it is highly sensitive to initial conditions during the first 10 to 12 years. The model
assumes salinity is a conservative water quality parameter, and reservoirs are modeled as
fully mixed systems.
Modeling Assumptions for the 2011 Triennial Review
The following lists major modeling assumptions in a bulleted format for the 2011
Triennial Review. These assumptions reflect the January 2011 Configuration of CRSS. Documents referenced in these assumptions include the Final Environmental Impact Statement
(Final EIS), Record of Decision (ROD) for Colorado River Interim Guidelines for Lower Basin
Shortages and the Coordinated Operations for Lake Powell and Lake Mead and Prairie and
Rajagopalan’s (2007) article entitled “A basin wide stochastic salinity model.” Refer to these
documents for additional detail regarding specific assumptions. All runs were performed using
the Colorado River Simulation System (CRSS) long-term planning model.
Key Assumptions Common to All Scenarios Updated Since the 2008 Triennial Review
Simulations performed from January 2011 through December 2030 at a monthly time step
Initial conditions for all reservoirs are 2010 end-of-calendar year (EOCY) actual values o Includes pool elevation and reservoir salt concentration
For modeling purposes, certain provisions (i.e., Shortage, Surplus, and Coordinated
Operations) of the Interim Guidelines as adopted in the ROD (Section XI.G.) were extended
4 years from 2026 through 2030
Future water demands for Upper Division water users are based on depletion projections
prepared by the Upper Division states in coordination with the Upper Colorado River
Commission (UCRC) dated December 2007
Intentionally Created Surplus (ICS)
o ICS creation and delivery schedules and initial ICS balances were updated in
December 2009 by the Lower Division states

D-3
o Rules for ICS activity remain unchanged from the ROD
Water Quality Improvement Project’s (WQIP) have been updated to reflect historic and
projected control levels based on the Salinity Control Forum Science Team efforts completed
January 2011
Description of 2011 Triennial Review Scenarios
1) Scenario 1
Salinity controls currently built or under construction BUT without additional
controls
1,205,125 tons of control in 2030
2) Scenario 2
Salinity controls currently built or under construction AND with Plan of
Implementation
1,850,000 tons of control in 2030
Other Assumptions Common to All Scenarios
1) Future hydrologic inflows are generated at 29 separate inflow points or nodes in the
Colorado River watershed using the Indexed Sequential Method (Final EIS, Chapter
4.2.5). This technique is applied to the 103-year (1906 through 2008) historical record of
calculated natural flows to produce 103 hydrologic inflow sequences or traces for each
scenario.
2) Future salinity concentrations are generated at 20 nodes in Colorado River watershed
using Reclamation’s nonparametric natural salt model. The natural salt model includes
annual (Upper Basin) and monthly (Lower Basin) regressions built with 1971-2008
natural flow and salt mass data. The natural salt model provides salt mass based on flows.
Salt concentrations are computed from flow and salt mass. Prairie and Rajagopalan
(2007) describes the methods used in the basinwide salinity modeling framework.
3) Salt loading values from agriculture are input as a constant tons per month. Variations in
salt mass resulting from variation in flow conditions (high and low) are not considered;
therefore, when computing natural salt we expect negative natural salt values.
4) Reservoirs upstream of Lake Powell are generally operated to meet monthly storage
targets or downstream demands (Final EIS, Appendix A).
5) Lake Mead flood control procedures are always in effect.
6) Except during flood control conditions, Lake Mead is operated to meet downstream
demands under the applicable water supply condition (Normal, Surplus, or Shortage).
7) If Lake Mead elevation falls below 1,000 feet, delivery to the Southern Nevada Water
Authority (SNWA) is reduced to zero for that month.
8) Lake Mohave and Lake Havasu are operated in accordance with their existing rule
curves.
9) Future water demands for Lower Division water users are based on depletion schedules
prepared by the Lower Division states for the Final EIS (Final EIS, Appendix D).
10) Future water deliveries to Mexico are made as follows:

D-4
a. CRSS accounts for the entire delivery to Mexico at the Northerly International
Boundary (NIB)
b. Mexico’s annual delivery schedule is set to 1,500 kaf
c. An additional 7 kaf1 is delivered at the NIB for a total annual delivery to Mexico
of 1,507 kaf
d. Mexico’s annual delivery schedule is set to 1,700 kaf during Flood Control
11) Brock Reservoir is assumed to operate every year and is assumed to conserve
approximately 90 percent of the historical average of non-storable flows from 1964
through 2008 (excluding flood years). This reduces the volume of non-storable flows
arriving at the NIB from 74 kaf to 7 kaf annually.
12) Bypass of return flows from the Wellton-Mohawk Irrigation and Drainage District to the
Cienega de Santa Clara in Mexico is assumed to be 109 kaf annually (historical average
from 1990 through 2008), and is not counted as part of the 1944 Treaty delivery to
Mexico.
13) Yuma Desalting Plant is assumed to not operate.
1 The estimated annual average volume of non-storable (excess) flows with the Brock Reservoir in
operation

APPENDIX E
Colorado River Salinity Damage Model

E-1
COLORADO RIVER SALINITY DAMAGE MODEL
The Salinity Damage Model estimates the quantitative damages that are incurred in the
metropolitan and agricultural areas in the Lower Colorado Basin that receive Colorado River
water. The model estimates the impacts from salinity levels greater than 500 TDS on household
water-using appliances, damages in the commercial sector, industrial sector, water utilities, and
agricultural crop revenues. It also estimates the additional costs related to meeting statewide
water quality standards for groundwater and recycled water use (Metropolitan Water District of
Southern California (MWD) service area).
The model only estimates damages that can be quantified at the present time. For example, the
model does not account for on-farm management costs related to high salinity levels or the costs
associated with the replacement of low-tolerant crops to high-tolerant crops in the Lower Basin
agricultural areas. There has been some initial investigation on the impact of high salinity levels
on golf course turf in the southwestern portion of the United States. Currently, Reclamation is in
the process of signing a memorandum of understanding with MWD to update and enhance the
MWD portion of the salinity damage model. This cooperative effort hopes to identify other
salinity damages that are not currently identified with the present model. Other areas for future
research could be identifying the costs or damages due to salinity contribution to groundwater
areas in the southwest and the management costs associated with brine removal.
The salinity damage model was updated from 2005 price levels to 2008 price levels. Population
projections were updated also for the Central Arizona metropolitan areas, the Las Vegas/Clark
County area, and the communities along the lower portion of the Colorado River in Nevada,
Arizona and California.
The Colorado River Salinity Damage Model consists of a number of EXCEL spreadsheets. The
initial worksheet displays some overall input data and the summary quantifiable dollar damages
by economic sector and primary agricultural and metropolitan areas that receive Colorado River
water.
I. Summary Salinity Input and Dollar Damage Output Sheet
The upper portion of this spreadsheet contains the salinity levels of the lower Colorado River
that are measured at Hoover, Parker and Imperial dams. This data can come from actual
sampling at these sites, or projected values can be obtained from the CRSS hydrologic salinity
model. Also, this portion of the spreadsheet contains input data for present valuing damages that
may occur in the future. The present value data consists of the latest Reclamation planning
interest rate, base dollar year, and the projected year the damages are to be calculated.
The remaining portion of this spreadsheet displays the salinity levels and total damages (based
on a 500 TDS salinity baseline) for each primary agricultural and metropolitan area that receives
Colorado River water. There are six economic sectors: agriculture, households, commercial,
water utilities, industrial and policy related (groundwater and recycled water requirements). The
agricultural areas currently in the model are the Central Arizona Project, Arizona; La Paz
County, Arizona; Yuma County, Arizona; Imperial County, California; Riverside County (non

E-2
MWD), California; and the MWD service area (covers all or portions of six southern California
counties). The metropolitan areas currently in the model are: Maricopa County/Phoenix; Pima
County/Tucson; Clark County/Las Vegas; the MWD service area; and lower Colorado River
communities. Data is being incorporated into the model to include the Yuma, Arizona
metropolitan area.
II. Summary Damage Calculation Sheet
In this spreadsheet, the dollar damages from each of the sectors and areas are displayed for the
baseline salinity level (500 TDS) and the current or projected salinity levels. It is a rather large
spreadsheet because it is linked to all the calculation spreadsheets. For example, the household
damages are listed by metropolitan area and by household item for the baseline and current or
projected salinity levels. Displaying the damage estimates in this manner aids in identifying
particular household items or crops that are impacted by salinity damage functions differently or
where salinity levels are higher in a particular area. The differences in dollar damages between
the 500 TDS salinity level and the current or projected salinity level are summed by sector and
by Lower Basin areas. This procedure estimates the current or projected damages which are
greater than the damages at the 500 TDS level. To estimate the benefits of the Colorado River
Salinity Control Program, a series of model runs are made based on the concept of “with versus
without” additional salinity control projects being implemented in the Program. This application
of the model uses salinity levels provided by the CRSS salinity model. The procedure is to
estimate the difference in dollar damages from the 500 TDS baseline and TDS levels based on no
additional salinity control projects and then estimate the difference in dollar damages based on
TDS levels which include additional salinity control projects. With the inclusion of additional
projects, salinity levels are less than the “without project” TDS levels and this results in lower
dollar damages in the Lower Basin areas. The difference in dollar damages based on the “with
versus without” project conditions are identified as the avoided damages, or simply the benefits
of the Salinity Control Program with the implementation of the projects.
To convert the avoided damages (benefits) to a mg/L or tons of salt removed basis, the damages
by area are summed for each numeric criteria diversion site, i.e., Hoover Dam, Parker Dam and
Imperial Dam. For Hoover Dam, the difference in total dollar damages for the Las Vegas/Clark
County area are converted to a mg/L basis using the difference in TDS levels for Hoover. This
approach is done for the areas that receive Colorado River water at Parker Dam and at Imperial
Dam and then summed to a total avoided damage per mg/L for the Lower Basin average. To
convert the avoided dollar damages per mg/L to a per ton of salt removal basis, a conversion
factor in tons per mg/L is used for each diversion point to calculate the avoided damages per ton
of salt. The conversion factors for the diversion points are 13,100 tons/mg/L at Hoover, 9,900
tons/mg/L at Parker, and 8,300 tons/mg/L at Imperial. Again this is done for each diversion
point and then summed to a total benefit value per ton of salt removed from the Lower Colorado
Basin area.
III. Additional Input Data Sheets
The next two spreadsheets contain input data. The first spreadsheet contains data to calculate
weighted average salinity levels based on different water sources with differing salinity levels for

E-3
the MWD service area and the Central Arizona area. The blending of water sources has a
significant impact on the overall water quality that is used by residences, commerce, and industry
as well as meeting groundwater and recycled water requirements. The second spreadsheet
contains population and number of households projections for each of the metropolitan areas.
This data contains the most current and projected population estimates. The population and
household data is primarily used in the calculation of household and commercial damages.
IV. Damage Calculation Spreadsheets
The next six spreadsheets are linked to the other input spreadsheets to actually calculate the
salinity damages for each sector and area covered by the model. Salinity crop yield or useful life
functions are contained in these spreadsheets, which tie salinity levels to crop yields or product
use. Below is a brief explanation of each damage spreadsheet:
A. Household Damage Spreadsheet
This spreadsheet consists of three parts. The first part (Part A) consists of the household
items per unit average costs (e.g. water heater cost plus installation), number of units per
household, and the salinity-useful life functions for each household item considered in
the model. There are ten household items that are included in the model. These are:
galvanized water pipe systems (older houses), water heaters, faucets, garbage disposals,
clothes washers, dishwashers, bottled water, water softeners, water treatment systems,
and soaps and detergents. Unit cost prices for each household item were obtained from
sources on Internet websites such as Sears, Home Depot, Lowes or supermarkets in the
local area. The number of units per household was obtained from the latest Census data
for each metropolitan area considered in the model. Salinity useful life functions were
developed to estimate the average life of a household appliance based on a given salinity
level. Most of the useful life functions were taken from previous salinity research and can
be found in the Milliken-Chapman study (1988). MWD had contracted for additional
research of bottled water use, water softeners, and water treatment systems and found a
relationship between these household items and salinity.
The second part (Part B) of this spreadsheet is the calculation of the useful life and
average household costs based on a given salinity level that has been calculated in the
input spreadsheet for weighted average salinity values of each metropolitan area in the
model and the salinity functions in Part A.
The third part (Part C) of this spreadsheet takes the information from the other sections of
the spreadsheet and calculates the total annual cost per household item for each of the
areas considered by the model. From the input spreadsheet on population and number of
households, the number of households per area is multiplied by the average cost per
household item and then divided by the average life of the item or percentage of
household use for that item at a given salinity level. The costs are summed for each
metropolitan area and are linked to the summary damage spreadsheet.

E-4
B. Commercial Damage Spreadsheet
This spreadsheet has been changed from the original Milliken-Chapman study model
when commercial damages were calculated as a percentage of household damages and
added to the total household damage estimate. MWD and their contractor, Bookman and
Edmonson, did some research based on the relationship between salinity and water use
for commercial and institutional activities in their service area. MWD was able to collect
commercial water use for particular uses such as sanitary, cooling, irrigation, kitchen, and
other uses. Based on the type of commercial water use, salinity cost functions were
developed. From MWD water resource management plans, projected commercial water
use was used to calculate salinity damages in future years. From their research on
household and commercial salinity costs, it was estimated that the percentage of
commercial salinity related damages to household damages is approximately 26 percent.
For the Phoenix area, a similar methodology was used to estimate commercial salinity
damages. The advantage of the commercial water use methodology is that it ties salinity
damages to actual commercial water use for a given area. Due to the lack of available
data for types of commercial water use in the other metropolitan areas, the 26 percent of
household damages is used as an estimate for commercial damages in those areas.
Ongoing research is attempting to better estimate the commercial related salinity
damages for the Las Vegas/Clark County area.
C. Industrial Damage Spreadsheet
From research done for the MWD Salinity Management Study, salinity damages can be
calculated for industrial water use. Salinity damage functions were developed based on
three major types of industrial water use: process water, boiler feed water, and cooling
water. MWD was able to estimate the amount of water used for these industrial types of
production. Related salinity costs are on a dollar per acre-foot per mg/L basis. A change
in salinity from the 500 TDS baseline would show a change in salinity costs as it relates
to industrial water use. This methodology was applied to the Phoenix and Tucson
metropolitan areas to estimate industry salinity costs.
D. Utility Damage Spreadsheet
The MWD research estimated the per capita costs for capital investments in replacement
of water production and distribution facilities. The salinity useful life functions that were
developed for the Milliken-Chapman study model are used in this spreadsheet. The
methodology is similar to the household damage spreadsheet. The per capita costs for
water production and distribution costs are divided by the average life of the facilities,
based on the given salinity level, and then multiplied by the metropolitan population for
time period.
E. Agricultural Damage Spreadsheet
This spreadsheet estimates the change in gross revenue due to a change in crop yields of
salt sensitive crops that receive Colorado River water in the Lower Basin. The

E-5
agricultural areas considered by the model are irrigated lands in the Central Arizona
Project; La Paz County, Arizona; Yuma County, Arizona; Imperial County, California;
Riverside County (non MWD), California; and MWD service area irrigated lands. This
spreadsheet consists of three parts in calculating the salinity costs associated with crop
yields.
The first part consists of the salinity-crop yield functions that were derived from a 1998
Reclamation study, Final Report, Crop Salinity Estimation Procedures. For the MWD,
ten salinity-crop yield functions were used to estimate changes in crop yield due to
changing salinity conditions of irrigation water in the service area. For the remaining
irrigated areas in the Lower Basin, fourteen salinity-crop yield functions were selected
due to their lower tolerances to salinity.
The next part of the spreadsheet consists of the irrigated crop acreages and crop prices.
These were updated to year 2007 prices and acreages for the Central Arizona areas and
Imperial County and Riverside County outside of the MWD service area.
The final part takes the above data and estimates the gross crop revenue based on the crop
yield per acre at a given salinity level and the price per unit per acre times the total
irrigated acres for that crop. This method is done to estimate the gross crop revenue at the
500 TDS baseline salinity level and the given salinity level to estimate the salinity
damages.
Research data from the Central Arizona Salinity Study (CASS) was collected for CAP
irrigated acres in the Phoenix area to identify for management costs associated with
flushing out salts that build up in the soil. This would reduce the impact on yield but
would add to the costs of salinity due to the additional purchase of water. It is hoped that
more research can be conducted to identify these types of costs in other agricultural areas
in the Lower Basin.
F. Policy Related Spreadsheet.
This spreadsheet is based on research conducted by MWD for their Salinity Management
Study (June, 1999). One of the purposes of the MWD study was to conduct extensive
research on the costs associated to meet groundwater and recycling requirements within
their service area. The model calculates the costs of removing salts to maintain water
quality requirements for groundwater and recycled water that is used extensively in their
service area. MWD was able to estimate the amount of water that drains into the
groundwater system and the amount that is used for recycled water purposes. To meet
regional water quality standards for these types of water sources, MWD was able to
develop salinity cost functions (costs to desalt these sources of water) that could estimate
the costs at given salinity levels. As of now, this methodology has not been extended to
other metropolitan areas in the model.

For additional information please contact:
Don A. Barnett
Executive Director
Colorado River Basin Salinity Control Forum
106 West 500 South, Suite 101
Bountiful, Utah 84010-6203
(801) 292-4663
Timothy J. Henley
Work Group Chairman
Colorado River Basin Salinity Control Forum
7450 E. Norwood St
Mesa, Arizona 85007
(602) 679-0004