Salinity Trends in the Upper Colorado River Basin Upstream ... · Salinity Trends in the Upper...
30
U.S. Department of the Interior U.S. Geological Survey Scientific Investigations Report 2007–5288 Prepared in cooperation with the U.S. Bureau of Reclamation Salinity Trends in the Upper Colorado River Basin Upstream from the Grand Valley Salinity Control Unit, Colorado, 1986–2003
-
Upload
truongkhuong -
Category
Documents
-
view
231 -
download
0
Transcript of Salinity Trends in the Upper Colorado River Basin Upstream ... · Salinity Trends in the Upper...

U.S. Department of the InteriorU.S. Geological Survey
Scientific Investigations Report 2007–5288
Prepared in cooperation with theU.S. Bureau of Reclamation
Salinity Trends in the Upper Colorado River BasinUpstream from the Grand Valley Salinity ControlUnit, Colorado, 1986–2003

Cover.—Photograph of the Grand Mesa (background), Mancos Shale Hills, and agricultural land (foreground) near Whitewater, Colorado, 2004 (photograph taken by Cory Williams, U.S. Geological Survey, Denver, Colorado).
Background photograph: Cactus Valley near Silt, Colorado, 2004 (photograph taken by Cory Williams, U.S. Geological Survey, Denver, Colorado).

Salinity Trends in the Upper Colorado River Basin Upstream from the Grand Valley Salinity Control Unit, Colorado, 1986–2003
By Kenneth J. Leib and Nancy J. Bauch
Prepared in cooperation with U.S. Bureau of Reclamation
Scientific Investigations Report 2007–5288
U.S. Department of the InteriorU.S. Geological Survey

U.S. Department of the InteriorDIRK KEMPTHORNE, Secretary
U.S. Geological SurveyMark D. Myers, Director
U.S. Geological Survey, Reston, Virginia: 2008
For product and ordering information: World Wide Web: http://www.usgs.gov/pubprod Telephone: 1-888-ASK-USGS
For more information on the USGS—the Federal source for science about the Earth, its natural and living resources, natural hazards, and the environment: World Wide Web: http://www.usgs.gov Telephone: 1-888-ASK-USGS
Any use of trade, product, or firm names is for descriptive purposes only and does not imply endorsement by the U.S. Government.
Although this report is in the public domain, permission must be secured from the individual copyright owners to reproduce any copyrighted materials contained within this report.
Suggested citation:Leib, K.J., and Bauch, N.J., 2008, Salinity trends in the upper Colorado river Basin Upstream from the Grand Valley Salinity Control Unit, Colorado, 1986–2003: U.S. Geological Survey Scientific Investigations Report 2007–5288, 21 p.

iii
ContentsAbstract ...........................................................................................................................................................1Introduction.....................................................................................................................................................2
Purpose and Scope ..............................................................................................................................2Description of Regions Upstream from the Grand Valley Salinity Control Unit ..........................4Summary of Previous Studies .............................................................................................................6
Study Methods ...............................................................................................................................................7Annual Streamflow, Salinity Load, and Salinity Concentration, 1986–2003 .........................................9
Streamflow .............................................................................................................................................9Salinity Load...........................................................................................................................................9Salinity Concentration ........................................................................................................................12
Salinity Trends in the Upper Colorado River Basin Upstream from the Grand Valley Salinity Control Unit ......................................................................................................................................12
Temporal Trends in Annual Flow-Adjusted Salinity Loads by Region ........................................12Temporal Trends in Salinity Concentrations, Selected Individual Ion Concentrations, and
Streamflow at U.S. Geological Survey Streamflow-Gaging Station CAMEO ..............16Factors Potentially Affecting Trends in Annual Salinity Loads in the Colorado River Upstream
from the Grand Valley Salinity Control Unit ................................................................................16Channel Evolution ...............................................................................................................................17Ground-Water Inflows .......................................................................................................................17Land-Use Changes..............................................................................................................................18
Summary and Conclusions .........................................................................................................................18References Cited..........................................................................................................................................20
Figures 1–2. Maps showing: 1. Location of study area and streamflow-gaging stations .......................................................3 2. Region locations upstream from the Grand Valley Salinity Control Unit .............................5 3–4. Graphs showing: 3. Annual streamflow volume at U.S. Geological Survey streamflow-gaging
station 09095500, Colorado River at Cameo (CAMEO), for water years 1986 through 2003 ................................................................................................................................12
4. LOWESS smooth curves of flow-adjusted salinity load at streamflow-gaging stations for water years 1986 through 2003 ...........................................................................................15
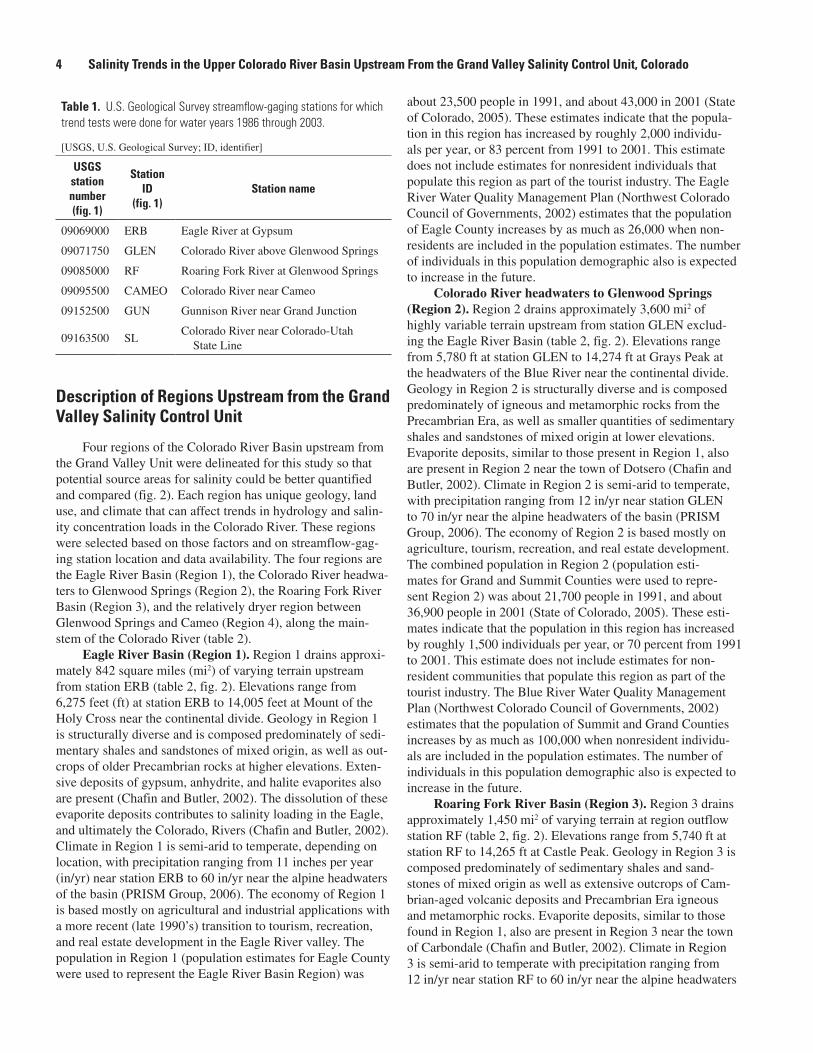
Tables 1. U.S. Geological Survey streamflow-gaging stations for which trend tests were done for
water years 1986 through 2003. ..................................................................................................4 2. Defined regions upstream from the Grand Valley Salinity Control Unit. .............................6 3. Summary of annual streamflow data, and salinity data estimated by SLOAD program
for each streamflow-gaging station. .......................................................................................10

iv
4. Monotonic trends in annual flow-adjusted salinity load for streamflow-gaging stations and regions upstream from the Grand Valley Salinity Control Unit, for various periods ............................................................................................................................14
5. Monotonic trends in annual streamflow and flow-adjusted salinity and selected major ion concentrations, for streamflow-gaging station Cameo 09095500 (CAMEO), water years 1986 through 2003 ............................................................................................................16
Conversion Factors, Datums, and AbbreviationsMultiply By To obtain
Length
inch (in.) 2.54 centimeter (cm)
inch (in.) 25.4 millimeter (mm)
foot (ft) 0.3048 meter (m)
mile (mi) 1.609 kilometer (km)
mile, nautical (nmi) 1.852 kilometer (km)
yard (yd) 0.9144 meter (m)
Area
acre 4,047 square meter (m2)
acre 0.004047 square kilometer (km2)
square mile (mi2) 2.590 square kilometer (km2)
Volume
acre-foot (acre-ft) 1,233 cubic meter (m3)
Flow rate
cubic foot per second (ft3/s) 0.02832 cubic meter per second (m3/s)
Mass
Tons (metric) 1,000 kilograms (kg)
Temperature in degrees Celsius (°C) may be converted to degrees Fahrenheit (°F) as follows:
°F=(1.8×°C)+32
Temperature in degrees Fahrenheit (°F) may be converted to degrees Celsius (°C) as follows:
°C=(°F-32)/1.8
Horizontal coordinate information is referenced to the North American Datum of 1983 (NAD 83).
Vertical coordinate information is referenced to the National Geodetic Vertical Datum of 1929 (NGVD 29).
Elevation, as used in this report, refers to distance above the vertical datum.
Specific conductance is given in microsiemens per centimeter at 25 degrees Celsius (µS/cm at 25°C).
Concentrations of chemical constituents in water are given in milligrams per liter (mg/L).
Water year is defined in this report as the surface water supply for the 12-month period October 1 through September 30.

AbstractIn 1974, the Colorado River Basin Salinity Control Act
was passed into law. This law was enacted to address concerns regarding the salinity content of the Colorado River. The law authorized various construction projects in selected areas or ‘units’ of the Colorado River Basin intended to reduce the salinity load in the Colorado River. One such area was the Grand Valley Salinity Control Unit in western Colorado. The U. S. Geological Survey has done extensive studies and research in the Grand Valley Salinity Control Unit that provide information to aid the U.S. Bureau of Reclamation and the Natural Resources Conservation Service in determining where salinity-control work may provide the best results, and to what extent salinity-control work was effective in reducing salinity concentrations and loads in the Colorado River. Previous stud-ies have indicated that salinity concentrations and loads have been decreasing downstream from the Grand Valley Salinity Control Unit, and that the decreases are likely the result of salinity control work in these areas. Several of these reports; however, also document decreasing salinity loads upstream from the Grand Valley Salinity Control Unit. This finding was important because only a small amount of salinity-control work was being done in areas upstream from the Grand Valley Salinity Control Unit at the time the findings were reported (late 1990’s). As a result of those previous findings, the U.S. Bureau of Reclamation entered into a cooperative agreement with the U.S. Geological Survey to investigate salinity trends in selected areas bracketing the Grand Valley Salinity Control Unit and regions upstream from the Grand Valley Salinity Control Unit.
The results of the study indicate that salinity loads were decreasing upstream from the Grand Valley Salinity Control Unit from 1986 through 2003, but the rates of decrease have slowed during the last 10 years. The average rate of decrease in salinity load upstream from the Grand Valley Salinity Control Unit was 10,700 tons/year. This accounts for approxi-mately 27 percent of the decrease observed downstream from the Grand Valley Salinity Control Unit. Salinity loads were decreasing at the fastest rate (6,950 tons/year) in Region 4,
which drains an area between the Colorado River at Cameo, Colorado (station CAMEO) and Colorado River above Glenwood Springs, Colorado (station GLEN) streamflow-gaging stations.
Trends in salinity concentration and streamflow were tested at station CAMEO to determine if salinity concen-tration, streamflow, or both are controlling salinity loads upstream from the Grand Valley Salinity Control Unit. Trend tests of individual ion concentrations were included as poten-tial indicators of what sources (based on mineral composi-tion) may be controlling trends in the upper Colorado. No significant trend was detected for streamflow from 1986 to 2003 at station CAMEO; however, a significant downward trend was detected for salinity concentration. The trend slope indicates that salinity concentration is decreasing at a median rate of about 3.54 milligrams per liter per year. Five major ions (calcium, magnesium, sodium, sulfate, and chloride) were tested for trends. The results indicate that processes within source areas with rock and soil types (or other unidentified sources) bearing calcium, sodium, and sulfate had the largest effect on the downward trend in salinity load upstream from station CAMEO.
Downward trends in salinity load resulting from ground-water sources and/or land-use change were thought to be possible reasons for the observed decreases in salinity loads; however, the cause or causes of the decreasing salinity loads are not fully understood. A reduction in the amount of ground-water percolation from Region 4 (resulting from work done through Federal irrigation system improvement programs as well as privately funded irrigation system improvements) has helped reduce annual salinity load from Region 4 by approxi-mately 7,400 tons. This amount is equal to about 5.9 percent of the total decrease (125,000 tons, or about 6,950 tons/year) estimated to have occurred in Region 4 during water years 1986 through 2003. A geographic information system was used to quantify the change in the amount of irrigated land upstream from the Grand Valley Salinity Control Unit from 1993 through 2000. These data indicated that the amount of irrigated land did not change substantially, thus indicating that the downward trends in salinity load did not result from land-use change.
Salinity Trends in the Upper Colorado River Basin Upstream From the Grand Valley Salinity Control Unit, Colorado, 1986–2003
By Kenneth J. Leib and Nancy Bauch

IntroductionSalinity is generally defined as concentration of dissolved
mineral salts or dissolved solids in water. Elevated concentra-tions of salinity can cause numerous issues for water users including soil dispersion, taste and odor, costly desalinization, and corrosion of infrastructures that convey irrigation and potable water supplies. The Colorado River Basin Salinity Control Act of June 24, 1974 (Public Law 93-320) authorized the construction of the Grand Valley Salinity Control Unit (herein after referred to as the Grand Valley Unit) Salin-ity Control Project by the U. S. Department of the Interior. Oversight of the project was delegated to the U.S. Bureau of Reclamation (USBR). Public Law 93-320 also directed the Secretary of the U.S. Department of the Interior to cooperate with the Secretary of U.S. Department of Agriculture in the implementation of on-farm salinity control work.
The Grand Valley Unit includes approximately 63,000 irrigated acres draining to the Colorado River between the historical town of Cameo to the east, and the town of Mack near the Colorado-Utah State line (fig. 1). The U.S. Geological Survey (USGS) has done extensive studies and research in the Grand Valley Unit that provide information to aid the USBR and Natural Resources Conservation Service (NRCS) in determining where salinity-control work may provide the best results, and to what extent salinity-control work was effective in reducing salinity loads in the Colorado River. Butler (1998) found that salinity concentrations and loads decreased in sev-eral washes and arroyos draining to the Colorado River after several sections of primary canals and laterals in the Grand Valley Unit were lined or put into pipe. Butler (1996) reported that a downward trend in salinity load occurred downstream from the Grand Valley Unit at the USGS streamflow-gaging station near the Colorado-Utah state line (station SL, fig. 1). However, Butler (1996) and Bauch and Spahr (1998) docu-mented that salinity loads in the Colorado River at stations upstream from the Grand Valley Unit were decreasing at simi-lar rates compared to areas downstream from the Grand Valley Unit. This finding was important because only a small amount of salinity-control work was being done in areas upstream of the Grand Valley Unit at the time the findings were reported.
As a result of this finding, the USBR entered into a coop-erative agreement with the USGS to investigate salinity trends in selected areas bracketing the Grand Valley Unit and regions upstream from the Grand Valley Unit. An assessment of recent salinity trends is useful to the USBR, and to land manag-ers in general, because additional decreases in salinity from areas upstream from the Grand Valley Unit could amount to substantial salinity reduction with time and decrease the need for future salinity-control projects. The specific objectives of this study are to:
report annual streamflow and salinity concentrations •and loads for select stations near the Grand Valley Unit, and at stations representing regions upstream from the Grand Valley Unit;
determine trends in annual salinity loads for stations •near the Grand Valley Unit and at stations representing regions upstream from the Grand Valley Unit;
determine trends in annual streamflow, salinity concen-•trations, and selected ions for selected stations repre-senting regions upstream from the Grand Valley Unit;
characterize streamflow and salinity trends from 1986 •to 2003 and compare the results to findings from previ-ous studies; and
discuss the possible factors affecting salinity trends •in the Colorado River upstream from the Grand Valley Unit.
Purpose and Scope
This report presents results of analysis of data for trends in salinity concentrations, loads, and selected major ions at selected USGS streamflow-gaging stations (herein after referred to as stations) near the Grand Valley Unit and at stations representing four regions upstream from the Grand Valley Unit (these regions are described in the following section). The trend results for each station are reported and are used to identify and evaluate those regions that have had the largest changes in salinity load. Trends in streamflow are also discussed.
Annual salinity loads were computed using available data for water years 1986 through 2003 for six USGS streamflow-gaging stations (fig. 1, table 1). Salinity load (often referred to as ‘total-dissolved solids’ load) at station CAMEO represents one of two main inflow loads to the Grand Valley Unit. The other main influx of salinity load to the Grand Valley Unit is measured at station GUN, which is located near the mouth of the Gunnison River Basin. Station GUN is included in this study to aid in calculating the part of the salinity-load trend that the Grand Valley Unit accounts for at station SL (Grand Valley Unit part of trend = SL – (CAMEO + GUN)), which is the outflow site for the Grand Valley Unit. Stations GLEN and RF are included in this study to represent the part of the trend in salinity load (if detected) at station CAMEO that can be apportioned to the headwaters region of the Colorado River and the Roaring Fork River Basin, respectively. Station ERB is included in this study to represent the part of the trend in salinity load (if detected) that can be apportioned to the Eagle River Basin.
Monotonic trend analyses were done on annual stream-flow and salinity concentrations and loads for station CAMEO. Monotonic trend analyses were done on annual salinity loads for the remainder of the stations listed in table 1. Trend analysis was done for water years 1986 through 2003 for all stations. For purposes of consistency, the begin-ning of the trend analysis time period is the same as that reported in previous studies by Butler (1996) and Bauch and Spahr (1998).
2 Salinity Trends in the Upper Colorado River Basin Upstream From the Grand Valley Salinity Control Unit, Colorado

Figu
re 1
. Lo
catio
n of
stu
dy a
rea
and
stre
amflo
w-g
agin
g st
atio
ns.
Introduction 3
Col
orad
o
Gun
niso
n
River
East
Cre
ek
Cre
ekR
oan
Pla
teau
Cre
ek
Parachute
Cre
ek
Mamm
Cre
ek
RifleCreek
Col
orad
o
Creek
Rive
r
River
Eagl
e West Brush
Gypsu
mRo
arin
gFork
Cre
ek
River
Fry
ing
Pan
Riv
er
CrystalRiver
Cre
ek
Eas
tN
orth
Rive
r
Rio
Bla
nco
Cou
nty
Gar
fiel
d C
ount
y
Gar
fiel
d C
ount
yM
esa
Cou
nty
Delta CountyGunnison County
Garfield CountyEagle County
Eag
le C
ount
yPi
tkin
Cou
nty Lak
e C
ount
yC
haff
ee C
ount
y
Mes
a C
ount
y
Del
ta C
ount
y
Den
ver
C O
L O
R A
D O
Ark
ansa
sR
iver
Riv
er
Col
orad
o
River
Pla
tte
South
Inde
x m
ap
0916
3500
(SL)
0916
3500
(SL)
0915
2500
(GUN
)
0909
5500
(CAM
EO)
0908
5000
(RF)
0906
9000
(ERB
)
0907
1750
(GLE
N)
De
Beq
ue
Gra
nd
Junc
tion
Gra
nd
Junc
tion
Col
lbra
n
Rif
leG
lenw
ood
Spri
ngs
Car
bond
ale
Gyp
sum
UTAHCOLORADO M
ack
Cam
eo
Del
ta
Gra
nd V
alley
Uni
t
Silt
Bas
alt
Eag
le
109°
30’
108°
107°
30'
106°
30'
39°
39°3
0'
EX
PL
AN
AT
ION
Salin
ity
Con
trol
Uni
t
U.S
. Geo
logi
cal S
urve
y st
ream
flow
-gag
ing
sta
tion
and
num
ber.
Ide
ntif
ier
is in
p
aren
thes
es (
)
030
45 M
ILES
15
030
45 K
ILOM
ETER
S15
Low
er G
unni
son
Uni
t
Base
map
from
Col
orad
o De
partm
ent o
f Tra
nspo
rtatio
n di
gita
l dat
a, 1
983
Univ
ersa
l Tra
nsve
rse
Mer
cato
r Pro
ject
ion,
Zone
13
Horiz
onta
l coo
rdin
ate
info
rmat
ion
is re
fere
nced
to th
eN
orth
Am
eric
an D
atum
of 1
983
(NAD
83)
Enla
rged
area
Description of Regions Upstream from the Grand Valley Salinity Control Unit
Four regions of the Colorado River Basin upstream from the Grand Valley Unit were delineated for this study so that potential source areas for salinity could be better quantified and compared (fig. 2). Each region has unique geology, land use, and climate that can affect trends in hydrology and salin-ity concentration loads in the Colorado River. These regions were selected based on those factors and on streamflow-gag-ing station location and data availability. The four regions are the Eagle River Basin (Region 1), the Colorado River headwa-ters to Glenwood Springs (Region 2), the Roaring Fork River Basin (Region 3), and the relatively dryer region between Glenwood Springs and Cameo (Region 4), along the main-stem of the Colorado River (table 2).
Eagle River Basin (Region 1). Region 1 drains approxi-mately 842 square miles (mi2) of varying terrain upstream from station ERB (table 2, fig. 2). Elevations range from 6,275 feet (ft) at station ERB to 14,005 feet at Mount of the Holy Cross near the continental divide. Geology in Region 1 is structurally diverse and is composed predominately of sedi-mentary shales and sandstones of mixed origin, as well as out-crops of older Precambrian rocks at higher elevations. Exten-sive deposits of gypsum, anhydrite, and halite evaporites also are present (Chafin and Butler, 2002). The dissolution of these evaporite deposits contributes to salinity loading in the Eagle, and ultimately the Colorado, Rivers (Chafin and Butler, 2002). Climate in Region 1 is semi-arid to temperate, depending on location, with precipitation ranging from 11 inches per year (in/yr) near station ERB to 60 in/yr near the alpine headwaters of the basin (PRISM Group, 2006). The economy of Region 1 is based mostly on agricultural and industrial applications with a more recent (late 1990’s) transition to tourism, recreation, and real estate development in the Eagle River valley. The population in Region 1 (population estimates for Eagle County were used to represent the Eagle River Basin Region) was
about 23,500 people in 1991, and about 43,000 in 2001 (State of Colorado, 2005). These estimates indicate that the popula-tion in this region has increased by roughly 2,000 individu-als per year, or 83 percent from 1991 to 2001. This estimate does not include estimates for nonresident individuals that populate this region as part of the tourist industry. The Eagle River Water Quality Management Plan (Northwest Colorado Council of Governments, 2002) estimates that the population of Eagle County increases by as much as 26,000 when non-residents are included in the population estimates. The number of individuals in this population demographic also is expected to increase in the future.
Colorado River headwaters to Glenwood Springs (Region 2). Region 2 drains approximately 3,600 mi2 of highly variable terrain upstream from station GLEN exclud-ing the Eagle River Basin (table 2, fig. 2). Elevations range from 5,780 ft at station GLEN to 14,274 ft at Grays Peak at the headwaters of the Blue River near the continental divide. Geology in Region 2 is structurally diverse and is composed predominately of igneous and metamorphic rocks from the Precambrian Era, as well as smaller quantities of sedimentary shales and sandstones of mixed origin at lower elevations. Evaporite deposits, similar to those present in Region 1, also are present in Region 2 near the town of Dotsero (Chafin and Butler, 2002). Climate in Region 2 is semi-arid to temperate, with precipitation ranging from 12 in/yr near station GLEN to 70 in/yr near the alpine headwaters of the basin (PRISM Group, 2006). The economy of Region 2 is based mostly on agriculture, tourism, recreation, and real estate development. The combined population in Region 2 (population esti-mates for Grand and Summit Counties were used to repre-sent Region 2) was about 21,700 people in 1991, and about 36,900 people in 2001 (State of Colorado, 2005). These esti-mates indicate that the population in this region has increased by roughly 1,500 individuals per year, or 70 percent from 1991 to 2001. This estimate does not include estimates for non-resident communities that populate this region as part of the tourist industry. The Blue River Water Quality Management Plan (Northwest Colorado Council of Governments, 2002) estimates that the population of Summit and Grand Counties increases by as much as 100,000 when nonresident individu-als are included in the population estimates. The number of individuals in this population demographic also is expected to increase in the future.
Roaring Fork River Basin (Region 3). Region 3 drains approximately 1,450 mi2 of varying terrain at region outflow station RF (table 2, fig. 2). Elevations range from 5,740 ft at station RF to 14,265 ft at Castle Peak. Geology in Region 3 is composed predominately of sedimentary shales and sand-stones of mixed origin as well as extensive outcrops of Cam-brian-aged volcanic deposits and Precambrian Era igneous and metamorphic rocks. Evaporite deposits, similar to those found in Region 1, also are present in Region 3 near the town of Carbondale (Chafin and Butler, 2002). Climate in Region 3 is semi-arid to temperate with precipitation ranging from 12 in/yr near station RF to 60 in/yr near the alpine headwaters
Table 1. U.S. Geological Survey streamflow-gaging stations for which trend tests were done for water years 1986 through 2003.
[USGS, U.S. Geological Survey; ID, identifier]
USGS station number (fig. 1)
Station ID
(fig. 1)Station name
09069000 ERB Eagle River at Gypsum
09071750 GLEN Colorado River above Glenwood Springs
09085000 RF Roaring Fork River at Glenwood Springs
09095500 CAMEO Colorado River near Cameo
09152500 GUN Gunnison River near Grand Junction
09163500 SLColorado River near Colorado-Utah
State Line
4 Salinity Trends in the Upper Colorado River Basin Upstream From the Grand Valley Salinity Control Unit, Colorado

Figu
re 2
. Re
gion
loca
tions
ups
tream
from
the
Gran
d Va
lley
Salin
ity C
ontro
l Uni
t.
Introduction 5
Rif
leSi
lt
108°
39°
40°
107°
106°
Regi
on 1
Regi
on 2
Regi
on 3
Regi
on 4
0909
5500
(CAM
EO)
0908
5000
(R
F)
0907
1750
(GLE
N)
0907
1750
(GLE
N)
0906
9000
(ERB
)
Colora
do
Rive
r
Colorado
Rive
r
Eagl
e
Mou
nt o
f the
Ho
ly C
ross
Gray
's P
eak
Cast
le P
eak
Eag
le
Car
bond
ale
Bas
alt
Elk
Mou
ntai
n Pe
ak
Dot
sero
Gyp
sum
Gle
nwoo
d S
prin
gs
River
River
Blue
River
Roarin
g For
k
Base
map
from
U.S
. Geo
logi
cal S
urve
y, di
gita
l dat
a, 1
983
Univ
ersa
l Tra
nsve
rse
Mer
cato
r Pro
ject
ion,
Zone
13
Horiz
onta
l coo
rdin
ate
info
rmat
ion
is re
fere
nced
to th
eN
orth
Am
eric
an D
atum
of 1
983
(NAD
83)
Land
use
from
U.S
. Geo
logi
cal S
urve
y La
nd C
over
Dat
aset
, 198
3
020
30 M
ILES
10
020
30 K
ILOM
ETER
S10
EX
PL
AN
AT
ION R
egio
n bo
unda
ry
U.S
. Geo
logi
cal S
urve
y st
ream
flow
-gag
ing
sta
tion
and
num
ber.
Ide
ntif
ier
is in
p
aren
thes
es (
)
Lan
d us
e
Inte
nse
resi
dent
ial l
and
use
Mod
erat
e re
side
ntia
l lan
d us
e
Agr
icul
tura
l lan
d us
e

of the basin (PRISM Group, 2006). The economy of Region 3 is based mostly on agriculture, tourism, recreation, and real estate development. The population in Region 3 (popula-tion estimates for Pitkin County and the towns of Carbon-dale and Basalt were used to represent Region 3) was about 16,800 people in 1991 and about 27,200 people in 2001 (State of Colorado, 2005). These estimates indicate that the popula-tion in this region has increased of roughly 1,040 individuals per year or 62 percent from 1991–2001. Population estimates for nonresident communities that populate this region as part of the tourist industry were not available at the time this report was written. However, it is assumed that the population of the area fluctuates, and often is larger than census estimates because the economy of the region is largely dependent on the tourist industry.
Colorado River Basin between Glenwood Springs and Cameo (Region 4). Region 4 drains approximately 2,050 square miles (mi2) of varying terrain between Glen-wood Springs and station CAMEO (table 2, fig. 2). Eleva-tions range from 4,810 ft at station CAMEO to 12,061 ft at the summit of Elk Mountain. Geology in Region 4 is com-posed predominately of sedimentary shales and sandstones of marine origin with lesser amounts of Tertiary aged volca-nic deposits. Evaporite deposits, similar to those present in Regions 1 and 3, also are present in Region 4 near the town of Glenwood Springs (Chafin and Butler, 2002). Several large hot springs drain saline water from the evaporite forma-tions in the Glenwood Springs area (Warner, 1985). These hot springs are a popular stop for tourists passing through the region. Climate in Region 4 is arid to temperate depending on location, with precipitation ranging from 7 in/yr near station CAMEO to 50 in/yr near the alpine headwaters of Battlement Mesa (PRISM Group, 2006). The economy of Region 4 is
based mostly on agriculture, energy development, industry, and real estate development, with lesser amounts of tourism and recreation relative to the other regions. The population in Region 4 (population estimates for Garfield County were used to represent Region 4) was about 31,200 people in 1991 and about 45,500 in 2001 (State of Colorado, 2005). These esti-mates indicate that the population in this region has increased by roughly 1,430 individuals per year, or 46 percent from 1991 to 2001.
Summary of Previous Studies
Many reports published in recent decades document downward trends in salinity at streamflow-gaging stations in the study area. A brief account of some of these reports follows; however, the reader is encouraged to further exam-ine each reference to fully understand the varying methods of trend analysis and the interpretations associated with the results of trend analysis. Information from the reports will be referred to in subsequent sections of this report for comparison purposes. All results from previous studies reference “flow-adjusted” values as defined in the Study Methods section of this report.
Several reports have specific information related to salin-ity trends in one or more of the aforementioned study regions. A study by Kircher and others (1984) reported downward trends in salinity load (significance level of 0.05) at station CAMEO on the order of 240 tons per year (tons/yr) for water years 1965 to 1979. Liebermann and others (1989) reported a downward trend in salinity load at station ERB (significance level of 0.01) of 1,250 tons/yr for water years 1947 to 1983. They also reported downward trends in salinity concentration at stations ERB (1947 to 1983), GUN (1934 to 1965), and SL
Table 2. Defined regions upstream from the Grand Valley Salinity Control Unit.
[USGS, U.S. Geological Survey; ID, identifier]
Region(fig. 2)
Region numberUSGS Station
number at region outflow
Station name at region outflow
(station ID)
Drainage area of region
(square miles)
Percent area upstream from Grand
Valley Unit
Eagle River Basin 1 09069000 Eagle River at Gypsum(ERB)
842 11
Colorado River headwaters to
Glenwood Springs
2 09071750 Colorado River above Glenwood
Springs(GLEN)
3,600 45
Roaring Fork River Basin
3 09085000 Roaring Fork River at Glenwood Springs
(RF)
1,450 18
Colorado River Basin between Glenwood Springs and Cameo
4 09095500 Colorado River near Cameo
(CAMEO)
2,050 26
6 Salinity Trends in the Upper Colorado River Basin Upstream From the Grand Valley Salinity Control Unit, Colorado

(1962 to 1983) of 2.1, 2.8, and 4.8 milligrams per liter (mg/L) per year, respectively. No significant trends in streamflow were reported by Liebermann and others (1989) at any of the stations that had downward trends in salinity load or concen-tration, indicating that changes to salinity sources, rather than streamflow volume, were controlling decreases in salinity load. Methods used by Liebermann are the same as those used for salinity load calculations and trend analysis in this report. Butler (1996) performed trend analysis for stations CAMEO, GUN, and SL for three periods: water-years 1970 to 1993, 1980 to 1993, and 1986 to 1993. He did not test for trends at any stations upstream from station CAMEO. Large downward trends in salinity load (significance level of 0.01) at stations CAMEO and SL were detected on the order of 41,000 and 62,300 tons/yr, respectively, from 1986 to 1993. The trend in salinity load at station CAMEO was not significant from 1970 to 1993, indicating that salinity loads upstream from the Grand Valley Unit may have started decreasing in the later part of the 1980’s. Butler (1996) also reported sizable down-ward trends in salinity concentration at stations CAMEO and SL on the order of 14.3 and 12.5 mg/L per year, respectively, from 1986 to 1993. Bauch and Spahr (1998) compared trend results from Butler (1996) to stations upstream from station CAMEO for the same periods. Downward trends in salinity load were detected at stations ERB, GLEN, and RF. Station ERB had significant downward trends from 1970 to 1993 and from 1986 to 1993. From 1970 to 1993, the rate of decrease was 842 tons/yr. From 1986 to 1993, the rate of decrease was 3,330 tons/yr, which suggests that trends in salinity loads in the Eagle River decreased most rapidly in the late 1980’s and early 1990’s. Station GLEN had a significant downward trend from 1986 to 1993 on the order of 9,350 tons/yr. Station RF also had only one time period from 1970 to 1993 when there was a significant downward trend, which was 800 tons/yr. Methods used by Butler (1996) and Bauch and Spahr (1998) are the same as those used for salinity load calculations and trend analysis in this report.
Downward trends reported by Bauch and Spahr (1998) at locations upstream from station CAMEO accounted for approximately 23 percent of the annual decrease observed by Butler (1996) at station CAMEO from 1986 to 1993. Of that 23 percent, Region 1 accounted for about 8 percent and Region 2 accounted for about 15 percent, and Region 3 accounted for 0 percent (no trend detected) of the decrease. Approximately 77 percent of the decrease reported by Butler (1996) at station CAMEO occurred within Region 4. Appor-tioning the rate of trend to square miles of watershed for each of the four regions studied in this report indicates that Region 1 had a downward trend equal to 3.9 tons/year/square mile (tons/yr/mi2), Region 2 had a downward trend equal to 1.7 tons/yr/mi2, and Region 4 had a downward trend equal to 15.4 tons/yr/mi2.
Study MethodsThe primary source of data for streamflow, specific con-
ductance (SC), and salinity concentration values used in these analyses was the USGS National Water Information System (NWIS, URL: http://waterdata.usgs.gov/nwis). Salinity load data published by the USBR (U.S. Department of the Inte-rior, 2003) for the Colorado River above Glenwood Springs, Colorado station (station GLEN) also were used. These loads originally were calculated from salinity concentration and streamflow data from NWIS.
Variables discussed in this report include mean-annual streamflow and flow-adjusted salinity concentrations and loads. Mean-annual values for streamflow or salinity concen-trations and loads represent an average of annual values. Salin-ity loads and trends in annual salinity loads were computed for six sites (table 1). Trends in streamflow and salinity concentra-tion were computed for station CAMEO. The time period used for all trend analysis was 1986 through 2003. The Statistical Analysis System (SAS) (SAS Institute, Inc., 1999) was used for all computations and trend tests.
As a first step in estimating annual salinity loads and conducting trend analysis, daily streamflow, daily SC, and periodic water-quality data were retrieved from NWIS for each site. Periodic water-quality data included concentrations of eight major ions (calcium, magnesium, sodium, potassium, silica, chloride, sulfate, and carbonate/bicarbonate expressed as carbonate equivalent) and dissolved solids (salinity) con-centrations, either as residue on evaporation at 180º Celsius (ROE) or sum of constituents (SOC). SOC is calculated in NWIS and consists of the major ions plus other dissolved constituents, such as nutrients and trace elements if they are present in large enough quantities in the water. In subsequent steps, the preference order for salinity concentration in this report was SOC > ROE, as recommended by Liebermann and others (1987). Quality assurance of all daily streamflow, daily SC, and water-quality data was done using USGS approved methods for data evaluation (Hem, 1970; Rantz and others, 1982; U.S. Geological Survey, 1997-present; Wagner and others 2000). The evaluation process includes automated and manual statistical evaluations by multiple reviewers.
Salinity loads were estimated using the computer pro-gram SLOAD (Salt LOAD; Liebermann and others, 1987). In SLOAD, regression equations were developed to estimate daily salinity loads as a function of daily streamflow, and, if available, daily SC. Each regression equation was based on 3 years of data. Daily salinity loads were estimated for the middle year of the 3-year period. Incremental 3-year groups of data were used to compute daily loads for each year in the period of analysis (1986–2003). For example, daily loads for 1986 were computed using data from 1985 through 1987. Therefore, for this report, the period used in SLOAD to compute salinity concentrations and loads from 1986 through 2003 was 1985 through 2004. The daily loads were summed by month and then water year to determine annual salinity
Study Methods 7

loads by water year. Daily streamflow data also were used to determine annual flow volume and mean-annual streamflow by water year. The annual loads and flow volumes were used to compute mean-annual salinity concentrations.
For station RF, SOC and ROE data were not available for all periodic samples during the 1985 through 2004 period; however, SC data were available for samples throughout the entire period. Using the SC and SOC data for 1969 through 2004 (time period after major reservoir completion), a regres-sion equation was established relating the two variables. For days in 1985 through 2004 without SOC data, the SOC was calculated for that date by applying the periodic sample SC data to the regression equation. The retrieved and calculated SOC data were then used in SLOAD.
For station ERB, daily streamflow from the Eagle River below Gypsum streamflow gage (09070000) was used because no daily streamflow record is available for station ERB. The 09070000 streamflow gage is located approximately 450 feet downstream from station ERB. Gypsum Creek flows into the Eagle River between station ERB and the 09070000 streamflow gage. Measured streamflow from Gypsum Creek is subtracted out of the instantaneous streamflow measured at the 09070000 streamflow gage to correct for differences in streamflow reported for discrete samples. No correction for daily streamflow is made because there is no continuous streamflow-gaging station on Gypsum Creek.
Salinity concentration typically is correlated with streamflow; as streamflow increases, concentrations typically decrease because of dilution. With this correlation, trends in concentrations and loads because of natural or human factors may be masked by variability in streamflow between water years. To remove the effects of streamflow variability, salin-ity concentrations and loads were adjusted for streamflow before trends testing. Annual salinity loads were adjusted for streamflow using hyperbolic regression models (Smith and others, 1982). The residuals of these regression estimates are the annual flow-adjusted salinity loads. Salinity concentrations in period samples were adjusted by regression of the logarithm of concentration on (or with) the logarithm of streamflow and the square of the logarithm of streamflow. The residuals of these regression estimates are the annual flow-adjusted salinity concentrations (Smith and others, 1982; Liebermann and oth-ers, 1989; Schertz and others, 1991).
The annual flow-adjusted salinity concentrations were tested for trends using a computerized procedure developed by the USGS called EStimate TREND (ESTREND) (Schertz and others, 1991). ESTREND was used to detect trends in flow-adjusted salinity concentration because it is designed to investigate trends in water-quality that have non-normal distri-butions, seasonality, and outliers. A nonparametric test called the Seasonal Kendall test (Hirsch and others, 1991) is used in ESTREND to test for monotonic trends. This type of trend indicates whether or not there has been a change in a water-quality variable of interest with time but does not specify if a change is linear. The Seasonal Kendall test’s null hypothesis is that there is no trend with time. The seasonal effects of
variations in concentration data are addressed by computing the Mann-Kendall test statistics on concentrations measured during the same seasons, or time periods, and summing all results to determine the overall Kendall tau value. Salinity concentrations measured in March to May of one year, for example, would be compared only to concentrations measured in March to May of other years. Similarly, concentration data for July of one year would be compared to July data of other years. The number of seasons chosen for analysis does not necessarily correspond to climatic seasons but is based more on the temporal distribution of the data. For a season with more than one observation, the most central observation with respect to time for that season is used (Schertz and others, 1991). In this study, four seasons per year were used for trend analysis of salinity concentrations.
The seasonal Kendall tau value measures the strength of the monotonic relation between two variables. A tau value of zero indicates no trend. As the absolute value of tau increases, it is more likely that a trend is present. The p-value and trend slope are computed as part of the seasonal Kendall test. The p values are adjusted for serial correlation, because succes-sive residuals in a time series are not entirely independent of one another. The trend slope, computed using methods of Sen (1968), equals the median slope of all pair-wise comparisons of concentration data (the difference between two concentra-tion values divided by the time in years) between the two values. As such, trend slopes computed using the seasonal Kendall test are not directly comparable among stations (Butler, 1996). The trend slope is reported as the change in original units per year and as a percent of mean concentra-tion (slope in original units divided by the mean times 100). For log-transformed data, such as the flow-adjusted salinity concentrations in this report, the slope in original units is computed using the expression ‘eb minus 1’ times the mean concentration. The coefficient b is the seasonal Kendall slope estimate in natural logarithm units. The percent rate of change for log-transformed data is computed using the expression ‘eb minus 1’ times 100.
Annual flow-adjusted salinity loads were tested for trends using linear-regression, a parametric method involving the regression of the loads on (or with) time. This method was chosen for purposes of maintaining consistency and compara-bility to previous salinity trends reports and also because the total change in tons can be reported and compared. Originally, the method was chosen by Butler (1996) because parametric statistics can be more powerful and straightforward to interpret if the residuals are normally distributed (Hirsch and others, 1991). Butler (1996) also reported that slopes calculated using the seasonal Kendall test are not that informative for mak-ing direct comparisons between stations, especially for slope estimators for log-transformed data. No comparisons between slope trends for annual flow-adjusted salinity concentration are made in this report; however, slope trends for annual flow-adjusted salinity load are compared and so the linear regres-sion method was used.
8 Salinity Trends in the Upper Colorado River Basin Upstream From the Grand Valley Salinity Control Unit, Colorado
The null hypothesis of the trend test is that there is no change in annual flow-adjusted salinity load with time. An upward trend is indicated by a statistically significant positive slope, and a downward trend is indicated by a statistically sig-nificant negative slope. The p value, the attained significance level of the test, was computed with each analysis. The p-value is a measure of statistical significance of the probability of rejecting the null hypothesis. Smaller p-values indicate that there is an increased probability that a trend is present. For this report, trends were considered statistically significant at p values of 0.05 or less.
The adjustment of salinity concentrations and loads for seasonal effects of streamflow may not remove all seasonality. To account for this and as an additional measure for under-standing trends in salinity loads and concentrations at station CAMEO, trend analysis of annual streamflow was conducted for this site using linear regression. No adjustments to the streamflow data were made before the trend analysis.
As an additional step in interpreting results of the trends testing, LOWESS (LOcally WEighted Scatterplot Smoothing) (Cleveland, 1979) lines were graphed. The LOWESS tech-nique is a robust procedure that uses weighting functions with least squares regression to minimize the effect of data outliers in fitting a smooth line to the data. A LOWESS smooth line provides information on short-term changes in water-quality data, and may be highly nonlinear because of the procedures used to develop the line. For each application of LOWESS, a smoothing factor of 0.5 was used.
Additional descriptions of methods used for load com-putations, flow adjustment, and trend analysis are available in Vaill and Butler (1999), Butler (1996), and Schertz and others (1991).
Annual Streamflow, Salinity Load, and Salinity Concentration, 1986–2003
Streamflow
Typically, streamflow volumes in the Colorado and Gun-nison Rivers are highest in the spring when snowmelt occurs, and lowest when baseflow conditions exist in the winter. Commonly, however, some streamflow is stored or diverted for agricultural, industrial, and residential needs, which alters the natural cycle of snowmelt and rainfall runoff. Thus, annual streamflow volumes at each station do not necessarily reflect those that existed before human development.
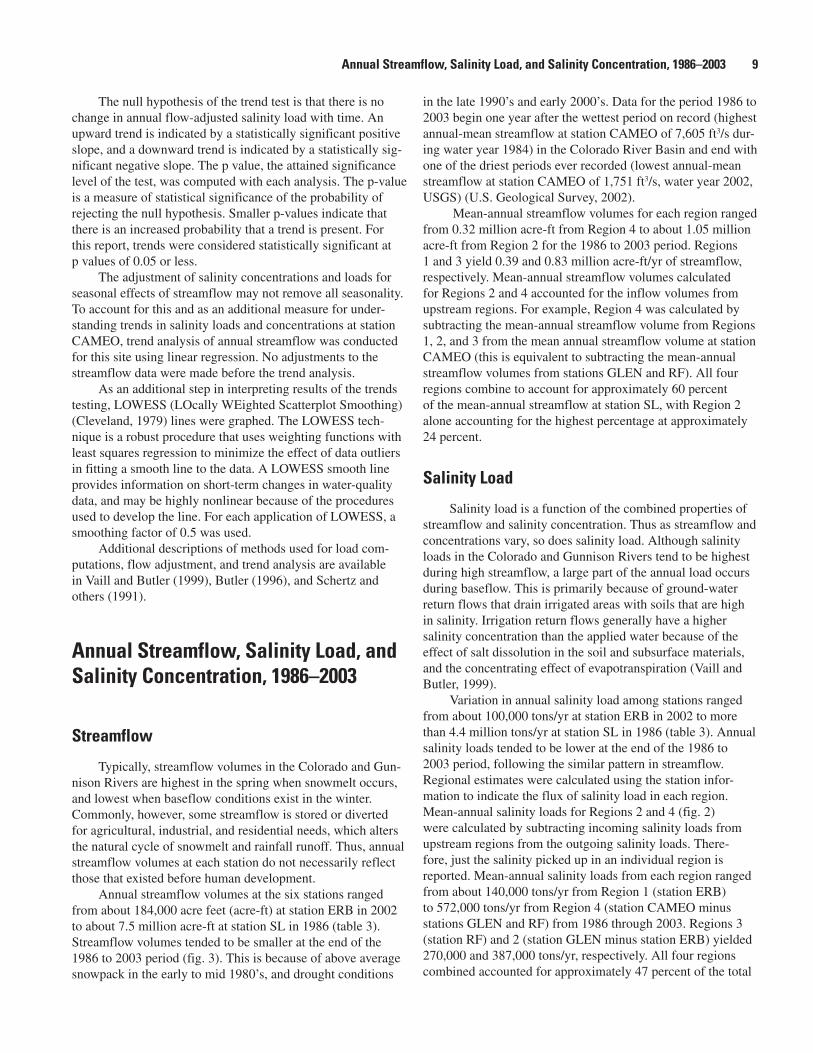
Annual streamflow volumes at the six stations ranged from about 184,000 acre feet (acre-ft) at station ERB in 2002 to about 7.5 million acre-ft at station SL in 1986 (table 3). Streamflow volumes tended to be smaller at the end of the 1986 to 2003 period (fig. 3). This is because of above average snowpack in the early to mid 1980’s, and drought conditions
in the late 1990’s and early 2000’s. Data for the period 1986 to 2003 begin one year after the wettest period on record (highest annual-mean streamflow at station CAMEO of 7,605 ft3/s dur-ing water year 1984) in the Colorado River Basin and end with one of the driest periods ever recorded (lowest annual-mean streamflow at station CAMEO of 1,751 ft3/s, water year 2002, USGS) (U.S. Geological Survey, 2002).
Mean-annual streamflow volumes for each region ranged from 0.32 million acre-ft from Region 4 to about 1.05 million acre-ft from Region 2 for the 1986 to 2003 period. Regions 1 and 3 yield 0.39 and 0.83 million acre-ft/yr of streamflow, respectively. Mean-annual streamflow volumes calculated for Regions 2 and 4 accounted for the inflow volumes from upstream regions. For example, Region 4 was calculated by subtracting the mean-annual streamflow volume from Regions 1, 2, and 3 from the mean annual streamflow volume at station CAMEO (this is equivalent to subtracting the mean-annual streamflow volumes from stations GLEN and RF). All four regions combine to account for approximately 60 percent of the mean-annual streamflow at station SL, with Region 2 alone accounting for the highest percentage at approximately 24 percent.
Salinity Load
Salinity load is a function of the combined properties of streamflow and salinity concentration. Thus as streamflow and concentrations vary, so does salinity load. Although salinity loads in the Colorado and Gunnison Rivers tend to be highest during high streamflow, a large part of the annual load occurs during baseflow. This is primarily because of ground-water return flows that drain irrigated areas with soils that are high in salinity. Irrigation return flows generally have a higher salinity concentration than the applied water because of the effect of salt dissolution in the soil and subsurface materials, and the concentrating effect of evapotranspiration (Vaill and Butler, 1999).
Variation in annual salinity load among stations ranged from about 100,000 tons/yr at station ERB in 2002 to more than 4.4 million tons/yr at station SL in 1986 (table 3). Annual salinity loads tended to be lower at the end of the 1986 to 2003 period, following the similar pattern in streamflow. Regional estimates were calculated using the station infor-mation to indicate the flux of salinity load in each region. Mean-annual salinity loads for Regions 2 and 4 (fig. 2) were calculated by subtracting incoming salinity loads from upstream regions from the outgoing salinity loads. There-fore, just the salinity picked up in an individual region is reported. Mean-annual salinity loads from each region ranged from about 140,000 tons/yr from Region 1 (station ERB) to 572,000 tons/yr from Region 4 (station CAMEO minus stations GLEN and RF) from 1986 through 2003. Regions 3 (station RF) and 2 (station GLEN minus station ERB) yielded 270,000 and 387,000 tons/yr, respectively. All four regions combined accounted for approximately 47 percent of the total
Annual Streamflow, Salinity Load, and Salinity Concentration, 1986–2003 9

Tabl
e 3.
Sum
mar
y of
ann
ual s
tream
flow
dat
a, a
nd s
alin
ity d
ata
estim
ated
by
SLOA
D pr
ogra
m fo
r eac
h st
ream
flow
-gag
ing
stat
ion.
[USG
S, U
.S. G
eolo
gica
l Sur
vey;
Str
eam
flow
, str
eam
flow
in a
cre
feet
per
yea
r; C
once
ntra
tion,
sal
inity
con
cent
ratio
n in
mill
igra
ms
per
liter
; Loa
d, s
alin
ity lo
ad in
tons
per
yea
r; E
RB
, Eag
le R
iver
at G
ypsu
m,
Col
orad
o; G
LE
N, C
olor
ado
Riv
er a
bove
Gle
nwoo
d Sp
ring
s, C
olor
ado;
RF,
Roa
ring
For
k R
iver
at G
lenw
ood
Spri
ngs,
Col
orad
o.]
Year
USG
S st
ream
flow
-gag
ing
stat
ions
0906
9000
(ERB
)09
0717
50 (G
LEN
)09
0850
00 (R
F)
Stre
amflo
wCo
ncen
trat
ion
Load
Stre
amflo
wCo
ncen
trat
ion
Load
Stre
amflo
wCo
ncen
trat
ion
Load
1986
536,
000
253
184,
000
2,23
5,00
023
471
0,00
01,
240,
000
223
375,
000
1987
342,
000
316
147,
000
1,31
1,00
029
552
7,00
091
3,00
025
231
3,00
0
1988
307,
000
315
131,
000
1,35
2,00
030
355
7,00
062
4,00
029
124
7,00
0
1989
294,
000
317
127,
000
1,10
9,00
031
547
5,00
060
2,00
028
523
4,00
0
1990
266,
000
333
121,
000
1,03
2,00
033
346
8,00
052
6,00
029
321
0,00
0
1991
363,
000
268
132,
000
1,25
0,00
029
049
3,00
074
2,00
025
025
3,00
0
1992
322,
000
322
141,
000
1,11
6,00
030
846
7,00
058
7,00
028
622
8,00
0
1993
546,
000
203
151,
000
1,76
0,00
024
257
8,00
01,
110,
000
200
303,
000
1994
297,
000
322
130,
000
1,15
6,00
030
347
6,00
069
2,00
027
025
4,00
0
1995
586,
000
194
154,
000
1,80
9,00
022
254
6,00
01,
430,
000
175
340,
000
1996
535,
000
221
161,
000
2,02
9,00
021
057
9,00
01,
060,
000
223
321,
000
1997
577,
000
213
167,
000
2,33
1,00
020
565
1,00
01,
220,
000
203
337,
000
1998
376,
000
302
155,
000
1,55
3,00
027
157
3,00
099
5,00
022
931
0,00
0
1999
413,
000
258
145,
000
1,60
6,00
025
455
5,00
087
6,00
023
227
7,00
0
2000
376,
000
254
130,
000
1,40
2,00
027
752
9,00
070
9,00
025
524
6,00
0
2001
323,
000
273
120,
000
1,05
0,00
032
646
6,00
061
1,00
026
822
3,00
0
2002
184,
000
400
100,
000
697,
000
402
381,
000
406,
000
334
185,
000
2003
373,
000
227
115,
000
1,06
5,00
031
145
1,00
061
4,00
025
020
9,00
0
Su
mm
ary
Stat
istic
s
Mea
n39
0,00
027
714
0,00
0
1,43
7,00
028
352
7,00
083
1,00
025
127
0,00
0
Stan
dard
Dev
iatio
n11
8,00
0 5
5 2
1,00
0
44
9,00
0 5
0 7
8,00
028
8,00
0 3
954
,000
10 Salinity Trends in the Upper Colorado River Basin Upstream From the Grand Valley Salinity Control Unit, Colorado

Tabl
e 3.
Sum
mar
y of
ann
ual s
tream
flow
dat
a, a
nd s
alin
ity d
ata
estim
ated
by
SLOA
D pr
ogra
m fo
r eac
h st
ream
flow
-gag
ing
stat
ion.
—Co
ntin
ued
[USG
S, U
.S. G
eolo
gica
l Sur
vey;
Str
eam
flow
, str
eam
flow
in a
cre
feet
per
yea
r; C
once
ntra
tion,
sal
inity
con
cent
ratio
n in
mill
igra
ms
per
liter
; Loa
d, s
alin
ity lo
ad in
tons
per
yea
r; E
RB
, Eag
le R
iver
at G
ypsu
m,
Col
orad
o; G
LE
N, C
olor
ado
Riv
er a
bove
Gle
nwoo
d Sp
ring
s, C
olor
ado;
RF,
Roa
ring
For
k R
iver
at G
lenw
ood
Spri
ngs,
Col
orad
o.]
Year
USG
S st
ream
flow
-gag
ing
stat
ions
0909
5500
(CA
MEO
)09
1525
00 (G
UN
)09
1635
00 (S
L)
Stre
amflo
wCo
ncen
trat
ion
Load
Stre
amflo
wCo
ncen
trat
ion
Load
Stre
amflo
wCo
ncen
trat
ion
Load
1986
4,15
6,00
035
21,
990,
000
2,89
2,00
036
81,
449,
000
7,51
2,00
042
84,
372,
000
1987
2,59
6,00
043
31,
530,
000
2,47
7,00
044
81,
511,
000
5,20
6,00
050
73,
592,
000
1988
2,15
4,00
046
11,
349,
000
1,37
5,00
055
71,
041,
000
3,51
0,00
061
12,
918,
000
1989
1,85
9,00
048
61,
230,
000
904,
000
714
878,
000
2,81
3,00
072
32,
766,
000
1990
1,64
3,00
049
31,
101,
000
766,
000
823
857,
000
2,24
2,00
076
02,
317,
000
1991
2,17
4,00
041
21,
218,
000
1,44
2,00
054
31,
064,
000
3,50
8,00
057
02,
718,
000
1992
1,86
7,00
046
71,
186,
000
1,52
9,00
055
81,
160,
000
3,32
7,00
059
62,
696,
000
1993
3,37
9,00
032
51,
493,
000
2,69
7,00
037
41,
371,
000
6,14
7,00
040
53,
389,
000
1994
2,07
1,00
045
71,
288,
000
1,48
4,00
052
41,
058,
000
3,35
3,00
057
72,
629,
000
1995
3,85
2,00
029
91,
568,
000
3,22
2,00
031
91,
398,
000
7,07
9,00
035
93,
457,
000
1996
3,46
4,00
031
71,
494,
000
2,01
3,00
042
51,
164,
000
5,55
9,00
041
73,
152,
000
1997
4,15
4,00
029
91,
688,
000
2,81
7,00
034
11,
307,
000
7,11
4,00
036
23,
499,
000
1998
3,06
2,00
038
31,
597,
000
2,09
3,00
039
61,
127,
000
5,34
8,00
042
83,
110,
000
1999
2,76
7,00
037
41,
407,
000
1,69
3,00
052
61,
211,
000
4,35
7,00
049
92,
959,
000
2000
2,33
2,00
039
71,
258,
000
1,46
6,00
047
494
4,00
03,
499,
000
498
2,37
0,00
0
2001
1,93
9,00
044
81,
181,
000
1,17
1,00
054
887
2,00
02,
799,
000
582
2,21
6,00
0
2002
1,26
8,00
057
398
8,00
080
5,00
066
272
5,00
01,
750,
000
729
1,73
4,00
0
2003
1,92
0,00
041
51,
083,
000
860,
000
618
724,
000
2,63
3,00
059
52,
131,
000
Sum
mar
y St
atis
tics
Mea
n2,
590,
000
411
1,36
9,00
01,
761,
000
512
1,10
3,00
04,
320,
000
536
2,89
0,00
0
Stan
dard
Dev
iatio
n88
8,00
075
250,
000
781,
000
135
241,
000
1,79
2,00
012
463
6,00
0
Annual Streamflow, Salinity Load, and Salinity Concentration, 1986–2003 11

salinity load at station SL, with the highest loading region (Region 4) accounting for approximately 20 percent.
Salinity Concentration
Salinity concentrations generally are highest during low streamflow, which typically occurs in winter. Like streamflow, the natural cycle of salinity concentration in the Colorado and Gunnison Rivers has been altered by human activities such as agriculture, industry, and residential development. As a result, the correlation of salinity to streamflow is more complex because the timing at which salinity is mobilized to streams is altered from the natural cycle. This shift in timing can nega-tively affect salinity concentrations estimated by SLOAD. To account for these complexities, continuous SC data are collected as a surrogate for salinity. Continuous SC data were used to estimate salinity concentrations and loads for all sta-tions except station ERB after 1995.
Annual-mean salinity concentrations at the six stations ranged from 175 mg/L at station RF in 1995 to 823 mg/L in 1990 (table 3) at station GUN. Mean-annual salinity concentrations at the four stations near the outflow of each region (table 2, fig. 2) ranged from 251 mg/L at station RF to 411 mg/L at station CAMEO from 1986 through 2003. Stations ERB and GLEN had concentrations of 277 and 283 mg/L, respectively. An analysis of concentration by region indicates the degree to which concentrations in Regions 2 and 4 are affected by upstream regions. The mean-annual salinity concentration in runoff from Regions 2 and 4 was calculated using the following equation:
C = L/(Q*k), (1)
where L is the mean-annual salinity load, in tons per
year, at the outflow site for the region of interest (defined in the following section) minus the mean-annual salinity load from upstream regions;
Q is the mean-annual streamflow volume, in acre feet, at the outflow site for the region of interest minus the mean-annual streamflow volume from upstream regions;
k is the constant (0.00136) used to convert units into milligrams per liter;
and C is the calculated mean-annual salinity
concentration, in milligrams per liter, for the region of interest.
The calculated values indicate that mean annual salinity concentration was 287 mg/L in Region 2 and 1,620 mg/L in Region 4. Because the mean-annual concentrations at sta-tions GLEN and ERB are approximately the same, there is only a small increase in the mean annual concentration in Region 2 relative to the mean annual concentration of 283 mg/L at station GLEN. The calculated mean annual concentra-tion for Region 4; however, is substantially greater than that of station CAMEO (411 mg/L) indicating that dilution from the Regions 1, 2, and 3 plays an important role in controlling salinity concentration upstream from the Grand Valley Unit.
Salinity Trends in the Upper Colorado River Basin Upstream from the Grand Valley Salinity Control Unit
As previously mentioned, historical studies show down-ward trends in salinity concentrations and loads upstream from the Grand Valley Unit. In previous studies it was determined that the highest rate of decrease occurred from 1986 through 1993. The 1986 to 2003 period was tested in this report to determine if the trends reported in the previous study are still “in effect” and if the rate of change is changing. The results of trend testing are provided in this section and the factors poten-tially affecting trends in annual salinity loads in the Colorado River upstream from the Grand Valley Unit are discussed in subsequent sections.
Temporal Trends in Annual Flow-Adjusted Salinity Loads by Region
Trends in annual flow-adjusted salinity load were tested for the six streamflow-gaging stations from 1986 through 2003. The results for each station are shown in table 4. The trend-slope value from table 4 indicates the average rate (tons per year) that salinity load is changing annually (a downward
Figure 3. Annual streamflow volume at U.S. Geological Survey streamflow-gaging station 09095500, Colorado River at Cameo (CAMEO), for water years 1986 through 2003.
12 Salinity Trends in the Upper Colorado River Basin Upstream From the Grand Valley Salinity Control Unit, Colorado
0
500
1,000
1,500
2,000
2,500
3,000
3,500
4,000
4,50019
86
1987
1988
1989
1990
1991
1992
1993
1994
1995
1996
1997
1998
1999
2000
2001
2002
2003
ANN
UAL
STRE
AMFL
OW V
OLUM
E IN
THO
USAN
DSOF
ACR
E FE
ET

trend is preceded by a minus sign). Listed in table 4 is the trend slope as a percent of mean annual load and as a percent of the trend slopes at stations SL and CAMEO to facilitate comparing the contributions from areas upstream from a given station or region. Regional estimates of trend slope were cal-culated for Regions 2 and 4 by subtracting trend slopes from upstream basins (Region 2 minus Region 1; Region 4 minus Regions 2 and 3).
Trend slopes at all six stations were downward and significant at or below the 5 percent level (p value of less than or equal to 0.05 from table 4) from 1986 through 2003. The trend analysis indicates that approximately 27 percent of the decrease in salinity at station SL is a consequence of reductions in salinity upstream from the Grand Valley Unit (station CAMEO). This percentage is comparable to the 28 percent decrease from the Gunnison River Basin (station GUN), where salinity control projects have been implemented by the NRCS and the USBR. For the 1986 to 1993 period, Butler (1996) reported no trend for station GUN and a much larger trend slope (-41,000 tons/yr) at station CAMEO, which is equal to about 66 percent of the decrease observed at station SL (table 4). These results indicate that the rate of trend had changed after 1993 at stations GUN, CAMEO, and SL.
To aid in the interpretation of the temporal trends at each station, the data were examined graphically, using the LOWESS smoothing technique. A LOWESS line was fitted to the annual flow-adjusted salinity load estimates (residuals) from SLOAD for the period of 1986–2003 for each station on figure 4. The residuals represent the annual departure (posi-tive or negative) for the flow-adjusted annual salinity load estimates. A residual of zero would indicate that the annual flow-adjusted salinity load matches the annual salinity load estimate from SLOAD for a given year, a positive residual is more than what was expected, and a negative residual is less. The LOWESS plots for all six stations show that annual flow-adjusted salinity loads were highest at the beginning of the test period, decreased until about 1995 to 1997, and then began to level off. Butler (1996) reported moderate increases in salinity load during wetter periods despite flow adjustment; therefore, one would expect that the annual flow-adjusted salinity loads might increase during the mid 1990’s (wettest period) and decrease during the early 2000’s (driest period). However, based on the LOWESS lines in figure 4, flow adjusted salinity loads at the majority of sites decreased in the early 1990’s and were relatively stable in the mid to late 1990’s and early 2000’s. These results indicate that the factors affecting salin-ity loads on a regional scale were not limited to climate from 1986 through 2003.
Trend slopes for each region were different from 1986 through 1993 and 1986 through 2003. Region 1 had trend slopes of -3,330 tons/yr and -1,230 tons/yr from 1986 through 1993 and 1986 through 2003, respectively. From 1986 through 1993, a slightly higher percentage of the trend slope at sta-tions SL relative to 1986 through 2003 was accounted for. Region 2 had trend slopes of -6,020 and -940 tons/yr from 1986 through 1993 and 1986 through 2003, respectively. From
1986 through 1993, a higher percentage of the trend slope at station CAMEO and a much higher portion of the slope at SL relative to the 1986 through 2003 period were accounted for. These differences indicate salinity loads from Regions 1 and 2 were decreasing at a slower rate from 1993 through 2003 than during the 1986 to 1993 period. Thus, the factors affecting salinity trends in Regions 1 and 2 are changing or no longer exist. Overall, contributions to the trend in salinity load at SL were similar from Regions 1 and 2 for both periods. There was not a significant trend in annual flow-adjusted salinity load in Region 3 from 1986 to 1993, therefore the trend slope is assumed to equal zero for that period. There was, how-ever, a significant trend in annual flow-adjusted salinity load from 1986 through 2003 in Region 3, and the trend slope was -1,580 tons/yr. Region 4 had trend slopes of -31,650 tons/yr (assuming the trend slope at station RF is zero for the 1986 to 1993 period) and -6,950 tons/yr from 1986 through 1993 and 1986 through 2003, respectively. The trend slope from 1986 through 1993 was considerably steeper than the trend slope from 1986 through 2003, indicating that the trend in salinity in Region 4 was decreasing at a slower rate from 1993 through 2003 relative to 1986 through 1993.
The 1986 to 1993 period may have had an artificially inflated slope value in Region 4 due to the fact that no trend was detected in Region 3. The failure to detect a trend in Region 3 by Bauch and Spahr (1998) does not necessarily mean that a downward trend did not exist, but rather that a trend was not detected. If a downward trend did exist but was not detected it would cause any portion of the downward trend at station CAMEO that was undetected from Region 3 to be attributed to Region 4. The methods used to estimate annual salinity loads for this report differed somewhat from those used by Bauch and Spahr (1998), in that SOC values used for the SLOAD computations were estimated using a regres-sion of daily SC on SOC (see methods section). Bauch and Spahr (1998) used periodic data from STORET to estimate annual loads in SLOAD. A trend analysis was done from 1986 through 1993 for the data used in this report because there appears to be a trend in the flow adjusted loads at station RF as shown in figure 4. The trend analysis from 1986 through 1993 flow adjusted loads (not listed in table 4) was done using linear regression as a means to determine what, if any, portion of a trend in Region 4 needed to be attributed to Region 3. The results indicated a significant trend (p <.05) and that approxi-mately 15 percent of the trend slope in annual flow-adjusted salinity load at Region 4 should be attributed to Region 3 from 1986 through 1993. Despite this, the percent of trend slope accounted for by Region 4 at stations CAMEO and SL was roughly twice that of the other three regions combined. These results indicate that Region 4 plays a substantial role in controlling salinity trends upstream from the Grand Valley Unit. The results published by Bauch and Spahr (1998) were used for comparison purposes in this report because there is no strong evidence to reject their analysis. The reader, how-ever, should note that there may have been a downward trend in annual flow-adjusted salinity load from Region 3, which
Salinity Trends in the Upper Colorado River Basin Upstream from the Grand Valley Salinity Control Unit 13

would have affected the magnitude of the calculated trend slope for Region 4 from 1986 through 1993.
The total change in flow-adjusted salinity load from 1986 through 1993 and 1986 through 2003 are presented in table 4. The data indicate that regions 1, 2, and 4 had a larger total decrease from 1986 through 1993 than from 1986 through 2003 meaning that some of the decreases in salin-ity load realized from 1986 through 1993 may have been offset by increases in salinity load after 1993. Station GUN and the Grand Valley Unit, however, both showed that the total change in flow-adjusted salinity load was larger from 1986 through 2003 (fig. 4), meaning salinity loads from these areas continued to decline and were not offset by increases in salinity load after 1993 to the degree that other regions were.
The Gunnison River Basin and the Grand Valley Unit had a substantial effect on the downward trend in salinity at station SL from 1986 through 2003. The combined total decrease in salinity load from the Gunnison River Basin (measured at station GUN) and the Grand Valley Unit (calculated as station SL minus stations CAMEO and GUN) was approximately 524,000 tons from 1986 through 2003. This was likely due in part to the ongoing and extensive amount of salinity control work done by the USBR and NRCS in agricultural areas in the Lower Gunnison and Grand Valley Salinity Control Units (fig. 1). Extensive salinity control work began in the Grand Valley in the early 1980’s and in the late 1980’s in the Lower Gunnison Unit.
Table 4. Monotonic trends in annual flow-adjusted salinity load for streamflow-gaging stations and regions upstream from the Grand Valley Salinity Control Unit, for various periods.
[ID, Identifier; Trend slope, the rate that salinity load is changing in tons per year–negative value indicates a downward trend; percent, the trend slope expressed as percent of the mean-annual load; p value, probability of erroneously reporting an existing trend; Total change for period, total decrease in salin-ity load in tons for given period; NA, not applicable; NT, not trend; <, less than]
Station ID (fig. 1)
Region (fig. 2)
Average trend slope
(tons/yr)Percent p value
Percent of trend slope at station
SL
Percent of trend slope at station
CAMEO
Total changefor period
(tons)
1986–2003
ERB Region 1 -1,230 -0.88 0.011 3.1 11 -22,100
GLEN -2,170 -.41 .05 5.5 20 -39,100
RF Region 3 -1,580 -.58 .013 4.0 15 -28,400
CAMEO -10,700 -.78 .009 27 100 -192,600
GUN -11,200 -1.01 <.001 28 NA -201,600
SL -39,800 -1.38 <.001 100 NA -716,400
Region 21 -940 -.24 NA 2.4 9.0 -16,900
Region 41 -6,950 -2.5 NA 17 65 -125,100
Grand Valley Unit1 -17,900 -4.3 NA 45 NA -322,200
1986–1993 Data from Bauch and Spahr (1998)
ERB Region 1 -3,330 -2.35 .028 5.3 8.1 -26,640
GLEN -9,350 -1.77 .022 15 23 -74,800
RF Region 3 NT NT .842 NA NA NA
1986–1993 Data from Butler (1996)
CAMEO -41,000 -2.95 <.001 65 100 -328,000
GUN NT NT .413 NA NA NA
SL -62,300 -2.02 .003 100 NA -498,400
Region 21 -6,020 -1.51 NA 9.7 15 -48,160
Region 41 -31,650 -5.18 NA 51 77 -253,200
Grand Valley Unit1 -21,300 -.69 NA 34 NA -170,400
1Calculated value, no trend analysis.
14 Salinity Trends in the Upper Colorado River Basin Upstream From the Grand Valley Salinity Control Unit, Colorado

Figure 4. LOWESS smooth curves of flow-adjusted salinity load at streamflow-gaging stations for water years 1986 through 2003.
Salinity Trends in the Upper Colorado River Basin Upstream from the Grand Valley Salinity Control Unit 15
-300,000
-200,000,
-100,000
0
100,000
200,000
300,000
400,000
500,000
600,000
-50,000-40,000
-30,000
-20,000
-10,000
0
10,000
20,000
30,000
40,000
50,000
60,000
70,000
-200,000
-100,000
0
100,000
200,000
300,000
Eagle River at Gypsum (ERB) Colorado River above Glenwood Springs (GLEN)
Roaring Fork River at Glenwood Springs (RF) Colorado River near Cameo (CAMEO)
Gunnison River near Grand Junction (GUN) Colorado River near Colorado-Utah State Line (SL)
FLOW
-ADJ
USTE
D SA
LIN
ITY
LOAD
IN T
ONS
WATER YEAR
1987
1988
1986
1989
1990
1991
1992
1993
1994
1995
1996
1997
1998
1999
2000
2001
2002
2003
1987
1988
1986
1989
1990
1991
1992
1993
1994
1995
1996
1997
1998
1999
2000
2001
2002
2003
-30,000
-20,000
-10,000
0
10,000
20,000
30,000
-200,000
-100,000
0
100,000
200,000
-30,000
-20,000
-10,000
0
10,000
20,000
30,000
40,000
Annual flow-adjusted salinity load
LOWESS smooth line
Annual flow-adjusted salinity load
Annual flow-adjusted salinity load
Annual flow-adjusted salinity load
LOWESS smooth line
LOWESS smooth line
LOWESS smooth lineAnnual flow-adjusted salinity load
LOWESS smooth line
Annual flow-adjusted salinity load
LOWESS smooth line

The period of record may be affecting the results of trend analysis due to the parametric nature of linear regres-sion. Because the trend slopes at all sites deviate from a linear distribution to some degree, the total decrease in salinity load from 1986 through 2003 (table 4) will have an increased margin of error associated with it and should not be used to forecast future decreases in salinity loads. The linear method of analysis for salinity loads was used in this report so that the current results could be compared to those of previous stud-ies in an attempt to demonstrate the relative change in trend slopes during the initial 1986 to 1993 period and the extended period from 1986 to 2003.
Temporal Trends in Salinity Concentrations, Selected Individual Ion Concentrations, and Streamflow at U.S. Geological Survey Streamflow-Gaging Station CAMEO
Trends in salinity concentration and streamflow were tested at station CAMEO, the outflow site for Region 4, to determine if salinity concentration, streamflow, or both are controlling salinity loads upstream from the Grand Valley Unit (table 5). For example, downward trends in salinity concentra-tion may indicate source changes, including changes caused by salinity control work, whereas downward trends in stream-flow may indicate changes in transbasin diversions, reservoir storage, or climatic fluctuations. Test of trends in concentra-tion of individual ions were included as potential indicators of what sources (based on mineral composition) may be control-ling trends in the upper Colorado.
No significant trend in streamflow from 1986 through 2003 was detected at station CAMEO; however, a significant downward trend in salinity concentration was detected. The trend slope indicates that salinity concentration is decreasing at a median rate of about 3.54 milligrams per liter per year (mg/L/yr). These findings indicate that decreasing salinity concentration is controlling the downward trend in salinity load upstream from the Grand Valley Unit at station CAMEO. Five major ions (calcium, magnesium, sodium, sulfate, and chloride) were tested for trends. The results indicate that pro-cesses within source areas with rock and soil types (or other unidentified sources) bearing calcium, sulfate, and magnesium had the largest effect on the downward trend upstream from station CAMEO. Rock and soil types that may be associated with these ions are prolific and not limited spatially to any specific region upstream from station CAMEO. Gypsum (cal-cium sulfate) and halite (sodium chloride), which are locally associated with the Mancos Shale, Green River, and Eagle Val-ley Evaporite Formations, occur in all four regions. Dolomite (calcium magnesium carbonate), which is locally associated with the Dyer and Manitou Dolomite Formations, occurs in Region 4 near Glenwood Springs. Downward trends in salinity concentration appear to be caused by changes occur-ring in Region 4 based on the trend analysis of the individual ions. Chafin and Butler (2002) reported that approximately
60 percent of the halite that occurs as salinity in the Colorado River at station CAMEO is sourced from the Eagle Val-ley Evaporite Formation, which is situated predominately in Regions 1, 2 and 3. If the downward trend was caused by changes that occurred to the Eagle Valley Evaporite in Regions 1, 2, and 3, it is unlikely that the constituents that comprise gypsum would have a downward trend and the constituents that comprise halite would not. Therefore, the downward trend in gypsum was most likely caused by changes in gypsum sources that originate from the Mancos Shale and Green River Formations in Region 4.
Factors Potentially Affecting Trends in Annual Salinity Loads in the Colorado River Upstream from the Grand Valley Salinity Control Unit
Several possible explanations for decreases in salinity concentrations and loads upstream from the Grand Valley Unit have been documented in previous studies. Most notable is a study by Bauch and Spahr (1998), who suggest that the observed trends may be the result of one or more factors including channel evolution, decreasing salinity load from ground-water sources, and land-use changes. While it is hard to pinpoint the exact factor or combination of factors affecting decreases in salinity loads, an effort is made in this section to determine the most likely explanation.
Table 5. Monotonic trends in annual streamflow and flow-adjusted salinity and selected major ion concentrations, for streamflow-gaging station Cameo 09095500 (CAMEO), water years 1986 through 2003.
[ft3/s, cubic feet per second; mg/L/yr, milligrams per liter per year; NT, no trend; p value, probability of erroneously reporting an existing trend; per-cent, the trend slope expressed as percent of the median-annual concentra-tion; Trend slope, the rate that streamflow (average) or annual flow adjusted salinity concentration (median) is changing per unit per year; <, less than]
Variable tested
Streamflow, annual flow-adjusted salinity concentration, and major ions
Trend slope ( ft3/s or mg/L/yr)
Percent p value
Streamflow -24.8 -1.05 0.382 (NT)
Salinity -3.54 -.73 <.001
Calcium -.41 -.70 <.001
Magnesium -.19 -1.35 <.001
Sodium -.058 -.65 .004
Sulfate -2.00 -1.80 <.001
Chloride -.003 -.002 969 (NT)
16 Salinity Trends in the Upper Colorado River Basin Upstream From the Grand Valley Salinity Control Unit, Colorado

Channel Evolution
Channel evolution is thought to be a contributing fac-tor to reduced salinity loads because of the recent (last 50 to 60 years) decline in the rate of arroyo development or down-cutting in salt bearing bedrock of the Colorado Plateau (Gellis and others, 1989; Bauch and Spahr, 1998). The decrease in erosion may be due in part to the stabilization of channels by phreatophyte colonization or to partial equilibrium between stream channels and irrigation return flows. Phreatophyte colonization would stabilize the banks of arroyos and slow the erosion process. Greater equilibrium between stream chan-nels and irrigation return flows has most likely occurred as a result of time and reduced spillage and field runoff from improved irrigation systems. Gellis and others (1989) suggest a large-scale hydrologic pattern may play a role in sediment yield based on analogs from the late Holocene period, which indicated episodic arroyo development and subsequent chan-nel stabilization and sediment storage. Evaluation of trends in sediment load upstream from the Grand Valley Unit was beyond the scope of this report; therefore, it is not known whether sediment loads in any of the four regions actually are decreasing.
Ground-Water Inflows
Ground-water inflows to the Colorado River account for the majority of streamflow and salinity to the system. Warner and others (1985) reported that baseflow contributes 76 per-cent of the total streamflow in the Colorado River upstream from Glenwood Springs, and about 87 percent of the total streamflow in the Colorado River from Glenwood Springs to the outflow of the Grand Valley Unit. Warner and others (1985) also reported that the baseflow contributions account for most of the salinity load in the Colorado River. Because ground water contributes the vast majority of salinity load to the Colorado River, it is conceivable that the downward trends in salinity concentration and load observed upstream from the Grand Valley Unit are a direct result of changes in ground-water contributions. In agricultural areas, most of the ground water is derived from deep percolation and seepage. Deep percolation occurs when excess irrigation water is applied and seepage occurs from unlined irrigation water delivery systems (canals, laterals, and on-farm delivery ditches). Deep percolation and seepage move as ground water toward and into streams and mobilize salts in the process. Ground-water inflow to streams also comes from natural sources such as saline springs that drain evaporite and saline bedrock forma-tions in all four regions. Dissolution of evaporite formations account for approximately 60 percent of the salinity in the Colorado River upstream from the Grand Valley Unit (Chafin and Butler, 2002). Downward trends in salinity load in the
Colorado River upstream from the Grand Valley Unit may have resulted from changes to flow paths or leachable salts in the evaporite formations. Investigation into possible changes in evaporite formations was beyond the scope of this report, and would most likely require some level of field investigations and a more extensive network of streamflow-gaging stations to monitor trends near evaporite springs and outcrops.
Several government programs, such as the USDA-Farm Services Agency, Agricultural Conservation Program (ACP), the USDA Interim Environmental Quality Incentives Pro-gram (Interim EQIP), and USDA EQIP programs all provided landowners with cost-share incentives to make irrigation system improvements. These programs were available to land owners during the 1986–2003 period and including irrigated areas upstream from the Grand Valley Unit. These improve-ment programs were not specifically for salinity control, but to improve overall water quality and to make efficient use of limited water supplies. These programs also had the added benefit of reducing salt mobilization because deep percola-tion and seepage were reduced. The NRCS estimates that approximately 25 percent of irrigated land upstream from the Grand Valley Unit was improved (more efficient irrigation systems and lined water delivery systems) under the ACP, Interim EQIP, and regular EQIP programs or as part of a pri-vate endeavor (Dennis Davidson, NRCS, oral commun., 2005) from 1986 through 2003.
The estimated annual reduction in ground water salinity loading (if any) that resulted from the salinity control work in Region 4 was calculated using information provided by the NRCS. In Region 4, the region with the highest salinity load and largest downward trend, there are approximately 53,000 acres of irrigated land, of which the NRCS estimates 25 percent have been improved as of 2003. This amounts to approximately 13,250 acres improved. A study done by the NRCS (2005) for the Silt Project (not shown in fig. 2 but located near the town of Silt in Region 4) reported that about 2 tons per irrigated acre are contributed to the Colorado River each year from the project area. The study also reported that there would be a reduction in salinity load of approximately 28 percent from the project area after irrigation system improvements were installed. When these numbers are used to estimate reductions in salinity load for 25 percent of irrigated lands in Region 4, the estimated reductions equate to roughly 7,400 tons. This amount of salinity reduction is equal to about 5.9 percent of the total decrease in salinity load that occurred from 1986 through 2003 in Region 4 (125,000 tons or about 6,950 tons/yr, table 4). It is possible that the reduction in salin-ity load from salinity control projects was underestimated. It is likely that other factors are controlling salinity load upstream from the Grand Valley Unit. No data were available to estimate salinity load reductions from ACP, Interim EQIP, and regular EQIP programs in the other regions; therefore, no reduction estimates were made.
Factors Affecting Trends in Salinity Loads in the Colorado River Upstream from the Grand Valley Salinity Control Unit 17

Land-Use Changes
Salinity loads in the Colorado River may be affected by a change in land use from agricultural to residential or industrial settings. Irrigation return flow picks up salts as it percolates through soluble formations. These salts are carried along in the ground-water flow system until they are discharged into streams (Bauch and Spahr, 1998). In the event that agricultural land is converted to a residential or industrial use, it is possible that the amount of water that percolates into the ground (and subsequently picks up salts and discharges them into streams) will decrease, because there is less irrigated land and therefore less irrigation water applied. It is assumed for this discussion that the area of irrigated land will decrease because of road construction and housing developments. Although the actual decrease (if any) in water applied is not known, an inference can be made about land-use conversion based on the number of irrigated acres in production over time using a geographic information system (GIS). The inference is that as land is con-verted from an agricultural setting to a residential or industrial setting, the number of irrigated acres decreases; therefore, if no decrease in irrigated land is observed, it is assumed that no land-use change (or change in salinity load) has occurred.
Data for a GIS analysis are available for determining how many acres of irrigated land existed in Region 4 in 1993 and in 2000 (Techni Graphic Systems, Inc., 2003). Irrigated lands data for Regions 1 through 3 also were available; however, only Region 4 was investigated because it was the region with the highest salinity load and largest downward trend. In Region 4, approximately 53,680 acres were irrigated in 1993, and approximately 54,670 acres were irrigated in 2000. Some degree of error is associated with the GIS data used to estimate irrigated acres in Region 4, primarily because of the impre-cise nature of remotely sensing vegetation/crop types using spectral imaging. However, because the data indicate a small increase in irrigated acres, it was assumed that the number of irrigated acres probably was not decreasing. No decrease in the amount of irrigated land from 1993 to 2000 in Region 4 indicates either that there was no change in land use, or that land use change did not decrease the amount of irrigated land in Region 4 during that period. Thus, the downward trends in salinity load from 1993 to 2000 would not be the result of land-use change even though population estimates indicate that the population in Region 4 had increased by 46 percent from 1991 to 2001. It is possible that previously unirrigated portions of Region 4 were the setting for any new develop-ment that occurred. If this were the case, the new development on previously unirrigated land may have caused an increase in salinity loads, which in turn offset other factors that were causing salinity loads to decrease. This scenario may help explain why trends in flow-adjusted salinity load decreased at a slower rate during the latter portion of the 1986 to 2003 period, but does not explain why flow-adjusted salinity loads were decreasing at a relatively higher rate during the early part of the period (fig. 4, Colorado River near Cameo, Colorado).
Summary and ConclusionsThe U. S. Geological Survey has completed extensive
studies and research in the Grand Valley Salinity Control Unit in Colorado that provide information to aid the U.S. Bureau of Reclamation and the Natural Resources Conservation Service in determining where salinity control work may provide the best results, and to what extent salinity control work was effec-tive in reducing salinity concentrations and loads in the Colo-rado River. Reports published by the U. S. Geological Survey indicate that salinity concentrations and loads are decreasing below the Grand Valley Salinity Control Unit, and that the decreases are likely the result of salinity control work. Several reports also document decreasing salinity levels upstream from the Grand Valley Salinity Control Unit. As a result of those previous findings, the U.S. Bureau of Reclamation entered into a cooperative agreement with the U. S. Geological Survey to investigate salinity trends in selected areas bracketing the Grand Valley Salinity Control Unit and regions upstream from the Grand Valley Salinity Control Unit.
Six streamflow-gaging stations and four regions upstream from the Grand Valley Salinity Control Unit were selected for evaluation based on unique features that control hydrology and salinity, and on streamflow-gaging-station location. The regions are the Eagle River Basin (Region 1), Colorado River headwaters to Glenwood Springs (Region 2), the Roaring Fork River Basin (Region 3), and the region between Glenwood Springs and Cameo along the main-stem of the Colorado River (Region 4). It was determined in previous studies that the highest rate of downward trend upstream from the Grand Valley Salinity Control Unit occurred from 1986 through 1993. Data from 1986 through 2003 were used in this study to determine if the trends reported in previous studies are still present and if the rate of trend is changing.
Mean-annual streamflow volumes from each region ranged from 0.32 million acre-ft from Region 4 to about 1.05 million acre-ft from Region 2 for the 1986–2003 period. All four regions combined account for approximately 60 per-cent of the mean-annual streamflow at the Colorado River near Colorado-Utah State Line streamflow-gaging station (station SL) with Region 2 alone accounting for the highest percentage at approximately 24 percent.
Mean-annual salinity loads from each region ranged from 140,000 tons/yr from Region 1 to 572,000 tons/yr from Region 4 from 1986 through 2003. All four regions combined account for approximately 47 percent of the total salinity load at station SL with the highest loading region (Region 4) accounting for approximately 20 percent.
Mean-annual salinity concentrations at the four stream-flow-gaging stations near the outflow of each region ranged from 251 mg/L at the Roaring Fork River at Glenwood Springs streamflow-gaging station (station RF) to 411 mg/L at the Colorado River near Cameo streamflow-gaging sta-tion (station CAMEO) from 1986 through 2003. Regional
18 Salinity Trends in the Upper Colorado River Basin Upstream From the Grand Valley Salinity Control Unit, Colorado

estimates for mean-annual salinity concentration are 287 mg/L in Region 2 and 1,620 mg/L in Region 4.
Salinity trends for the 1986 to 2003 period were deter-mined for the six streamflow-gaging stations. Trend slopes at all six stations were downward and significant at or below the 5 percent level. The salinity trend analysis indicates that approximately 27 percent of the salinity decrease at station SL is because of reductions upstream from the Grand Valley Salinity Control Unit. Previous studies reported no trend for the Gunnison River near Grand Junction streamflow gaging-station (station GUNN) for the 1986 to 1993 period, and a much larger trend slope (-41,000 tons/yr) at station CAMEO, which is equal to about 66 percent of the decrease observed at station SL. These results indicate that the rate of trend had changed after 1993 at stations GUN and CAMEO.
To aid in the interpretation of the temporal trends at each station, graphical examination of the data also was done using the LOWESS smoothing technique. The LOWESS plots showed that flow adjusted salinity loads at the majority of sites decreased in the early 1990’s and were relatively stable in the mid to late 1990’s and early 2000’s.
Trend slopes for each region were different for the 1986 to 1993 and 1986 to 2003 periods. Region 1 had trend slopes of -3,330 tons/yr and -1,230 tons/yr for the 1986 to 1993 and 1986 to 2003 periods, respectively. From 1986 through 1993, a slightly higher percentage of the trend slope at sta-tion SL relative to 1986 through 2003 was accounted for. Region 2 had trend slopes of -6,020 and -940 tons/yr from 1986 through 1993 and 1986 through 2003, respectively. From 1986 through 1993, a higher percentage of the trend slope at station CAMEO and a much higher portion at SL relative to the 1986 to 2003 period was accounted for. These differences indicate salinity loads from Regions 1 and 2 were decreasing at a slower rate from 1993 to 2003 than during the 1986 to 1993 period. There was not a significant trend in annual flow-adjusted salinity load in Region 3 from 1986 through 1993, therefore the trend slope is assumed to equal zero for that period. There was, however, a significant trend in annual flow-adjusted salinity load from 1986 through 2003 in Region 3, and the trend slope was -1,580 tons/yr. Region 4 had trend slopes of -31,650 tons/yr (assuming the trend slope at station RF is zero from 1986 through 1993) and -6,950 tons/yr from 1986 through 1993 and 1986 through 2003, respectively. The trend slope from 1986 through 1993 was considerably steeper than the trend slope from 1986 through 2003, indicat-ing that the trend in salinity in Region 4 was decreasing at a slower rate from 1993 through 2003 relative to 1986 through 1993. The percent of trend slope accounted for by Region 4 at stations CAMEO and SL was roughly twice that of the other three regions combined. These results indicate that Region 4 plays a substantial role in controlling salinity trends upstream of the Grand Valley Salinity Control Unit.
The total decrease in flow-adjusted salinity load from 1986 through 1993 and 1986 through 2003 were calculated from the trend analysis. The data indicate that regions 1, 2, and 4 had a larger total decrease from 1986 through 1993 meaning
that some of the decreases in salinity load realized from 1986 through 1993 may have been offset by increases in salinity load after 1993. Station GUN and the Grand Valley Salinity Control Unit, however, both showed that the total change in flow-adjusted salinity load was larger from 1986 through 2003 meaning salinity loads from these areas continued to decline and were not offset by increases in salinity load after 1993 to the degree that other regions were.
Trends in salinity concentration and streamflow were tested at station CAMEO to determine if salinity concen-tration, streamflow, or both are controlling salinity loads upstream from the Grand Valley Salinity Control Unit. Trend tests of individual ion concentrations were included as poten-tial indicators of which sources (based on mineral composi-tion) may be controlling trends in the upper Colorado. No sig-nificant trend was detected for streamflow from 1986 through 2003 at station CAMEO; however, a significant downward trend was detected for salinity concentration. The trend slope indicates that salinity concentration is decreasing at a median rate of about 3.54 milligrams per liter per year (mg/L/yr). The concentrations of five major ions (calcium, magnesium, sodium, sulfate, and chloride) were tested for trends. The results indicate that processes within source areas with rock and soil types (or other unidentified sources) bearing calcium, sulfate, and magnesium had the largest effect on the downward trend upstream from station CAMEO.
Several possible explanations for decreases in salinity concentrations and loads upstream from the Grand Valley Salinity Control Unit have been documented in previous stud-ies. Recent studies suggest that the observed trends may be the result of one or more factors, including channel evolution, decreasing salinity load from ground-water sources, and land-use changes.
Channel evolution is thought to be a contributing factor to reduced salinity loads because of the recent (last 50 to 60 years) decline in the rate of arroyo development or downcutting in salt bearing bedrock of the Colorado Plateau. The decrease in erosion may be in part because of the stabi-lization of channels by phreatophyte colonization or partial equilibrium between stream channels and irrigation return flows. Downward trends in salinity load in the Colorado River upstream from the Grand Valley Salinity Control Unit also may have resulted from changes to flow paths or leach-able salts in the evaporite formations. The estimated annual reduction in ground-water salinity load that resulted from the irrigation system improvements in Region 4 was calculated using information provided by the Natural Resources Con-servation Service. When these numbers are used to estimate reductions in salinity load for 25 percent of irrigated lands in Region 4, the estimated reductions equate to roughly 7,400 tons. This amount of salinity reduction is equal to about 5.9 percent of the total decrease in salinity load that occurred from 1986 through 2003 in Region 4 (125,000 tons or about 6,950 tons/yr, table 4). It is possible that the salinity load reduction from the irrigation system improvement projects were underestimated; however, it is likely there are also other
Summary and Conclusions 19

factors are controlling salinity load upstream from the Grand Valley Salinity Control Unit.
Salinity loads in the Colorado River may be affected by a change in land use from agricultural to residential or indus-trial settings. If agricultural land is converted to a residential or industrial setting, the amount of water that percolates into the ground (and subsequently picks up salts and discharges them into surface streams) may be reduced because there is less irrigated land and, therefore, less irrigation water applied. The actual amount of reduction (if any) in water applied is not known, but an inference can be made about land-use conver-sion based on an estimate of the number of irrigated acres in production with time. The inference is that as land is converted from agricultural uses to residential or industrial uses, the number of irrigated acres decreases. If no decrease in irrigated land is observed, it is assumed that no land-use change (or change in salinity load) has occurred. In Region 4, approxi-mately 53,680 acres were irrigated in 1993, and approximately 54,670 were irrigated in 2000. No decrease in the amount of irrigated land from 1993 to 2000 in Region 4 indicates that there was either no change in land use, or that land-use change did not decrease the amount of irrigated land in Region 4. Thus, the downward trends in salinity load would not be the result of land-use change.
References Cited
Bauch, N. J., and Spahr, N.E., 1998, Salinity trends in surface waters of the upper Colorado River Basin, Colorado: Jour-nal of Environmental Quality, v. 27, no. 3, p. 640–655.
Butler, D.L., 1996, Trend analysis of selected water-quality data associated with salinity-control projects in the Grand Valley, in the lower Gunnison River basin, and at Meeker Dome, western Colorado: U.S. Geological Survey Water-Resources Investigations Report 95–4274, 38 p.
Butler, D.L., 1998, Estimated decreases in dissolved-solids loads in four tributaries to the Colorado River in the Grand Valley, Colorado, 1973–96: U.S. Geological Survey Fact Sheet FS–159–97, 6 p.
Chafin, D.T., and Butler, D.L., 2002, Dissolved-solids-load contributions of the Pennsylvanian Eagle Valley Evaporite to the Colorado River, west-central Colorado in Geologi-cal Society of America Special Paper 366: Late Cenozoic Evaporite Tectonism and Volcanism in West-Central Colo-rado: v. 366, No. 0, p. 149–156.
Cleveland, W.S., 1979, Robust locally weighted regression and smoothing scatterplots: Journal of American Statistical Association, v. 74, no. 368, p. 829–836.
Gellis, A.C., Hereford, R., and Schumm, S.A., 1989, Geo-morphic and hydrologic control of sediment and salt loads in the Colorado River Basin: Significance for conservation and land management: U.S. Geological Survey Open-File Report 89–121, 37 p.
Hem, J.D., 1970, Study and interpretation of the chemical characteristics of natural water (2d ed.): U.S. Geological Survey Water-Supply Paper 1473, 363 p.
Hirsch, R.M., Alexander, R.B. and Smith, R.A., 1991, Selec-tion methods for the detection and estimation of trends in water quality: Water Resources Research, v. 27, no. 5, p. 803–813.
Kircher, J.E., Dinicola, R.S., and Middelburg, R.M., 1984, Trend analysis of salt load and evaluation of the frequency of water-quality measurements for the Gunnison, the Colorado, and the Dolores Rivers in Colorado and Utah: U.S. Geological Survey Water-Resources Investigations Report 84–4048, 69 p.
Liebermann, T.D., Middelburg, R.F., and Irvine, S.A., 1987, User’s manual for estimation of dissolved-solids concentra-tions and loads in surface water: U.S. Geological Survey Water-Resources Investigations Report 86–4124, 51 p.
Liebermann T.D., Mueller, D.K., Kircher, J.E., and Choquette, A.F., 1989, Characteristics and trends of streamflow and dissolved solids in the upper Colorado River Basin, Ari-zona, Colorado, New Mexico, Utah, and Wyoming: U.S. Geological Survey Water-Supply Paper 2358, 64 p.
Natural Resources Conservation Service, 2005, Silt salinity control project draft plan and environmental assessment, Garfield County, Colorado: 55 p.
Northwest Colorado Council of Governments, 2002, 2002 Eagle River water quality management plan, Colorado plan-ning and management region 12: Regional Water Quality Management Plan Report, 36 p.
PRISM Group, 2006, Annual climatology data at URL: http://mistral.oce.orst.edu/www/mapserv/nn/index.phtml?vartype=ppt&year1=2003&year0=2003, accessed July 2005.
Rantz, S.E., and others, 1982, Measurement and computation of streamflow—Volume 1, Measurement of stage and dis-charge: U.S. Geological Survey Water-Supply Paper 2175, 284 p.
SAS Institute, Inc., 1999, SAS/STAT User’s Guide, version 8: Cary, N.C., SAS Institute, Inc., volumes 1–5, 3,848 p.
Schertz, T.L., Alexander, R.B., and Ohe, D.J., 1991, The com-puter program EStimate TREND (ESTREND), a system for the detection of trends in water-quality data: U.S. Geologi-cal Survey Water-Resources Investigations Report 91–4040, 63 p.
20 Salinity Trends in the Upper Colorado River Basin Upstream From the Grand Valley Salinity Control Unit, Colorado

Sen, P.K., 1968, Estimates of the regression coefficient based on Kendall’s tau: Journal of the American Statistical Asso-ciation, v. 63, p. 1379–1389.
Smith, R.A., Hirsch, R.M., and Slack, J.R., 1982, A study of trends in total phosphorus measurements at NASQAN stations: U.S. Geological Survey Water-Supply Paper 2190, 34 p.
State of Colorado, 2005, State of Colorado demography page—Colorado County Profile System: various counties 1991–2001, accessed May 11 at URL http://dola.colorado.gov/demog/ mule1.cfm
Techni Graphic Systems, Inc., 2003, Colorado River Deci-sion Support System 1993 Irrigated Parcels, Data available from Colorado River Decision Support System, Division 5– Colorado, http://cdss.state.co.us/DNN/Colorado/tabid/54/Default.aspx, accessed August 23, 2005.
U.S. Geological Survey, 1997–present, National field manual for the collection of water-quality data: U.S. Geological Survey Techniques of Water-Resources Investigations, book 9, chaps. A1–A9, 2 volumes variously paged.
U.S. Geological Survey, 2000 to 2002, Water resources data for Colorado, water years 1984–2002 v. 2, Colorado River Basin: U.S. Geological Survey Water-Data Reports CO–84–2 to CO–02–2 (published annually).
U.S. Department of the Interior, 2003, Quality of water Colo-rado River Basin: Bureau of Reclamation Progress Report No. 21, 89 p.
Vaill, J. E., and Butler, D.L., 1999, Streamflow and dissolved-solids trends, through 1996, in the Colorado River Basin upstream from Lake Powell–Colorado, Utah, and Wyoming: U.S. Geological Survey Water-Resources Investigations Report 99–4097, 47 p.
Wagner, R.J., Mattraw, H.C., Ritz, G.F., and Smith, B.A., 2000, Guidelines and standard procedures for continuous water-quality monitors: Site selection, field operation, cali-bration, record computation, and reporting: U.S. Geological Survey Water-Resources Investigations Report 00–4252, 53 p.
Warner, J.W., Heimes, F.J., and Middelburg, R.F., 1985, Ground-water contribution to the salinity of the Upper Colorado River Basin: U.S. Geological Survey Water-Resources Investigations Report 84–4198, 113 p.
References Cited 21

Publishing support provided by:Rolla Publishing Service Center
For more information concerning this publication, contact:Director, USGS Colorado Water Science CenterBox 25046, MS 415 Denver Federal CenterDenver, CO 80225(303) 236–4882
Or visit the Colorado Water Science Center Web site at:http://co.water.usgs.gov

Back cover.—Photograph 1: The Colorado River near Rifle, Colorado, 2003 (photograph taken by Win Wright, U.S. Geological Survey, Denver, Colorado). Photograph 2: Irrigation canal west of Rifle, Colorado, 2003 (photograph taken by Win Wright, U.S. Geological Survey, Denver, Colorado). Photograph 3: Side roll sprinkler irrigation system near Rifle, Colorado, 2003 (photograph taken by Win Wright, U.S. Geological Survey, Denver, Colorado).
Photo 1
Photo 3
Photo 2

Leib and others—Salinity Trends in the U
pper Colorado River Basin, Colorado, 1986–2003—
Scientific Investigations Report 2007–5288
Printed on recycled paper