2017 Colorado River Annual Operating Plan...2017 Colorado River Annual Operating Plan Colorado River...
26
2017 Colorado River Annual Operating Plan Colorado River Management Work Group Final Consultation September 8, 2016
Transcript of 2017 Colorado River Annual Operating Plan...2017 Colorado River Annual Operating Plan Colorado River...

2017 Colorado River Annual Operating Plan
Colorado River Management Work GroupFinal ConsultationSeptember 8, 2016

2017 Colorado River AOPFinal Consultation Meeting
• Welcome and Introductions – Brent Rhees / Jennifer McCloskey• Opening Remarks – Chris Cutler / Steve Hvinden• Upper Basin Hydrology and Operations – Paul Davidson• Lower Basin Hydrology and Operations – Noe Santos• 2017 AOP Review Process – Chris Cutler / Steve Hvinden• Review of Draft 2017 AOP – CRMWG • Conclusion/Wrap-up - Chris Cutler / Steve Hvinden• Next Steps• Reminder of Future Meeting Date• Adjourn
2

Upper Colorado River Basin Hydrology and Operations
3

4
87%
86%
54%
79%
74%
1 Percent of average based on period 1981-2010.
http://www.usbr.gov/uc/water/basin/
ReservoirApr-Jul
Observed (KAF)
Percent of
Average1
Fontenelle 650 90%
Flaming Gorge 1,048 107%
Blue Mesa 602 89%
Navajo 562 76%
Powell 6,610 92%
Basin StorageAs of
9/5/2016
Upper Basin Storage
April to July 2016 Observed Inflow

5
87%
86%
54%
79%
74%
1 Percent of average based on period 1981-2010.
http://www.usbr.gov/uc/water/basin/
ReservoirWater YRForecast
(KAF)
Percent of
Average1
Fontenelle 945 87%
Flaming Gorge 1,290 89%
Blue Mesa 840 88%
Navajo 915 93%
Powell 9,630 89%
Basin StorageAs of
9/5/2016
Upper Basin Storage
CBRFC Unregulated Inflow Forecastdated August 1, 2016
Water Year 2017 Forecasted Inflow

6

Projected OperationsWater Years 2016 and 2017
7

8
Lake Powell 2016 Operating TierUpper Elevation Balancing
• Tier was set using the August 2015
• April Adjustment to Balancing
• Goal: balance contents of Lake Powell and Lake Mead by end of water year– release 8.23 maf - 9.0 maf– Currently projecting 9.0 maf release

9

1,219.6 26.120 mafLake Powell Lake Mead3,70024.322 maf
Not to Scale
16.2 maf17.3 maf
1,1453,651
2.5 maf
1.9 maf
Dead StorageDead Storage
0.0 maf0.0 maf 8953,370
1,105 12.2 maf
5.9 maf 3,525
1,078.1 feet9.85 maf in storage
38% of capacity
3,606.0 feet12.33 maf in storage
51% of capacity
End of Water Year 2015September 30, 2015
9.00 maf
Unregulated Inflow into Powell = 10.17 maf (94% of average)
10
9.5 maf 3,575 9.6 maf1,075
1,025 6.0 maf

1,219.6 26.120 mafLake Powell Lake Mead3,70024.322 maf
Not to Scale
16.2 maf17.3 maf
1,1453,651
2.5 maf
1.9 maf
Dead StorageDead Storage
0.0 maf0.0 maf 8953,370
1,105 12.2 maf
5.9 maf 3,525
1,076.0 feet9.68 maf in storage
37% of capacity
3,612.1 feet12.95 maf in storage
53% of capacity
End of Water Year 2016 ProjectionsAugust 2016 24-Month Study Most Probable Inflow Scenario1
9.00 maf
Projected Unregulated Inflow into Powell1 = 9.78 maf (90% of average)
11
9.5 maf 3,575 9.6 maf1,075
1,025 6.0 maf
1 WY 2016 unregulated inflow into Lake Powell is based on the CBRFC forecast dated 8/1/16.

1,219.6 26.120 mafLake Powell Lake Mead3,70024.322 maf
16.2 maf
9.5 maf 9.6 maf
17.5 maf1,145
1,075
3,652
3,575
2.5 maf
1.9 maf
Dead StorageDead Storage
0.0 maf0.0 maf 8953,370
1,105 12.2 maf
5.9 maf 3,525 1,025 6.0 maf
End of Calendar Year 2016 ProjectionsAugust 2016 24-Month Study Most Probable Inflow Scenario1
1,078.9 feet9.92 maf in storage
38% of capacity
3,605.8 feet12.32 maf in storage
51% of capacity
1 WY 2016 unregulated inflow into Lake Powell is based on the CBRFC forecast dated 8/1/16.
Based on a 9.00 maf release pattern from Lake Powell in Water Year 2017
12
Not to Scale

Lake Powell 2017 Operating Tier Scenarios Based on August 2016 modeling
Inflow Scenario
Operating TierRelease Volume
MinimumProbable
Upper Elevation Balancing9.0 maf
MostProbable
Upper Elevation Balancing9.0 maf
Maximum Probable
Upper Elevation Balancing11.9 maf
13

14
3,605.83’
Lake Powell peaked on 7/9/16Elevation: 3621.45 feetContent: 13.9 maf, 57% Full
End of CY 2017 Projection:3607.21 feet(Range 3,580 to 3,645 feet)
Water Year 2017 projectionsMost: 9.0 maf releaseMax: 11.9 maf release Min: 9.0 maf release

15
April adjustment to Balancing releases
April adjustment to Equalization releases
No April Adjustment

16

Lower Colorado River Basin
Hydrology and Operations
17

Colorado River Basin Storage(as of September 5, 2016)
Reservoir Percent Full
Storage(MAF)
Elevation (Feet)
Lake Powell 54% 13.04 3,613
Lake Mead 37% 9.63 1,075
Total System Storage* 51% 30.60 NA
*Total system storage was 30.76 maf or 52% this time last year
18

1,219.6 26.120 mafLake Powell Lake Mead3,70024.322 maf
16.2 maf
9.5 maf 9.6 maf
17.5 maf1,145
1,075
3,652
3,575
2.5 maf
1.9 maf
Dead StorageDead Storage
0.0 maf0.0 maf 8953,370
1,105 12.2 maf
5.9 maf 3,525 1,025 6.0 maf
End of Calendar Year 2016 ProjectionsAugust 2016 24-Month Study Most Probable Inflow Scenario1
1,078.9 feet9.92 maf in storage
38% of capacity
3,605.8 feet12.32 maf in storage
51% of capacity
1 WY 2016 unregulated inflow into Lake Powell is based on the CBRFC forecast dated 8/1/16.
Based on a 9.00 maf release pattern from Lake Powell in Water Year 2017
19
Not to Scale

Lake Powell & Lake Mead Operational TableOperational Tiers for Water/Calendar Year 20171
20
3,605.83 ftJan 1, 2017 Projection
1,078.93 ftJan 1, 2017 Projection
1 Lake Powell and Lake Mead operational tier determinations were based on August 2016 24-Month Study projections and will be documented in the 2017 AOP.

21
End of CY 2016 Projection: 1,078.9 feet (38% full)(Range 1,078.7 to 1,079.3 feet)
End of CY 2017 Projection:1,074.3 feet (37% full)(Range 1,073 to 1,109 feet)

Lower Basin Side Inflows – WY/CY 20161,2
Intervening Flow from Glen Canyon to Hoover DamMonth in WY/CY 2015
5-Year Average Intervening Flow
(KAF)
ObservedIntervening Flow
(KAF)
ObservedIntervening Flow (% of Average)
Difference From 5-Year Average
(KAF)
HIS
TOR
ICAL
October 2015 69 118 171% 49
November 2015 56 41 73% -15
December 2015 54 43 79% -12
January 2016 62 89 145% 28
February 2016 73 81 111% 8
March 2016 55 31 56% -24
April 2016 53 68 127% 14
May 2016 37 50 134% 13
June 2016 21 14 68% -7
July 2016 78 70 90% -6
August 2016 124 106 85% -18
FUTU
RE
September 2016 112
October 2016 69
November 2016 56
December 2016 54
WY 2016 Totals 795 822 103% 28
CY 2016 Totals 795 800 101% 6
1 Values were computed with the LC’s gain-loss model for the most recent 24-month study.2 Percents of average are based on the 5-year mean from 2011-2015.22
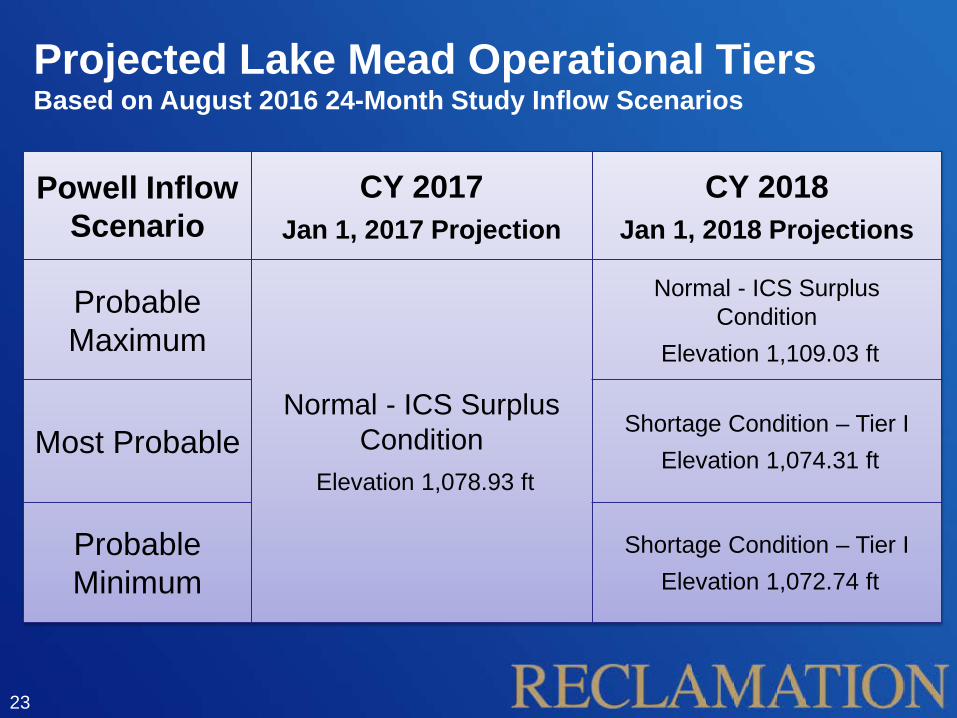
Projected Lake Mead Operational TiersBased on August 2016 24-Month Study Inflow Scenarios
Powell Inflow Scenario
CY 2017Jan 1, 2017 Projection
CY 2018Jan 1, 2018 Projections
Probable Maximum
Normal - ICS Surplus Condition
Elevation 1,078.93 ft
Normal - ICS Surplus Condition
Elevation 1,109.03 ft
Most ProbableShortage Condition – Tier I
Elevation 1,074.31 ft
Probable Minimum
Shortage Condition – Tier IElevation 1,072.74 ft
23

YAO Operations Update
• Brock Reservoir and Senator Wash2016 YTD accumulated storage1
–Brock 106,994 AF
–Senator Wash 48,970 AF
• Excess Flows to Mexico
2016 YTD total2 2,536 AF
1 Provisional year-to-date total through September 1, 20162 Provisional year-to-date total through September 5, 2016
24

YAO Operations Update
• Pumped drainage return flows from the Wellton-Mohawk Irrigation and Drainage District – Flow at station 0+00 on the Main Outlet Drain from
January through July 2016 was 54,800 AF at 2,654 ppm
• Provisional drainage Flows to the Colorado River– From the South Gila Drainage Wells
January through April 2016 was14,570 AF at 1,672 ppm
– From the Yuma Mesa Conduit January through July 2016 was 0 AF
25
25

2017 Colorado River Annual Operating Plan
Colorado River Management Work GroupFinal ConsultationSeptember 8, 2016
26