Colorado River sediment transport
28
Colorado River sediment transport 1. Natural sediment supply limitation and the influence of Glen Canyon Dam David J. Topping U.S. Geological Survey, Reston, Virginia David M. Rubin U.S. Geological Survey, Menlo Park, California L. E. Vierra Jr. Department of Civil and Environmental Engineering, University of Colorado, Boulder Abstract. Analyses of flow, sediment-transport, bed-topographic, and sedimentologic data suggest that before the closure of Glen Canyon Dam in 1963, the Colorado River in Marble and Grand Canyons was annually supply-limited with respect to fine sediment (i.e., sand and finer material). Furthermore, these analyses suggest that the predam river in Glen Canyon was not supply-limited to the same degree and that the degree of annual supply limitation increased near the head of Marble Canyon. The predam Colorado River in Grand Canyon displays evidence of four effects of supply limitation: (1) seasonal hysteresis in sediment concentration, (2) seasonal hysteresis in sediment grain size coupled to the seasonal hysteresis in sediment concentration, (3) production of inversely graded flood deposits, and (4) development or modification of a lag between the time of a flood peak and the time of either maximum or minimum (depending on reach geometry) bed elevation. Analyses of sediment budgets provide additional support for the interpretation that the predam river was annually supply-limited with respect to fine sediment, but it was not supply-limited with respect to fine sediment during all seasons. In the average predam year, sand would accumulate and be stored in Marble Canyon and upper Grand Canyon for 9 months of the year (from July through March) when flows were dominantly below 200 –300 m 3 /s; this stored sand was then eroded during April through June when flows were typically higher. After closure of Glen Canyon Dam, because of the large magnitudes of the uncertainties in the sediment budget, no season of substantial sand accumulation is evident. Because most flows in the postdam river exceed 200 –300 m 3 /s, substantial sand accumulation in the postdam river is unlikely. 1. Introduction River channels range in type from classical self-formed al- luvial channels to bedrock channels. In self-formed alluvial channels the sediment supply is either in equilibrium or ex- ceeds the transport capacity of the channel over long time- scales, whereas in bedrock channels, the transport capacity of the channel exceeds the supply of sediment over long time- scales. Most rivers fall between these two channel types and may be expected to show some evidence of sediment supply limitation with respect to some portion of the size classes of sediment in transport. The Colorado River in Glen, Marble, and Grand Canyons (Figure 1) is one such river. Though in many places the river bed consists of patches of erodible fine sediment (i.e., sand and finer material) overlying gravel and bedrock, in at least 10 reaches in Marble and Grand Canyons the river flows directly over bedrock (R. Anima, U.S. Geological Survey, personal communication, 1999). Therefore, although the bed of the river is, in many places, easily erodible, the river displays some geomorphic evidence of sediment supply limitation. In addition to this geomorphic signature, sediment supply limitation produces four effects found in sediment-transport, sedimentologic, and bed-topographic data: (1) seasonal hyster- esis in sediment concentration, (2) seasonal hysteresis in sed- iment grain size coupled to the seasonal hysteresis in sediment concentration, (3) production of inversely graded flood depos- its, and (4) development or modification of a lag between the time of a flood peak and the time of either maximum or minimum (depending on reach geometry) bed elevation. The Colorado River is a good natural laboratory for studying these effects of sediment supply limitation in a fluvial system because of the wealth of available flow and sediment-transport data collected both prior to and after the closure of Glen Canyon Dam in 1963. As in the postdam era [Rubin et al., 1998; Top- ping et al., this issue], sediment-transport rates in the predam era varied independently of discharge and as a function of the grain sizes of sediment present in the river. Seasonal decreases in the upstream supply of sediment during the annual snow- melt flood have been observed to produce significant hysteresis in suspended-sediment concentration at the Grand Canyon gage [Leopold and Maddock, 1953]. Decreases in the predam upstream supply of sediment have been interpreted to cause coarsening of the bed [Colby, 1964; Burkham, 1986] and scour Copyright 2000 by the American Geophysical Union. Paper number 1999WR900285. 0043-1397/00/1999WR900285$09.00 WATER RESOURCES RESEARCH, VOL. 36, NO. 2, PAGES 515–542, FEBRUARY 2000 515
Transcript of Colorado River sediment transport

Colorado River sediment transport1. Natural sediment supply limitation and the influenceof Glen Canyon DamDavid J. ToppingU.S. Geological Survey, Reston, Virginia
David M. RubinU.S. Geological Survey, Menlo Park, California
L. E. Vierra Jr.Department of Civil and Environmental Engineering, University of Colorado, Boulder
Abstract. Analyses of flow, sediment-transport, bed-topographic, and sedimentologic datasuggest that before the closure of Glen Canyon Dam in 1963, the Colorado River inMarble and Grand Canyons was annually supply-limited with respect to fine sediment (i.e.,sand and finer material). Furthermore, these analyses suggest that the predam river inGlen Canyon was not supply-limited to the same degree and that the degree of annualsupply limitation increased near the head of Marble Canyon. The predam Colorado Riverin Grand Canyon displays evidence of four effects of supply limitation: (1) seasonalhysteresis in sediment concentration, (2) seasonal hysteresis in sediment grain size coupledto the seasonal hysteresis in sediment concentration, (3) production of inversely gradedflood deposits, and (4) development or modification of a lag between the time of a floodpeak and the time of either maximum or minimum (depending on reach geometry) bedelevation. Analyses of sediment budgets provide additional support for the interpretationthat the predam river was annually supply-limited with respect to fine sediment, but it wasnot supply-limited with respect to fine sediment during all seasons. In the average predamyear, sand would accumulate and be stored in Marble Canyon and upper Grand Canyonfor 9 months of the year (from July through March) when flows were dominantly below200–300 m3/s; this stored sand was then eroded during April through June when flowswere typically higher. After closure of Glen Canyon Dam, because of the large magnitudesof the uncertainties in the sediment budget, no season of substantial sand accumulation isevident. Because most flows in the postdam river exceed 200–300 m3/s, substantial sandaccumulation in the postdam river is unlikely.
1. Introduction
River channels range in type from classical self-formed al-luvial channels to bedrock channels. In self-formed alluvialchannels the sediment supply is either in equilibrium or ex-ceeds the transport capacity of the channel over long time-scales, whereas in bedrock channels, the transport capacity ofthe channel exceeds the supply of sediment over long time-scales. Most rivers fall between these two channel types andmay be expected to show some evidence of sediment supplylimitation with respect to some portion of the size classes ofsediment in transport. The Colorado River in Glen, Marble,and Grand Canyons (Figure 1) is one such river. Though inmany places the river bed consists of patches of erodible finesediment (i.e., sand and finer material) overlying gravel andbedrock, in at least 10 reaches in Marble and Grand Canyons theriver flows directly over bedrock (R. Anima, U.S. GeologicalSurvey, personal communication, 1999). Therefore, although thebed of the river is, in many places, easily erodible, the riverdisplays some geomorphic evidence of sediment supply limitation.
In addition to this geomorphic signature, sediment supplylimitation produces four effects found in sediment-transport,sedimentologic, and bed-topographic data: (1) seasonal hyster-esis in sediment concentration, (2) seasonal hysteresis in sed-iment grain size coupled to the seasonal hysteresis in sedimentconcentration, (3) production of inversely graded flood depos-its, and (4) development or modification of a lag between thetime of a flood peak and the time of either maximum orminimum (depending on reach geometry) bed elevation. TheColorado River is a good natural laboratory for studying theseeffects of sediment supply limitation in a fluvial system becauseof the wealth of available flow and sediment-transport datacollected both prior to and after the closure of Glen CanyonDam in 1963. As in the postdam era [Rubin et al., 1998; Top-ping et al., this issue], sediment-transport rates in the predamera varied independently of discharge and as a function of thegrain sizes of sediment present in the river. Seasonal decreasesin the upstream supply of sediment during the annual snow-melt flood have been observed to produce significant hysteresisin suspended-sediment concentration at the Grand Canyongage [Leopold and Maddock, 1953]. Decreases in the predamupstream supply of sediment have been interpreted to causecoarsening of the bed [Colby, 1964; Burkham, 1986] and scour
Copyright 2000 by the American Geophysical Union.
Paper number 1999WR900285.0043-1397/00/1999WR900285$09.00
WATER RESOURCES RESEARCH, VOL. 36, NO. 2, PAGES 515–542, FEBRUARY 2000
515

of the bed [Leopold and Maddock, 1953; Brooks, 1958; Howardand Dolan, 1981; Burkham, 1986]. Furthermore, seasonal de-creases in the predam upstream supply of sediment have beeninterpreted to cause coarsening of the suspended sedimentduring the annual snowmelt flood, resulting in inversely gradedpredam flood deposits [Rubin et al., 1998].
Since March 1963, Glen Canyon Dam has regulated flows onthe Colorado River and has greatly diminished the supply ofsediment in lowermost Glen Canyon and in Marble and GrandCanyons. Growing public concern over perceived degradationof the riverine environment downstream from the dam culmi-nated in the completion of the Glen Canyon Dam Environ-mental Impact Statement [U.S. Department of the Interior,1995]. A major conclusion of this environmental impact state-ment was that the dam reduced the sand-transport capacity toa greater degree than it reduced the supply of sand, thustransforming a naturally net degradational system into one inwhich sand may accumulate over time. This conclusion wasreached by applying concepts developed in the framework ofclassical alluvial channels with ample supplies of sediment andwithout a detailed investigation of the flow and sediment-transport processes that operated in the potentially supply-limited predam bedrock-canyon river.
The goals of this investigation are to determine the degree towhich the predam Colorado River in Glen, Marble, and GrandCanyons was supply-limited with respect to fine sediment (i.e.,sand and finer material) and to quantify the major downstreamsediment-related impacts of Glen Canyon Dam. In this paperwe pursue these goals by first determining the degree to whichthe predam Colorado River displayed evidence of the foureffects of sediment supply limitation. Then, we construct andanalyze a sediment budget to determine if the predam andearly postdam river in Marble Canyon and upper Grand Can-yon met the integral constraint of supply limitation, that is, tosee if, and over what timescale, the river exported the finesediment supplied to it.
The work we present in this paper draws heavily on bothanalyses of historical flow and sediment-transport data col-
lected by the U.S. Geological Survey (USGS) on both theColorado River and its major tributaries and also on fieldworkthat we have conducted in the postdam river. Our study reachextends from Glen Canyon Dam to the Grand Canyon gage(Figure 1). For the purposes of this paper, Glen Canyon liesupstream from Lees Ferry, Marble Canyon extends from rivermile 0 at Lees Ferry to river mile 61.5 at the mouth of the LittleColorado River, and upper Grand Canyon extends from themouth of the Little Colorado River to the Grand Canyon gageat river mile 87.4. We present and analyze historical flow andsediment-transport data that were collected by the USGS atfive sites (four stream gages and one water-quality station).These sites are the Colorado River at Lees Ferry, Arizona(station number 09380000), herein referred to as the “LeesFerry gage”; the Colorado River near Grand Canyon, Arizona(station number 09402500), herein referred to as the “GrandCanyon gage”; the Paria River at Lees Ferry, Arizona (stationnumber 09382000), herein referred to as the “Paria River LeesFerry gage”; the Little Colorado River near Cameron, Arizona(station number 09402000), herein referred to as the “LCRnear Cameron gage”; and the Little Colorado River at Cam-eron, Arizona (station number 09401200), herein referred to asthe “highway 89 bridge at Cameron.”
2. Definition of Sediment Supply LimitationA complete definition of sediment supply limitation in a
fluvial system requires: (1) precise specification of the grainsizes for which the system is supply-limited and (2) the time-scale over which the system is supply-limited for these grainsizes. In this sense a reach of a river will be supply-limited withrespect to a certain sediment grain size over a chosen timescaleif, over that timescale, the river has the capacity to transportmore of that size class of sediment than is supplied to it.According to this definition most rivers are expected to exhibitsome degree of supply limitation. A second implication of thisdefinition is that sediment supply limitation does not require
Figure 1. Map of the Grand Canyon region showing the locations where the data presented and analyzedin this paper were collected. Numbers next to the locations of predam flood deposits indicate the river milesof these locations.
TOPPING ET AL.: COLORADO RIVER SEDIMENT TRANSPORT, 1516

that a river be erosional; net deposition of coarser sizes mayoccur even if a river is supply-limited with respect to finer sizes.
3. Hypothesized Effects of Sediment SupplyLimitation
In a reach that is supply-limited with respect to a specifiedsize class of sediment over a given timescale, four coupledeffects are hypothesized to result. First, within the timescaleover which the reach is supply-limited, hysteresis in transportrates of the specified size class will result [e.g., Nanson, 1974;Dunne and Leopold, 1978; Moog and Whiting, 1998]. Followingsediment-supplying events to the reach, transport rates of sed-iment in the supply-limited size class will initially increaseindependently of discharge, then subsequently decrease as thatsize class becomes depleted. As a result of the same process,transport rates of the supply-limited size class will be higher onthe rising limb than on the receding limb of a flood.
The interplay between different size classes of sediment in asupply-limited reach leads to the second effect of sedimentsupply limitation. Sediment input to a supply-limited reach willtravel downstream as an elongating “sediment wave,” with thefinest sizes (because of their lower settling velocities) travelingthe fastest. This sediment wave will have a component in thebed, the bed load, and the suspended load. As the front of asediment wave passes a given location, the sediment-transportrate will first increase as the grain size in the reach fines, thensubsequently decrease as the grain size in the reach coarsens[Topping et al., this issue]. Thus, associated with the hysteresisin sediment-transport rates described above, hysteresis willalso exist in sediment grain size during a flood passing througha supply-limited reach. The grain size of sediment in transporton the rising limb will be finer than that on the receding limbof the flood. Furthermore, by virtue of the physical linkagebetween particle settling velocity and suspended-sediment-transport rate [e.g., Rouse, 1937; Hunt, 1969; Smith, 1977;McLean, 1992], in the same flow conditions the transport rateof finer sediment will be greater than that of coarser sediment.Therefore, following a discrete sediment-supplying event, thetimescale over which a reach becomes supply-limited with re-spect to a finite amount of finer sediment is shorter than thatover which it becomes supply-limited with respect to an equiv-alent amount of coarser sediment.
The third hypothesized effect of sediment supply limitationfollows directly from the second effect. Because the grain sizeof sediment in suspension will coarsen over time during floodspassing through a supply-limited reach, the sediment availablefor deposition on floodplains, on channel margins, or in eddieswill coarsen through time. Thus deposits produced duringfloods passing through a supply-limited reach will coarsen up-ward [Iseya, 1989; Rubin et al., 1998].
The fourth hypothesized effect of sediment supply limitationhas to do with the temporal patterns of scour and fill of the bedduring floods passing through a supply-limited reach [Toppinget al., this issue]. If the upstream supply of sediment decreasesduring a flood, a lag may develop or be modified between thetime of the flood peak and the time of either maximum orminimum bed elevation. At a cross section where convergenceoccurs in the boundary shear stress field with increasing flow,the time of maximum bed elevation in a supply-limited casewill occur prior to that in a non–supply-limited case. Thus, atthis type of cross section, an observation of maximum bedelevation leading a flood peak, with scour beginning prior to
the flood peak, indicates the presence of sediment supply lim-itation. At a cross section where divergence occurs in theboundary shear stress field with increasing flow, the time ofminimum bed elevation in a supply-limited case will occur afterthat in a non–supply-limited case. However, because, at thissecond type of cross section, minimum bed elevation lags theflood peak in both the supply-limited and non–supply-limitedcases, an observation of minimum bed elevation lagging a floodpeak may suggest, but does not require, the presence of sedi-ment supply limitation. Therefore, as with the previously de-scribed hysteresis in sediment-transport rate and grain size,hysteresis may also exist in bed elevation at a cross sectionduring floods, and, depending on reach geometry, the presenceof this hysteresis can be used to deduce the presence of sedi-ment supply limitation.
4. Systematic Seasonal Changes in SedimentConcentration, Grain Size, and Bed Elevation:Evidence for Predam Annual Fine-SedimentSupply Limitation in Grand Canyon4.1. Coupled Hysteresis in Suspended-SedimentConcentration, Grain Size, and Bed Elevation
Calendar year 1954 provides a good example of the behaviorof suspended-sediment concentration, suspended-sedimentgrain size, and bed elevation during an annual predam floodcycle. The peak discharge of the 1954 snowmelt flood wasbelow average, and the duration was shorter than average,extending only from mid-April to mid-June (Figure 2a). Be-cause of this shorter than normal duration, little overlap ex-isted between the snowmelt flood and the onset of tributarysediment-supplying floods during the summer thunderstormseason. Thus 1954 provides a clear example of the response ofthe river to changes in the upstream supply of sediment duringthe annual snowmelt flood, without any of the complicationsdue to resupply of sediment to the river during the subsequentsummer thunderstorm season. As the upstream supply of sed-iment decreased during the 1954 snowmelt flood (Figure 2b),the suspended sand coarsened (Figure 2c) and the bed beganto scour (Figure 2d). Also, note that in 1954 the maximum bedelevation led the flood peak by about a week.
4.2. Vertical Grain-Size Trends in Predam Flood Depositsin Marble and Grand Canyons
Sediment deposited in eddies in the Colorado River pro-vides an accurate record of changes in suspended-sedimentgrain size during floods [Rubin et al., 1998; Topping et al., 1999,this issue]. To determine trends in grain size recorded in pre-dam flood deposits, we sampled predam flood deposits verti-cally for grain size at six sites in Marble and Grand Canyonsduring 1997 and 1998 (Figure 1). As we found in deposits ofthe 1996 flood experiment [Rubin et al., 1998; Topping et al.,1999] and the 1997 test flow [Topping et al., this issue], thepredam flood deposits in the majority of Marble Canyon (i.e.,below river mile 2) and Grand Canyon coarsened upward. Thiscoarsening occurred both by a decrease in the percentage ofsilt and clay and also by coarsening of the sand (Figure 3). Thedeposit at river mile 1 (at the head of Marble Canyon) did notcoarsen upward, however. In this deposit the silt and claycontent increased, and the sand fined upward.
4.3. Discussion
All four of the hypothesized effects of sediment supply lim-itation occurred in the predam Colorado River in Grand Can-
517TOPPING ET AL.: COLORADO RIVER SEDIMENT TRANSPORT, 1

TOPPING ET AL.: COLORADO RIVER SEDIMENT TRANSPORT, 1518

yon. The style of coupled hysteresis in suspended-sedimentconcentration, suspended-sediment grain size, and bed eleva-tion documented during the 1954 snowmelt flood suggests thatthe predam river was supply-limited with respect to fine sedi-ment (i.e., sand and finer material). The fact that this behaviorwas observed during the annual flood suggests that the time-scale over which this supply limitation occurred was a year orless. Furthermore, the observation that predam flood depositscoarsen upward in the majority of Marble and Grand Canyons,
suggesting a depletion of fines during floods, lends furthersupport to this supply-limited interpretation.
5. Evidence for Predam Differences in theDegree of Sediment Supply Limitation in Grandand Glen Canyons
The hydraulic geometry of the predam Colorado River inMarble and Grand Canyons was very different from that inGlen Canyon. Though the mean depths of the predam river inGlen, Marble, and Grand Canyons were comparable, the riverwas generally narrower (by about a factor of 1.5–2) and steeper(by a factor of 3–5) in Marble and Grand Canyons than it wasin Glen Canyon. Because of this difference in hydraulic geom-etry, the reach-averaged boundary shear stress, and hence thetransport capacity for a given supply of sediment, would prob-ably have been lower in Glen Canyon. Predam USGS sedimentrecords collected at the Lees Ferry and Grand Canyon gagesindicate that most of the sediment that passed the GrandCanyon gage first passed through Glen Canyon. Therefore,though the predam river in Marble and Grand Canyons wasprobably annually supply-limited with respect to fine sedimentby virtue of the difference in hydraulic geometry, the river inGlen Canyon may not have been. Howard and Dolan [1981]first suggested that because of the differences in hydraulicgeometry, bed elevation in the predam river in Marble and
Figure 3. Vertical trends in the silt and clay content and the median size of sand in predam flood depositsin Marble and Grand Canyons. Both the silt and clay content and the median size of sand are normalized bythe values measured near the base. The beds coarsened upward in probable response to depletion of the finersediment during floods. “RM” stands for river mile.
Figure 2. (Opposite) (a) The 1954 mean-daily dischargerecord from the Grand Canyon gage showing the seasonalseparation between tributary sediment-input events and theannual snowmelt flood. Tributary rivers that contributed to theobserved discharge peaks are indicated. Cross-hatched regionindicates the period from April 28, 1954, through June 14,1954, during which the data shown in Figures 2b–2d werecollected. (b) Hysteresis in the concentration of suspended siltand clay and suspended sand; arrows indicate the sequence ofmeasurements. Progressive depletion of the finer sedimentcaused the concentrations (for a given discharge) to be loweron the receding limb than on the rising limb. (c) Hysteresis inthe median grain size of the suspended sand. The suspendedsand was coarser (for a given discharge) on the receding limbthan on the rising limb. (d) Hysteresis in mean bed elevation.Stage is relative to gage datum.
519TOPPING ET AL.: COLORADO RIVER SEDIMENT TRANSPORT, 1

Grand Canyons was more sensitive to annual changes in thesediment supply than was bed elevation in the predam river inGlen Canyon. To determine the potential differences in thedegree of sediment supply limitation in Marble and GrandCanyons versus Glen Canyon, we examined: (1) the differencesin coupled hysteresis in suspended-sediment concentration,grain size, and bed elevation at the Grand Canyon and LeesFerry gages and (2) the differences in vertical trends in grain sizein predam flood deposits in Glen, Marble, and Grand Canyons.
5.1. Differences in Annual Hysteresis in SedimentConcentration and Grain Size
Because the groundwater and surface-water input to theColorado River between the Lees Ferry and Grand Canyongages is typically small, the downstream increase in flow be-tween these gages is minimal. Indeed, the long-term averageincrease in discharge between the Lees Ferry and Grand Can-yon gages based on data from water years 1923–1962 was only13 m3/s (i.e., an increase of only 3% over the mean-dailydischarge at Lees Ferry during this period). Because the down-stream increase in discharge is slight, suspended-sediment con-centration as a function of discharge at the two gages can becompared without correcting for downstream changes in flow.
In the predam era the magnitude of annual hysteresis insuspended-silt and clay concentration was comparable at eachgage (Figure 4a), but the magnitude of annual hysteresis insuspended-sand concentration was much greater at the GrandCanyon gage (Figure 4b). At the Grand Canyon gage, suspend-ed-sand concentrations were much lower during the periodfrom June 1 through July 20 (i.e., the last portion of the risinglimb and most of the receding limb of the typical snowmeltflood) than those measured in similar flows during the rest ofthe year. This systematic annual variation in suspended-sandconcentration at this site arose because the first portion of thesnowmelt flood reduced the supply of the finer (i.e., 0.0625–0.25 mm) sand (Figures 4c and 4d). Thus the annual hysteresisin suspended-sand concentration at the Grand Canyon gagewas coupled to an annual hysteresis in grain size, with thesuspended sand sampled from June 1 through July 20 typicallybeing coarser than that sampled during the rest of the year. Incontrast, at the Lees Ferry gage, relatively little annual hyster-esis in concentration or grain size existed for either the finer orthe coarser sand (Figures 4b, 4c, and 4d).
In addition to the difference between the magnitudes of theannual hysteresis in suspended-sand concentration a flow-dependent difference also existed between the sand-transportrates at the Grand Canyon and Lees Ferry gages. On average,in the predam river, more silt and clay were in suspension thansand, but flow-dependent differences in sand-transport rateswere large enough to dominate the total fine-sediment (i.e.,sand, silt, and clay) data [see Howard and Dolan, 1981, Figure12]. Sand-transport rates were generally higher at the LeesFerry gage than at the Grand Canyon gage during low flows,whereas the opposite was true during high flows depending onseason. In flows below about 200–300 m3/s, suspended-sandconcentrations were substantially higher at the Lees Ferry gagethan at the Grand Canyon gage (Figures 4b, 4c, and 4d). Incontrast, in flows in excess of about 400–500 m3/s the oppositewas generally true but also depending on both grain size andseason (Figures 4c and 4d). At these higher flows and occur-ring independently of season, the concentration of suspendedcoarser (i.e., .0.25 mm) sand was typically higher at the GrandCanyon gage than at the Lees Ferry gage. For finer sand,
however, sand-transport rates at the two gages generally dif-fered only during the initial portion of the annual snowmeltflood (i.e., when flows first exceeded about 400–500 m3/s).During this initial period of higher flows, concentrations ofsuspended finer (0.0625–0.25 mm) sand were substantiallyhigher at the Grand Canyon gage. Then, in similar high flowsduring the latter part of the snowmelt flood (i.e., after aboutJune 1), concentrations of suspended finer sand at the GrandCanyon gage decreased to become comparable to those at theLees Ferry gage.
5.2. Discussion of Differences in Annual Hysteresisin Sediment Concentration and Grain Size
The difference between the magnitudes of coupled annualhysteresis in suspended-sand concentration and grain size be-tween the Grand Canyon and Lees Ferry gages suggests thatthe predam Colorado River in Grand Canyon was annuallysupply-limited with respect to sand to a far greater degree thanit was in Glen Canyon. Though annual hysteresis existed in theconcentration of silt and clay at both gages, it was of the samemagnitude, suggesting that the degree of annual supply limi-tation with respect to silt and clay was similar in both Grandand Glen Canyons. Because substantial annual hysteresis insuspended-sand concentration existed in the finer (0.0625–0.25mm) sand at the Grand Canyon gage, the river in GrandCanyon was probably supply-limited with respect to this sizeclass of sand on an annual timescale. This represented anannual supply limitation with respect to 80–90% of the sizes ofsand in transport (based on the data presented in Figure 4).Because little annual hysteresis existed in the concentration ofcoarser (.0.25 mm) sand at the Grand Canyon gage, the riverin Grand Canyon was either not annually supply-limited withrespect to this size class of sand, or it was supply limited withrespect to this size class of sand on a timescale that was longerthan either (1) the period between sediment-resupplyingevents to Marble Canyon and upper Grand Canyon or (2) thelength of time required to transport sand coarser than 0.25 mmout of Marble Canyon and upper Grand Canyon.
The difference in sand-transport rates between the Grand
Figure 4. (Opposite) Predam sediment concentrations as afunction of water discharge at the Lees Ferry and Grand Can-yon gages shown at the same scale. Cross-hatched region over-laying the Grand Canyon gage data in Figure 4 indicates theregion in concentration-discharge space occupied by the LeesFerry data. Silt and clay concentrations were generally uniformat both gages, indicating no demonstrable storage of silt andclay in Marble Canyon and the upper Grand Canyon. At lowflows, sand concentrations at the Lees Ferry gage were higherthan at Grand Canyon gage, indicating sand accumulation inMarble Canyon and upper Grand Canyon. At high flows thestored sand was eroded from this reach, as reflected by theinitially higher sand concentrations at the Grand Canyon gage.Sources of data are as follows: at the Grand Canyon gage, the620 suspended-sediment samples collected (with modern sam-pling equipment) from June 6, 1944, through December 19,1962, and analyzed for grain size, and at the Lees Ferry gage,the 504 suspended-sediment samples collected from July 21,1949, through December 19, 1962, and analyzed for grain size.(a) Suspended-silt and clay concentrations at the two gages. (b)Suspended-sand concentrations at the two gages. (c) Concen-trations of suspended finer (0.0625–0.25 mm) sand at the twogages. (d) Concentrations of suspended coarser (.0.25 mm)sand at the two gages.
TOPPING ET AL.: COLORADO RIVER SEDIMENT TRANSPORT, 1520

521TOPPING ET AL.: COLORADO RIVER SEDIMENT TRANSPORT, 1

Canyon and Lees Ferry gages suggests that though the river inGrand Canyon may have been annually supply-limited withrespect to finer (0.0625–0.25 mm) sand, it was not supply-limited with respect to this size class of sand in all seasons.Because the concentrations of both finer (0.0625–0.25 mm)and coarser (.0.25 mm) sand were lower at low flows in GrandCanyon than they were in Glen Canyon, sand did accumulatein Marble and Grand Canyons when flows were sufficientlylow. However, the fact that hysteresis in sand concentrationand grain size occurred even in years with small snowmeltfloods, like 1954 (Figure 2), suggests that the seasonal sand-storage potential was relatively small in Marble Canyon andupper Grand Canyon.
As shown by (1) the higher concentrations of suspendedcoarser (.0.25 mm) sand during the entire snowmelt flood and(2) the higher concentrations of finer (0.0625–0.25 mm) sandduring the initial portion of the snowmelt flood (when flowsfirst exceeded 400–500 m3/s), the river in Grand Canyon hadthe capacity to transport more sand than was supplied to itfrom Glen Canyon. Therefore, as required by conservation ofmass, the sand stored in Marble Canyon and upper GrandCanyon would have been depleted at these higher flows untilthe concentration of suspended sand at the Grand Canyongage decreased to a value equal to that upstream at the LeesFerry gage. By virtue of their lower settling velocities the finersizes of sand would have had higher transport rates. Thus thefiner sizes of sand stored in Marble Canyon and upper GrandCanyon would have been depleted more quickly than thecoarser sizes during these higher flows. This effect led to theobserved decrease in the concentration of finer (0.0625–0.25mm) sand at the Grand Canyon gage to match the lowerupstream supply of this size class of sand at the Lees Ferry gageduring the latter portion of the snowmelt flood. Furthermore,this effect led to the lack of any substantial decrease in theconcentration of suspended coarser (.0.25 mm) sand at theGrand Canyon gage, even though in flows in excess of about400–500 m3/s the upstream supply of this size class of sand wasless at the Lees Ferry gage.
5.3. Differences in Coupled Changes in Suspended-SandConcentration, Suspended-Sand Grain Size, Bed GrainSize, and Bed Elevation
Calendar year 1956 was the only predam year in whichsuspended-sand concentration, suspended-sand grain size, andbed-sediment grain size were measured at both the GrandCanyon and Lees Ferry gages. Therefore comparison of datacollected at these two gages during this year serves to furtherillustrate some of the predam sediment-related differences be-tween Grand and Glen Canyons. During the 1956 snowmeltflood at the Grand Canyon gage, hysteresis existed in suspend-ed-sand concentration and grain size, with the concentration ofsuspended sand decreasing and the suspended sand coarseningduring the latter part of the rising limb of the flood (Figure 5a).In contrast, no significant hysteresis in either suspended-sandconcentration or grain size existed at the Lees Ferry gage, andthe suspended-sand grain size increased with concentrationsuch that the maximum sand concentration and grain sizeoccurred together at the peak of the flood (Figure 5b). Duringthe initial part of the rising limb of the 1956 snowmelt flood,the bed at the Grand Canyon cableway aggraded, while the bedat the upper Lees Ferry cableway scoured (Figures 5a and 5b).Maximum bed elevation at the Grand Canyon cableway led theflood peak by about 4 weeks and occurred at about the same
time as the maximum suspended-sand concentration. In con-trast, at the upper Lees Ferry cableway, minimum bed eleva-tion occurred at about the same time as the flood peak and themaximum suspended-sand concentration. During the risinglimb of the 1956 snowmelt flood the fine sediment on the bedat the Grand Canyon cableway coarsened, whereas the finesediment on the bed at the upper Lees Ferry cableway finedslightly (Figures 5a and 5b). At the Grand Canyon cableway,coarsening of the bed was associated with coarsening of thesuspended sand (Figure 5a). This style of coupled bed andsuspended-sand coarsening was similar to that observed byRubin et al. [1998], Topping et al. [1999], and Topping et al. [thisissue] in the postdam river.
To investigate the degree to which the observed systematicchanges in bed elevation in 1956 reflected general changes inthe upstream sediment supply during an average predam yearin Grand and Glen Canyons, a new methodology was devel-oped and applied to the predam periods of suspended-sandrecord at the Grand Canyon and Lees Ferry gages. The firstgoal of this analysis was to identify the degree to which a lagexisted between the annual flood peak and either maximum orminimum bed elevation during an average year. The secondgoal of this analysis was to determine the degree to whichsand-supply depletion was coupled to bed scour during floods.
At both gages the mean relationship between bed elevationand the flow during the average predam year was determinedfor the periods of suspended-sand record. This was done bybinning and averaging the measurements of water-surfacestage, mean bed stage, and minimum bed stage [fromBurkham, 1986] (Figures 6a and 6b). A bin size of 2 weeks wasfound to be optimum to ensure that enough data were includedin each bin. Both mean and minimum bed stage were includedin this analysis to determine if a change in bed elevation acrossthe cross section was real and not an artifact of cross-sectiongeometry. First, mean bed stage provides information on thechange in bed elevation over the entire width of a cross section,whereas minimum bed stage provides information only on themagnitude of the deepest scour in the cross section. Second, aslight apparent increase in mean bed stage will occur with anincrease in water-surface stage simply because of the trapezoi-dal cross-sectional shape of a river channel.
To quantify the seasonal style and importance of changes inthe upstream sand supply, we developed a method based on
Figure 5. (Opposite) Water-surface stage, bed stage, grainsize (in suspension and on the bed), and suspended-sand con-centration at the Grand Canyon and upper Lees Ferry cable-ways during calendar year 1956. Greater hysteresis was presentin all of these quantities at the Grand Canyon cableway, sug-gesting a greater depletion of the upstream supply of sand inGrand Canyon than in Glen Canyon. (a) Water-surface stage,mean bed stage, median size of the suspended sand, mediansize of the fine sediment (i.e., sand and finer material) on thebed, and suspended-sand concentration at the Grand Canyoncableway. Stage is that measured at the lower gage (measuredrelative to the same datum as at the upper gage). (b) Water-surface stage, mean bed stage, median size of the suspendedsand, median size of the fine sediment on the bed, and sus-pended-sand concentration at the upper Lees Ferry cableway.Cableway stage is measured relative to a different datum thanstage at the recording gage. Data in Figures 5a and 5b are fromunpublished U.S. Geological Survey (USGS) discharge-measurement field notes.
TOPPING ET AL.: COLORADO RIVER SEDIMENT TRANSPORT, 1522

523TOPPING ET AL.: COLORADO RIVER SEDIMENT TRANSPORT, 1

the physical relationships that link changes in suspended-sandconcentration to changes in suspended-sand grain size. Theserelationships are based on the suspended-sediment theory re-viewed by Topping et al. [this issue] and hold true for all caseswhere suspended-load transport is the dominant transportmode of the sand on the bed (i.e., when the Rouse number ofthe median size of the sand on the bed is less than about 1).
The relationships that link changes in suspended-sand con-centration and grain size are relatively straightforward when(1) the upstream supply of sand is in equilibrium with the flowconditions, (2) the upstream supply of sand becomes depletedwhile the flow is steady or increasing, and (3) the upstreamsupply of sand becomes enhanced while the flow is steady ordecreasing. Given an upstream supply of sand that is in equi-librium with the flow conditions, sand in suspension willcoarsen only when its concentration increases. In this case thecoupled increase in suspended-sand concentration and grainsize is caused by an increase in boundary shear stress associ-ated with an increase in flow. At steady or increasing flows,given a decreasing upstream supply of sand, the grain size ofthe sand in suspension will either increase or remain constantif the concentration of sand decreases. At steady or decreasingflows, given an increasing upstream supply of sediment, thegrain size of the sand in suspension will either fine or remainconstant if the concentration of sand increases.
The relationships that link changes in suspended-sand concen-tration and grain size are more complicated in flows that aredecreasing while the sediment supply is being depleted and inflows that are increasing while the sediment supply is being en-hanced. This increase in complexity arises from the fact thatunder these conditions the rate at which the boundary shear stresschanges can offset the influence of a change in the upstreamsupply of sand. For example, in decreasing flows, though theconcentration of sand will always decrease when the upstreamsupply of sediment is depleted, the sand in suspension may actu-ally fine if the boundary shear stress decreases quickly enough.Likewise, in increasing flows, though the concentration of sandwill always increase when the upstream supply of sediment isenhanced, the sand in suspension may actually coarsen if theboundary shear stress increases quickly enough.
In summary, regardless of how the flow changes, (1) a de-crease in suspended-sand concentration associated with eithercoarsening or no change in grain size always indicates sanddepletion, (2) a decrease in suspended-sand concentration as-sociated with fining is inconclusive, (3) an increase in sandconcentration associated with either fining or no change ingrain size always indicates an increase in the upstream supplyof sand, and (4) an increase in suspended-sand concentrationassociated with coarsening is inconclusive. In this analysis thesefour types of sand-supply events are referred to as (1) sand-depletion events, (2) decreasing-concentration inconclusiveevents, (3) sand-enhancement events, and (4) increasing-concentration inconclusive events, respectively.
Determination of the relative seasonal importance of eachof these four types of sand-supply events at the Grand Canyonand Lees Ferry gages was an eight-step process. First, thesuspended-sand data from each gage were placed in the formatof a time series. Second, these data were analyzed to determinehow the measured concentration and grain size of the sus-pended sand changed from sample to sample (i.e., each pair ofsamples was assigned to one of the four defined types of sand-supply events). Third, so that this analysis would be consistentwith the bed-elevation analysis in Figure 6a, only those samples
that were collected within 2 weeks of each other were used.Fourth, the time of each sand-supply event was calculated asthe midpoint in time between the two samples. Fifth, the datawere then segregated into the same 2-week bins used in thebed-elevation analysis. Sixth, each sand-supply event was thenweighted by the measured suspended-sand load at the time ofeach event. This weighting was applied because the degree towhich the upstream supply of sand gets depleted or enhanceddepends strongly on the sand-transport rate. For example,sand-depletion events occurring when the sand-transport rateis low represent a smaller decrease in the upstream supply ofsediment than those occurring when the sand-transport rate ishigh. Seventh, for each of the four types of sand-supply eventsin each 2-week bin, the load-weighted data were summed todetermine the load-weighted occurrence of each type of sand-supply event. Finally, before the data in either different bins orat the Grand Canyon and Lees Ferry gages could be compared,a correction had to be made to remove the dependence of theload-weighted occurrences on the different total number ofsand-supply events in each bin. Therefore, eighth, the “nor-malized load-weighted occurrence” of each type of sand-supplyevent was determined by dividing the load-weighted occur-rence of each type of event by the total number of the fourtypes of sediment-supply events in each bin (Figures 6a and 6b).
5.4. Discussion of the Differences in Coupled Changesin Suspended-Sand Concentration, Suspended-SandGrain Size, Bed Grain Size, and Bed Elevationin Grand and Glen Canyons
In the average predam year the bed at the Grand Canyonand upper Lees Ferry cableways responded very differentlyduring the annual snowmelt flood. The bed at the Grand Can-yon cableway would initially aggrade, while the bed at theupper Lees Ferry cableway would initially scour. Following theinitial portion of the snowmelt flood (but still during the risinglimb), the response of the bed at the Grand Canyon cablewaywould reverse, and the bed at both cableways would scour.During the receding limb of the flood the bed at the GrandCanyon cableway would typically remain stable, whereas thebed at the upper Lees Ferry cableway would aggrade. Thesystematic response of the bed at the Grand Canyon cablewayduring floods was first recognized by Leopold and Maddock[1953], who related it to systematic changes in the upstreamsediment supply and mean velocity during a flood. This inter-pretation was essentially restated by Burkham [1986], who an-alyzed time series of bed scour and mean velocity at the GrandCanyon and upper Lees Ferry cableways. The opposing initialresponses of the bed at the two sites during floods was firstdocumented by Colby [1964], who attributed this difference notto the mechanism proposed by Leopold and Maddock [1953]but rather to the control of reach geometry on the pattern ofscour and fill during a flood. Colby [1964] indicated that sedi-ment concentrations were increasing at both the Grand Can-yon and Lees Ferry gages during the rising limb of the snow-melt flood but that the response of the bed at the two sites wasthe opposite. Colby [1964] demonstrated through flume exper-iments that, given only a difference in reach geometry, onereach will scour and one will fill given the same upstreamsupply of sediment. Using a conceptual model of sedimentredistribution during high flows, Howard and Dolan [1981], likeColby [1964], suggested that the initial response of the bed atthe Grand Canyon cableway was controlled by reach geometry[Howard and Dolan, 1981, Figure 7] and that the initial scour
TOPPING ET AL.: COLORADO RIVER SEDIMENT TRANSPORT, 1524

of the bed at the upper Lees Ferry cableway during snowmeltfloods was also controlled by reach geometry.
Our analyses, in combination with those presented by Top-ping et al. [this issue], suggest that Leopold and Maddock[1953], Colby [1964], Howard and Dolan [1981], and Burkham[1986] were all partially correct and that both reach geometryand a reduction in the upstream sand supply played importantroles in the responses of the bed at the Grand Canyon andupper Lees Ferry cableways. The response of the bed at bothsites was initially controlled by a reach-geometry-driven redis-tribution of the boundary shear stress field (as the flow in-creased), but the response of the bed at the Grand Canyoncableway much more strongly reflected a seasonal depletion ofthe upstream supply of sand. The bed at the Grand Canyoncableway aggraded with the initial increase in water-surfacestage during the snowmelt flood (from March 1 through May10). Then, from about May 10 through July 20, the bed de-graded back to its presnowmelt-flood elevation. Thus maxi-mum bed elevation at the Grand Canyon cableway led thepeak of the snowmelt flood by about 4 weeks (Figure 6a). Thisis the style of bed response predicted at this type of crosssection by Topping et al. [this issue] for the case when theupstream supply of sand becomes depleted during a flood.While the bed was scouring at the Grand Canyon cableway, thesuspended-sand data at the Grand Canyon gage were domi-nated by sand-depletion events (Figure 6a). In the averagepredam year the bed at the upper Lees Ferry cableway scouredwith the increase in water-surface stage during the snowmeltflood and began to aggrade about 2 weeks after the peak of thesnowmelt flood (Figure 6b). As shown by Topping et al. [thisissue], this style of bed-topography response may be due to, butdoes not require, depletion of the upstream supply of sand. Inany case the lag between the maximum or minimum bed ele-vation and the flood peak was much less at the upper LeesFerry cableway than at the Grand Canyon cableway. This sug-gests that bed elevation changes at the upper Lees Ferry cable-way were driven more by changes in the spatial distribution ofboundary shear stress (caused by changes in discharge) than bydepletion of the upstream supply of sediment. Furthermore,unlike at the Grand Canyon cableway, sand-depletion eventswere never dominant at the upper Lees Ferry cableway (Figure6b). Thus the Colorado River in Glen Canyon showed thebed-topographic effects of sediment supply limitation to a farlesser degree than it did in Grand Canyon.
5.5. Long-Term Trends in Bed Stage at the Grand Canyonand Upper Lees Ferry Cableways
If a river is annually supply-limited with respect to finesediment, then over multiyear timescales the amount of finesediment present in the channel should either decrease or bezero. However, for a decrease in the amount of fine sedimentin a cross section over multiyear timescales to be attributableto sediment supply limitation, this decrease must occur in theabsence of changes in the local hydraulics that might causechanges in the local patterns of scour and fill. Burkham [1986]indicated that the channel bed at the upper Lees Ferry cable-way was scouring over multiyear timescales prior to the closureof Glen Canyon Dam in 1963 and suggested that this scour wasdue to a decrease in the upstream supply of sediment. Todetermine whether multiyear changes in cross-section geome-try were related to changes in either the sediment supply or thelocal hydraulics, F-test trend analyses were conducted on themeasurements of mean bed stage (Figures 7a and 7b). Because
the channel width and stage-discharge relationship were bothstable (Figures 7c and 7d) at the Grand Canyon cableway, the1922–1962 bed-stage data at this site could be analyzed as asingle time series (Figure 7a). However, because of three ma-jor changes in channel geometry (two related to changes at themouth of the Paria River and one caused by a large rockslide(Figures 7c and 7d)) in the Lees Ferry reach that could haveinfluenced the response of the bed at the upper cableway, the1921–1962 bed-stage data at this site had to be analyzed in foursegments (Figure 7b).
5.6. Discussion of the Long-Term Trends in Bed Stageat the Grand Canyon and Upper Lees Ferry Cableways
At both the Grand Canyon and upper Lees Ferry cableways,trends in bed stage during the predam era were slightly, butsignificantly, negative (Figures 7a and 7b). Though thesetrends are consistent with the interpretation that both Grandand Glen Canyons were, to some degree, supply-limited withrespect to fine sediment, other factors (e.g., changes in flowand externally forced changes in channel geometry) may haveaffected the response of the bed at these sites. However, be-cause the bed at both sites (sites at which bed elevation re-sponded in opposing manners during the annual flood)scoured over multiyear timescales, these other factors canprobably be ruled out (though they are still discussed below).Therefore the long-term scour at both sites was probably dueto the transport capacity of the river in both canyons exceedingthe long-term upstream supply of sediment. In other words, theriver in both canyons was probably supply-limited over multi-year timescales with respect to some fraction of the sizes ofsediment in transport.
Because at the Grand Canyon cableway, no major changeoccurred from 1922 through 1962 in either the channel width(because the channel margins are bedrock) or in the stage-discharge relationship (Figures 7c and 7d), the entire predamperiod could be analyzed as a single time series. From Novem-ber 12, 1922, through December 31, 1962, the bed at the GrandCanyon cableway scoured at a rate of 1.6 cm/yr; this trend issignificant at less than the 1.0 3 10216 level. Thus, given theapproximate 90-m width of the channel, about 1.4 m2 moresediment was eroded from this cross section than was suppliedto it each year. Because the channel width and stage-dischargerelationship at the Grand Canyon cableway were effectivelyconstant, this long-term erosion of sediment can be interpretedto be either due to a long-term depletion in the upstreamsediment supply or due to a long-term change in either thedischarge of water or the water-surface stage. Analysis of theUSGS discharge records from the Grand Canyon gage indi-cates that from 1922 through 1962 the mean-daily discharge ofwater decreased by about 25%, corresponding to a decrease inwater-surface stage of about 15%. Therefore, though sedimentsupply limitation may have caused the 1922–1962 decrease inbed elevation, because the bed at the Grand Canyon cablewayscours slightly with decreasing water-surface stage [Topping etal., this issue], the 1922–1962 decrease in water-surface stagecannot be ruled out as a contributing factor.
At Lees Ferry, interpretation of long-term trends in bedstage are complicated by three externally forced changes inchannel geometry that may have affected the response of thebed at the upper cableway. First, during the first week of April1923, as flows first increased above 500 m3/s during the annualsnowmelt flood, a large downward shift in the stage-dischargerelationship occurred (Figure 7d). This was likely the result of
525TOPPING ET AL.: COLORADO RIVER SEDIMENT TRANSPORT, 1

a rearrangement of the gravel bars at the mouth of the PariaRiver that form the hydraulic control for the Lees Ferry gage.Second, a large Paria River flood caused backwater in theColorado River at the Lees Ferry gage on August 2, 1929, and
rearranged the hydraulic control for the gage again, shiftingthe stage-discharge relationship back to its pre-April 1923 state(Figure 7d). Third, a large rock slide on December 19, 1944,fell on the right end of the upper cableway (unpublished USGS
Figure 6. Relationships between water-surface stage, bed stage, and changes in the upstream sand supplyduring the average predam year at the Grand Canyon and upper Lees Ferry cableways. Depletion of theupstream supply of sand played a greater role in the response of the bed topography at the Grand Canyoncableway. (a) Water-surface stage, mean bed stage, and minimum bed stage in 2-week bins during the averagepredam year and the load-weighted normalized occurrence (in 2-week bins) of the four types of sand-supplyevents at the Grand Canyon cableway. Analysis is conducted on all the 1944–1962 discharge measurementsand on the suspended-sand data presented in Figure 4; stage error bars are 1 standard deviation. (b)Water-surface stage, mean bed stage, and minimum bed stage in 2-week bins during the average predam yearand the load-weighted normalized occurrence (in 2-week bins) of the four types of sand-supply events at theLees Ferry gage. Analysis is conducted on all the 1949–1962 discharge measurements made at the upper LeesFerry cableway and on the suspended-sand data presented in Figure 4; stage error bars are 1 standarddeviation. The lower Lees Ferry cableway was not included in this analysis because the channel at that locationwas almost twice as wide as at the upper cableway, and relatively few discharge measurements were madethere. The cofferdam at the Glen Canyon Dam site (23 km upstream from the upper cableway) was completedon February 11, 1959 [Martin, 1989], and immediately began to trap some of the upstream supply of sediment[Pemberton, 1976]. Though the bed at the upper cableway began to scour in 1959 in probable response to thispartial trapping of the upstream sediment supply, the magnitude of this scour was much smaller than themagnitude of the natural seasonal scour and fill at the upper cableway. Thus inclusion of the period 1959–1962did not greatly affect this analysis, as indicated by the slight difference between the values of mean bed stagefor 1949–1962 and 1949–1958. The number of minimum bed-stage measurements in Figures 6a and 6b is lessthan the number of water-stage and mean bed-stage measurements because Burkham [1986] analyzed a subsetof the USGS discharge measurements.
TOPPING ET AL.: COLORADO RIVER SEDIMENT TRANSPORT, 1526

Lees Ferry gage annual technical file, 1945) and caused ap-proximately 10 m of channel narrowing (Figure 7c). Because ofthese externally forced changes in geometry, the bed-stagedata from the upper cableway were analyzed in four segments:(1) from August 3, 1921, through April 8, 1923, (2) from April10, 1923, through July 31, 1929, (3) from August 2, 1929,through December 7, 1944, and (4) from January 10, 1945,through February 7, 1959. To ensure that only natural long-term trends were detected in this analysis, the period aftercompletion of the cofferdam at the Glen Canyon Dam site onFebruary 11, 1959 [Martin, 1989], was not included. Thoughthe effect of the cofferdam was probably small at the uppercableway during 1959–1962, by trapping some of the upstreamsupply of sediment, the cofferdam may have slightly enhancedthe scour at the upper cableway (Figure 6b) [see Pemberton,1976].
From August 2, 1929, through February 7, 1959, and asobserved at the Grand Canyon cableway, the trend in bed stageat the upper Lees Ferry cableway was slightly, but significantly,negative (Figure 7b). Trends in mean bed stage from August 3,1921, through April 8, 1923, and from April 10, 1923, throughJuly 31, 1929, are not significant at either the 5% or 10% level,however. From August 2, 1929, through December 7, 1944, the
bed at the upper cableway scoured at a rate of 2.5 cm/yr; thistrend is significant at the 1.6 3 1025 level. From January 10,1945, through February 7, 1959, the bed scoured at a rate of 3.0cm/yr; this trend is significant at the 3.9 3 1024 level. Thus,given the approximate 120-m width of the channel at the uppercableway, about 3.0 m2 more sediment was eroded from thiscross section than was supplied to it each year during 1929–1944, and about 3.6 m2 more sediment was eroded from thiscross section than was supplied to it each year during 1945–1958. From August 2, 1929, through February 7, 1959, the15-min discharge of water at the Lees Ferry gage increased byonly 10%, and the 15-min water-surface stage increased byonly 3% (L. E. Vierra and D. J. Topping, unpublished data,1999). Thus long-term changes in either discharge or stage canbe ruled out as the cause of the 1929–1958 erosion. Further-more, because the August 2, 1929, to February 7, 1959, stage-discharge relationship was effectively constant (Figure 7d), the1929–1958 decrease in the amount of sediment at the uppercableway suggests that Glen Canyon, like Grand Canyon, wassupply-limited with respect to fine sediment. However, theprevious analyses (shown in Figures 4, 5, and 6) suggest thatthe degree of sediment supply limitation in Glen Canyon wasmuch less than in Grand Canyon.
Figure 6. (continued)
527TOPPING ET AL.: COLORADO RIVER SEDIMENT TRANSPORT, 1

Figure 7. (a) Mean and minimum bed stage as a function of time at the Grand Canyon cableway. Values ofmean bed stage are from the 3690 USGS discharge measurements made from 1922 through 1962; values ofminimum bed stage are from the 766 USGS discharge measurements analyzed by Burkham [1986]. Stage isthat measured at the lower gage (relative to the same datum as at the upper gage). The linear regression usedin the F-test trend analysis of mean bed stage is shown. (b) Mean and minimum bed stage as a function of timeat the upper Lees Ferry cableway. Values of mean bed stage are from the 3815 USGS discharge measurementsmade from 1921 through 1962; values of minimum bed stage are from the 1005 USGS discharge measure-ments analyzed by Burkham [1986]. Stage is that measured at cableway gage (relative to a different datum thanat the recording gage). Bold vertical lines indicate where the time series of mean bed stage was subdivided intothe four segments for the F-test trend analyses, see text for justification of this subdivision; linear regressionsused in the F-test trend analysis of the data in each segment are shown. (c) Width as a function of stage atthe Grand Canyon and upper Lees Ferry cableways. Note the channel narrowing caused by the December 19,1944, rockslide at the Lees Ferry cableway. For comparison, data from the Grand Canyon cableway are alsosubdivided into two portions to illustrate the stability of the channel at that site. Stage at the Grand Canyoncableway is that measured at the lower gage; stage at the Lees Ferry cableway is that measured at the cablewaygage. The 1922–1940 Grand Canyon data are from the 2406 USGS discharge measurements made fromNovember 12, 1922, through December 30, 1940; 1941–1962 Grand Canyon data are from the 1284 USGSdischarge measurements made from January 5, 1941, through December 31, 1962. The 1921–1944 Lees Ferrydata are from the 2592 USGS discharge measurements made at the upper cableway from August 3, 1921,through December 7, 1944; 1945–1962 Lees Ferry data are the 1223 USGS discharge measurements made atthe upper cableway from January 10, 1945, through December 30, 1962. (d) Discharge of water as a functionof stage at the Grand Canyon and Lees Ferry gages. Data from the Grand Canyon gage are subdivided as inFigure 7c to illustrate the stability of the stage-discharge relationship from 1922 through 1962. Stage at theGrand Canyon gage is that measured at the lower gage. Data from the Lees Ferry gage are subdivided intothe three periods with approximately stable stage-discharge relationships: August 3, 1921, through April 8,1923, April 10, 1923, through July 31, 1929, and from August 2, 1929, through February 7, 1959. Unlike inFigures 7b and 7c, stage at the Lees Ferry gage is that measured at the recording gage. At Lees Ferry theAugust 3, 1921, through April 8, 1923, data are from the 237 discharge measurements made at the uppercableway during this period; April 10, 1923, through July 31, 1929, data are from the 464 discharge measure-ments made at the upper cableway and the 41 discharge measurements made at the lower cableway during thisperiod; August 2, 1929, through February 7, 1959, data are from the 2896 discharge measurements made atthe upper cableway and the 286 discharge measurements made at the lower cableway during this period.
TOPPING ET AL.: COLORADO RIVER SEDIMENT TRANSPORT, 1528

Figure 7. (continued)
529TOPPING ET AL.: COLORADO RIVER SEDIMENT TRANSPORT, 1

5.7. Differences in Vertical Grain-Size Trends in PredamFlood Deposits in Marble and Grand Canyonsand Glen Canyons
As suggested by the above series of analyses, predam Glen,Marble, and Grand Canyons were all annually supply-limitedwith respect to silt and clay, whereas predam Marble andGrand Canyons were annually supply-limited with respect tosand to a greater degree than was predam Glen Canyon. Ifthese interpretations are correct, then some difference shouldexist between the vertical trends in grain size preserved inpredam flood deposits in Marble and Grand Canyons andthose preserved in predam flood deposits in Glen Canyon.Though most of Glen Canyon is today inaccessible beneath thewaters of Lake Powell, some predam flood deposits are pre-served in the 25-km-long reach between Glen Canyon Damand Lees Ferry. To compare the vertical trends in grain sizepreserved in predam flood deposits in Glen Canyon with thosepreserved in predam deposits in Marble and Grand Canyons,we sampled a total of 10 predam flood deposits vertically forgrain size at three sites in Glen Canyon in 1998 and 1999(Figures 1 and 8).
5.8. Discussion of the Differences Between the VerticalGrain-Size Trends in Predam Flood Deposits in Marbleand Grand Canyons and Glen Canyon
As in Marble and Grand Canyons, the content of silt andclay generally decreases upward in the predam flood deposits
in Glen Canyon, with the silt and clay content at the top beingless than that at the base in about 80% of the sampled deposits.However, in contrast to Marble and Grand Canyons, less gen-erality exists in the vertical trends in sand grain size in thepredam flood deposits in Glen Canyon. In Glen Canyon thesand was actually finer at the top than at the base in about 30%of the deposits (as was the case in the predam deposit at thehead of Marble Canyon). Therefore the sedimentologic recordpreserved in the predam flood deposits lends further supportto the interpretation that in the predam era, the majority ofMarble Canyon and all of Grand Canyon were annually sup-ply-limited with respect to fine sediment to a greater degreethan was Glen Canyon. Thus a predam transition to increasedannual fine-sediment supply limitation may have occurred nearthe head of Marble Canyon.
6. Support for Annual Sediment SupplyLimitation From Late Predam and EarlyPostdam Sediment Budgets
In addition to displaying the four above-described and doc-umented effects associated with sediment supply limitation,the integral constraint on whether a reach is annually supply-limited with respect to fine sediment (i.e., sand and finer ma-terial) is that the reach must export all of the fine sedimentsupplied to it each year. The above analyses provide evidencethat is necessary, but not sufficient, to conclude that the pre-
Figure 8. Vertical trends in the silt and clay content and the median size of sand in predam flood depositsin Glen Canyon, at the head of Marble Canyon, and in Marble (downstream from river mile 2) and GrandCanyons. Both the silt and clay content and the median size of sand are normalized by the values measurednear the base of each deposit. In Glen Canyon and at the head of Marble Canyon the beds did not consistentlycoarsen upward with respect to sand, as they did in Marble and Grand Canyons. Thus the upstream supply ofsand probably did not get as depleted during floods in Glen Canyon as it did downstream in Marble and GrandCanyons.
TOPPING ET AL.: COLORADO RIVER SEDIMENT TRANSPORT, 1530

dam river in Marble and Grand Canyons was annually supply-limited with respect to fine sediment. Therefore, to testwhether the predam Colorado River between the Lees Ferryand Grand Canyon gages met the integral constraint of annualsupply limitation with respect to fine sediment, we constructeda sediment budget for the 141-km-long reach of the ColoradoRiver in Marble Canyon and upper Grand Canyon.
6.1. Annual Sediment Budget
Fine sediment is supplied to the Colorado River in MarbleCanyon and upper Grand Canyon from (1) the Colorado Riverin Glen Canyon (this ceased to be a major source after closureof the dam), (2) the Paria River (which enters the ColoradoRiver at river mile 0.9 at the head of Marble Canyon), (3) theLittle Colorado River (which enters the Colorado River atriver mile 61.5 at the lower end of Marble Canyon), and (4) thesmaller ungaged tributaries between river mile 0 and 87.4.During the predam era, large quantities of fine sediment weresupplied to the Colorado River in Marble Canyon and upperGrand Canyon during tributary floods that typically occurredin both July–October and January–April, whereas the largestquantities of fine sediment were exported during the annualsnowmelt flood. Thus neither calendar years (January–December) nor water years (October–September) were thebest time period to use in computing annual sediment budgetsbecause the season of largest sediment export fell between thetwo seasons of greatest tributary sediment supply. Thereforewe constructed a sediment budget for years beginning on July1 of the preceding calendar year and ending on June 30 of thecurrent calendar year, a year herein defined as a “sedimentyear.” For example, by this definition, sediment year 1957 wasthe year between July 1, 1956, and June 30, 1957.
Constructing a sediment budget for Marble Canyon and theupper Grand Canyon was a relatively straightforward processbecause of the high spatial density and long duration of sedi-ment-transport data collected by the USGS. For over 2 de-cades, daily suspended-sediment concentrations were mea-sured at two stations on the main stem in this reach and atstations on the two major tributary suppliers of sediment, thatis, the Paria and Little Colorado Rivers. On the main stemColorado River these data were collected at the Lees Ferryand Grand Canyon gages (Figure 1). At the Lees Ferry gage,suspended-sediment concentrations were measured with mod-ern USGS sampling equipment from October 1, 1947, throughAugust 13, 1965. After August 13, 1965, suspended-sedimentconcentrations were measured only occasionally at this site. Atthe Grand Canyon gage, suspended-sediment concentrationswere measured with modern USGS sampling equipment fromJune 1, 1944, through November 28, 1944, from April 25, 1945,through April 27, 1945, and from May 13, 1945, through Sep-tember 30, 1972. Suspended-sediment data collected at theGrand Canyon gage prior to June 1, 1944, from November 29,1944, through April 24, 1945, and from April 28, 1945, throughMay 12, 1945, were not used in this analysis because the sus-pended-sediment sampler used during these periods has beenshown to oversample suspended sand by as much as a factor of2–2.5 depending on the method of sampler deployment [Fed-eral Inter-Agency River Basin Committee, 1957; Topping et al.,1996]. On the Paria River, suspended-sediment concentrationswere measured at the Paria River Lees Ferry gage from Oc-tober 1, 1947, through September 30, 1976 (Figure 1). On theLittle Colorado River, suspended-sediment concentrations
were measured from October 1, 1947, through September 30,1970, at the highway 89 bridge at Cameron, Arizona (Figure 1).
In this sediment budget the monthly fine-sediment supplywas set equal to the combined measured monthly loads of theColorado River at Lees Ferry, the Paria River, the Little Col-orado River, and an estimation of the monthly loads of theungaged tributaries (described in Appendix A). The monthlyfine-sediment export was set equal to the measured monthlyload of the Colorado River at the Grand Canyon gage. Duringperiods of missing record, most notably between the measure-ments made after August 1965 at the Colorado River LeesFerry gage, daily sediment loads were estimated by interpola-tion. Longer periods of missing record at the Grand Canyongage prevented sediment budgets from being constructed fromJune 2, 1956, through August 31, 1956, and from August 1,1958, through March 31, 1959.
Prior to constructing and interpreting any sediment budget,it is essential that the sources and magnitudes of measurementerror be understood and quantified so that appropriate uncer-tainties can be assigned. As justified in Appendix B, the fol-lowing uncertainties were assigned to the measured monthlyand annual sediment loads: (1) 5% for the Colorado River atthe Lees Ferry and Grand Canyon gages and (2) 20% for theParia and Little Colorado Rivers. As justified in Appendix A,an uncertainty of a factor of 3 was assigned to the estimatedmonthly and annual sediment loads of the ungaged tributaries.These uncertainties in the measured and estimated loads arenot unreasonably high and, if anything, may be too low.
The annual supplies of fine sediment (from each of the foursources) to the reach between the Lees Ferry and Grand Can-yon gages and the annual export of fine sediment from thisreach are shown in Figure 9a. Prior to closure of the dam, themajor supplier of fine sediment to this reach was the ColoradoRiver above the Lees Ferry gage (i.e., the Colorado River inGlen Canyon). During the predam years with complete sedi-ment-transport data at the Lees Ferry gage (sediment years1949–1962), the mean annual supply of sediment from theColorado River in Glen Canyon was 57 6 3 million t (t indi-cates metric ton) (of which approximately 40% was sand).During the predam years with complete sediment-transportdata at the Grand Canyon gage (i.e., sediment years 1948–1955, 1958, and 1960–1962), the mean-annual export of finesediment from this reach was 83 6 4 million t (of which ap-proximately 35% was sand). Because the first few years afterclosure of Glen Canyon Dam in March 1963 were not repre-sentative of the fluctuating flows that typify most of the post-dam era [U.S. Department of the Interior, 1995], these yearswere not used to determine mean-annual postdam loads of theColorado River. Dam releases during these years consisted ofquasi-steady low flows through much of 1963 and 1964 andsustained high flows during April–June 1965 (Figure 9b). Inthe initial period of daily fluctuating flows following the highdam releases of 1965 (i.e., sediment years 1966–1970), themean-annual supply of sediment from the Colorado River inGlen Canyon was only 0.24 6 0.01 million t. This representeda decrease of 99.5–99.6% in the mean-annual predam supplyof fine sediment from this source. Following the high flows in1965 (i.e., sediment years 1966–1972), the mean-annual exportof fine sediment past the Grand Canyon gage was 14 6 1million t. This represented a decrease of 81–85% in the mean-annual predam export of fine sediment.
The other major predam suppliers of fine sediment, and theonly major suppliers of sediment to the reach between the Lees
531TOPPING ET AL.: COLORADO RIVER SEDIMENT TRANSPORT, 1

Figure 9. (a) Annual fine-sediment (i.e., sand and finer material) loads of the Colorado River in GlenCanyon (as measured at the Lees Ferry gage), the Paria River, the Little Colorado River, the ungagedtributaries, and the Colorado River at the Grand Canyon gage. Error bars indicate the uncertainties in theloads (see text). (b) Instantaneous water discharge of the Colorado River at Lees Ferry during sediment years1949–1970. This time series was constructed using unpublished raw USGS stage and discharge data. (c)Annual fine-sediment supply to and export from Marble Canyon and upper Grand Canyon. In all but a fewyears, the supply and export of fine sediment in both the predam and postdam periods were equal within theuncertainties in the sediment budget.
TOPPING ET AL.: COLORADO RIVER SEDIMENT TRANSPORT, 1532

Ferry and Grand Canyon gages in the postdam era, are theParia and Little Colorado Rivers. During their respective pe-riods of sediment record the mean-annual supplies of finesediment were 3.0 6 0.6 million t from the Paria River (ofwhich about 50% was sand) and 8.6 6 1.7 million t from theLittle Colorado River (of which about 30–40% was sand).During the period of sediment years 1949–1970 the mean-annual supply of fine sediment from the ungaged tributariesbetween Lees Ferry and the Grand Canyon gage was estimatedat 0.72 6 (a factor of 3) million t [after Griffiths et al., 1998].
Because the periods of record at each of the four USGSsediment stations were different, a reasonable sediment budgetfor Marble Canyon and upper Grand Canyon could only beconstructed for sediment years 1949–1955, 1958, and 1960–1970 (Figure 9c). This period included 11 years from the pre-dam era and the first 7 years of the postdam era. During boththe predam and postdam periods in this sediment budget themean-annual fine-sediment supply generally equaled themean-annual export to within the measurement error (Figure9c and Table 1). As discussed in Appendix B and shown in theanalysis in Table 1, the uncertainties in the sediment loadswould have to be much lower than is reasonable to result in theprediction of substantial multiyear storage of fine sediment ineither the predam or postdam periods. Given the uncertaintiesin the sediment budget, the only years in which the fine-sediment supply can be shown to have exceeded the exportwere sediment years 1954 and 1963, and the only years in whichthe export can be shown to have exceeded the supply weresediment years 1949 and 1965.
6.2. Magnitude and Duration of Seasonal Sediment Storage
Our analysis of the predam differences in sand-transportrates between the Lees Ferry and Grand Canyon gages (Figure4b) suggests that sand accumulated in Marble Canyon andupper Grand Canyon during low flows and was eroded fromMarble Canyon and upper Grand Canyon during high flows.Therefore, to determine the mean seasonal patterns of fine-sediment accumulation, storage, and erosion both under nat-ural conditions and under normal dam operations, we aver-aged, differenced, and integrated the monthly sediment-loaddata for the 11 predam years with complete data and the 5postdam years with fluctuating flows. This approach is justifiedbecause the annual fine-sediment supply to and export fromMarble Canyon and upper Grand Canyon during these periodswere equal to within the uncertainties in the sediment budget,with the exception of only 2 of the 11 predam years. The meansupplies (Colorado River at Lees Ferry, Paria River, LittleColorado River, and ungaged tributaries) and export (Colo-rado River at Grand Canyon) of fine sediment each monthduring the average predam and postdam years are shown inFigures 10a and 10b. The amount of fine sediment in storageafter each month during the average predam and postdam yearare shown in Figures 10c and 10d.
Substantial differences exist between the magnitude and du-ration of seasonal fine-sediment storage in the average predamand postdam years (Figures 10c and 10d). During the averagepredam year the most rapid accumulation of fine sediment inMarble Canyon and upper Grand Canyon occurred from July
Figure 9. (continued)
533TOPPING ET AL.: COLORADO RIVER SEDIMENT TRANSPORT, 1

through August, and, given the assigned uncertainties, at least1 million t of fine sediment were retained in storage fromSeptember through March. Then, from April through June thisstored sediment was probably eroded and may have been ex-hausted by the end of April. As shown in section 5.1, relativelylittle difference in predam silt and clay concentration existedbetween the Lees Ferry and Grand Canyon gages (Figure 4a),whereas large flow-dependent differences in sand concentra-tion existed between the two gages (Figure 4b). These differ-ences were greatest for the 0.0625–0.25 mm sand (Figures 4cand 4d); thus the fine sediment seasonally stored in MarbleCanyon and upper Grand Canyon was probably largely com-posed of 0.0625–0.25 mm sand. To place these minimal mag-nitudes of seasonal sand storage in perspective, the 1949–1976mean-annual sand load of the Paria River was approximately1.76 million t, of which half was finer than 0.125 mm and 90%was finer than 0.25 mm [Topping, 1997]. In contrast to thepredam case, given the same set of uncertainties, sand cannotbe demonstrated to accumulate for more than 1 month or beretained in storage for more than 2 months in Marble Canyonand upper Grand Canyon during the average postdam year(Figure 10d).
The hydrology of the predam Colorado River during theseasons of sand accumulation and storage (July–March) andsand erosion (April–June) is that expected, given the flow-dependent differences in the transport rates of finer (0.0625–0.25-mm) sand at the Lees Ferry and Grand Canyon gages(Figure 4c). As shown in Figure 4c, (1) finer sand should haveaccumulated in Marble Canyon and upper Grand Canyonwhen the flows were lower than about 200–300 m3/s, (2) finersand should have been conveyed through Marble Canyon andupper Grand Canyon when flows exceeded 200–300 m3/s, and
(3) finer sand should have been either eroded from or con-veyed through Marble Canyon and upper Grand Canyon whenflows exceeded 400–500 m3/s. Indeed, during the season ofsand accumulation and storage (July–March), flows exceeded
Table 1. Maximum Demonstrable Annual Change in Fine-Sediment Mass in Marble Canyon and Upper Grand Canyons as aFunction of Uncertainty in the Sediment Loads of the Colorado River, Paria and Little Colorado Rivers, and Ungaged Tributaries
SedimentYear
Uncertainties Assigned to Sediment Loads,* %
2†, 5† 2†, 10† 2†, 20 2†, 30 5, 5† 5, 10† 5, 20‡ 5, 30 10, 5† 10, 10† 10, 20 10, 30
1949 29.9 29.8 29.5 29.3 24.4 24.3 24.1 23.8 0 0 0 01950 0 0 0 0 0 0 0 0 0 0 0 01951 2.1 1.9 1.7 1.5 0 0 0 0 0 0 0 01952 23.3 22.4 20.6 0 0 0 0 0 0 0 0 01953 0.9 0.6 0 0 0 0 0 0 0 0 0 01954 4.1 3.7 2.8 1.9 2.0 1.5 0.7 0 0 0 0 01955 0 0 0 0 0 0 0 0 0 0 0 01958 21.4 20.6 0 0 0 0 0 0 0 0 0 01960 0 0 0 0 0 0 0 0 0 0 0 01961 0 0 0 0 0 0 0 0 0 0 0 01962 0 0 0 0 0 0 0 0 0 0 0 01963 5.8 5.7 5.3 5.0 4.8 4.6 4.3 3.9 3.0 2.8 2.5 2.21964 1.4 0.7 0 0 0.8 0.1 0 0 0 0 0 01965 210.8 29.8 28.0 26.1 29.4 28.5 26.6 24.7 27.1 26.2 24.3 22.51966 1.6 0.9 0 0 1.3 0.6 0 0 0.7 0 0 01967 0.6 0.3 0 0 0.5 0.1 0 0 0.1 0 0 01968 0 0 0 0 0 0 0 0 0 0 0 01969 0.7 0 0 0 0.3 0 0 0 0 0 0 01970 0 0 0 0 0 0 0 0 0 0 0 0
Values are in million metric tons; positive values indicate net annual storage of sediment; negative values indicate net annual erosion ofsediment; and zero values indicate that the magnitude of net annual storage or erosion of sediment is less than the magnitude of the uncertaintyin the sediment budget.
*The first number indicates the uncertainty assigned to the measured sediment loads of the Colorado River at the Lees Ferry and GrandCanyon gages. The second number indicates the uncertainty assigned to the measured sediment loads of the Paria and Little Colorado Rivers.In each case an uncertainty of a factor of 3 was assigned to the estimated sediment loads of the ungaged tributaries (see Appendix A).
†These uncertainties are thought to be unreasonably low based on the discussion in Appendix B.‡These are uncertainties used in this paper.
Figure 10. (Opposite) (a) Mean supplies and export of finesediment each month (with uncertainties) during the averagepredam year. These values were calculated from the data col-lected during sediment years 1949–1955, 1958, and 1960–1962(i.e., the predam years with complete sediment data). (b) Meansupplies and export of fine sediment each month (with uncer-tainties) during the average postdam year with fluctuatingflows. These values were calculated from the data collectedduring sediment years 1966–1970. Note that the cumulativemonthly loads of the Paria and Little Colorado River arehighly correlated with the monthly export of fine sediment pastthe Grand Canyon gage, suggesting minimal accumulation offine sediment in the postdam river. (c) Amount of fine sedi-ment in storage after each month (with uncertainties) duringthe average predam year. These values were determined bydifferencing and integrating the data in Figure 10a. In theaverage predam year, fine sediment accumulated in MarbleCanyon and the upper Grand Canyon during 9 months of theyear and then was eroded. This seasonally stored and erodedfine sediment was probably largely 0.0625–0.25 mm sand (seetext). (d) Amount of fine sediment in storage after each month(with uncertainties) during the average postdam year with fluc-tuating flows. These values were determined by differencingand integrating the data in Figure 10b. In the average postdamyear, fine-sediment storage in Marble Canyon and the upperGrand Canyon cannot be demonstrated for more than 2months. As in Figure 10c, this stored and eroded fine sedimentwas probably largely sand.
TOPPING ET AL.: COLORADO RIVER SEDIMENT TRANSPORT, 1534

535TOPPING ET AL.: COLORADO RIVER SEDIMENT TRANSPORT, 1

the approximate threshold between sand accumulation andconveyance (i.e., 250 m3/s) only 27.0% of the time and ex-ceeded the approximate threshold between sand conveyanceand erosion (i.e., 450 m3/s) only 8.8% of the time. During theseason of sand erosion (April–June), flows exceeded the ap-proximate threshold between sand accumulation and convey-ance 90.4% of the time and exceeded the approximate thresh-old between sand conveyance and erosion 69.1% of the time(Figure 11).
When compared to that in the predam era, the hydrology ofthe postdam Colorado River during sediment years 1966–1970was closer to that during the predam season of sand erosion(April–June) than it was to the hydrology during the predamseason of sand accumulation and storage (July–March). Fur-thermore, given that the hydrology of the Colorado Riverduring sediment years 1966–1970 was similar to that during therest of the postdam era (sediment years 1966–1998), interpre-tations of the magnitude and duration of sand storage based onthis limited period of sediment data should be valid for theentire postdam era (Figure 11). Indeed, flows were slightlyhigher during sediment years 1966–1998 than they were duringsediment years 1966–1970, suggesting that the data from sed-iment years 1966–1970 provide an upper bound on the mag-nitude and duration of seasonal sand accumulation and storage.During sediment years 1966–1970, flows exceeded the approxi-mate predam threshold between sand accumulation and con-veyance 68.1% of the time; during sediment years 1966–1998,
flows exceeded the approximate predam threshold betweensand conveyance and erosion 73.6% of the time (Figure 11).
6.3. Discussion of the Annual and Seasonal SedimentBudgets
Analysis of the annual sediment budget does not invalidatethe hypothesis that in both the predam and postdam era theColorado River in Marble Canyon and upper Grand Canyonwas an annually supply-limited system with respect to finesediment (i.e., sand and finer material). During the 19 years ofcomplete sediment data the magnitudes of the annual fine-sediment supply and export are equal to within the uncertain-ties in the sediment budget in all but four years. The fine-sediment export can be shown to have exceeded the supply inonly sediment years 1949 and 1965. Sediment year 1949 was ayear in which a large snowmelt flood occurred (Figure 9b), andsediment year 1965 was a year with abnormally high damreleases (Figure 9b). The high flows in 1965 scoured the reachimmediately downstream of the dam [Pemberton, 1976; Wil-liams and Wolman, 1984; Burkham, 1986] and, as suggested bythis sediment budget, scoured sediment from much of Marbleand Grand Canyons. The fine-sediment supply can be shown tohave exceeded the export in only sediment years 1954 and 1963(Table 1). Sediment year 1954 was the predam year in theperiod of sediment record with the lowest flows (Figure 9b),and sediment year 1963 was the year in which the dam wasclosed and in which the naturally erosive snowmelt flood was
Figure 10. (continued)
TOPPING ET AL.: COLORADO RIVER SEDIMENT TRANSPORT, 1536

replaced by steady 30 m3/s flows (Figure 9b). Closure of thedam in 1963 occurred in March; thus the dam was closed afterthe predam season of sand accumulation and storage (July–March), when storage of sand in Marble Canyon and the upperGrand Canyon was probably at an annual maximum.
In addition to greatly diminishing the sediment supply, GlenCanyon dam has transformed a reach in which accumulation orstorage of sand dominated over most of a year to a reach inwhich conveyance or erosion of sand dominates over most of ayear. In the average predam year, newly input sand was re-tained in storage in Marble Canyon and upper Grand Canyonfor 9 months (given the assigned uncertainties). In contrast, inthe average postdam year, newly input sand may be retained instorage for only 2 months.
Our interpretation of the postdam sediment budget agreesmore closely with the early interpretation made by Laursen etal. [1976] than with three of the more recent interpretations.Laursen et al. [1976] concluded that under normal power plantreleases, the capacity of the river to transport fine sedimentexceeded the supply. In contrast, Howard and Dolan [1981],Andrews [1990, 1991], and U.S. Department of the Interior[1995] all predicted multiyear fine-sediment accumulation inMarble Canyon and upper Grand Canyon during normalpower plant fluctuating flows. Our analyses do not preclude
long-term fine-sediment accumulation under normal powerplant flows in the postdam river but rather suggest that onecannot conclude this, given the uncertainties in the sedimentbudget. Howard and Dolan [1981] predicted that fine sedimentshould accumulate at a system-wide average rate of about 1 mper decade under normal power plant flows. They based theirconclusion on (1) a high annual sediment yield for the ungagedtributaries of 780 t/km2 and, more importantly, (2) the assump-tion that the uncertainties in the measured sediment loadswere zero. Andrews [1990, 1991] based his conclusions on anestimated annual sediment export past the Grand Canyon gageof 9–11 million t, not on the measured mean-annual 1966–1972 export of 14 million t. The U.S. Department of the Interior[1995] based their conclusion on the assumption of stable re-lationships between the discharge of water and the sand-transport rate (i.e., stable sand rating curves). Topping et al.[this issue] have shown that because the grain size of sand onthe bed of the Colorado River changes substantially over time,relationships between the discharge of water and sand-transport rate change significantly over time. During and im-mediately following a tributary flood, the sand on the bed ofthe Colorado River fines as the sand supply becomes en-hanced. This causes the sand-transport rates in the ColoradoRiver to increase independently of the discharge of water.
Figure 11. Flow-duration curves constructed from the instantaneous discharge record of the Colorado Riverat the Lees Ferry gage for the predam season of sand accumulation and storage (July–March), the predamseason of sand erosion (April–June), sediment years 1966–1970, and sediment years 1966–1998. The cross-hatched region indicates the predam 200–300 m3/s transition from sand accumulation to sand conveyance orerosion; also shown are the percentages of time at which flows of 250 m3/s were equaled or exceeded in eachperiod. The predam curves were constructed from data from sediment years 1949–1955, 1958, and 1960–1962.Because the raw stage and discharge data from October 1977 to September 1979 and October 1980 toSeptember 1981 could not be found, the curve for sediment years 1966–1998 was constructed exclusive ofthese periods of missing data.
537TOPPING ET AL.: COLORADO RIVER SEDIMENT TRANSPORT, 1
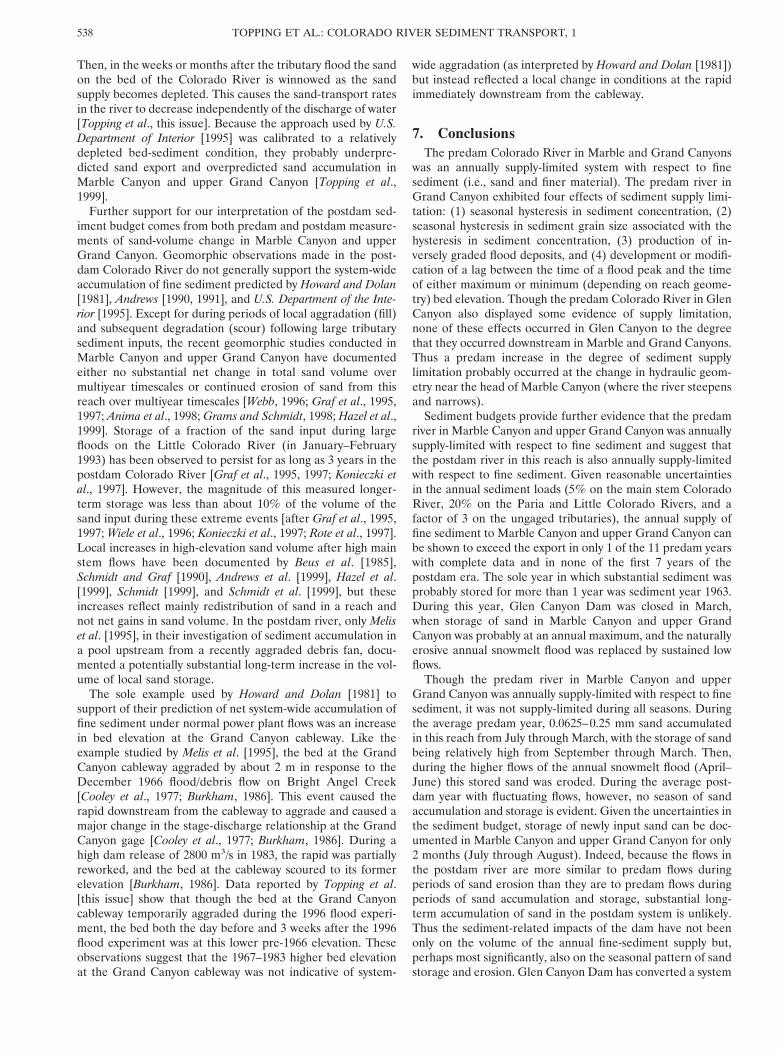
Then, in the weeks or months after the tributary flood the sandon the bed of the Colorado River is winnowed as the sandsupply becomes depleted. This causes the sand-transport ratesin the river to decrease independently of the discharge of water[Topping et al., this issue]. Because the approach used by U.S.Department of Interior [1995] was calibrated to a relativelydepleted bed-sediment condition, they probably underpre-dicted sand export and overpredicted sand accumulation inMarble Canyon and upper Grand Canyon [Topping et al.,1999].
Further support for our interpretation of the postdam sed-iment budget comes from both predam and postdam measure-ments of sand-volume change in Marble Canyon and upperGrand Canyon. Geomorphic observations made in the post-dam Colorado River do not generally support the system-wideaccumulation of fine sediment predicted by Howard and Dolan[1981], Andrews [1990, 1991], and U.S. Department of the Inte-rior [1995]. Except for during periods of local aggradation (fill)and subsequent degradation (scour) following large tributarysediment inputs, the recent geomorphic studies conducted inMarble Canyon and upper Grand Canyon have documentedeither no substantial net change in total sand volume overmultiyear timescales or continued erosion of sand from thisreach over multiyear timescales [Webb, 1996; Graf et al., 1995,1997; Anima et al., 1998; Grams and Schmidt, 1998; Hazel et al.,1999]. Storage of a fraction of the sand input during largefloods on the Little Colorado River (in January–February1993) has been observed to persist for as long as 3 years in thepostdam Colorado River [Graf et al., 1995, 1997; Konieczki etal., 1997]. However, the magnitude of this measured longer-term storage was less than about 10% of the volume of thesand input during these extreme events [after Graf et al., 1995,1997; Wiele et al., 1996; Konieczki et al., 1997; Rote et al., 1997].Local increases in high-elevation sand volume after high mainstem flows have been documented by Beus et al. [1985],Schmidt and Graf [1990], Andrews et al. [1999], Hazel et al.[1999], Schmidt [1999], and Schmidt et al. [1999], but theseincreases reflect mainly redistribution of sand in a reach andnot net gains in sand volume. In the postdam river, only Meliset al. [1995], in their investigation of sediment accumulation ina pool upstream from a recently aggraded debris fan, docu-mented a potentially substantial long-term increase in the vol-ume of local sand storage.
The sole example used by Howard and Dolan [1981] tosupport of their prediction of net system-wide accumulation offine sediment under normal power plant flows was an increasein bed elevation at the Grand Canyon cableway. Like theexample studied by Melis et al. [1995], the bed at the GrandCanyon cableway aggraded by about 2 m in response to theDecember 1966 flood/debris flow on Bright Angel Creek[Cooley et al., 1977; Burkham, 1986]. This event caused therapid downstream from the cableway to aggrade and caused amajor change in the stage-discharge relationship at the GrandCanyon gage [Cooley et al., 1977; Burkham, 1986]. During ahigh dam release of 2800 m3/s in 1983, the rapid was partiallyreworked, and the bed at the cableway scoured to its formerelevation [Burkham, 1986]. Data reported by Topping et al.[this issue] show that though the bed at the Grand Canyoncableway temporarily aggraded during the 1996 flood experi-ment, the bed both the day before and 3 weeks after the 1996flood experiment was at this lower pre-1966 elevation. Theseobservations suggest that the 1967–1983 higher bed elevationat the Grand Canyon cableway was not indicative of system-
wide aggradation (as interpreted by Howard and Dolan [1981])but instead reflected a local change in conditions at the rapidimmediately downstream from the cableway.
7. ConclusionsThe predam Colorado River in Marble and Grand Canyons
was an annually supply-limited system with respect to finesediment (i.e., sand and finer material). The predam river inGrand Canyon exhibited four effects of sediment supply limi-tation: (1) seasonal hysteresis in sediment concentration, (2)seasonal hysteresis in sediment grain size associated with thehysteresis in sediment concentration, (3) production of in-versely graded flood deposits, and (4) development or modifi-cation of a lag between the time of a flood peak and the timeof either maximum or minimum (depending on reach geome-try) bed elevation. Though the predam Colorado River in GlenCanyon also displayed some evidence of supply limitation,none of these effects occurred in Glen Canyon to the degreethat they occurred downstream in Marble and Grand Canyons.Thus a predam increase in the degree of sediment supplylimitation probably occurred at the change in hydraulic geom-etry near the head of Marble Canyon (where the river steepensand narrows).
Sediment budgets provide further evidence that the predamriver in Marble Canyon and upper Grand Canyon was annuallysupply-limited with respect to fine sediment and suggest thatthe postdam river in this reach is also annually supply-limitedwith respect to fine sediment. Given reasonable uncertaintiesin the annual sediment loads (5% on the main stem ColoradoRiver, 20% on the Paria and Little Colorado Rivers, and afactor of 3 on the ungaged tributaries), the annual supply offine sediment to Marble Canyon and upper Grand Canyon canbe shown to exceed the export in only 1 of the 11 predam yearswith complete data and in none of the first 7 years of thepostdam era. The sole year in which substantial sediment wasprobably stored for more than 1 year was sediment year 1963.During this year, Glen Canyon Dam was closed in March,when storage of sand in Marble Canyon and upper GrandCanyon was probably at an annual maximum, and the naturallyerosive annual snowmelt flood was replaced by sustained lowflows.
Though the predam river in Marble Canyon and upperGrand Canyon was annually supply-limited with respect to finesediment, it was not supply-limited during all seasons. Duringthe average predam year, 0.0625–0.25 mm sand accumulatedin this reach from July through March, with the storage of sandbeing relatively high from September through March. Then,during the higher flows of the annual snowmelt flood (April–June) this stored sand was eroded. During the average post-dam year with fluctuating flows, however, no season of sandaccumulation and storage is evident. Given the uncertainties inthe sediment budget, storage of newly input sand can be doc-umented in Marble Canyon and upper Grand Canyon for only2 months (July through August). Indeed, because the flows inthe postdam river are more similar to predam flows duringperiods of sand erosion than they are to predam flows duringperiods of sand accumulation and storage, substantial long-term accumulation of sand in the postdam system is unlikely.Thus the sediment-related impacts of the dam have not beenonly on the volume of the annual fine-sediment supply but,perhaps most significantly, also on the seasonal pattern of sandstorage and erosion. Glen Canyon Dam has converted a system
TOPPING ET AL.: COLORADO RIVER SEDIMENT TRANSPORT, 1538
in which sand would generally accumulate over 9 months anderode during 3 months of a year to one in which substantialstorage of newly input sand cannot be demonstrated for morethan 2 months per year.
Appendix A: Estimation of Ungaged TributarySediment Input
We estimated the monthly sediment loads of the ungagedtributaries by a two-step process. First, a long-term supply rateof 7.2 million t per decade for the ungaged tributaries betweenthe Lees Ferry and Grand Canyon gages was estimated for theperiod of sediment-data overlap in the Paria and Little Colo-rado Rivers (i.e., sediment years 1949–1970). This value isequivalent to an annual fine-sediment yield of 220 t/km2 (tindicates metric ton) and was determined by Griffiths et al.[1998] using the method of Renard [1972]. On the basis ofUSGS sediment-transport data and a 20% uncertainty, theannual sediment yields for the Paria and Little Colorado Riverbasins are respectively 780 6 160 and 130 6 26 t/km2. Becausethe geology in the ungaged tributary basins is more similar tothat in the Little Colorado River basin than that in the PariaRiver basin and because the fine-sediment yield of the PariaRiver basin is known to be amongst the highest on the Colo-rado Plateau, the fine-sediment yield of 220 t/km2 computed byGriffiths et al. [1998] is appropriate. After determination of thelong-term supply rate, because the hydrology of the ungagedtributaries is somewhat similar to that of the Paria and LittleColorado Rivers, the fine-sediment load of the ungaged trib-utaries each month within sediment years 1949–1970 was set asproportional to the combined monthly fine-sediment load ofthe Paria and Little Colorado Rivers.
On the basis of the comparison of predictions of fine-sediment yield by the Renard [1972] method and field datafrom the Little Colorado River basin [Griffiths et al., 1998], theuncertainty associated with the estimate of the fine-sedimentloads in the ungaged tributaries was determined to be approx-imately a factor of 3. Though this approach may seem primi-tive, the sediment budget is not extremely sensitive to theuncertainty in the estimated fine-sediment input from the un-gaged tributaries because the mean-annual input from thissource (i.e., 0.72 6 (a factor of 3) million t/yr) is comparable tothe mean-annual uncertainty associated with the measuredfine-sediment inputs. For example, given a 5% uncertainty inthe load of the Colorado River at Lees Ferry and a 20%uncertainty in the loads of the Paria and Little Colorado Riv-ers, the mean-annual uncertainty associated with the measuredinputs is 5.3 million t/yr during the predam era and 2.3 milliont/yr during the postdam era.
Appendix B: Sources of Sediment-LoadMeasurement Error
There are six major sources of measurement error inherentin the daily sediment loads used to construct the sedimentbudget for Marble Canyon and upper Grand Canyon. The firstand most easily quantifiable source of error in daily sedimentloads arises from the computation of the discharge of water.This error is greatest in rivers with poorly defined stage-discharge rating curves, like the hydrologically flashy PariaRiver. For the main stem Colorado River the rating curves andshifts in ratings were well defined; thus the discharge errorsreported by the USGS were only 2% (unpublished USGS
annual technical files from the Lees Ferry and Grand Canyongages, 1948–1970). For the Little Colorado River the dis-charge errors reported by the USGS were typically 5% (un-published USGS annual technical files from the LCR nearCameron gage, 1948–1970), though the discharge errors ex-ceeded this during higher flows. However, for the Paria River,because of a general lack of discharge measurements at higherflows, the errors were much larger and greatly exceeded 10%during periods of high flow. During the period for which asediment budget can be constructed (October 1947 throughSeptember 1970), 50% of all discharge measurements on theParia River were made at flows less than 0.45 m3/s, 97% of alldischarge measurements were made at flows less than 15 m3/s,and the highest discharge measurement was made at a flow of76 m3/s [after Topping, 1997]. During October 1947 to Septem-ber 1970, 13 floods had peaks higher than the highest dischargemeasurement made during this period [Topping, 1997]. Be-cause of these problems, the discharge errors reported by theUSGS for the Paria River were typically 5% at flows less than14 m3/s and were greater than 8% at higher flows (unpublishedUSGS annual technical files from the Paria River Lees Ferrygage, 1948–1970). Prior to the first use of the modern slope-area method for estimating the peak discharge during a flood(method described by Dalrymple and Benson [1967]) in Sep-tember 1963, errors in Paria River peak flood discharges some-times exceeded 50% [Topping, 1997].
The five major sources of error related to determining sed-iment concentration are much harder to quantify and are typ-ically larger than those associated with computing the dis-charge of water. The first of these is best termed a “sediment-station location error.” This error has to do with whether asuspended-sediment measurement station is in a good locationto measure sediment loads. In the Grand Canyon region thissource of error was significant (but hard to quantify) only onthe Little Colorado River (LCR), where discharges and sus-pended-sediment concentrations were measured at differentlocations. On this river, discharges (and ultimately sedimentloads) were computed at the LCR near Cameron gage, butsuspended-sediment concentrations were measured upstreamat the highway 89 bridge at Cameron, Arizona (Figure 1).Importantly, a major sediment supplier to the LCR, that is,Moenkopi Wash, enters the LCR downstream from the sus-pended-sediment measurement station and upstream from thegage. The limited number of USGS suspended-sediment mea-surements made on Moenkopi Wash indicate that in similarflows, sediment concentrations in this stream are typically afactor of 5 or more higher than in the LCR. Indeed, in someyears, more of the sediment supplied to the Colorado River bythe LCR is from Moenkopi Wash than from the LCR aboveMoenkopi Wash [e.g., Graf et al., 1996, Figure 25]. Memo-randa circulated between the USGS and the Bureau of Rec-lamation (the agency who provided funding for the sediment-load measurements on the LCR) in 1949 indicate that theUSGS was aware of this problem but because of funding lim-itations could not add a daily sediment station on MoenkopiWash (unpublished USGS permanent technical file from theLCR at Cameron water-quality station (located at the highway89 bridge at Cameron)). Therefore, during October 1947through September 1970, the USGS attempted to account forthe sediment inputs from Moenkopi Wash either by (1) sub-tracting the discharge from Moenkopi Wash and using theconcentrations as measured at the LCR at Cameron, Arizona,water-quality station or (2) increasing the measured concen-
539TOPPING ET AL.: COLORADO RIVER SEDIMENT TRANSPORT, 1

trations at the LCR at Cameron, Arizona, water-quality sta-tion. Unpublished internal USGS memoranda dated Decem-ber 26, 1950, and November 3, 1952, suggest that the errorassociated with the LCR sediment loads ranged from slightlyless than 25% to as much as 50% (memoranda on file inunpublished USGS annual sediment technical files from theLCR at Cameron, water-quality station, 1949, 1951). In thememorandum dated November 3, 1952, the Regional ChemistC. S. Howard stated that “ z z z the Geological Survey was get-
ting records at the Cameron Bridge because that was where theBureau of Reclamation wanted them but that we in the Surveyknew they were not good records.” In this same memorandumhe argued that the sediment records from the LCR at Cam-eron should not be published and stated that he could notagree “ z z z that the figures may have some definite value toothers.” Thus this “sediment-station location” source of error isextremely difficult to quantify.
The second source of error related to determining sediment
Figure 12. Paria River measured suspended-sediment concentrations, the curves constructed by the USGSto estimate sediment concentrations between the times of the measurements, and the instantaneous dischargeof water. Measured and estimated concentrations in Figure 12 are from unpublished USGS sediment notesfrom the Paria River at Lees Ferry gage; the discharge of water was computed by Topping [1997] usingunpublished raw USGS stage and discharge data from this gage. (a) An example of an unusually wellmeasured period of tributary sediment loads in 1953. Note that in some cases, the time of the peakconcentration was assumed to occur at the same time as the flood peak, and, in other cases (especially on July18 and 19), it was assumed to lag the flood peak. (b) An example of a typically sparsely measured period oftributary loads in 1961. Note that (1) the concentrations during the entire flood on September 9 wereestimated and not measured and (2) the peak concentration was assumed to be quite high and to occur at thesame time as the flood peak. (c) Another example of a sparsely measured period of tributary sediment loads(but one in which a different interpretation was used to estimate concentrations) in 1972. In this case, like inFigure 12b, no measurements of sediment concentration were made during the flood on August 14–15.However, in this case, the peak concentration was assumed to be much lower than in Figure 12b (even thoughthe peak discharge of this flood was much larger than that during the September 1961 flood) and was assumedto lag the flood peak.
TOPPING ET AL.: COLORADO RIVER SEDIMENT TRANSPORT, 1540

concentration arises from how well the spatial distribution ofsuspended sediment in a cross section is characterized. Anexample of this type of error comes from 1957 at the LeesFerry gage, when only inadequate sampling equipment wasavailable at the gage. During 1957, a D-43 suspended-sedimentsampler was the only type of suspended-sediment sampleravailable for use at the Lees Ferry gage (unpublished USGSLees Ferry gage annual technical file, 1958). Because a D-43sampler could only sample to a depth of 4.5 m [Guy andNorman, 1970], the lower portion of the Colorado River atLees Ferry could not be sampled properly during higher flows.Thus the measured sediment load at the Lees Ferry gageduring the higher portions of the 1957 snowmelt flood was toolow. The USGS corrected this problem during 1958, when theD-43 was replaced by a P-46 sampler, a sampler designed fordeeper, higher-velocity flows (unpublished USGS Lees Ferrygage annual technical file, 1958).
The third source of error related to determining sedimentconcentration arises from how well changes in sediment con-centration over time are characterized during periods of rap-idly varying flow. During these periods, sediment loads in theintervals between measured concentrations were estimated byfirst drawing a curve between the measured concentrations andthen multiplying the estimated concentrations along this curveby the discharge during these intervals (see Porterfield [1972]for a detailed description of this procedure). Because typicallyonly 1 or 2, and sometimes no, samples were collected duringlarge flood events on the Paria and Little Colorado Rivers, thissource of error may easily have been as high as 100% duringindividual floods on these rivers (Figure 12). This source oferror also became significant on the main stem Colorado Riverat the Grand Canyon gage during the postdam era when onlyone sample was collected each day under daily fluctuatingflows. Therefore this source of error is probably the largestsource of error in the sediment budget for Marble Canyon andupper Grand Canyon.
The fourth and fifth sources of error related to determiningsediment concentration arise from changes in personnel andlaboratory analyses. Because of the complexity of measuringsediment loads in a river, significant errors or changes in themagnitude of error can be introduced into sediment-load datawhen there is a change in the personnel making the measure-ments [e.g., Allen and Petersen, 1981]. Allen and Petersenfound that a difference in sediment load of 30% was possiblewhen the load was calculated using samples collected by per-sonnel with different levels of experience. Also, a significanterror or change in the magnitude of error can be introducedwhen there is a change in the personnel making the computa-tions. For example, in computing loads, one person mightassume that the maximum sediment concentration occurs atthe same time as the flood peak, and another might assumethat it occurs at a different time (Figure 12). The other placewhere errors can be introduced into sediment-load data is inthe laboratory where the samples are processed, but this istypically the smallest of all of the sources of error.
As indicated by the above summary of the sources of mea-surement error, uncertainties in the calculated sediment loadon any individual day can be quite large but are difficult toquantify. On the main stem Colorado River they were probablyas large as 10–30%, and on the Paria and Little ColoradoRivers, they could easily have been as high as 50–100%. Be-cause the uncertainty in the mean of a time series is typicallymuch smaller than the uncertainties associated with the indi-
vidual measurements (when the various sources of error areuncorrelated), the uncertainties associated with sediment loadsover monthly or annual timescales were probably smaller.However, because the error associated with measurements ofsediment concentration are all much larger than the errorassociated with the computation of the discharge of water, theuncertainties in the sediment loads still had to be much largerthan those associated with the computation of the discharge ofwater.
Therefore, perhaps the best way to estimate the minimalprobable uncertainty in monthly or annual sediment loads is tomultiply the uncertainty in the discharge of water by about afactor of 2. This approach yields minimal uncertainties in themonthly or annual sediment loads in the Colorado, Paria, andLittle Colorado Rivers of about 5%, 20%, and 10%, respec-tively. However, because of the different locations at whichsediment concentrations and the discharge of water were mea-sured, the errors thought by USGS personnel to exist in theLittle Colorado River sediment records ranged from slightlyless than 25% to as much as 50%. Thus a reasonable minimaluncertainty in the monthly or annual sediment loads in theLittle Colorado River is also 20%. Therefore, in this paper,uncertainties of 5% are assigned to the measured sedimentloads of the Colorado River, and uncertainties of 20% areassigned to the measured sediment loads of the Paria andLittle Colorado Rivers.
Acknowledgments. This research was funded by the Grand CanyonMonitoring and Research Center. Randy Parker, Paul Kinzel, IngridCorson, and Lisa Dierauf helped compile and process the historicaldata from the Lees Ferry and Grand Canyon gages. Ted Melis, PeterGriffiths, George Tate, Bob Bohannon, Lars Neimi, and Steve Bledsoehelped collect the samples from the predam flood deposits. Conver-sations with Jack Schmidt, Jon Nelson, Steve Wiele, Randy Parker,Peter Wilcock, and Paul Grams helped improve the quality of thescience. Jack Schmidt, Jon Nelson, Jim Bennett, Bill Dietrich, AlanHoward, and Peter Whiting provided thorough reviews of earlier ver-sions of this manuscript.
ReferencesAllen, P. B., and D. V. Petersen, A study of the variability of suspended
sediment measurements, in Erosion and Sediment Transport Mea-surements, Proceedings of the Florence Symposium, June 1981, IAHSPubl., 133, 203–211, 1981.
Andrews, E. D., The Colorado River: A perspective from Lees Ferry,Arizona, in The Geology of North America, vol. O-1, Surface WaterHydrology, edited by M. G. Wolman and H. C. Riggs, pp. 281–328,Geol. Soc. of Am., Boulder, Colo., 1990.
Andrews, E. D., Sediment transport in the Colorado River basin, inColorado River Ecology and Dam Management, edited by Comm. onGeosci., Environ., and Resour., pp. 54–74, Washington, D. C., Natl.Acad., 1991.
Andrews, E. D., C. E. Johnson, J. C. Schmidt, and M. Gonzales,Topographic evolution of sand bars, in The 1996 Controlled Flood inGrand Canyon, Geophys. Monogr. Ser., vol. 110, edited by R. H.Webb et al., pp. 117–130, AGU, Washington, D. C., 1999.
Anima, R. J., M. S. Marlow, D. M. Rubin, and D. J. Hogg, Comparisonof sand distribution between April 1994 and June 1996 along sixreaches of the Colorado River in Grand Canyon, Arizona, U.S. Geol.Surv. Open File Rep., 98-141, 33 pp., 1998.
Beus, S. S., S. W. Carothers, and C. C. Avery, Topographic changes influvial terrace deposits used as campsite beaches along the ColoradoRiver in Grand Canyon, J. Ariz. Nev. Acad. Sci., 20, 111–120, 1985.
Brooks, N. H., Mechanics of streams with movable beds of fine sand,Trans. Am. Soc. Civ. Eng., 123, 526–594, 1958.
Burkham, D. E., Trends in selected hydraulic variables for the Colo-rado River at Lees Ferry and near Grand Canyon, Arizona—1922–1984, report, 58 pp., Bur. of Reclam., Glen Canyon Environ. Stud.,
541TOPPING ET AL.: COLORADO RIVER SEDIMENT TRANSPORT, 1

Flagstaff, Ariz., 1986. (Available as PB88-216098 from Natl. Tech.Inf. Serv., Springfield, Va.)
Colby, B. R., Scour and fill in sand-bed streams, U.S. Geol. Surv. Prof.Pap., 462-D, 32 pp., 1964.
Cooley, M. E., B. N. Aldridge, and R. C. Euler, Effects of the cata-strophic flood of December, 1966, North Rim area, eastern GrandCanyon, Arizona, U.S. Geol. Surv. Prof. Pap., 980, 43 pp., 1977.
Dalrymple, T., and M. A. Benson, Measurement of peak discharge bythe slope-area method, U.S. Geol. Surv. Tech. of Water Resour. In-vest., Book 3, Chap. A2, 12 pp., 1967.
Dunne, T., and L. B. Leopold, Water in Environmental Planning, 818pp., W. H. Freeman, New York, 1978.
Federal Inter-Agency River Basin Committee, A study of methodsused in measurement and analysis of sediment loads in streams, inComparative Field Tests on Suspended-Sediment Samplers as of Jan-uary 1946, Rep. D, pp. 39–48, St. Anthony Falls Hydraul. Lab.,Minneapolis, Minn., 1957.
Graf, J. B., J. E. Marlow, G. G. Fisk, and S. M. D. Jansen, Sand-storagechanges in the Colorado River downstream from the Paria andLittle Colorado Rivers, June 1992 to February 1994, U.S. Geol. Surv.Open File Rep., 95-446, 61 pp., 1995.
Graf, J. B., L. Wirt, E. K. Swanson, G. G. Fisk, and J. R. Gray,Streamflow transport of radionuclides and other chemical constitu-ents in the Puerco and the Little Colorado River basins, Arizona andNew Mexico, U.S. Geol. Surv. Water Supply Pap., 2459, 89 pp., 1996.
Graf, J. B., J. E. Marlow, P. D. Rigas, and S. M. D. Jansen, Sand-storage changes in the Colorado River downstream from the Pariaand Little Colorado Rivers, April 1994 to August 1995, U.S. Geol.Surv. Open File Rep., 97-206, 41 pp., 1997.
Grams, P. E., and J. C. Schmidt, Synthesis of geomorphic data in thePoint Hansbrough and Little Colorado River confluence studyreaches, Rep. 1425-96-FC-81-05023, Grand Canyon Monit. and Res.Cent., Flagstaff, Ariz., 1998.
Griffiths, P. G., R. H. Webb, D. R. Hartley, and T. S. Melis, Estimatesof sediment input from ungaged tributaries in Grand Canyon, Ari-zona, preliminary report, Grand Canyon Monit. and Res. Cent.,Flagstaff, Ariz., 1998.
Guy, H. P., and V. W. Norman, Field methods for measurement offluvial sediment, U.S. Geol. Surv. Tech. Water Resour. Invest., Book 3,Chap. C2, 6–7, 1970.
Hazel, J. E., Jr., M. Kaplinski, R. Parnell, M. Manone, and A. Dale,Topographic and bathymetric changes at thirty-three long-termstudy sites, in The 1996 Controlled Flood in Grand Canyon, Geophys.Monogr. Ser., vol. 110, edited by R. H. Webb et al., pp. 161–184,AGU, Washington, D. C., 1999.
Howard, A., and R. Dolan, Geomorphology of the Colorado River inthe Grand Canyon, J. Geol., 89, 269–298, 1981.
Hunt, J. N., On the turbulent transport of a heterogeneous sediment,Q. J. Mech. Appl. Math., 22, 235–246, 1969.
Iseya, F., Mechanism of inverse grading of suspended load deposits, inSedimentary Facies in the Active Plate Margin, edited by A. Taira andF. Masuda, pp. 113–129, Terra Sci., Tokyo, 1989.
Konieczki, A. D., J. B. Graf, and M. C. Carpenter, Streamflow andsediment data collected to determine the effects of a controlledflood in March and April 1996 on the Colorado River between LeesFerry and Diamond Creek, Arizona, U.S. Geol. Surv. Open File Rep.,97-224, 55 pp., 1997.
Laursen, E. M., S. Ince, and J. Pollack, On sediment transport throughGrand Canyon, paper presented at Third Federal Interagency Sed-imentation Conference, Sediment. Comm., Water Resour. Counc.,Denver, Colo., March 22–25, 1976.
Leopold, L. B., and T. Maddock Jr., The hydraulic geometry of streamchannels and some physiographic implications, U.S. Geol. Surv. Prof.Pap., 252, 57 pp., 1953.
Martin, R., A Story That Stands Like a Dam, 354 pp., Henry Holt, NewYork, 1989.
McLean, S. R., On the calculation of suspended load for noncohesivesediments, J. Geophys. Res., 97, 5759–5770, 1992.
Melis, T. S., R. H. Webb, M. Kaplinski, J. E. Hazel Jr., J. P. Shannon,D. W. Blinn, R. A. Valdez, and R. J. Ryel, Impacts of the 1993Tanner Canyon debris flow on physical and aquatic resources of theColorado River in Grand Canyon National Park, Arizona, EosTrans. AGU, 76(46), Fall Meet. Suppl., F254, 1995.
Moog, D. B., and P. J. Whiting, Annual hysteresis in bed load ratingcurves, Water Resour. Res., 34, 2393–2399, 1998.
Nanson, G. S., Bedload and suspended-load transport in a small, steepmountain stream, Am. J. Sci., 274, 471–486, 1974.
Pemberton, E. L., Channel changes in the Colorado River below GlenCanyon Dam, paper presented at Third Federal Interagency Sedi-mentation Conference, Sediment. Comm., Water Resour. Counc.,Denver, Colo., March 22–25, 1976.
Porterfield, G., Computation of fluvial sediment discharge, U.S. Geol.Surv. Tech. Water Resour. Invest., Book 3, chap. C3, 17–52, 1972.
Renard, K. G., Sediment problems in the arid and semi-arid southwest,paper presented at 27th Annual Meeting, Soil Conserv. Soc. of Am.,Portland, Oreg., Aug. 6–9, 1972.
Rote, J. J., M. E. Flynn, and D. J. Bills, Hydrologic data, ColoradoRiver and major tributaries, Glen Canyon Dam to Diamond Creek,Arizona, water-years 1990–95, U.S. Geol. Surv. Open File Rep., 97-250, 474 pp., 1997.
Rouse, H., Modern conceptions of the mechanics of turbulence, Trans.Am. Soc. Civ. Eng., 102, 463–543, 1937.
Rubin, D. M., J. M. Nelson, and D. J. Topping, Relation of inverselygraded deposits to suspended-sediment grain-size evolution duringthe 1996 flood experiment in Grand Canyon, Geology, 26, 99–102,1998.
Schmidt, J. C., Summary and synthesis of geomorphoric studies con-ducted during the 1996 controlled flood in Grand Canyon, in The1996 Controlled Flood in Grand Canyon, Geophys. Monogr. Ser., vol.110, edited by R. H. Webb et al., pp. 329–342, AGU, Washington,D. C., 1999.
Schmidt, J. C., and J. B. Graf, Aggradation and degradation of alluvialsand deposits, 1965 to 1986, Colorado River, Grand Canyon Na-tional Park, Arizona, U.S. Geol. Surv. Prof. Pap., 1493, 74 pp., 1990.
Schmidt, J. C., P. E. Grams, and M. F. Leschin, Variation in themagnitude and style of deposition and erosion in three long (8–12km) reaches as determined by photographic analyses, in The 1996Controlled Flood in Grand Canyon, Geophys. Monogr. Ser., vol. 110,edited by R. H. Webb et al., pp. 185–204, AGU, Washington, D. C.,1999.
Smith, J. D., Modeling of sediment transport on continental shelves, inThe Sea, vol. 6, edited by E. D. Goldberg, pp. 539–577, John Wiley,1977.
Topping, D. J., Physics of flow, sediment transport, hydraulic geome-try, and channel geomorphic adjustment during flash floods in anephemeral river, the Paria River, Utah and Arizona, Ph.D. thesis,406 pp., Univ. of Wash., Seattle, 1997.
Topping, D. J., R. S. Parker, J. M. Nelson, and J. P. Bennett, Theapparent mid-20th century sediment load decrease in the ColoradoRiver basin: An investigation of the mechanics of the ColoradoRiver Sampler, Geol. Soc. Am. Abstr. Programs, 28(7), 261, 1996.
Topping, D. J., D. M. Rubin, J. M. Nelson, P. J. Kinzel III, and J. P.Bennett, Linkage between grain-size evolution and sediment deple-tion during Colorado River floods, in The 1996 Controlled Flood inGrand Canyon, Geophys. Monogr. Ser., vol. 110, edited by R. H. Webbet al., pp. 71–98, AGU, Washington, D. C., 1999.
Topping, D. J., D. M. Rubin, J. M. Nelson, P. J. Kinzel III, and I. C.Corson, Colorado River sediment transport, 2, Systematic bed-elevation and grain-size effects of sand supply limitation, WaterResour. Res., this issue.
U.S. Department of the Interior, Operation of Glen Canyon Dam,final environmental impact statement, 337 pp., Bur. of Reclam., SaltLake City, Utah, 1995.
Webb, R. H., Grand Canyon, A Century of Change, 290 pp., Univ. ofAriz., Tucson, 1996.
Wiele, S. M., J. B. Graf, and J. D. Smith, Sand deposition in theColorado River in the Grand Canyon from flooding of the LittleColorado River, Water Resour. Res., 32, 3579–3596, 1996.
Williams, G. P., and M. G. Wolman, Downstream effects of dams onalluvial rivers, U.S. Geol. Surv. Prof. Pap., 1286, 83 pp., 1984.
D. M. Rubin, U.S. Geological Survey, 345 Middlefield Road, MS999, Menlo Park, CA 94025. ([email protected])
D. J. Topping, U.S. Geological Survey, National Center, MS 430,12201 Sunrise Valley Drive, Reston, VA 20192. ([email protected])
L. E. Vierra Jr., Department of Civil and Environmental Engineer-ing, University of Colorado, Boulder, CO 80309. ([email protected])
(Received August 6, 1998; revised September 14, 1999;accepted September 17, 1999.)
TOPPING ET AL.: COLORADO RIVER SEDIMENT TRANSPORT, 1542