1 Title: Drivers of red fox (Vulpes vulpes) daily...
29
1 Title: Drivers of red fox (Vulpes vulpes) daily activity: prey availability, human 1 disturbance or habitat structure? 2 Abbreviated title: Drivers of red fox activity patterns 3 Authors: F. Díaz-Ruiz a, b , J. Caro a , M. Delibes-Mateos a, b, c , B. Arroyo a and P. Ferreras a 4 5 a Instituto de Investigación en Recursos Cinegéticos (IREC; CSIC-UCLM-JCCM). 6 Ronda de Toledo s/n 13071 Ciudad Real, Spain. Phone number: 0034 926295450. 7 b CIBIO/InBIO, Universidade do Porto, Campus de Vairao 4485-661, Vairao Vila do 8 Conde, Portugal 9 c Instituto de Estudios Sociales Avanzados (IESA-CSIC). Campo Santo de los Mártires 7 10 14004, Córdoba, Spain. 11 12 13 Corresponding author: Francisco Díaz-Ruiz. Instituto de Investigación en Recursos 14 Cinegéticos (IREC; CSIC-UCLM-JCCM). Ronda de Toledo s/n 13071 Ciudad Real, 15 Spain. E-mail address: [email protected] 16
Transcript of 1 Title: Drivers of red fox (Vulpes vulpes) daily...

1
Title: Drivers of red fox (Vulpes vulpes) daily activity: prey availability, human 1
disturbance or habitat structure? 2
Abbreviated title: Drivers of red fox activity patterns 3
Authors: F. Díaz-Ruiza, b, J. Caroa, M. Delibes-Mateosa, b, c, B. Arroyoa and P. Ferrerasa 4
5
aInstituto de Investigación en Recursos Cinegéticos (IREC; CSIC-UCLM-JCCM). 6
Ronda de Toledo s/n 13071 Ciudad Real, Spain. Phone number: 0034 926295450. 7
bCIBIO/InBIO, Universidade do Porto, Campus de Vairao 4485-661, Vairao Vila do 8
Conde, Portugal 9
cInstituto de Estudios Sociales Avanzados (IESA-CSIC). Campo Santo de los Mártires 7 10
14004, Córdoba, Spain. 11
12
13
Corresponding author: Francisco Díaz-Ruiz. Instituto de Investigación en Recursos 14
Cinegéticos (IREC; CSIC-UCLM-JCCM). Ronda de Toledo s/n 13071 Ciudad Real, 15
Spain. E-mail address: [email protected] 16
2
Abstract 17
Daily activity patterns in mammals depend on food availability, reproductive stage, 18
habitat selection, intraspecific interactions and predation risk, among other factors. Some 19
mammals exhibit behavioral plasticity in activity patterns, which allows them to adapt to 20
environmental changes. A good example of this can be found in the red fox Vulpes vulpes. 21
This species is adapted to living in highly humanized environments, where it is often 22
culled because it may affect human interests (e.g. through the consumption of game 23
species or livestock). We assessed the potential main drivers of the daily activity patterns 24
of the red fox in 12 Iberian Mediterranean areas through the use of camera traps. Among 25
drivers, we considered main prey availability (wild rabbit Oryctolagus cuniculus), degree 26
of human disturbance (e.g. distance to human settlements, and intensity of predator 27
control) and habitat structure. Our results revealed a predominantly crepuscular and 28
nocturnal activity of foxes with local variations. Although overall activity of fox 29
increased with rabbit availability, the temporal overlap with prey activity was on average 30
low, because foxes increased activity when rabbits decreased theirs (twilight-night). Red 31
fox activity rhythms seemed to be determined by human presence where human 32
disturbance is high. In addition, diurnal activity decreased in areas with higher levels of 33
human disturbance (closer to human settlements and high predator control intensity) and 34
increased in dense habitats. Our study shows that daily activity patterns of highly 35
adaptable species are determined by several interacting drivers, resulting in complex 36
behavioral patterns. This suggests that further studies should consider different factors 37
simultaneously for a better understanding of daily activity patterns of wildlife in 38
humanized landscapes. 39
Key words: camera trap, circadian rhythms, human disturbance, fox control, 40
Oryctolagus cuniculus. 41

3
Introduction 42
Daily activity patterns have been defined as adaptive sequences of routines that meet the 43
time structure of the environment, shaped by evolution and fine-tuned to the actual state 44
of the environment (Halle, 2000). In mammals, daily activity is internally regulated by 45
species-specific endogenous clocks (Kronfeld-Schor & Dayan, 2003), but also by 46
external factors such as nutritional requirements (Masi, Cipolletta & Robbins, 2009), 47
temporal habitat selection (Chavez & Gese, 2006), intraguild interactions (Di Bitetti et 48
al., 2010) or predation risk (Lima & Dill, 1990). Additionally, mammals, as well as other 49
animals, show behavioral responses to environmental changes induced by human 50
activities (Tuomainen & Candolin, 2011). 51
Similarly to other mammals, daily activity patterns in mammalian predators are mainly 52
determined by both innate activity rhythms and prey availability. The latter has been 53
defined as the combination of prey abundance and their accessibility; prey can be 54
abundant but inaccessible to predators when not active or in inaccessible habitats 55
(Ontiveros, Pleguezuelos & Caro, 2005). A high level of synchrony between predator and 56
prey activity has thus been reported in some cases (Foster et al., 2013; Monterroso, Alves 57
& Ferreras, 2013). Additionally, daily activity patterns of mammalian predators may be 58
influenced by other external factors like habitat structure or human disturbance. 59
Mammalian predators frequently decrease their activity at daytime in open habitats 60
(Chavez & Gese, 2006), where predator removal is conducted (Kitchen et al., 2000) or 61
where human activities such as hunting or outdoor recreational activities are common 62
(Belotti et al., 2012; Ordiz et al., 2012). 63
We chose the red fox Vulpes vulpes as a model to study the flexibility of mammalian 64
predator daily activity patterns due to its high ecological plasticity. The red fox is the 65
most widely distributed mammalian carnivore of the world and it is found in many 66
different habitats, where it can be abundant and feeds on a large variety of foods (Sillero-67
Zubiri et al., 2004; Díaz-Ruiz et al., 2013). Although the species is a generalist predator, 68
in certain regions such as central-southern Spain, European wild rabbits Oryctolagus 69
cunniculus are the fox main prey when abundant (Delibes-Mateos et al. 2008; Díaz-Ruiz 70
et al., 2013). Red foxes have adapted to living in highly human-dominated landscapes, 71
where they take advantage of human subsidiary resources (Bino et al., 2010). On the other 72
hand, they are often persecuted by humans because they feed on game species and 73

4
livestock (Sillero-Zubiri et al., 2004). In areas where predator control is carried out more 74
intensively foxes are exposed to a higher ‘risk of predation’ by humans (Reynolds & 75
Tapper, 1996). Thus, fox control could cause stronger fox behavioral responses to human 76
presence in these areas: when hunting constitutes an important source of mortality, human 77
presence itself may create a ‘landscape of fear’ and thereby provoke strong behavioral 78
responses (Martin et al., 2010; Ordiz et al., 2012). 79
Daily rhythms of activity are among the least studied aspects of the ecology and biology 80
of red foxes. Different studies have shown that red foxes are mainly nocturnal-81
crepuscular, a pattern that can be explained by factors such as season, habitat structure, 82
prey and human activities (Blanco, 1986; Cavallini & Lovari, 1994; Baker et al., 2007; 83
Monterroso, Alves & Ferreras, 2013; Villar et al., 2013). Notwithstanding, to our 84
knowledge no study has examined the simultaneous influence of ecological (e.g. habitat 85
and prey availability) and human-related factors on red fox activity. 86
We evaluated the plasticity of red fox daily activity in environments with varying levels 87
of prey availability, habitat structure and human disturbance (e.g. fox control and distance 88
to human settlements) in Mediterranean areas of central Spain, where fox control is a 89
widespread game management tool (Delibes-Mateos et al., 2013; Díaz-Ruiz & Ferreras, 90
2013). According to previous studies on mammal predator activity we expected that foxes 91
would adapt their activity pattern to that of their preferred prey at least where this is highly 92
available, but that this behavioral pattern could be disrupted by other factors, such as 93
habitat composition or human disturbance. To assess this, we first tested whether the daily 94
activity patterns of the red fox were related to the daily activity of its preferred prey 95
(European wild rabbit) in central Spain (Delibes-Mateos et al. 2008). Secondly, we tested 96
the relationships between the daily activity of red foxes and prey availability, human 97
disturbance and habitat structure simultaneously. 98
Material and Methods 99
Study area 100
The study was conducted in 12 localities within central Spain (Fig. 1), with 101
Mediterranean-continental climate (Rivas-Martínez, Penas & Díaz, 2004). The landscape 102
was heterogeneous and dominated by cereal croplands and permanent crops such as olive 103
groves and vineyards and natural pastures, mixed with Mediterranean scrubland (mainly 104

5
Cistus spp. and holm oak Quercus ilex forests). Other less abundant habitats included 105
riparian habitats, ‘dehesas’ (pastureland with savannah-like open tree layer, mainly 106
dominated by Mediterranean evergreen oaks) and tree plantations (Pinus spp., Eucalyptus 107
spp. and Populus spp.). Villages and scattered dwellings were interspersed in the 108
landscape. Surface and habitat composition varied among localities (see Table 1 for a 109
detailed description). 110
Agriculture and livestock were the main economic activities in all localities, which were 111
hunting estates too, with the exception of two protected areas where hunting was not 112
allowed (numbers 5 and 11 in Fig. 1). Hunting estates were managed to improve small 113
game populations, mainly by the provision of supplementary food and water, and predator 114
control. Direct shooting and live trapping with cage traps and neck snares are the methods 115
most used for legal fox culling (Delibes-Mateos et al., 2013, Díaz-Ruiz & Ferreras, 2013). 116
In central Spain, there is a high variation in the use of these management measures among 117
hunting estates (Arroyo et al., 2012). In addition, estates usually employ diverse 118
management tools simultaneously and their intensity of use is generally correlated; more 119
intensively managed estates employ more game keepers per km2, and have higher hunting 120
pressure (e.g. more hunting days per year) and larger bags (Arroyo et al., 2012). In our 121
study the intensity of fox control also varied largely among hunting estates (Table 1), thus 122
reflecting differences in general game management intensity. 123
Camera trap surveys 124
Camera trap surveys were carried out between 2010 and 2013. One sampling survey was 125
developed in each study area between mid-May and mid-August (Table 1) outside the 126
regular hunting season. We used two similar models of infrared-triggered digital cameras: 127
Leaf River IR5 (LeafRiver OutDoor Products, USA) were used only in 2010 surveys (35 128
cameras), and HCO ScoutGuard (HCO OutDoor Products, USA) in the remaining 129
surveys (179 cameras). Cameras were uniformly spaced in each locality following a grid-130
sampling scheme according to field features; the average distance between neighbouring 131
cameras was ~1.2 km, boosting independence between them (Monterroso, Alves & 132
Ferreras, 2013; 2014). Between 14 and 20 camera traps were deployed in each study 133
locality, proportionally to locality surface (Table 1). Cameras were mounted on trees 134
approximately 0.5m off the ground and set to record time and date when triggered. 135
Cameras operated 24 h a day for an average period of 28.4 ± 0.4 days (mean ± SE). We 136

6
programmed cameras with the minimum time delay between consecutive photos to ensure 137
species identification of each event. 138
In order to increase the detection probability of red fox, we set the sensitivity of the 139
infrared sensor at the highest level, and used a combination of Valerian scent and Iberian 140
lynx Lynx pardinus urine, which is an effective attractant for the red fox (Monterroso, 141
Alves & Ferreras, 2011). Lures were put in two independent perforated plastic vials (3-4 142
ml) secured to a metal rod, set at 2-3 m from each camera trap, and replenished every two 143
weeks. Consecutive images of the same species within 30 min interval were considered 144
as the same event and those separated by a longer interval as independent events (O’Brien, 145
Kinniard & Wibisono 2003; Davis, Kelly & Stauffer, 2011). To assess the ability of 146
camera-trapping to detect foxes and rabbits we estimated weekly detection probability 147
conditioned to their presence in our study area using single season-species occupancy 148
models (see MacKenzie et al. 2006). Models were built taking into account a habitat 149
covariate (i.e. open or dense, a description of how habitats were classified in these two 150
categories is provided below) that may affect both species detection and occupancy 151
probabilities (MacKenzie et al. 2006). 152
In an independent study, we tested whether rabbit detection in the cameras was affected 153
by the use of lures. We gathered data during field trials performed in 2013 with the same 154
methodology (n=37 cameras during ~one month) in a near-by area with similar landscape 155
features as in our study areas (i.e. Mediterranean habitats; Monfragüe National Park). 156
Single season-species occupancy models showed that the probability of weekly rabbit 157
detection conditioned to its presence did not change significantly between lured cameras 158
(average detectability ± SE: 0.174±0.105) and non-lured ones (0.03±0.078) (author’s 159
unpublished data), so the use of these scent attractants does not reduce rabbit detectability. 160
Relationship between fox and rabbit activity patterns 161
We studied the activity patterns of red foxes and rabbits to estimate the probability of 162
both species concurring in a time period. Probability density functions of activity for both 163
species were estimated non-parametrically for each locality from their detection records 164
using kernel density estimates (Ridout & Linkie, 2009). Density functions were only 165
estimated for species in localities with >10 records. We also estimated for each locality 166
the coefficient of overlap Δ1 for small sample sizes (Ridout & Linkie 2009, Linkie & 167
Ridout 2011) between both species. Δ1 ranges from 0 (no overlap) to 1 (complete 168

7
overlap). The precision of this estimator was obtained through confidence intervals as 169
percentile intervals from 500 bootstrap samples (Linkie & Ridout, 2011). These analyses 170
were performed in R 3.0.1 (R Core Development Team 2013), using an adaptation of the 171
scripts developed by Linkie & Ridout (2011) 172
(http://www.kent.ac.uk/ims/personal/msr/overlap.html). 173
Relationship between fox activity, rabbit availability, human disturbance and habitat 174
structure 175
Records of red fox activity were assigned to one of three time periods defined according 176
to light levels: i) twilight (one hour prior to sunrise and one hour after sunset, as a semi-177
darkness period; Mills, 2008); ii) diurnal; and iii) nocturnal periods, taking into account 178
the time of sunset and sunrise in each study site during the sampling period. 179
We calculated a rabbit availability index for each camera station as the number of 180
independent detections (regardless of time period) of rabbits per 100 trap days 181
(Monterroso, Alves & Ferreras, 2014). 182
Distance to human settlement was used as a proxy of human disturbance (Ordeñana et 183
al., 2010). We calculated the distance (in kilometres) to the nearest human settlement 184
from each camera using a Geographic Information System (QGIS 1.8.0; QGIS 185
Development Team 2013). 186
Fox control intensity was gathered through face-to-face interviews with game managers 187
of each hunting estate, conducted in February before field sampling. We asked managers 188
about the number of foxes removed in the previous hunting season (Table 1). We 189
estimated intensity of fox control as the number of foxes removed per km2 and year 190
(fox·year-1·km-2). As explained above, we used this variable as another index of human 191
disturbance because high levels of predator extraction are generally associated with more 192
game keepers and more intensive management activities (Arroyo et al., 2012). 193
We grouped habitat types in: dense (including scrubland, forests and riparian habitats) 194
and open habitats (including ‘dehesas’, pasturelands and croplands). Habitat types 195
surrounding each camera trap were identified from CORINE land-cover 2006 and 196
updated satellite orthophotos (Instituto Geográfico Nacional, <http://www.ign.es/>) and 197
checked during fieldwork. Using QGIS 1.8.0, we calculated the percentage of each habitat 198
type (i.e. open versus dense) within a buffer of 200 m radius around each camera trap 199

8
(Ordeñana et al., 2010). Either open or dense habitat was assigned to each camera trap 200
according to the prevailing category (>50%) within the buffer. Overall, 124 cameras were 201
assigned to open habitat and 90 to dense habitat. 202
Generalized Linear Mixed Models (GLMM) were employed to assess red fox activity as 203
a function of time period (day, twilight and night), rabbit availability, human disturbance 204
(fox control intensity and distance to human settlement) and habitat type. The response 205
variable was the number of independent red fox detections for each camera in a given 206
time period. It was fitted to a Poisson distribution through a log link function. We included 207
as an offset in the models the trapping effort in each camera for each period and locality, 208
calculated as No. camera-days × period duration in hours, to standardize activity measures 209
in each period per time unit. Camera trap identity was included as a random effect nested 210
within study locality, to account for the non-independence of observations according to 211
these factors. Fixed explanatory effects included: time period and habitat as categorical 212
variables; distance to human settlement, intensity of fox control and overall rabbit 213
availability as continuous variables; and all two-way interactions between time period 214
and other variables. Analyses were carried out with R 3.0.1 with lme4 package (Bates & 215
Maechler, 2010). We compared all possible combinations of these independent effects, 216
as all of those models were biologically plausible, by using the dredge function (package 217
MuMIn; Bartoń, 2012). We selected the models with delta ΔAICc<2, and if no single 218
model accounted for >90% of the total model weights we calculated model-averaged 219
parameter estimates for the variables included in those models (Burnham & Anderson, 220
2002). We assessed whether models were affected by overdispersion, accepting 221
dispersion parameter levels between 0.5 and 1.5 (Zuur et al., 2009). We also checked for 222
potential collinearity and redundancy of the explanatory variables by analysing the 223
Variable Inflation Factor (VIF). All the predictor variables had VIF <1.26, so they were 224
considered not collinear nor redundant and included in the analysis (Belsley, Kuh & 225
Welsch, 1980). 226
Results 227
Red fox daily activity patterns and overlap with rabbit activity 228
During a total effort of 6128 trap-days (mean ± SE: 511±27 trapping days·locality-1; Table 229
1) (all means are presented ± SE), we obtained 610 independent detections of red foxes 230
(51±14 detections·locality-1) and 1190 of rabbits (99±37 detections·locality-1; Table 2). 231
9
Mean weekly detection probability was overall similar for both species (red fox: 232
0.35±0.07; rabbit: 0.33±0.08), but varied among study localities (Table 2). 233
Red foxes were detected in all localities (Table 2). Fox activity density functions varied 234
slightly among localities but, as a rule, two major activity peaks occurred, one after sunset 235
and another before sunrise (Fig. 2a). 236
Rabbits were detected in most localities (Table 2). Rabbit activity density functions were 237
similar among localities, revealing a strong bimodal pattern, with a major activity peak 238
occurring after sunrise and throughout the morning and a second peak before sunset (Fig. 239
2b). 240
The coefficient of activity overlap between red fox and rabbit was estimated in nine 241
localities with enough detections of both species (Table 2), and varied widely among 242
them, ranging from 0.24 to 0.60 (mean=0.40 ± 0.04; Table 2 and Fig. 3). Activity overlap 243
in a given locality was not correlated with mean rabbit availability in that locality 244
(Pearson´s correlation= 0.45, p=0.2). 245
Rabbit availability, human disturbance and habitat structure as factors explaining red 246
fox activity patterns 247
Five of the evaluated models showed ΔAICc <2, involving a total weight of 0.70 (Table 248
3). None of these models were affected by overdispersion (dispersion parameter levels: 249
0.67-0.69). All these models included all the fixed variables, except fox control, which 250
was not included in two of the selected models (Table 3). Interactions between time period 251
and the remaining fixed variables were also included in the selected models (Table 3). 252
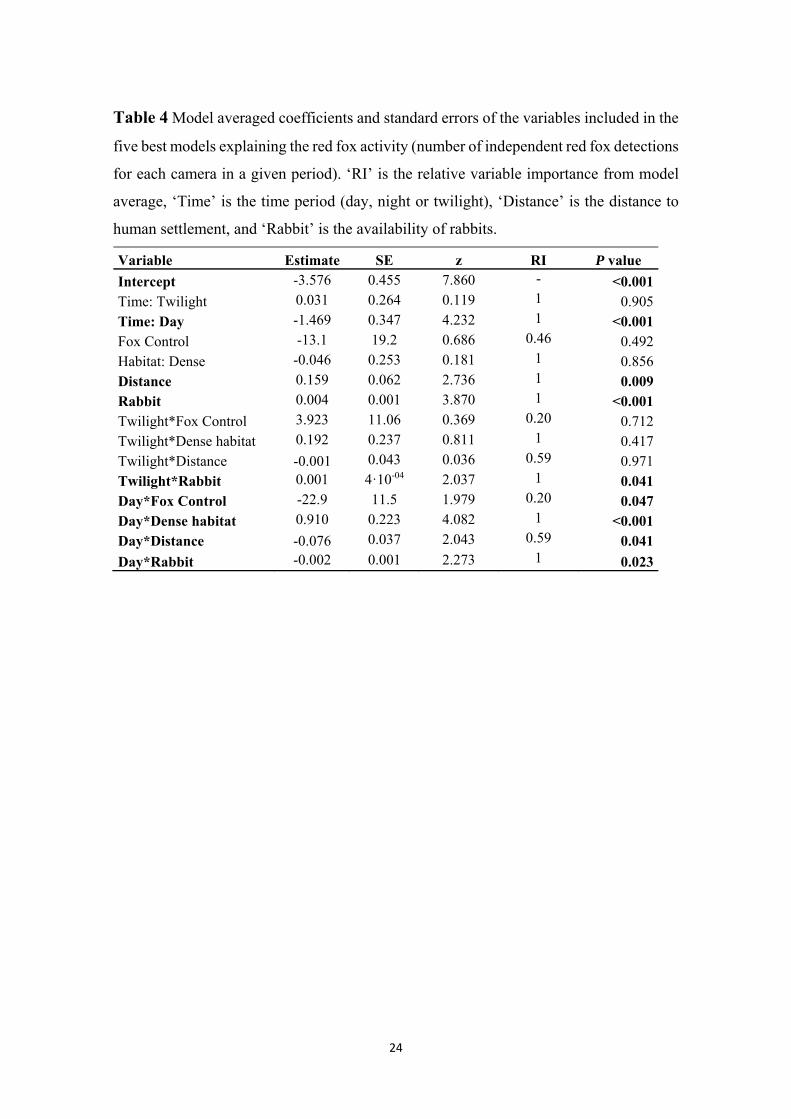
The most important variables explaining fox activity were time period, rabbit availability, 253
distance to human settlement and habitat type, and the interactions between time period 254
and both rabbit availability and habitat type (Table 4). Fox control and other interactions 255
between variables contributed less to explain the variability in daily activity of foxes 256
(relative importance <0.6; Table 4). 257
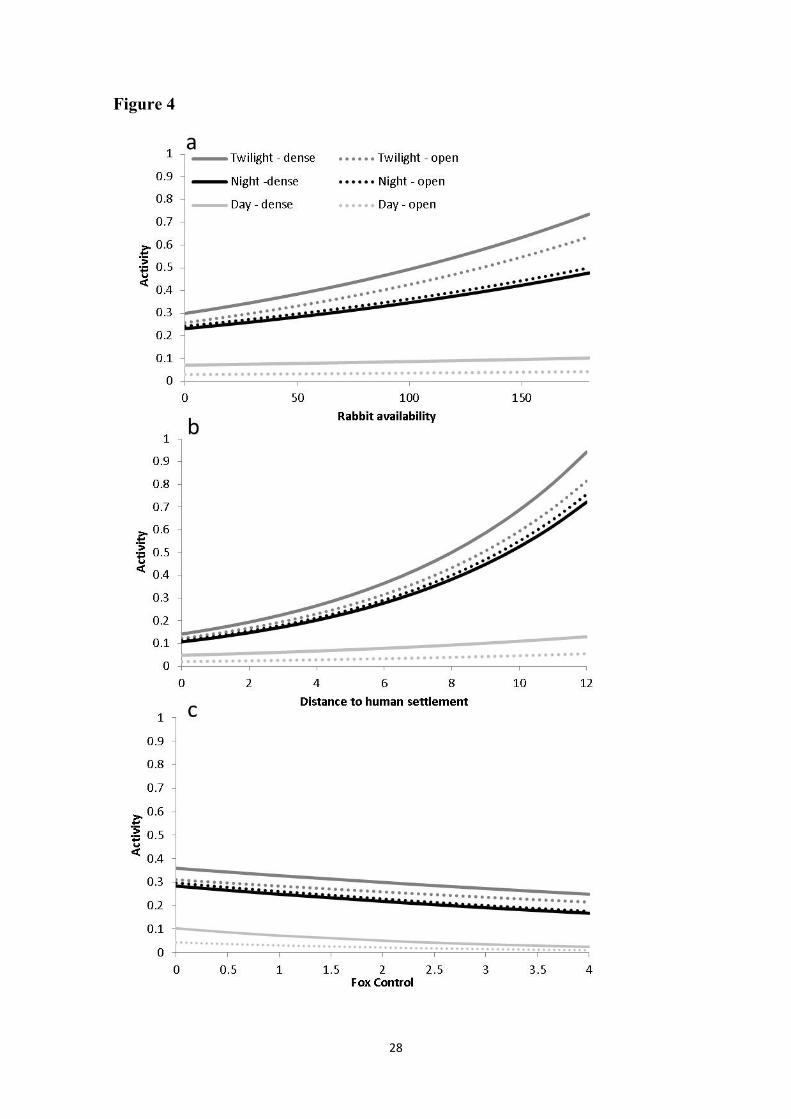
Model-averaged parameter estimates revealed that red fox activity was in general lowest 258
during daytime, and increased with rabbit availability except during daytime (Table 4; 259
Fig. 4a). Daytime activity of red foxes increased in dense habitats (Day*Dense habitat 260
interaction, Table 4, Fig. 4). Overall red fox activity increased with increasing distance to 261
human settlements (Table 4; Fig. 4b), although that trend was less marked during daytime 262

10
(Day*Distance interaction, Table 4; Fig. 4b). Overall fox activity did not change strongly 263
with fox control, but diurnal activity decreased where fox control was more intense 264
(Day*Fox control interaction, Table 4; Fig. 4c). 265
Discussion 266
Our results indicate that the red fox is mainly crepuscular and nocturnal in our study areas 267
(Fig. 2a and Table 4). This is in agreement with previous studies across red fox worldwide 268
distribution (Blanco 1986; Sunquist, 1989; Phillips & Catling, 1991; Cavallini & Lovari, 269
1994) and supports that the red fox is ‘facultative nocturnal’ (Monterroso, Alves & 270
Ferreras, 2014). 271
Unlike foxes, rabbits presented two main activity peaks in the diurnal time period in our 272
study areas (Fig. 2b). This means that the mean activity overlap between red fox and 273
rabbit (0.40) was low compared with that described for other mammalian predator-prey 274
examples (0.60: Foster et al., 2013; Monterroso, Alves & Ferreras, 2013). Therefore, our 275
results initially disagree with the hypothesis that predators adapt their activity to that of 276
their main prey species (Foster et al., 2013). This partial lack of activity synchrony 277
between predator and its main prey has been previously reported by Arias-Del Razo et al. 278
(2011) and Monterroso, Alves & Ferreras (2013), who interpreted this as an adaptation 279
of prey to reduce predation risk. These low overlaps between rabbit and fox activity 280
patterns may suggest that rabbit activity is not the most important factor explaining 281
variations in red fox activity patterns and suggest the implication of other factors. 282
In fact, the overlap between rabbit and fox activity was highest during twilight (Table 4 283
and Fig.3), the time period when rabbits are accessible for foxes. Similarly, our findings 284
show that the overall activity of red foxes increased where rabbits were more available 285
(Table 4 and Fig.4a), reflecting the importance of rabbits in fox diet in central Spain 286
(Delibes-Mateos et al. 2008). However, this increase only occurred during twilight and 287
night time periods, i.e. excluding the period when rabbits were most active and accessible 288
(Table 4 and Fig.3). This suggests that fox activity during daytime is probably constrained 289
by factors unrelated to prey abundance, and also explains the lack of relationship between 290
the coefficient of overlap and rabbit availability at the locality level. Thus, our results 291
could indicate that red foxes do not need a high synchrony with rabbits where the latter 292
are abundant, and/or that prey-predator patterns may be altered by human disturbance, as 293
it has been also suggested for wolves Canis lupus and moose Alces alces in Scandinavia 294
11
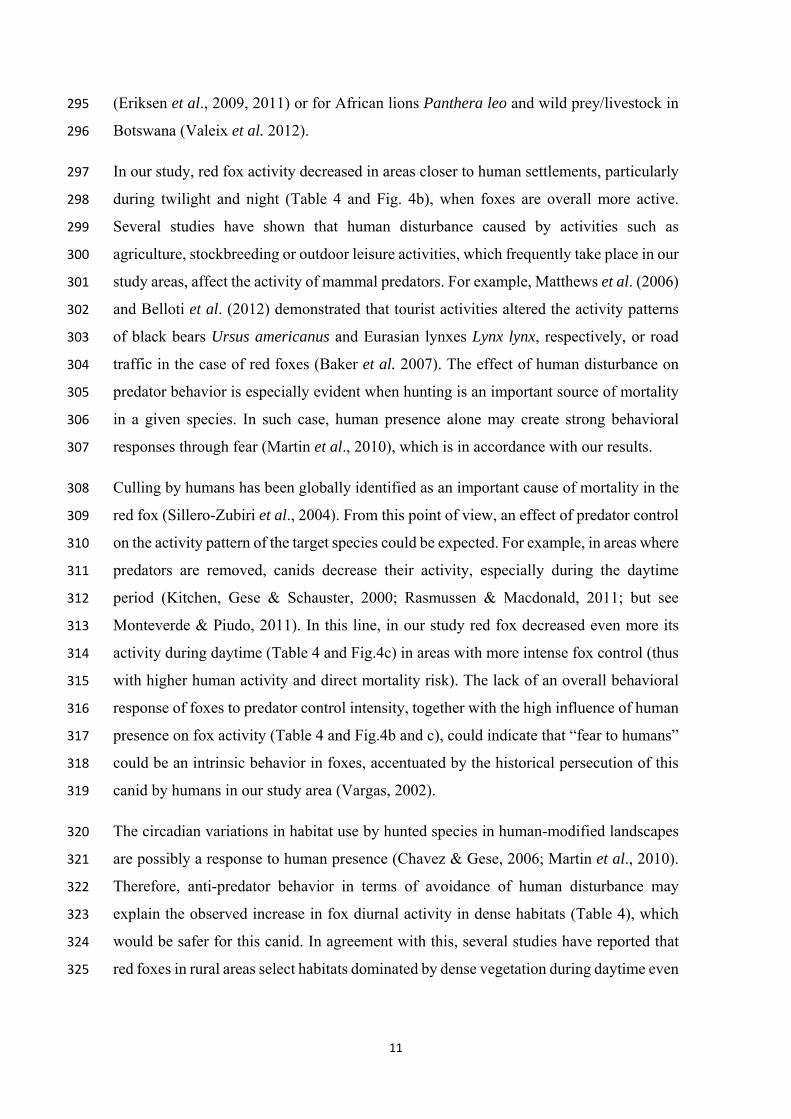
(Eriksen et al., 2009, 2011) or for African lions Panthera leo and wild prey/livestock in 295
Botswana (Valeix et al. 2012). 296
In our study, red fox activity decreased in areas closer to human settlements, particularly 297
during twilight and night (Table 4 and Fig. 4b), when foxes are overall more active. 298
Several studies have shown that human disturbance caused by activities such as 299
agriculture, stockbreeding or outdoor leisure activities, which frequently take place in our 300
study areas, affect the activity of mammal predators. For example, Matthews et al. (2006) 301
and Belloti et al. (2012) demonstrated that tourist activities altered the activity patterns 302
of black bears Ursus americanus and Eurasian lynxes Lynx lynx, respectively, or road 303
traffic in the case of red foxes (Baker et al. 2007). The effect of human disturbance on 304
predator behavior is especially evident when hunting is an important source of mortality 305
in a given species. In such case, human presence alone may create strong behavioral 306
responses through fear (Martin et al., 2010), which is in accordance with our results. 307
Culling by humans has been globally identified as an important cause of mortality in the 308
red fox (Sillero-Zubiri et al., 2004). From this point of view, an effect of predator control 309
on the activity pattern of the target species could be expected. For example, in areas where 310
predators are removed, canids decrease their activity, especially during the daytime 311
period (Kitchen, Gese & Schauster, 2000; Rasmussen & Macdonald, 2011; but see 312
Monteverde & Piudo, 2011). In this line, in our study red fox decreased even more its 313
activity during daytime (Table 4 and Fig.4c) in areas with more intense fox control (thus 314
with higher human activity and direct mortality risk). The lack of an overall behavioral 315
response of foxes to predator control intensity, together with the high influence of human 316
presence on fox activity (Table 4 and Fig.4b and c), could indicate that “fear to humans” 317
could be an intrinsic behavior in foxes, accentuated by the historical persecution of this 318
canid by humans in our study area (Vargas, 2002). 319
The circadian variations in habitat use by hunted species in human-modified landscapes 320
are possibly a response to human presence (Chavez & Gese, 2006; Martin et al., 2010). 321
Therefore, anti-predator behavior in terms of avoidance of human disturbance may 322
explain the observed increase in fox diurnal activity in dense habitats (Table 4), which 323
would be safer for this canid. In agreement with this, several studies have reported that 324
red foxes in rural areas select habitats dominated by dense vegetation during daytime even 325

12
with human presence (Cavallini & Lovary, 1994; Reynolds & Tapper, 1995; Janko et al., 326
2012; but see Sunquist, 1989). 327
Our results show that the red fox presents a high degree of behavioral plasticity adjusting 328
its daily activity rhythms to different ecological scenarios. In this sense, rabbit availability 329
seems to drive fox activity in a scenario of low human disturbance, and foxes actively 330
track rabbits at twilight and night time. However, where foxes are close to urbanized areas 331
or culled, human disturbance may determine the activity of red foxes, which is strongly 332
reduced during daytime, despite the higher accessibility of rabbits then. Our findings 333
show how wildlife adapts to different environmental conditions, including human 334
disturbance, contributing reliable information about an adaptive species such as the red 335
fox. Thus further studies should consider different factors simultaneously for a better 336
understanding of daily activity patterns of wildlife in humanized landscapes. 337
Acknowledgments 338
We are very grateful to land owners and hunters who allowed us to work in their hunting 339
estates, to the staff of Cabañeros National Park and Ruidera Natural Park. Special thanks 340
to people who assisted us during the fieldwork. Thanks to Drs. Matthew Hayward, Ben 341
Allen and Richard Yarnell, because their comments and suggestions helped us to improve 342
our manuscript. This study was funded by project ref: CGL2009-10741, by the Spanish 343
Ministry of Science and Innovation and EU-FEDER funds, EU 7th framework HUNTing 344
for Sustainability project (212160, FP7-ENV-2007-1), and the project OAPN 352/2011 345
from the Spanish Organismo Autónomo Parques Nacionales. F. Díaz-Ruiz and J. Caro 346
enjoyed postdoctoral contracts financed by the European Social Fund (ESF) and the Junta 347
de Comunidades de Castilla-La Mancha (Operational Programme FSE 2007/2013). M. 348
Delibes-Mateos is currently funded by Consejería de Economía, Innovación, Ciencia y 349
Empleo of Junta de Andalucía, and the European Union’s Seventh Framework 350
Programme for research, technological development and demonstration under grant 351
agreement 267226. 352

13
References 353
Arias-Del Razo, I., Hernández, L., Laundré, J.W. & Myers, O. (2011). Do predator and 354
prey foraging activity patterns match? A study of coyotes (Canis latrans), and 355
lagomorphs (Lepus californicus and Sylvilagus audobonii). J. Arid. Environ. 75,112–118. 356
Arroyo, B., Delibes-Mateos, M., Díaz-Fernández, S. & Viñuela, J. (2012). Hunting 357
management in relation to profitability aims: red-legged partridge hunting in central 358
Spain. Eur. J. Wildl. Res. 58,847–855. 359
Baker, P.J., Dowding, C.V., Molony, S.E., White, P.C.L. & Harris, S. (2007). Activity 360
patterns of urban red foxes (Vulpes vulpes) reduce the risk of traffic-induced mortality. 361
Behav. Ecol. 18,716–724. 362
Bartoń, K. (2012). MuMIn: multi-model inference. R package version 1.7.11. 363
http://CRAN.R-project.org/package=MuMIn. Accessed 15 November 2012. 364
Bates, D. & Maechler, M. (2010). lme4: Linear Mixed-effects Models Using S4 Classes. 365
R package version 0.999375-37. http://lme4.r-forge.r-project.org/. 366
Belsley, D.A., Kuh, E. & Welsch, R.E. (1980). Regression Diagnostics: Identifying 367
Influential Data and Sources of Collinearity. New York: Wiley. 368
Belotti, E., Heurich, M., Kreisinger, J., Šustr, P. & Bufka, L. (2012). Influence of tourism 369
and traffic on the Eurasian lynx hunting activity and daily movements. Anim. Biodiv. 370
Conserv. 35,235–246. 371
Bino, G., Dolev, A., Yosha, D., Guter, A., King, R., Saltz, D. & Kark, S. (2010). Abrupt 372
spatial and numerical responses of overabundant foxes to reduction in anthropogenic 373
resources. J. Appl. Ecol. 47, 1262–1271. 374
Blanco, J.C. (1986). On the diet, size and use of home range and activity patterns of a red 375
fox in central Spain. Acta Theriol. 31,547–556. 376
Burnham, K.P. & Anderson, D.R. (2002). Model selection and multimodel inference: a 377
practical information-theoric approach. 2nd edn. New York: Springer.-Verlag. 378
Cavallini, P. & Lovari, S. (1994). Home range, habitat selection and activity of the red 379
fox in a Mediterranean coastal ecotone. Acta Theriol. 39,279–287. 380

14
Chavez, A.S. & Gese, E.M. (2006). Landscape Use and Movements of Wolves in 381
Relation to Livestock in a Wildland–Agriculture Matrix. J. Wildlife. Manage. 70,1079–382
1086. 383
Davis, M.L., Kelly, M.J. & Stauffer, D.F. (2011). Carnivore co-existence and habitat use 384
in the Mountain Pine Ridge Forest Reserve, Belize. Anim. Conserv. 14,56–65. 385
Delibes-Mateos M., Fernández de Simón, J., Ferreras, P. & Villafuerte R (2008). Feeding 386
responses of the red fox (Vulpes vulpes) to different wild rabbit (Oryctolagus cuniculus) 387
densities: a regional approach. Eur. J. Wildlife Res. 54, 71–78. 388
Delibes-Mateos, M., Díaz-Fernández, S., Ferreras, P., Viñuela, J. & Arroyo, B. (2013). 389
The role of economic and social factors driving predator control in small game estates in 390
central Spain. Ecol. Soc. 18:28. 391
Díaz–Ruiz, F., Delibes-Mateos, M., García-Moreno, J.L., López-Martín, J.M., Ferreira, 392
C. & Ferreras, P. (2013). Biogeographical patterns in the diet of an opportunistic predator, 393
the red fox Vulpes vulpes in the Iberian Peninsula. Mammal Rev. 43,59–70. 394
Díaz-Ruiz, F. & Ferreras, P. (2013). Conocimiento científico sobre la gestión de 395
depredadores generalistas en España: el caso del zorro (Vulpes vulpes) y la urraca (Pica 396
pica). Ecosistemas 22,40–47. 397
Di Bitetti, M.S., De Angelo, C.D., Di Blanco, Y.E. & Paviolo, A. (2010). Niche 398
partitioning and species coexistence in a Neotropical felid assemblage. Acta Oecol. 399
36,403–412. 400
Eriksen, A., Wabakken, P., Zimmermann, B., Andreassen, H.P., Arnemo, J.M., 401
Gundersen, H., Liberg, O., Linnell, J., Milner, J.M., Pedersen, H.C., Sand, H., Solberg, 402
E. & Storaas, T. (2009). Encounter frequencies of GPS-collared wolves and moose in a 403
Scandinavian wolf territory. Ecol. Res. 24,547–557. 404
Eriksen, A., Wabakken, P., Zimmermann, B., Andreassen, H.P., Arnemo, J.M., 405
Gundersen, H., Liberg, O., Linnell, J., Milner, J.M., Pedersen, H.C., Sand, H., Solberg, 406
E. & Storaas, T. (2011). Activity patterns of predator and prey: a simultaneous study of 407
GPS-collared wolves and moose. Anim. Behav. 81,423–431. 408

15
Foster, V.C., Sarmento, P., Sollmann, R., Tôrres, N., Jácomo, A.T.A., Negrôes, N., 409
Fonseca, C. & Silveira, L. (2013). Jaguar and puma activity patterns and predator-prey 410
interactions in four Brazilian biomes. Biotropica 45,373–379. 411
Halle, S. (2000). Ecological relevance of daily activity patterns. In: Halle S, Stenseth NC 412
(eds) Activity patterns in small mammals: An ecological approach. New York: Springer, 413
pp 67–90. 414
Instituto Geografico Nacional. (2013). CORINE land-cover 2006 and satellite 415
orthophotos. http://www.ign.es/. 416
Janko, C., Schröder, W., Linke, S. & König, A. (2012). Space use and resting site 417
selection of red foxes (Vulpes vulpes) living near villages and small towns in Southern 418
Germany. Acta Theriol. 57,245–250. 419
Kitchen, A.M., Gese, E.M. & Schauster, E.R. (2000) Changes in coyote activity patterns 420
due to reduced exposure to human persecution. Can. J. Zoolog., 78, 853–857. 421
Kronfeld-Schor, N. & Dayan, T. (2003). Partitioning of time as an ecological resource. 422
Annu. Rev. Ecol. Syst. 34,153–181. 423
Lima, S.L. & Dill, L.M. (1990). Behavioral decisions made under the risk of predation: a 424
review and prospectus. Can. J. Zool. 68 619–640. 425
Linkie, M. & Ridout, M.S. (2011). Assessing tiger-prey interactions in Sumatran 426
rainforests. J. Zool. 284,224–229. 427
MacKenzie, D., Nichols, J.D., Royle, J.A., Pollock, K.H., Bailey, L.L. & Hines, J.E. 428
(2006). Occupancy estimation and modeling: inferring patterns and dynamics of species 429
occurrence. Academic Press, Oxford. 430
Martin, J., Basille, M., Van Moorter, B., Kindberg, J., Allaine, D. & Swenson, J.E. (2010). 431
Coping with human disturbance: Spatial and temporal tactics of the brown bears (Ursus 432
arctos). Can. J. Zoolog. 88,875–883. 433
Masi, S., Cipolletta, C. & Robbins, M.M. (2009). Western lowland gorillas (Gorilla 434
gorilla gorilla) change their activity patterns in response to frugivory. Am. J. Primatol. 435
71,91–100. 436
16
Matthews, S.M., Beecham, J.J., Quigley, H., Greenleaf, S.S. & Leithead, H.M. (2006). 437
Activity patterns of American black bears in Yosemite National Park. Ursus 17,30–40. 438
Mills, A.M. (2008). Latitudinal gradients of biologically useful semi-darkness. 439
Ecography 31, 578–582. 440
Monterroso, P., Alves, P.C. & Ferreras, P. (2011). Evaluation of attractants for non-441
invasive studies of Iberian carnivore communities. Wildlife Res. 38,446–454. 442
Monterroso, P., Alves, P.C. & Ferreras, P. (2013). Catch me if you can: diel activity 443
patterns of mammalian prey and predators. Ethology 119, 1044–1056. 444
Monterroso, P., Alves, P.C. & Ferreras, P. (2014). Plasticity in circadian activity patterns 445
of mesocarnivores in Southwestern Europe: implications for species coexistence. Behav. 446
Ecol. Sociobiol. 68, 1403-1417. 447
Monteverde, M.J. & Piudo, L. (2011). Activity patterns of the culpeo fox (Lycalopex 448
culpaeus magellanica) in a non-hunting area of northwestern Patagonia, Argentina. 449
Mamm. Study 36,119–125. 450
Muñoz-Igualada, J., Shivik, J.A., Domínguez, F.G., González, L.M., Moreno, A.A., 451
Olalla, M.F. & García, C.A. (2010). Traditional and new cable restraint systems to capture 452
fox in central Spain. J. Wildlife Manage. 74,181–187. 453
O’Brien, T.G., Kinnaird, M.F., & Wibisono, H.T., (2003). Crouching tigers, hidden prey: 454
Sumatran tiger and prey populations in a tropical forest landscape, Anim. Conserv. 6, 455
131–139. 456
Ontiveros, D., Pleguezuelos, J.M. & Caro, J. (2005). Prey density, prey detectability and 457
food habits: the case of Bonelli’s eagle and the conservation measures. Biol. Conserv. 458
123, 19–25. 459
Ordeñana, M.A., Crooks, K.R., Boydston, E.E., Fisher,R.N., Lyren, L.M., Siudyla, S., 460
Haas, C.D., Harris, S., Hathaway, S.A., Turschak, G.M., Miles, A.K. & Van Vuren, D.H. 461
(2010). Effects of urbanization on carnivore species distribution and richness. J. Mammal. 462
91,1322–1331. 463
Ordiz, A., Støen, O.G., Sæbø, S., Kindberg, J., Delibes, M. & Swenson, J.E. (2012). Do 464
bears know they are being hunted? Biol. Conserv. 152,21–28. 465

17
Phillips M. & Catling P.C. (1991). Home range and activity patterns of red foxes in 466
Nadgee Nature Reserve. Wildl. Res. 18,677–686. 467
QGIS Development Team. (2013). QGIS Geographic Information System. Open Source 468
Geospatial Foundation Project. http://qgis.osgeo.org. Accessed 15 July 2013. 469
R Core Development Team. (2013). R: A language and environment for statistical 470
computing. R Foundation for Statistical Computing, Vienna, Austria. http://www.R-471
project.org. Accessed 27 July 2013. 472
Rasmussen, G.S.A. & Macdonald, D.W. (2011). Masking of the zeitgeber: African wild 473
dogs mitigate persecution by balancing time. J. Zool. 286,232–242. 474
Reynolds, J.C. & Tapper, S.C. (1995). The ecology of the red fox Vulpes vulpes in relation 475
to small game in rural southern England. Wildlife Biol. 1,105–119. 476
Reynolds, J.C & Tapper, S.C. (1996). Control of mammalian predators in game 477
management and conservation. Mammal Rev. 26,127–155. 478
Ridout, M.S. & Linkie, M. (2009). Estimating overlap of daily activity patterns from 479
camera trap data. J. Agric. Biol. Envir. S. 14,322–337. 480
Rivas-Martínez, S., Penas, A. & Díaz, T.E. (2004). Mapa Bioclimático de Europa, 481
Bioclimas, http://www.globalbioclimatics.org/form/maps.htm. Accessed 25 March 2014. 482
Sillero-Zubiri, C., Hoffmann, M. & Macdonald, D.W. (2004). Canids: Foxes, Wolves, 483
Jackals and Dogs. Status Survey and Conservation Action Plan. IUCN/SSC Canid 484
Specialist Group. Switzerland and Cambridge: Gland. 485
Sunquist, M.E. (1989). Comparison of spatial and temporal activity of red foxes and gray 486
foxes in north-central Florida. Florida Field Naturalist 17,11–18. 487
Tuomainen, U. & Candolin, U. (2011). Behavioural responses to human-induced 488
environmental change. Biol. Rev. 86,640–657. 489
Valeix M., Hemson G., Loveridge A. J., Mills G. & Macdonald D. W. (2012). 490
Behavioural adjustments of a large carnivore to access secondary prey in a human-491
dominated landscape. J. Appl. Ecol. 49,73-81. 492
Vargas, J.M. (2002). Alerta cinegética. Madrid; Otero ediciones. 493
18
Villar, N., Lambin, X., Evans, D., Pakeman, R. & Redpath, S. (2013). Experimental 494
evidence that livestock grazing intensity affects the activity of a generalist predator. Acta 495
Oecol. 49,12–16. 496
Zuur, A.F., Ieno, E.N., Walker, N.J., Saveliev, A.A. & Smith, G.M. (2009). Mixed effects 497
models and extensions in ecology with R. New York: Springer Science+Business Media. 498
19
Figure 1Location of the study localities (1-12) in the Iberian Peninsula. 499
500
Figure 2 Overall Kernel densities of red fox (a) and rabbit (b) activity in study localities 501
(mean: solid line; range: dashed lines). Vertical dashed lines represent approximate 502
sunrise and sunset times. 503
504
Figure 3 Overlap between red fox (dashed line) and rabbit (solid line) activity, 505
determined by camera trapping. The numbers shown in brackets correspond to the study 506
sites ID, as in Fig. 1. Vertical dashed lines represent approximate sunrise and sunset times 507
during the study period in study localities. 508
509
Figure 4 Model-averaged relationships between red fox activity (expressed as 510
detections·100 trapping-hour-1) and: a) Rabbit availability (rabbits·100 trapping-day-1), 511
b) Distance to human settlements (km), and c) Fox control (fox·year-1·km-2) during the 512
three periods of the daily cycle (day, twilight and night) at two different habitat types 513
(dense and open). For plotting the results, data were back-transformed. 514
515
516

20
Table 1 Description of study localities (* in the ‘Map ID’ indicates protected areas; the rest were hunting estates). The predominant landscape 517
(agriculture or scrubland) is indicated along with the habitat types present in each area: Oa: open areas, Scr: scrubland, Wc: woody crops, Rip: 518
riparian, Fo: forest, Dh: dehesa. The start and end dates of each survey are shown in the sampling year column. ‘Cameras’ indicate the number of 519
camera traps used in each locality. ‘Effort’ (survey effort) is expressed as camera-days, or the sum of days each camera was active in the field in 520
each locality. Descriptive statistics of independent variables for each study locality are also shown: ‘Rabbit availability’ is expressed as the number 521
of independent detections of rabbits per 100 trap days; ‘Distance’ is the distance in km to the nearest human settlement; ‘Red fox control’ refers to 522
the number of foxes culled per square km and year; ‘Habitat’ represents the number of cameras assigned to open or dense predominant habitat, 523
respectively. 524
Study site (Map ID)
Area (km2)
Landscape (habitat types)
Sampling year (start/end)
Cameras Effort Rabbit
availability (mean±SE)
Distance (km)
(mean±SE)
Red fox control (foxes km-2 year-1)
Habitat (open/dense)
1 20 Agricultural
(Oa, Scr, Rip, Wc) 2010
(Jul/Aug) 20 620 7.74 ± 2.15 2.67 ± 1.05 0.08 16/4
2 16 Scrubland
(Oa, Scr, Rip) 2010
(Jul/Aug) 15 424 30.15 ± 16.77 3.51 ± 0.94 1.98 3/12
3 50 Agricultural
(Oa, Scr, Rip, Wc) 2011
(Jun/Jul) 16 493 66.53 ± 43.79 3.74 ± 1.85 0.89 13/3
4 36 Agricultural
(Oa, Scr, Rip, Wc) 2011
(Jun/Jul) 17 485 36.03 ± 16.89 2.58 ± 1.44 0.43 16/1
5* 21 Scrubland
(Oa, Scr, Rip, Dh, Fo) 2011
(Jul/Aug) 19 682 15.61 ± 7.61 6.56 ± 1.96 0 4/15
6 16 Scrubland
(Oa, Scr, Rip, Wc) 2011
(Jul/Aug) 20 645 2.73 ± 2.57 5.86 ± 1.34 1.30 4/16
7 21 Agricultural
(Oa, Scr, Rip, Dh) 2012
(Jul/Aug) 20 495 - 3.25 ± 1.27 0 16/4

21
8 20 Agricultural
(Oa, Scr, Rip, Wc) 2012
(Jul/Aug) 20 503 2.61 ± 1.35 3.88 ± 1.30 4.00 19/1
9 9 Scrubland
(Oa, Scr, Rip, Dh, Fo) 2012
(May/Jun) 15 417 - 9.21 ± 0.64 0.10 6/9
10 9 Agricultural
(Oa, Scr, Rip) 2012
(May/Jun) 14 372 106.07 ± 64.01 5.18 ± 0.71 2.70 13/1
11* 26 Scrubland
(Oa, Scr, Rip) 2012
(May/Jun) 20 529 2.23 ± 1.43 8.83 ± 1.40 0 9/11
12 16 Scrubland
(Oa, Scr, Rip, Dh, Fo) 2013
(May/Jun) 18 463 2.31 ± 2.31 9.30 ± 1.40 0.70 5/13
525
526

22
Table 2 Number of independent detections of red fox and rabbit and coefficient of
overlap (Δ1) of daily activity patterns of red fox and rabbit in each locality. CI95% is the
95% bootstrap confidence interval. Weekly detection probabilities (P) conditioned to
presence for both species are also shown (estimated using occupancy models).
Study
site (Map ID)
Nº Red fox detections
Nº Rabbit detections
∆1 CI 95% P red fox P rabbit
1 17 48 0.48 (0.33-0.67) 0.10 0.34 2 4 101 - - 0.04 0.51 3 35 343 0.33 (0.31-0.52) 0.39 0.80 4 77 176 0.43 (0.36-0.56) 0.57 0.63 5 38 108 0.6 (0.39-0.66) 0.30 0.36 6 22 18 0.49 (0.36-0.72) 0.14 0.09 7 17 0 - - 0.21 0.00 8 39 12 0.46 (0.29-0.63) 0.37 0.19 9 89 0 - - 0.55 0.00 10 48 357 0.26 (0.15-0.32) 0.33 0.80 11 180 16 0.24 (0.25-0.49) 0.84 0.14
12 44 11 0.35 (0.11-0.56) 0.41 0.08

23
Table 3 Models explaining red fox activity (number of independent red fox detections
for each camera in a given period). We present data for those models with ∆AICc<2, as
well as the full and null models. Variables are, Time: timer period (day, night and
twilight), Hbt: habitat type (dense or open), Dst: distance to human settlement, Rab: rabbit
availability, Fc: fox control. Interactions between variables are represented by *.
Model df logLik AICc ∆AICc w
Time+Hbt+Dst+Rab+Time*(Hbt+Rab) 12 -421.74 867.99 0 0.20
Time+Hbt+Dst+Rab+Time*(Dst+Hbt+Rab) 14 -419.73 868.13 0.14 0.18
Time+Fc+Hbt+Dst+Rab+Time*(Fc+Hbt+Dst+Rab) 17 -416.82 868.63 0.64 0.14
Time+Fc+Hbt+Dst+Rab+Time*(Hbt+Rab) 13 -421.43 869.44 1.46 0.09
Time+Fc+Hbt+Dst+Rab+Time*(Hbt+Dst+Rab) 15 -419.42 869.61 1.63 0.09
Full model 18 -416.79 870.70 2.69 0.05
Null model 3 -604.63 1215.30 347.31 0.00
24
Table 4 Model averaged coefficients and standard errors of the variables included in the
five best models explaining the red fox activity (number of independent red fox detections
for each camera in a given period). ‘RI’ is the relative variable importance from model
average, ‘Time’ is the time period (day, night or twilight), ‘Distance’ is the distance to
human settlement, and ‘Rabbit’ is the availability of rabbits.
Variable Estimate SE z RI P value
Intercept -3.576 0.455 7.860 - <0.001 Time: Twilight 0.031 0.264 0.119 1 0.905 Time: Day -1.469 0.347 4.232 1 <0.001 Fox Control -13.1 19.2 0.686 0.46 0.492 Habitat: Dense -0.046 0.253 0.181 1 0.856 Distance 0.159 0.062 2.736 1 0.009 Rabbit 0.004 0.001 3.870 1 <0.001 Twilight*Fox Control 3.923 11.06 0.369 0.20 0.712 Twilight*Dense habitat 0.192 0.237 0.811 1 0.417 Twilight*Distance -0.001 0.043 0.036 0.59 0.971 Twilight*Rabbit 0.001 4·10-04 2.037 1 0.041 Day*Fox Control -22.9 11.5 1.979 0.20 0.047 Day*Dense habitat 0.910 0.223 4.082 1 <0.001 Day*Distance -0.076 0.037 2.043 0.59 0.041
Day*Rabbit -0.002 0.001 2.273 1 0.023

25
Figure 1

26
Figure 2

27
Figure 3
28
Figure 4

29