


Languages
Pages
Legal


FiberSource® Overview
February 2006
This document is confidential and is intended solely for the use and information of the client to whom it is addressed.
2 This document is proprietary and is intended solely for the use and information of the client to whom it is addressed. CFN Services
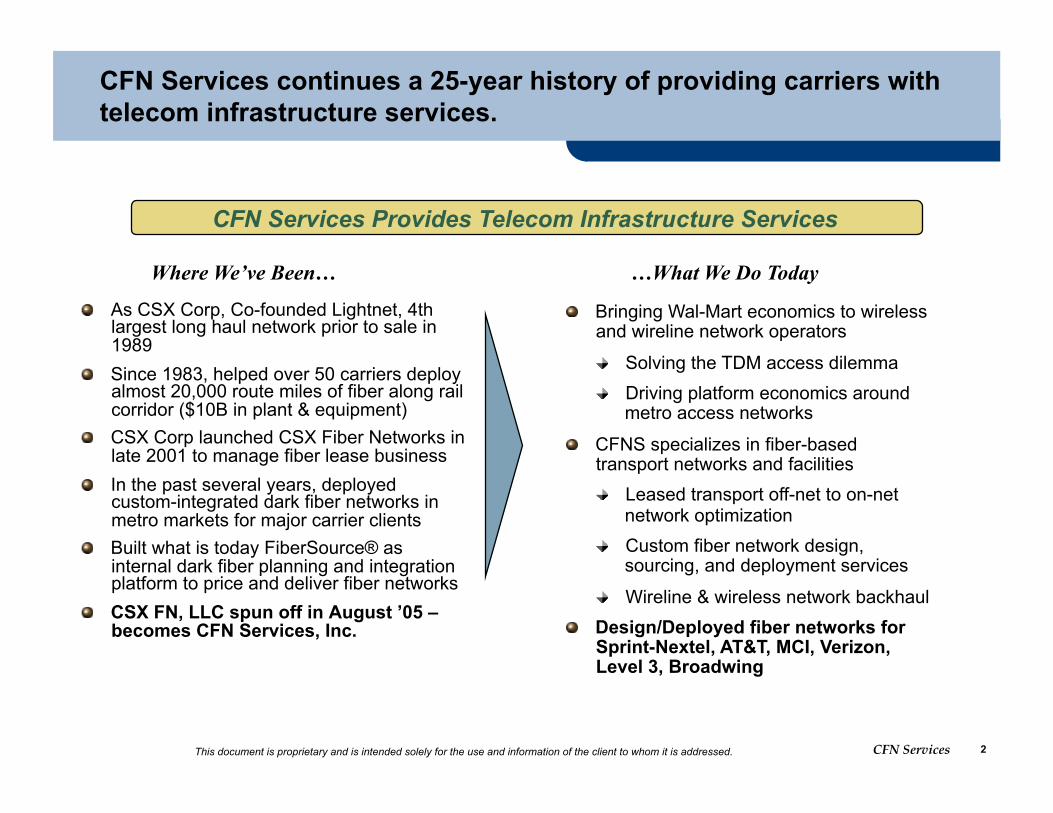
CFN Services continues a 25-year history of providing carriers with telecom infrastructure services.
Where We’ve Been…
Bringing Wal-Mart economics to wireless and wireline network operators
Solving the TDM access dilemma Driving platform economics around
metro access networks
CFNS specializes in fiber-based transport networks and facilities Leased transport off-net to on-net
network optimization Custom fiber network design,
sourcing, and deployment services
Wireline & wireless network backhaul Design/Deployed fiber networks for
Sprint-Nextel, AT&T, MCI, Verizon, Level 3, Broadwing
…What We Do Today
As CSX Corp, Co-founded Lightnet, 4th largest long haul network prior to sale in 1989
Since 1983, helped over 50 carriers deploy almost 20,000 route miles of fiber along rail corridor ($10B in plant & equipment)
CSX Corp launched CSX Fiber Networks in late 2001 to manage fiber lease business
In the past several years, deployed custom-integrated dark fiber networks in metro markets for major carrier clients
Built what is today FiberSource® as internal dark fiber planning and integration platform to price and deliver fiber networks
CSX FN, LLC spun off in August ’05 – becomes CFN Services, Inc.
CFN Services Provides Telecom Infrastructure Services

3 This document is proprietary and is intended solely for the use and information of the client to whom it is addressed. CFN Services
Volume
Recurring TDM Access
Cost
2x 3x
New incremental access cost curve (CFNS optimized infrastructure platform)
Current linear access cost curve Access Dilemma: Local access was a
$30B cost for carriers in 2005; 53% and 38% of MCI and ATT topline; 40-60% of wireless network operating costs.
Carriers are facing rapidly increasing transport volumes due to data services bandwidth growth (e.g. Ethernet MAN) and 3G wireless services expansion
Facilities based infrastructure provides significant bulk capacity with low incremental growth costs effectively “flattening” the access cost curve
CFN’s platform approach enables carriers to enhance profitability as volumes grow without requiring new capex/opex
– Optimized Transport Network Platforms Flatten the Access Cost Curve – ILLUSTRATIVE
Bringing Wal*Mart economics to wireless and wireline network operators to solve the TDM local access transport network dilemma.
Facilities based platform deployment
Carriers facing local access transport volume growth achieve better economics with a facilities based platform approach.

4 This document is proprietary and is intended solely for the use and information of the client to whom it is addressed. CFN Services
FiberSource® is the industry’s best and most comprehensive telecom infrastructure knowledge and relationship base.
FiberSource® & FiberMAP®
Local access transport and backhaul network design, optimization, and implementation
Carrier and enterprise network design for dedicated or shared TDM, WDM and Ethernet networks
Local market footprint expansion via leased line and fiber served buildings and LEC collocations
15,000 on-net buildings
Over100 asset owners
1,000 collocation/ carrier hotel sites
20,000 Central Offices, FCC Market
boundaries, MSAs
FiberSource® 220,000 fiber route miles
550 metro networks
150,000 cellular sites
100,000 miles rail corridor 120 Markets
Web enabled portal for real time access
FiberSource®: Powers CFNS Fiber Network Design & Delivery Capabilities
5-90Ghz broadband wireless spectrum

5 This document is proprietary and is intended solely for the use and information of the client to whom it is addressed. CFN Services
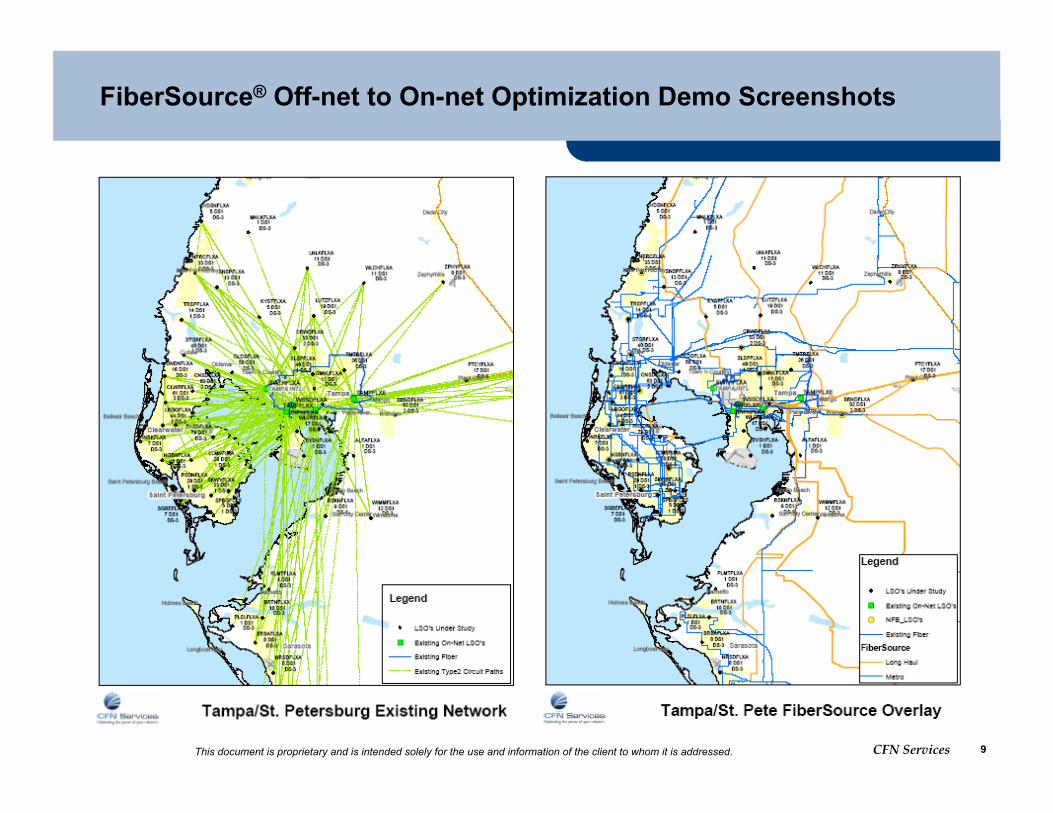
Together FiberMAP® and FiberSource® enable CFN Services capabilities for off-net to on-net optimization displacing type II costs.
Perform Analysis and Mapping
Verizon • Circuit Costs • Forecasts • New Service
Opportunities
CFNS Inventory
(fiber, facilities, and relationships)
Conduct Infrastructure Optimization
(iterate)
Und
erst
andi
ng R
equi
rem
ents
Telecom & IT Network
Requirements
Transport Equipment
Specifications
Customer MAN & WAN Locations
Detailed network deployment planning and implementation support
Customer Network Deployment
Requirements
CFNS
FiberSource®
MCI AT&T
Optional Business Case & ROI Data
Gather Network Requirements
Implementation Planning
Map, Engineer Optimized Networks
FiberMAP® (Local Access Optimization Process)

6 This document is proprietary and is intended solely for the use and information of the client to whom it is addressed. CFN Services
• Confirm objectives, scope, and required detail
• Dark fiber/Lit Services • Collocation • Sites/addresses • Transport/access
equipment and/or technologies
• Diversity requirements • Other design
standards
• Route level overview and solution network maps
• Preliminary hub/node sites plotted
• Customer required sites plotted
• High-level cost estimates including:
• Fiber • Network Integration • Lateral and other
construction costs • Collocation • Engineering and
Permitting
• Confirm asset availability, etc.
• Revise/refine design and cost estimates based on availability, demarc, etc.
• Finalize proposed route maps with construction required
• Finalize cost estimate
• Working with asset owners initiate site surveys to finalize costs on construction and other components
CFN Services provides fiber sourcing along a continuum from network planning support through turnkey network delivery and financing under a single IRU/Lease/SLA
FiberSource® Planning Service Keeps the Sales Cycle Moving Forward
Develop Route Level Design
Requirements Submission
Develop Site-level Designs and Costs
Confirm Asset Availability, Design
Estimate High-level Costs (+/- 25%)
FiberSource® improves the productivity of pre-sales support resources and accelerates sales cycles for fiber dependent products and services.
2 – 72 hours depending on complexity 1-4 weeks aligned with sales cycle

7 This document is proprietary and is intended solely for the use and information of the client to whom it is addressed. CFN Services
FiberSource® Sample Metro Fiber Data & Demo Screenshot

8 This document is proprietary and is intended solely for the use and information of the client to whom it is addressed. CFN Services
FiberSource® Sample Metro Fiber Data & Demo Screenshot
9 This document is proprietary and is intended solely for the use and information of the client to whom it is addressed. CFN Services
FiberSource® Off-net to On-net Optimization Demo Screenshots

10 This document is proprietary and is intended solely for the use and information of the client to whom it is addressed. CFN Services
FiberSource® Off-net to On-net Optimization Demo Screenshots
Top Related