Real-Time Distributed Fiber Optic Sensor for Security ... · is based on the future fiber...
12
Photonic Sensors (2012) Vol. 2, No. 3: 225–236 DOI: 10.1007/s13320-012-0071-6 Photonic Sensors Regular Real-Time Distributed Fiber Optic Sensor for Security Systems: Performance, Event Classification and Nuisance Mitigation Seedahmed S. MAHMOUD, Yuvaraja VISAGATHILAGAR, and Jim KATSIFOLIS * Future Fibre Technologies Pty Ltd. 10 Hartnett Close, Mulgrave, VIC 3170, Australia *Corresponding author: Jim KATSIFOLIS E-mail: [email protected] Abstract: The success of any perimeter intrusion detection system depends on three important performance parameters: the probability of detection (POD), the nuisance alarm rate (NAR), and the false alarm rate (FAR). The most fundamental parameter, POD, is normally related to a number of factors such as the event of interest, the sensitivity of the sensor, the installation quality of the system, and the reliability of the sensing equipment. The suppression of nuisance alarms without degrading sensitivity in fiber optic intrusion detection systems is key to maintaining acceptable performance. Signal processing algorithms that maintain the POD and eliminate nuisance alarms are crucial for achieving this. In this paper, a robust event classification system using supervised neural networks together with a level crossings (LCs) based feature extraction algorithm is presented for the detection and recognition of intrusion and non-intrusion events in a fence-based fiber-optic intrusion detection system. A level crossings algorithm is also used with a dynamic threshold to suppress torrential rain-induced nuisance alarms in a fence system. Results show that rain-induced nuisance alarms can be suppressed for rainfall rates in excess of 100 mm/hr with the simultaneous detection of intrusion events. The use of a level crossing based detection and novel classification algorithm is also presented for a buried pipeline fiber optic intrusion detection system for the suppression of nuisance events and discrimination of intrusion events. The sensor employed for both types of systems is a distributed bidirectional fiber-optic Mach-Zehnder (MZ) interferometer. Keywords: Adaptive level crossings, fiber optic sensor, intrusion detection, nuisance alarm Received: 8 June 2012 / Revised version: 15 June 2012 © The Author(s) 2012. This article is published with open access at Springerlink.com 1. Introduction Distributed fiber-optic sensors have been used in many commercial and defense applications. These sensors have been used to protect assets such as airports, commercial and defense infrastructure, and oil and pipeline systems. A number of underlying sensing technologies can be implemented when designing distributed fiber-optic sensors which include Mach-Zehnder (MZ) interferometers [1, 2], Michelson interferometers [1], Fiber-Bragg grating arrays [1], Sagnac loops [1], and coherent optical time domain reflectometry (C-OTDR) [3, 4]. High performance distributed fiber-optic sensors have been applied to both outdoor and buried intrusion detection systems in recent years. The advantages of using fiber optic sensors in intrusion detection systems over conventional technologies are well recognized and include their immunity to electromagnetic interference, high sensitivity, no power required in the field, intrinsic safety in volatile environments, and high reliability and cost effectiveness over large distances. Their implementation in noisy or hostile environments
-
Upload
trinhxuyen -
Category
Documents
-
view
221 -
download
4
Transcript of Real-Time Distributed Fiber Optic Sensor for Security ... · is based on the future fiber...

Photonic Sensors (2012) Vol. 2, No. 3: 225–236
DOI: 10.1007/s13320-012-0071-6 Photonic Sensors Regular
Real-Time Distributed Fiber Optic Sensor for Security Systems: Performance, Event Classification and Nuisance Mitigation
Seedahmed S. MAHMOUD, Yuvaraja VISAGATHILAGAR, and Jim KATSIFOLIS*
Future Fibre Technologies Pty Ltd. 10 Hartnett Close, Mulgrave, VIC 3170, Australia
*Corresponding author: Jim KATSIFOLIS E-mail: [email protected]
Abstract: The success of any perimeter intrusion detection system depends on three important performance parameters: the probability of detection (POD), the nuisance alarm rate (NAR), and the false alarm rate (FAR). The most fundamental parameter, POD, is normally related to a number of factors such as the event of interest, the sensitivity of the sensor, the installation quality of the system, and the reliability of the sensing equipment. The suppression of nuisance alarms without degrading sensitivity in fiber optic intrusion detection systems is key to maintaining acceptable performance. Signal processing algorithms that maintain the POD and eliminate nuisance alarms are crucial for achieving this. In this paper, a robust event classification system using supervised neural networks together with a level crossings (LCs) based feature extraction algorithm is presented for the detection and recognition of intrusion and non-intrusion events in a fence-based fiber-optic intrusion detection system. A level crossings algorithm is also used with a dynamic threshold to suppress torrential rain-induced nuisance alarms in a fence system. Results show that rain-induced nuisance alarms can be suppressed for rainfall rates in excess of 100 mm/hr with the simultaneous detection of intrusion events. The use of a level crossing based detection and novel classification algorithm is also presented for a buried pipeline fiber optic intrusion detection system for the suppression of nuisance events and discrimination of intrusion events. The sensor employed for both types of systems is a distributed bidirectional fiber-optic Mach-Zehnder (MZ) interferometer.
Keywords: Adaptive level crossings, fiber optic sensor, intrusion detection, nuisance alarm
Received: 8 June 2012 / Revised version: 15 June 2012 © The Author(s) 2012. This article is published with open access at Springerlink.com
1. Introduction
Distributed fiber-optic sensors have been used in
many commercial and defense applications. These
sensors have been used to protect assets such as
airports, commercial and defense infrastructure, and
oil and pipeline systems. A number of underlying
sensing technologies can be implemented when
designing distributed fiber-optic sensors which
include Mach-Zehnder (MZ) interferometers [1, 2],
Michelson interferometers [1], Fiber-Bragg grating
arrays [1], Sagnac loops [1], and coherent optical
time domain reflectometry (C-OTDR) [3, 4].
High performance distributed fiber-optic sensors
have been applied to both outdoor and buried
intrusion detection systems in recent years. The
advantages of using fiber optic sensors in intrusion
detection systems over conventional technologies
are well recognized and include their immunity to
electromagnetic interference, high sensitivity, no
power required in the field, intrinsic safety in
volatile environments, and high reliability and cost
effectiveness over large distances. Their
implementation in noisy or hostile environments

Photonic Sensors
226
presents some interesting challenges which need to
be overcome in order to achieve acceptable
performance. In all outdoor perimeter intrusion
detection systems, there exists a performance
trade-off between the probability of detection and
nuisance alarm rate [5]. These systems are
susceptible to a wide range of nuisance alarms from
both environmental and man-made sources which
can include wind, torrential rain, storms, and nearby
traffic crossings.
A number of sensor related signal processing
algorithms have been presented in the literature for
suppressing nuisance alarms. Jiang et al. [6]
proposed a classification method for an MZ
interferometric sensor using a wavelet packet
transform for denoising and feature extraction and a
neural network as a classifier. This method however
is not suitable for eliminating nuisance alarms due to
torrential rain as the signal amplitude of the sensor
would be saturated in the time domain. Vries [7]
proposed an acoustic based perimeter intrusion
classification system that deployed a neural network
with frequency domain features to detect different
types of intrusion events such as climbing, cutting
and jumping over the fence. The system however
suffered from performance degradation when the
quality of the sound (SNR) generated by the
intruders and the surrounding environment
decreased. Moreover, the frequency domain features
were not robust enough to distinguish between
nuisance and intrusion events.
Yousefi et al. [8] presented a fence breach
detection system which could detect activity on the
fence and discriminate different types of activity.
The hardware of the system comprised a 3-axis
accelerometer and a RISC microprocessor. The
system employed an algorithm that detects activity
and non-activity on the fence. It also recognized the
type of breach whether it was due to rattling caused
by strong wind or a person climbing on the fence.
This system used signal variation features along
with the energy of two bandpass filters to separate
the rattle and climb frequency components. While
this showed some success, it was not possible to
discriminate between classes that had a similar
impact on a fence. Moreover, this algorithm was
used to classify a small number of classes (limited to
two classes). Min et al. [9] proposed a real-time
monitoring system using an audio sensor to detect
abnormal activity in the vicinity of buried gas pipes.
They extracted a frequency domain feature using a
nonlinear scale filter bank method and cepstral mean
subtraction along with a combination of two
classifiers using the Gaussian mixture model and
multi-layer perceptron. Their system achieved a
92% detection rate to abnormal activity such as
hammer drilling and digging. The detection rate of
intrusion was however degraded in the presence of
background noise such as traffic in the vicinity of
the sensor.
In this paper, robust level crossings based signal
processing algorithms are presented for detecting
intrusion event and suppressing nuisance alarms in
both outdoor fence-mounted and buried fiber-optic
intrusion detection systems without significantly
affecting sensitivity. The use of a real-time level
crossing algorithm to suppress rain-induced
nuisance alarms and discriminate between
continuous nuisance and non-continuous intrusion
events in perimeter intrusion detection systems is
described. The use of a level crossing based
detection method and novel classification algorithm
is also presented for the suppression and
discrimination of nuisance events from intrusion
events in a buried intrusion detection system.
Results are shown from real-time fiber optic sensing
systems.
2. Fiber optic intrusion detection system
The intrusion detection system used in this work
is based on the future fiber technologies microstrain
locator technology as applied to fence perimeter
applications [2]. The microstrain locator is based on
the use of a bidirectional MZ as a distributed sensor

Seedahmed S. MAHMOUD et al.: Real-Time Distributed Fiber Optic Sensor for Security Systems: Performance, Event Classification and Nuisance Mitigation
227
to detect and locate an intrusion anywhere along the
sensing length, LS, as shown in Fig. 1. The two
sensing fibers and the lead out fiber are typically
housed in a standard single mode fiber optic cable
which is mounted on the perimeter fence. In this
paper, the intrusion detection system will be referred
to as the locator.
Fig. 1 A basic future fiber technologies microstrain locator
system using a bi-directional MZ with the input polarization
control: C1 – C5 are all 50:50 fiber couplers.
The deployed sensing system consists of an
industrial computer which houses a highly coherent
1550-nm laser source which injects continuous wave
counter-propagating light into the MZ. Two
detectors, also housed in the sensing controller,
receive the clockwise (CW) and counter-clockwise
(CCW) signals from the MZ to analyze the signals.
The sensing controller also includes polarization
controllers PCCW and PCCCW to maximize the fringe
visibility of the MZ and optimize the location
accuracy by actively compensating for changes in
fiber birefringence. Detection of an event is based
on analyzing the interferometric signals, while the
location of an event along the sensing length LS is
resolved by measuring the time difference between
received counter propagating signals. Additionally,
using the event signals detected by both detectors it
is possible to apply the appropriate signal processing
techniques to classify the signals and perform both
event recognition and event discrimination.
2.1 System installation
For fence-mounted perimeter systems, the
implementation of the sensor as a fence-based
perimeter system is achieved by housing the two
sensing fibers as well as the insensitive lead-out
fiber Llead-out in a single fiber cable which is directly
attached to the fence fabric as shown in Figs. 2 and
3 [10]. This can be applied to a range of fence
fabrics including chain link, weld mesh, and
palisade styles.
Inactive lead-in cable
Start sensorFibre optic
sensing cable End sensor
Microstrain/locator densing controller Lead-out or
return fibreSensing fibers
(interferometer) Fig. 2 Use of a single fiber cable to implement the
bidirectional MZ sensing system.
Fig. 3 Implementation of the locator sensor on a fence
perimeter.
The quality of installation of the sensing cable
on the fence structure is very important in achieving
optimum system performance and is very often
underestimated. The fence construction needs to be
built according to an acceptable standard and the
sensing cable attached correctly. Poor fence
construction and sensor cable attachment contribute
to excessive nuisance alarms and long-term
performance degradation. While good installation
practices do not eliminate all nuisance alarms, it will
ensure that excessive nuisance signals are not
generated due to hypersensitivity of the fence to
environmental noise. It also enables optimal

Photonic Sensors
228
performance of any nuisance mitigation algorithms
employed. Another factor which impacts the
probability of detection is the cable configuration
which is used. Figures 4(a), 4(b), and 4(c) show
three different examples of possible installation
configurations of the sensor cable on a chain link
fence. While the configuration in Fig. 4(a) can
provide a basic level of security, looping the sensor
up and down the posts [Fig. 4(b)] will improve the
detection rate of fence climbing at or near the more
rigid posts and is a typical configuration used.
Where higher sensitivity is required, other cable
configurations may be implemented such as an extra
loop in the middle of the fence panels [Fig. 4(c)].
The exact configuration used will vary and will
depend on the level of security required, the types of
intrusion events to be detected, and the skill level of
the intruder. It is important that the type of the fence
barrier and cable configuration is chosen to match
the security requirements of the proposed system.
Fig. 4 Example of different cable configurations on a chain
link fence.
In buried systems, the sensor cable is configured
identical to the fence sensor except the sensing cable
is typically buried next to an oil or gas pipeline to
detect third party interference (TPI) activities as
shown in Fig. 5. Inevitably, it will also be sensitive
to other non-intrusion events such as those from
nearby traffic and railway crossings.
Fig. 5 Cross section of a buried fiber optic intrusion
detection system for detection of third party interference.
2.2 Performance parameters
The success of any perimeter intrusion detection system depends on three important performance parameters: the probability of detection (POD), the
nuisance alarm rate (NAR), and the false alarm rate (FAR). The POD is related to the sensitivity of the system and provides an indication of a system’s
ability to detect an intrusion within the protected area. A nuisance alarm is any alarm which is generated by an event that is not of interest. A false
alarm refers to an alarm generated by the system electronics and is not related to the sensor or an event. False alarms can be minimized through the
appropriate system design. Nuisance alarms are typically generated by environmental conditions such as rain, wind, snow, wildlife, and vegetation, as
well as man-made sources such as traffic crossings, industrial noises, and other ambient noise sources. While increasing the sensitivity of a system
increases its POD, it also increases its sensitivity to nuisance events. Basic event detection algorithms with little event discrimination capability which are
applied to a wide range of intrusion events can lead to increased nuisance alarm rates as well as decreased POD. Advanced signal processing
algorithms that can maintain a high POD and eliminate nuisance alarms are therefore crucial in perimeter intrusion detection systems. In the
following sections, the use of event recognition and

Seedahmed S. MAHMOUD et al.: Real-Time Distributed Fiber Optic Sensor for Security Systems: Performance, Event Classification and Nuisance Mitigation
229
classification techniques to maintain a high POD and minimize alarms caused by nuisance events will be presented for each type of the system.
3. Intrusion detection and nuisance suppression in fence systems
Event classification in perimeter intrusion
detection systems can be defined as the
categorization of detected signals into identifiable
pattern classes through the extraction and analysis of
unique signal features and attributes. The selection
of unique features from the detected signals is
paramount as it ultimately leads to a simplification
of the classification problem as well as faster
processing and higher detection rates [11]. The main
benefits of an accurate and robust event
classification system include the ability to
discriminate between nuisance events and intrusion
events, and more importantly, to suppress nuisance
alarms without significantly compromising the
probability of detection.
A typical event classification system consists of
a pre-processing stage that extracts unique features
from the detected event, and a classifier that assigns
the computed features to a particular class of
intrusion or nuisance (see Fig. 6). Feature samples of
nuisance and intrusion events are used to train a
classifier offline, and when training is complete, the
system will classify new instances based on what is
learnt in the training phase. Accurate nuisance and
intrusion event classification requires both features
that are highly discriminative with respect to the
classes of interest and a classifier which can form
arbitrary boundaries in the feature space.
Signal
samples Signature analysis
Feature selection
Neural network training
Pre-processing stage
Real-time signal input
Event detection
Feature extraction
Neural network classifier
Real-time classification Classification result
Fig. 6 An event classification system consisting of a
pre-processing stage and a real-time classification stage.
3.1 Neural networks based classification
Accurate event detection and the use of suitably
discriminative features are critical in any event
classification application. When training a classifier,
the classifier creates boundaries in the features space
between the investigated classes. Inaccurate
detection of an event can be a common cause of
errors in automatic classification [12].
A real-time event detection and feature
extraction based on a level crossings (LC) algorithm
was proposed and implemented [10]. This algorithm
has been used to form the basis of detecting and
classifying both intrusion and non-intrusion
(nuisance) events. This allows for an effective way
of reducing the nuisance alarm rate without reducing
the sensitivity of the system. In this work, the
intrusion events of interest for fence perimeter
systems are fence-climbing and fence-cutting, while
the nuisance events which need to be recognized and
discriminated are throwing a stone at the fence
(stone-throwing) and dragging a stick along the
fence (stick-dragging).
In general, the LC algorithm can be defined by
the number of crossings, in the positive direction, of
an input vector through a given threshold and can be
expressed as [10, 13]
1
0
( ) & ( 1)N
n
LC x n thresh x n thresh
≥ (1)
where x is a signal of the length N, the parameter
“thresh” is the level threshold, and the indicator
function Ψ is 1 if its argument is true, or 0
otherwise. The level threshold is always positive and
just above the system noise.
Based on the level crossings representation of
the intrusion signal, a number of configurable
parameters can be defined to detect events in real
time [10]:
1. Trigger level (TL): the level at which the
intrusion event will be detected.
2. Zero settle blocks (ZSB): the number of
blocks with zero values before and after an event to
determine the start and end of the event.

Photonic Sensors
230
3. Zero level (ZL): the level crossing per block
below which will be considered as zero.
4. Maximum duration (MD) of the event: limits
the duration of a continuous event such as stick
dragging on the fence.
Figures 7(a), 7(b), and 8 show examples of a
climb event, cut event and stick drag event detected
by the proposed detection algorithm, respectively.
The TL parameter was set to 5 LCs, the MD was set
to 46 blocks, and the ZSB was set to 5 blocks.
Figure 8 shows the termination of the long event
after it satisfies the MD parameter. Features are
extracted from these detected events and fed into
neural networks.
0 0.2 0 .4 0.6 0 .8 1 1.2 1 .4 1 .6 1.8 2.03
2
1
0 1 2 3 4
No. of samples
Am
plit
ude
Fence-climbing s ignal
0 10 20 30 40 50 60 70 800
10
20 30 40
Block number
LC
s
Level crossings in each block
Trigger level
Detected Event
ZL = 0 LCs
ZSB = 5 Blocks TL = 5 LCs
104
(a)
0 0.2 0.4 0.6 0.8 1 1.2 1.4 1.6 1.8 2104
3 2 1
0 1 2 3
No. of samples
Am
plit
ude
Fence-cutting signal
0 10 20 30 40 50 60 70 800
10 20 30 40 50
Block number
LC
s
Level crossings in each block
Detected Event
ZL = 0 LCs ZSB = 5 Blocks TL = 5 LCs
(b)
Fig. 7 Time domain and LC representation of (a) a climb
event and (b) cut event detected by the proposed algorithm.
No. of samples 0 0.2 0.4 0.6 0.8 1 1.2 1.4 1.6 1.8 2
×10 4
642
0246
Am
plit
ude
Stick-dragging signal
10 20 30 40 50 60 70 8005
1015202530
Block number
LC
s
Level crossings in each block
ZL = 0 LCs ZSB = 5 BlocksTL = 5 LCs
MD = 46 Blocks
Detected event
Fig. 8 Time domain and LC representation of a stick drag
event detected by the proposed algorithm.
A time-domain signal contains too much
irrelevant data to be used directly for classification
[11]. Additional features are usually required for an
effective classification. Using the LC algorithm, five
features have been extracted from the LC
representation of the detected intrusion signals.
These features are:
1. Total level crossings (TLC): the total number
of level crossings for the duration of the event.
2. Duration (d): the duration of the detected
event as a number of blocks (see Fig. 9).
3. Slope of the falling edge of the LCs: the slope
of the falling edge of the LC graph as measured
between the line formed when joining the end point
of the duration (x1, y1) and the point (x2, y2). In Fig. 9
which represents a climbing event, a threshold has
been used to select the point (x2, y2).
4. The angle (slope) of the rising edge of the LCs,
: the angle of the rising slope edge, , is
measured between the line formed when joining the
initial point of the duration and the maximum point
on the LCs graph, and the x-axis (see Fig. 9). In
most of the cutting events, the rising edge of the LCs
forms approximately a right angle (90°) with the
x-axis, while the climbing events form an acute
angle (< 90°). This feature is very important for the
climbing event and cut event classification.
5. Number of zeros (NZ): the number of zeros
(NZ) is the number of blocks within the detected
events which have a value less than the ZL parameter.

Seedahmed S. MAHMOUD et al.: Real-Time Distributed Fiber Optic Sensor for Security Systems: Performance, Event Classification and Nuisance Mitigation
231
No. of samples 0 0.2 0.4 0.6 0.8 1 1.2 1.4 1.6 1.8 2
104
321
01234
Am
plitu
de
Fence-climbing signal
0 10 20 30 40 50 60 70 800
10203040
Block number
LCs
Level crossings in each block
Threshold
Duration
Slope
Maximum point
(x1,y1)(x2,y2)
Fig. 9 Representation of the extracted features from the LCs
graph of a climbing event.
A three-layer supervised artificial neural network
(ANN) with a back-propagation learning algorithm
was used to classify the detected events. The five
extracted LC based features were used as inputs to
the ANN. The advantage of using an ANN is that it
can be trained and can implement fast decision
algorithms making them suitable for real-time
applications [14, 15]. Additionally, event
classification by the ANN does not require any
statistical assumptions regarding the data and can
learn to recognize the characteristic features of the
data to classify the event efficiently and accurately.
The LCs and neural network based classification
system described was implemented in a chain link
fence-mounted fiber-optic intrusion detection system
based on the locator technology with a sensing
length of 600 m. The extracted LC based features
were normalized and used as inputs to the
feed-forward neural networks with an input layer
consisting of 5 neurons, a hidden layer with 3
neurons, and an output layer consisting of 2 neurons.
Performance of the classification system was
measured against fence-climb, fence-cut, stick
dragging, and stone-throwing classes. The ANN was
trained with training data representing these classes,
and the weights were stored for real-time testing.
Fifteen training events were used per class.
The total number of tested events for each class
was 26. Table 1 shows the impact of the proposed
features on the performance of the classification
system. From the table, it can be observed that while
using four of the extracted LC features produces an
optimum result for fence cutting and stone throwing
events, by using all five features, it is possible to
achieve a 100% correct classification rate for all
four events. The classification accuracy of the
system is given by
classification accuracy 100 %t
n (2)
where t is the number of events correctly classified,
and n is the total number of tested events per class.
Table 1 Impact of the proposed features on the performance
of the classification system.
Performance in
Features Climb Cut Stick drag Stone throwing
TLC, d, slope, ө 87 % 100 % 95 % 100 %
TLC, d, slope, ө, NZ 100 % 100 % 100 % 100 %
3.2 Mitigation of continuous-nuisance alarm based on LCs
Suppression of continuous nuisance alarms such
as those induced by torrential rain is one of the most
challenging tasks for outdoor perimeter intrusion
detection systems (PIDS). A real-time level
crossings algorithm to mitigate rain-induced
nuisance alarms in fence based fiber-optic intrusion
detection systems was proposed and implemented
[13]. This algorithm is computationally
non-intensive, and it can be used to eliminate
rain-induced nuisance alarms for torrential rainfall
rates up to and in excess of 100 mm/hr. The LCs
based algorithm is also used to discriminate between
continuous nuisances such as rain and
non-continuous intrusion events, which allows for
simultaneous detection of intrusion events. The
algorithm also employs a dynamic event threshold to
be able to automatically adjust to varying rainfall
rates.
The LC algorithm was integrated into the locator
sensing controller which was installed in numerous
sites worldwide that experienced torrential rainfall.

Photonic Sensors
232
These sites experienced rainfall rates up to and in
excess of 100 mm/hour (> 4 inches/hr). Results from
these sites have demonstrated the elimination of
rain-induced nuisance alarms with the simultaneous
detection of intrusion events. The LC-based
algorithm is used to discriminate between
continuous nuisances such as rain and
non-continuous intrusion events. Due to its
continuous nature, torrential rainfall will generate a
fairly consistent level-crossing rate per time block
period. This feature can be used to suppress rainfall
induced alarms from the system. By monitoring for
any changes in the level crossing rate,
non-continuous intrusion events such as fence
climbing or cutting can be detected during the
rainfall period. Using a dynamic intrusion event
threshold has also proven to be effective in
automatically adjusting to variable rainfall rates.
Figure 10 shows an example of the detected
torrential rain signal on a 3.2-km long chain link
fence perimeter. The LC representation (see inset
nuisance level graph in Fig. 10) can be used to detect
intrusions whose signals are essentially buried inside
the time domain representation of the rain signal.
The LC algorithm can also be adapted to deal with
other continuous or semi-continuous nuisances such
as nearby traffic noise in a similar way.
Fig. 10 Real-time elimination of rain-induced nuisance
alarms with simultaneous intrusion detection on a 3.2-km chain
link fence (the inset graph is the LC representation of nuisance
and intrusion events).
4. Intrusion detection and nuisance suppression in buried systems
Buried-fiber-optic sensors, such as those
implemented for protecting buried oil and gas pipelines, are designed to detect physical disturbances generated by TPI which includes
accidental or deliberate digging or excavation activities. These systems are also susceptible to a range of ground based nuisance events such as road
and railway traffic and other nearby construction activities. These events can reduce an intrusion detection system’s effectiveness with an unacceptably
high rate of nuisance alarms. In this section, some novel signal processing techniques are outlined to mitigate the effect of these nuisance events on
buried intrusion detection systems by suppressing particular nuisance induced alarms without affecting alarms generated by intrusion events of interest.
Figures 11(a) and 11(b) show detected signal examples of typical intrusion events that should be detected, while Figs. 12(a) and 12(b) show typical
signals of nuisance alarms due to traffic that should be rejected on a 2.7-km buried gas pipeline.
0 0.2 0.4 0.6 0.8 1 1.2 1.4 1.6 1.8 2104
54321
012345
No. of samples
Am
plit
ude
(a)
0 0.2 0.4 0.6 0.8 1 1.2 1.4 1.6 1.8 2104
54321
012345
No. of samples
Am
plit
ude
(b)
Fig. 11 Time domain representation of intrusion events:
(a) the intrusion signal caused by digging with a pick-axe above
a 2.7-km buried gas pipeline protected by a locator system and
(b) intrusion signal caused by digging with a back-hoe above a
2.7-km buried gas pipeline protected by a locator system.
Seedahmed S. MAHMOUD et al.: Real-Time Distributed Fiber Optic Sensor for Security Systems: Performance, Event Classification and Nuisance Mitigation
233
0 0.2 0.4 0.6 0.8 1 1.2 1.4 1.6 1.8 2104
2.52
1.51
0.50
0.51
1.52
2.5
No. of samples
Am
plitu
de
(a)
0 0.2 0.4 0.6 0.8 1 1.2 1.4 1.6 1.8 2104
6
4
2
0
2
4
6
No. of samples
Am
plitu
de
(b)
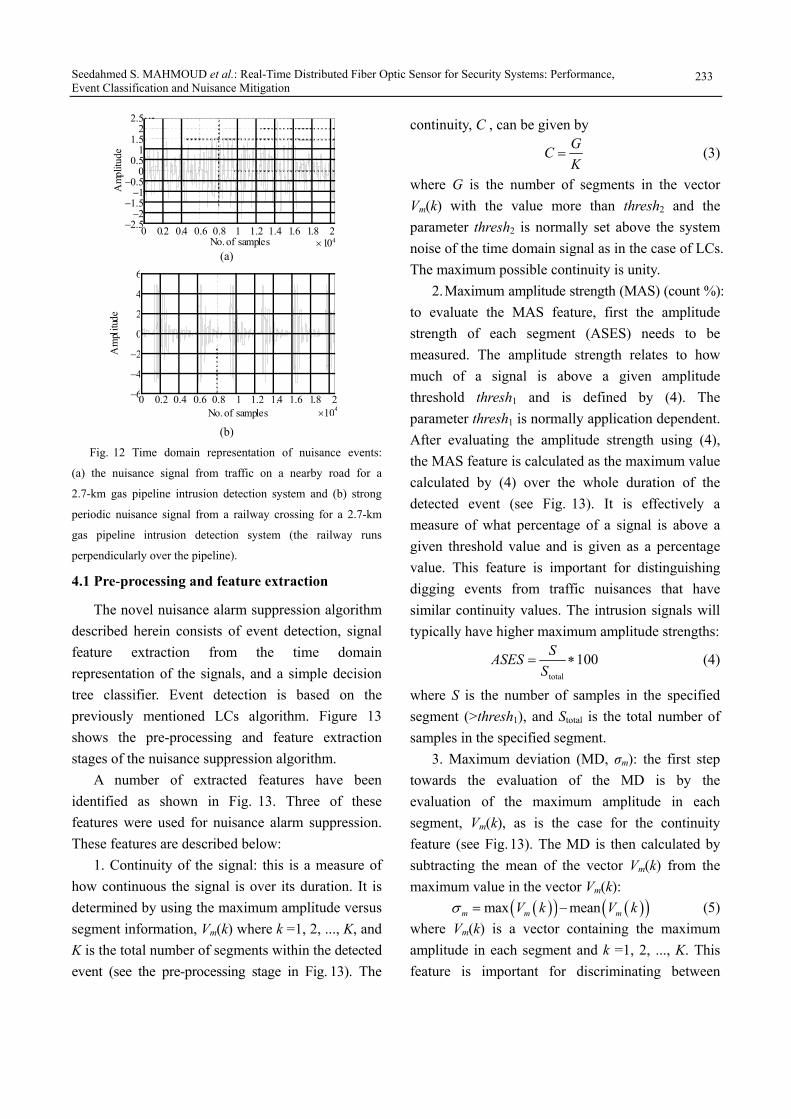
Fig. 12 Time domain representation of nuisance events:
(a) the nuisance signal from traffic on a nearby road for a
2.7-km gas pipeline intrusion detection system and (b) strong
periodic nuisance signal from a railway crossing for a 2.7-km
gas pipeline intrusion detection system (the railway runs
perpendicularly over the pipeline).
4.1 Pre-processing and feature extraction
The novel nuisance alarm suppression algorithm
described herein consists of event detection, signal
feature extraction from the time domain
representation of the signals, and a simple decision
tree classifier. Event detection is based on the
previously mentioned LCs algorithm. Figure 13
shows the pre-processing and feature extraction
stages of the nuisance suppression algorithm.
A number of extracted features have been
identified as shown in Fig. 13. Three of these
features were used for nuisance alarm suppression.
These features are described below:
1. Continuity of the signal: this is a measure of
how continuous the signal is over its duration. It is
determined by using the maximum amplitude versus
segment information, Vm(k) where k =1, 2, ..., K, and
K is the total number of segments within the detected
event (see the pre-processing stage in Fig. 13). The
continuity, C , can be given by G
CK
(3)
where G is the number of segments in the vector
Vm(k) with the value more than thresh2 and the
parameter thresh2 is normally set above the system
noise of the time domain signal as in the case of LCs.
The maximum possible continuity is unity.
2. Maximum amplitude strength (MAS) (count %):
to evaluate the MAS feature, first the amplitude
strength of each segment (ASES) needs to be
measured. The amplitude strength relates to how
much of a signal is above a given amplitude
threshold thresh1 and is defined by (4). The
parameter thresh1 is normally application dependent.
After evaluating the amplitude strength using (4),
the MAS feature is calculated as the maximum value
calculated by (4) over the whole duration of the
detected event (see Fig. 13). It is effectively a
measure of what percentage of a signal is above a
given threshold value and is given as a percentage
value. This feature is important for distinguishing
digging events from traffic nuisances that have
similar continuity values. The intrusion signals will
typically have higher maximum amplitude strengths:
total
100S
ASESS
(4)
where S is the number of samples in the specified
segment (>thresh1), and Stotal is the total number of
samples in the specified segment.
3. Maximum deviation (MD, σm): the first step
towards the evaluation of the MD is by the
evaluation of the maximum amplitude in each
segment, Vm(k), as is the case for the continuity
feature (see Fig. 13). The MD is then calculated by
subtracting the mean of the vector Vm(k) from the
maximum value in the vector Vm(k):
max meanm m mV k V k (5)
where Vm(k) is a vector containing the maximum
amplitude in each segment and k =1, 2, ..., K. This
feature is important for discriminating between

Photonic Sensors
234
digging intrusion events and adjacent nuisance
events of comparably long continuities, even if they
have roughly similar amplitudes. In this situation,
the digging events will have a higher maximum
deviation owing to their higher variation in segment
maxima. This can be seen by comparing the two
signals represented by Figs. 11(b) (intrusion) and
12(b) (adjacent nuisance) where there are more
periods of inactivity in the digging signal (lower in
the amplitude) when compared with the continuous
nuisance signal. This translates into a higher
maximum deviation for the digging signal.
Detected event
Evaluate total LCsSignal rectification/10 equal segments
Measure max peak in each segment Measure% of the samples in eachsegment above specified
threshold
Maximum deviation Continuity
Extracted features
Ratio of the amplitude strength
Maximum amplitudestrength
Fig. 13 New alarming system feature extraction method.
4.2 Classification using simple decision tree
By using the features described in the previous
section in the right combination, it is possible to
suppress a large number of nuisance alarms in
buried intrusion detection systems. This can be done
by implementing a decision tree. Decision trees
represent a series of IF…THEN type rules which are
linked together and can be used to classify or predict
events based upon the values of a select number of
features. For this work, we use a simple decision
tree to discriminate between intrusion and nuisance
events. Neural networks can also be used with these
features to discriminate between true alarms and
nuisance events. Intrusion events will generate
alarms while nuisance events will be ignored.
Real captured intrusion and nuisance event
signals from two sites are used to test the proposed
algorithm. Table 2 shows the values of the features
for the intrusion and nuisance events in Figs. 11 and
12, respectively. The real intrusion and nuisance
data are used to derive appropriate threshold values,
thresh_1, thresh_2, thresh_3, and thresh_4 for the
decision tree as shown in Fig. 14. In this example,
thresh_1 = [0, 0.8) and [0.8, 1], thresh_2 = [0, 10)
and [10, 100], thresh_3 = [0, 15) and [15, 100] and
thresh_4 = [0, 0.9) and [0.9, 5]. Using these values
the algorithm classifies digging events accurately
(Figs. 11(a) and 11(b)) while traffic nuisances [such
as those in Figs. 12(a) and 12(b)] are rejected.
Continuity<thresh_1
(0.8)
>thresh_1 (0.8)
Maximum amplitude strength
Maximum amplitudestrength
(Node 1) (Node 2)
No alarm Alarm
Intrusion-1
Nuisance-1 No alarm
(Node 3)
(Node 4)
(Node 5)
Alarm
>thresh_4(0.9)
>thresh_3(15)
<thresh_3 (15)
No alarm
Nuisance-2
Event detection(LCs)
<thresh_2
(10)
>thresh_2(10)
Maximum deviation
<thresh_4(0.9)
Fig. 14 Practical example of the decision tree.
Table 2 Feature values of intrusion and nuisance events.
Features Values
Event Type Continuity
(C) MAS
MD
(σm)
Node
decision
Intrusion [hand and assisted
digging, Fig. 11(b)] 0.4 34.86 3.595 Node-2
Vehicular traffic [adjacent
traffic, Fig. 12(a)] 1 1.86 0.76 Node-3
Road intersection and train
crossings [Fig. 12(b)] 1 18.99 0.4712 Node-4

Seedahmed S. MAHMOUD et al.: Real-Time Distributed Fiber Optic Sensor for Security Systems: Performance, Event Classification and Nuisance Mitigation
235
5. Conclusions
The performance criteria of real-time fiber optic
perimeter intrusion detection systems have been
discussed. Performance results have shown that the
quality of sensor installation and fence construction
needs to be controlled to reduce excessive nuisance
signals. More importantly, an effective robust event
classification system also needs to be implemented
to minimize nuisance alarms while maintaining a
high probability of detection to intrusion events.
A number of signal processing techniques for
intrusion event detection and classification, and
nuisance alarm suppression in a fiber-optic intrusion
detection system have been proposed and presented.
In fence-based systems, intrusion and non-intrusion
events such as fence climbing, fence cutting,
stick-dragging, and stone-throwing have been
successfully classified in real time and demonstrated
on a standard chain link fence using robust level
crossings based features and artificial neural
networks. Additionally, the use of a level crossings
based algorithm with a dynamic threshold for
suppressing torrential rain-induced nuisance alarms
in fence-based fiber-optic perimeter intrusion
detection systems has demonstrated its effectiveness
against torrential rainfall rates in excess of 100 mm/hr.
The simultaneous detection of intrusion events
during rainfall periods has also been demonstrated.
In buried fiber-optic pipeline intrusion detection
systems, a level crossings based detection and novel
classification algorithm have also been implemented.
The use of a decision tree classification algorithm
has demonstrated the effective classification of both
traffic induced nuisance events and digging and
excavation intrusion events.
Future work is focusing on increasing the library
of signal features to achieve the classification of
more intrusion and nuisance events in a wider range
of operating environments.
Open Access: This article is distributed under the terms
of the Creative Commons Attribution License which
permits any use, distribution, and reproduction in any
medium, provided the original author(s) and source are
credited.
References
[1] A. D. Kersey, “A review of recent developments in fiber optic sensor technology,” Optical Fiber Technology, vol. 36, no. 2, pp. 291–317, 1996.
[2] J. Katsifolis and L. McIntosh, “Apparatus and method for using a counter-propagating signal method for locating events,” U.S. Patent 7,499,177, 2009.
[3] J. C. Juarez, E. W. Maier, K. N. Choi, and H. F. Taylor, “Distributed fiber-optic intrusion sensor system,” Journal of Lightwave Technology, vol. 23, no. 6, pp. 2081–2087, 2005.
[4] J. C. Juarez and H. F. Taylor, “Field test of a distributed fiber-optic intrusion sensor system for long perimeters,” Applied Optics, vol. 46, no. 11, pp. 1968–1971, 2007.
[5] S. Tarr and G. Leach, “The dependence of detection system performance on fence construction and detector location,” in Proceedings of the 32nd Annual IEEE International Carnahan Conference on Security Technology, pp. 196–200, 1998.
[6] L. H. Jiang, X. M. Liu, and F. Zhang, “Multi-target recognition used in airpoty fiber fence warning system,” in Proceedings of the Ninth International Conference on Machine Learning and Cybernetics, Qingdao, Jul. 11–14, pp. 1126–1129, 2010.
[7] J. D. Vries, “A low cost fence impact classification system with neural networks,” in Proceedings of 7th AFRICON Conference in Africa, Sept. 15–17, vol. 1, pp. 131–136, 2004.
[8] A. Yousefi, A. A. Dibazar, and T. Berger, “Intelligent fence intrusion detection system: detection of intentional fence breaching and recognition of fence climbing,” in IEEE International Conference on Technologies for Homeland Security, Boston, May 12–13, pp. 620–625, 2008.
[9] H. Min, C. Lee, J. Lee, and C. H. Park, “Abnormal signal detection in gas pipes using neural networks,” in Proceeding of 33rd Annual Conference of the IEEE Industrial Electronics, Taiwan, Nov. 5–8, pp. 2503–2508, 2007.

Photonic Sensors
236
[10] S. Mahmoud and J. Katsifolis, “Robust event classification for a fiber optic perimeter intrusion detection system using level crossing features and artificial neural networks,” in Proc. SPIE, vol. 7677, pp. 767708, 2010.
[11] L. R. Rabiner and R. W. Schafer, Digital Processing of Speech Signals. London: Pearson Education, 1978.
[12] J. C. Junqua, B. Mak, and B. Reaves, “A robust algorithm for word boundary detection in the presence of noise,” IEEE Transactions on Speech and Audio Processing, vol. 2, no. 3, pp. 407–412,
1994. [13] S. Mahmoud and J. Katsifolis, “Elimination of
rain-induced nuisance alarms in distributed fiber-optic perimeter intrusion detection systems,” in Proc. SPIE, vol. 7316, pp. 731604-1–731604-11, 2009.
[14] A. Freeman and M. Skapura, Neural Networkss: Algorithms, Applications, and Programming Techniques. Massachusetts: Addison-Wesley, 1991.
[15] A. K. Jain, J. Mao, and K. M. Mohiuddin, “Artificial neural networks: a tutorial,” Computer, vol. 29, no. 3, pp. 31–44, 1996.


