


Languages
Pages
Legal

1 CTU Monthly Economic Bulletin – May 2018
CTU Monthly Economic Bulletin No. 200 (May 2018) Commentary In memoriam: This is the 200th CTU Economic Bulletin. It was founded by my predecessor, Peter Conway, CTU economist and then CTU Secretary, who wrote the first 101 issues. He died just three years ago, on 9 June 2015. We still miss his wisdom, values, activism, music and friendship.
The Budget: bleeding stopped, patient’s condition still serious Summary
The 2018 Budget was a “stop the bleeding” Budget. Many services received funding to cover rising costs for the first time in many years. But the body of public services is still in dire straits: while the bleeding may have stopped, we still have to get the patient well again.
The highlights of the Budget were clearly in Health and Housing. That is not to forget the Families Package to reduce poverty and inequality which had been announced in advance.
To take Health as an example, this is the first Budget I have attended since 2010 where funding has been adequate to meet rising costs and population pressures since the previous year, as well as paying for politicians’ promises. It reduced doctors’ fees for an estimated 540,000 people with low incomes, and extended free visits to 13 year olds – but it did not provide pay settlements and pay equity claims nor the increasingly desperate staffing needs. It needs around $2 billion to restore funding to 2010 levels in real terms.
That is the story throughout this Budget: it set a direction, but took just a step along the way. Even good starts in education, housing and the Families Package leave enormous gaps to fill.
There are growing structural surpluses which could boost services and income support. The main immediate barrier is unwillingness to make use of the available revenue: the Budget Responsibility Rules which limit spending and debt. Yet our net debt levels are far from our greatest worry, especially taking account of the rapidly growing Superannuation Fund.
The Government is planning to take a “wellbeing” approach to next year’s Budget, weighing up not only the finances of the Government and the health of the economy but also people’s skills, knowledge and health; trust, culture and fairness; and preserving the environment. If we applied a wellbeing framework, I have no doubt that the dangers to our wellbeing would far outweigh the risks in say a net debt target, including the Super Fund, of 10 percent of GDP.
I calculate that we could deliver further funding, rising over four years to $5 billion per year, to Health, Education and other strapped public services, on top of rising costs; raise benefits by 30 percent; and index Working for Families to wages, by relaxing the debt and spending limits and raising around $3 billion in additional revenue from taxation starting in the year to June 2021. But this would break the Government’s Budget Responsibility Rules.
The Government is heading in the right direction. It now needs to demonstrate the urgency that the situation demands.
Information
Section p.6
2 CTU Monthly Economic Bulletin – May 2018
The 2018 Budget was a “stop the bleeding” Budget. Many services received funding to cover rising costs for the first time in many years. But the body of public services is still in dire straits: we have heard repeatedly about services that cannot keep up with demand, staff stretched past breaking point, and people and communities suffering as a result. While the bleeding may have stopped, we still have to get the patient well again.
What is getting in the way of a rapid recovery is the Budget Responsibility Rules and lack of revenue. There are growing surpluses which Treasury’s analysis shows are largely structural, not cyclical1, so they can be used to boost services and income support. The main immediate barrier then to doing more about these huge and growing pressures is the willingness to make use of the available revenue. The Budget Responsibility Rules form a pincer, leaving little room to move between requiring operating expenses to be below 30 percent of GDP; lowering net debt (from which New Zealand Superannuation Fund is excluded) to below 20 percent of GDP by 2022, combined with a promise not to introduce new taxes in this term of office.
I describe the reasons in more detail below, but a rough calculation using Treasury’s Fiscal Strategy Model shows that we could
• Provide a step increase in annual funding, rising over 4 years from $2 billion to $5 billion (on top of population and cost adjustments) spread between Health, Education and other services, addressing many of the gaps that have grown over the last 9 years; and
• Index Working for Families to maintain relativity with wages; and • Raise benefits by 30 percent on average, restoring their real levels to around where they were
after being slashed in 1991, and index them to wages to ensure they don’t fall behind again, thus lifting many more people out of poverty whom Working for Families does little to help
by raising the net debt limit (including the Super Fund) to 10 percent of GDP and raising around $3 billion in additional revenue from taxation starting in the year to June 2021. Spending would then be modestly over 30 percent of GDP – 31 percent of GDP after four years – but outside the Budget Responsibility Rules on that basis and because its measure of net debt would be up to 25 percent of GDP. But it would be a much better balance between the high social and environmental risks we currently see evidenced every day and the low risks attached to our very low government debt.
The highlights of the Budget were clearly in Health and Housing. That is not to forget the Families Package to reduce poverty and inequality which tended to be overlooked.
To use Health as an example, we have been assessing Health Budgets since 2010. We’ll be double checking our numbers and publishing more extensive analysis later, but this is the first Budget I have attended since 2010 where funding has been adequate to meet the rising costs and population pressures since the previous year, as well as paying for politicians’ promises. The new capital allocation was exceptional – a total of $1.25 billion compared to $368 million estimated to have been spent in the current financial year (to June 2018). The need is huge, as Dunedin’s dilapidated hospital and Middlemore’s leaky buildings illustrate, but the problem will not be “not enough” but “do we have the capacity to spend that much in a year?”
1 Budget Economic and Fiscal Update 2018, p. 34.
3 CTU Monthly Economic Bulletin – May 2018
Since 2010, the shortfalls have accumulated and we calculated that if this year’s health funding was to be restored in real terms to the 2010 levels it would need an additional $2.7 billion instead of the $800 million it received. In essence it is around $2 billion behind where it was in 2010 in real terms.
Of course that was never going to happen in one Budget, but if we are going to meet the health needs of New Zealanders, which are growing due to an aging population, poor housing, poverty, poor diets and new and better ways to treat people, that has to be restored, and more. We have not only documented the funding needs but also the human needs that require more funding, such as the need for mental health services that has grown three times faster than funding, the increasing seriousness of the state of people turning up at emergency departments, the staff burnout, the unmet needs.
The Budget reduced doctors’ fees for an estimated 540,000 people with low incomes, and extended free visits to 13 year olds – but it did not provide for pay settlements and pay equity claims.
That is similar to the story throughout this Budget: it set a direction, but took just a step along the way.
Increased base funding to Early Childhood Education comes after nine years without any increases, and so is very welcome, but we will still have teachers trying to look after up to five under-twos at a time, and unqualified staff being allowed to care for our small children.
There is more operational funding in the school sector, but not addressed are the well-recognised problems in recruiting and retaining staff. There are many causes, including their pay levels.
In tertiary it is right, at a time of major changes to the nature of work, to be aiming for free tertiary education. Students welcomed their increased allowances. But tertiary education including trade training has also been subjected to years of underfunding. The problems of competitive fiefdoms, rather than a tertiary education system, are also coming home to roost. There are polytechnics and institutes of technology teetering on the edge of viability, and continuing layoffs in universities.
Kiwibuild is a great plan, and its teething problems are not about funding but about the complexity of and urgency of the situation it is trying to address. The Government is faced with years of wilful neglect of Kiwis’ need for good quality, affordable housing. The start made on expanding the stock of Housing NZ houses is desperately needed, but even over 4 years it will fall well short of the current waiting lists.
Even the Families Package, while a good start, leaves an enormous gap still to fill. It lifts an estimated 54,000 children above the 50 percent poverty line (that is, 50 percent of median disposable household income before housing costs), 34,000 less than the Government thought it was helping due to a Treasury estimation error. But that still leaves approximately 90,000 children at or below that level of poverty (the Household Incomes Report for 2017 estimated there were 140,000 below that poverty line in 2016). The Child Poverty Action Group (CPAG)1 points out that there are many more children who will not be brought out of poverty by this measure: for example there are 140,000 below the extreme 40 percent poverty line after housing costs (and some even below the 30 percent after-housing-cost line), who need very significant changes to benefits to come out of poverty: increases in Working for Families tax credits will not help most of them.
1 For example, “Does this budget turn the tide?” by Susan St John, 18 May 2018, available at http://www.cpag.org.nz/assets/SusanSTJohnPBBpresentationwellington18.pdf
4 CTU Monthly Economic Bulletin – May 2018
CPAG also points out that, while the Government has restored the funding of Working for Families to the 2010 level in real terms (the previous Government deliberately eroded it), it will fall back again after the coming year unless it is fully indexed.
The reality is that each step in removing the blight of poverty requires progressively more intensive commitment. The $1.2 billion cost of the Families Package in the 2019 year, rising to $1.6 billion in 2022 (total $5.5 billion) is only a start.
So the direction of the Budget is good, but it is much too timid in addressing the evident problems throughout our public services, not only the big ones I have mentioned. Our response to climate change, protection of our borders from plant and animal diseases and pests, and many other areas are either not working or showing signs of great stress.
As I mentioned at the start, there are growing surpluses which Treasury’s analysis shows are largely structural, not cyclical1, so they can be used to boost services and income support, but the Budget Responsibility Rules get in the way. Here are more detailed reasons why.
Throughout the forecast period, operational spending is well below 30 percent of GDP: 28.5 percent in the year to June 2019 and falling over the next three years to 28.0 percent – not much more than the previous Government had planned. Yet revenue, even without new taxes, is rising from 29.9 percent of GDP to 30.4 percent over the same period.
So why can’t the Government increase spending at least to 30 percent of GDP?
Because it is, justifiably, spending on capital projects such as hospitals, schools, housing and transport infrastructure. That pressure would be released if more could be borrowed, as it can be at the very low interest rates available to the government. Most of these projects will repay themselves in lowered costs or increased tax revenues in future years. Treasury estimates its average cost of borrowing is just 3.6 percent, and it is currently raising funds at under 2.6 percent.
But crucially, the Government’s core crown net debt target of 20 percent of GDP prevents it from doing so. Yet New Zealand’s public net debt is strikingly low by international standards – 7th lowest in the OECD in 2017.
International agencies like the IMF and OECD use a different net debt measure to the one the Government uses: they include the financial assets of the New Zealand Superannuation Fund which are growing much faster than GDP. Our Auditor General agrees (see last month’s Bulletin). Our net debt including the Super Fund is forecast to be only 7.2 percent of GDP in June 2019, and just 2.3 percent in 2022. This more logical net debt measure falls much faster than the official one (which goes from 20.8 percent to 19.1 percent over the same period) because the Super Fund is growing so fast.
Our net debt levels are therefore far from our greatest worry.
The Government is planning to take a “wellbeing” approach to next year’s Budget. This will be a major step forward for public policy. It stated in this year’s Budget papers that this
will support our commitment to put people’s wellbeing and the environment at the heart of our policies. This includes reporting against a wider set of wellbeing indicators in future Budgets. For example, the Prime Minister’s Child Poverty Reduction Bill will require each
1 Budget Economic and Fiscal Update 2018, p. 34.
5 CTU Monthly Economic Bulletin – May 2018
government to set targets on alleviating child poverty and report against those targets at every Budget.
Budget 2019, the Wellbeing Budget, will broaden the Budget’s focus beyond economic and fiscal policy by using the Treasury’s Living Standards Framework (LSF) to inform the Government’s investment priorities and funding decisions. The LSF is based on the OECD’s wellbeing framework and combines measures of current wellbeing (across 12 domains) with indicators of intergenerational wellbeing, which are organised into four capitals – financial and physical, human, social and natural.
As part of the Confidence and Supply Agreement with the Green Party of Aotearoa New Zealand, the Government is developing a comprehensive set of environmental, social and economic sustainability indicators to measure our progress as a country. These will be used alongside the LSF to enable us to measure and report against a broader set of indicators to show a more rounded measure of success, as a country and as a Government.
Human capital is concerned with people’s skills, knowledge and health; social capital is concerned with the values holding society together, trust, culture, cultural identity and fairness (including the impacts of inequality); and natural capital is concerned with preserving the natural environment.
If we applied a wellbeing approach, I have no doubt that the dangers to our wellbeing, the dangers to our social, human and natural capital presented by dysfunctional public services, would far outweigh the risks in a net debt target, including the Super Fund, of say 10 percent of GDP.
That would allow prudent borrowing to free up sufficient revenue to fund the difference between current government operational spending and 30 percent of GDP and allow attention to be paid much more quickly and adequately to our failing services, as indicated at the beginning of this commentary. It would give the Government time to reframe its Budget Responsibility Rules into policies that took full account, not only of fiscal and financial considerations but all dimensions of New Zealanders’ wellbeing.
How would this work? We have yet to see, but one approach would be for the Government to set some objectives covering all the aspects of wellbeing – such as reducing poverty, raising wages, addressing climate change, cleaning up our rivers, ensuring people are helped through climate change, globalisation and technological changes in a just way, having a world class life-long education and vocational training system, and improving our people’s health to reduce their need for the health system. It could set some specific targets (but be wary of targets that lead to neglect of the bigger picture as has happened in Health). It could then estimate what resources are needed, what can be afforded and when, and how they should be raised – by reprioritisation, borrowing or new taxes. This would replace the arbitrary process of setting a limit on spending and borrowing, taking little account of the nation’s needs.
Based on this, the Government could seek a mandate from New Zealanders to raise the revenue needed through new taxes to fund the public services they want. The UMR poll the CTU commissioned recently showed 92 percent of New Zealanders agreed that our public services needed more government funding, and that almost two-thirds of them (65 percent) supported raising taxes to pay for them.
The Government is heading in the right direction. It now needs to demonstrate the urgency that the situation demands.
Bill Rosenberg
6 CTU Monthly Economic Bulletin – May 2018
Information Forecast ..................................................................................................................................................... 6
Economy ................................................................................................................................................... 7
Employment ............................................................................................................................................ 12
Wages and prices .................................................................................................................................... 17
Public Sector ........................................................................................................................................... 20
Notes ....................................................................................................................................................... 21
Aindicates information that has been updated since the last bulletin.
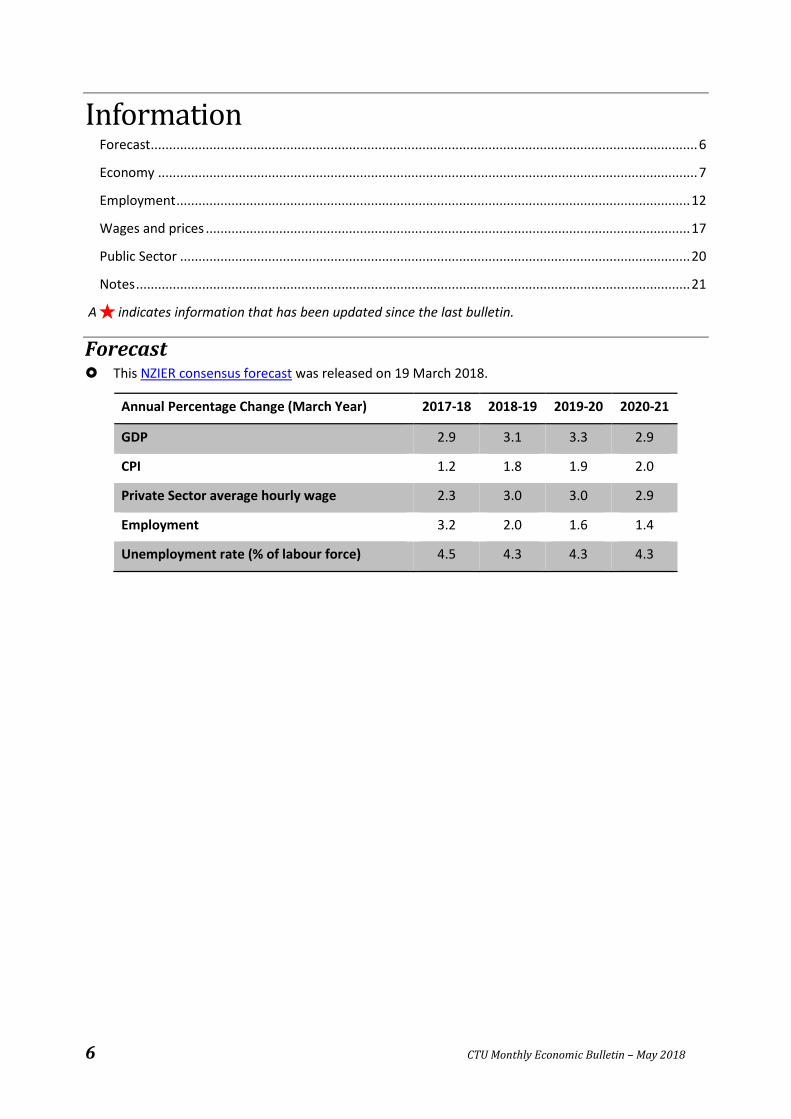
Forecast This NZIER consensus forecast was released on 19 March 2018.
Annual Percentage Change (March Year) 2017-18 2018-19 2019-20 2020-21
GDP 2.9 3.1 3.3 2.9
CPI 1.2 1.8 1.9 2.0
Private Sector average hourly wage 2.3 3.0 3.0 2.9
Employment 3.2 2.0 1.6 1.4
Unemployment rate (% of labour force) 4.5 4.3 4.3 4.3
7 CTU Monthly Economic Bulletin – May 2018
Economy
Annual Regional Gross Domestic Product statistics for the year to March 2017 show Auckland producing over a third (37.5 percent) of the nation’s goods and services which can be valued in dollar terms – $101 billion out of $271 billion. (Unlike the usually quoted GDP figures, these values are not adjusted for inflation in prices of the goods and services produced.) Next was Wellington with 13.2 percent of the country’s production, closely followed by Canterbury with 12.9 percent. At the other end were the West Coast (0.6 percent), Gisborne (0.7 percent) and Marlborough (1.0 percent). Over three-quarters of the production was in the North Island (77.3 percent). In 2016 (latest available), the region with the largest proportion of its production in manufacturing was Marlborough with 21.5 percent, followed by Southland with 19.0 percent, Taranaki with 16.9 percent, and Northland with 14.5 percent. The great majority of the manufacturing production is described as “primary manufacturing”, presumably food, forestry, oil and gas processing and similar.
However production per person (per capita) showed a somewhat different picture. The highest in the year to March 2017 was Taranaki at $70,863 per capita, followed by Wellington ($69,851 per capita), Auckland ($61,924) and Marlborough ($61,402). Canterbury was 6th with $57,551 per capita. At the other end was Gisborne, at $39,896 per capita, not much more than half Taranaki’s per capita production. Then came Northland ($40,269), Manawatu-Whanganui ($42,919) and Hawke’s Bay ($45,651). However there was less difference on average between the North Island ($57,438) and South Island ($55,578), with New Zealand averaging $57,002 per person overall. The ranking of the regions’ per capita income has not changed greatly since 2000 when the series starts, but Hawke’s Bay has gone from 8th to 12th among the 15 regions, while Marlborough has gone from 7th to 4th, the West Coast from 13th to 8th, and Otago from 10th to 7th. This reflects different growth rates in the regions: between 2000 and 2017, the fastest average annual growth in per capita production (5.5 percent per year) was in Marlborough, followed by the West Coast (5.1 percent), Otago (4.7 percent), Canterbury (4.6 percent) and Southland (also 4.6 percent). The slowest growth region was Wellington at 3.4 percent followed by our supposed power-house, Auckland, at 3.6
-4.5
-3.0
-1.5
0.0
1.5
3.0
4.5
-1.5
-1
-0.5
0
0.5
1
1.5
Dec-13 Dec-14 Dec-15 Dec-16 Dec-17
Perc
enta
ge o
f GDP
Perc
enta
ge C
hang
e
Quarterly Percentage Change in GDP Current Account Deficit as a % of GDP
8 CTU Monthly Economic Bulletin – May 2018
percent. Over New Zealand, production grew 4.0 percent per year on average, but 4.6 percent in the South Island and 3.8 percent in the North Island. In the last year, the West Coast grew fastest at 7.5 percent, followed by Southland with 7.3 percent, Bay of Plenty and 6.7 percent and Northland at 5.9 percent. Wellington held its bottom spot at 2.9 percent growth and Canterbury joined the main population centres at the bottom, also with 2.9 percent, while Auckland was next at 3.5 percent annual per capita growth.
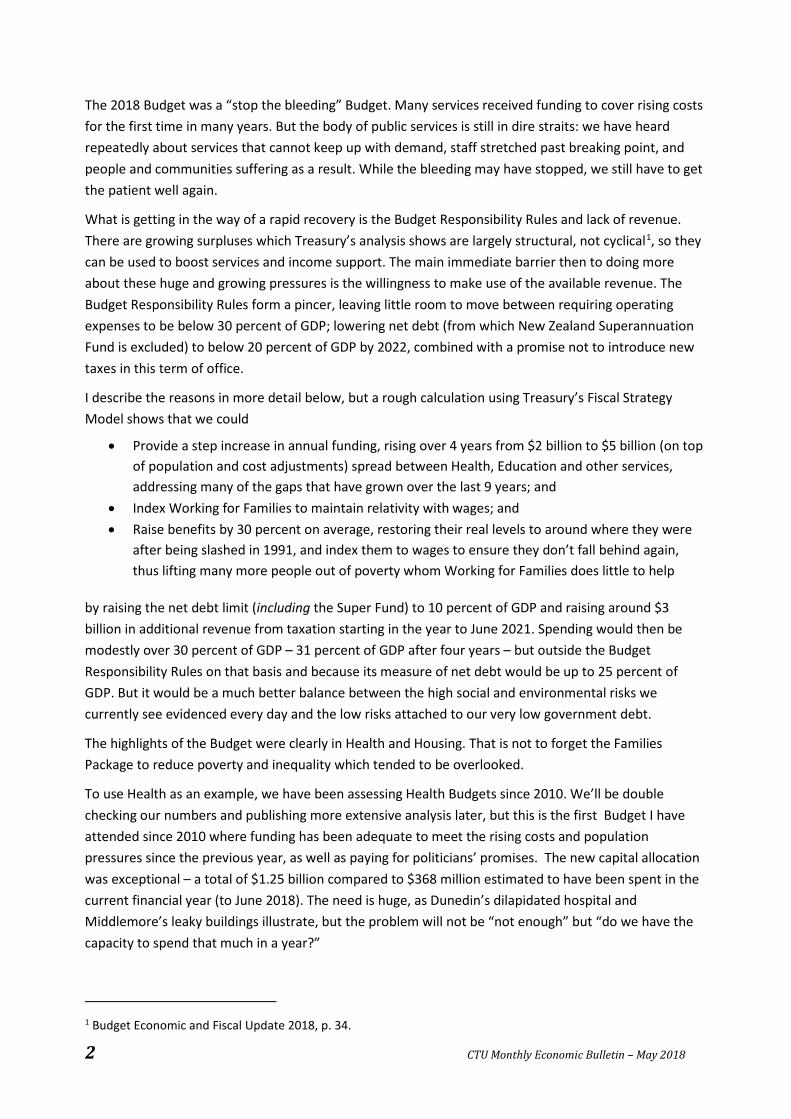
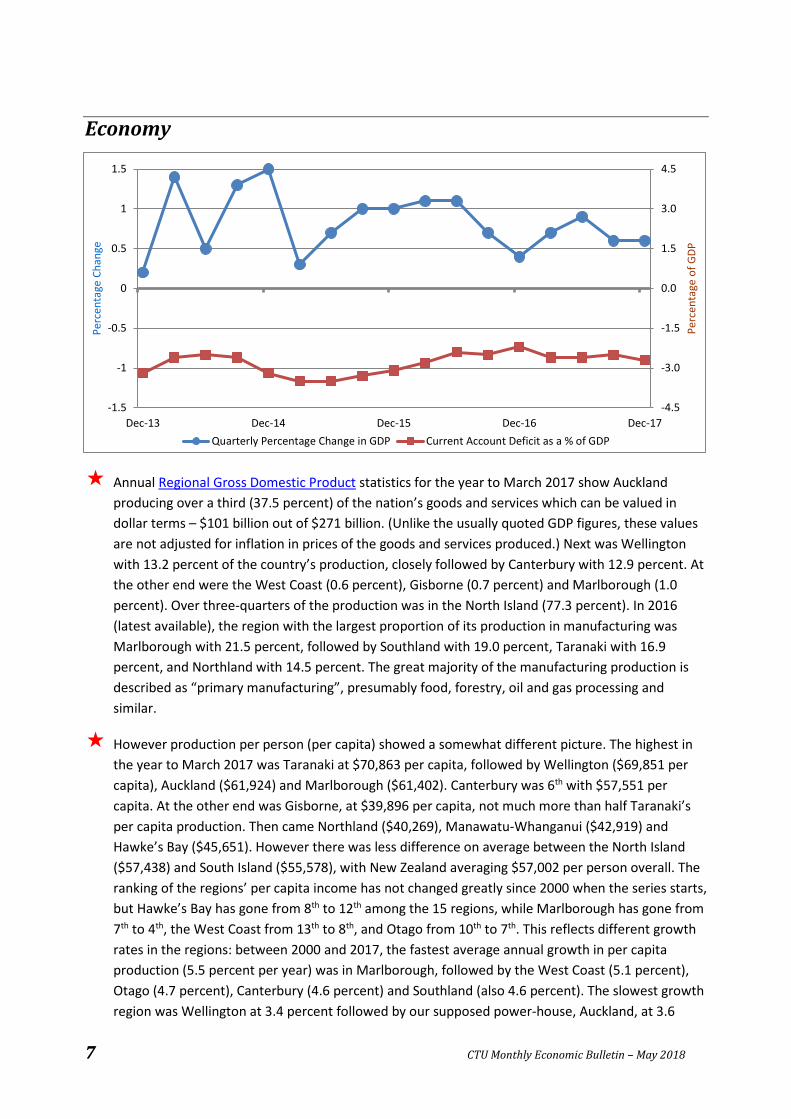
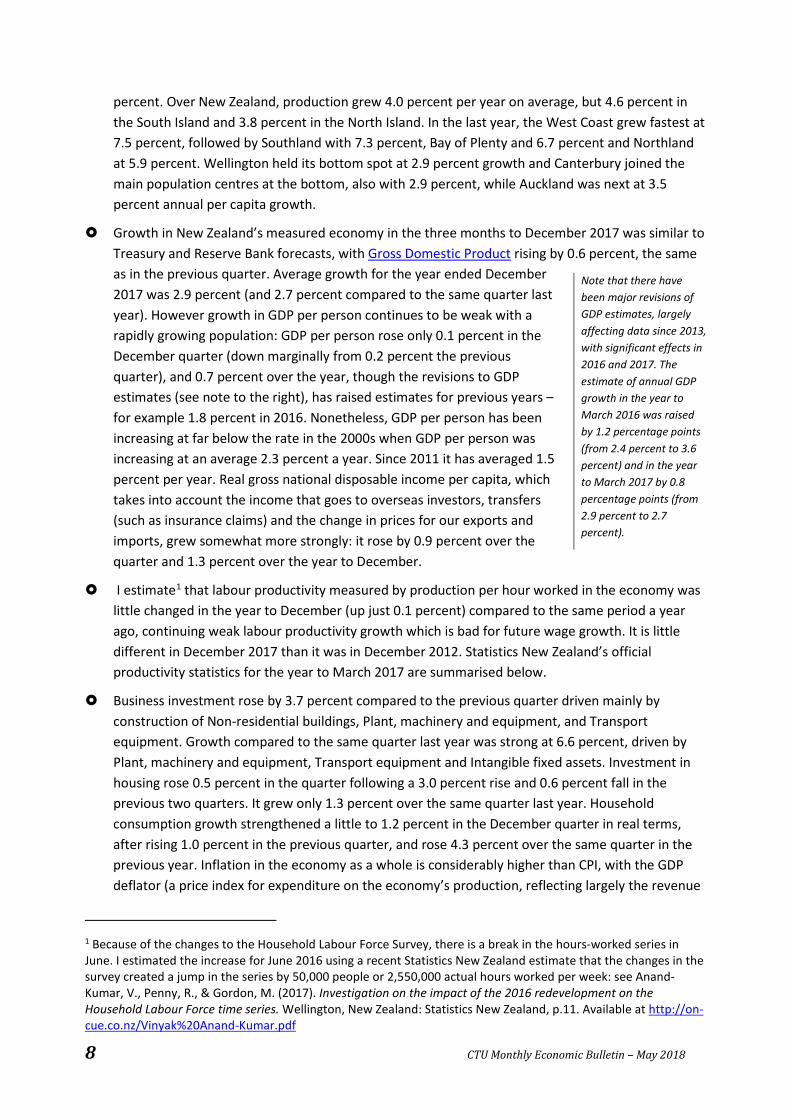
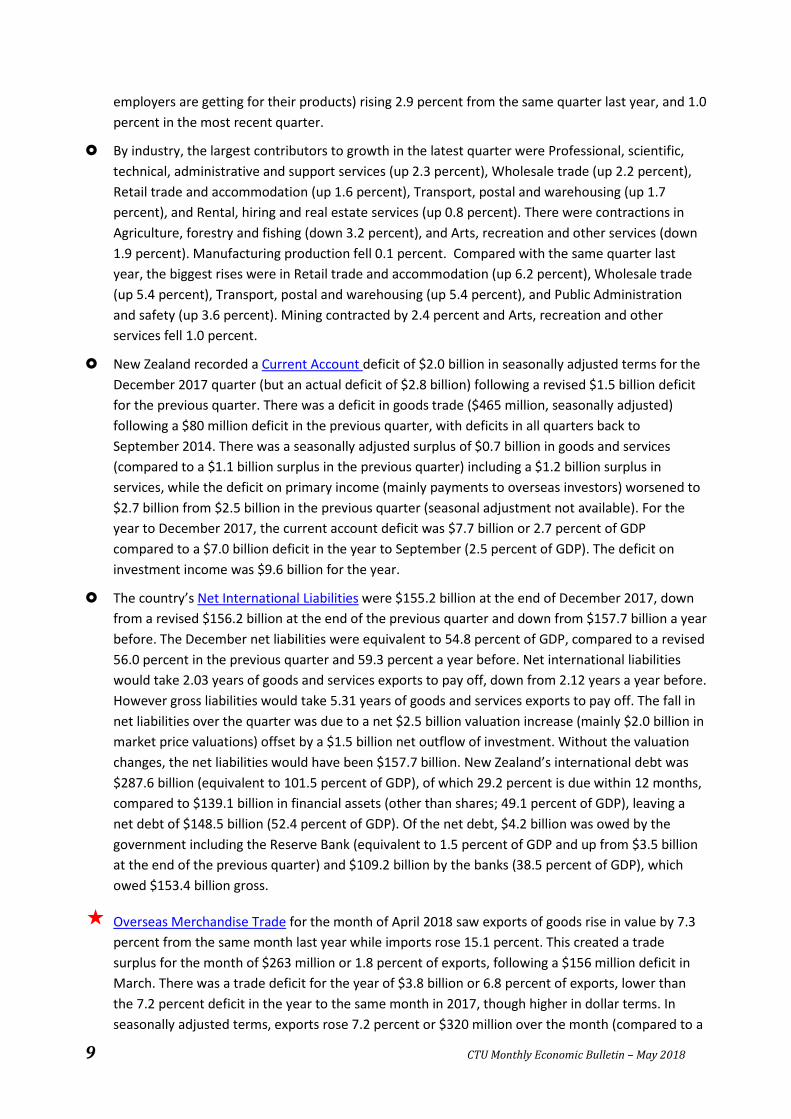
Growth in New Zealand’s measured economy in the three months to December 2017 was similar to Treasury and Reserve Bank forecasts, with Gross Domestic Product rising by 0.6 percent, the same as in the previous quarter. Average growth for the year ended December 2017 was 2.9 percent (and 2.7 percent compared to the same quarter last year). However growth in GDP per person continues to be weak with a rapidly growing population: GDP per person rose only 0.1 percent in the December quarter (down marginally from 0.2 percent the previous quarter), and 0.7 percent over the year, though the revisions to GDP estimates (see note to the right), has raised estimates for previous years – for example 1.8 percent in 2016. Nonetheless, GDP per person has been increasing at far below the rate in the 2000s when GDP per person was increasing at an average 2.3 percent a year. Since 2011 it has averaged 1.5 percent per year. Real gross national disposable income per capita, which takes into account the income that goes to overseas investors, transfers (such as insurance claims) and the change in prices for our exports and imports, grew somewhat more strongly: it rose by 0.9 percent over the quarter and 1.3 percent over the year to December.
I estimate1 that labour productivity measured by production per hour worked in the economy was little changed in the year to December (up just 0.1 percent) compared to the same period a year ago, continuing weak labour productivity growth which is bad for future wage growth. It is little different in December 2017 than it was in December 2012. Statistics New Zealand’s official productivity statistics for the year to March 2017 are summarised below.
Business investment rose by 3.7 percent compared to the previous quarter driven mainly by construction of Non-residential buildings, Plant, machinery and equipment, and Transport equipment. Growth compared to the same quarter last year was strong at 6.6 percent, driven by Plant, machinery and equipment, Transport equipment and Intangible fixed assets. Investment in housing rose 0.5 percent in the quarter following a 3.0 percent rise and 0.6 percent fall in the previous two quarters. It grew only 1.3 percent over the same quarter last year. Household consumption growth strengthened a little to 1.2 percent in the December quarter in real terms, after rising 1.0 percent in the previous quarter, and rose 4.3 percent over the same quarter in the previous year. Inflation in the economy as a whole is considerably higher than CPI, with the GDP deflator (a price index for expenditure on the economy’s production, reflecting largely the revenue
1 Because of the changes to the Household Labour Force Survey, there is a break in the hours-worked series in June. I estimated the increase for June 2016 using a recent Statistics New Zealand estimate that the changes in the survey created a jump in the series by 50,000 people or 2,550,000 actual hours worked per week: see Anand-Kumar, V., Penny, R., & Gordon, M. (2017). Investigation on the impact of the 2016 redevelopment on the Household Labour Force time series. Wellington, New Zealand: Statistics New Zealand, p.11. Available at http://on-cue.co.nz/Vinyak%20Anand-Kumar.pdf
Note that there have been major revisions of GDP estimates, largely affecting data since 2013, with significant effects in 2016 and 2017. The estimate of annual GDP growth in the year to March 2016 was raised by 1.2 percentage points (from 2.4 percent to 3.6 percent) and in the year to March 2017 by 0.8 percentage points (from 2.9 percent to 2.7 percent).
9 CTU Monthly Economic Bulletin – May 2018
employers are getting for their products) rising 2.9 percent from the same quarter last year, and 1.0 percent in the most recent quarter.
By industry, the largest contributors to growth in the latest quarter were Professional, scientific, technical, administrative and support services (up 2.3 percent), Wholesale trade (up 2.2 percent), Retail trade and accommodation (up 1.6 percent), Transport, postal and warehousing (up 1.7 percent), and Rental, hiring and real estate services (up 0.8 percent). There were contractions in Agriculture, forestry and fishing (down 3.2 percent), and Arts, recreation and other services (down 1.9 percent). Manufacturing production fell 0.1 percent. Compared with the same quarter last year, the biggest rises were in Retail trade and accommodation (up 6.2 percent), Wholesale trade (up 5.4 percent), Transport, postal and warehousing (up 5.4 percent), and Public Administration and safety (up 3.6 percent). Mining contracted by 2.4 percent and Arts, recreation and other services fell 1.0 percent.
New Zealand recorded a Current Account deficit of $2.0 billion in seasonally adjusted terms for the December 2017 quarter (but an actual deficit of $2.8 billion) following a revised $1.5 billion deficit for the previous quarter. There was a deficit in goods trade ($465 million, seasonally adjusted) following a $80 million deficit in the previous quarter, with deficits in all quarters back to September 2014. There was a seasonally adjusted surplus of $0.7 billion in goods and services (compared to a $1.1 billion surplus in the previous quarter) including a $1.2 billion surplus in services, while the deficit on primary income (mainly payments to overseas investors) worsened to $2.7 billion from $2.5 billion in the previous quarter (seasonal adjustment not available). For the year to December 2017, the current account deficit was $7.7 billion or 2.7 percent of GDP compared to a $7.0 billion deficit in the year to September (2.5 percent of GDP). The deficit on investment income was $9.6 billion for the year.
The country’s Net International Liabilities were $155.2 billion at the end of December 2017, down from a revised $156.2 billion at the end of the previous quarter and down from $157.7 billion a year before. The December net liabilities were equivalent to 54.8 percent of GDP, compared to a revised 56.0 percent in the previous quarter and 59.3 percent a year before. Net international liabilities would take 2.03 years of goods and services exports to pay off, down from 2.12 years a year before. However gross liabilities would take 5.31 years of goods and services exports to pay off. The fall in net liabilities over the quarter was due to a net $2.5 billion valuation increase (mainly $2.0 billion in market price valuations) offset by a $1.5 billion net outflow of investment. Without the valuation changes, the net liabilities would have been $157.7 billion. New Zealand’s international debt was $287.6 billion (equivalent to 101.5 percent of GDP), of which 29.2 percent is due within 12 months, compared to $139.1 billion in financial assets (other than shares; 49.1 percent of GDP), leaving a net debt of $148.5 billion (52.4 percent of GDP). Of the net debt, $4.2 billion was owed by the government including the Reserve Bank (equivalent to 1.5 percent of GDP and up from $3.5 billion at the end of the previous quarter) and $109.2 billion by the banks (38.5 percent of GDP), which owed $153.4 billion gross.
Overseas Merchandise Trade for the month of April 2018 saw exports of goods rise in value by 7.3 percent from the same month last year while imports rose 15.1 percent. This created a trade surplus for the month of $263 million or 1.8 percent of exports, following a $156 million deficit in March. There was a trade deficit for the year of $3.8 billion or 6.8 percent of exports, lower than the 7.2 percent deficit in the year to the same month in 2017, though higher in dollar terms. In seasonally adjusted terms, exports rose 7.2 percent or $320 million over the month (compared to a
10 CTU Monthly Economic Bulletin – May 2018
3.2 percent fall the previous month) led by rises in Meat (up 14.1 percent or $75 million), Fruit (up 28.3 percent or $69 million), Dairy (up 3.4 percent or $40 million) and Crude oil (up 16.8 percent or $6 million, not seasonally adjusted), offset by falls in Wine (down 11.6 percent or $18 million) and Logs, wood and wood articles (down 3.8 percent or $16 million). Seasonally adjusted imports rose 0.8 percent or $44 million over the previous month, creating a trade deficit of $428 million following a $705 million deficit in the previous month. The rising imports were led by Optical, medical and measuring equipment (up 2.5 percent or $3 million), while there were falls in Petroleum and products (down 4.1 percent or $27 million, not seasonally adjusted), Electrical machinery and equipment (down 3.1 percent or $13 million), and Textiles and textile articles (down 3.7 percent or $8 million, not seasonally adjusted). In the year to April, 23.0 percent of New Zealand’s exports went to China, 16.2 percent to Australia, 9.7 percent to the US, and 57.4 percent went to the top five countries buying New Zealand exports. This was up from 20.6 percent going to China in the year to April 2017, and 57.1 percent going to the top five destinations. Over the same period, 19.0 percent of New Zealand’s imports came from China (compared to 19.7 percent in the year to April 2017), 11.9 percent from Australia, 10.7 percent from the US, and 53.9 percent from the top five countries selling to New Zealand, compared to 55.5 percent a year before.
The Retail Trade Survey for the three months to March 2018 showed retail sales rose 3.0 percent by volume and 3.4 percent by value compared with the same quarter a year ago. They rose just 0.1 percent by volume and 0.2 percent by value in the quarter, seasonally adjusted. The fastest rises by seasonally adjusted value over the quarter were in Fuel (up 3.4 percent), Liquor (up 0.2 percent), Electrical and electronic goods (up 3.2 percent), and Furniture, floor coverings, houseware and textiles (up 2.8 percent). Supermarkets and grocery stores (easily the largest single category, with 21.8 percent of sales), rose 0.9 percent and its $45 million increase was over three-quarters of the total $58 million increase in retail sales. Sales fell in many areas led by Clothing, footwear, and accessories (down 5.1 percent), Recreational goods (down 3.7 percent), Motor vehicles and parts (down 1.1 percent), and Non-store and commission-based retailing (which includes online sales, down 1.0 percent). Notably, the increase in fuel prices was the major driver of the 3.4 percent increase in fuel sales: the volume of fuel sales fell 2.1 percent. On the other hand, prices in Non-store and commission-based retailing fell: despite the 1.0 percent fall in the value of sales, volume rose 0.8 percent in the quarter and 10.7 percent over the year.
The Performance of Manufacturing Index for April 2018 was 58.9, a sharp rise from 53.1 in the previous month. The employment sub-index was at 54.9, a rise from 53.4 in the previous month.
The Performance of Services Index for April 2018 was 55.9, a fall from 58.6 the previous month though still ahead of the 55.1 a month before. The employment sub-index was 51.4, up from 50.6 in the previous month.
On 10 May 2018 the Reserve Bank left the Official Cash Rate (OCR) at its record low of 1.75 percent. The new Governor of the Bank, Adrian Orr, made his mark by explaining why in plain language:
Tena koutou, katoa, welcome all.
The Official Cash Rate (OCR) will remain at 1.75 percent for some time to come. The direction of our next move is equally balanced, up or down. Only time and events will tell.
For these indexes, a figure under 50 indicates falling activity, above 50 indicates growing activity. Previous figures are often revised and may differ from those in a previous Bulletin.
11 CTU Monthly Economic Bulletin – May 2018
Economic growth and employment in New Zealand remain robust, near their sustainable levels. However, consumer price inflation remains below the 2 percent mid-point of our target due, in part, to recent low food and import price inflation, and subdued wage pressures.
The recent growth in demand has been delivered by an unprecedented increase in employment. The number of willing workers continues to rise, especially with more female and older workers choosing to participate. Likewise net immigration has added to the supply of labour, and the demand for goods, services, and accommodation.
Ahead, global economic growth is forecast to continue supporting demand for New Zealand’s products and services. Global inflation pressures are expected to rise but remain contained.
At home, ongoing spending and investment, by both households and government, is expected to support economic growth and employment demand. Business investment should also increase due to emerging capacity constraints.
However, he again expressed faith, as the Bank always does, that CPI will rise to its 2 percent target. “To best ensure this outcome, we expect to keep the OCR at this expansionary level for a considerable period of time. This is the best contribution we can make, at this moment, to maximising sustainable employment and maintaining low and stable inflation.” The phrase “maximising sustainable employment” is a reminder by the Bank that it now has this as an explicit objective in its agreement with the new Government. The Bank is currently wrestling with what the employment objective means in practice, and discussed it in the Monetary Policy Statement released at the same time. The next OCR announcement will be on 28 June 2018.
According to REINZ, over the year to April the national median house price rose $10,000 or 1.9 percent to $550,000 and REINZ’s house price index rose 3.8 percent. (The house price index adjusts for the type of house, such as its size and land area, and seasonal price patterns.) Over the month, the median price rose 0.7 percent seasonally adjusted while the house price index fell 0.1 percent. In Auckland over the year the median price was down $5,000 or 0.6 percent at $850,000 while the house price index rose 0.9 percent. Over the month, Auckland’s median price rose 0.4 percent seasonally adjusted, and the house price index fell 0.3 percent. Excluding Auckland, over the year the national median price rose $25,000 to $460,000 or 5.7 percent while the house price index rose 6.6 percent. Over the month the median price excluding Auckland was up 0.7 percent on the previous month seasonally adjusted, and the house price index rose 0.0 percent. There were record median prices in Manawatu-Whanganui (up 19.4 percent over the year to $305,000), Nelson (up 15.8 percent to $550,000) and Otago (up 19.5 percent to $460,000). Median prices fell over the year in Auckland (down 0.6 percent) and Canterbury (down 0.9 percent). Seasonally adjusted median prices fell over the month in Northland (down 0.4 percent), Waikato (down 1.4 percent) Gisborne (down 5.2 percent), Hawke’s Bay (down 3.2 percent), Wellington (down 1.4 percent), Canterbury (down 1.4 percent) and the West Coast (down 12.4 percent). Sales fell in five regions over the month, seasonally adjusted, while over the year, sales fell in four regions, averaging a rise of 6.6 percent.
12 CTU Monthly Economic Bulletin – May 2018
Employment
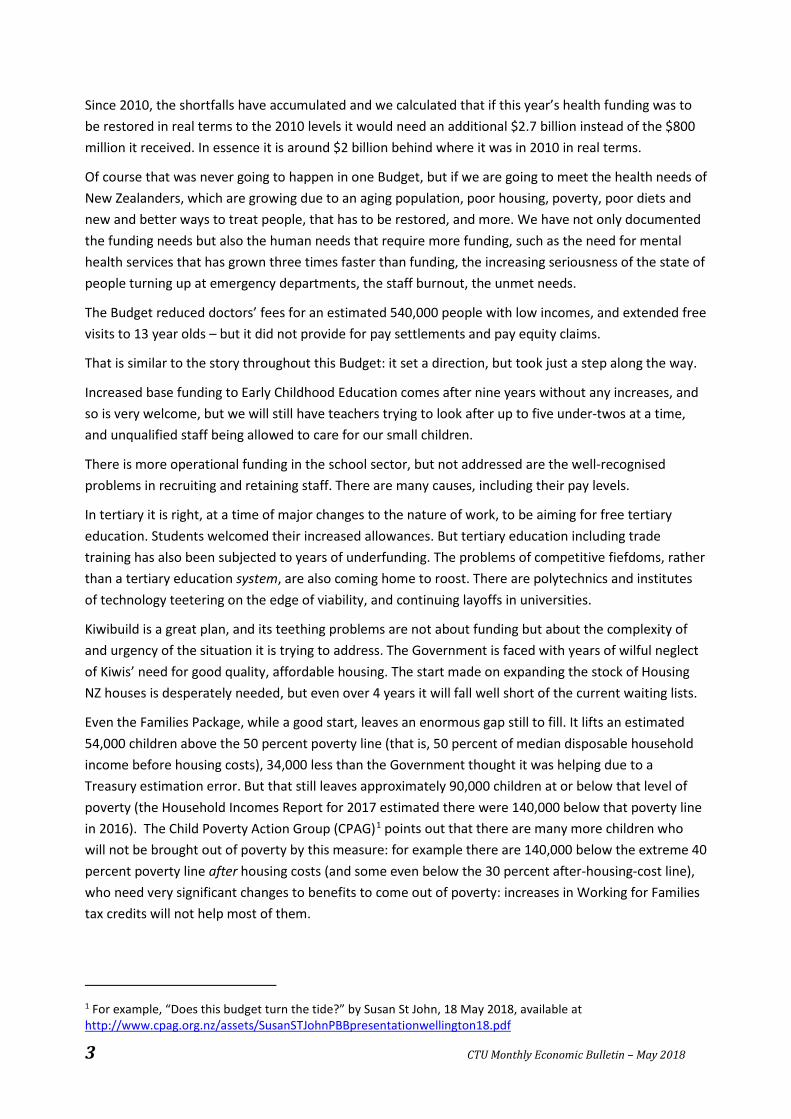
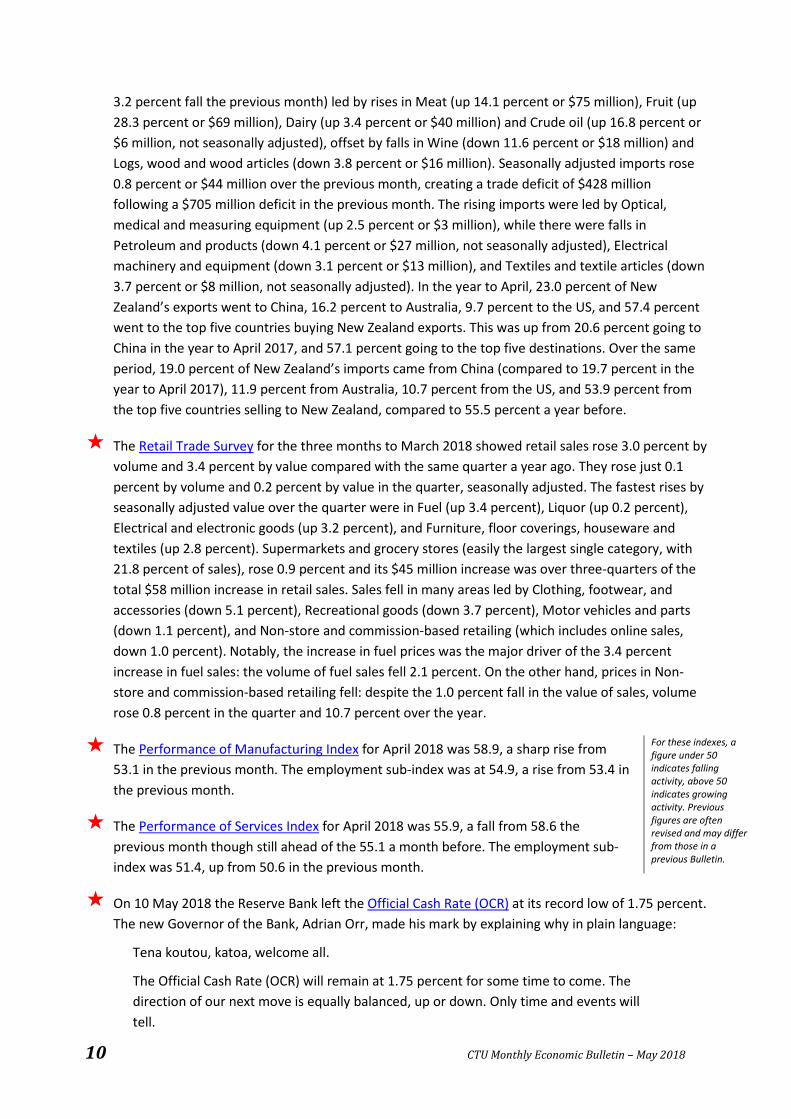
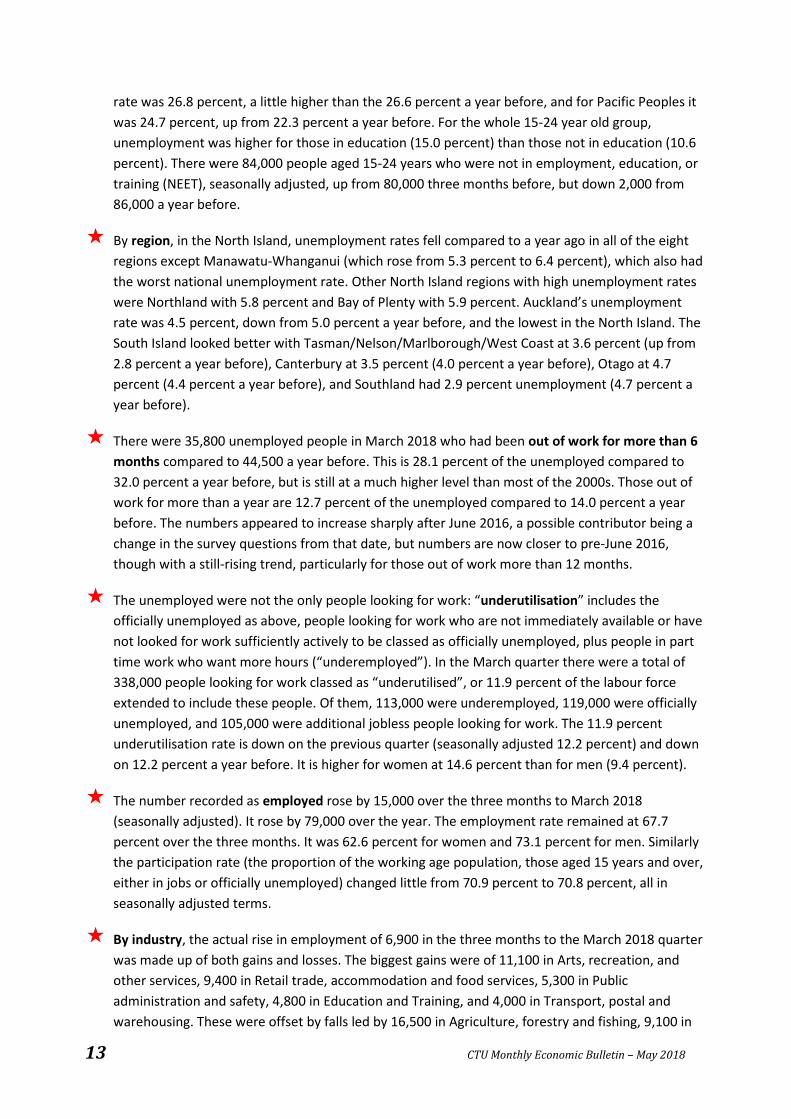
According to the Household Labour Force Survey (HLFS) the unemployment rate in the March 2018 quarter fell to 4.4 percent or 119,000 people, compared to 4.5 percent three months before (122,000 people), seasonally adjusted. If it were the 3.3 percent it was in December 2007, 29,000 more people would have jobs. The seasonally adjusted female unemployment rate fell to 4.9 percent from 5.0 percent three months before, but was still considerably higher than for men (3.9 percent) whose unemployment rate fell from 4.0 percent. Māori unemployment fell from 10.4 percent a year before to 9.6 percent in March 2018, while Pacific people’s unemployment fell from 11.0 percent to 8.3 percent over the year. Compared to OECD unemployment rates, New Zealand remained at 13th lowest (out of 35 countries). However New Zealand had the third-highest employment rate at 77.4 percent for 15-64 year olds.
Youth unemployment for 15-19 year olds was 19.2 percent in March, down from 20.3 percent three months before, and from 20.5 percent a year before (these and the other statistics for the whole youth population are seasonally adjusted, but those for Māori and for Pacific Peoples are not). For Māori 15-19 year olds in March 2018, the unemployment rate was 25.7 percent, up from 21.2 percent a year before. For 15-19 year old Pacific Peoples it was 16.9 percent, almost halved from 32.8 percent a year before. For 20-24 year olds, youth unemployment was 8.1 percent, down from 8.6 percent three months before, and from 8.7 percent a year before. For Māori 20-24 year olds in March 2018 the unemployment rate was 12.9 percent, a fall from 13.4 percent a year before. For 20-24 year old Pacific Peoples it was 14.2 percent, up from 13.0 percent a year before. The proportion of 15-19 year olds “not in employment, education, or training” (the NEET rate) was 10.1 percent, up from 8.6 percent three months before but down slightly from 10.3 percent a year before. For Māori 15-19 year olds in March 2018 the rate was 16.4 percent, down from 16.8 percent a year before and for Pacific Peoples it was 14.1 percent, down from 17.1 percent a year before. For 20-24 year olds the NEET rate in March was 14.6 percent, down from 14.8 percent three months before and from 15.0 percent a year before. For Māori 20-24 year olds in March the
-2,000
-1,500
-1,000
-500
0
500
1,000
1,500
4.4
4.6
4.8
5.0
5.2
5.4
5.6
5.8
Mar-15 Mar-16 Mar-17 Mar-18
Num
ber o
f Peo
ple
Dep
artin
g
Perc
enta
ge U
nem
ploy
ed
Unemployment Net Quarterly Departures to Australia
13 CTU Monthly Economic Bulletin – May 2018
rate was 26.8 percent, a little higher than the 26.6 percent a year before, and for Pacific Peoples it was 24.7 percent, up from 22.3 percent a year before. For the whole 15-24 year old group, unemployment was higher for those in education (15.0 percent) than those not in education (10.6 percent). There were 84,000 people aged 15-24 years who were not in employment, education, or training (NEET), seasonally adjusted, up from 80,000 three months before, but down 2,000 from 86,000 a year before.
By region, in the North Island, unemployment rates fell compared to a year ago in all of the eight regions except Manawatu-Whanganui (which rose from 5.3 percent to 6.4 percent), which also had the worst national unemployment rate. Other North Island regions with high unemployment rates were Northland with 5.8 percent and Bay of Plenty with 5.9 percent. Auckland’s unemployment rate was 4.5 percent, down from 5.0 percent a year before, and the lowest in the North Island. The South Island looked better with Tasman/Nelson/Marlborough/West Coast at 3.6 percent (up from 2.8 percent a year before), Canterbury at 3.5 percent (4.0 percent a year before), Otago at 4.7 percent (4.4 percent a year before), and Southland had 2.9 percent unemployment (4.7 percent a year before).
There were 35,800 unemployed people in March 2018 who had been out of work for more than 6 months compared to 44,500 a year before. This is 28.1 percent of the unemployed compared to 32.0 percent a year before, but is still at a much higher level than most of the 2000s. Those out of work for more than a year are 12.7 percent of the unemployed compared to 14.0 percent a year before. The numbers appeared to increase sharply after June 2016, a possible contributor being a change in the survey questions from that date, but numbers are now closer to pre-June 2016, though with a still-rising trend, particularly for those out of work more than 12 months.
The unemployed were not the only people looking for work: “underutilisation” includes the officially unemployed as above, people looking for work who are not immediately available or have not looked for work sufficiently actively to be classed as officially unemployed, plus people in part time work who want more hours (“underemployed”). In the March quarter there were a total of 338,000 people looking for work classed as “underutilised”, or 11.9 percent of the labour force extended to include these people. Of them, 113,000 were underemployed, 119,000 were officially unemployed, and 105,000 were additional jobless people looking for work. The 11.9 percent underutilisation rate is down on the previous quarter (seasonally adjusted 12.2 percent) and down on 12.2 percent a year before. It is higher for women at 14.6 percent than for men (9.4 percent).
The number recorded as employed rose by 15,000 over the three months to March 2018 (seasonally adjusted). It rose by 79,000 over the year. The employment rate remained at 67.7 percent over the three months. It was 62.6 percent for women and 73.1 percent for men. Similarly the participation rate (the proportion of the working age population, those aged 15 years and over, either in jobs or officially unemployed) changed little from 70.9 percent to 70.8 percent, all in seasonally adjusted terms.
By industry, the actual rise in employment of 6,900 in the three months to the March 2018 quarter was made up of both gains and losses. The biggest gains were of 11,100 in Arts, recreation, and other services, 9,400 in Retail trade, accommodation and food services, 5,300 in Public administration and safety, 4,800 in Education and Training, and 4,000 in Transport, postal and warehousing. These were offset by falls led by 16,500 in Agriculture, forestry and fishing, 9,100 in
14 CTU Monthly Economic Bulletin – May 2018
Construction, and 6,700 in Wholesale Trade. These are not seasonally adjusted. Over the year, the biggest contributors to the 79,400 additional jobs were 22,300 in Professional, scientific, technical, administrative, and support services, and 20,000 in Retail trade, accommodation and food services, offset by falls of 10,400 in Agriculture, forestry and fishing, 6,100 in Information media and telecommunications, and 3,300 in Wholesale trade.
In the March quarter, total union membership was estimated at 408,200, a 2.8 percent increase from 397,000 in the previous quarter and up 8.7 percent from 375,400 a year before. The membership is 19.1 percent of employees compared to 18.7 percent three months before and 18.1 percent a year before. Women make up 57.5 percent of the membership compared to them being 49.2 percent of all employees. As a result, the proportion of women employees who are in unions is higher than for men: 22.3 percent compared to 15.9 percent. The increase in numbers was greater for females (up 10.6 percent over the year) than males (up 6.2 percent) so the pay equity settlement is a strong factor (see the industry breakdown below), but not the only one. The rise was greatest in four age groups: 15-24 (up 11.4 percent in the year, 7.2 percent in the quarter), 25-34 (up 15.2 percent in year, 2.8 percent in quarter), 55-64 year olds (up 15.0 percent in year, 3.2 percent in quarter), and 65 years and over (up 12.3 percent in the year and 12.6 percent in the quarter, with female membership rising 34.4 percent in the year while male fell 11.9 percent). The other two age groups also rose over the year but by slower rates. By industry, the rises in both numbers and union density over the year to March were led by Health Care and Social Assistance (up 15,500 and density rising from 40.0 percent to 44.2 percent), Education and Training (up 8,600, density rising from 40.6 percent to 42.5 percent), Public Administration and Safety (up 4,800, density rising from 35.9 percent to 36.5 percent), Manufacturing (up 2,900, density rising from 20.2 percent to 21.9 percent), and Transport Postal and Warehousing (up 2,000, density rising from 28.0 percent to 28.6 percent). However numbers and density fell by small amounts (probably not statistically significant) in a number of industries. There may be seasonal variations in union membership which are not yet apparent, so quarterly comparisons may not represent annual trends.
In the March 2018 quarter, total collective employment agreement coverage was estimated at 406,200 employees, which makes 19.0 percent of employees who said their employment agreement was a collective compared to 18.4 percent three months before and 18.7 percent (387,800) a year before. An estimated 68.1 percent (1,457,300) said they were on an individual agreement compared to 67.8 percent three months before and 66.4 percent a year before, and 6.3 percent or 134,500 said they had no agreement (which is illegal), compared to 6.6 percent three months before and 7.4 percent a year before. A further 6.6 percent of employees didn’t know what kind of employment agreement they had. Coverage by collective agreement was 16.0 percent for men and 22.0 percent for women. The biggest rise in collective agreement membership was among 55-64 year olds – up 11.9 percent over the year, and 5.5 percent over the quarter. Those aged 65+ rose 9.7 percent in the year and 8.2 percent in the quarter. There was also a strong rise for 25-34 year olds – up 6.5 percent in the year and 7.9 percent in the quarter. Collective agreement membership grew in all age groups over the quarter and fell only for 35-44 year olds (by 2.2 percent) over the year. By industry, the largest rise was in Health Care and Social Assistance (up 12,700 for the year, or 16.1 percent), and there were also large rises in Education and Training (up 5,900 or 7.7 percent), Public Administration and Safety (up 4,200 or 8.7 percent), and Transport,
15 CTU Monthly Economic Bulletin – May 2018
Postal and Warehousing (up 3,500 or 14.8 percent). As with union membership, numbers and density fell by small amounts (probably not statistically significant) in a number of industries.
By employment relationship, in the March 2018 quarter, 90.2 percent of employees (1,930,500) reported they were permanent, 5.3 percent casual (112,600), 2.4 percent fixed term (50,800), 1.2 percent seasonal (25,600), and 0.4 percent employed through a “temporary agency” (7,800). The proportion reporting they were permanent was up from 89.8 percent (1,906,500) three months before and from 90.0 percent (1,862,800) a year before. Women were slightly less likely to be permanent employees: 89.4 percent of women were permanent compared to 90.9 percent of men. Instead, women were more likely to be casual (5.9 percent of them compared to 4.6 percent of men) or fixed term (2.9 percent of women compared to 1.9 percent of men). However more men were in seasonal work than women – 1.5 percent of men compared to 0.8 percent of women. Of the temp agency employees, 3,000 were men and 4,800 women. Employment relationships may have seasonal variations, so we should be cautious about seeing trends in quarterly comparisons. In addition, small differences may not be statistically significant.
By duration of employment (job tenure), in the March 2018 quarter, 24.2 percent of those in the labour force (including the self-employed) had been in their jobs for less than a year. Another 32.9 percent had been in their job for at least a year but less than five years, so a majority had been in their jobs less than five years. A further 16.5 percent had been in their job for at least five but less than ten years, and 25.6 percent had been in their jobs for 10 years or more. Women appeared to be somewhat more likely to have been in their jobs for a shorter time than men. For example, 26.9 percent of men had been in their jobs for more than 10 years, but only 24.0 percent of women. Age is a significant factor as would be expected: 55.3 percent people aged 15 to 24 had been in their jobs for less than a year, and 31.6 percent of 25-34 year olds, but only 14.0 percent of 45-54 year olds and 10.2 percent of 55-64 year olds. Small differences may not be statistically significant.
The Ministry of Social Development reports that at the end of March 2018 there were 118,755 working age people on the Jobseeker benefit, 650 fewer than a year before and 4,286 fewer than three months before. At March, 63,048 were classified as ‘Work Ready’, and 55,707 were classified as ‘Health Condition or Disability’. A total of 273,387 were on ‘main’ benefits, 4,849 fewer than a year before, mainly due to 3,382 fewer on Sole Parent Support, and 16,401 fewer than three months earlier, mainly because over 8,900 left the Jobseeker Support Student Hardship benefit with the start of teaching in tertiary institutions. Of the 51,649 benefits cancelled during the three months to March, 21,945 or 42.5 percent of the people obtained work, 11.0 percent transferred to another benefit and 13.4 percent became full time students. A further 2,475 (4.8 percent) left on their 52 week reapplication or annual review. A total of 14,705 suffered sanctions, the majority (12,032) on a Jobseeker benefit. Of the total sanctioned, 44.5 percent were Māori, though 35.7 percent of working-age benefit recipients were Māori.
Job Vacancies Online for the three months to March 2018 showed the seasonally adjusted number of job vacancies rose by 3.5 percent in the quarter and rose 6.9 percent over the same quarter a year previously. All the following are seasonally adjusted. Over the quarter, vacancies in Auckland were up 1.7 percent, in Bay of Plenty up 4.4 percent, Canterbury up 1.3 percent, Gisborne/Hawke’s Bay up 3.3 percent, Manawatu-Whanganui/Taranaki up 3.0 percent, Marlborough/NelsonTasman/ West Coast up 3.3 percent, Northland up 1.7 percent, Otago/Southland up 5.0 percent, Waikato up 5.8 percent and Wellington up 0.2 percent. By industry, Accounting was up 2.0 percent,
16 CTU Monthly Economic Bulletin – May 2018
Construction rose 1.4 percent, Education rose 0.6 percent, Health rose 4.0 percent, Hospitality rose 2.4 percent, IT rose 5.8 percent, Manufacturing rose 2.0 percent, Primary was unchanged, Sales rose 2.8 percent, and Other fell 5.2 percent. By occupation, Manager vacancies rose 2.5 percent, Professionals rose 4.0 percent, Technicians and Trades rose 1.5 percent, Community and Personal Services rose 6.5 percent, Clerical and Administration rose 1.5 percent, Sales rose 3.3 percent, Machinery Drivers rose 1.3 percent, and Labourers rose 15.1 percent.
International Travel and Migration statistics showed 10,500 permanent and long-term arrivals to New Zealand in April 2018 and 5,570 departures in seasonally adjusted terms, a net gain of 4,930 which was down 450 on the previous month. There was a seasonally adjusted net loss to Australia of 260, compared to a loss of 90 a year before. It was made up of a net loss of 550 New Zealand citizens offset by a net gain of 290 citizens of other countries. There was an actual net gain of 67,038 migrants in the year to April, down from 71,885 in the year to April 2017. Net migration from Australia in the year was 162 departures, with 24,571 departures and 24,733 arrivals. However there was a net loss of 5,245 New Zealand citizens to Australia over the year and a net loss of 1,109 to all countries. In April, 10.8 percent of the arrivals had residence visas, 15.4 percent student visas, 36.5 percent work visas, and 5.3 percent visitors. A further 31.5 percent were New Zealand or Australian citizens.
17 CTU Monthly Economic Bulletin – May 2018
Wages and prices
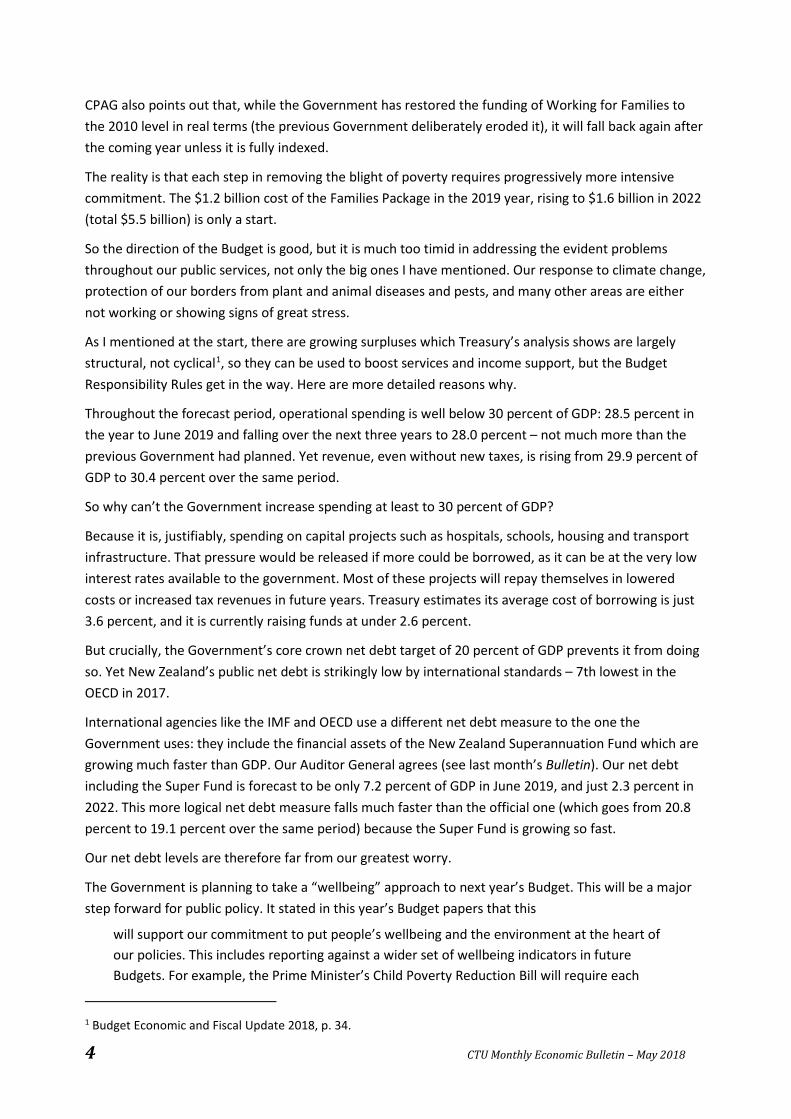
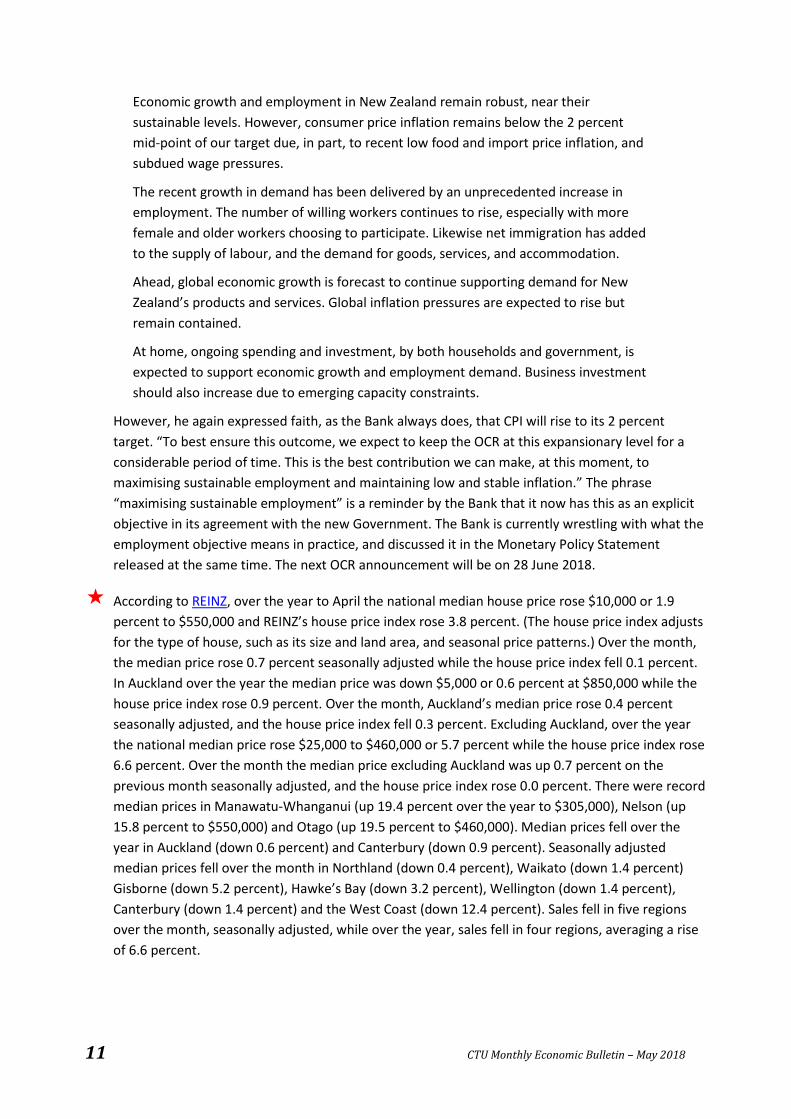
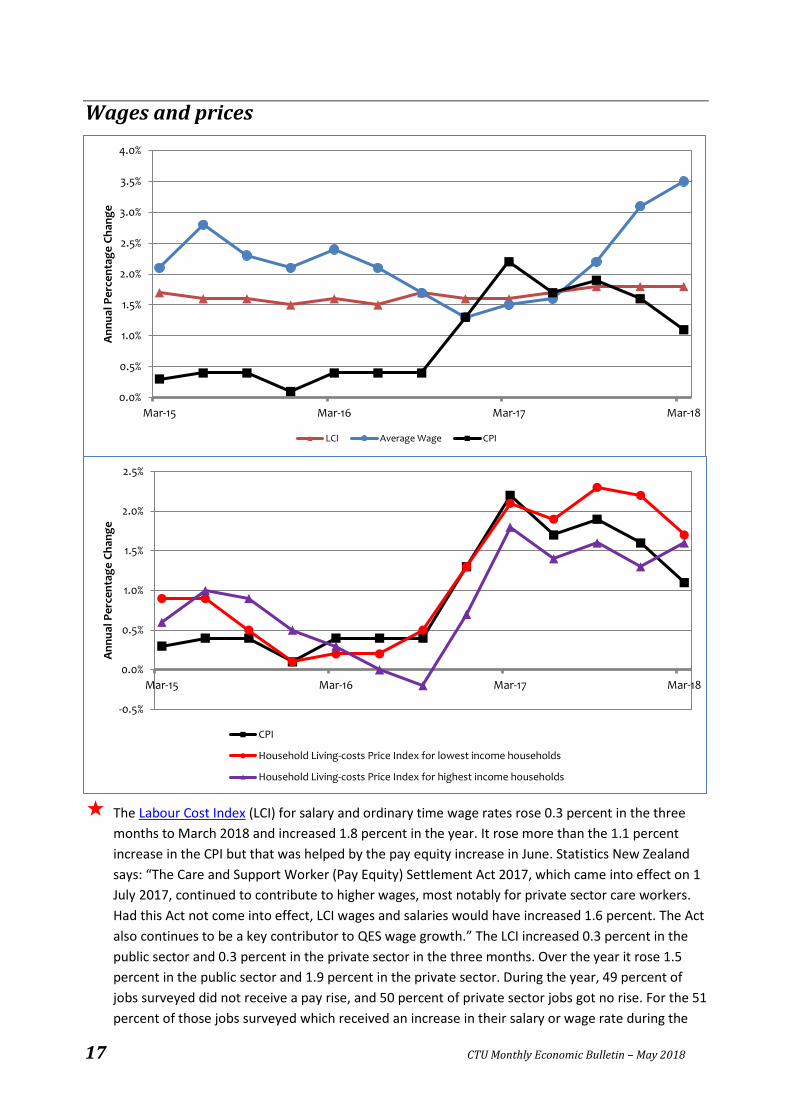
The Labour Cost Index (LCI) for salary and ordinary time wage rates rose 0.3 percent in the three months to March 2018 and increased 1.8 percent in the year. It rose more than the 1.1 percent increase in the CPI but that was helped by the pay equity increase in June. Statistics New Zealand says: “The Care and Support Worker (Pay Equity) Settlement Act 2017, which came into effect on 1 July 2017, continued to contribute to higher wages, most notably for private sector care workers. Had this Act not come into effect, LCI wages and salaries would have increased 1.6 percent. The Act also continues to be a key contributor to QES wage growth.” The LCI increased 0.3 percent in the public sector and 0.3 percent in the private sector in the three months. Over the year it rose 1.5 percent in the public sector and 1.9 percent in the private sector. During the year, 49 percent of jobs surveyed did not receive a pay rise, and 50 percent of private sector jobs got no rise. For the 51 percent of those jobs surveyed which received an increase in their salary or wage rate during the
0.0%
0.5%
1.0%
1.5%
2.0%
2.5%
3.0%
3.5%
4.0%
Mar-15 Mar-16 Mar-17 Mar-18
Ann
ual P
erce
ntag
e Ch
ange
LCI Average Wage CPI
-0.5%
0.0%
0.5%
1.0%
1.5%
2.0%
2.5%
Mar-15 Mar-16 Mar-17 Mar-18
Ann
ual P
erce
ntag
e Ch
ange
CPI
Household Living-costs Price Index for lowest income households
Household Living-costs Price Index for highest income households
18 CTU Monthly Economic Bulletin – May 2018
year, the median increase was 2.5 percent and the average increase was 3.6 percent. For those jobs in the public sector that received increases, the median increase was 2.0 percent and in the private sector 2.5 percent; the average increase in the public sector was 2.5 percent and in the private sector 3.9 percent. We estimate that over the year, jobs on collective employment agreements were 2.2 times as likely to get a pay rise as those which were not, and were more likely to get a pay rise of any size ranging from less than 2 percent to 5 percent, but somewhat less likely to get one over 5 percent. Only 44 percent of jobs that were not on a collective got a pay rise during the year whereas the Centre for Labour, Employment and Work reports 99 percent of those on a collective stating pay rates got a pay rise in the year to June 2017.
The Quarterly Employment Survey for the three months to March 2017 found the average hourly wage for ordinary-time work was $30.96, up 0.9 percent on the previous quarter and up 3.5 percent over the year, significantly more than the 1.1 percent rise in the CPI. Female workers (at $28.85) earned 11.9 percent less than male workers (at $32.74) for ordinary time hourly earnings. The average ordinary-time wage was $28.92 in the private sector (up 1.1 percent in the quarter and 4.0 percent in the year) and $39.25 in the public sector (up 1.0 percent in the quarter and 1.1 percent in the year). Average total hourly wages (including overtime) ranged from $19.64 in Accommodation and food services and $21.80 in Retail trade, to $44.30 in Finance and insurance services, and $40.64 in Information, media and telecommunications. In Accommodation and food services, 56.6 percent of employee jobs were part time, and in Health care and social assistance 42.6 percent were part time; in Retail trade 40.7 percent were part time; 35.7 percent were also part time in Arts, recreation and other services, 24.8 percent in Professional, scientific, technical, administration and support services, and 23.7 percent in Education and training. Together these six industries made up 81.0 percent of all part time work. (However the QES does not include agriculture or fishing and excludes very small businesses.)
The Consumer Price Index (CPI) rose 0.5 percent in the March 2018 quarter compared with the December 2017 quarter. It also rose 0.5 percent in seasonally adjusted terms. It increased 1.1 percent for the year to March. For the quarter, the largest single upward influence was Alcoholic beverages and tobacco (up 4.3 percent due to the annual rise in taxes on tobacco) contributing over half – 58.8 percent – of the rise. Next was Housing and household utilities contributing 28.8 of the total rise, and up 0.6 percent (mainly due to rent rises), followed by Food making up 19.7 percent of the rise (up 0.5 percent), driven mainly by Fruit rising 7.6 percent. Transport on average fell 0.2 percent, after a big rise in the December quarter, but it was a mixed bag: new vehicle prices went up 2.7 percent, contributing 23.9 percent of total CPI rise, and similarly Petrol rose 2.7 %, making 22.6 percent to the CPI rise. However International air transport fell 14.4 percent, subtracting 57.4 percent from the CPI rise, so the effect of the Transport group as a whole was almost neutral, reducing the CPI by 6.6 percent. Over the year, Housing and household utilities were easily the biggest driver in the rise, up 3.1 percent and contributing almost two-thirds (65.4 percent) of the CPI increase with new housing up 4.7 percent, rents up 2.1 percent, and all the other subgroups rising faster than overall CPI: Property maintenance up 4.4 percent, Property rates and services up 3.0 percent and Household energy up 2.7 percent. The next largest contributor to the CPI rise was Alcoholic beverages and tobacco (up 4.5 percent, making up 27.0 percent of the CPI rise), while the Miscellaneous group contributed another 16.0 percent mainly due to insurance rising 5.1 percent (with house insurance up 14.9 percent), but Real estate services, which rose 4.7 percent, contributed too. Rents rose fastest in Wellington but fell in Canterbury; new house prices
19 CTU Monthly Economic Bulletin – May 2018
rose fastest in Auckland, and slowest in Canterbury. Not part of the CPI (though in the Household Living Cost Indexes) is Interest, which was still falling in March (down 0.2 percent in the quarter and 1.1 percent over the year) though the fall is slowing. In seasonally adjusted terms, the CPI rose 0.5 percent over the last three months, Food fell 0.6 percent, Alcoholic beverages and tobacco rose 1.3 percent, Clothing and footwear rose 0.3 percent, Housing and household utilities rose 0.8 percent, Communications fell 0.8 percent, Recreation and culture rose 0.8 percent, and Education fell 6.7 percent (under the influence of free first year tertiary fees). Over the year, in Auckland consumer prices fell 0.6 percent, Wellington rose 0.5 percent and they fell 1.1 percent in the North Island other than Auckland and Wellington. Inflation in Canterbury for the year was negative 0.1 percent but prices rose 0.9 percent in the rest of the South Island.
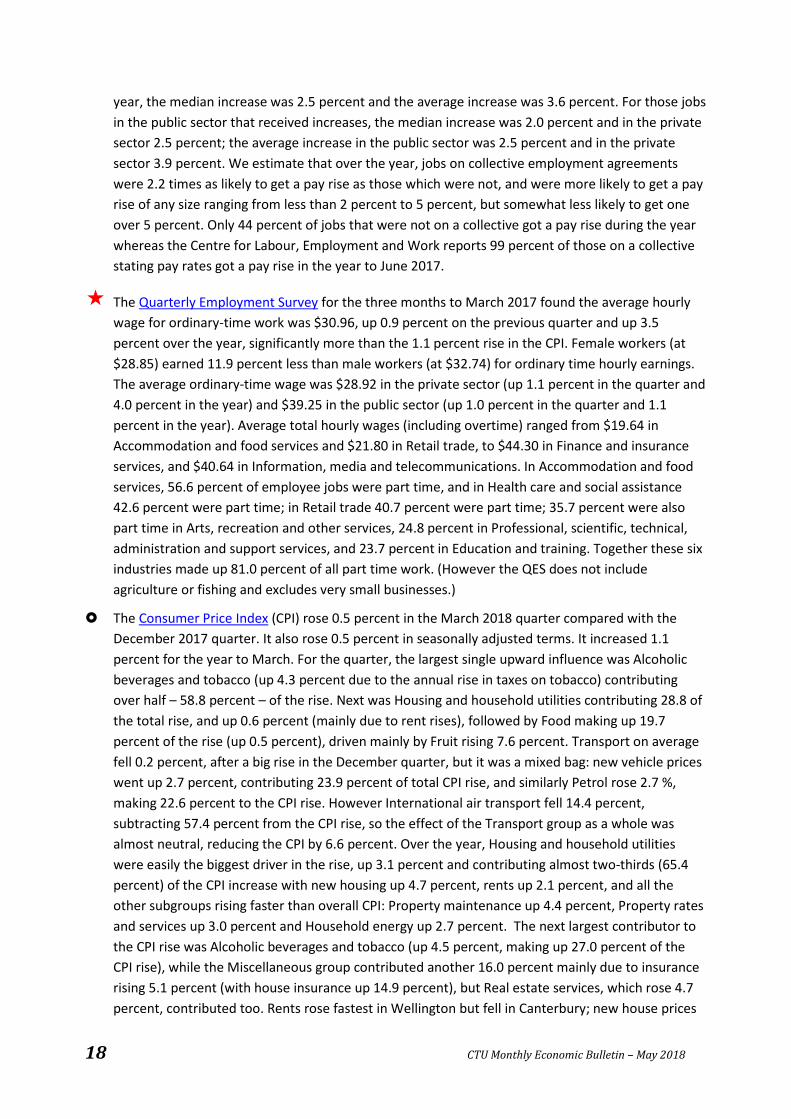
The Household Living-costs Price Indexes (HLPIs) for the year to March 2018 again showed lower income households experiencing faster price rises than higher income households over the year, though not in the latest three months. Lowest spending households saw their living costs rise 1.8 percent over the year while prices for the highest spending households rose only 1.4 percent. The difference occurs because they spend their money on different things. Prices for the necessities of housing and food dominate low income households’ spending: 54.5 percent of the expenditure of the lowest income one-fifth (quintile) of households went on Food and Housing and household utilities in 2018, compared to being only 32.7 percent of the expenditure of the highest income one-fifth. Over the year, the All households HLPI index rose 1.7 percent, the Beneficiary households index rose 1.9 percent, the Māori households index rose 2.0 percent, and the Superannuitant households index rose 1.8 percent. By income quintile, the index for the lowest income households (quintile 1) rose 1.7 percent, quintile 2 rose 1.7 percent, quintile 3 rose 1.7 percent, quintile 4 rose 1.8 percent, and quintile 5 (the highest incomes) rose 1.6 percent. By expenditure quintile, the index for the lowest expenditure households (quintile 1) rose 1.8 percent, quintile 2 rose 1.8 percent, quintile 3 rose 1.8 percent, quintile 4 rose 1.5 percent, and quintile 5 rose 1.4 percent. Over the March quarter, the All households HLPI index rose 0.8 percent, the Beneficiary households index rose 1.0 percent, the Māori households index rose 1.3 percent, and the Superannuitant households index rose 0.6 percent. By income quintile, over the quarter the index for the lowest income households (quintile 1) rose 0.7 percent, quintile 2 rose 0.8 percent, quintile 3 rose 1.0 percent, quintile 4 rose 1.1 percent, and quintile 5 rose 0.9 percent. By expenditure quintile, the index for the lowest expenditure households (quintile 1) rose 0.8 percent, quintile 2 rose 0.9 percent, quintile 3 rose 1.0 percent, quintile 4 rose 0.8 percent, and quintile 5 rose 0.6 percent.
The Food Price Index rose 0.1 percent in the month of April 2018 (and also rose 0.1 percent in seasonally adjusted terms). Food prices rose 2.3 percent in the year to April 2018. Compared with the previous month, fruit and vegetable prices fell 0.9 percent (and were down 2.5 percent seasonally adjusted); meat, poultry, and fish fell 0.9 percent; grocery food prices rose 0.4 percent (and also rose 0.4 percent when seasonally adjusted); non-alcoholic beverage prices rose 1.1 percent; and restaurant meals and ready-to-eat food prices rose 0.6 percent. (There are no significant seasonal effects for the categories without a seasonal adjustment.)
HLPIs show price increases like the CPI (above) but are designed to be better at showing the costs faced by households, and to show the different costs faced by fourteen different types of households. See the commentary in the November 2016 Bulletin for more detail. Weights reflecting the proportion of different products bought by households were updated starting from the December 2017 release.
20 CTU Monthly Economic Bulletin – May 2018
Public Sector
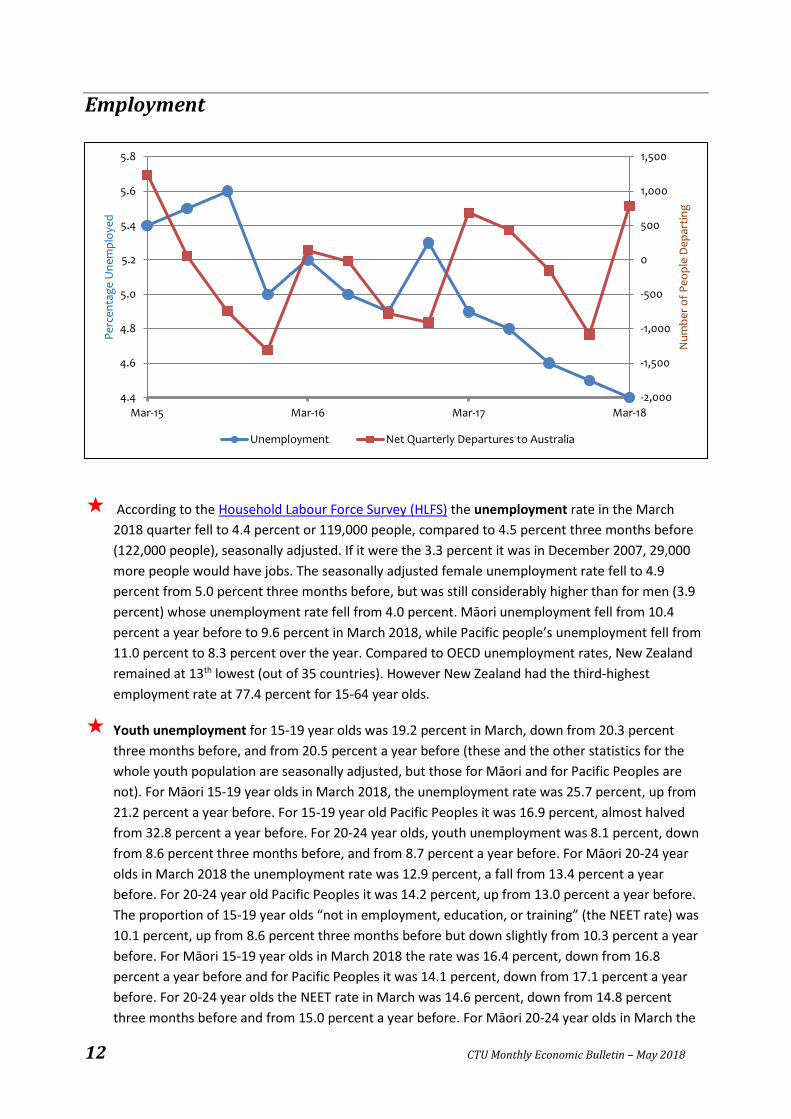
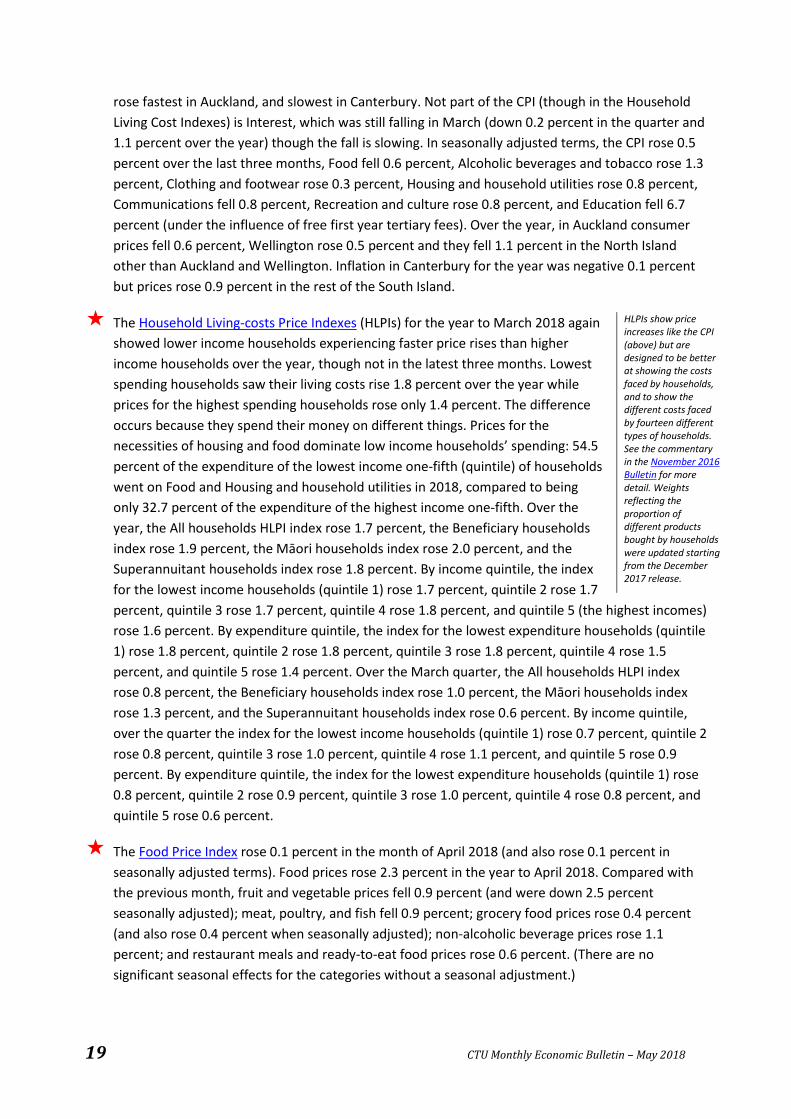
According to Treasury’s Financial Statements of the Government of New Zealand for the nine months to 31 March 2018, core Crown tax revenue was $1.1 billion (1.9 percent) higher than forecast in the 2017 Half-Year Economic and Fiscal Update (HYEFU 17). Corporate tax, GST, PAYE and customs and excise revenue were all ahead of forecast, respectively by $0.3 billion, $0.2 billion, $0.1 billion and $0.2 billion, and the $1.1 billion is expected to remain until the end of the financial year. Overall core Crown revenue was $1.2 billion or 1.9 percent higher than forecast. Core Crown expenses were just $72 million (0.1 percent) below forecast with $0.2 billion expenses converted to capital for roading, and impairment of student loans was $0.1 billion lower than expected. As a result, the Operating Balance before Gains and Losses (OBEGAL) was $0.9 billion better than
-180
-160
-140
-120
-100
-80
-60
-40
-20
0
Dec-14 Dec-15 Dec-16 Dec-17
NZ$
mill
ion
Local Government Operating Balance DHBs Operating Balance
-1,000
0
1,000
2,000
3,000
4,000
5,000
6,000
7,000
Jun-17 Jul-17 Aug-17 Sep-17 Oct-17 Nov-17 Dec-17 Jan-18 Feb-18 Mar-18 Apr-18 May-18 Jun-18
$NZ
mill
ion
Month of Financial Year
Financial position of the government
Operating Balance OBEGAL
21 CTU Monthly Economic Bulletin – May 2018
forecast, with a $3.3 billion surplus instead of the $2.4 billion forecast. However as usual there were substantial unforecast gains and losses, with net investment gains of $3.8 billion, $0.6 billion more than forecast, offset by a $1.8 billion increase in estimates of future liabilities ($1.4 billion more than forecast), mainly an increase of ACC’s claims liability due to changes in discount rates. “The Emissions Trading Scheme also recognised a loss of $0.5 billion due to an increase in carbon prices.” The result was that the Operating Balance was $80 million better than forecast with a $5.5 billion surplus. Net debt at 21.4 percent of GDP ($60.8 billion) was $2.2 billion lower than forecast. Gross debt at $87.7 billion (30.9 percent of GDP) was $2.4 billion more than forecast. The Crown’s net worth in financial terms was $34 million higher than forecast at $116.0 billion.
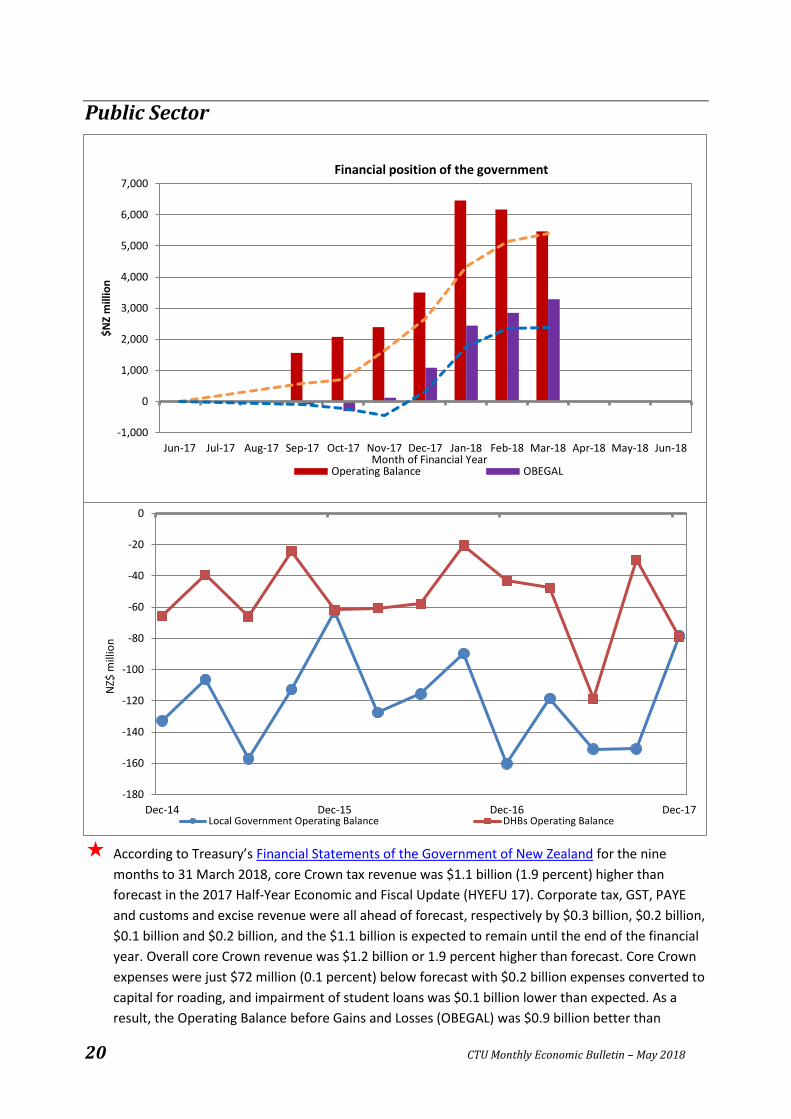
District Health Boards had 421 fewer full time equivalent staff than planned at the end of February 2018 (64,192 compared to 64,613 planned). Exceptions were Medical Personnel (doctors – 103 over plan) and Nursing (260 over plan), but there were shortfalls in Allied Health Personnel (465 short), Management/Administration staff (257 short), and Support Personnel (62 short). Average costs per full time equivalent staff were $500 below those planned ($94,800 compared to $95,300). The DHBs had accumulated combined deficits of $73.2 million in the eight months to February. This is $27.3 million worse than their plans. The Funder arms were in surplus by $89.6 million, $26.6 million more than the $63.0 million surplus planned, and Provider arms (largely their hospitals) in deficit by $168.0 million, $56.9 million worse than planned. The Northern region was $1.2 million behind plan with a surplus of $4.2 million and two of the four DHBs in deficit. The Midland region was $12.5 million behind plan with a deficit of $16.5 million and all of the five DHBs in deficit. Central region was $4.9 million behind plan, a combined $25.5 million deficit and all of the six DHBs in deficit. The Southern Region was $8.7 million behind plan with a $35.4 million deficit and three of the five DHBs in deficit, with Canterbury showing a $25.7 million deficit and Southern $9.7 million. In all, just four of the 20 DHBs were in surplus and just three were ahead of plan. The DHB furthest ahead of plan was Counties Manukau by $0.4 million, and Southern was furthest behind, by $4.9 million. Capital expenditure across all DHBs was behind plan with $225.3 million spent out of $365.0 million planned.
Local Government in the December 2017 quarter recorded a 3.5 percent ($85.2 million) increase in operating income in seasonally adjusted terms and a 0.5 percent rise in operating expenditure ($12.6 million) including a 0.8 percent fall in employee costs (down $4.6 million) compared to the previous quarter. This resulted in an operating deficit of $78.1 million in the quarter, compared with a deficit of $150.7 million in the previous quarter, and deficits in all the quarters back to June 2007 with the exception of June 2010. Note that the latest quarter results are provisional and seasonally adjusted figures are revised with each release.
Notes This bulletin is available online at http://www.union.org.nz/economicbulletin200.
For further information contact Bill Rosenberg.