
wiiw Background Study: How to Stabilise the Economy of Ukraine · Background Study How to Stabilise...
100
15 APRIL 2015 Background Study How to Stabilise the Economy of Ukraine Amat Adarov, Vasily Astrov, Peter Havlik, Gábor Hunya, Michael Landesmann and Leon Podkaminer The Vienna Institute for International Economic Studies Wiener Institut für Internationale Wirtschaftsvergleiche
Transcript of wiiw Background Study: How to Stabilise the Economy of Ukraine · Background Study How to Stabilise...

15 APRIL 2015
Background Study
How to Stabilise the Economy of Ukraine Amat Adarov, Vasily Astrov, Peter Havlik, Gábor Hunya, Michael Landesmann and Leon Podkaminer
The Vienna Institute for International Economic Studies Wiener Institut für Internationale Wirtschaftsvergleiche

How to Stabilise the Economy of Ukraine FINAL REPORT, APRIL 2015 With contributions by AMAT ADAROV VASILY ASTROV PETER HAVLIK GÁBOR HUNYA MICHAEL LANDESMANN LEON PODKAMINER and statistical support of Alexandra Bykova, Roman Römisch and Galina Vasaros
We gratefully acknowledge the financial support for this report by the Austrian Central Bank, Bertelsmann Stiftung, DER-th ink tank, ING Bank NV, Porsche Holding Gesellschaft m.b.H, Raiffeisen Bank International AG and United Europe.
The opinions expressed are those of the authors only and do not represent any official position of the financing institutions.
The Vienna Institute for International Economic Studies (wiiw)

CONTENTS
Executive summary ................................................................................................................................................... 1
Introduction ................................................................................................................................................................. 6
1. Political background: conflict unfolding ........................................................................................... 8
2. Macroeconomic situation and stabilisation challenges ........................................................... 10
Real economy: deepening recession ........................................................................................................10
Economic losses due to war in Donbas and secession of Crimea ...........................................................12
Flexible exchange rate a big disappointment ...........................................................................................15
Fiscal policy: defence spending offsets IMF-imposed austerity................................................................18
Policy recommendations ...........................................................................................................................21
3. Poland’s past does not provide easy prescriptions applicable to Ukraine ....................... 24
Initial conditions seemed to favor Ukraine materially................................................................................24
Another “shock therapy” for Ukraine? .......................................................................................................25
The deep non-economic roots of differential performance .......................................................................30
Lessons for Ukraine in 2015? ...................................................................................................................31
4. Ukraine’s foreign trade and related integration challenges ................................................... 32
Foreign trade specialisation: dichotomies between east and west ...........................................................33
Challenges of implementing the deep and comprehensive free trade area (DCFTA) with the EU...........39
Spectrum of trade integration options for Ukraine ....................................................................................44
What to do in order to limit the potential damage: policy implications ......................................................47
Conclusion ................................................................................................................................................52
5. An FDI policy for Ukraine........................................................................................................................ 54
Background conditions .............................................................................................................................54
FDI in Ukraine – facts and trends .............................................................................................................55
FDI regime in Ukraine ...............................................................................................................................60
FDI policy recommendations ....................................................................................................................61
6. Industrial and regional developments .............................................................................................. 64
Regional differentiation – production and export specialisation................................................................64
Regional and industrial developments – Industrial policy implications .....................................................68
References ................................................................................................................................................................... 74
Annex .............................................................................................................................................................................. 77
TABLES AND FIGURES
Table 1 / Ukraine: Selected Economic Indicators .................................................................................... 11
Table 2 / General government budget, 2013-2014 .................................................................................. 19
Table 3 / History of IMF lending arrangements to Ukraine ....................................................................... 28
Table 4 / Ukraine’s main export commodities by regions, USD mn and % of total, 2013 ........................ 37
Table 5 / FDI inflow, EUR million ............................................................................................................. 55
Table 6 / Relative size of FDI ................................................................................................................... 56
Table 7 / Ukraine: Inward FDI stock by economic activity, Total and Manufacturing,
NACE Rev. 2, in % .................................................................................................................. 57
Table 8 / Number and value of cross-border M&As, 2010-2013 cumulated ............................................ 58
Figure 1 / Weight of Crimea, Sevastopol and Donbas in Ukraine’s GDP and exports ............................. 13
Figure 2 / Gross regional product per capita in 2012, in EUR at PPP ..................................................... 14
Figure 3 / Nominal and real exchange rates, 2007-2015 ......................................................................... 16
Figure 4 / Current account in % of GDP, 1995-2014 ............................................................................... 16
Figure 5 / Per capita GDP (at current purchasing power parity) as percentage of EU-28 average,
1991-2013, Poland and Ukraine .............................................................................................. 25
Figure 6 / Poland’s GDP growth rate and unemployment rate, 1990-2014 ............................................. 27
Figure 7 / Top 20 trading partners of Ukraine, average 2003-2013 ......................................................... 33
Figure 8 / Share of the EU and Russia in total trade of Ukraine, 2003-2013 ........................................... 34
Figure 9 / Industrial composition of exports and imports of Ukraine, 2003-2013 average ....................... 35
Figure 10 / Commodity structure of Ukrainian foreign trade, 2013, in % ................................................. 36
Figure 11 / Top 15 most competitive industries of Ukraine, 2013 ............................................................ 38
Figure 12 / Destination of top 15 biggest export industries of Ukraine, 2013 ........................................... 39
Figure 13 / Exemptions from the Ukraine-EU AA/DCFTA proposed by Russia ....................................... 41
Figure 14 / FDI inflow in % of GDP .......................................................................................................... 55
Figure 15 / Inward FDI stock by economic activity, 2012 ......................................................................... 56
Figure 16 / Inward FDI stock by investing country, 2012 ......................................................................... 57
Figure 17 / Number of greenfield projects ................................................................................................ 58
Figure 18 / Value of greenfield projects, EUR million ............................................................................... 59
Figure 19 / Income per capita, regional GDP and sectoral value-added shares in 2012, in % ................ 64
Figure 20 / Relative sectoral specialisation of regions of Ukraine ............................................................ 65
Figure 21 / Regional composition of exports by destination, 2012 ........................................................... 66
Figure 22 / GDP growth convergence, index 1995=100, differences to EU-27 average, in pp................ 69
Box 1 / Estimating Ukraine’s external financing requirement for 2015 ..................................................... 18
Box 2 / What is the content of the EU-Ukraine DCFTA? .......................................................................... 42
Box 3 / Ukraine and DCFTA implementation – Fact sheet from the EU .................................................. 43

ANNEX
Annex Table 1 / Foreign trade by top twenty partners ..............................................................................77
Annex Table 2 / Trade by SITC commodity groups ..................................................................................78
Annex Table 3 / Balance of payments ......................................................................................................79
Annex Table 4 / Inward FDI stock by investing country, EUR million and % of total ................................80
Annex Table 5 / Number and value of greenfield projects 2003-2014......................................................81
Annex Table 6 / Specialisation of regions of Ukraine relative to country as a whole................................82
Annex Table 7 / Relative specialisation of regions of Ukraine – by employment .....................................83
Annex Table 8 / Exports of the regions of Ukraine to the regions of the world in 2012, in % ...................84
Annex Table 9 / Share of top 10 export products (at HS 2-digit level) by region in 2012, in % ................85
Annex Figure 1 / Business activity of greenfield projects, 2003-2014 ......................................................80
Annex Figure 2 / Number of greenfield projects by business activity .......................................................81

EXECUTIVE SUMMARY
1
Executive summary
In 2015, the military conflict in the Donbas region, the erosion of incomes on account of galloping
inflation and the unrelenting collapse of trade and investment will plunge Ukraine’s economy into deep
recession for the second year running. Even under the assumption that the current ceasefire holds, an
economic recovery can hardly be expected before 2017. Dismal recovery prospects, an ever-weakening
currency and massive fiscal deficits have translated into insolvency of the government. Negotiations
over restructuring of privately held sovereign external debt have been launched and are to be seen as
part of the new IMF ‘rescue’ package approved in March 2015.
Economic stabilisation and return to sustainable and inclusive economic growth will be impossible
without a resolution of the military conflict, which should be the first priority for the policy-makers.
Restoration of normal economic activities in the affected territories will also require massive public
investment, and the EU could potentially play a crucial role here – ideally by designing a sort of ‘Marshall
Plan’ for Ukraine. Under the crucial assumption that peace is restored, wiiw has elaborated a number of
policy recommendations which would be important to follow to reach the above goals.
› The current flexible exchange rate is clearly inappropriate to achieve macroeconomic stabilisation and
should be replaced with a more stable exchange rate regime, which could serve as a ‘nominal anchor’
of inflationary expectations. However, to ensure its credibility, the National Bank would need a fairly
high level of foreign exchange reserves, possibly requiring an extra USD 15-20 billion to this end.
› The currently implemented front-loaded energy tariff hikes are welcome per se, but will do little to
advance the badly needed improvements in energy efficiency, unless they are accompanied by
parallel subsidisation of energy-saving investments, such as the installation of heating metres and the
insulation of residential buildings. Such subsidisation should enjoy priority over fiscal consolidation
targets.
› A more balanced structure of government expenditures would require both more socially-oriented
spending and higher public investments which are crucial for long-term growth prospects. In addition,
preserving a welfare state could help preserve the badly needed public support for reforms. A shift in
the spending priorities would imply among other things less spending on the military and also a
substantially smaller burden of public debt service, possibly requiring larger debt ‘haircuts’ than those
on the negotiating table at the moment.
Despite some similarities, Poland’s past experience can be currently used by Ukraine only to a limited
degree: It is incorrect to assume that Poland’s successful transition has been due to some simple trick
(e.g. ‘shock therapy’) which could be easily replicated in Ukraine. The major Polish lesson is that
economic prosperity came as a result of deep reforms of the legal and constitutional system which
enjoyed broad support in society. In Poland, these reforms grew out of social and political conditions that
are yet to emerge and consolidate in Ukraine.

2 EXECUTIVE SUMMARY
It is widely acknowledged that the Ukrainian state has been captured by oligarchic interests which
engendered widespread corruption. Successive oligarchy-controlled governments have failed to institute
economic and institutional reforms (and of the state at large) in such a way as to create conditions
conducive to the emergence of a more or less viable competitive and dynamic market economy.
Arguably, as long as Ukraine is ruled by oligarchic interests, the chances of a successful major
institutional and legal overhaul seem low.
Nevertheless, the inescapable institutional transformation of Ukraine could greatly benefit from a well-
designed Western involvement, which could have several dimensions:
› Concerted efforts are necessary to strengthen non-violent civil society, independent media and non-
government organisations.
› The West should spare no effort in making transparent its disapproval of Ukraine’s ruling elites’ ways
of doing politics (and business), thus contributing towards a change of their behaviour. Financial and
material assistance should be rigidly tied to the progress on e.g. the legal system reforms (including
monitoring their implementation), the severance of relationships between business and politics, proper
taxation of oligarchic assets, and confiscation of illegally amassed wealth, including assets parked
abroad.
› In advocating specific economic policies, the West should be sensitive towards the social impact of
austerity or ‘shock’ therapies that could make life of ordinary Ukrainians even more miserable and
erode the necessary reform support.
The integration process of Ukraine has been obstructed by a lack of clear domestic strategy as well as
outside intervention. On the one hand, the implementation of the newly signed Association Agreement
(including a Deep and Comprehensive Free Trade Area – AA/DCFTA) with the EU, related trade
reorientation and competitiveness issues are among the most urgent challenges facing the Ukrainian
economy. On the other hand, existing trade and specialisation patterns are hampered by disrupted
relations with Russia: Despite the recent downturn, Russia is still Ukraine’s single most important export
partner, and its role as a source of imports is even more prominent (largely owing to energy). A number
of important export positions of Ukraine depend predominantly on the Russian market, and their
reorientation away from Russia will be difficult and costly. Trade disruptions with Russia affect above all
Ukraine’s machine-building sector located mostly in the eastern part of the country. Annual losses for
Ukraine from the break-up of economic relations with Russia are estimated at USD 33 billion; the
cumulated overall losses at USD 100 billion. Therefore, an – at least partial – restoration of trade
linkages with Russia and the Russia-led Eurasian Economic Union (EEU) should continue to be one of
Ukraine’s trade policy goals.
Ukraine’s position between the EU and the EEU and its nearly equal (yet asymmetric) dependence on
both markets puts forward a challenge to look beyond the current conflict situation and explore how to
maintain, expand and deepen its trade relations in both directions simultaneously. It is important for all
parties to recognise that the two integration directions are not in principle mutually exclusive. A balanced
trade policy could play an important role towards attracting investments and advancing modernisation.
Regarding trade policy we therefore suggest the following:

EXECUTIVE SUMMARY
3
› Macroeconomic stabilisation and the implementation of major institutional changes should be the
immediate primary concern. Given limited financial resources and administrative capabilities, it is
reasonable to consider a delay of the full implementation of the DCFTA and hence temporarily shield
the fragile domestic market from EU import competition, while still maintaining free-market access to
the EU and the CISFTA, as currently arranged.
› A long-run restructuring strategy concerning future areas of trade specialisation and competitiveness
in the global and regional contexts should be elaborated, taking into account the EU integration
challenges and opportunities. An industrial policy for the restructuring/conversion of sectors that are
not likely to withstand competitive pressures and/or the potential loss of traditional markets also needs
to be devised as an inherent part of the long-run economic development strategy.
› For industries that are sensitive to EU technical requirements and market liberalisation (machinery,
railways, chemicals, nuclear, and others) longer transition periods as regards approximation to the EU
regulations should be negotiated in order to ensure orderly adjustment to a more competitive market
environment.
› A more constructive stance should be taken by Ukraine and the EU with regard to Russia’s strategic
position and concerns expressed in relation to the AA/DCFTA effects. Trilateral negotiations focusing
on trade-related matters should be facilitated and decoupled to the extent possible from non-trade
issues to ensure practical dialogue.
› The objective of the trilateral negotiations should focus on the possibility of maintaining a preferential
trade regime for Ukraine under the CISFTA framework. While membership in the EEU, which involves
a customs union arrangement, is not compatible with the DCFTA, the CISFTA still remains a feasible
option allowing for an optimal consensus for the three parties concerned.
› Discussions concerning the feasibility, strategy and technical aspects of the hypothesised pan-
European-Eurasian free trade area ‘from Lisbon to Vladivostok’ should be launched and transformed
into a more consistent format, involving, besides the EU and Russia, other member states of the EEU
and the CISFTA, as well as the Eurasian Economic Commission.
FDI inflows – indispensable for economic restructuring and growth – have so far been meagre in
Ukraine, when controlling for round-tripping Ukrainian capital. This puts forward the challenge of
designing a business environment as well as specific FDI policies which are conducive towards reaching
these goals. Such policies can be based on revamping previous initiatives and regulations as well as on
existing recommendations by OECD and other international institutions.
Beyond improving the framework conditions which would make the country a less risky place for genuine
investors, four main lines of actions need to be implemented as a coherent package to attract more and
better FDI:
› Industrial/business parks can act as an incentive for attracting (foreign) investors, as they enable to
start operations in a rather short period of time and under good infrastructure and operational
conditions. Parks must provide clear ownership rights, good transport connections, abundant and
reliable energy and water supply, and need the support of the local/regional administration. Especially

4 EXECUTIVE SUMMARY
the unutilised industrial land of state-owned enterprises could be used in this way. Oblasts and
municipalities must have the legal authority and financial means to foster the establishment of such
parks. Special economic zones are specific forms of business parks to attract investments, at least in
a limited territory of the country. The government should initiate establishing special zones in border
regions with the aim to attract export-processing investments.
› Granting a transparent contractual regime by the government to the investors in large projects can
provide individually tailored packages of incentives. Contracts should guarantee investors’ access to
fair or even priority treatment by authorities in a transparent way.
› Promotion of FDI spillovers is necessary to upgrade the absorption capacity of the local economy.
Foreign-owned companies need support to create linkages with local companies, and local companies
need support to meet the standards to become suppliers to foreign multinationals. Support may not
necessarily mean a lot of money but care and communication on the part of authorities in fostering
cluster development.
› It is also necessary to revitalise the FDI agency InvestUkraine, preferably as an independent agency
reporting to the prime minister. There are several successful investment promotion agencies in the
new EU Member States, especially PAIiIZ in Poland and Czech Invest in the Czech Republic, which
may serve as examples and provide support to the Ukrainian agency. Regional investment agencies
in territorial-administrative units are necessary to help investors find the proper locations. This is
another reason why the competences and autonomy of oblasts and municipalities need to be
increased.
Industrial policy has to recognise the new situation emerging from the current conflict: The ‘industrial
heartland’ of Ukraine’s economy is mostly in the east, its trade and production links were traditionally
heavily dependent on Russia. This region has de facto been split into one part controlled by the
separatists, with the other part also strongly affected by disruptions of linkages and the impact of the
conflict on production and export activity.
The following would be the priorities for a successful industrial adjustment programme to the new
situation:
› In the eastern regions there was a long-term neglect of investment and of modernisation of product
programmes. Ownership is highly concentrated. This region will need the biggest support to facilitate a
change in production and trade links which the current situation requires. Private investment will not
easily be forthcoming unless major public support is given to invest into modernised transport
infrastructure to encourage new production and trade linkages, and open up market structures with a
properly functioning and decisive competition authority. It is unlikely that the challenge of new products
and changed market orientation could be met without a strong attempt to make the region – over the
medium run – attractive to FDI (see above).
› The western regions are less affected by the conflict but have traditionally been much less
industrialised and poorer. However, there is scope to encourage the development of a more diversified
economic structure on the basis of existing agricultural activity, food-processing, wood-based and
other light industries. In urban centres there is scope for a wider range of industrial and service

EXECUTIVE SUMMARY
5
activities. Cross-border production linkages with Central European economies should be encouraged;
these were drivers for the setting-up of successful export platforms in Central European transition
economies over the past 20 years. Black Sea regions have scope for tourism development as well as
for other forms of agrarian exports.
› Technical assistance and transitory periods under the DCFTA as well as other supports (EIB, EBRD,
etc.) should be used effectively to upgrade technical standards, improve energy efficiency, encourage
cooperation with foreign partners to obtain better market access and improve product programmes
and product quality to enhance export capacity.
› Investment into new and improved transport routes are essential to support market reorientation, the
necessary rebalancing of economic activity across Ukrainian regions and encourage new inter-
regional and cross-border production and trade linkages.
› Regional rebalancing, industrial modernisation and the problematic labour market situation require the
support and setting-up of new training and retraining institutions as well as introducing incentive
schemes to reduce out-migration and encourage return-migration of skilled young personnel.

6 INTRODUCTION
Introduction
The key reforms advancing Ukraine’s economic transition from a planned to a market economy –
macroeconomic stabilisation, price liberalisation and privatisation – were initiated already more than
twenty years ago after the Soviet Union collapsed and the country gained independence. For all
purposes, Ukraine can be now viewed as a market economy, albeit with distorted structure, vast
inefficiencies and dysfunctional institutions. The reforms have so far failed to lay the foundations for
sustainable economic growth, efficiency improvements and a marked improvement of living standards.
Currently, Ukraine’s GDP per capita is still only 65% of what it was on the eve of the break-up of the
Soviet Union. With EUR 6,500 at PPP, it corresponds to a mere 23% of the EU average, making Ukraine
the second poorest country in Europe (after Moldova and followed by Kosovo). On top of that, during the
past twenty years, Ukraine’s population has dropped by more than 5 million people, or about 10%. Thus,
it would be not an exaggeration to say that Ukraine’s development trajectory since its independence has
been a big disappointment.
Clearly, Ukraine is in need of new reforms which would be consistently implemented and conducive
towards reaching the goal of sustainable and inclusive long-term economic growth. Those will have to
take place in circumstances of possibly prolonged internal conflict or instability combined with a rather
strained macroeconomic situation, demanding institution-building and challenging conditions for trade
and investment. Crucially, reforms cannot be imposed from outside, but need a broad domestic
‘ownership’ – not only at the central government but also at the local levels and in the society as a
whole.
Recently there have been a number of economic reports on Ukraine, including by the IMF, the German
Advisory Group and the Atlantic Council, to name just a few.1 Nevertheless, a number of issues have
received relatively little attention so far, e.g. the role of the Russian market for Ukraine’s foreign trade or
the potentially negative repercussions of the IMF package on the economy. Also, the issue to what
extent Ukraine can draw on the earlier – both positive and negative – reform experiences of other
Central, East and Southeast European (CESEE) countries, including the Balkans and the former Soviet
republics, has remained largely unexplored so far.2
The present report is aimed at contributing to filling these gaps and is structured as follows. After
providing an overview of Ukraine’s current political and economic situation, it focuses on the analysis of
four important aspects of the economy/economic policy, with the aim to elaborate policy
recommendations based on the research findings. After presenting the political background in
Chapter 1, Chapter 2 gives an overview of Ukraine’s current macroeconomic developments and policy
recommendations for stabilisation. Chapter 3 analyses what – and whether at all – Ukraine could learn
from the experience of Poland, which is often seen as a clear ‘success story’ in its transition to the
market economy. Chapter 4 deals with foreign trade relations of Ukraine, which is ‘sandwiched’ between
1 wiiw published a study dealing with similar issues in 2010 – see Astrov et al. (2010). 2 Earlier experience of the Central and East European countries could be particularly useful – see Havlik, Landesmann
and Stehrer (2001), and Grinberg, Havlik and Havrylyshyn (2008).

INTRODUCTION
7
the EU and Russia and exhibits highly asymmetric patterns of trade in both directions. Based on the
analysis of trade specialisation patterns, it elaborates policy recommendations with respect to the
directions of integration which would be optimal for the country. Chapter 5 analyses the recent trends in
foreign direct investments (FDI) flows as well as applied FDI policy tools, and draws comparisons
between Ukraine, Poland and Romania in this respect. Finally, Chapter 6 deals in depth with the
structural and regional dimensions of the country’s industrial sector and outlines potential industrial
policy tools which could be applied to advance economic restructuring and modernisation.
8 POLITICAL BACKGROUND: CONFLICT UNFOLDING
1. Political background: conflict unfolding
In the West, the blame for the intra-Ukrainian conflict is usually attributed to Russia, particularly after the
Russian annexation of Crimea in March 2014 and its subsequent interventions in eastern Ukraine.
However, the responsibility for the dangerous escalation cannot be assigned solely to Russia: the
conflict’s history is much longer. The EU’s misguided handling of the Ukrainian crisis – preceded by the
ill-conceived Eastern Partnership (EaP) initiative which deliberately left out Russia – has also contributed
to the conflict.3
The tug of war between Russia and the EU over Ukraine escalated in the second half of 2013, prior to
the envisaged signature of the Association Agreement between Ukraine and the EU which included a
Deep and Comprehensive Free Trade Area (AA/DCFTA). During the summer of 2013, both Russia and
Ukraine were suddenly alerted by the potentially adverse economic consequences of AA/DCFTA
signature after details of the planned agreement became public. Russia responded with a set of counter-
measures, which included both ‘sticks’, such as imposing restrictions on imports from Ukraine and
threatening with more, and ‘carrots’, such as granting Ukraine an extensive financial package on highly
preferential terms and a gas price discount. The Russian moves proved partly effective: Ukraine’s
President Viktor Yanukovych announced the postponement of the AA/DCFTA signature just a few days
before the Vilnius EaP Summit in November 2013 – a decision that sparked the first wave of protests in
Ukraine. The rapid sequence of events that followed is well known: mass protests in Kyiv turning violent
in February 2014, the failed mediation attempts between the protestors and the Yanukovych government
(involving the foreign affairs ministers of France, Germany and Poland), the ousting of President
Yanukovych and his flight to Russia on the very next day, and the controversial establishment of the new
transitory government in Kyiv which was supported by the West but whose legitimacy was disputed in
the eastern parts of Ukraine and Crimea, let alone Russia.
One of the first steps of the post-Maidan parliament was the attempt to deprive the Russian language of
its official status in a number of Russian-speaking regions of eastern Ukraine and Crimea. Though the
respective bill was never signed by the then acting President Oleksandr Turchynov, it sufficed to trigger
mass protests in some of these regions, sparking the subsequent annexation of Crimea by Russia and
the internal conflict in mainland Ukraine. In contrast to Crimea, where the ‘re-unification’ with Russia
proceeded without major confrontation, the anti-Maidan protests in Donbas as well as in Odesa (in
southern Ukraine) turned violent, as the new government in Kyiv attempted to restore control over the
rebellious regions by force, involving both regular military troops and freelance fighters, mostly from
western Ukraine.
On 26 May 2014, Petro Poroshenko, an oligarch with business interests in food and media industries
who had already served as economics minister under President Yanukovych, was elected Ukraine’s
president with a convincing majority vote. The vote was ‘respected’ by Russia but not recognised by
separatists in Donbas; the latter had initiated referenda in which the majority voted in favour of
secession from Ukraine (although the legitimacy of those referenda is at least questionable).
3 See Havlik (2013). The failure of EaP policies has recently been admitted even by the EU itself – see European Commission (2015).
POLITICAL BACKGROUND: CONFLICT UNFOLDING
9
Subsequently, the fighting escalated dramatically during the summer months before the separatist rebels
found themselves on the losing side by the end of July 2014.4 However, they managed to initiate an
impressive counter-offensive, almost certainly not without extensive help from Russia, and the Ukrainian
army was overwhelmingly defeated in a crucial battle near Ilovaysk.
The military defeat near Ilovaysk paved the way for negotiations (with the intermediation of the OSCE
and the EU) over a ceasefire and an overhaul of Ukraine’s constitutional set-up, culminating in the
signing of an agreement in Minsk in September 2014, meanwhile referred to as the ‘Minsk-I’ agreement.
A law adopted subsequently by the Ukrainian parliament granted the insurgent Donbas extensive
autonomy in a number of areas. However, the status of autonomy hardly represented a real ‘carrot’ for
the separatist rebels who saw Donbas as fully independent from Ukraine or ideally as part of Russia.
Neither was the support for the new law particularly strong among the Ukrainian nationalists who viewed
the autonomy granted to Donbas as a defeat. Given the high degree of polarisation in the Ukrainian
society, which the attempted compromise helped little to resolve, a resumption of fighting appeared to be
only a question of time.
The re-escalation of the conflict was also helped by the snap parliamentary elections in October 2014
initiated by President Poroshenko. The elections brought a surprise success for the rival party of Prime
Minister Arseniy Yatsenyuk, known as relatively ‘hawkish’ in its position in the Donbas conflict, and
allowed him to retain his post.5 On the opposite side, an important destabilising factor has been the
arbitrariness of borders controlled by the pro-Russian separatists (one-third of the Donbas territory and
half of its population) by the time of the signing of the Minsk-I ceasefire agreement, coupled with strong
pro-Russian sentiments in other Donbas territories which have been re-gained by government troops but
were part of the self-proclaimed ‘peoples’ republics’ back in summer 2014. The so-called ‘Minsk-II’
ceasefire agreement signed on 12 February 2015 hardly differed from the first agreement and did not
put an end to the war, at least not immediately. On the contrary, fighting reportedly escalated and
resulted in another major loss for the Ukrainian army near Debaltsevo. Whether the Minsk-II agreement
will ultimately deliver the badly needed peace in Donbas remains to be seen.
All in all, it is clear that the Ukrainian government has overestimated its ability to resolve the conflict by
force, to a large extent because Russia has apparently been providing crucial support to the separatists.
Besides, poor financing and low fighting morale of the Ukrainian army, as well as the outright
incompetence of its commandment have clearly played a role as well. Other military and paramilitary
groupings such as the newly formed National Guard and the voluntary regiments, which are often
sponsored from sources other than the government budget (above all by Ihor Kolomoyskyi, an oligarch
and until March 2015 governor of the important Dnipropetrovsk region), have been generally much more
efficient and at least prevented the spread of the separatist movement to other Russian-speaking
provinces. However, in the medium term the existence of alternative troops potentially bears the risk of
further loss of government control over the security situation in the country, which may easily slide into
chaos.
4 Almost simultaneously, a tragic accident occurred on 17 July 2014 when the Malaysian Flight MH17 was shot down over the separatist-controlled territory, killing nearly 300 people.
5 With the 2004 constitution, enhancing the powers of the parliament and the prime minister, and re-installed in February 2014, the current power structure somewhat resembles the earlier fragile (and partly dysfunctional) Yuschenko-Tymoshenko ‘ruling tandem’.

10 MACROECONOMIC SITUATION AND STABILISATION CHALLENGES
2. Macroeconomic situation and stabilisation challenges
REAL ECONOMY: DEEPENING RECESSION
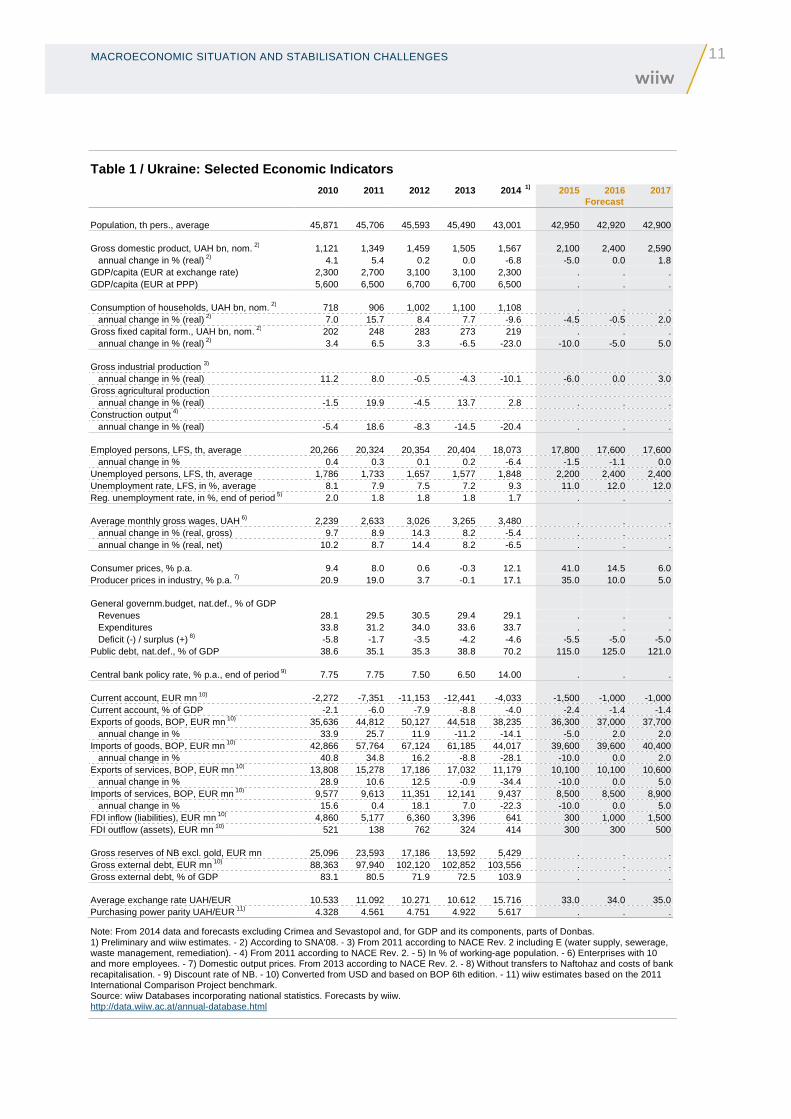
In 2014, Ukraine’s GDP contracted by 6.8% (Table 1), with economic dynamics progressively worsening
from quarter to quarter. In the first quarter of 2014, the GDP decline was at 1.2% (year-on-year) still
rather modest; however, it accelerated to 4.5% in the second quarter, 5.4% in the third quarter and a
dramatic 14.8% in the fourth quarter. Starting from the second quarter, these figures do not cover
Crimea and Sevastopol, and the figure for the fourth quarter also does not cover the eastern areas of
Donbas which are controlled by the separatist rebels. Including the latter would certainly show an even
deeper recession, since the war has destroyed a large part of the local production and transport
capacities (more on that see below). Coal mining and the metals industry – both heavily concentrated in
war-torn areas – were hit particularly hard: by 31% and 15%, respectively (in Ukraine as a whole), while
machine-building, whose main export market is Russia, also reported a strong 21% decline. Apart from
the weakening growth dynamics in Russia and the falling rouble, machine-building also suffered from the
disruption of existing links in military-related production cooperation because of the export bans imposed
by both countries, as well as Russia’s import-substitution efforts. All in all, merchandise exports to
Russia, which used to account for a quarter of Ukraine’s exports in previous years, plummeted by a
dramatic 35% last year (in US dollar terms).
Exports to the European Union increased by 12% in 2014, but could not offset the decline of exports to
Russia and the rest of the world; all in all, Ukrainian merchandise exports as a whole dropped by 14%,
according to balance-of-payments statistics. The increase in exports to the EU was largely thanks to the
unilateral abolition by the EU of most trade barriers for imports from Ukraine in spring 2014, which
benefited particularly agricultural products. This measure represented a first step towards the
implementation of the Deep and Comprehensive Free Trade Area (DCFTA) with the EU – part of the
broader Association Agreement. However, the implementation of other parts of the DCFTA agreement –
such as the gradual abolition of tariffs on imports from the EU – has been put on hold at least until the
end of 2015, partly at the insistence of Russia.6 This currently asymmetric arrangement is advantageous
for Ukraine: it puts a brake on the influx of European goods into Ukraine, while Ukrainian exporters are
able to benefit from zero import duties in the EU markets. On a negative note, the suspension of DCFTA
implementation – which could potentially represent an important reform ‘anchor’ for Ukraine – means
also a delay in the badly needed economic reforms and restructuring. However, the latter would only
have a positive impact on economic performance if accompanied by inflows of FDI, and the latter is
highly unlikely to come anyway as long as the conflict in Donbas and its future status remain unresolved,
and the perceived risks of investing into Ukraine remain high.
6 It also meant that Russia did not formally revoke its free trade regime with Ukraine, although a number of trade barriers for Ukrainian goods were erected on an ad hoc basis (see more details in Chapter 4).
MACROECONOMIC SITUATION AND STABILISATION CHALLENGES
11
Table 1 / Ukraine: Selected Economic Indicators
2010 2011 2012 2013 2014 1) 2015 2016 2017 Forecast Population, th pers., average 45,871 45,706 45,593 45,490 43,001 42,950 42,920 42,900
Gross domestic product, UAH bn, nom. 2) 1,121 1,349 1,459 1,505 1,567 2,100 2,400 2,590 annual change in % (real) 2) 4.1 5.4 0.2 0.0 -6.8 -5.0 0.0 1.8 GDP/capita (EUR at exchange rate) 2,300 2,700 3,100 3,100 2,300 . . . GDP/capita (EUR at PPP) 5,600 6,500 6,700 6,700 6,500 . . .
Consumption of households, UAH bn, nom. 2) 718 906 1,002 1,100 1,108 . . . annual change in % (real) 2) 7.0 15.7 8.4 7.7 -9.6 -4.5 -0.5 2.0 Gross fixed capital form., UAH bn, nom. 2) 202 248 283 273 219 . . . annual change in % (real) 2) 3.4 6.5 3.3 -6.5 -23.0 -10.0 -5.0 5.0
Gross industrial production 3) annual change in % (real) 11.2 8.0 -0.5 -4.3 -10.1 -6.0 0.0 3.0 Gross agricultural production annual change in % (real) -1.5 19.9 -4.5 13.7 2.8 . . . Construction output 4) annual change in % (real) -5.4 18.6 -8.3 -14.5 -20.4 . . .
Employed persons, LFS, th, average 20,266 20,324 20,354 20,404 18,073 17,800 17,600 17,600 annual change in % 0.4 0.3 0.1 0.2 -6.4 -1.5 -1.1 0.0 Unemployed persons, LFS, th, average 1,786 1,733 1,657 1,577 1,848 2,200 2,400 2,400 Unemployment rate, LFS, in %, average 8.1 7.9 7.5 7.2 9.3 11.0 12.0 12.0 Reg. unemployment rate, in %, end of period 5) 2.0 1.8 1.8 1.8 1.7 . . .
Average monthly gross wages, UAH 6) 2,239 2,633 3,026 3,265 3,480 . . . annual change in % (real, gross) 9.7 8.9 14.3 8.2 -5.4 . . . annual change in % (real, net) 10.2 8.7 14.4 8.2 -6.5 . . .
Consumer prices, % p.a. 9.4 8.0 0.6 -0.3 12.1 41.0 14.5 6.0 Producer prices in industry, % p.a. 7) 20.9 19.0 3.7 -0.1 17.1 35.0 10.0 5.0
General governm.budget, nat.def., % of GDP Revenues 28.1 29.5 30.5 29.4 29.1 . . . Expenditures 33.8 31.2 34.0 33.6 33.7 . . . Deficit (-) / surplus (+) 8) -5.8 -1.7 -3.5 -4.2 -4.6 -5.5 -5.0 -5.0 Public debt, nat.def., % of GDP 38.6 35.1 35.3 38.8 70.2 115.0 125.0 121.0
Central bank policy rate, % p.a., end of period 9) 7.75 7.75 7.50 6.50 14.00 . . .
Current account, EUR mn 10) -2,272 -7,351 -11,153 -12,441 -4,033 -1,500 -1,000 -1,000 Current account, % of GDP -2.1 -6.0 -7.9 -8.8 -4.0 -2.4 -1.4 -1.4 Exports of goods, BOP, EUR mn 10) 35,636 44,812 50,127 44,518 38,235 36,300 37,000 37,700 annual change in % 33.9 25.7 11.9 -11.2 -14.1 -5.0 2.0 2.0 Imports of goods, BOP, EUR mn 10) 42,866 57,764 67,124 61,185 44,017 39,600 39,600 40,400 annual change in % 40.8 34.8 16.2 -8.8 -28.1 -10.0 0.0 2.0 Exports of services, BOP, EUR mn 10) 13,808 15,278 17,186 17,032 11,179 10,100 10,100 10,600 annual change in % 28.9 10.6 12.5 -0.9 -34.4 -10.0 0.0 5.0 Imports of services, BOP, EUR mn 10) 9,577 9,613 11,351 12,141 9,437 8,500 8,500 8,900 annual change in % 15.6 0.4 18.1 7.0 -22.3 -10.0 0.0 5.0 FDI inflow (liabilities), EUR mn 10) 4,860 5,177 6,360 3,396 641 300 1,000 1,500 FDI outflow (assets), EUR mn 10) 521 138 762 324 414 300 300 500
Gross reserves of NB excl. gold, EUR mn 25,096 23,593 17,186 13,592 5,429 . . . Gross external debt, EUR mn 10) 88,363 97,940 102,120 102,852 103,556 . . . Gross external debt, % of GDP 83.1 80.5 71.9 72.5 103.9 . . .
Average exchange rate UAH/EUR 10.533 11.092 10.271 10.612 15.716 33.0 34.0 35.0 Purchasing power parity UAH/EUR 11) 4.328 4.561 4.751 4.922 5.617 . . .
Note: From 2014 data and forecasts excluding Crimea and Sevastopol and, for GDP and its components, parts of Donbas. 1) Preliminary and wiiw estimates. - 2) According to SNA'08. - 3) From 2011 according to NACE Rev. 2 including E (water supply, sewerage, waste management, remediation). - 4) From 2011 according to NACE Rev. 2. - 5) In % of working-age population. - 6) Enterprises with 10 and more employees. - 7) Domestic output prices. From 2013 according to NACE Rev. 2. - 8) Without transfers to Naftohaz and costs of bank recapitalisation. - 9) Discount rate of NB. - 10) Converted from USD and based on BOP 6th edition. - 11) wiiw estimates based on the 2011 International Comparison Project benchmark. Source: wiiw Databases incorporating national statistics. Forecasts by wiiw. http://data.wiiw.ac.at/annual-database.html

12 MACROECONOMIC SITUATION AND STABILISATION CHALLENGES
Indeed, the military conflict in Donbas has obviously had a detrimental effect on the already poor
investment climate: fixed investments plunged by 23% and FDI inflows were negligibly low last year.
Strong capital flight has also been a main reason behind the free fall of the hryvnia. Currency
depreciation and energy tariff hikes fuelled consumer price inflation, which by February 2015 soared to
34.5% on an annual basis and eroded the purchasing power of households: on average, net wages
dropped by 6.5% in real terms last year. At the same time, credits to households fell by 16% (after
adjusting for the valuation effect of forex-denominated loans) amidst strong deposit outflows and the
overall gloomy economic prospects. All this weighed heavily on private consumption, which fell by nearly
10% last year. On a positive note, the combined effect of currency depreciation and falling domestic
demand contributed to a sharp drop in imports of goods and services by 27% in US dollar terms – much
more than that of exports (-20%), resulting in vastly improved trade and current accounts and a strongly
positive contribution of real net exports to GDP growth.
Economic prospects remain crucially dependent on a lasting peace settlement of the Donbas conflict.
For 2015, another recession – in the tune of at least 5% – will not be avoided, with substantial risks on
the downside, and recovery can hardly be expected before 2017. Among other things, the ongoing war
deters the inflow of foreign investments, which are badly needed to modernise the economy and finance
the costly implementation of EU technical standards and numerous other regulations (‘acquis’) within the
framework of the newly signed – but temporarily suspended until January 2016 – DCFTA agreement
with the EU. It is also unlikely that Ukraine’s export sector will be able to take advantage of the highly
competitive exchange rate, given that part of the production and transportation capacities are physically
destroyed and trade with Russia remains severely curtailed, while an increase in manufacturing exports
to the EU is conditional on improved competitiveness, including the costly implementation of EU
standards as envisaged in the DCFTA agreement – both possible only in the medium and longer run.
Important exceptions to this may be agriculture and parts of the food processing industry, which are
largely located outside the conflict zone and have been able to benefit to some extent from the newly
granted market access for their products by the EU.
ECONOMIC LOSSES DUE TO WAR IN DONBAS AND SECESSION OF CRIMEA
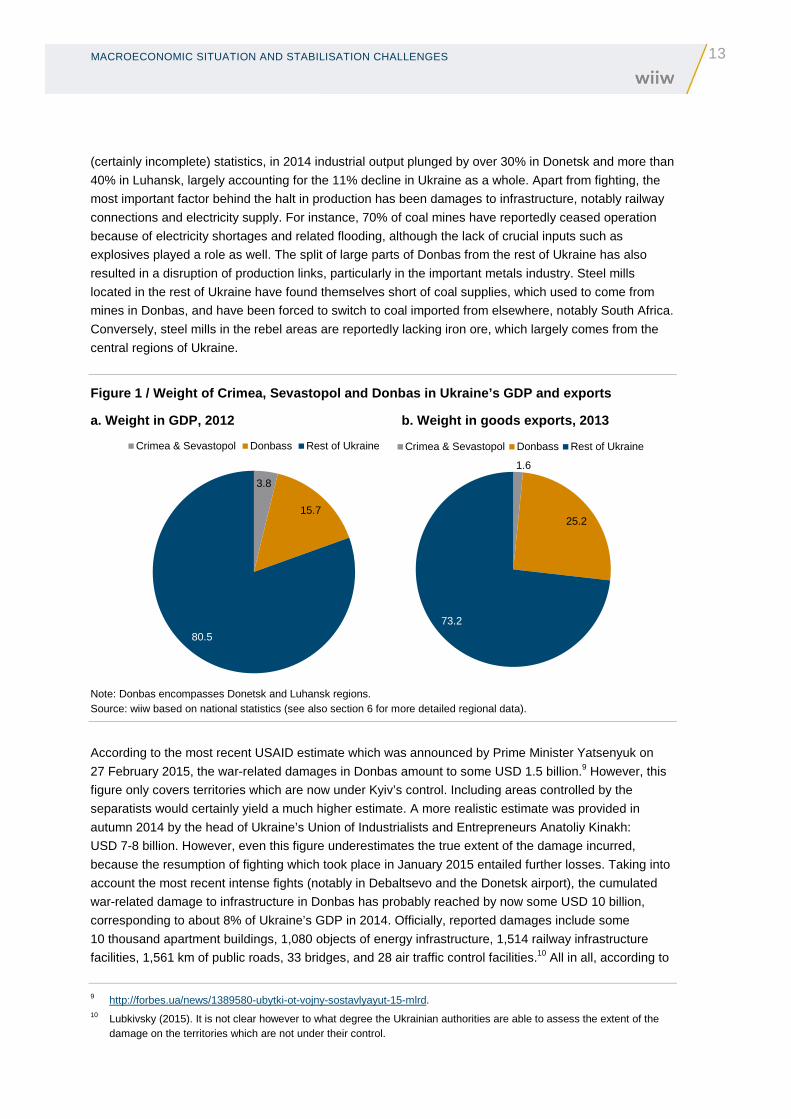
The Donetsk and Luhansk eastern provinces – commonly referred to as Donbas – are located in the
easternmost part of Ukraine and have a combined territory of 53 thousand square kilometres and a pre-
conflict population of 6.5 million people. Home to coal mining and metallurgy, Donbas has traditionally
been Ukraine’s industrial heartland, accounting for 16% of GDP and a quarter of exports (Figure 1).7 The
Donetsk region was statistically the second richest in Ukraine in per capita GDP terms behind the capital
city Kyiv (Figure 2). Despite its relatively high development level (by Ukrainian standards), Donbas was
however a net recipient of fiscal transfers from Kyiv, largely thanks to coal mining subsidies.8
In the first months of the conflict, it was primarily local small and medium-sized businesses which
suffered the most. However, as the civil war was gaining momentum, the big industrial enterprises which
form the backbone of the Donbas economy, such as those in the metals and chemicals sectors, became
increasingly affected as well. In July 2014, statistics reported for the first time huge drops in industrial
production in both provinces, which only deepened during the subsequent months. According to official
7 See also Chapter 6 of the present report. 8 Anecdotal evidence suggests however that these subsidies were allocated not for the purpose of covering the losses of
coal mines, many of which were in fact profitable, but rather represented hidden budget support to oligarchs who controlled a large part of mines and were close to former president Viktor Yanukovych.
MACROECONOMIC SITUATION AND STABILISATION CHALLENGES
13
(certainly incomplete) statistics, in 2014 industrial output plunged by over 30% in Donetsk and more than
40% in Luhansk, largely accounting for the 11% decline in Ukraine as a whole. Apart from fighting, the
most important factor behind the halt in production has been damages to infrastructure, notably railway
connections and electricity supply. For instance, 70% of coal mines have reportedly ceased operation
because of electricity shortages and related flooding, although the lack of crucial inputs such as
explosives played a role as well. The split of large parts of Donbas from the rest of Ukraine has also
resulted in a disruption of production links, particularly in the important metals industry. Steel mills
located in the rest of Ukraine have found themselves short of coal supplies, which used to come from
mines in Donbas, and have been forced to switch to coal imported from elsewhere, notably South Africa.
Conversely, steel mills in the rebel areas are reportedly lacking iron ore, which largely comes from the
central regions of Ukraine.
Figure 1 / Weight of Crimea, Sevastopol and Donbas in Ukraine’s GDP and exports
a. Weight in GDP, 2012 b. Weight in goods exports, 2013
Note: Donbas encompasses Donetsk and Luhansk regions. Source: wiiw based on national statistics (see also section 6 for more detailed regional data).
According to the most recent USAID estimate which was announced by Prime Minister Yatsenyuk on
27 February 2015, the war-related damages in Donbas amount to some USD 1.5 billion.9 However, this
figure only covers territories which are now under Kyiv’s control. Including areas controlled by the
separatists would certainly yield a much higher estimate. A more realistic estimate was provided in
autumn 2014 by the head of Ukraine’s Union of Industrialists and Entrepreneurs Anatoliy Kinakh:
USD 7-8 billion. However, even this figure underestimates the true extent of the damage incurred,
because the resumption of fighting which took place in January 2015 entailed further losses. Taking into
account the most recent intense fights (notably in Debaltsevo and the Donetsk airport), the cumulated
war-related damage to infrastructure in Donbas has probably reached by now some USD 10 billion,
corresponding to about 8% of Ukraine’s GDP in 2014. Officially, reported damages include some
10 thousand apartment buildings, 1,080 objects of energy infrastructure, 1,514 railway infrastructure
facilities, 1,561 km of public roads, 33 bridges, and 28 air traffic control facilities.10 All in all, according to
9 http://forbes.ua/news/1389580-ubytki-ot-vojny-sostavlyayut-15-mlrd. 10 Lubkivsky (2015). It is not clear however to what degree the Ukrainian authorities are able to assess the extent of the
damage on the territories which are not under their control.
3.8
15.7
80.5
Crimea & Sevastopol Donbass Rest of Ukraine
1.6
25.2
73.2
Crimea & Sevastopol Donbass Rest of Ukraine
14 MACROECONOMIC SITUATION AND STABILISATION CHALLENGES
official estimates, the military conflict in Donbas reduced Ukraine’s GDP by 2.5 pp last year, including
1.9 pp due to the decline in the Donetsk and Luhansk regions and another 0.6 pp due to contagion
effects.11
Figure 2 / Gross regional product per capita in 201 2, in EUR at PPP
Note: Purchasing power parity (PPP) is wiiw estimate based on the 2011 International Comparison Project benchmark, and is assumed to be the same across regions. Source: Own calculations based on data from the State Statistics Service of Ukraine.
The destruction of production and transportation capacities in the region means that in the short run, up
to 1.8 million people in Donbas may stay unemployed, according to official estimates. In the longer run,
however, the problem may well be the opposite: labour shortages due to the high number of refugees,
many of whom may not come back. By the latest count, almost 2 million people, or nearly one-third of
the Donbas population, have left the region since the outbreak of the conflict, including nearly one million
registered as ‘internally displaced’ in other parts of Ukraine (according to Ukraine’s Ministry of Social
Policy) and up to 900 thousand who fled to other countries, mostly to Russia.12
By way of contrast, the annexation of Crimea and Sevastopol (a port city which constituted a separate
administrative entity) by Russia entailed much smaller economic losses for Ukraine. The two provinces
have a combined population of 2.4 million, or 5% of Ukraine’s total, while their economic weight was
even lower: 4% of GDP and only 2% of exports of goods and services. Thus, Crimea and Sevastopol
were under-performing regions even by Ukrainian (rather low) standards: their GDP per capita was
lower than the national average, and both provinces were chronically net recipients of fiscal transfers
11 Rashkovan (2015). 12 Estimates with respect to the number of Donbas refugees who fled to other countries differ by a wide margin.

MACROECONOMIC SITUATION AND STABILISATION CHALLENGES
15
from Kyiv.13 For both regions, the takeover by Russia, which is on average three times richer than
Ukraine, had among other things a clear economic attraction, and made them eligible for transfers of
much larger magnitude than those received from Kyiv – not to speak of the potential for increased
investments into infrastructure, including the planned construction of a bridge from mainland Russia. In
turn, for Ukraine the takeover of both regions by Russia meant that the government no longer needs to
subsidise them, which has been a modest relief to the central government budget.
It is however clear that, irrespective of the above-mentioned minor positive effects for the budget, the
departure of Crimea and Sevastopol has diminished Ukraine’s economic potential, although the precise
magnitude of related losses is difficult to quantify. Apart from the unique sub-tropical climate on the
southern Black Sea Riviera and related tourist facilities, the region features some industrial assets
(including a titanium plant owned by Dmytro Firtash) and port facilities, 40% of Ukraine’s ships and boats
exports, as well as 6% of gas and 16% of oil deposits (off-shore) – even if their recovery is rather
expensive for geological reasons.
FLEXIBLE EXCHANGE RATE A BIG DISAPPOINTMENT
Under the leadership of former president Yanukovych, Ukraine used to have a fixed exchange rate
regime, with the hryvnia pegged to the US dollar at a fixed rate of 8 UAH/USD. Because of the relatively
higher domestic inflation, this arrangement led over time to increasing currency overvaluation (see
Figure 3). In addition, the problem was magnified by the fact that Ukraine’s terms of trade suffered on
account of depressed world prices of steel (its main export item until recently), while the fixed exchange
rate could not adjust accordingly and ‘absorb’ this negative terms-of-trade shock, i.e. render the
economy to become more competitive. The result of this policy was mounting current account deficits,
which increased from 2% of GDP in 2010 to nearly 9% in 2013 (Figure 4). Since those deficits were not
fully offset by net capital inflows, the National Bank of Ukraine (NBU) was forced to sell its reserves in
order to defend the exchange rate, so that their stock in relation to GDP more than halved between 2010
and 2013.
The sharp increase in political and economic uncertainty following the ‘Maidan revolution’ led to
unprecedented capital outflows from Ukraine: in 2014, they totalled USD 8 billion, USD 2.6 billion of
which represented purchases of foreign currency by households. In this new macroeconomic
environment, the previous fixed peg could no longer be defended, and the NBU switched to a flexible
exchange rate regime – partly also under pressure from the IMF, and resulting in a subsequent free fall
of the hryvnia. During the year following the Maidan revolution, the hryvnia lost around three-quarters of
its value, falling from 8 to 32 UAH/USD.
13 The low official GDP figures may however also reflect the extent of the ‘shadow economy’ which is likely to be pronounced given the region’s reliance on tourism. The estimates of the extent of the shadow economy for Ukraine as a whole generally range between 40% and 50% of GDP.
16 MACROECONOMIC SITUATION AND STABILISATION CHALLENGES
Figure 3 / Nominal and real exchange rates, 2007-20 15
Note: Values more than 100 indicate real appreciation against January 2007. Source: wiiw Monthly database incorporating national statistics.
Figure 4 / Current account in % of GDP, 1995-2014
Source: wiiw Annual Database incorporating national statistics.
For various reasons, the NBU has been however trying to limit the scope of currency depreciation. First,
depreciation is fuelling inflation via the increased price of imported goods. Second, it is jeopardising the
stability of the banking system because of the latter’s high dollarisation level. Despite the near-ban on
lending in foreign currency imposed during the crisis of 2008-2009, by the end of 2013 foreign currency
loans still accounted for 32% of total loans extended to households and 35% of those to businesses
(loans denominated mostly in US dollars; other currencies play only a marginal role). The steep hryvnia
depreciation has increased the debt burden on those borrowers and, because of the rising non-
performing loans, has become a problem for banks as well.14 Finally, depreciation has also affected the
dynamics of public debt, more than half of which is denominated in foreign currency. During 2014, public
debt stock soared by over 30 percentage points (pp) of GDP (from 39% to 70%), of which more than
20 pp was solely on account of currency depreciation, according to wiiw calculations.
14 Because of the valuation effect of currency depreciation, which inflated the value of dollar credits in national currency terms, the share of foreign currency loans jumped dramatically in the course of 2014: to 43% for households and 48% for businesses.
0
2
4
6
8
10
12
14
16
1880
90
100
110
120
130
140
150
Jän.07 Jän.08 Jän.09 Jän.10 Jän.11 Jän.12 Jän.13 Jän.14 Jän.15
Real exchange rate EUR per UAH, PPI-deflated, January 2007 = 100 Nominal exchange rate UAH per USD (right hand scale)
-10
-5
0
5
10
15
1995
1996
1997
1998
1999
2000
2001
2002
2003
2004
2005
2006
2007
2008
2009
2010
2011
2012
2013
2014
MACROECONOMIC SITUATION AND STABILISATION CHALLENGES
17
In order to put a brake on currency depreciation, the NBU has resorted to a range of measures,
including a further tightening of monetary policy15 and a number of administrative restrictions of the
foreign exchange market, including a 100% surrender requirement for the incoming foreign exchange
(later reduced to 75%) and several steps aimed at curbing the foreign exchange demand. However, in
reality the choice of instruments at NBU’s disposal has been very limited: official reserves are already at
a critically low level of USD 5.6 billion (covering just one month of imports), interest rate hikes hardly
provide an incentive to invest into a war-torn country, while the imposed administrative measures have
only resulted in growing currency shortages and the emergence of a vast ‘shadow’ market for foreign
exchange.16 In addition, the foreign exchange market continues to be rather ‘thin’, with only a few
currency speculators able to generate substantial exchange rate fluctuations – a task made nowadays
particularly easy because of the military conflict and the related ‘bearish’ market sentiments. The
formally adopted ‘inflation targeting’ which in theory accompanies a flexible exchange rate regime
remains an empty slogan, with inflation rates meanwhile exceeding 30% p.a. and the ineffectiveness of
traditional monetary policy instruments such as interest rates.
All in all, Ukraine continues to be critically dependent on foreign emergency assistance, the bulk of it
coming from the IMF. Last year, Ukraine received USD 4.6 billion as part of the USD 17 billion Stand-by
Arrangement (SBA) agreed with the IMF in April 2014, as well as a total of another USD 4.5 billion in
other multilateral and bilateral loans and credit guarantees, such as from the World Bank, the EBRD, the
EU, the United States and Japan.17 Upon its inception, the IMF programme implicitly assumed that the
country’s balance-of-payments (and fiscal) problems were those of liquidity rather than solvency:
economic recovery and currency stabilisation were expected to enable external debt repayment in the
longer run.18 This assumption – arguably justified at that time – looks now increasingly unrealistic, as
economic recovery is not in sight, and the hryvnia is likely to depreciate even more, while high defence
spending continues to hamper budget consolidation. Rising concerns over public debt sustainability are
also pushing upwards the yields on government Eurobonds; the latter stand on average at 7.1% p.a.19 –
much higher than the GDP growth rate in US dollar terms (which is negative), thus contributing towards
the debt to GDP ratio rising still further and sovereign default becoming a ‘self-fulfilling prophecy’.
The new IMF lending arrangement to Ukraine approved on 11 March 2015 – a four-year Extended Fund
Facility (EFF) worth USD 17.5 billion, which replaced the earlier SBA package – should be seen as
recognition of the solvency problems the country is facing. It is only USD 5 billion larger in volume than
the funds outstanding in the framework of the SBA (USD 12.5 billion); in addition, these funds are to be
disbursed over a much longer period: four years instead of one. On the other hand, the IMF package is
to be supplemented with some USD 8 billion worth of net disbursements from other multilateral and
bilateral lenders (especially the United States and the EU, but also from the World Bank, EBRD, and
EIB), which will bring the size of the total financial package to around USD 25 billion over the next four
15 The NBU key policy rate (discount rate) was hiked five times over the past year, bringing it to 30% p.a. 16 On 5 February 2015, the exchange rates were unified, resulting in another massive depreciation of the hryvnia.
However, at the beginning of March, extensive administrative controls were re-imposed once again, bringing about a (likely temporary) recovery of the official exchange rate to levels around 23 UAH/USD by the time of finalising this report (end-March 2015).
17 The net inflows of IMF funds during this period amounted however to less than USD 1 billion, since the bulk of the newly arrived funds were used to repay old IMF credits.
18 Several authors, such as Schadler (2014) and Lachman (2015), argue that the IMF projections underlying its decision to extend an SBA to Ukraine were heavily skewed towards optimism from the very beginning.
19 http://forbes.ua/news/1391410-mvf-poka-ne-reshil-yavlyaetsya-li-dolg-ukrainy-pered-rf-oficialnym
18 MACROECONOMIC SITUATION AND STABILISATION CHALLENGES
years. Still, these funds will be almost certainly not enough to meet Ukraine’s external financing
requirement, which in 2015 alone is projected by wiiw at approximately USD 15 billion – see Box 1.
BOX 1 / ESTIMATING UKRAINE’S EXTERNAL FINANCING REQ UIREMENT FOR 2015
Projected current account deficit: USD 1.7 billion
Projected FDI inflow: 0
External debt service of government: USD 7.7 billion
External debt service of private sector20: USD 8.1 billion
Projected purchases of foreign currency by households: USD 1 billion
Required replenishment of NBU’s foreign reserves21: USD 10.4 billion
Minus: Expected inflows from the IMF under the newly approved EFF22: - USD 10 billion
Expected inflows from other multilateral and bilateral lenders under EFF: - USD 3.5 billion
-----
Total: ~ USD 15 billion
Source: NBU, IMF (2015), SP Advisors (2015), wiiw estimates.
Therefore, the new IMF package explicitly assumes partial restructuring of privately held sovereign
foreign debt (i.e. debt owed to the London Club of creditors), which represents around half of the total
and stands at some USD 18 billion, including USD 3 billion owed to Russia.23 Overall, such restructuring
– diplomatically referred to by the IMF as ‘debt operations’ – should save Ukraine USD 15 billion in debt
payments over the entire period 2015-2018; this year alone, USD 5.2 billion is to be saved this way
(IMF, 2015). Negotiations over debt restructuring have already started, and will likely lead to a reduction
in interest payments and principal, as well as maturity extension up to 10-15 years on the remaining debt
(BNP Paribas, 2015). According to some estimates, about 40% of the debt may be written off as a result,
with the US-based fund Franklin Templeton – the largest single private holder of Ukraine’s sovereign
debt worth some USD 7 billion – poised to lose the most.24 However, given Ukraine’s external financial
requirements (see Box 1), even this impressive amount of debt restructuring which is envisaged by the
IMF is probably an under-estimate.
FISCAL POLICY: DEFENCE SPENDING OFFSETS IMF-IMPOSED AUSTERITY
In 2014, both revenues and expenditures of the general government were nearly stagnant (+3%
nominally, Table 2), which implied a 10% drop in real terms. This appears to be well in line with the
20 Includes both the corporate and the banking sector, assuming an 85% rollover ratio of existing credit liabilities. 21 Amount required for replenishing NBU’s foreign exchange reserves from the current level (USD 5.6 billion as of end-
February 2015) to a level covering three months of imports (USD 16 billion). 22 Ukraine already received USD 5 billion under the EFF programme in March 2015. 23 This debt owed to Russia’s National Welfare Fund is held in the form of Eurobonds, giving rise to controversies whether
it should be treated as official or rather as private debt. 24 Financial Times, ‘Contrarian US investor with $7 bn of debt stands to lose most if Kiev imposes haircuts’, 12 February
2015, p. 3. Other large holders of Ukrainian debt reportedly include i.a. BlackRock, Allianz, and Fidelity.

MACROECONOMIC SITUATION AND STABILISATION CHALLENGES
19
stated government strategy (partly inspired by the IMF) to reduce the role of the state in the economy.
However, the almost identical dynamics of revenues and expenditures last year suggests that the
declared target of budget consolidation has not been met. Although the conditionalities attached to the
IMF loans officially require budget austerity, in practice the latter has been offset by the ballooning
military spending which was (seemingly) tolerated by the IMF. As a result, the government deficit as a
percentage of GDP even increased somewhat: from 4.2% of GDP in 2013 to 4.6% of GDP last year –
see Table 1.25
Table 2 / General government budget, 2013-2014
UAH billion 2014, as % of 2013
2013 2014
Revenues 442.8 455.9 103.0
Income tax 72.2 75.2 104.2
Corporate profit tax 55.0 40.2 73.1
Value-added tax 181.7 189.2 104.1
Value-added tax refunded -53.4 -50.2 94.0
Excise tax on domestically-produced goods 27.7 28.2 101.9
Excise tax on imported goods 8.9 16.9 188.4
Royalties on mineral resources 14.2 19.6 137.9
Royalties on land 12.8 12.1 94.4
Import customs duties 13.3 12.4 93.4
NBU profits 28.3 22.8 80.6
Own revenues of budgetary institutions 37.9 31.5 83.2
Expenditures 505.8 523.0 103.4
State administration (excl. debt service) 28.5 27.4 96.1
Debt service 33.2 49.4 149.0
Defence 14.8 27.4 184.4
Public order, security and judiciary 39.4 44.9 113.8
Economic activity 50.8 43.6 86.0
Environmental protection 5.6 3.5 62.1
Housing and communal services 7.7 17.8 231.1
Health care 61.6 57.0 92.7
Culture, arts and sports 13.7 13.9 101.4
Education 105.5 100.1 94.9
Social security and welfare 145.1 138.0 95.1
Credits 0.5 5.0 -
Credits taken 6.1 6.8 -
Credits repaid -5.6 -1.9 -
Budget balance (‘+’ deficit, ‘-’surplus), incl. 63.6 72.0 -
Issued bonds to compensate local budgets for the difference in tariffs - 11.1 -
Issued bonds for the purpose of VAT refunds requested prior to January 1, 2014 - 6.9 -
Budget balance (‘+’ deficit, ‘-’ surplus) in compar able terms (w/o issued bonds) 63.6 54.1 -
Source: Ministry of Finance
On the revenue side, tax collection was crucially helped by a spike in inflation which offset the negative
impact of the recession, as well as the hikes in regulated prices and excise taxes on alcohol and tobacco
implemented as part of the austerity package. Also, property taxes and royalties on the extraction of
natural resources were raised, and the (nearly) ‘flat’ tax regime for personal incomes made more
25 These figures do not include the substantial quasi-fiscal deficits – more on that see below.
20 MACROECONOMIC SITUATION AND STABILISATION CHALLENGES
progressive, albeit with thresholds set at rather high levels. In addition, state revenues benefited from
the 1.5% ‘war’ payroll tax introduced from August 2014 (and prolonged for 2015).
Table 2 also reveals a marked shift in the structure of government expenditures in 2014. The two biggest
expenditure items – social payments and spending on education – were cut by 5% and spending on
health by 7% in nominal terms, implying a reduction by up to 20% in real terms. Among the austerity
measures implemented in this vein were a ‘freeze’ of the minimum wage, a 10% reduction in the number
of civil servants, and cuts in some of civil servants’ pensions and privileges. The secession of the net
budget transfer recipients Crimea and Sevastopol, as well as the suspension of pensions and other
transfers to the rebel areas in Donbas implemented in autumn 2014 have contributed towards a
reduction of government expenditures as well.26 Allocations to the ‘national economy’ were reduced by
14%, with a strong emphasis on cuts in capital spending. A large part of funds saved in this way were
channelled to pay interest on the public debt (+49%) and for military purposes: defence spending
increased by 84% (albeit starting from a rather low basis) and amounted to some UAH 28 billion
(1.8% of GDP).27
Following the latest IMF recommendations, the amended central government budget for 2015 targets a
somewhat lower deficit of 4.1% of GDP. However, attaining even this (seemingly moderate) target under
conditions of a severe economic recession would require a sizeable consolidation effort of 7.4% of GDP,
of which 3.3 pp is to be achieved thanks to higher budget revenues, and 4.1 pp due to expenditure cuts
(in real terms). Thus, the extent of fiscal consolidation required from Ukraine by the IMF (not taking into
account the reduction in energy subsidies – see below) exceeds that in Portugal, Italy and Spain in
2011-2013 (5-7% of GDP), although it is somewhat lower than the one implemented in Greece (8-9%).
Judging from these countries’ experience, the IMF assumption with respect to the size of the fiscal
multiplier in Ukraine is probably over-optimistic,28 and the recessionary impact of government austerity
on the real economy may turn out to be much higher than anticipated, potentially resulting in GDP falling
by up to 10% this year.29
The growth of government revenues is projected at 32% in nominal terms – roughly in line with inflation,
and notwithstanding the severe economic downturn. The government reckons that tax collection should
benefit from the newly enacted comprehensive tax reform: as of January 2015, the tax system has been
streamlined and the number of taxes reduced from 22 to 9, while a drastic lowering of social security
contributions and a generous tax amnesty are hoped to encourage the ‘de-shadowing’ of the economy.
In addition, government revenues should be boosted by the newly imposed temporary (until the end of
2015) 5-10% surcharge on all imports, excluding energy and pharmaceuticals, although this might be in
violation of WTO rules.30
26 According to IMF (2015), the Ukrainian government saved 0.4% of GDP in this way. 27 Here and thereafter, budgetary allocations to defence do not include private financing of volunteer regiments fighting on
the government side. 28 In a recently published working paper (Mitra and Poghosyan, 2015), the IMF has found that fiscal multipliers in Ukraine
are relatively low and below one. 29 This estimate has been provided by Gorodnichenko (2015) who applied to the case of Ukraine the findings of Blanchard
and Leigh (2013) that the IMF has systematically under-estimated the contractionary impact of fiscal consolidation by 0.7 pp for every 1 pp of forecasted drop on GDP.
30 The WTO will consider the case in April 2015. The official justification for the import surcharge is ‘to contain balance-of-payments pressures’ in line with Article XII of GATT agreement (IMF, 2015).
MACROECONOMIC SITUATION AND STABILISATION CHALLENGES
21
On the expenditure side, the 2015 budget envisages further austerity measures, such as additional cuts
in the number of public employees (especially in law enforcement agencies, but also in other ministries
and at the NBU) and a ‘freeze’ of the minimum wage until December 2015, implying a further erosion of
real incomes by high inflation. Also, pensions for working pensioners which exceed UAH 1,423 (some
USD 50) per month will be cut by 15% as of April 2015 and until the end of this year. However, as last
year, the austerity impact of these measures will be offset by a near-doubling (in nominal terms) of
military spending: budget allocations for security and defence amount to UAH 90 billion, or 5% of GDP.
According to the government, the ‘anti-terrorist operation’ in Donbas costs USD 5-10 million per day.
Extrapolated for the whole year, this would sum up to some USD 2-4 billion, or 2-4% of GDP (obviously,
the costs can be easily higher if the fighting escalates further). While the effectiveness of the Ukrainian
army on the battlefield is far from being impressive, high military spending – mirrored in the statistics by
the growth of public consumption – provides at least some growth stimulus in an otherwise strongly
recessionary environment.
Finally, and probably most importantly, the officially reported budget figures and targets discussed above
do not include important quasi-fiscal expenditure items, such as subsidies to the state-owned energy
company Naftohaz (resulting from low domestic gas tariffs), transfers to the Pension Fund, and costs of
bank recapitalisation. According to IMF (2015), the Naftohaz deficit alone accounted for 5.7% of GDP
last year, as strong currency depreciation inflated the gas import bill in hryvnia terms, which was only
partially offset by the enacted domestic tariff hikes.31 This year, the import gas price for Ukraine should
decline (at least in US dollar terms) thanks to the recent drop in the oil price, to which it is contractually
linked. Nevertheless, in line with the latest budget amendments and under pressure from the IMF, retail
gas tariffs were hiked on average by 284% and those for heating by 66% as of 1 April 2015. These
moves should reduce the deficit of Naftohaz to 3.1% of GDP and bring down the consolidated (i.e.
including all quasi-fiscal entities) government deficit to 8.8% this year (from 13.5% in 2014).32 However,
they will also contribute an estimated 9 pp to consumer price inflation this year33 and thus further erode
the purchasing power of the majority of the country’s households. In the longer run (until April 2017), the
IMF requires that gas tariffs be hiked to ‘cost-recovery levels’, i.e. raised approximately five times from
their present level.
POLICY RECOMMENDATIONS
› As indicated above, the war-related damages in Donbas already amount to at least USD 10 billion
(8% of GDP), and may end up being much higher. It goes without saying that, given the extent of
the damage, restoration of normal economic activities in the affected territories will require
massive public investment . Since the cash-stripped Ukrainian government will hardly be able to
come up with adequate funds on its own, the EU could potentially play a crucial role here – ideally
by designing a sort of ‘Marshall Plan’ for Ukraine ; similar plans have been advocated recently e.g.
by George Soros34 and Dmytro Firtash.35 At the same time, it is important to bear in mind that, given
31 Gas tariffs for households were hiked by 60% and those for district heating companies by 40% as of 1 May and 1 July 2014, respectively.
32 http://forbes.ua/nation/1389731-ne-hotelos-no-kushat-nado 33 Rashkovan (2015). 34 Reuters, ‘Soros urges giving Ukraine $50 billion of aid to foil Russia’, 8 January 2015,
http://www.reuters.com/article/2015/01/08/ukraine-crisis-soros-idUSL6N0UN13720150108
22 MACROECONOMIC SITUATION AND STABILISATION CHALLENGES
pervasive corruption in Ukraine, a substantial share of EU funds is likely to be embezzled or
stolen.36 Even large-scale financial assistance from abroad will not bring the expected benefits to
Ukraine’s economy unless it is accompanied by a wide range of – above all institutional – reforms
(for more on that see next Chapter).
› The current flexible exchange rate regime – which is a key IMF conditionality, coupled with
inflation targeting – is clearly inappropriate for Ukraine under the conditions of de facto war,
elevated political and economic uncertainties, and the high degree of dollarisation of the economy.
Therefore, macroeconomic stabilisation will require a more sta ble exchange rate regime which
could serve as a ‘nominal anchor’ of inflationary expectations and put an end to the current
depreciation-inflation spiral. At the same time, the adoption of a fixed peg regime similar to the one
which was in place under former president Yanukovych is unrealistic and bears the dangers of
overvaluation which may materialise rather soon with the levels of inflation currently observed. An
optimal compromise could be a fixed but adjustable exchange rate regime, or alternatively a
‘crawling peg’; these types of exchange rate arrangements were widely used to achieve
macroeconomic stabilisation in a number of CESEE countries during the 1990s and generally
proved their effectiveness. However, in order to make a new exchange rate regime credi ble, the
National Bank of Ukraine would need a substantially h igher volume of foreign exchange
reserves : the current level of USD 5.6 billion covering a mere one month of imports is clearly
insufficient. Even the customarily used benchmark of three months of imports as the absolutely
crucial minimum of the reserves level (which would correspond to some USD 15-16 billion) may not
be enough to ensure credibility under the current circumstances. Realistically, the NBU would
probably require additional funds to the tune of USD 15-20 billion to this end. This is far above the
new IMF package which is supposed to cover a wide range of Ukraine’s needs apart from forex
reserve replenishment, including foreign debt repayment and budgetary support. Increased
availability of forex reserves could also allow the NBU to lower interest rates and thus mitigate
somewhat the economic recession.
› With gas and heating tariffs for households being artificially low and the energy intensity of the
economy among the world’s highest, the necessity of tariff hikes which would encourage energy-
saving behaviour of consumers is fairly obvious. Therefore, in principle the government deserves
praise for implementing this highly unpopular step.37 However, the wisdom of front-loaded tariff
hikes is questionable unless they are accompanied b y parallel efforts aimed at promoting
energy-saving investments . Such efforts could complement, for instance, the recent EBRD
programmes in Ukraine which have gained major traction in energy efficiency results, and draw on
the past successful experience in other East European countries such as Romania.38 One possible
area of government involvement could be, for instance, the installation of heating metres which may
35 Telepolis, ‘Deutsche Politiker im Verbund mit ukrainischen Oligarchen’, 4 March 2015, http://www.heise.de/tp/artikel/44/44303/1.html
36 The same caveat applies also to other types of potential EU financial assistance outlined below. 37 Another challenge is low energy efficiency in the industrial sector – despite the already high (cost-covering) level of
energy tariffs for industry. Ukraine’s industry, especially its energy-intensive branches such as metals and chemicals, still rely to a large extent on obsolete technologies which often date back to the 1950s and are extremely energy-wasteful.
38 See, for instance, EBRD (2009).

MACROECONOMIC SITUATION AND STABILISATION CHALLENGES
23
be unaffordable for the vast majority of poorer households without targeted subsidies from the
government: As long as households continue using old Soviet-style heating infrastructure which
does not allow to regulate the temperature, any hopes for a reduction in energy consumption in
response to tariff hikes may be elusive. Another possible area of government support could be the
thermal insulation of residential buildings.39 Government subsidies along these lines would be
crucial in solving the long-term structural problem of excessive energy consumption, and should
enjoy priority over the short-term task of fiscal consolidation (which is probably the real motivation
for the implemented tariff hikes). In fact, they could be financed from the tariff hikes, leaving the
overall fiscal deficit unchanged.40
› More generally, the current composition of government expenditures is sub-optimal. High military
spending and high costs of public debt service are ‘crowding out’ other essential budget payments
while broad-based reductions in expenditures on health and education, and a freeze of the minimum
wages and pensions under conditions of high inflation contribute to a progressive degradation of the
welfare state and impoverishment of vast segments of the population. This means not only less
investment into human capital, with the potential negative repercussions for long-term growth
prospects, but also less public support for reforms. Therefore, an optimal structure of government
expenditures would require over time more social an d less defence spending, and also a
smaller public debt burden . As for the burden of public debt, the current negotiations over debt
restructuring are a welcome step in the right direction, but may potentially require debt ‘haircuts’
larger than those on the negotiating table.
39 According to some estimates, thermal insulation of a typical five-storey residential building would require some USD 100,000 in investments, which would reduce its heating consumption by half. For Ukraine as a whole, this would translate into some 40% of GDP or e.g. 2.5% of GDP per year if the programme is extended over 15 years – an amount which is to be saved thanks to tariff hikes.
40 Although the government is planning to allocate UAH 12.5 billion (0.7% of GDP) in direct heating subsidies to the poor to offset the impact of tariff hikes, this will hardly contribute towards improving energy efficiency.
24 POLAND’S PAST DOES NOT PROVIDE EASY PRESCRIPTIONS APPLICABLE TO UKRAINE
3. Poland’s past does not provide easy prescriptions applicable to Ukraine
Poland is generally considered to be the ‘success story’ among the Central and East European transition
countries, while Ukraine had been – even before the outbreak of the civil war in 2014 – viewed as a bad
(if not the worst) performer. At the same time, the two countries seem to have initially shared many
similarities. Therefore, the idea is floating around that Ukraine’s lot could be improved upon the
emulation of Poland’s past economic reforms and policies. This chapter argues that Poland’s past
transition experience does not provide simple lessons which could be of direct relevance to Ukraine. In
particular, the notorious Polish-style ‘shock therapy’ (pursued in 1990-1991) does not seem to be worth
trying on Ukraine. In contrast, Ukraine’s economic performance could perhaps gain solid foundations
should the country’s institutional and legal systems emulate some ‘Polish’ features. But it must be
admitted that the desirable changes will not be easy to implement given the entrenched political and
economic interests.
INITIAL CONDITIONS SEEMED TO FAVOR UKRAINE MATERIALLY
According to wiiw estimates (wiiw, 2015), Poland and Ukraine started their transformations from roughly
similar development levels: In 1991 Poland’s per capita (p.c.) GDP stood at EUR 4,500 (at purchasing
power parities) – not much more than the respective level of Ukraine (EUR 3,700) – see Figure 5.
Poland’s p.c. GDP represented 32% of the average EU-28 level and Ukraine’s 26%. In 2013, Poland’s
p.c. GDP reached an estimated EUR 17,500 (i.e. 68% of the EU-28 level) while Ukraine’s stood at
EUR 6,700 (or 26% of the EU-28 level). In 2014, the income gap between the two countries was further
increasing (EUR 18,500 vs. 6,500). Moreover, it is now forecast that by 2016 Poland’s p.c. GDP will
have reached about EUR 21,000 (70% of the EU average) while Ukraine’s will have fallen to EUR 6,200
(less than 23% of the EU average).
What factors account for the striking difference between the long-term performances of the two
countries? Arguably, in terms of material initial conditions, Ukraine’s starting position was more
favourable than Poland’s. While both are reasonably similar as far as area and population numbers are
concerned, Ukraine was (and still is) much more generously endowed in terms of mineral deposits,
climate and soil. Ukraine disposes of huge areas covered with ‘black earth’, or chernozem, highly prized
for its natural fertility, while Poland’s agricultural land is of poor quality in comparison. In economic
terms, the initial conditions of the two countries were certainly different – though not necessarily entirely
disadvantageous to Ukraine: the latter inherited a quite advanced industrial base (albeit unduly
specialised in the production of weapons) which was generally less developed in Poland. Poland’s
small-scale and vastly inefficient and overmanned private farming also seemed a hindrance compared to
the large-scale cooperative and state-owned farming in Ukraine. Moreover, Poland’s ‘centrally planned’
economy had stagnated throughout the 1980s and towards its end it had gone through triple-digit
inflation. In addition, Poland was essentially bankrupt, initially. Already in 1982 the country defaulted on

POLAND’S PAST DOES NOT PROVIDE EASY PRESCRIPTIONS APPLICABLE TO UKRAINE
25
its huge foreign debt denominated in ‘convertible currencies’. In 1990 Poland’s foreign debt stood at
USD 48.5 billion – while Ukraine’s at USD 3.5 billion (in 1992).
Figure 5 / Per capita GDP (at current purchasing po wer parity) as percentage of EU-28 average, 1991-2013, Poland and Ukraine
Source: wiiw Annual Database, Eurostat, wiiw calculations.
ANOTHER “SHOCK THERAPY” FOR UKRAINE?
Because the initial material conditions did not seem to favour Poland, the eventual difference in
performance tends to be ascribed to other factors – primarily to the differences in economic policies
pursued in either country, with the economic policy conducted in Poland being definitely superior to that
in Ukraine. That is a rather obvious conclusion which, however, can lead to erroneous overstatements.
Some of the policies conducted in Poland at some points in time were as bad as those in Ukraine. This
applies especially to the initial ‘shock therapies’ (in Poland in 1990, in Ukraine in 1992). Ironically, it is
commonly believed (at least among the mainstream Western observers) that Poland’s later prosperity
has followed from its initial ‘shock therapy’. The suggestion implicit in this is that Ukraine may need
another Polish-style ‘shock therapy’ if the country is to succeed eventually. It is probably in this context
that Ukraine’s President Poroshenko has recently (January 2015) invited Leszek Balcerowicz – the
person who administered the ‘shock therapy’ to Poland – to design the economic reform policy for his
country. Mr. Balcerowicz seems to have accepted the invitation.
As will be argued below, Ukraine does not really need any new ‘shock therapy’. But first it may be
expedient to consider briefly whether that ‘therapy’ did really any good to Poland.
Poland: from “shock without therapy”
Poland’s ‘shock therapy’, initiated on 1st January 1990, immediately set in motion a number of
processes, among them a near-hyperinflation, a steep rise in previously absent unemployment, and a
0.0
10.0
20.0
30.0
40.0
50.0
60.0
70.0
Poland Ukraine

26 POLAND’S PAST DOES NOT PROVIDE EASY PRESCRIPTIONS APPLICABLE TO UKRAINE
precipitous decline in production, wages and living standards. Macro policies behind the ‘shock therapy’
were consistent with the macro clauses of the then fashionable ‘Washington Consensus’. The
emissaries of international financial organisations – especially the International Monetary Fund – were
very active in the design of the policy. Simultaneously, from the very beginning the government tried
hard to implement – at the maximum speed possible – the ‘systemic clauses’ of the Washington
Consensus which stipulated, inter alia, wholesale deregulation of the economy, its external opening, and
radical de-nationalisation, including privatisation.
Against the initial expectations (or promises), the hardship imposed on the economy and the population
at large failed to produce any quick improvements. The deepening economic contraction, paired with
very high inflation, continued for about thirty consecutive months. But the first two governments (the first
responsible for the formulation of the economic policy, the second for its rigid continuation) fell – due to
growing popular dissatisfaction – after the first twenty months in office. Importantly, both those
governments were dominated by the same person: Deputy Prime Minister Leszek Balcerowicz, who also
held the portfolio of the Finance Ministry.
… to “therapy without shock”
Only after Mr. Balcerowicz’s final ousting from the commanding position did this policy change. It
became much more opportunistic on macro matters (including fiscal ones), social (including support to
the losers of reform) and much less doctrinaire (or more gradualist) in matters of privatisation, external
openness and governmental regulation. The slow recovery finally initiated (at mid-1992) was gradually
gaining momentum. Recovery – and then growth – became swift and improvements fairly
comprehensive from 1993 through 1998 under the government led by the Social-Democrats, which tried
to secure an acceptable balance between the interests of the nascent business class and the rest of the
society (the employed as well as the unemployed).
It is essential to stress the difference between the two periods: 1990-1992 and 1993-1998. In the
popular Western opinion the success of the ‘Polish way’ tends to be ascribed to the rapidity of the radical
change imposed (and to the policy being unscrupulous in scrapping the ‘Socialist Welfare State’) as well
as to the society’s resigned acceptance of the hardships implied. This is inaccurate. The first period is
better described as ‘shock without therapy’. It is the second period (1993-1998) – which in the Western
opinion is often seen as the years of ‘muddling through’, or falling behind in terms of privatisation and
foreign investment – that should be properly described as the one of ‘therapy without shock’.
Specifically, the negative experience with the initial ‘shock therapy’ led to the formulation and
implementation of a consistent – gradualist – reform alternative. This alternative, formalised in the official
document called the ‘Strategy for Poland’, guided Poland’s economic policies from 1993 through 1998,
and then from 2002 through 2006. The policy corrected many excesses imposed during the ‘shock
therapy’ years, paid more attention to the needs of the losers of reforms, without yet compromising on
the principles of a competitive market economy. Fiscal and monetary policies stopped being restrictive
irrespective of the state of the economy and became much more flexible. A modern taxation system was
introduced. Simultaneously there was a fairly consistent evolution of the state’s constitutional and legal
framework, with a reasonably clear delineation of the powers of various state institutions.
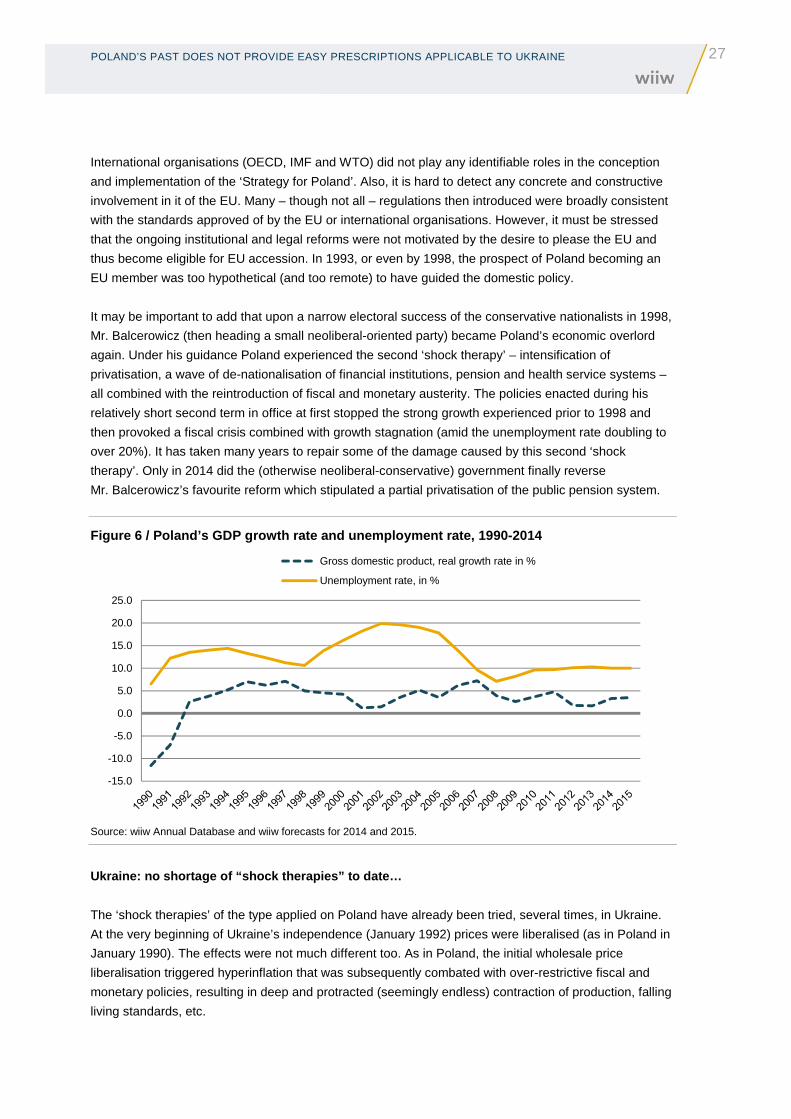
POLAND’S PAST DOES NOT PROVIDE EASY PRESCRIPTIONS APPLICABLE TO UKRAINE
27
International organisations (OECD, IMF and WTO) did not play any identifiable roles in the conception
and implementation of the ‘Strategy for Poland’. Also, it is hard to detect any concrete and constructive
involvement in it of the EU. Many – though not all – regulations then introduced were broadly consistent
with the standards approved of by the EU or international organisations. However, it must be stressed
that the ongoing institutional and legal reforms were not motivated by the desire to please the EU and
thus become eligible for EU accession. In 1993, or even by 1998, the prospect of Poland becoming an
EU member was too hypothetical (and too remote) to have guided the domestic policy.
It may be important to add that upon a narrow electoral success of the conservative nationalists in 1998,
Mr. Balcerowicz (then heading a small neoliberal-oriented party) became Poland’s economic overlord
again. Under his guidance Poland experienced the second ‘shock therapy’ – intensification of
privatisation, a wave of de-nationalisation of financial institutions, pension and health service systems –
all combined with the reintroduction of fiscal and monetary austerity. The policies enacted during his
relatively short second term in office at first stopped the strong growth experienced prior to 1998 and
then provoked a fiscal crisis combined with growth stagnation (amid the unemployment rate doubling to
over 20%). It has taken many years to repair some of the damage caused by this second ‘shock
therapy’. Only in 2014 did the (otherwise neoliberal-conservative) government finally reverse
Mr. Balcerowicz’s favourite reform which stipulated a partial privatisation of the public pension system.
Figure 6 / Poland’s GDP growth rate and unemploymen t rate, 1990-2014
Source: wiiw Annual Database and wiiw forecasts for 2014 and 2015.
Ukraine: no shortage of “shock therapies” to date…
The ‘shock therapies’ of the type applied on Poland have already been tried, several times, in Ukraine.
At the very beginning of Ukraine’s independence (January 1992) prices were liberalised (as in Poland in
January 1990). The effects were not much different too. As in Poland, the initial wholesale price
liberalisation triggered hyperinflation that was subsequently combated with over-restrictive fiscal and
monetary policies, resulting in deep and protracted (seemingly endless) contraction of production, falling
living standards, etc.
-15.0
-10.0
-5.0
0.0
5.0
10.0
15.0
20.0
25.0
Gross domestic product, real growth rate in %
Unemployment rate, in %

28 POLAND’S PAST DOES NOT PROVIDE EASY PRESCRIPTIONS APPLICABLE TO UKRAINE
Some of the leading Polish reformers (e.g. Marek Dabrowski, in 1990 the deputy to Mr. Balcerowicz)
have been actively involved in the Ukrainian affairs all along. So has been CASE – the Warsaw-based
research-cum-advisory organisation set up by Mr. Balcerowicz which started its advisory activity in
Ukraine in March 1993. Funded by George Soros, a CASE expert team including both Mr. Balcerowicz
and Mr. Dabrowski worked with the then Ukrainian Prime Minister Leonid Kuchma. The first (to be
followed by many such) ‘comprehensive diagnosis’ of the Ukrainian economy and an ‘economic reform
project’ were prepared in July 1993. Polish (and many professional Western) ‘shock therapists’ were
offering precisely the same medicines they had tried on Poland in 1990-1991. However, in contrast to
Poland, under constantly worsening conditions there was a high political turnover in Ukraine:
governments were sworn in and deposed at much higher frequency than in Poland. Persons in charge of
economic affairs enjoyed their offices rather briefly in comparison to Poland, albeit much more ‘gainfully’.
…but no “therapy without shock” yet…
No economic alternative akin to the ‘Strategy for Poland’ has been ever worked out in Ukraine. The
realisation that ‘things do not develop as they perhaps should’ produced, periodically, attempts at easing
the hardship by either some ad hoc fiscal relaxation or some ad hoc bureaucratic interventions. The
impression one gains from studying Ukraine’s track record of the past 25 years is that the responses to
crises typically involved the change of persons in charge of policy – and not the change in policy itself.
The widely celebrated (in the West) ‘Orange Revolution’ of 2005 brought about even less: a radical
change in public rhetoric while retaining the key figures of the incumbent political elite, including
Victor Yushchenko, former Prime Minister and head of the National Bank, and the ‘gas princess’ Yulia
Tymoshenko, former Deputy Prime Minister for fuel and energy. (The former became the new President,
the latter the new Prime Minister.)
Table 3 / History of IMF lending arrangements to Uk raine as of 28 February 2015, in million SDR (Special Dra wing Rights, 1 SDR ~ 1.5 USD)
Facility Date of
Arrangement
Date of
Expiration or
Cancellation
Amount
Agreed
Amount
Drawn
Amount
Outstanding
Standby Arrangement April 2014 April 2016 10,976 2,973 2,973
Standby Arrangement July 2010 December 2012 10,000 2,250 813
Standby Arrangement November 2008 July 2010 11,000 4,000 0
Standby Arrangement March 2004 March 2005 412 0 0
Extended Fund Facility September 1998 September 2002 1,920 1,193 0
Standby Arrangement August 1997 August 1998 399 181 0
Standby Arrangement May 1996 February 1997 598 598 0
Standby Arrangement April 1995 April 1996 997 539 0
Total 36,302 11,734 3,785
Note: The current Extended Fund Facility (EFF) worth SDR 12,348 million approved by the IMF on 11 March 2015 is not included. Source: IMF
Changes in the commanding positions alone could not bring about any real change. Also, as the ad hoc
interventions could not, as a rule, produce any immediate improvements they were usually scrapped (or
simply ignored) not long after having been initiated. Worse still, the ad hoc interventions were often
considered to be the cause rather than the effect of continuing misfortune. Renewed austerity, renewed

POLAND’S PAST DOES NOT PROVIDE EASY PRESCRIPTIONS APPLICABLE TO UKRAINE
29
‘shock therapies’ were then repeatedly enforced – not without active involvement, since 1994, of the
International Monetary Fund. Before the current Standby Arrangement, agreed in April 2014, Ukraine
has had seven IMF programmes over the past twenty years (Table 3). Six of them were however
terminated because of Ukraine’s failure to comply with the requirements that would have drastically
reduced the otherwise miserable living standards of the population.
Both countries are market economies by now, but…
While both Ukraine and Poland quickly transformed into market economies with high and rising shares
of assets effectively owned by private individuals (and not by the state), the ways the private sectors
came into existence differed widely. The origins of capitalism did differ radically – and so do their modes
of operation – including the relationships of the ‘business community’ with the state. It is fair to say that
in Poland the representatives of the business community (and of big business in particular) tend to be
kept at bay by the politicians. Attempts at forging ties between the two classes are considered
inacceptable. The media are after such attempts – and so are the offices in charge of corruption
persecution.
It is equally fair to say that, in Ukraine, the state has been captured by oligarchic interests. The conduct
of the state’s economic policy has been directly controlled by the business ‘moguls’ whose fortunes
derive, primarily, from shameless – and unpunished – looting of public assets, extortion of huge
undeserved subsidies, etc. The Ukrainian ruling (political) class is actually indistinguishable from its quite
narrow economic oligarchy. Not only do the oligarchs control the media and the political parties (and
thus the legislature) but they also maintain their own paramilitary forces (e.g. the ‘voluntary battalions’
involved in the battles over the control of Donbas). The very same persons also tend to be in charge of
‘economic reforms’.
The representatives of the oligarchic ‘clans’ are often provincial governors (such as until recently Ihor
Kolomoyskyi, the owner of the country’s biggest bank PrivatBank, and Serhiy Taruta, the owner of the
steel-making Industrial Union of Donbas). Effectively, the provinces governed by the oligarchs are
becoming semi-feudal principalities.
That the oligarchs are divided into clans competing (with means fair and foul) for power and wealth is
often misinterpreted as the manifestation of pluralism and democracy. At best, this is an ‘oligarchic
democracy’, not to be confused with ‘normal democracy’, as prevailing e.g. in Poland. Under the
Ukrainian ‘democracy’, the ‘more equal’ are exempt from law. Not surprisingly, the government is
unwilling to control private monopolies or capital flight whereas corruption is rampant on all levels of
public administration. The ‘masses’ – i.e. the underprivileged majority (including small business) – are at
the mercy of a wilful and corrupt bureaucracy.
Corruption, lawlessness, bureaucratic excesses are often correctly considered to be the obstacles to
‘running normal business’ in Ukraine. However, these phenomena carry the day precisely because they
are compatible with the way the ruling oligarchs run their businesses there.
30 POLAND’S PAST DOES NOT PROVIDE EASY PRESCRIPTIONS APPLICABLE TO UKRAINE
THE DEEP NON-ECONOMIC ROOTS OF DIFFERENTIAL PERFORMANCE
There are several non-economic reasons why an oligarchic capitalism did not strike comparably deep
roots in Poland. First, Poland entered the transition while disposing of political, legal and intellectual
elites representing a very long tradition of national statehood, public service, active opposition to the
authoritarian rule and also some moral standards derived primarily (but not exclusively) from close links
to the Catholic Church, at that time led by the ‘Polish Pope’. In Poland a non-violent civil society had
formed and matured over decades prior to the collapse of the authoritarian rule. Secondly, Poland’s
transition (the first among many to follow in Central and Eastern Europe) was assisted by an organised
non-violent mass movement: the ‘Solidarity’. The moment the old regime collapsed most of its influential
representatives were summarily purged from the position of power, including in most state-owned firms
and organisations. Many of those who were not purged pledged allegiance (to be closely monitored by
the public) to the emerging democratic and legal order. All these factors prevented the rise of an
omnipotent oligarchic class – and helped keep members of the emerging business class generally at a
distance from the government.
Nothing like that existed in Ukraine. The elites inherited from the Soviet era at best represented second-
rate provincial communist apparatchiks (as the more outstanding and ambitious personalities had made
careers in Moscow rather than in Kyiv). The traditions of national statehood did not exist as far as ethnic
Ukrainians were concerned (while the citizens of Russian origin may have identified with the Russian
state traditions). There was only a rudimentary background of a non-violent civil society capable of
exerting a positive role in public affairs.
The inception of the first-ever Ukrainian national state in 1991 was not assisted by any non-violent mass
movement that could support or monitor the change. Independence was not the result of own efforts and
aspirations of the peoples inhabiting the Ukrainian Socialist Soviet Republic – it was just decreed by a
ukas following a secret meeting of a very narrow group of top Soviet apparatchiks who decided to carve
‘own republics’ out of the decaying Soviet Union. In consequence, the representatives of the
nomenklatura (top bureaucrats and managers in charge of public institutions and state-owned firms)
retained, by and large, their commanding positions. Being good homines sovietici, they could not be
expected to take seriously the norms of some exotic (to them) moral doctrines. Nor could they
appreciate the rules of democracy or the importance of the rule of law. But what they immediately
grasped was that the new circumstances offered – to the unscrupulous – immense possibilities of
personal enrichment. The pursuit of profit, which in a civilised market economy is the engine of progress,
in the Ukrainian market economy only too often degenerates into bloody wars between rivalling
oligarchic clans or into simply looting the state assets. The evidence of both inter-oligarchic terrorist
attacks and of rampant corruption at the highest governmental offices abounds. Perhaps one could
mention the case of Pavlo Lazarenko, an erstwhile Prime Minister of Ukraine (1996-1997) sentenced (in
the United States though) to nine years in prison for money laundering.41
All in all, the ‘impoverished Ukraine’ used to be the proud home to numerous new super-rich. According
to Forbes, in 2013 there were eight US dollar billionaires in Ukraine, with a combined wealth of
USD 26.2 billion.42 By contrast, the same source lists only four Polish dollar billionaires, with the total
41 Mr. Lazarenko is still accused of stealing some USD 200 million (!) of the Ukrainian government money. 42 Forbes’ list does not mention Ms. Tymoshenko and other public personalities suspected of having amassed huge
fortunes as well.
POLAND’S PAST DOES NOT PROVIDE EASY PRESCRIPTIONS APPLICABLE TO UKRAINE
31
wealth standing at USD 9.8 billion ‘only’ – despite the fact that the Polish economy is three times bigger
than Ukraine’s. The fortunes of three out of these four persons have nothing to do with their participation
in any privatisation of public assets (nor with any other dealings with the state).
LESSONS FOR UKRAINE IN 2015?
It is incorrect to assume that Poland’s success has been due to some simple trick (e.g. ‘shock therapy’)
which could be easily replicated in Ukraine. The major Polish lesson is that economic prosperity was
associated with deep reforms on legal and constitutional matters. In Poland, these reforms grew out of
social conditions that were actually non-existent and are yet to consolidate in Ukraine.
It is widely acknowledged that the Ukrainian state has been captured by oligarchic interests. Successive
oligarchy-controlled governments have failed to institute a reform of the economy (and of the state at
large) in such a way as to create conditions conducive to the emergence of a more or less viable
competitive and dynamic market economy of the Polish type. Arguably, as long as Ukraine is ruled by
oligarchic interests, the chances of a successful major institutional and legal overhaul seem low.
Of course, sooner or later authentic democracy and the rule of law may eventually prevail in Ukraine –
just as they have done in Poland and most other former transition countries in Central and Eastern
Europe. Currently the results of the elections conducted in Ukraine so far (including the most recent
ones) suggest that a comprehensive political change is yet to come.
The inescapable institutional transformation of Ukraine could greatly benefit from a well-designed
Western involvement. That involvement could have several dimensions. First, there should be concerted
efforts to strengthen the Ukrainian non-violent civil society, independent media and non-government
organisations, and provide opportunities for young people from Ukraine to study abroad. Secondly,
friends of Ukraine should spare no effort in showing their disapproval of Ukraine’s ruling elites’ ways of
doing politics (and business). Financial and material assistance to Ukraine should be rigidly tied to the
progress on e.g. the legal system, the severance of relationships between business and politics, proper
taxation of oligarchic fortunes, confiscation of wealth (including parked abroad) illegally amassed, etc.
Finally, in advocating specific economic policies, the friends of Ukraine should refrain from lobbying for
the application of austerity, or ‘shock’ therapies that could make the lives of ordinary Ukrainians even
more miserable.
32 UKRAINE’S FOREIGN TRADE AND RELATED INTEGRATION CHALLENGES
4. Ukraine’s foreign trade and related integration challenges
The integration process of Ukraine has been obstructed by the lack of a clear domestic strategy as well
as the outside intervention. The issue of Ukraine’s economic and political ‘orientation’ – either towards
the EU or to Eurasian integration – received a lot of attention already in the context of the failed Eastern
Partnership November 2013 Summit in Vilnius.43 This ‘either/or’ approach pursued by both Russia and
the EU was misguided and instigated the subsequent conflict in and over Ukraine.44 Currently (April
2015) – apart from overcoming the effects of the conflict – an urgent challenge facing Ukraine is the
implementation of the AA/DCFTA (Association Agreement/Deep and Comprehensive Free Trade Area)
with the EU, related trade reorientation, commodity restructuring and competitiveness issues. Trade
integration and the establishment of new specialisation patterns will be additionally hampered by
disrupted economic and trade relations with Russia with grave economic repercussions, not only in the
short run, but probably also in the medium and long run. Disruptions in economic relations with Russia
include mutual trade, investment and travel embargoes, energy price disputes and other frictions which
altogether result in sizeable economic costs for all parties concerned. Official Western (IMF, EU, World
Bank, EBRD and bilateral) reform assistance notwithstanding, new Ukrainian specialisation and
competitive trade patterns can be established only after a comprehensive restructuring triggered and
facilitated especially by inflows of new investments (both domestic and foreign). This will require some
degree of macroeconomic stability, improvements in the investment climate and, above all, the
termination of the military conflict. The latter is a fundamental precondition for economic stabilisation and
subsequent investment-led growth, thus representing an urgent task for all parties involved. This chapter
aims to review the Ukraine’s present regional and commodity specialisation patterns in foreign trade as
a starting point, and to explore the challenges and potential for trade restructuring and the related costs,
taking into account the experiences of other transition countries in Central and Eastern Europe (CEE).
We start by taking stock of Ukraine’s foreign trade regional and commodity composition as an important
starting point in evaluating the consequences (economic and otherwise) of alternate integration
strategies and development prospects. We explore existing export specialisation patterns and evaluate
the country’s current and potential competitive advantages that have important implications for its
economic stabilisation and development prospects. Next, we assess the costs associated with conflict-
related trade disruptions and identify the most vulnerable sectors and regions of Ukraine’s economy.
Last but not least, we discuss trade-related challenges associated with the AA/DCFTA, review Ukraine’s
possible trade integration scenarios and provide policy recommendations.
43 Havlik (2013) discussed some additional aspects of the Vilnius Eastern Partnership summit. 44 Havlik (2014) dealt with economic consequences of the conflict.

UKRAINE’S FOREIGN TRADE AND RELATED INTEGRATION CHALLENGES
33
FOREIGN TRADE SPECIALISATION: DICHOTOMIES BETWEEN EAST AND
WEST
Economic growth of Ukraine has been highly dependent on external demand and fluctuating commodity
prices. Exports and imports accounted each for some 45-50% of Ukraine’s GDP in 2013. Both European
Union (EU) and Russian/Eurasian Economic Union (EEU) markets have been historically very important
for Ukraine.45 Imports from the EU constituted 34% and those from Russia 32% of total imports on
average over the period 2003-2013 (Figures 7 and 8). Similarly, exports to the EU have amounted to
28% and those to Russia to 24% of total exports of Ukraine on average over the past decade. In 2013,
26% of Ukraine’s exports and 35% of imports were traded with the EU. The latter shares are –
understandably – much lower than in the CEE NMS, which have been fully integrated in the EU market
and had been, for many years already, much less dependent on Russia. However, Ukraine’s EU trade
shares are also lower than those of Russia (53% of Russian exports and 42% of imports were traded
with the EU in 2013, before the sanctions crisis). For Ukraine, Russia has been the single most
important export partner (with 23.6% of exports in 2013 and 17.6% in 2014; Belarus and Kazakhstan
accounted for an additional 6.5% of Ukraine’s exports), followed by Turkey, China and Egypt. Poland
and Italy were the key export markets within the EU, each accounting for some 4% of Ukraine’s exports
(Figure 7). This geographic pattern of exports – a dichotomy between the EU and the EEU – will
represent the major challenge for the post-conflict trade reorientation (compounded by commodity-
specific regional specialisation patterns – see below).
Figure 7 / Top 20 trading partners of Ukraine, aver age 2003-2013
Exports Imports
Source: calculations based on wiiw database.
45 Eurasian Economic Union (EEU) was established in 1 January 2015 on the basis of Customs Union of Belarus, Kazakhstan and Russia. Armenia joined EEU on 1 January 2015. Kyrgyzstan is expected to join in mid-2015 (http://www.eurasiancommission.org/en/Pages/default.aspx)
Russia24%
Turkey6%
Italy5%
Poland4%
Germany3%
Belarus3%
Kazakhstan3%
Egypt2%
China2%
India2%
Hungary2%
United States
2%Moldova
2%Netherlands1%
Spain1%
Iran1%
Syria1%
Romania1%
Slovakia1%
Bulgaria1% Other
31%
Russia32%
Germany9%
China6%
Poland4%
Belarus4%
Turkmenistan4%
United States
3%
Italy3%
Kazakhstan2%
France2%
Turkey2%
Japan2%
Hungary2%
Korea Republic
2%
Czech Republic
2%
United Kingdom
1%
Netherlands1%
Austria1%
Romania1%
Switzerland1%
Other17%
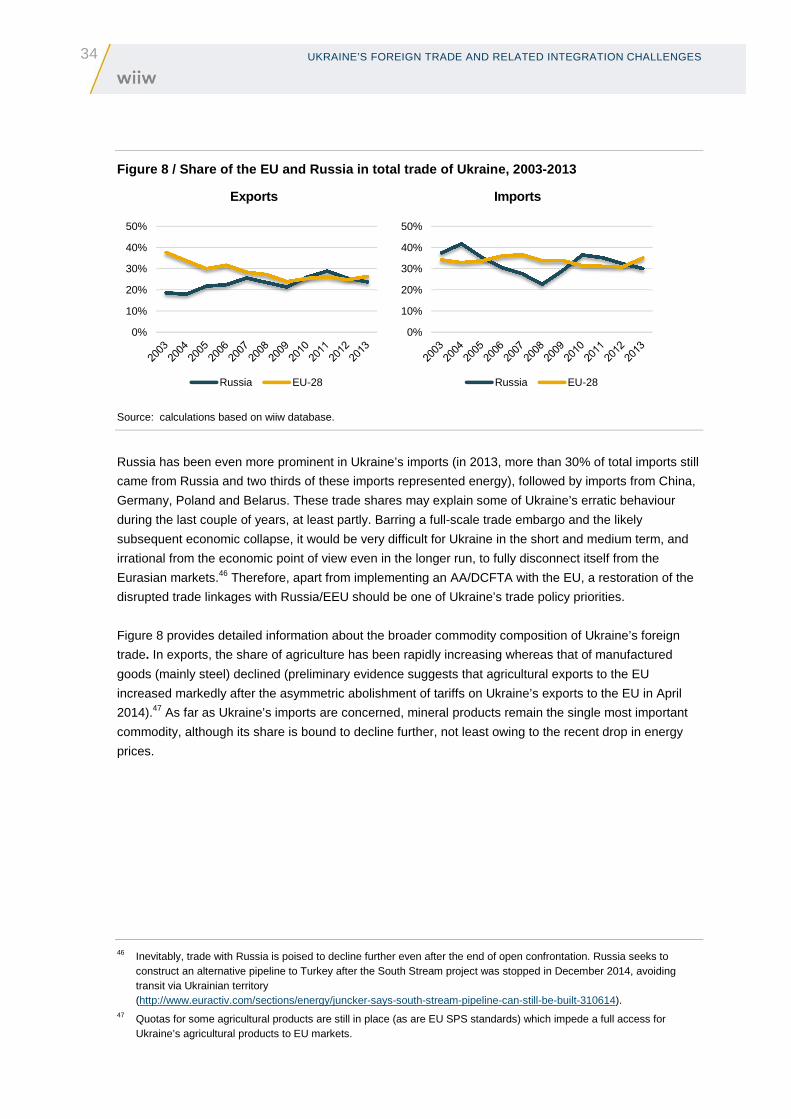
34 UKRAINE’S FOREIGN TRADE AND RELATED INTEGRATION CHALLENGES
Figure 8 / Share of the EU and Russia in total trad e of Ukraine, 2003-2013
Exports Imports
Source: calculations based on wiiw database.
Russia has been even more prominent in Ukraine’s imports (in 2013, more than 30% of total imports still
came from Russia and two thirds of these imports represented energy), followed by imports from China,
Germany, Poland and Belarus. These trade shares may explain some of Ukraine’s erratic behaviour
during the last couple of years, at least partly. Barring a full-scale trade embargo and the likely
subsequent economic collapse, it would be very difficult for Ukraine in the short and medium term, and
irrational from the economic point of view even in the longer run, to fully disconnect itself from the
Eurasian markets.46 Therefore, apart from implementing an AA/DCFTA with the EU, a restoration of the
disrupted trade linkages with Russia/EEU should be one of Ukraine’s trade policy priorities.
Figure 8 provides detailed information about the broader commodity composition of Ukraine’s foreign
trade. In exports, the share of agriculture has been rapidly increasing whereas that of manufactured
goods (mainly steel) declined (preliminary evidence suggests that agricultural exports to the EU
increased markedly after the asymmetric abolishment of tariffs on Ukraine’s exports to the EU in April
2014).47 As far as Ukraine’s imports are concerned, mineral products remain the single most important
commodity, although its share is bound to decline further, not least owing to the recent drop in energy
prices.
46 Inevitably, trade with Russia is poised to decline further even after the end of open confrontation. Russia seeks to construct an alternative pipeline to Turkey after the South Stream project was stopped in December 2014, avoiding transit via Ukrainian territory (http://www.euractiv.com/sections/energy/juncker-says-south-stream-pipeline-can-still-be-built-310614).
47 Quotas for some agricultural products are still in place (as are EU SPS standards) which impede a full access for Ukraine’s agricultural products to EU markets.
0%
10%
20%
30%
40%
50%
Russia EU-28
0%
10%
20%
30%
40%
50%
Russia EU-28

UKRAINE’S FOREIGN TRADE AND RELATED INTEGRATION CHALLENGES
35
Figure 9 / Industrial composition of exports and im ports of Ukraine, 2003-2013 average
Exports Imports
I Live animals, animal products II Vegetable products III Animal or vegetable fats, oils, waxes, prepared edible fats IV Prepared foodstuffs, beverages, tobacco and substitutes V Mineral products VI Products of the chemical or allied industries VII Plastics and articles thereof, rubber and articles thereof VIII Raw hides and skins, leather, fur skins and articles, etc. IX Wood and articles of wood, wood charcoal, cork, etc. X Pulp wood, paper or paperboard (incl. recovered) and articles XI Textiles and textile articles XII Footwear, headgear, umbrellas, walking sticks, etc. XIII Articles of stone, plaster, cement, ceramic products, glassware XIV Natural or cultured pearls, precious stones and metals, etc. XV Base metals and articles of base metal XVI Machinery, mechanical appliances, electrical equipment XVII Vehicles, aircraft, vessels and associated transport equipment XVIII Optical, measuring, medical instruments, clocks, musical instr., etc. XX Miscellaneous manufactured articles
Source: calculations based on wiiw database.
The distinct commodity specialisation of Ukrainian trade on its two key markets – the EU and Russia/EEU – represents another challenge facing post-conflict trade transformation. While both markets had been (at least until the outbreak of the conflict last year) nominally about equally large with respect to both exports and imports, the dichotomy in the commodity composition has been substantial and the respective patterns of revealed comparative advantages quite distinct with exports to Russia/EEU generally more sophisticated (see Figure 11 where the composition of exports from Ukraine to Russia and the EU is shown, and Figure 12 where the importance of Ukrainian exports to Russia and the EU is shown in terms of their respective shares in total Ukrainian exports. Figure 11 refers to Ukraine's most competitive industries measured by revealed comparative advantage and Figure 12 to Ukraine's most important export industries in value terms).48
48 There is an additional regional dichotomy: a significant part of Ukraine’s exports (even more so of the ‘sophisticated’ ones) originated in eastern regions, not only of separatist Donetsk (19.5%) and Luhansk (5.6%), in 2013 – see further below and Chapter 6 of this report.
I2%
II8%
III4%
IV 4%
V12%
VI8%
VII2%
VIII0%
IX2%
X2%
XI2%
XII0%
XIII1%
XIV0%
XV35%
XVI10%
XVII6%
XVIII1%
XX1%
XXI0%
Other1%
I2%
II2%
III1%
IV4%
V32%
VI10%
VII5%
VIII0%
IX1%
X3%
XI3%
XII1%
XIII1%
XIV1%
XV7%
XVI16%
XVII9%
XVIII1%
XX1%
XXI0%
Other1%

36 UKRAINE’S FOREIGN TRADE AND RELATED INTEGRATION CHALLENGES
Figure 10 / Commodity structure of Ukrainian foreig n trade, 2013, in %
Note: See description Figure 8. Source: UKRSTAT, wiiw calculations.
Which sectors of Ukraine’s economy are most vulnerable to conflict-related trade disruptions? Table 4.
provides detailed data on the main export commodities (covering more than 90% of all Ukrainian exports
in 2013), showing the relative importance of key export destinations (Russia, the EU and the rest of the
world). A number of important export positions depend predominantly on the Russian market (nuclear
reactors and boilers, railway/tramway rolling stocks, inorganic chemicals, paper, plastics, etc.) and a
reorientation to other markets would be not only costly but also difficult without
modernisation/restructuring investments and appropriate transitory arrangements.49 Heyets et al. (2014)
provide detailed sectoral data and list examples of cooperation linkages between Ukraine-Russian
enterprises (Motor Sich in Zaporozhye producing helicopter motors, Sea Engineering Bureau in Odesa
designing shipyards, Steel Plant Dniprospetsstal in Zaporozhye, etc.). Interrupted Russian-Ukrainian
cooperation in space and defence sectors hurts not only the affected production facilities in Ukraine (e.g.
Yushmash in Dnipropetrovsk, Khatron-Arkos in Kharkiv producing space launchers and electronics), but
also Russia and other countries which used Ukraine-supplied rockets and electronic components in
space launching programmes.50
49 In imports from Russia (totalling USD 23.2 billion in 2013), 64% of the total represented mineral fuels and products. At the same time, Ukraine exported mineral fuels and oils valued at nearly USD 3 billion.
50 Dvorkin (2015). The cancellation of the Russian order for 60 AN-70 military cargo planes produced at the Kyiv Region-based Antonov plant will result in a loss of more than USD 4 billion – see Izvestia, 3 March 2015. For more information on major Ukrainian enterprises, their sectoral specialisation, ownership and location see Uiboubin (2006).
0
5
10
15
20
25
30
I II III IV V VI VII VIII IX X XI XII XIII XIV XV XVI XVII XVIII XX
Exports to EU27 (EUR 12.6 bn) Exports to Russia (EUR 11.4 bn)
64 %
0
5
10
15
20
25
30
I II III IV V VI VII VIII IX X XI XII XIII XIV XV XVI XVII XVIII XX
Imports from EU27 (EUR 20.3 bn) Imports from Russia (EUR 17.5 bn)
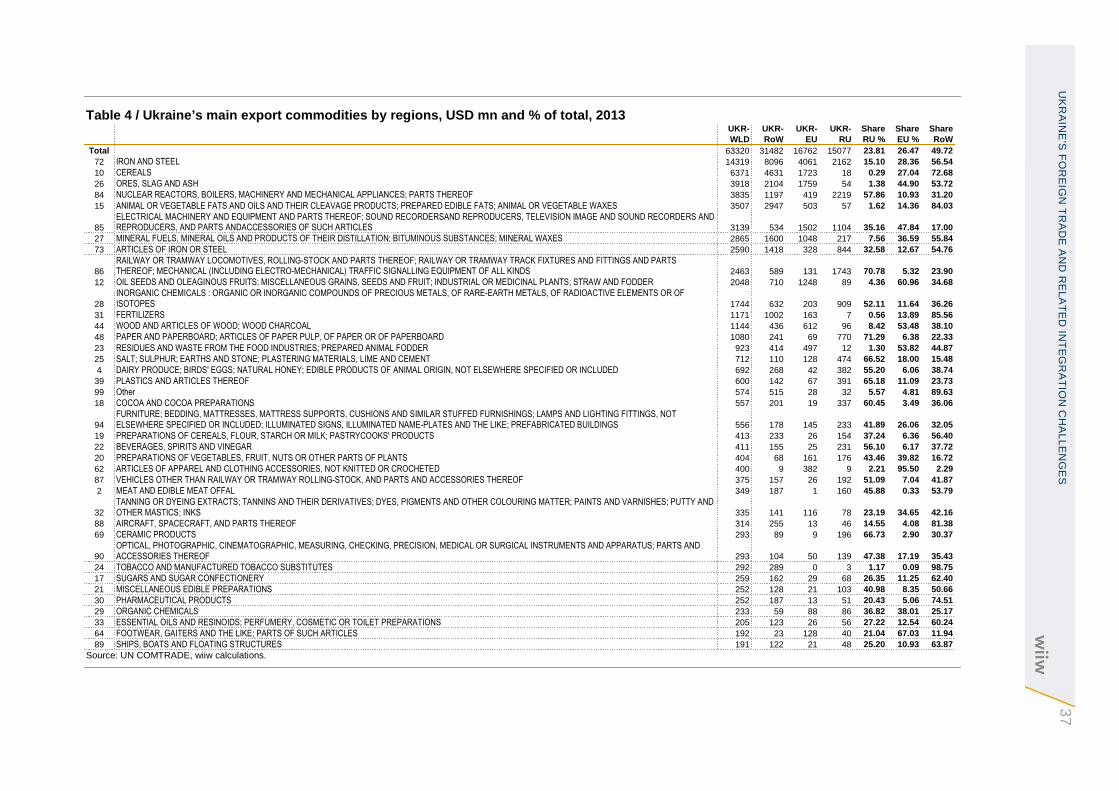
U
KR
AIN
E’S
FO
RE
IGN
TR
AD
E A
ND
RE
LA
TE
D IN
TE
GR
AT
ION
CH
AL
LE
NG
ES
37
Table 4 / Ukraine’s main export commodities by regi ons, USD mn and % of total, 2013
UKR-WLD
UKR-RoW
UKR-EU
UKR-RU
Share RU %
Share EU %
Share RoW
Total 63320 31482 16762 15077 23.81 26.47 49.72 72 IRON AND STEEL 14319 8096 4061 2162 15.10 28.36 56.54 10 CEREALS 6371 4631 1723 18 0.29 27.04 72.68 26 ORES, SLAG AND ASH 3918 2104 1759 54 1.38 44.90 53.72 84 NUCLEAR REACTORS, BOILERS, MACHINERY AND MECHANICAL APPLIANCES; PARTS THEREOF 3835 1197 419 2219 57.86 10.93 31.20 15 ANIMAL OR VEGETABLE FATS AND OILS AND THEIR CLEAVAGE PRODUCTS; PREPARED EDIBLE FATS; ANIMAL OR VEGETABLE WAXES 3507 2947 503 57 1.62 14.36 84.03
85 ELECTRICAL MACHINERY AND EQUIPMENT AND PARTS THEREOF; SOUND RECORDERSAND REPRODUCERS, TELEVISION IMAGE AND SOUND RECORDERS AND REPRODUCERS, AND PARTS ANDACCESSORIES OF SUCH ARTICLES 3139 534 1502 1104 35.16 47.84 17.00
27 MINERAL FUELS, MINERAL OILS AND PRODUCTS OF THEIR DISTILLATION; BITUMINOUS SUBSTANCES; MINERAL WAXES 2865 1600 1048 217 7.56 36.59 55.84 73 ARTICLES OF IRON OR STEEL 2590 1418 328 844 32.58 12.67 54.76
86 RAILWAY OR TRAMWAY LOCOMOTIVES, ROLLING-STOCK AND PARTS THEREOF; RAILWAY OR TRAMWAY TRACK FIXTURES AND FITTINGS AND PARTS THEREOF; MECHANICAL (INCLUDING ELECTRO-MECHANICAL) TRAFFIC SIGNALLING EQUIPMENT OF ALL KINDS 2463 589 131 1743 70.78 5.32 23.90
12 OIL SEEDS AND OLEAGINOUS FRUITS; MISCELLANEOUS GRAINS, SEEDS AND FRUIT; INDUSTRIAL OR MEDICINAL PLANTS; STRAW AND FODDER 2048 710 1248 89 4.36 60.96 34.68
28 INORGANIC CHEMICALS : ORGANIC OR INORGANIC COMPOUNDS OF PRECIOUS METALS, OF RARE-EARTH METALS, OF RADIOACTIVE ELEMENTS OR OF ISOTOPES 1744 632 203 909 52.11 11.64 36.26
31 FERTILIZERS 1171 1002 163 7 0.56 13.89 85.56 44 WOOD AND ARTICLES OF WOOD; WOOD CHARCOAL 1144 436 612 96 8.42 53.48 38.10 48 PAPER AND PAPERBOARD; ARTICLES OF PAPER PULP, OF PAPER OR OF PAPERBOARD 1080 241 69 770 71.29 6.38 22.33 23 RESIDUES AND WASTE FROM THE FOOD INDUSTRIES; PREPARED ANIMAL FODDER 923 414 497 12 1.30 53.82 44.87 25 SALT; SULPHUR; EARTHS AND STONE; PLASTERING MATERIALS, LIME AND CEMENT 712 110 128 474 66.52 18.00 15.48 4 DAIRY PRODUCE; BIRDS' EGGS; NATURAL HONEY; EDIBLE PRODUCTS OF ANIMAL ORIGIN, NOT ELSEWHERE SPECIFIED OR INCLUDED 692 268 42 382 55.20 6.06 38.74 39 PLASTICS AND ARTICLES THEREOF 600 142 67 391 65.18 11.09 23.73 99 Other 574 515 28 32 5.57 4.81 89.63 18 COCOA AND COCOA PREPARATIONS 557 201 19 337 60.45 3.49 36.06
94 FURNITURE; BEDDING, MATTRESSES, MATTRESS SUPPORTS, CUSHIONS AND SIMILAR STUFFED FURNISHINGS; LAMPS AND LIGHTING FITTINGS, NOT ELSEWHERE SPECIFIED OR INCLUDED; ILLUMINATED SIGNS, ILLUMINATED NAME-PLATES AND THE LIKE; PREFABRICATED BUILDINGS 556 178 145 233 41.89 26.06 32.05
19 PREPARATIONS OF CEREALS, FLOUR, STARCH OR MILK; PASTRYCOOKS' PRODUCTS 413 233 26 154 37.24 6.36 56.40 22 BEVERAGES, SPIRITS AND VINEGAR 411 155 25 231 56.10 6.17 37.72 20 PREPARATIONS OF VEGETABLES, FRUIT, NUTS OR OTHER PARTS OF PLANTS 404 68 161 176 43.46 39.82 16.72 62 ARTICLES OF APPAREL AND CLOTHING ACCESSORIES, NOT KNITTED OR CROCHETED 400 9 382 9 2.21 95.50 2.29 87 VEHICLES OTHER THAN RAILWAY OR TRAMWAY ROLLING-STOCK, AND PARTS AND ACCESSORIES THEREOF 375 157 26 192 51.09 7.04 41.87 2 MEAT AND EDIBLE MEAT OFFAL 349 187 1 160 45.88 0.33 53.79
32 TANNING OR DYEING EXTRACTS; TANNINS AND THEIR DERIVATIVES; DYES, PIGMENTS AND OTHER COLOURING MATTER; PAINTS AND VARNISHES; PUTTY AND OTHER MASTICS; INKS 335 141 116 78 23.19 34.65 42.16
88 AIRCRAFT, SPACECRAFT, AND PARTS THEREOF 314 255 13 46 14.55 4.08 81.38 69 CERAMIC PRODUCTS 293 89 9 196 66.73 2.90 30.37
90 OPTICAL, PHOTOGRAPHIC, CINEMATOGRAPHIC, MEASURING, CHECKING, PRECISION, MEDICAL OR SURGICAL INSTRUMENTS AND APPARATUS; PARTS AND ACCESSORIES THEREOF 293 104 50 139 47.38 17.19 35.43
24 TOBACCO AND MANUFACTURED TOBACCO SUBSTITUTES 292 289 0 3 1.17 0.09 98.75 17 SUGARS AND SUGAR CONFECTIONERY 259 162 29 68 26.35 11.25 62.40 21 MISCELLANEOUS EDIBLE PREPARATIONS 252 128 21 103 40.98 8.35 50.66 30 PHARMACEUTICAL PRODUCTS 252 187 13 51 20.43 5.06 74.51 29 ORGANIC CHEMICALS 233 59 88 86 36.82 38.01 25.17 33 ESSENTIAL OILS AND RESINOIDS; PERFUMERY, COSMETIC OR TOILET PREPARATIONS 205 123 26 56 27.22 12.54 60.24 64 FOOTWEAR, GAITERS AND THE LIKE; PARTS OF SUCH ARTICLES 192 23 128 40 21.04 67.03 11.94 89 SHIPS, BOATS AND FLOATING STRUCTURES 191 122 21 48 25.20 10.93 63.87
Source: UN COMTRADE, wiiw calculations.

38 UKRAINE’S FOREIGN TRADE AND RELATED INTEGRATION CHALLENGES
Figure 11 / Top 15 most competitive industries of U kraine, 2013
Note: Horizontal axis: share of an industry in total exports from Ukraine to Russia; vertical axis: share of an industry in total exports from Ukraine to EU; bubble size corresponds to the RCA index value of an industry.51 Source: Authors’ calculations based on UN Comtrade data.
There is an additional important regional component in the destination of Ukraine’s exports (which will be
further discussed in Chapter 6): Kyiv Region, Ivano-Frankivsk, Khmelnitsky, Kharkiv and Sumy are
particularly dependent on Russian/EEU markets (more than half of regional exports). Moreover, several
eastern regions (Luhansk, Donetsk and Dnipropetrovsk) represent, apart from the City of Kyiv, the
biggest Ukrainian exporters and would suffer the most from trade disruptions with Russia/EEU.
Obviously, the first policy implication of the diverse geographic and commodity trade patterns outlined
above is that it would be rather costly for Ukraine to abandon a quarter of its export market in the east
(part of it has already been lost). Moreover, the huge regional dichotomy in the commodity composition
of Ukraine’s trade (and its labour market, social, political and other implications) represent another
challenge which is seldom taken into account in trade integration discussions.52 As shown above,
51 The RCA index, based on Balassa (1965, 1986), measures the relative advantage of country c in industry i in year t, and is constructed as follows: ���� �
�����/ �
�����/ � , where x(i) is the value of exports of industry i (in our case, HS 2-digit
level) and X is the total value of exports from Ukraine (UKR) or world (W). A country reveals a comparative advantage in a particular industry i if the RCA index for that industry is greater than unity, i.e. the export share of a country in that industry is higher than the world average export share for that industry.
52 The latest EU Joint Staff Working Document on the implementation of the Neighbourhood Policy from 25 March 2015 mentions briefly that ‘the type of goods exported to the EU were different to those exported to Russia’ without mentioning the trade policy implications – see http://eeas.europa.eu/enp/pdf/2015/ukraine-enp-report-2015_en.pdf.

UKRAINE’S FOREIGN TRADE AND RELATED INTEGRATION CHALLENGES
39
Ukraine’s exports to Russia – more often than not originating from the eastern part of Ukraine – display
a more ‘advanced’ structure: machinery, equipment, aircraft, vessels and other transport equipment.
Admittedly, these exports are frequently remnants of past cooperation linkages persisting from the
Soviet period which are largely non-competitive on other markets. Even with adequate investments, a
restructuring, conversion and reorientation of the respective export capacities would be extremely
challenging.
Figure 12 / Destination of top 15 biggest export in dustries of Ukraine, 2013
Note: Horizontal axis: share of Russia in total industry exports from Ukraine; vertical axis: share of the EU in total industry exports from Ukraine; bubble size corresponds to the value of the industry exports in USD million. Source: Authors’ calculations based on UN Comtrade data.
CHALLENGES OF IMPLEMENTING THE DEEP AND COMPREHENSIVE FREE
TRADE AREA (DCFTA) WITH THE EU
Regional and commodity trade asymmetries have also many additional implications for the evolution of a
future association of Ukraine with the EU, the implementation of the AA/DCFTA (see Boxes 2 and 3
below) and for the design of trade policy in general. Ukraine’s position between the EU and the Russia-
led Eurasian Economic Union (EEU) and its nearly equal (yet asymmetric) dependence on both markets
puts forward the challenge how to maintain, expand and deepen trade relations in both the EU and the
‘eastern’ EEA directions. A balanced trade policy could play an important role towards attracting
investments and advancing modernisation, with Ukraine potentially developing trade relations with both
the EU and the EEU, turning its geographic location from a curse to a competitive advantage and
serving as a bridge between the two integration blocs. Ukraine still maintains a free trade agreement
with the CIS countries and formally this includes free trade with Russia/EEU as well. The alleged
IRON AND STEEL;14319CEREALS; 6371
ORES, SLAG AND ASH; 3918
NUCLEAR REACTORS; 3835ANIMAL OR
VEGETABLE FATS AND OILS ; 3507
ELECTRICAL MACHINERY AND
EQUIPMENT; 3139
MINERAL FUELS; 2865
ARTICLES OF IRON OR STEEL;2590
RAILWAY OR TRAMWAY
LOCOMOTIVES, 2463
OIL SEEDS AND OLEAGINOUS
FRUITS; INDUSTRIAL OR MEDICINAL
PLANTS; STRAW AND FODDER; 2048
INORGANIC CHEMICALS 1744
FERTILISERS; 1171
WOOD; 1144
PAPER AND PAPERBOARD;1080
RESIDUES AND WASTE FROM THE
FOOD INDUSTRIES;923
-5
0
5
10
15
20
25
30
35
40
45
50
55
60
65
70
75
-5 0 5 10 15 20 25 30 35 40 45 50 55 60 65 70 75
Share of the EU in total industry exports from Ukraine, %
Share of Russia in total industry exports of Ukrain e, %
40 UKRAINE’S FOREIGN TRADE AND RELATED INTEGRATION CHALLENGES
incompatibility of the DCFTA and the EEU – unless there is an FTA between the EEU (and the
concomitant Customs Union) and the EU – has been one of the sore points which sparked the conflict
after Ukraine decided to delay the signature of the AA/DCFTA at the Vilnius Eastern Partnership Summit
in November 2013 (see Havlik, 2013 for more details).53
Russia claims that its market would be flooded by EU products re-exported via Ukraine (as borders are
porous and rules of origin are generally not observed) and its exports to Ukraine will be crowded out by
more competitive EU products. Moreover, additional costs (to Russia) would allegedly arise from
Ukraine’s takeover of the EU acquis after the DCFTA obligatory implementation of EU technical
standards and SPS norms. These (and other objections related to allegedly horrendous costs for
Ukraine) were first raised by Putin’s economic advisor S. Glazyev well before the failed Vilnius EaP
Summit in November 2013 and eventually led President Yanukovych to delay the AA/DCFTA
signature.54 The EU strongly denied the validity of such objections and published a number of detailed
counterarguments.55 Nevertheless, Russia demands changes in the EU-Ukraine trade deal and
threatens to revoke the Ukraine-CIS Free Trade agreement, imposing tariffs on its imports from Ukraine
comparable to those existing in trade with the EU. In a series of exchanges between Russia and the EU
Commission (including the correspondence between Putin and Barroso) in September 2014, Russia
reiterated its concerns regarding adverse impacts of the DCFTA on its domestic economy. In September
2014, a trilateral meeting of the EU Commission, Ukraine and Russia agreed to postpone the
implementation of the DCFTA by Ukraine until end-2015. In exchange, Russia agreed to maintain the
CIS free trade agreement with Ukraine.56
Russia insists on further negotiations, requiring an amendment of the DCFTA and being de facto a party
in future EU negotiations with Ukraine. According to a document leaked to the Ukrainian press,57 Russia
allegedly demands to remove more than 2000 positions from the tariff-free access for EU exporters to
the Ukrainian market and calls for guarantees of openness of the Ukrainian market for Russia (see
Figure 13 for details). With respect to technical regulations and SPS norms, Russia requests an
amendment of the DCFTA which would allow Ukraine to apply both the EU and existing CISFTA
regulations simultaneously even after the DCFTA is fully implemented.
Apart from the loss of face for the EU, the delay in the implementation of the DCFTA also results in a
delay of its expected benefits (see Box 3 and Speck, 2014; Emerson, 2014c). Would the newly signed
AA/DCFTA with the EU – assuming it is actually implemented (which is far from certain, taking into
account the poor track record of Ukraine’s compliance with its contractual obligations so far and Russian
pressures) – be conducive towards reaching the goal to restructure and modernise Ukraine’s economy
via FDI inflows, as well as to implement the required institutional reforms (‘acquis’) even without an
explicit EU accession ‘anchor’?58
53 Paradoxically, Ukraine, Russia and the EU agreed in September 2014 at the trilateral meeting in Brussels to delay the implementation of the trade-related part of the AA/DCFTA until end-2015 – see Havlik (2014) and Financial Times, 4 February 2015 for a detailed account of the controversial negotiations.
54 At that time, the Ukrainian government estimated the costs of signing the AA/DCFTA at nearly USD 40 billion in 2014 (http://www.kmu.gov.ua/control/ru/publish/article?art_id=246935198&cat_id=246935198).
55 See ‘Myths about the EU-Ukraine Association Agreement: Setting the facts straight’, European Commission, 22 January 2014.
56 See http://europa.eu/rapid/press-release_ STATEMENT-14-276 of 12 September 2014. See also Emerson (2014b). 57 See http://zn.ua/static/file/russian_proposal.pdf 58 The AA/DCFTA was ratified by the European and Ukrainian parliaments on 16 September 2014. It entered provisionally
into force in April 2014 and tariffs on Ukraine’s exports to the EU were abolished, but the implementation on the Ukraine’s side was delayed until end-2015 by the decision reached at the Joint Ministerial meeting in September 2014.

UKRAINE’S FOREIGN TRADE AND RELATED INTEGRATION CHALLENGES
41
Figure 13 / Exemptions from the Ukraine-EU AA/DCFTA proposed by Russia
(by HS 2-digit industry group; total number of product titles listed is 2385)
Source: Own calculations based on: http://zn.ua/static/file/russian_proposal.pdf.
6
154
118
107
21
14
67
3
60
14
16
22
42
188
36
154
4
8
16
28
2
30
5
5
22
153
28
1
5
41
3
44
27
193
16
40
17
7
22
138
8
67
172
169
9
11
68
4
0 20 40 60 80 100 120 140 160 180 200LIVE ANIMALS
MEAT AND EDIBLE MEAT OFFAL
DAIRY PRODUCE; BIRDS' EGGS; NATURAL HONEY; EDIBLE PRODUCTS OF ANIMAL ORIGIN, NOTELSEWHERE SPECIFIED OR INCLUDED
EDIBLE VEGETABLES AND CERTAIN ROOTS AND TUBERS
EDIBLE FRUIT AND NUTS; PEEL OF CITRUS FRUITS OR MELONS
CEREALS
PRODUCTS OF THE MILLING INDUSTRY; MALT; STARCHES; INULIN; WHEAT GLUTEN
OIL SEEDS AND OLEAGINOUS FRUITS; MISCELLANEOUS GRAINS, SEEDS AND FRUIT; INDUSTRIAL ORMEDICINAL PLANTS; STRAW AND FODDER
ANIMAL OR VEGETABLE FATS AND OILS AND THEIR CLEAVAGE PRODUCTS; PREPARED EDIBLE FATS;ANIMAL OR VEGETABLE WAXES
PREPARATIONS OF MEAT, OF FISH OR OF CRUSTACEANS, MOLLUSCS OR OTHER AQUATICINVERTEBRATES
SUGARS AND SUGAR CONFECTIONERY
COCOA AND COCOA PREPARATIONS
PREPARATIONS OF CEREALS, FLOUR, STARCH OR MILK; PASTRYCOOKS' PRODUCTS
PREPARATIONS OF VEGETABLES, FRUIT, NUTS OR OTHER PARTS OF PLANTS
MISCELLANEOUS EDIBLE PREPARATIONS
BEVERAGES, SPIRITS AND VINEGAR
TOBACCO AND MANUFACTURED TOBACCO SUBSTITUTES
SALT; SULPHUR; EARTHS AND STONE; PLASTERING MATERIALS, LIME AND CEMENT
INORGANIC CHEMICALS : ORGANIC OR INORGANIC COMPOUNDS OF PRECIOUS METALS, OF RARE-EARTH METALS, OF RADIOACTIVE ELEMENTS OR OF ISOTOPES
ORGANIC CHEMICALS
FERTILIZERS
TANNING OR DYEING EXTRACTS; TANNINS AND THEIR DERIVATIVES; DYES, PIGMENTS AND OTHERCOLOURING MATTER; PAINTS AND VARNISHES; PUTTY AND OTHER MASTICS; INKS
ESSENTIAL OILS AND RESINOIDS; PERFUMERY, COSMETIC OR TOILET PREPARATIONS
SOAP, ORGANIC SURFACE-ACTIVE AGENTS, WASHING PREPARATIONS, LUBRICATING PREPARATIONS,ARTIFICIAL WAXES, PREPARED WAXES, POLISHING OR SCOURING PREPARATIONS, CANDLES AND…
MISCELLANEOUS CHEMICAL PRODUCTS
PLASTICS AND ARTICLES THEREOF
RUBBER AND ARTICLES THEREOF
COTTON
WADDING, FELT AND NONWOVENS; SPECIAL YARNS; TWINE, CORDAGE, ROPES AND CABLES ANDARTICLES THEREOF
CARPETS AND OTHER TEXTILE FLOOR COVERINGS
IMPREGNATED, COATED, COVERED OR LAMINATED TEXTILE FABRICS; TEXTILE ARTICLES OF A KINDSUITABLE FOR INDUSTRIAL USE
KNITTED OR CROCHETED FABRICS
ARTICLES OF APPAREL AND CLOTHING ACCESSORIES, KNITTED OR CROCHETED
ARTICLES OF APPAREL AND CLOTHING ACCESSORIES, NOT KNITTED OR CROCHETED
OTHER MADE-UP TEXTILE ARTICLES; SETS; WORN CLOTHING AND WORN TEXTILE ARTICLES; RAGS
FOOTWEAR, GAITERS AND THE LIKE; PARTS OF SUCH ARTICLES
ARTICLES OF STONE, PLASTER, CEMENT, ASBESTOS, MICA OR SIMILAR MATERIALS
CERAMIC PRODUCTS
GLASS AND GLASSWARE
ARTICLES OF IRON OR STEEL
NUCLEAR REACTORS, BOILERS, MACHINERY AND MECHANICAL APPLIANCES; PARTS THEREOF
ELECTRICAL MACHINERY AND EQUIPMENT AND PARTS THEREOF; SOUND RECORDERSANDREPRODUCERS, TELEVISION IMAGE AND SOUND RECORDERS AND REPRODUCERS, AND PARTS…
RAILWAY OR TRAMWAY LOCOMOTIVES, ROLLING-STOCK AND PARTS THEREOF; RAILWAY OR TRAMWAYTRACK FIXTURES AND FITTINGS AND PARTS THEREOF; MECHANICAL (INCLUDING ELECTRO-…
AIRCRAFT, SPACECRAFT, AND PARTS THEREOF
OPTICAL, PHOTOGRAPHIC, CINEMATOGRAPHIC, MEASURING, CHECKING, PRECISION, MEDICAL ORSURGICAL INSTRUMENTS AND APPARATUS; PARTS AND ACCESSORIES THEREOF
CLOCKS AND WATCHES AND PARTS THEREOF
TOYS, GAMES AND SPORTS REQUISITES; PARTS AND ACCESSORIES THEREOF
MISCELLANEOUS MANUFACTURED ARTICLES
42 UKRAINE’S FOREIGN TRADE AND RELATED INTEGRATION CHALLENGES
BOX 2 / WHAT IS THE CONTENT OF THE EU-UKRAINE DCFTA ?
The EU-UA DCFTA represents a part of the Association Agreement and consists of 15 Chapters,
14 Annexes and 3 protocols – altogether more than 900 pages of text which was published in November
2012, and few experts have probably actually read it. According to Chapter 1 (Market Access for Goods)
the vast majority of customs duties (99.1% by Ukraine and 98.1% by the EU) will be removed as soon as
the Agreement enters into force after the ratification process is completed. Few sectors will obtain
transition periods for removing customs duties (e.g. the automotive sector in Ukraine for 15 years and
some agriculture products in the EU for up to 10 years); WTO rules will be generally applied to non-
tariffs barriers. According to EC estimates, Ukrainian exporters will save EUR 487 million annually due to
reduced EU import duties while Ukraine will remove around EUR 390 million in duties on imports from
the EU. Ukraine will progressively adapt its technical regulations and standards to those of the EU.59
Chapter 6 (which deals with services) aims at the expansion of the EU internal market ‘once Ukraine
effectively implements the EU-acquis’. Similar wording is used in relation to financial services, telecom,
postal and maritime services. Chapter 8 (Public procurement) provides exceptions for the defence
sectors in both Ukraine and the EU. For the first time, Ukraine’s DCFTA includes specific provisions on
trade-related energy issues (Chapter 11; Ukraine is already a member of the Energy Community Treaty
which imposes an obligation to implement the EU energy acquis on electricity and gas). These include
rules on pricing, prohibition of dual pricing and transport interruption to third countries as well as rules on
non-discriminatory access to the exploration and production of hydrocarbons. Importantly, Protocol I of
the DCFTA deals with rules of origin and defines the ‘economic nationality’ of products needed to
determine the duties applicable to traded goods. Future EU-Ukraine relations will include EU-Ukraine
summits and the Association Council with the power to take binding decisions. Last but not least, Article
39 of the agreement explicitly stipulates that the DCFTA ‘shall not preclude the maintenance or
establishment of customs unions, free trade areas or arrangements for frontier traffic except insofar as
they conflict with trade arrangements provided for in this agreement’ and consultations regarding these
matters will take place within the Trade Committee.
Source: European Commission, DG Trade and Industry. For the English version of the whole text see EU Ukraine Association Agreement English - 2012_11_19_EU_Ukraine_Association_Agreement_English.pdf published on 19 November 2012 (a concise summary was published on the European Commission DG Trade website on 26 February 2013).
The EU has attempted to dismiss fears of Ukrainian (and Russian) opponents of the DCFTA (see Box 3
for some explanations provided by the EU). Admittedly, DCFTA implementation will be costly, especially
in the short run, and the EU initially offered compensation and assistance (Havlik, 2013). Yet in the
medium and long run considerable benefits are expected from increased trade, investments,
competitiveness and improved welfare in general – as usually forecast in trade integration studies (see,
for example, Pelipas et al., 2014 for an overview of integration effects studies). Before the 2013 Vilnius
EaP Summit, European Commissioner for Enlargement and Neighbourhood Policy Štefan Füle
attempted to de-escalate the situation, promised Ukraine a speedier AA/DCFTA implementation and
59 See EU-Ukraine Association Agreement, Chapter 3, Technical barriers to trade. There is no available EC estimate for Ukraine’s acquis takeover costs but, according to Ukrainian sources, these costs are doubtlessly considerable (see also Dreyer, 2012). Commissioner Füle, in his speech on 11 October 2013, mentioned the intention to help with an ‘indicative amount of EUR 186 million’. For more details see Havlik (2013). For the experience of CEE NMS and the respective ‘acquis takeover’ costs estimates see Commission of the European Communities (2003).
UKRAINE’S FOREIGN TRADE AND RELATED INTEGRATION CHALLENGES
43
also declared that the European Commission is ‘working on overcoming the issues of legal compatibility
between the AA and Customs Union’ in order to ‘prevent new walls in Europe’.60 Mr. Füle also sharply
rebuked claims regarding the adverse effects of an AA/DCFTA.61 In October 2013, he announced a
‘post-Vilnius agenda’ for Ukraine which would include financial assistance to support the implementation
of the Association Agreement amounting to EUR 186 million and to move ahead with a macro-financial
assistance of EUR 610 million, ‘once the conditions are in place’.62 In the meantime, the EU assistance
promised to Ukraine (not always related to AA/DCFTA implementation) has considerably increased:
EUR 11 billion to support reforms, EUR 1.61 billion Macro Financial Assistance, etc.63 In March 2015, a
new IMF Extended Fund Facility (EFF) programme was adopted (see Chapter 2 above). The EFF
comprises a USD 17.5 billion credit extended over a four-year period, and the overall western financial
package (including the EU, the USA, IMF, EBRD, etc.) is set at USD 40 billion (including USD 15 billion
to be saved via sovereign debt restructuring) – a considerably larger amount than offered initially, before
the outbreak of the conflict.
BOX 3 / UKRAINE AND DCFTA IMPLEMENTATION – FACT SHE ET FROM THE EU
‘With the implementation of the Association Agreement, Ukraine will adopt EU standards for key
industrial sectors, and firms will be required to undertake the necessary changes and investments that
will result in the production of better and higher quality goods. The Agreement identifies several
industrial sectors where the approximation to the EU regulations and standards is already foreseen, to
be phased in over a number of years. For other sectors, including the agricultural sector, the Agreement
foresees that the EU and Ukraine will agree a timetable for movement to EU standards. To make sure
that the adoption of new standards results from a managed and controlled process, the Agreement gives
Ukraine a certain amount of power to decide which sectors to prioritise, and the period of time required
to make the changes.
This process will certainly not be achievable without cost. Modernisation of the Ukrainian industry
cannot be done without investments that have unfortunately been lacking over the past 20 years. A
considerable amount of investment will be needed by the companies themselves, by foreign investors
and by assistance from government and the international financial institutions. But such investments will
ultimately benefit the domestic and international competitiveness of Ukraine-based industries, and
will benefit consumers by providing better quality goods. The EU is committed to provide its
assistance, advice and experience in this important area.’
Source: Abbreviated from ‘Fact sheet: Frequently asked questions about Ukraine, the EU's Eastern Partnership and the EU-Ukraine Association Agreement’, Brussels, External Action, 12 June 2014.
60 See Mr. Füle’s speech at the conference in Yalta, Ukraine, on 20 September 2013. 61 See the above quoted speeches by Mr. Füle at the international conference in Kyiv and before the Ukrainian Parliament
on 11 October 2013 at http://europa.eu/rapid/press-release_SPEECH-13-808_en.htm and 13-810_en.htm. 62 Ibid. 63 Fact Sheet EU-Ukraine relations, Brussels, 12 September 2014, 140912/01.
44 UKRAINE’S FOREIGN TRADE AND RELATED INTEGRATION CHALLENGES
The implications of serious trade disruptions with Russia/EEU – apart from the direct consequences of
the armed conflict in eastern Ukraine – have been analysed already before.64 In particular, trade
disruptions with Russia would affect Ukraine’s machine-building sector, which accounted for 3.5% of
Ukraine’s GDP and 5.5% of employment in 2012 (gross output accounted for nearly USD 20 billion and
600 thousand employees). A complete loss of the Russian machine-building exports would directly
reduce Ukrainian GDP by 1.1% according to these estimates.65 However, the overall immediate losses
resulting from trade disruptions with Russia and the EEU will most likely be higher, weighing heavily on
Ukraine’s economy and society for a longer time. Estimates show that just 15% of Ukraine’s major
export positions traded with the Russian-led EEU could be potentially relocated to other markets (in
value terms, these are just USD 2.9 billion of exports out of more than USD 19 billion exported to the
EEU in 2013; see Heyets and Shinkaruk, 2014), and the annual revenue loss may reach some USD 15
billion. In addition to reduced goods exports, Ukraine is likely to suffer also from reduced transit fees for
gas exports as Russia will now surely accelerate its efforts to bypass Ukraine as a gas transit country.66
Moreover, there will also be less FDI from Russia and a potential loss of money transfers from Russia at
USD 7-8 billion (about 5% of Ukrainian GDP).67 Net revenues from transport services amounted to more
than EUR 3 billion in 2013. In the worst case of a ‘shock scenario’, Vinokurov et al. (2014) estimate the
annual loss from the break-up of economic relations with Russia for Ukraine at USD 33 billion and the
cumulated overall losses for the period 2015-2018 up to USD 100 billion.68
SPECTRUM OF TRADE INTEGRATION OPTIONS FOR UKRAINE
While Ukraine has made progress in the direction of EU integration with the signature of the AA, the dilemma
between European and Eurasian integration that was at the heart of the conflict in 2013/2014 still holds as the
split between western and eastern parts of the country will last into the foreseeable future. In the long run,
successful EU integration is expected to bring multiple benefits to Ukraine not only in the trade dimension, but
also in reforming institutions and infrastructure building, altogether allowing for more investments and a more
sustainable economic development. However, there is also a viable economic logic behind preserving
existing linkages and promoting integration efforts also with respect to Eurasian integration, stemming from
the strong economic linkages between Ukraine and Russia formed during the past. For Ukraine, the abrupt
choice between European and Eurasian integration is even more difficult, as it is among the countries that still
64 Apart from Glazyev’s and Yanukovych’s above-quoted government estimates, see, for instance, Saha et al. (2014) and Vinokurov et al. (2014). These authors estimate that one third of Ukraine’s machine-building output was exported to Russia in 2012 and is potentially threatened.
65 This is without military-related and dual-use trade which has been restricted by both Ukrainian (on 16 June 2014) and Russian authorities after the outbreak of the military conflict. Russia stopped also the cooperation in the space industry affecting 80% of the production of the Yuzhmash Plant in Dnepropetrovsk (Gazeta.ru, 2 February 2015).
66 Instead of the abandoned South Stream pipeline, Russia plans to build an alternative ‘Turkish Stream’ pipeline which will also bypass Ukraine – see http://www.euractiv.com/sections/energy/russia-says-it-will-shift-gas-transit-ukraine-turkey-311291.
67 Officially recorded remittances of Ukrainians working in Russia amounted to more than USD 3 billion in 2013 according to the Central Bank of Russia – see http://www.cbr.ru/statistics/print.aspx?file=CrossBorder/C-b_trans_countries_13.htm&pid=svs&sid=TGO_sp.
68 English summary available at http://www.eabr.org/e/research/centreCIS/projectsandreportsCIS/index.php?id_4=41399. The Ukrainian Industrialist Union estimated in June 2014 that cumulated costs related to the implementation of the DCFTA would amount to EUR 170-180 billion over a ten-year period – see Kommersant, 22 September 2014. These estimates are presumably based on the extrapolation of the estimated acquis-related costs incurred earlier in Poland. Before the EU eastern enlargement in 2004, a study by the European Commission estimated the costs of the takeover of the environmental ‘acquis’ by the CEECs to range between EUR 80 and 100 billion – see Commission of the European Communities (2003).
UKRAINE’S FOREIGN TRADE AND RELATED INTEGRATION CHALLENGES
45
maintain relatively technology-intensive production linkages and intra-industry trade (along with Belarus,
Russia, and Uzbekistan) which is exposed to significant risks in the case of one-sided EU integration.
Reverting back to the pre-conflict state with the Kyiv government regaining control over the entire Ukraine is
highly unlikely and – in the best-case scenario – one can hope that after the military clash has ended Ukraine
will attain a ‘frozen conflict’ state with a certain degree of decentralisation/autonomy granted to Ukraine’s
rebel-controlled East. Therefore, leaving aside extreme scenarios involving continuing military clashes or
even outright war, the space for possible economic integration routes in Ukraine is rather narrow:
Scenario 1. European integration + standard MFN regi me with Russia/the EEU. Ukraine focuses on
EU integration and implements the AA/DCFTA while abandoning efforts to achieve any preferential trade
options with Russia and the EEU. In turn, Russia along with its EEU partners suspends the (formally still
existing) free trade agreement with Ukraine and replaces it with the ‘most favoured nation’ regime along
WTO lines. Furthermore, the EEU or Russia may selectively apply non-tariff barriers to Ukrainian
products deemed to be sensitive for the Russian/EEU market. However, in this case EU integration also
risks to be hindered. Taking into account how the conflict has been evolving so far, after the military
pressures abate, Ukraine is very likely to face the ‘Transnistriasation’/‘Bosniasation’ issues: while the
territorial integrity of Ukraine is formally preserved, rebel-controlled eastern Ukraine territories are de
facto either granted extensive autonomy if Kyiv agrees to proceed with the federalisation of Ukraine, or,
alternatively, they fail to recognise Kyiv’s legal authority and remain in a unresolved ‘special’ status akin
to Transnistria in Moldova, rejecting the idea of the EU integration.69 In the case of federalisation,
eastern Ukraine gains the ability to influence or veto important strategic decisions by the Kyiv
government, which may result, given Russia’s significant political and economic influence on the region,
in a largely dysfunctional state, somewhat resembling the complex political structure of Bosnia and
Herzegovina. This will preclude or severely undermine attempts by the Kyiv central government to
implement the AA/DCFTA-related reforms on the whole Ukrainian territory. Therefore, under this
scenario, strategic decisions concerning economic or political integration with the EU will be delayed
(frozen) while the push for more EU integration attempted by the central government may reignite the
frozen conflict and/or trigger the realisation of Scenario 4.
Scenario 2. European integration + preferential tra de regime with the EEU/CISFTA for all or
selected product categories with ‘rules of origin’ . Participation of a country in several free trade
zones does create policy contradictions, but these can still be effectively addressed. The DCFTA
precludes entry of Ukraine to the EEU as its member states share common external tariff, as well as
coordinated economic policies. However, it is compatible with the preferential trade regime within the
CIS Free Trade Agreement signed in 2011 between Armenia, Belarus, Moldova, Kazakhstan,
Kyrgyzstan, Russia, Ukraine and Uzbekistan. It should be noted that neither the DCFTA nor the CISFTA
block their members from participating in other trade agreements and, in fact, Belarus, Kazakhstan and
Russia have been concurrently operating under the Eurasian Customs Union regime since 2010.
Overall, there are multiple cases of countries participating in several preferential trade arrangements
69 Moldova’s breakaway region of Transnistria is heavily dependent on Russia, which has considerable military presence there and accounts for some 70-80% of the Transnistrian budget. While Moldova signed an AA with the EU in 2014, Transnistria has been refusing so far to join the DCFTA, despite the fact that about a third of its exports are directed to the EU due to the concurrent EU Autonomous Trade Preferences regulation (ATP). Moldova may now quickly become another arena of conflict driven by the EU-Russia tensions, given its intensifying political crisis and the expiry of the ATP by the end of 2015. In the recent local elections in March 2015, the Gagausian separatist region in Moldova voted for accession to the EEU. See also: http://www.euractiv.com/europes-east/moldova-eu-commission-clarifies-news-532785; http://www.neweasterneurope.eu/articles-and-commentary/1462-transnistria-s-economy-going-from-bad-to-worse

46 UKRAINE’S FOREIGN TRADE AND RELATED INTEGRATION CHALLENGES
simultaneously; for instance, the United States, Canada and Mexico, while being part of NAFTA,
individually negotiated free trade agreements with other countries. Achieving such an arrangement may
certainly not be an easy task given Ukraine’s commitments under the EU approximation requirements,
and the terms should be negotiated individually. However, the legal framework of both blocs does leave
enough room to address major concerns expressed by Russia regarding Ukraine-EU relations
(discussed later in more detail). The fears that Ukraine may re-export to Russia goods brought in from
the EU duty-free may be addressed by following ‘rules of origin’ – a commonly used approach to deal
with the so-called problem of trade deflection arising as a result of differences in tariff levels between
partners within the same trade bloc. In addition, exemption/temporary exclusion lists for product groups
deemed to be sensitive for the EEU/CISFTA and Ukraine could be negotiated. In the worst case, if it is
discovered that such a trade arrangement leads to imbalanced trade and is hurting certain industries of
the bloc, the CISFTA Agreement (Article 18 and Annex 6 to the agreement) allows the Customs Union
members to revert to MFN after negotiations with member states.
Scenario 3. Free trade area arrangement between the EU and the EEU or CISFTA. As already
mentioned, it is often argued that the EU and the EEU are mutually exclusive blocs as one cannot satisfy
the requirements of having higher tariffs against the EU while simultaneously abolishing them under the
regulations of the AA/DCFTA, unless the two blocs establish a common free trade area. A general
willingness to facilitate free trade ‘from Lisbon to Vladivostok’ was already indicated by the leaders of
Russia and Germany. Spanning a huge territory, such an arrangement would bring not only significant
economic benefits to the members, but would also help to trigger the necessary structural changes in
the Eurasian economies and resolve Ukraine’s geopolitical trade orientation dilemma. However,
importantly, it is not merely the legal provisions that raise a sharp divide between the two trade blocs,
but the differences in the shared values, and social and political institutions. The possibility of progress
along a joint pan-European-Eurasian free trade area nowadays lies almost entirely in the political
dimension, and unfortunately the situation in Russia is currently steering in the opposite direction, with
long-run negative consequences for the entire region. Yet, for the Eurasian economies now could be the
time for a turning point and an optimal choice as the prospects for the commodity-based EEU
economies are bleak and alternative development strategies are being considered. Trilateral
negotiations focusing on the implications of Ukraine’s EU integration could trigger at least some
progress in the direction of a free trade area ‘from Lisbon to Vladivostok’ which would relieve Ukraine
from the unfortunate ‘either/or’ integration dilemma.
Scenario 4. Ukraine split: European integration of w estern Ukraine, Eurasian integration of
eastern Ukraine. Assuming that the legal space of western Ukraine and eastern Ukraine controlled by
the pro-Russian separatists is ultimately split, trade and non-trade flows between Russia and eastern
Ukraine will be determined solely by the Russian side and local authorities of the rebel-controlled
regions. In relation to this, it is not very clear what the pro-Russian factions in eastern Ukraine are trying
to achieve in the longer run with regard to their foreign economic relations. Some signals via sporadic
public announcements suggest that they might wish to have a special territory status which would allow
to conduct independent external economic activities and to maintain close ties with Russia and the EEU.
This may yield way to an ‘exotic’ scenario in which, with deep ‘Transnistriasation’ of Ukraine and heavy
Russian influence across the pro-Russian territories, unlike in Scenario 1, Russia may choose to
preserve preferential trade and possibly attempt a deeper integration with selected eastern territories of
Ukraine, while the Kyiv central government may find it less costly to focus on the AA/DCFTA and route
its resources to the territories under its direct control, allowing for some sort of special economic zone
UKRAINE’S FOREIGN TRADE AND RELATED INTEGRATION CHALLENGES
47
arrangement for the eastern territories or maintaining a ‘frozen conflict’ state. However, the idea of such
a special economic zone for a part of Ukraine itself looks awkward, implying that border controls
between western and eastern Ukraine are established along with the ‘rules of origin’, which would
ultimately undermine the notion of Ukraine as a single state and inhibit EU integration of Ukraine.
WHAT TO DO IN ORDER TO LIMIT THE POTENTIAL DAMAGE: POLICY IMPLICATIONS
Obviously, the first recommendation would be to stop the armed conflict, try to normalise the (economic)
relations with Russia and maintain/develop trade linkages with both the EU and the Russian-led blocs of
the EEU and/or the CISFTA.70 However, at present this appears fairly unrealistic even in the medium
term and alternative solutions need to be explored in order to curtail the potential damages. Ukraine’s
domestic market will not – even under ‘normal’ conditions and without the crisis-related effects of the
conflict – be able to absorb the redundant machine-building output which used to be exported to the
east. A redirection of exports to third markets and/or a conversion of military-related cooperation
linkages will also be difficult – even in the medium and long run. Though politically difficult in the current
circumstances, a negotiated EU-Russia (and EU-EEU) free trade agreement would be a meaningful way
forward to overcome the current stalemate. In the meantime, transitory solutions could be implemented
which should take into account the fact that neither Belarus nor Kazakhstan (other EEU members) are
WTO members yet. A similar proposal has recently been put forward by Emerson (2015) and Yavlinsky
(2015) as well.71
For Ukraine, Saha et al. (2014) propose a modernisation strategy directed at improving competitiveness
as the only viable strategic option for a compensation of the expected market access losses in Russia.
The success of the modernisation strategy requires – apart from the obvious necessity to stop the inner-
Ukraine armed conflict – investments (in particular foreign direct investments), sustained government
(industrial) policies and more consequent reforms. However, some of the necessary industrial policy
measures (such as the protection of vulnerable sectors or direct support for restructuring) may be in
conflict with the macroeconomic adjustment programme associated with the IMF EFF package, existing
WTO obligations, implementation of the DCFTA with the EU, etc. An additional complication for the
successful modernisation strategy may result from delayed implementation of the DCFTA, weakening
the potential impact from one of the important expected medium- and longer-term DCFTA benefits –
namely the pressure for modernisation and reforms (see also Speck, 2014b).72 The need to continue
trilateral talks about the implementation of the DCFTA between Ukraine, Russia and the EU was
reiterated once more at the Minsk-2 negotiations in February 2015. Looking forward – and moving from
the current confrontation to a more cooperative strategy – trilateral negotiations between the EU,
Ukraine and Russia/EEA about the prospective cooperation in the medium and long run should be
launched as soon as possible. As rightly stated by Kotkin (2015), ‘no external power or aid package can
solve Ukraine’s problems or compensate for its inherent vulnerabilities vis-à-vis Russia’. Realistically,
70 This was suggested by numerous analysts already well before the ominous Vilnius EaP Summit in 2013 (see Hoekman et al., 2013; Havlik, 2013).
71 In fact, not long ago the expectation was to launch EU-Russia free trade negotiations after the latter joins the WTO (this happened, after protracted negotiations, already in 2012).
72 In view of the subsequent escalation of the conflict and mutual trade embargoes, the delayed DCFTA implementation has currently lost its impact while being overshadowed by other problems.
48 UKRAINE’S FOREIGN TRADE AND RELATED INTEGRATION CHALLENGES
the way out of the conflict is a negotiated larger settlement which goes beyond Crimea and eastern
Ukraine, ideally resolving also other ‘frozen conflicts’ on the post-Soviet space.73
Specific policy recommendations may include the following areas:
Focus on macroeconomic stabilisation reforms, possi ble postponement or gradual phasing-in of
the implementation of the DCFTA until sufficiently stable macroeconomic conditions are achieved. The
current regime – under which the CISFTA preferential regime as well as free EU market access for most
of Ukraine’s products are granted, while liberalisation of Ukraine’s market with respect to imports from
the EU and the implementation of the acquis are delayed – alleviates the extremely stressful business
environment. Ukrainian businesses currently face multiple shocks, including a rise in energy costs, and
very tight monetary conditions, which further exacerbate their historically low competitiveness relative to
their EU counterparts. Increasing the level of competitive pressures on the domestic market of Ukraine
as a result of fast trade liberalisation may have devastating consequences for many Ukrainian industries.
The unilateral liberalisation of trade by the EU with respect to Ukraine, while Ukraine keeps its current
level of protection, will provide Ukrainian producers at least some more time to address the urgent
issues. Therefore, it might be reasonable to consider postponing DCFTA implementation and its
phasing-in conditional on achieving a sufficiently stable macroeconomic environment, although – as
mentioned above – this may also delay potential medium- and long-run benefits of integration due to
approximation to the EU standards.
Ukraine is facing a deep recession with a wide range of issues concerning its currency, fiscal situation,
external debt, and weak financial sector, aggravated by the ongoing conflict in eastern Ukraine. The
assistance package that has been provided to Ukraine is hardly sufficient for macroeconomic
stabilisation (see Chapter 2 of this report) and is subject to significant risks. In such a highly fragile
situation Ukraine cannot afford, due to lack of financial and administrative resources, to tackle multiple
costly reform undertakings simultaneously. Macroeconomic stabilisation is the necessary precondition
for successfully implement the AA/DCFTA-related reforms and should be addressed first. Granting
another year of free market access to Ukraine will certainly not result in significant losses for the EU as
Ukraine’s share in the EU market is insignificant. In a situation when international donors are
constrained in extending additional financial aid to Ukraine, this could be instrumental. This may also
contribute to macroeconomic stabilisation by partially offsetting direct and indirect costs of the fiscal
sector of Ukraine, and aiding its balance of payments issues by facilitating net exports. Trade
liberalisation, by contrast, will put extra pressure on Ukraine’s current account (e.g., the current account
deteriorated after WTO accession in 2008). The objections against postponing the DCFTA focus
predominantly on ‘political importance’ and ‘loss to Russia’ arguments. However, economic pragmatism
is needed in this case for reforms in Ukraine to be successful. Abstracting from these ideas, the principal
objection dwells on the notion that without the pressure of greater competitiveness the Ukrainian
authorities will not have sufficient incentives to carry out reforms. While there is certainly a rationale
behind this claim, the tremendous pressures that Ukraine’s economy is currently facing along with the
conditionality of the financial aid that is currently disbursed or considered by the global community linked
to the IMF Extended Fund Facility package, provide sufficient incentives to reform. The macroeconomic
adjustment reforms are aimed, inter alia, at facilitating accountability and transparency of the Ukrainian
government, along with other structural reforms that are complementary to the AA/DCFTA
73 Needless to say, there are other voices that call for more focus on assisting Ukraine and a more resilient containment policy with respect to Russia – see, for example, Niblett (2015).

UKRAINE’S FOREIGN TRADE AND RELATED INTEGRATION CHALLENGES
49
approximation requirements. The delay will yield additional time to analyse immediate, medium- and
long-run challenges associated with the AA/DCFTA that were not carefully scrutinised previously as a
result of the political turmoil, and will also reveal issues within the existing mechanism of financial aid
use and reform implementation in the context of the Extended Fund Facility, Macro Financial Assistance,
and linked aid, likely to be significant in view of the persistent corruption and governance problems.
Trade and development strategy which includes longe r protection periods for sensitive and
strategically important sectors . A long-term economic strategy for Ukraine concerning future areas of
trade specialisation and competitiveness in the global and regional contexts should be formulated in the
light of the expected consequences of EU integration and taking into account the limited resources
available to support restructuring and significant competitiveness issues stemming from poor
infrastructure, institutions, capital constraints, and energy efficiency. The experience of NMS suggests
that industrial restructuring and modernisation induced by the AA/DCFTA is inevitable and the
adjustment process could be costly. Public and private institutional capacities may not be sufficient for
Ukraine to carry the costs of all-embracing convergence and some sectors may be entirely lost to more
efficient European producers even upon achieving conformity with the EU technical regulations and
standards. Therefore, the alignment of SPS and technical standards with the EU standards should in
general be gradual for the sensitive industries to ensure orderly transformation. Under the current
AA/DCFTA arrangements, several sectors are identified where the approximation to the EU regulations
and standards are phased in over several years, while special ‘defence’ measures are applied only to
passenger cars and worn clothes. The sectors requiring ‘special defence’ should be more carefully
analysed taking into account current conditions and strategic industrialisation priorities formulated by
Ukraine and a longer transition period should be negotiated to ensure their survival and orderly
adjustment to a more competitive environment and new markets. Sizeable sectors with relatively high
technology intensity in the east and south of Ukraine that are historically oriented towards Russian
markets, but are not likely to easily find a market niche elsewhere, are of particular concern, including
machinery, railway, chemicals, nuclear, and others, as identified in this Chapter, as well as sectors that
enjoyed significant tariff protection.
Facilitate a constructive dialogue with Russia via t rilateral negotiations . In general, a more
constructive approach in addressing concerns expressed by Russia should be attempted by the EU and
Ukraine (with regard to trade-related matters). As pointed out above, Russia is a significant trading
partner for Ukraine, has close social, economic and cultural ties with Ukraine, and will likely remain
among the most influential countries in the region with an ability to exercise substantial influence on
Ukraine regardless of the EU integration process.74 Discussions between the EU and Russia had
continued before the conflict escalated: as indicated by the European Commission, since November
2013 it has engaged in the consultation process on the EU-Ukraine DCFTA with 10 meetings held.
However, currently, the EU exhibits a lack of flexibility in addressing the concerns expressed by Russia
and has reiterated that it is only ready to proceed further with the bilateral partnership if the Ukrainian
crisis is resolved and Russia complies with the WTO regulations,75 which, along with the sanctions, only
contributes to a further escalation and effectively cultivates the Russian notion of a ‘besieged
motherland’ as socio-political processes are moving fast in the dangerous direction of isolationism,
nationalism and xenophobia. Fuelling social unrest in Russia could have potentially devastating
74 See also Delcour and Kostanyan (2014); Kotkin (2015). 75 This position was also reiterated at the meeting between the EU Trade Commissioner Cecilia Malmström and Russian
Minister for Economic Development Alexei Ulyukayev in Brussels on 3/3/2015, originally requested by the Russian side.
50 UKRAINE’S FOREIGN TRADE AND RELATED INTEGRATION CHALLENGES
consequences for Russia, Ukraine and beyond. Therefore, trilateral negotiations should continue along
multiple dimensions, including trade policy, and should proceed in a more systematic, formalised and
transparent manner and be decoupled to the extent possible from non-trade issues to ensure an
effective dialogue and pragmatic solutions.
Safeguard Ukraine’s membership in the CISFTA . Given the significant importance of Russia as a
trading partner and the losses for Ukrainian industries if the open market access to Russian/EEU market
is abolished, the objective of the trilateral negotiations should focus on the possibility of maintaining the
preferential trade regime for Ukraine under the CISFTA framework. While membership in the EEU,
which involves a customs union arrangement, is not compatible with the DCFTA, the CISFTA remains a
feasible option allowing for an optimal consensus for the three parties. Ukraine can either negotiate
preferential trade arrangements with Russia/EEU that liberalise trade for mutually agreed lines of
products, or, preferably, remain in the existing CISFTA. CISFTA-focused discussions should involve
other members of the CISFTA, however, a trilateral format may be used initially as the concerns raised
by the three parties constitute the major obstacle to headway. Nevertheless, Russia, along with other
EEU members, has the right to apply a standard trade regime to Ukraine involving the Common External
Tariff and other barriers to trade in line with the WTO and EEU regulations, just as it does in the case of
most other non-EEU members. As Ukraine is a member of the WTO since May 2008, it should receive
equal MFN treatment in this case. Therefore, while Ukraine should try to find a consensus to maintain
preferential trade with Russia and the CIS, its authorities should consider a strategy that ensures orderly
adjustment of Russia-oriented industries in case Ukraine does not remain in the CISFTA and estimate
the costs of adjustment, while the international community should consider providing technical and
financial assistance to offset these costs.
Adoption of EU technical standards and SPS regulatio ns . Along the lines of enabling the possibility
for Ukraine to enjoy liberalised trade with both the EU and the EEU/CIS economies, a range of concerns
expressed by Russia needs to be addressed. Besides potential re-exports, discussed earlier, which can
be addressed in a conventional manner via the ‘rules of origin’ in line with the WTO regulations, Russian
concerns include potential barriers to trade that may emerge as a result of Ukraine adopting the EU
technical and SPS standards. For instance, Article 56 of the AA states that ‘Ukraine shall withdraw
conflicting national standards, including its application of interstate standards (GOST/ГОСТ), developed
before 1992’. Russia is concerned that Ukraine will have to exclusively apply the EU standards (EN) and
abandon the existing GOST standards used in the CIS, which would constitute a barrier to Russian
exporters as well as inhibit exports from Ukraine to Russia of products that are made according to the
EU standards for which Russia applies different standards. The proposed changes to the related articles
(Article 56, 59, 64, 67, 70 of the AA) aim at establishing some sort of equivalence mechanism and
mutual recognition of standards and technical regulations to ensure that Russian GOST standards apply
also on Ukrainian territory. It should be noted that the EU standards are voluntary and do not preclude
using other standards, as long as they do not contradict the EU standards. Ukrainian producers may still
produce for export to Russia according to Russian standards, if they choose to, whereas the DCFTA
specifies only 17 product standards for adoption within fixed time schedules of up to four years. In any
case, closer scrutiny should be given to the issue of EN versus GOST standards, as this may indeed
constitute barriers to trade. Addressing this could be done along two timelines: (1) In the medium term,
as Russia has been attempting to harmonise its GOST standards with those of the EU on a bilateral
basis, gradual convergence to the EU standards by Ukraine may be at least partially aligned with
convergence by Russia (possibly, EEU and CISFTA). Convergence of the EU and EEU technical

UKRAINE’S FOREIGN TRADE AND RELATED INTEGRATION CHALLENGES
51
standards and SPS standards is in Russia’s interests as well, and some progress has been made in this
direction along the lines of the CEN, CENELEC and Rosstandart cooperation agreement signed in 2013.
The process of harmonisation and convergence of GOST and EN standards should continue and be
encouraged, and also involve other CIS countries via the Interstate Council for Standardisation,
Metrology and Certification of the CIS. Similarly, as part of their WTO accession agreements, both
Ukraine and Russia have agreed to move towards international SPS standards, and this process should
be facilitated. (2) The mechanism that will allow mutual recognition of standards and technical
regulations by Russia and Ukraine needs to be considered as a temporary solution to alleviate technical
barriers to trade.76
Yet another set of proposed amendments (e.g. to Articles 64, 67 of AA) aims at implementing a sort of
‘grandfather clause’ in the AA which implies, e.g., that Ukraine should avoid adopting legislative acts
creating a less favourable trade regime between Ukraine and Customs Union member countries. The
proposition by Russia that it is granted the right to observe and make amendments to drafts of policy
proposals on trade-related matters of the Ukraine-EU future relationship is certainly excessive. However,
fears that changes to legislation induced by the approximation to the acquis may have negative
implications for trade under the CISFTA framework are valid, and a trilateral mechanism to ensure
information exchange and discussions with the CISFTA members (certainly, only if Ukraine maintains its
membership in the CISFTA) should be established, as well as a transparent dispute resolution
mechanism to resolve trade-related conflict situations that may arise as Ukraine adjusts its legislation to
the EU acquis.
The negotiations focusing on a pan-European-Eurasia n free trade area, embracing the EU and
the EEU/CISFTA, should be encouraged . The need to strengthen bilateral trade relations between the
EU and Russia/EEU has been recognised before the Ukrainian crisis.77 Yet, because of the geopolitical
issues, problems related to compliance with the WTO commitments by Russia, and the deepening
Eurasian Economic Union, the progress along the EU-Russia partnership agreement, especially its trade
and investment part, have stalled since 2010. An even more ambitious idea of a pan-European-Eurasian
free trade area that has also emerged has been drawing much attention as well and a general interest is
periodically expressed by both Russian and European political leaders, and the potential benefits of
such an arrangement for all parties involved have been investigated by experts. The discussions
concerning the feasibility, strategy and technical aspects of the hypothesised pan-European-Eurasian
free trade area ‘from Lisbon to Vladivostok’ should be encouraged and transformed into a more
consistent format, involving, besides Russia, other member states of the EEU and the Eurasian
Economic Commission, and members of the CISFTA. However, as ambitious as such a goal may seem
now, the steps made in this direction may yet be another brick in constructing a mutually beneficial long-
run partnership not only in the economic area.
76 Cenusa et al. (2014) also favour ‘constructive discussion if the overall political context becomes sufficiently conductive’. 77 See IIASA project ‘Challenges and Opportunities of Economic Integration within a wider European and Eurasian Space’
launched in 2013. IIASA Options, Summer 2014 (www.iiasa.ac.at).
52 UKRAINE’S FOREIGN TRADE AND RELATED INTEGRATION CHALLENGES
CONCLUSION
The integration process of Ukraine has been obstructed by a lack of clear strategy and external
intervention. However, the notion that the two integration directions of Ukraine – European and Eurasian
– are competing and mutually exclusive is false. The preferred way forward would be to assess the
possible ways how to make them compatible. Given that Russia will remain one of the critical political
and economic players in the region under any circumstances, and may potentially invalidate any
progress towards EU integration by Ukraine directly or via eastern Ukraine authorities, the interests of
Russia should be taken into account when designing a sustainable integration strategy and drafting the
corresponding agreements. However difficult it may sound given the recent political developments, there
should be a way to find a mutually acceptable consensus for Ukraine, the EU and Russia. With regard to
the trade dimension, headway is possible along one of the mutually beneficial scenarios mentioned
earlier – our preferable medium- and long-run option is Scenario 3 – and trilateral consultations should
continue in order to eliminate Russian concerns (the valid ones), while still maintaining progress and
commitments to the AA/DCFTA as the top priority; this seems to be a constructive way to deal with the
issue. In the meantime, the situation is likely to evolve along the ‘Transnistriasation’ scenario of Ukraine
in the best case.
Summarising, we propose the following practical steps in order to move forward:
› Resolution of the military conflict. This is the first priority and the necessary precondition for the
subsequent macroeconomic stabilisation, investments in restructuring and growth, as well as for the
implementation of institutional reforms along the AA/DCFTA lines.
› Macroeconomic stabilisation and delayed DCFTA implem entation or its gradual phasing-in,
conditional on macroeconomic stabilisation . Macroeconomic stabilisation should be the next
primary concern. Given limited financial resources and administrative capabilities, and in order to
prevent excessive competitive pressures, it is reasonable to delay a full implementation of the DCFTA
and hence temporarily shield the fragile domestic market from the EU import competition, while still
maintaining free market access to the EU and the CISFTA, as currently arranged.
› Trade and development strategy. A long-run restructuring strategy concerning future areas of trade
specialisation and competitiveness in the global and regional contexts should be elaborated, taking
into account the EU integration challenges and opportunities. An industrial policy for the
restructuring/conversion of sectors that are not likely to withstand competitive pressures and/or the
potential loss of traditional markets also needs to be devised as an inherent part of the long-run
economic development strategy.
› Transition periods for sensitive sectors. For industries that are sensitive to EU technical
requirements and market liberalisation (machinery, railway, chemicals, nuclear, and others, as
identified above) longer transition periods as regards approximation to the EU regulations should be
negotiated in order to ensure orderly adjustment to a more competitive market environment.
› Facilitate a constructive dialogue with Russia via t rilateral negotiations. A more constructive
stance should be taken by Ukraine and the EU with regard to Russia’s strategic position and concerns
expressed in relation to the AA/DCFTA effects. Trilateral negotiations focusing on trade-related

UKRAINE’S FOREIGN TRADE AND RELATED INTEGRATION CHALLENGES
53
matters should be facilitated and decoupled to the extent possible from non-trade issues to ensure
practical dialogue.
› Safeguard Ukraine’s membership in the existing CISFTA . The objective of the trilateral
negotiations should focus on the possibility of maintaining the preferential trade regime for Ukraine
under the CISFTA framework. While membership in the EEU, which involves a customs union
arrangement, is not compatible with the DCFTA, the CISFTA still remains a feasible option allowing for
an optimal consensus for the three parties concerned. While the CISFTA-focused discussions should
involve other members of the CISFTA, a trilateral format may be used initially as the concerns raised
by the three parties constitute the major obstacle to headway.
› Negotiations focusing on a pan-European-Eurasian fre e trade area should be encouraged. The
discussions concerning the feasibility, strategy and technical aspects of the hypothesised pan-
European-Eurasian free trade area ‘from Lisbon to Vladivostok’ should be launched and transformed
into a more consistent format, involving, besides the EU and Russia, other member states of the EEU
and the CISFTA, as well as the Eurasian Economic Commission.

54 AN FDI POLICY FOR UKRAINE
5. An FDI policy for Ukraine
BACKGROUND CONDITIONS
Attracting foreign direct investment (FDI) has been among the primary goals of most Central, East and
Southeast European governments. Many of them have achieved remarkable foreign investment inflows
in efficiency-seeking, export-oriented projects underpinning economic growth, institutional transformation
and technological upgrading. But high FDI could often not be attained due to unstable institutions,
uncoordinated policies and inadequate business conditions.
Recently it has become increasingly difficult for middle-income countries to foster economic growth and
competitiveness by foreign investments. FDI has subsided globally, and in Europe in particular, since the
outset of the financial crisis. Multinational enterprises have become much more careful about putting
capital at risk and banks have turned quite reluctant to finance investments. Not only cross-border
investments are scarce but also host-country governments find it difficult to provide investors with a
stable and attractive environment. Fiscal policy goals, international agreements and investor needs
collide and call for a systematic analysis of options and trade-offs.
Ukraine developed a comprehensive FDI policy framework from the mid-2000s onwards. It has received
technical support from the OECD, IMF, the World Bank as well as the EU Commission related to
competitiveness, institutional improvement in general and also specifically in the field of FDI. Capacity-
building to local FDI specialists has also been provided by international institutions such as at the Joint
Vienna Institute. Recommendations of donors were partly implemented and resulted in the setting-up of
the FDI agency InvestUkraine to provide support for investors. Several regional and local governments
in Ukraine have also become active in promoting FDI. The results have been far from satisfactory,
however. Although inward FDI stock per GDP is on par with Poland and Romania, much of the
investment registered as foreign is round-tripping domestic capital. There is very limited FDI in greenfield
projects and in export-oriented activities.
IMF Country Report No. 14/145 of May 2014 identified some of the FDI-related problems in a general
way. In its forecast table the IMF extrapolates rather meagre FDI inflows of 2.4% of GDP until 2018. We
think that there is more in it: FDI can become a more important source of financial stability and support
to competitiveness and structural change. In fact, much of the problems related to FDI attraction goes
beyond FDI policy in the narrow sense. The country’s unfavourable ranking by the World Bank Doing
Business indicators78 shows the impediments to investments in general. Progress along those
indicators, including institutional efficiency and competition, are the foundations for a successful FDI
policy.
The circumstances for FDI have worsened in Ukraine over the past year. First, the country is considered
as being at war and close to financial default, which deters investments, both foreign and domestic.
Second, there are signs of an institutional vacuum, and new structures are still to emerge. The
78 www.doingbusiness.org
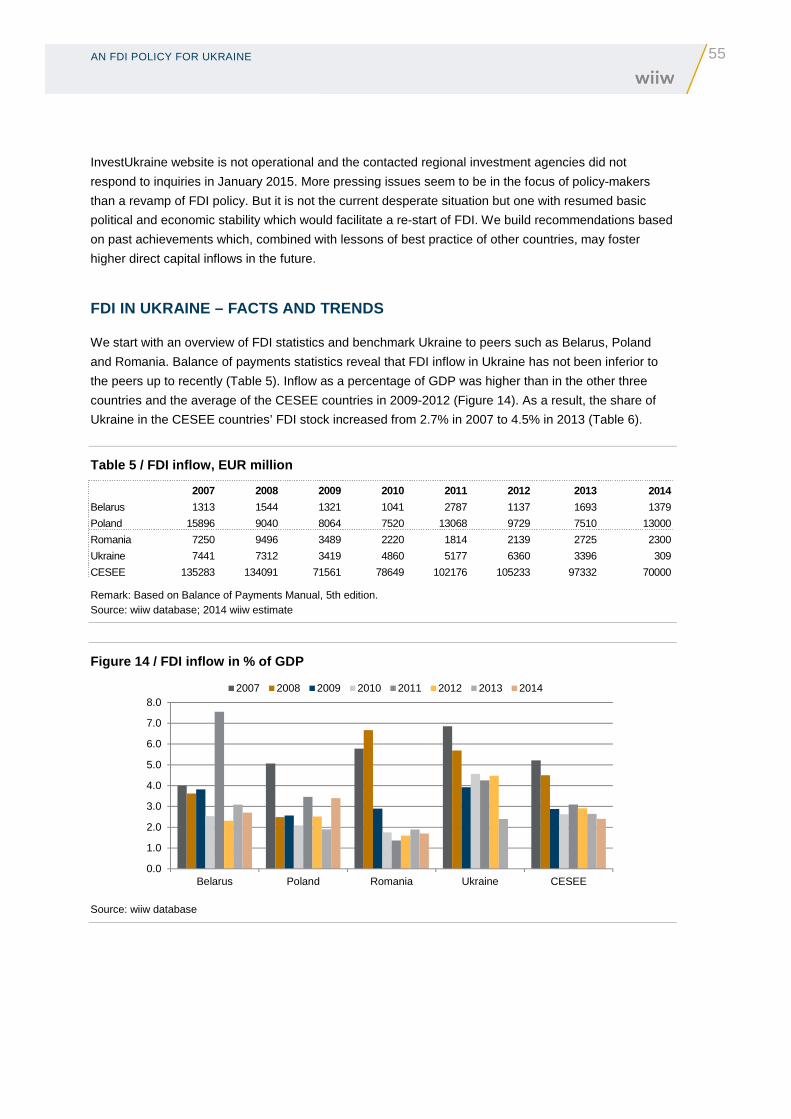
AN FDI POLICY FOR UKRAINE
55
InvestUkraine website is not operational and the contacted regional investment agencies did not
respond to inquiries in January 2015. More pressing issues seem to be in the focus of policy-makers
than a revamp of FDI policy. But it is not the current desperate situation but one with resumed basic
political and economic stability which would facilitate a re-start of FDI. We build recommendations based
on past achievements which, combined with lessons of best practice of other countries, may foster
higher direct capital inflows in the future.
FDI IN UKRAINE – FACTS AND TRENDS
We start with an overview of FDI statistics and benchmark Ukraine to peers such as Belarus, Poland
and Romania. Balance of payments statistics reveal that FDI inflow in Ukraine has not been inferior to
the peers up to recently (Table 5). Inflow as a percentage of GDP was higher than in the other three
countries and the average of the CESEE countries in 2009-2012 (Figure 14). As a result, the share of
Ukraine in the CESEE countries’ FDI stock increased from 2.7% in 2007 to 4.5% in 2013 (Table 6).
Table 5 / FDI inflow, EUR million
2007 2008 2009 2010 2011 2012 2013 2014
Belarus 1313 1544 1321 1041 2787 1137 1693 1379
Poland 15896 9040 8064 7520 13068 9729 7510 13000
Romania 7250 9496 3489 2220 1814 2139 2725 2300
Ukraine 7441 7312 3419 4860 5177 6360 3396 309
CESEE 135283 134091 71561 78649 102176 105233 97332 70000
Remark: Based on Balance of Payments Manual, 5th edition. Source: wiiw database; 2014 wiiw estimate
Figure 14 / FDI inflow in % of GDP
Source: wiiw database
0.0
1.0
2.0
3.0
4.0
5.0
6.0
7.0
8.0
Belarus Poland Romania Ukraine CESEE
2007 2008 2009 2010 2011 2012 2013 2014
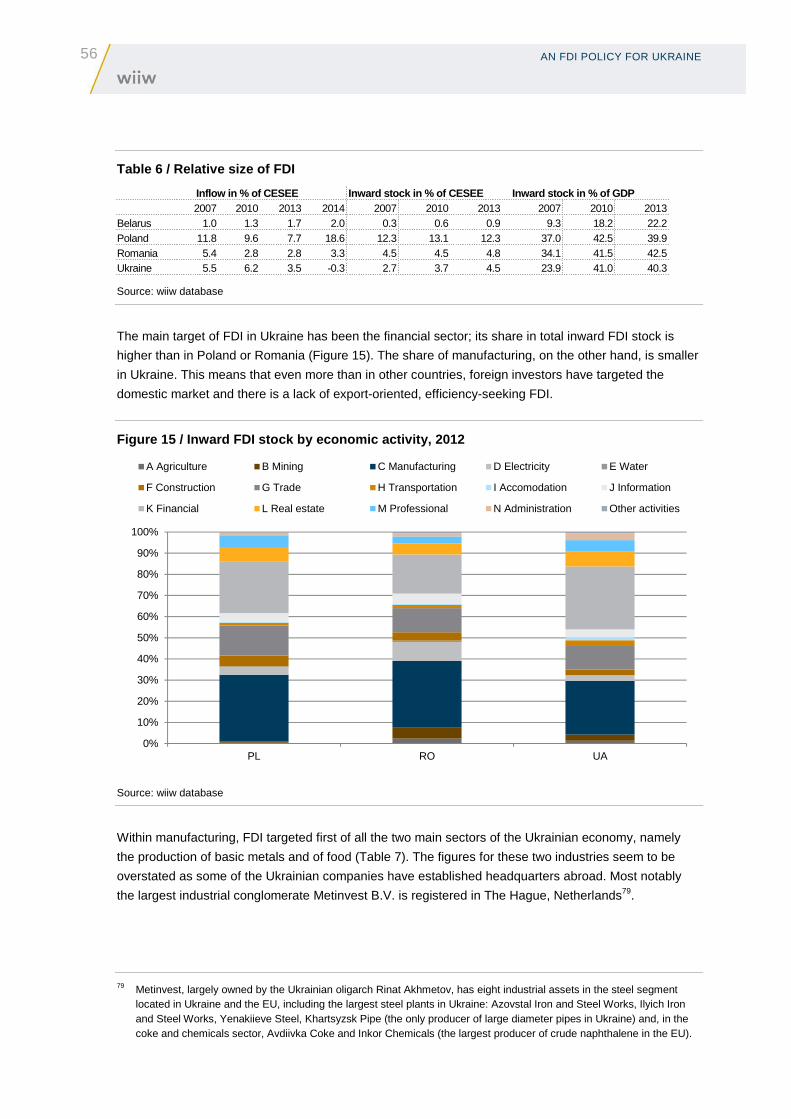
56 AN FDI POLICY FOR UKRAINE
Table 6 / Relative size of FDI
Inflow in % of CESEE Inward stock in % of CESEE Inward stock in % of GDP 2007 2010 2013 2014 2007 2010 2013 2007 2010 2013 Belarus 1.0 1.3 1.7 2.0 0.3 0.6 0.9 9.3 18.2 22.2 Poland 11.8 9.6 7.7 18.6 12.3 13.1 12.3 37.0 42.5 39.9 Romania 5.4 2.8 2.8 3.3 4.5 4.5 4.8 34.1 41.5 42.5 Ukraine 5.5 6.2 3.5 -0.3 2.7 3.7 4.5 23.9 41.0 40.3
Source: wiiw database
The main target of FDI in Ukraine has been the financial sector; its share in total inward FDI stock is
higher than in Poland or Romania (Figure 15). The share of manufacturing, on the other hand, is smaller
in Ukraine. This means that even more than in other countries, foreign investors have targeted the
domestic market and there is a lack of export-oriented, efficiency-seeking FDI.
Figure 15 / Inward FDI stock by economic activity, 2012
Source: wiiw database
Within manufacturing, FDI targeted first of all the two main sectors of the Ukrainian economy, namely
the production of basic metals and of food (Table 7). The figures for these two industries seem to be
overstated as some of the Ukrainian companies have established headquarters abroad. Most notably
the largest industrial conglomerate Metinvest B.V. is registered in The Hague, Netherlands79.
79 Metinvest, largely owned by the Ukrainian oligarch Rinat Akhmetov, has eight industrial assets in the steel segment located in Ukraine and the EU, including the largest steel plants in Ukraine: Azovstal Iron and Steel Works, Ilyich Iron and Steel Works, Yenakiieve Steel, Khartsyzsk Pipe (the only producer of large diameter pipes in Ukraine) and, in the coke and chemicals sector, Avdiivka Coke and Inkor Chemicals (the largest producer of crude naphthalene in the EU).
0%
10%
20%
30%
40%
50%
60%
70%
80%
90%
100%
PL RO UA
A Agriculture B Mining C Manufacturing D Electricity E Water
F Construction G Trade H Transportation I Accomodation J Information
K Financial L Real estate M Professional N Administration Other activities

AN FDI POLICY FOR UKRAINE
57
Table 7 / Ukraine: Inward FDI stock by economic act ivity, Total and Manufacturing, NACE Rev. 2, in %
Stock, % Manufacturing stock, %
2009 2013 2009 2013
A Agriculture 1.7 1.4 CA Food 16.3 22.4
B Mining 2.5 2.9 CB Textiles 1.4 1.0
C Manufacturing 29.5 25.3 CC Wood 3.7 3.4
D Electricity 0.7 2.6 CD Coke 3.8 2.7
E Water 0.2 0.2 CE Chemicals 6.7 7.2
F Construction 3.2 2.8 CF Pharmaceuticals 0.3 0.5
G Trade 10.9 13.0 CG Rubber 10.2 10.1
H Transportation 2.5 2.8 CH Basic metals 46.8 42.7
I Accommodation 1.2 1.5 CK Machinery n.e.c. 9.3 7.5
J Information 4.3 3.6 CM Other 1.4 2.6
K Financial 31.0 26.4 C Manufacturing 100.0 100.0
L Real estate 6.1 7.5
M Professional 2.9 5.9
N Administration 2.3 3.4
Other activities 0.8 0.6
Source: wiiw database
The main investing country in Ukraine is Cyprus (Figure 16). The role of Cyprus has increased in recent
years. This country can be identified as a tax haven frequented by Russian and also Ukrainian investors
to register companies operating in their home country (88% of Ukrainian outward FDI stock has gone to
Cyprus). This indicates that most probably a large part of the FDI inflow in Ukraine is not genuine foreign
capital but round-tripping domestic capital. Also Russian investors may be in the background of FDI
originating from Cyprus; thus, the share of Russian ownership in Ukraine may be understated.
Figure 16 / Inward FDI stock by investing country, 2012
Source: wiiw database
0%
10%
20%
30%
40%
50%
60%
70%
80%
90%
100%
PL RO UA
Austria Cyprus France Germany Italy Luxembourg
Netherlands Russia UK US Other

58 AN FDI POLICY FOR UKRAINE
Regarding the information gained from the above FDI inflow and stock data, one can conclude that they
widely overstate the real importance of FDI in the Ukrainian economy. Round-tripping capital through
holdings abroad does not bring new capital, technology and knowledge into the country. Such holdings
are artificial constructions having often the aim of avoiding taxation. At the same time, insecure property
rights and the fear of re-privatisation may have also prompted owners of Ukrainian companies to shift
headquarters abroad.
Table 8 / Number and value of cross-border M&As, 20 10-2013 cumulated
Number sold Value of sales, USD mn Number purchased Value of purchases, USD mn
Poland 12851 12416.3 136 4353.2
Romania 297 341.5 25 23.9
Belarus 685 672.0 9 214.9
Ukraine 1817 1986.3 110 1018.5
Source: UNCTAD database
FDI can have two entry modes: mergers and acquisitions (M&As) and greenfield investment including
enlargement projects.80 As to M&As, Ukraine has been a more important target than Romania or Belarus
(Table 8). The number of Ukrainian companies sold to foreign investors was much higher than that of
companies purchased by Ukrainian investors abroad in 2010-2013. The value of sales was USD 2 billion
and that of purchases USD 1 billion, thus much closer to each other than the number of deals. Related
to the size of the country, these figures are still low, especially in view of the size of state property that
should be privatised.
The number and value of greenfield projects in Ukraine has been much smaller than in Poland or
Romania (Figure 17). The increase up to the financial crisis was more modest and the decline in later
years much smaller than in the peers. In 2014 foreign investors avoided Ukraine: only 25 projects were
announced as compared to 69 in the previous year while the capital investment pledged in the greenfield
projects (Figure 18) declined from EUR 3 billion 2013 to EUR 600 million in 2014.
Figure 17 / Number of greenfield projects
Source: fdimarkets.com
80 Information on M&As and greenfield FDI is compiled from press reports and company data which are not directly comparable either with each other ot with balance of payments data. The sources used in this paper are the database of UNCTAD for M&As and fdimarket.com for greenfield investments.
0
50
100
150
200
250
300
350
400
Poland Romania Ukraine Belarus
2003 2004 2005 2006 2007 2008 2009 2010 2011 2012 2013 2014

AN FDI POLICY FOR UKRAINE
59
Figure 18 / Value of greenfield projects, EUR milli on
Source: fdimarkets.com
The sectoral distribution of projects (see Annex Table 5) demonstrates that foreign investors have
established a large number of rather small manufacturing production units and a number of even smaller
ICT units in Ukraine. The automotive industry has not been a main target which is a big difference
compared with Poland or Romania. Assembly lines operate only for the local market. But some
automotive and ICT suppliers that are present also in other countries of the region produce for exports in
Ukraine as well, including (source: fdimarkets.com):
› Flextronics (Singapore) invested in the city of Mukachevo in an electronic components manufacturing
project in 2007.
› Leopold Kostal, the German manufacturer of advanced electronic and electromechanical
(mechatronic) products, opened a subsidiary company in Pereiaslav-Khmelnytskyi located in the Kyiv
Oblast in 2007.
› Germany-based Leoni, a leading provider of cables and cable systems to the automotive sector and
other industries, announced the setting-up of a manufacturing facility in Ukraine by its wiring systems
division in 2011.
Among the projects established in 2014, there are several software and IT services projects:
› Gumi (Japan) is investing in the city of Kyiv in the software & IT services sector in a design,
development & testing project setting up a mobile games developer. It will open a new studio with a
focus on developing English-language games for the North American market.
› DataArt (United States) is investing in the city of Lviv in the software & IT services sector in a sales,
marketing & support project. The company has employed 20 engineers and project managers, and
expects to grow the office to 100 staff by the end of 2014.
› Team International (United States) is investing in the city of Lviv in the software & IT services sector in
a design, development & testing project. The new development centre aims to become a key
outsourcing destination for businesses in Western Europe and North America.
0
4000
8000
12000
16000
20000
Poland Romania Ukraine Belarus
2003 2004 2005 2006 2007 2008 2009 2010 2011 2012 2013 2014

60 AN FDI POLICY FOR UKRAINE
› Miratech (Sweden) is investing in the city of Vinnytsya in the software & IT services sector in a design,
development & testing project, creating 15 jobs. A technical laboratory in collaboration with a local
university may also be established by Miratech in the city.
These examples show that low wages do attract investments into Ukraine in labour-intensive activities,
and the country has chances to become a component production and service provider platform. It may
even attract relocating projects from new EU members such as Poland, based on significantly lower
wages, provided political and economic consolidation is achieved. Conditions for investments which are
better than those in Ukraine as a whole may be found in some western regions of the country. The
recently established projects quoted above are all located in the capital city or in the western part of the
country. These are rather small projects as of now, but may expand based on competitive wages if
business conditions improve.
Future FDI policy may target both entry modes. Cross-border M&A is necessary to dismantle
monopolies and to support progress in privatisation whereas greenfield projects are in demand to bring
in technology and establish internationally competitive export-oriented production. Sweeping changes
concerning the institutional environment are necessary to succeed in both.
FDI REGIME IN UKRAINE
Previous governments put in place institutions and frameworks to foster and promote FDI in Ukraine.
With a view to improving the investment climate, Ukraine adopted an ‘Investment reform’ in 2011,
targeting the preparation and promotion of strategic investment proposals. A ‘one-stop-shop’ investment
promotion department called ‘InvestUkraine’ (launched in January 2012) was created in the State
Agency for Investment and National Projects of Ukraine.81 The operation of InvestUkraine in principle
corresponded to the international best practice according to the chart below:
The website ‘Investukraine.com’ was out of service in February 2015 – hopefully to be interpreted as a
sign of renewal.
The investment incentive regime established in 2011 was on the whole attractive. It was most probably
not because of the lack of incentives why greenfield investors avoided the country. As of 2012, corporate
income tax and divided tax were reduced to internationally competitive levels. In addition, the Ukrainian
FDI law provided for special regimes82 similar to those in other countries:
› sector-based incentives: total exemption from taxation until 1 January 2021 for aircraft manufacturers,
shipbuilders, hotels, light industries and agricultural machinery producers;
81 http://www.ukrproject.gov.ua/en/page/investukraine-one-stop-shop 82 http://www.east-invest.eu/en/investment-promotion/ukraine-2

AN FDI POLICY FOR UKRAINE
61
› simplified tax regime for SMEs (annual turnover below UAH 1 million and less than 50 employees): 6%
on the sales revenue plus 20% VAT, or 10% rate including VAT;
› exemption from import duties for in-kind contributions to the enterprise capital with foreign investment;
exemption from import duties and taxes for goods imported and stored at bonded warehouses, no
tariff for goods imported to or exported from special economic zones, etc.;
› industrial parks: co-financing of infrastructure development by the state.
The OECD Investment Policy Review for Ukraine gave recommendations for further improvements in
the investment climate in 2011.83 The Review stated that ‘proposed investment policy recommendations
have to be a part of broader reforms which target public and private investment, including foreign capital,
and which remove entry and exit barriers for all categories of firms’. The specific recommendations
included the protection of property rights, improved land ownership rights, reduced national security
considerations and liberalised access to specific sectors as well as streamlined bureaucracy. We have
no detailed information about the implementation of these recommendations. It can be assumed that
most of these issues have remained open, and protracted time is necessary to solve them.
FDI POLICY RECOMMENDATIONS
An FDI policy revamp in Ukraine can be based on the previous initiatives and regulations outlined above
and the recommendations made by OECD in 2011. The knowledge of what to do seems available in the
country but it must be put into a comprehensive programme and implemented. While the OECD and
most other donors rightly stress the importance of framework conditions to be improved in order to make
the country a less risky place for investors, it must be possible to go beyond the general conditions of
doing business in the country. One is inclined to assume that a comprehensive reform programme
cannot be agreed upon and implemented within a short time. One may think of specific measures of
investment facilitation that may provide improved business conditions limited in space and scope but
relatively fast, even before an efficient general framework is put in place.
Based on theoretical considerations and practical experience of policy-makers, four FDI policy
instruments are of specific relevance: (i) establishing industrial/business parks, (ii) setting up a
contractual regime for large and technology-intensive projects, (iii) promote spillovers and clustering,
and last but not least, (iv) operating an efficient investment promotion agency with regional networks.
The four main lines of actions need to be implemented as a coherent package to become successful.
i) Industrial/business parks act as an incentive for (foreign) investors, because they enable to
start operation within a rather short period of time and under good infrastructure and operational
conditions. The Ukrainian approach to industrial park development had been highly centralised and
bureaucratic.84 A bottom-up approach coupled with a facilitation programme on the part of the central or
regional government may bring more success. Existing investment sites, both greenfield and brownfield,
83 OECD (2011), Investment Policy Reviews: Ukraine 2011, OECD Investment Policy Reviews, OECD Publishing; http://www.oecd-ilibrary.org/finance-and-investment/oecd-investment-policy-reviews-ukraine-2011_9789264113503-en
84 http://investukraine.com/10144-agency-will-present-documents-confirming-registration-of-the-first-five-industrial-parks-in-ukraine, 14 April 2014 (inactive as of February 2015).
62 AN FDI POLICY FOR UKRAINE
on the territory of existing but under-utilised industrial zones need to be developed with state-of-the-art
infrastructure. Investing in business park infrastructure may at least partly be done on a commercial
basis. Parks must provide clear ownership rights, good transport and telecom connection, as well as
abundant energy and water supply, and need the support of the local/regional administration.
A specific form of such parks, special economic zones (SEZs), have proved useful in countries where
the overall business environment is suboptimal. SEZs were the main targets of FDI in China in the
1990s, and in Turkey. They had also been established in Poland and survived after EU accession as
industrial parks granting special investment incentives. As of 2011, the 14 SEZs operating in Poland
were the main hubs of greenfield investments employing a quarter of a million people (total
manufacturing employment is about 2 million) in 1400 companies (both with foreign and domestic
capital).85 In Ukraine, oblasts and municipalities must have the legal authority and financial means to
foster the establishment of such parks.
Special economic zones can be appropriate vehicles to attract investments in countries where the
regulatory system is on the whole not investor-friendly by providing attractive special arrangements in a
limited territory. A special or export-processing zone is similar to the industrial/business park but fenced
and having a customs office at the gate. This arrangement, not necessarily tied to a certain geographic
area but to the physical plot chosen by the investor, operated in Hungary before EU accession.
Companies established export-oriented production as free economic zones. Some of them expanded to
become industrial parks attracting other export-oriented investors after EU accession when the duty-free
status became irrelevant. The Ukrainian government should initiate to establish special zones in border
regions, with the aim to attract export-processing investments. Parks and zones may benefit from
special investment incentives such as free or cheap industrial land, but not necessarily. The major
advantage of them are superior institutional conditions and infrastructure in comparison with the rest of
the country.
ii) Granting a contractual regime by the government for large investment projects can attract the
most desirable kind of FDI. Most NMS provide special incentives to large investors and those in specific
sectors while obeying the aid ceilings established by the EU. The advantage of a contractual regime is
that it enables the creation of individually tailored packages of incentives and stricter control of contract
implementation. Contracts guarantee investors access to fair or even priority treatment by authorities in
a transparent way. For example, in Poland government grants can be provided to large investments with
important job creation and technological development effects.86 Twenty-five grant programmes for
‘investment of considerable importance for the national economy’ were signed with foreign investors
between 2007 and 2012. Subsidies were also paid out during these years in accordance with the
progress of the investment project.87
iii) Promotion of FDI spillovers is necessary to upgrade the absorption capacity of the local
economy. Foreign-owned companies need support to create linkages with local companies. The aim is
to avoid foreign enclaves in the economy which have little positive effect on their environment. Domestic
85 KPMG (2011), Special Economic Zones, 2011 Edition. 86 http://www.paiz.gov.pl/governmental_grants 87
http://www.mg.gov.pl/Wspieranie+przedsiebiorczosci/Wsparcie+finansowe+i+inwestycje/Pomoc+na+inwestycje+o+istotnym+znaczeniu+dla+gospodarki

AN FDI POLICY FOR UKRAINE
63
companies need incentives to network with foreign companies and also to establish local and regional
clusters. Horizontal linkages are usually more important than vertical ones. Industrial parks or special
zones may function as enclaves but at the same time provide platforms for business agglomeration.
Local universities and research establishments should be stimulated to participate in regional clusters.
Good practice can be accessed from the DG Enterprise and also obtained through the Danube Region
Strategy (EUSDR), in which the south-west oblasts of Ukraine participate. Support may not necessarily
mean a lot of money but rather care and communication on the part of authorities.
iv) It is also necessary to revitalise the FDI agency InvestUkraine , preferably as an independent
agency reporting to the prime minister. The former institutional arrangement based on the State Agency
for Investment and National Projects of Ukraine must have been complicated and bureaucratic. A strong
agency with broad competencies such as PAIiIZ (the Polish Information and Foreign Investment
Agency) in Poland can be very helpful for foreign investors, especially in the initial stage of entry. It is
also desirable to establish, or strengthen where they exist, regional investment agencies in oblasts and
municipalities. The reason is that investors do not only decide on a country to invest in, but compare
specific location targets. Regional and local investment agencies shall act as mediators between
investors and local authorities and market their investment opportunities. They need to get coordinating
functions between municipalities disposing over industrial land, companies providing local services
including energy, as well as organisations training workforce.

64 INDUSTRIAL AND REGIONAL DEVELOPMENTS
6. Industrial and regional developments
REGIONAL DIFFERENTIATION – PRODUCTION AND EXPORT SPECIALISATION
The scenario currently emerging is one in which there is a de facto split of the Ukrainian state with
Crimea as well as greater parts of the regions of Donetsk and Luhansk no longer being under the control
of the central government in Kyiv. There are important implications of this split for industrial and regional
economic developments.
Let us first establish some facts with regard to the characteristics of regional development levels, the
distribution of economic activity across the Ukrainian regions, the pattern of regional production
specialisation and their contributions to exporting activity.
Figure 19 / Income per capita, regional GDP and sec toral value-added shares in 2012, in %
Note: The size of the pies shows the shares of regional value added in national GDP. Source: State Statistics Service of Ukraine.

INDUSTRIAL AND REGIONAL DEVELOPMENTS
65
Figure 20 / Relative sectoral specialisation of reg ions of Ukraine
Note: The bars refer to the share of a particular economic activity in region's value added minus the share of that economic activity in the whole economy of Ukraine minus one. Source: State Statistics Service of Ukraine.
Figure 19 shows (background colours) the income levels of the different regions as they were in 2012,
as well as the contributions the different regions made to Ukraine’s overall GDP (size of the pies) and
the sectoral composition of the regions’ GDP (slices of the pies). Differentiation in income levels is
relatively pronounced across Ukrainian regions as higher income regions were associated with the
industrialised regions in the east and the capital city Kyiv and surroundings, followed by some of the
Black Sea regions and one of the regions in the west (Lviv). Other regions, especially the more
agricultural regions in the west (plus those north of Kyiv) and some southeastern regions are
characterised by particularly low average income levels. The contribution of the regions to national GDP
follow pretty much this pattern as well. The conclusion we draw from this is that the disruption of
production activity in the east due to the conflict situation, with its impact on long-term effects of reduced
production linkages across the eastern regions and on trade linkages with Russia, will have long-term
consequences for overall GDP developments and particularly the pattern of longer-term regional
development.
Following on from this, we examine the pattern of sectoral specialisation of the regions which has been
shown in terms of sectoral shares in Figure 19 while Figure 20 gives the information regarding sectoral

66 INDUSTRIAL AND REGIONAL DEVELOPMENTS
specialisation of the individual regions in slightly different form: It shows the differences of the individual
sectors’ weights in regional GDPs as they differ from the shares of these sectors in national GDP (see
also Annex Table 1a for the numerical figures related to this Figure and Annex Table 1b for a similar
analysis in terms of sectoral employment shares). From both Figures 19 and 20 we see the rather
marked regional differentiation of sectoral specialisation of the Ukrainian economy:
The basic pattern is one in which mining and industrial regions are concentrated in the east (Luhansk,
Donetsk, Dnipropetrovsk, Zaporizhzhya, Kharkiv, Poltava), while agrarian regions are in the west and
the south of Ukraine. Apart from this distinction, there are the urban centres (Kyiv, Lviv, Odessa) which
are characterised by more market services and construction activity and there is also a stronger
dependence of western regions (in output and employment) on non-market, i.e. public services (which is
also true for Crimea).
Figure 21 shows the rather distinct historical difference in the orientation of trade – the export data are
from 2012: western regions historically trade significantly more with the EU – which is particularly true for
regions bordering directly EU member countries (Poland, Romania, Slovakia, Hungary) while eastern
regions traditionally traded more with Russia (see also Annex Table 8 which gives the actual figures).
Figure 21 / Regional composition of exports by dest ination, 2012
Note: Size of the pie corresponds to the value of regions’ exports in USD million. Source: Authors’ calculations based on data from Ukraine’s Statistical Office.
INDUSTRIAL AND REGIONAL DEVELOPMENTS
67
More detailed information regarding export specialisation is provided in Annex Table 9. We show there
the main export articles from each region: The first column of numerical values shows the share of the
specific export article in total goods exports of that region, while the second column calculates the share
of the region’s exports in total Ukrainian exports of that export article.
The following regional industrial clusters can be distinguished from the information contained in
Annex Table 9:
Regional cluster – Food and light industry (west) : specialises on lighter industry (wood-based
industries, food and food processing, electrical goods, clothing, furniture, toys, etc.). This cluster
includes the regional entities Zakarpattya, Ivano-Frankivsk, Lviv, Volyn, Rivne: the advantage of this
regional cluster is that it has not been affected by the military conflict raging in the east; it is close to the
borders with current EU members which could lend itself to cross-border economic linkages and could
generate an interest by foreign investors to exploit geographic proximity and labour cost advantages.
Important requirements: institutional reliability; efficient local authorities, further investments on transport
infrastructure and other location factors (training/educational centres, etc.) which would attract FDI and
allow domestic firm growth.
Regional cluster – Agriculture, Food Processing, Woo d-based industries (west) : this cluster partly
overlaps with the earlier one but includes a number of other regions which have economic development
potential because of natural endowments conducive to agrarian production and wood-based industries.
The regions which fall into this category include Ternopil, Chernnivtsi, Rivne, Zhytomir, Vinnytsa,
Chernihiv. This region would again require the development of infrastructure to attract FDI in order to
upgrade towards higher value-added segments in the production in wood-based industries and food
processing, logistics support for exporting and improvements in the business climate to allow new
entrants of firms to develop product niches in these areas.
Regional cluster – Black Sea : Odesa, Mykolayiv, Kherson (i.e. excluding Crimea) are the regions
which can benefit from tourism (cultural and otherwise). They also provide scope for different types of
cultivation with regard to vegetables, fruits, nuts, etc. compared to other agricultural regions; in the short-
to medium run, they could benefit from the diversion of domestic tourism from Crimea which has lost
attractiveness as a result of the recent separation.
Regional cluster – Kyiv and surrounding : Following the pattern observed in all capital cities in Central
and Eastern Europe, metropolitan regions benefited greatly from a catching-up process in market
services in all transition economies, as the main seat of central public services and its main educational
facilities. They all benefited from being especially attractive to FDI inflows and to the most educated part
of the population, as locations of the central offices of the main domestic and foreign firms and the best
transport connections domestically and via airport facilities to foreign destinations. Strong income
differentiation between the capital cities and the rest of the country is a typical feature of all transition
and emerging economies (exceeding the differentiation observed in most Western European
economies) and we do expect the same to continue to be the case with Kyiv.
Regional cluster – east not controlled by separatist s: This group of regions covers (together with the
two regions controlled by the separatists) the historical heart of heavy industry of the Ukrainian
economy. It comprises the regions of Dnipropetrovsk, Zaporizhzhya, Poltava, Sumy and Kharkiv as well

68 INDUSTRIAL AND REGIONAL DEVELOPMENTS
as parts of the Donetsk and Luhansk regions which are not controlled by separatists. While Kharkiv’s
economy supplies a wider spectrum of industrial and export products including instruments, other
engineering products, electrical goods and vehicles, the other regions in this group are strongly
specialised on heavy industry: iron and steel, metals, heavy machinery and transport equipment,
railways (locomotives and railway rolling stock), aircraft, etc. We see this region as requiring the most
intense effort for industrial policy in the wake of the military conflict and the de facto split of the country.
Its traditional links to the regions controlled by the separatists have been severely broken and so have
its historical strong links across the Russian border where strong industrial supplier relationships existed
before the outbreak of the military conflict. As mentioned in other parts of this report (see Chapter 4), the
production and export structure of this regional cluster has been strongly defined by supplying the
Russian (and partly domestic) markets, investment into new production facilities has been neglected
over the years and thus the region would – in its current state – be barely in a position to supply other
export markets. On top of that the transport infrastructure is geared towards cross-border links to Russia
and hence – if the region is to reorient its production and trade links – important investments would have
to be undertaken to support other transport routes.
Regional cluster – east (Donetsk and Luhansk) control led by separatists : This region comprises
the larger parts of Donetsk and Luhansk and is heavily specialised in iron and steel, mining/minerals,
machinery, railways but also chemicals and plastics. The military conflict has led to the destruction of
parts of its industrial capacities and transport infrastructure, to a dramatic fall in production and a large
movement of population out of the region. It also suffers from having been embedded traditionally in the
overall Donbas region (e.g. important coal-steel linkages) and these have substantially been broken
through the military conflict. Reconstruction of this region will – in the most likely scenario – be up to
Russia; the region will further deepen its production and trade linkages with Russia and it is very unlikely
that the traditional links with the rest of the eastern industrial regions will be recovered at least in the
medium term. EU integration and implementation of the AA/DCFTA in this region will be off the cards; it
will however be affected by any future EU-Russia-Eurasia trade policy arrangements (see the scenarios
discussed in Chapter 4).
REGIONAL AND INDUSTRIAL DEVELOPMENTS – INDUSTRIAL P OLICY IMPLICATIONS
There is no doubt that the current acute conflict regarding the destiny of Ukraine means a dramatic
seizure in its economic and political development:
Realistically, Ukraine will remain a split country with two of its traditional industrial regions (parts of
Donetsk and Luhansk) being heavily dependent on Russia, while the rest of Ukraine will be forming
increasingly closer ties with the European Union. Where exactly the demarcation line will be and how
long the current intense phase of the conflict will last is still unclear. However, that the outcome of the
conflict will be that a sizeable region will de facto be separated from the rest is almost a certainty by
now.
What are the implications of this scenario? Instead of the hybrid status of Ukraine being an ‘in-between
state’ it is highly likely that Ukraine will have two parts: one part with a potential to become a region more

INDUSTRIAL AND REGIONAL DEVELOPMENTS
69
integrated with developments in Western and Central Eastern Europe and another (much smaller) part
which will further deepen its historical industrial and economic links with Russia.
Analysts in the past have pointed to the importance of Ukraine maintaining economic ties with both the
EU and Russia. This will be the case now, but mostly separately and in a relatively extreme manner, in
terms of relatively separate trade and economic reorientation of the two parts in different directions.88
This might not be the optimal outcome for Ukraine as a whole, but the most likely – almost certain – one,
at least in the foreseeable future.
Will this lead to a successful economic development in the longer run?
The track record of CEECs which went on a path of integration with the EU is – on balance – positive.
There is certainly differentiation amongst the CEECs and some back-sliding in political-economic terms
in some of the economies especially after accession to the EU (e.g. Hungary, Romania), but on average,
we have witnessed a relatively successful ‘convergence’ story in Central Eastern Europe over the past
two decades (see Figure 22).
Figure 22 / GDP growth convergence, index 1995=100, differences to EU-27 average, in pp
Source: Dobrinsky and Havlik (2014).
As regards Ukraine, this report and other analysts (Havrylyshyn, 2014; OECD, 2014; World Bank, 2014;
Aslund, 2014) have pointed out that Ukraine requires a major break in its institutional development and
in relation to the stranglehold which oligarchic structures maintain over its economy (see Chapter 3 in
this report), in order to follow the path pursued by the more successful Central European transition
economies.
Over the longer run, there are reasons to believe that the EU-oriented part of Ukraine is reasonably well
placed to follow a convergence path in the future. What are the factors which point in this direction?
88 Of course, the dependency of ‘Western Ukraine’ on oil and gas supplies from Russia will remain.
-40
-20
0
20
40
60
80
100
120
1995 1996 1997 1998 1999 2000 2001 2002 2003 2004 2005 2006 2007 2008 2009 2010 2011 2012
BG CZ EE HU LV LTPO RO SK SI NMS-10
Baltics

70 INDUSTRIAL AND REGIONAL DEVELOPMENTS
› The reaction by the ‘West’ – documented by the most recent engagement both of the IMF to prepare a
further substantial financial assistance package (Extended Fund Facility) in the midst of military
conflict as well as the intense efforts by Germany and France to mediate an armistice deal – is an
expression of utmost commitment to push for its interest. This, of course, mirrors the commitment by
Putin to entrench his engagement in the eastern – split-off – part of Ukraine. Both these engagements
imply that considerable resources will be forthcoming from both sides to support their positions in the
two different parts – although along quite different lines.
› From the West’s point of view ‘success’ will have to be defined as a pay-off in terms of stabilising the
economic situation in the short run and supporting in a significant way institutional and political-
economic change in Ukraine which would be instrumental in bringing the country on a sustainable
growth path. The chances for this happening – we would judge – are not small as the partition of the
country might lead to a realignment and reorientation of the longer-term interests of the elites
(including oligarchs) as we have witnessed in quite a few of the transition countries in the course of
their rapprochement towards the EU – ending with EU membership. It is not a foregone conclusion, as
a concrete offer of full membership of the EU is not currently being made and this served as an
important focusing device for society and elites in other transition economies.
› The Deep and Comprehensive Free Trade Area (DCFTA) – together with the recent IMF Agreement –
will play quite an important role as an instrument for reforms: from the Ukrainian side all state bodies
will be heavily involved in its implementation and from the EU’s side (and other Western international
bodies) a massive mobilisation of technical assistance will be provided to assist in these reforms. By
past experience this can make a substantial impact on changing state, legal and market structures.
As regards regional and industrial developments we conjecture the following:
› Amongst the industrial regions, two will be part of ‘East Ukraine’ (i.e. large parts of Luhansk and
Donetsk), but there are other eastern regions, such as Dnipropetrovsk, Zaporizhzhya, Poltava, Sumy
and Kharkiv, which are likely to remain in the part of Ukraine under control of the Kyiv government.
These are currently in a very difficult phase given the conflict situation and the interruption of historical
production and trade links. The aim, however, has to be to preserve the potential for the development
of a diversified industrial structure which could evolve in this part of Ukraine. Massive investments will
be required to modernise capacities and reshape product programmes in line with changing market
orientation. It will be difficult in the short run to attract private sector foreign investors to this region,
partly because of the conflict situation and the massive nature of the task of restructuring, and partly
because of the highly concentrated nature of control of markets by existing interests and institutional
hindrances.
› The opening-up of highly concentrated market structures will thus have to be given high priority and
public supports by international donors together with the application of strict conditionality with regard
to institutional improvements will have to prepare the ground for the massive task of restructuring and
modernisation of industrial capacities in this region. The implementation of a programme to attract FDI
(discussed in Chapter 5) will be important for the whole of Ukraine but is absolutely indispensable in
this region as the task of reshaping product programmes and redirecting sales to new markets will be
impossible without the support of foreign investors.

INDUSTRIAL AND REGIONAL DEVELOPMENTS
71
› The question in the other (western) regions is how quickly the Ukraine can be made attractive to
cross-border and cross-European production networks which played an important role in
modernisation, the re-industrialisation and the development of an export base of the Central Eastern
European economies. Experience tells us that the regions which are neighbouring more advanced
economies (in this case particularly the regions bordering Poland) would have the potential to become
part of cross-border production networks.89 The development first of cross-border production linkages
and then the gradual upgrading of Ukraine’s position in value-added chains in agriculture, food
processing, wood-based industries and other (inclusive supplier) industries in these regions would
open up a scenario of regional rebalancing overcoming the pattern which characterised Ukraine’s
economy historically where industrial regions were concentrated in the east and agrarian regions in
the west.
› Linked to the encouragement of cross-border production networks but also the necessary changes in
market orientation is the focus on redesigning and improving the transport infrastructure and – as
mentioned earlier – the manifold improvements of institutional characteristics (legal, barriers to
enterprise activity) which still make the Ukraine rather unattractive for foreign investors.
› As outlined in Chapter 5, there were programmes already in place in Ukraine to streamline the efforts
to attract foreign direct investment over the past years, but these were hampered by major
weaknesses in institutions, legal and governance reliability and, more recently, by political instability.
Realistically, only once the conflict gets truly ‘frozen’ and the very challenging short-term
macroeconomic situation gets stabilised (the IMF programme will have to show some success with
regard to achieving a sustainable fiscal situation as well as monetary stabilisation), can longer-run
factors come into play to allow a catching-up process to truly take hold in the Ukraine.
› Comparative advantage factors (a relatively skilled and cheap labour force; geographic proximity to
EU markets; transport infrastructure inherited from the past but requiring capital investment) as well as
the impact of the recent strong devaluation (leading to very low relative production costs) make
Ukraine a potentially attractive location for international investments. The implementation of the
DCFTA and accompanying improvements of institutional and legal conditions may furthermore play an
important role. Evidence from the development processes in the CEE transition economies also points
to an advantage of the relatively big economies (such as Poland and Romania) to be attractive for
foreign investors both for the size of the domestic market as well as the production scale which can be
achieved for exporting and drawing on a wider domestic supplier network.
› The mobilisation of domestic public and international investment resources will have to play a major
role to revamp the educational sector, invest into the transport network (road and rail), and support the
process of regional redistribution of industrial activity and diversification in combination with policies
targeted to make private productive investment attractive again.
› Ukraine has suffered and will continue to suffer from a drain of skilled and professional workers
through outward migration. The track record of other transition countries shows that this can be
stopped or even partly reversed once an economy embarks on a successful catching-up process.
89 It is an interesting feature of many transition countries that the most rapid development processes take place in the western regions even though these border in most cases on the less developed regions of the neighbouring countries. It is the ease with which the geographic location of such regions lends itself to easier logistics of cross-border linkages while still benefiting from country-wide comparative advantage factors which explains this regional development pattern.
72 INDUSTRIAL AND REGIONAL DEVELOPMENTS
However, it is important to develop incentive structures for the highly skilled and professionals to see a
perspective in terms of career prospects (based on meritocratic criteria) and (at least expected future)
rewards to keep them in the country and support the re-stabilisation and growth process of the
country.
› Entry and exit rates in the firm population are very low, reflecting a high degree of concentration in
industrial activity (see World Bank, 2012). A powerful and well-monitored competition authority could
play an important role in improving mobility patterns, easing the ability of new firm entry and making
sure that public support is provided in a manner less skewed towards incumbents.
› Reforms of tax structures and the revamping of tax administration could also reduce the size of the
informal sector (estimated to be up to 40% of the economy) thus also broadening the base from which
firm growth including in export activity could take place. A large informal sector biases economic
structures in favour of the non-tradable sectors and inhibits human capital development.
› Policy measures emphasising a higher degree of diversification of export structures is a must
particularly in the case of Ukraine as the high reliance on exports of metals, petroleum products and
chemicals led to very high instability of terms-of-trade and export earnings. FDI alone might not lead to
diversification as the track record in many countries shows a strong interest by foreign investors in
materials. Hence accompanying policies (education, infrastructure, institutional/legal) have to be
implemented to avoid an undue continued specialisation of the Ukrainian economy on metals and low-
processed commodity exports.
The policy proposals regarding support for industrial and regional development are the following:
- Maintain and re-build diversified industrial capacities in eastern Ukrainian regions: this requires
massive new investments to assist the necessary adjustment process (market re-orientation,
disruption of production links, modernisation of product programme; improvement in energy
efficiency). Initially there will be a phase when private investors will be very hesitant to move into
this region. Hence public (domestic and international) support is required.
- Support upgrading and diversification of western regions in agricultural production, food
processing, wood-based industries, light industry. Use regional policy tools, improve local
authority administration to attract FDI. Support regionally diversified development also in second-
tier cities which can provide positive spillover effects in less developed regions.
- Use effectively technical assistance and transitory periods under the DCFTA as well as other
supports (EIB, EBRD, etc.) to upgrade technical standards, improve energy efficiency, encourage
cooperation with foreign partners to obtain better market access and improve product
programmes and product quality to enhance export capacity.
- Invest into new and improved transport routes to support market reorientation, regional
rebalancing of economic activity and new inter-regional and cross-border production and trade
linkages.
INDUSTRIAL AND REGIONAL DEVELOPMENTS
73
- Improve market structures: set up an effective and transparent competition authority; support new
entrants through a range of financial instruments and infrastructural supports and exert stronger
control of oligopolistic interests.
- Support training and retraining institutions to cope with the difficult labour market situation
resulting from the need of regional and industrial restructuring, introduce incentive schemes to
reduce out-migration and encourage return-migration of skilled young personnel.
74 REFERENCES
References
Aslund, A. (2015), ‘Ukraine – What Went Wrong and How to Fix It’, Peterson Institute for International Economic Studies, Washington.
Astrov, V. et al. (2010), ‘Ukraine, the European Union and the international community: Current challenges and the agenda for overcoming the stalemate’, wiiw Research Report No. 364.
Balassa, B. (1965), Trade Liberalization and Revealed Comparative Advantage. Manchester School of
Economic and Social Studies, 33, 99-123.
Balassa, B. (1986), ‘Comparative advantage in manufactured goods: a reappraisal’, The Review of Economics and Statistics 68(2): 315-19.
Blanchard O. and D. Leigh (2013), Growth forecast errors and fiscal multipliers, IMF Working Paper WP/13/1.
Blockmans, S. (2014), ‘Seven challenges to the Eastern Partnership’. CEPS Blog, 14th November.
BNP Paribas (2015), ‘Ukraine: Recap of breakfast with finance minister Natalie Jaresko’, 24 March,
http://rss-globalmarkets.bnpparibas.com/r/0324_-_BNPP_-
_BreakfastWithJaresko.pdf?t=Aj3BBENgPu7PJtrkJndHW&stream=true
Boistö Plan (2014), ‘A 24-Step Plan to Resolve the Ukrainian Crisis’, 26 August
(http://www.theatlantic.com/international/archive/2014/08/a-24-step-plan-to-resolve-the-ukraine-
crisis/379121/).
Cenusa, D. et al. (2014), ‘Russia’s Punitive Trade Policy Measures towards Ukraine, Moldova and Georgia’.
CEPS Working Document, No. 400, September.
Commission of the European Communities (2003), ‘Impact of Enlargement on Industry’. Commission Staff
Working Paper, SEC(2003) 234, February.
Copsey, N. and O. Pomorska (2014), ‘The Influence of Newer Member States in the European Union: The Case of Poland and the Eastern Partnership’, Europe-Asia Studies, Vol. 66, No. 3, pp. 421-443.
Delcour, L. and H. Kostanyan (2014), ‘Towards a Fragmented Neighbourhood: Policies of the EU and Russia and their consequences for the area that lies in between’. CEPS Essay, No. 17, October.
Dobrinsky, R. and P. Havlik (2014), ‘Economic Convergence and Structural Change: the Role of Transition
and EU Accession’; wiiw Research Report no 395; The Vienna Institute for International Economic Studies; Vienna.
Dabrowski, M. (2015), ‘It’s not just Russia: currency crises in the Commonwealth of Independent States’,
Bruegel Policy Contribution, February.
Dvorkin, V. (2015), ‘Who Benefits From Ending Russian-Ukrainian Cooperation in the Space and Defense Sectors?’. Carnegie Moscow Center, 16th March.
EBRD (2014a), ‘Russia/Ukraine crisis casts shadow over emerging economies’, London, 18 September.
EBRD (2014b), ‘The impact on the EBRD region of Russia’s food ban’, News, 9 September.

REFERENCES
75
Emerson, M. (2014a), ‘Towards a fresh deal for Ukraine, the EU and Russia and their neighbourhood policies: 15 steps’, CEPS Commentary, Brussels, 29 May.
Emerson, M. (2014b), ‘The EU-Ukraine-Russia Sanctions Triangle’, CEPS Commentary, Brussels, 13 October.
Emerson, M. (2015), ‘Is there reason to hope for Minsk II?’ CEPS Commentary, 16 February.
European Commission (2015), ‘Towards a new European Neighbourhood Policy’. Brussels. 4.3.2015 JOIN(2015) 6 final
Füle, Š. (2013a), ‘EU – Ukraine: In Yalta about progress towards signing the Association Agreement’,
Speech/13/727, 10th Yalta Annual Meeting, Yalta, Ukraine, 20 September.
Füle, Š. (2013b), ‘EU – Ukraine: Dispelling the Myths about the Association Agreement’, Speech/13/808, International Conference ‘The Way Ahead for the Eastern Partnership’, Kyiv, Ukraine, 11 October.
Gaddy, C. G. and B. W. Ickes (2014), ‘Can Sanctions Stop Putin?’, 3 June (www.brookings.edu).
Gelpern, A. (2015), ‘How to Help Ukraine and Offset Russia’s Advantage’. Peterson Institute for International Economics, February (http://blogs.piie.com/realtime/?p=4792).
Gorodnichenko Yu. (2015), Что Потребует МВФ в Обмен на $40 Млрд Помощи, Vox Ukraine, 28 March,
http://voxukraine.org/2015/03/28/imf-program-for-ukraine-what-to-expect-ru/
Grinberg, R., P. Havlik and O. Havrylyshyn (eds.) (2008), ‘Economic restructuring and integration in Eastern
Europe: experiences and policy implications’, Nomos Verlagsgesellschaft, Baden-Baden.
Havlik, P. (2013), ‘Vilnius Eastern Partnership Summit: A Milestone in EU-Russia Relations – not just for Ukraine’, wiiw Policy Notes and Reports, No. 11, Vienna, November.
Havlik, P. (2014), ‘Economic consequences of the Ukraine conflict’, wiiw Policy Notes and Reports, No. 14,
Vienna, November.
Havlik P., M. Landesmann and R. Stehrer (2001), Competitiveness of CEE Industries: Evidence From Foreign Trade Specialization and Quality Indicators, wiiw Research Report No. 278, July.
Havrylyshyn, O. (2014), Ukraine – Greatest Hopes, Greatest Disappointments; article.
Heyets, V.M., Shinkaruk, L.V. (2014), ‘Ukraine’s Integration Options: Perspectives and Consequences’ (in
Ukrainian). Institute of Economics and Forecasting, Ukraine Academy of Sciences.
Hoekman, B., J. Jensen and D. Tarr (2013), ‘A Vision for Ukraine in the World Economy. Defining a Trade policy Strategy that Leverages Global Opportunities’. Paper presented at 10th Yalta Annual Meeting YES,
September (www.yes-ukraine.org).
Ignatieff, M. (2014), ‘The post-Ukraine world order’, 50th Annual Lecture, Ditchley, 12 July.
IMF (2014), Ukraine - First Review of the Stand-by Arrangement; IMF Country report 14/263, August,
Washington.
IMF (2015), ‘Ukraine – Request for Extended Arrangement under the Extended Fund Facility and Cancellation of Stand-By Arrangement’; IMF Country report 15/69, March, Washington.
Kotkin, S. (2015), ‘The resistible Rise of Vladimir Putin’. Foreign Affairs. March/April.
Inayeh, A., D. Schwarzer and J. Forbrig (2014), ‘Regional Repercussions of the Ukraine Crisis. Challenges for the Six Eastern Partnership Countries’, The German Marshall Fund of the US, Economic Policy Paper 3.
Lachman D. (2015), ’Who should pay for Ukraine?‘, American Enterprise Institute, 7 February, http://www.aei.org/publication/pay-ukraine/

76 REFERENCES
Lubkivsky D. (2015), Russia’s war. Ukraine’s freedom. Our future, Presentation at ICEUR (International Centre for Advanced and Comparative EU-Russia/NIS Research), 27 February, Vienna
Mitra P. and T. Poghosyan (2015), Fiscal multipliers in Ukraine, IMF Working Paper WP/15/71, March.
Niblett, R. (2015), ‘What should Europe’s policy be towards Russia?’, Fondation Robert Schuman, Policy Paper, No. 349, 24th March.
OECD (2014), OECD Territorial Reviews: Ukraine, 2013; Paris.
Pelipas, I., I. Tochitskaya and E. Vinokurov (2014), ‘Quantifying Economic integration of the European Union and the Eurasian Economic Union: Methodological Approaches’, EDB Centre for Integration Studies Report,
No. 23.
Rashkovan, V. (2015), Ukraine: Current economic developments, Presentation at the wiiw member seminar, 26 March, Vienna
Saha, D., R. Guicci, D. Naumenko and A. Kovalchuk (2014), ‘Ukrainian Machine Building: Strategic options and short term measures in view of trade disruptions with Russia’. German Advisory Group/Institute for Economic Research and Policy Consulting. Policy Paper Series (PP/02/2014), Berlin/Kyiv, August.
Schadler, S. (2014), ‘Ukraine: A stress test of IMF credibility’, 9 October, http://www.voxeu.org/article/ukraine-stress-test-imf-credibility
SP Advisors (2015), ‘Обзор экономики Украины: приближаясь ко дну‘, 19 January, http://www.spadvisors.eu/rs/item_89/
Speck, U. (2014), ‘Postponing the Trade Agreement with Ukraine: Bad Move, EU’, Carnegie Europe, 30 September.
Summers, L. (2014), ‘ “Potemkin money” is the wrong way to help Ukraine’, Financial Times, 10 March, p. 7.
Techau, J. (2014), ‘Europe’s Five Deadly Sins on Ukraine’, Carnegie Europe, 4 March
Trenin, D. (2014a), ‘A War of Escalation’, Carnegie Moscow Center, OP-ED Foreign Policy, 19 March.
Trenin, D. (2014b), ‘The Ukraine Crisis and the Resumption of Great-Power Rivalry’, Carnegie Moscow Center, 9 July.
Uiboupin, J. (2006), Industrial clusters and regional development in Ukraine: the implications of foreign direct
investments and trade; Turku School of Economics; Publication of the Pan-European Institute 9/2006, Turku.
Vinokurov, Ye. et al. (2014), ‘Deadend of Integration Struggles in Europe’, Committee of Public Initiatives, Moscow, mimeo (in Russian).
wiiw (2015), ‘A time of moderate expectations’, wiiw Forecast Report. Economic Analysis and Outlook for Central, East and Southeast Europe, The Vienna Institute for International Economic Studies, Spring.
World Bank (2012), From Dispersion to Agglomeration: the Role of Internal Labor Mobility in Creating More
and Better Jobs in Ukraine; Human Development Department, ECA Regional Office; The World Bank.
Yavlinsky, G. (2015), ‘Nemtsov was casualty of a wider war’. Financial Times, 2 March, p. 9.

ANNEX
77
Annex
Annex Table 1 / Foreign trade by top twenty partner s
2000 2005 2010 2011 2012 2013 Total exports, fob, EUR million 1) 15,765 27,455 38,729 49,130 53,553 47,693 of which EU-28, fob, EUR million 5,215 8,257 9,859 12,945 13,323 12,622 Export shares in % (ranking in 2013) Russia 1 24.1 21.9 26.1 29.0 25.6 23.8 Turkey 2 6.0 5.9 5.9 5.5 5.4 6.0 China 3 4.3 2.1 0.9 3.2 2.6 4.3 Egypt 4 1.5 2.3 0.4 2.0 4.2 4.3 Poland 5 2.9 3.0 3.5 4.1 3.7 4.0 Italy 6 4.4 5.5 4.7 4.4 3.6 3.7 Kazakhstan 7 0.5 1.9 2.5 2.7 3.6 3.3 Belarus 8 1.9 2.6 3.7 2.8 3.3 3.1 India 9 1.2 2.2 1.0 3.3 3.3 3.1 Germany 10 5.1 3.8 2.9 2.6 2.4 2.5 Hungary 11 2.2 2.0 1.7 2.0 2.2 2.5 Netherlands 12 0.9 1.5 1.1 1.2 1.2 1.6 Spain 13 1.1 1.7 0.8 1.4 2.2 1.6 Moldova 14 1.2 2.0 1.4 1.3 1.2 1.4 United States 15 5.0 2.8 1.6 1.6 1.5 1.4 Azerbaijan 16 0.3 0.8 1.2 1.0 1.1 1.4 Czech Republic 17 1.3 1.1 1.2 1.2 1.0 1.3 Iran 18 0.6 1.7 0.6 1.6 1.7 1.3 Saudi Arabia 19 0.2 1.1 0.2 1.2 1.3 1.2 Iraq 20 . . 0.3 0.9 1.3 1.2
Total imports, cif, EUR million 1) 15,098 28,985 45,764 59,340 65,914 57,986 of which EU-28, cif, EUR million 4,379 9,795 14,429 18,536 20,413 20,371 Import shares in % (ranking in 2013) Russia 1 41.7 35.5 36.5 35.3 32.4 30.2 China 2 0.9 5.0 2.0 7.6 9.3 10.3 Germany 3 8.1 9.4 7.6 8.3 8.0 8.8 Poland 4 2.2 3.9 4.6 3.9 4.2 5.3 Belarus 5 4.3 2.6 4.2 5.1 6.0 4.7 United States 6 2.6 2.0 2.9 3.1 3.4 3.6 Italy 7 2.5 2.9 2.3 2.4 2.6 2.7 Turkey 8 1.1 1.7 2.1 1.8 2.3 2.4 France 9 1.7 2.2 1.8 1.8 2.0 2.2 Hungary 10 1.2 1.8 2.0 1.6 1.4 1.8 United Kingdom 11 1.5 1.4 1.4 1.4 1.4 1.5 Netherlands 12 1.1 1.3 1.4 1.4 1.3 1.4 Czech Republic 13 1.2 1.6 1.2 1.4 1.5 1.3 Japan 14 0.7 1.5 1.3 1.2 1.4 1.3 Austria 15 1.3 1.3 1.1 0.9 0.9 1.3 Lithuania 16 1.0 0.6 1.0 1.0 1.1 1.3 Switzerland 17 1.6 0.7 0.8 1.0 0.9 1.2 Romania 18 0.3 0.6 1.1 1.4 1.1 1.2 Spain 19 0.7 0.6 0.8 0.8 0.9 1.1 India 20 0.5 0.9 0.3 1.0 1.2 1.1
1) Values in EUR converted from USD to NCU to EUR at the average official exchange rate. Source: wiiw database
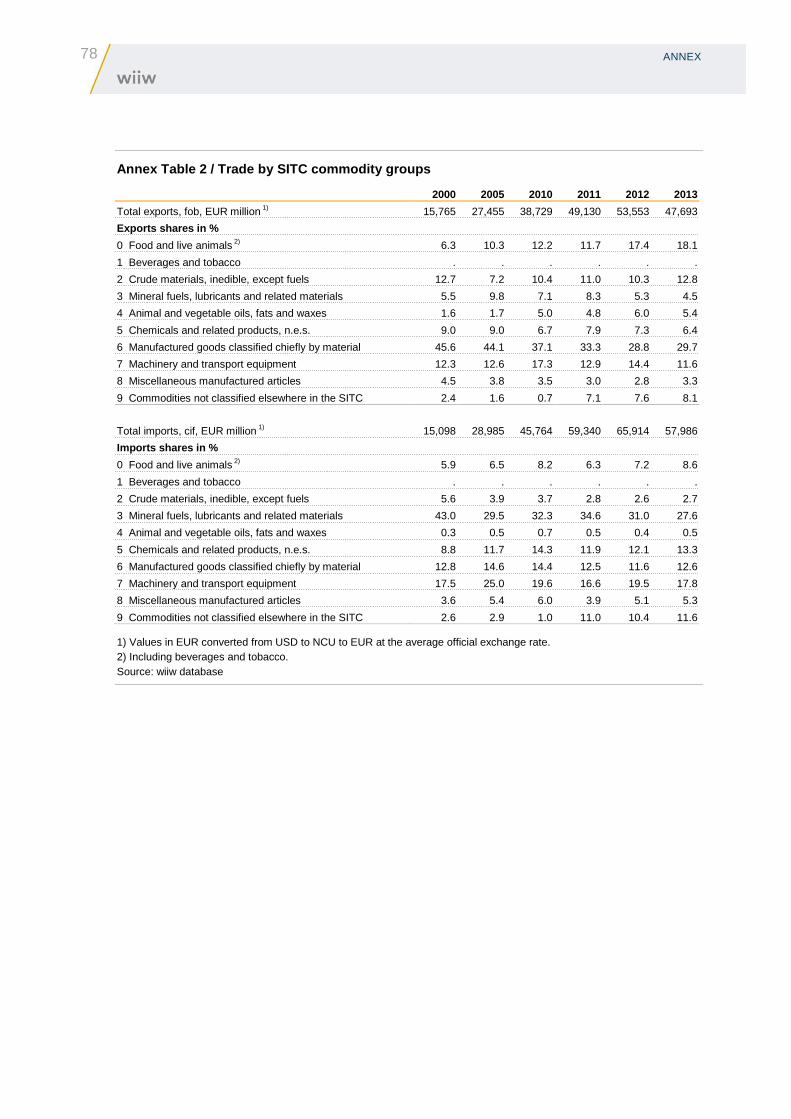
78 ANNEX
Annex Table 2 / Trade by SITC commodity groups
2000 2005 2010 2011 2012 2013
Total exports, fob, EUR million 1) 15,765 27,455 38,729 49,130 53,553 47,693
Exports shares in %
0 Food and live animals 2) 6.3 10.3 12.2 11.7 17.4 18.1
1 Beverages and tobacco . . . . . .
2 Crude materials, inedible, except fuels 12.7 7.2 10.4 11.0 10.3 12.8
3 Mineral fuels, lubricants and related materials 5.5 9.8 7.1 8.3 5.3 4.5
4 Animal and vegetable oils, fats and waxes 1.6 1.7 5.0 4.8 6.0 5.4
5 Chemicals and related products, n.e.s. 9.0 9.0 6.7 7.9 7.3 6.4
6 Manufactured goods classified chiefly by material 45.6 44.1 37.1 33.3 28.8 29.7
7 Machinery and transport equipment 12.3 12.6 17.3 12.9 14.4 11.6
8 Miscellaneous manufactured articles 4.5 3.8 3.5 3.0 2.8 3.3
9 Commodities not classified elsewhere in the SITC 2.4 1.6 0.7 7.1 7.6 8.1
Total imports, cif, EUR million 1) 15,098 28,985 45,764 59,340 65,914 57,986
Imports shares in %
0 Food and live animals 2) 5.9 6.5 8.2 6.3 7.2 8.6
1 Beverages and tobacco . . . . . .
2 Crude materials, inedible, except fuels 5.6 3.9 3.7 2.8 2.6 2.7
3 Mineral fuels, lubricants and related materials 43.0 29.5 32.3 34.6 31.0 27.6
4 Animal and vegetable oils, fats and waxes 0.3 0.5 0.7 0.5 0.4 0.5
5 Chemicals and related products, n.e.s. 8.8 11.7 14.3 11.9 12.1 13.3
6 Manufactured goods classified chiefly by material 12.8 14.6 14.4 12.5 11.6 12.6
7 Machinery and transport equipment 17.5 25.0 19.6 16.6 19.5 17.8
8 Miscellaneous manufactured articles 3.6 5.4 6.0 3.9 5.1 5.3
9 Commodities not classified elsewhere in the SITC 2.6 2.9 1.0 11.0 10.4 11.6
1) Values in EUR converted from USD to NCU to EUR at the average official exchange rate. 2) Including beverages and tobacco. Source: wiiw database
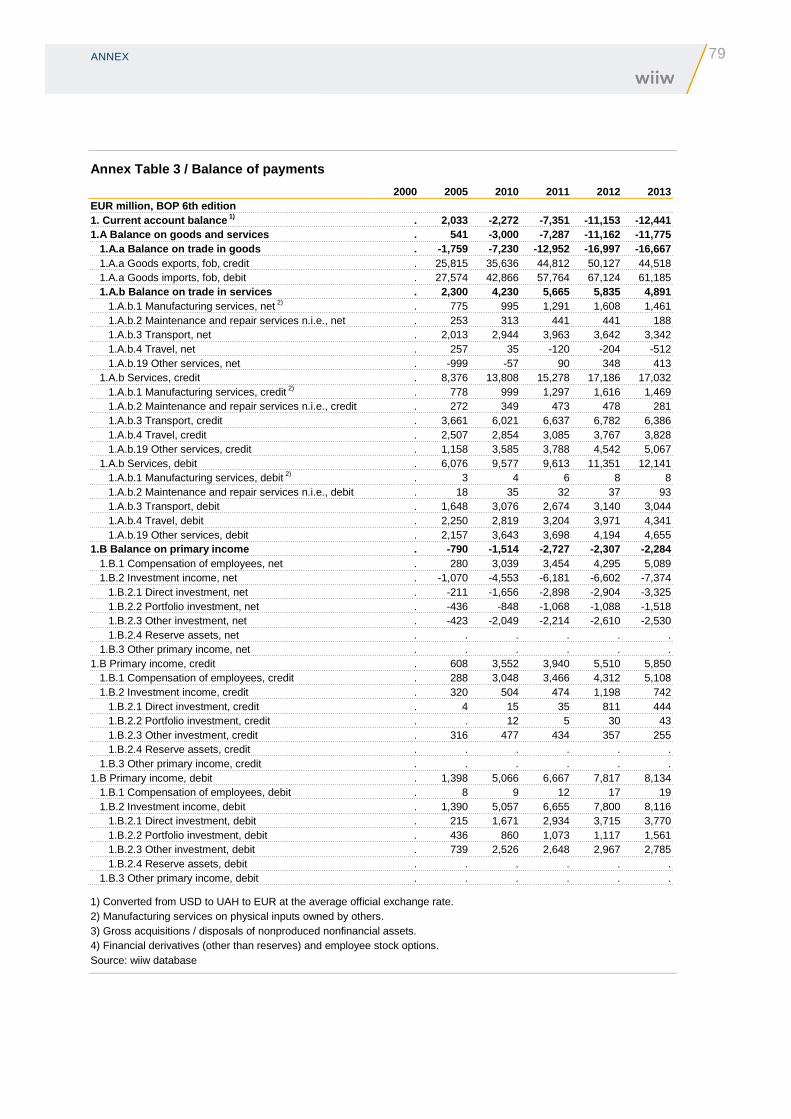
ANNEX
79
Annex Table 3 / Balance of payments
2000 2005 2010 2011 2012 2013 EUR million, BOP 6th edition 1. Current account balance 1) . 2,033 -2,272 -7,351 -11,153 -12,441 1.A Balance on goods and services . 541 -3,000 -7,287 -11,162 -11,775 1.A.a Balance on trade in goods . -1,759 -7,230 -12,952 -16,997 -16,667 1.A.a Goods exports, fob, credit . 25,815 35,636 44,812 50,127 44,518 1.A.a Goods imports, fob, debit . 27,574 42,866 57,764 67,124 61,185 1.A.b Balance on trade in services . 2,300 4,230 5,665 5,835 4,891 1.A.b.1 Manufacturing services, net 2) . 775 995 1,291 1,608 1,461 1.A.b.2 Maintenance and repair services n.i.e., net . 253 313 441 441 188 1.A.b.3 Transport, net . 2,013 2,944 3,963 3,642 3,342 1.A.b.4 Travel, net . 257 35 -120 -204 -512 1.A.b.19 Other services, net . -999 -57 90 348 413 1.A.b Services, credit . 8,376 13,808 15,278 17,186 17,032 1.A.b.1 Manufacturing services, credit 2) . 778 999 1,297 1,616 1,469 1.A.b.2 Maintenance and repair services n.i.e., credit . 272 349 473 478 281 1.A.b.3 Transport, credit . 3,661 6,021 6,637 6,782 6,386 1.A.b.4 Travel, credit . 2,507 2,854 3,085 3,767 3,828 1.A.b.19 Other services, credit . 1,158 3,585 3,788 4,542 5,067 1.A.b Services, debit . 6,076 9,577 9,613 11,351 12,141 1.A.b.1 Manufacturing services, debit 2) . 3 4 6 8 8 1.A.b.2 Maintenance and repair services n.i.e., debit . 18 35 32 37 93 1.A.b.3 Transport, debit . 1,648 3,076 2,674 3,140 3,044 1.A.b.4 Travel, debit . 2,250 2,819 3,204 3,971 4,341 1.A.b.19 Other services, debit . 2,157 3,643 3,698 4,194 4,655 1.B Balance on primary income . -790 -1,514 -2,727 -2,307 -2,284 1.B.1 Compensation of employees, net . 280 3,039 3,454 4,295 5,089 1.B.2 Investment income, net . -1,070 -4,553 -6,181 -6,602 -7,374 1.B.2.1 Direct investment, net . -211 -1,656 -2,898 -2,904 -3,325 1.B.2.2 Portfolio investment, net . -436 -848 -1,068 -1,088 -1,518 1.B.2.3 Other investment, net . -423 -2,049 -2,214 -2,610 -2,530 1.B.2.4 Reserve assets, net . . . . . . 1.B.3 Other primary income, net . . . . . . 1.B Primary income, credit . 608 3,552 3,940 5,510 5,850 1.B.1 Compensation of employees, credit . 288 3,048 3,466 4,312 5,108 1.B.2 Investment income, credit . 320 504 474 1,198 742 1.B.2.1 Direct investment, credit . 4 15 35 811 444 1.B.2.2 Portfolio investment, credit . . 12 5 30 43 1.B.2.3 Other investment, credit . 316 477 434 357 255 1.B.2.4 Reserve assets, credit . . . . . . 1.B.3 Other primary income, credit . . . . . . 1.B Primary income, debit . 1,398 5,066 6,667 7,817 8,134 1.B.1 Compensation of employees, debit . 8 9 12 17 19 1.B.2 Investment income, debit . 1,390 5,057 6,655 7,800 8,116 1.B.2.1 Direct investment, debit . 215 1,671 2,934 3,715 3,770 1.B.2.2 Portfolio investment, debit . 436 860 1,073 1,117 1,561 1.B.2.3 Other investment, debit . 739 2,526 2,648 2,967 2,785 1.B.2.4 Reserve assets, debit . . . . . . 1.B.3 Other primary income, debit . . . . . .
1) Converted from USD to UAH to EUR at the average official exchange rate. 2) Manufacturing services on physical inputs owned by others. 3) Gross acquisitions / disposals of nonproduced nonfinancial assets. 4) Financial derivatives (other than reserves) and employee stock options. Source: wiiw database
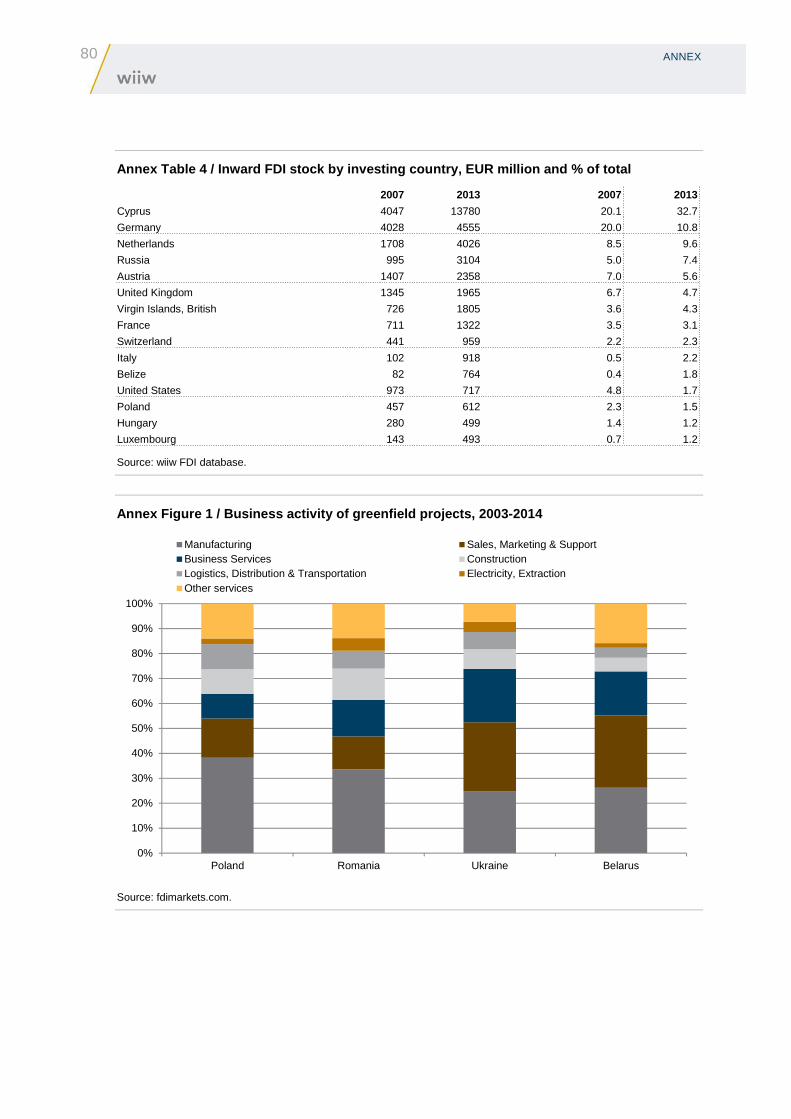
80 ANNEX
Annex Table 4 / Inward FDI stock by investing count ry, EUR million and % of total
2007 2013 2007 2013
Cyprus 4047 13780 20.1 32.7
Germany 4028 4555 20.0 10.8
Netherlands 1708 4026 8.5 9.6
Russia 995 3104 5.0 7.4
Austria 1407 2358 7.0 5.6
United Kingdom 1345 1965 6.7 4.7
Virgin Islands, British 726 1805 3.6 4.3
France 711 1322 3.5 3.1
Switzerland 441 959 2.2 2.3
Italy 102 918 0.5 2.2
Belize 82 764 0.4 1.8
United States 973 717 4.8 1.7
Poland 457 612 2.3 1.5
Hungary 280 499 1.4 1.2
Luxembourg 143 493 0.7 1.2
Source: wiiw FDI database.
Annex Figure 1 / Business activity of greenfield pr ojects, 2003-2014
Source: fdimarkets.com.
0%
10%
20%
30%
40%
50%
60%
70%
80%
90%
100%
Poland Romania Ukraine Belarus
Manufacturing Sales, Marketing & SupportBusiness Services ConstructionLogistics, Distribution & Transportation Electricity, ExtractionOther services

ANNEX
81
Annex Figure 2 / Number of greenfield projects by b usiness activity
Source: fdimarkets.com
Annex Table 5 / Number and value of greenfield proj ects 2003-2014
Industry Sector Industry Business activity
Number of
projects
Value
EUR million
Number of
projects
Value
EUR million
Financial Services 153 3763.2 Sales, Marketing & Support 246 2396.4
Food & Tobacco 73 1988.5 Manufacturing 222 10001.8
Software & IT services 69 775.5 Business Services 191 3914.5
Transportation 58 1258.4 Construction 70 8717.5
Real Estate 56 7511.5 Logistics, Distribution &
Transportation
62 1759.1
Business Services 52 120.4 Design, Development &
Testing
22 96.9
Coal, Oil and Natural Gas 40 2327.1 Electricity 21 3333.8
Communications 39 1373.1 ICT & Internet Infrastructure 21 1264.6
Metals 33 852.9 Extraction 15 832.8
Building & Construction
Materials
32 1846.7 Research & Development 6 315.1
Hotels & Tourism 30 1398.2 Maintenance & Servicing 5 30.5
Industrial Machinery, Equipment
& Tools
25 164.1 Recycling 3 183.5
Alternative/Renewable energy 23 2873.9 Headquarters 3 57.4
Beverages 21 460.6 Customer Contact Centre 3 4.0
Chemicals 20 491.5 Education & Training 1 5.0
Automotive OEM 19 1627.3 Shared Services Centre 1 17.3
Consumer Products 18 215.0 Total 892 32930.2
Consumer Electronics 14 718.9
Other 117 3163.4
Total 892 32930.2
Source: fdimarkets.com.
0
5
10
15
20
25
30
35
40
2009 2010 2011 2012 2013 2014
Sales, Marketing & Support
Manufacturing
Business Services
Construction
Logistics, Distribution &Transportation
Design, Development & Testing
Electricity
ICT & Internet Infrastructure
Extraction
Other

82 ANNEX
Annex Table 6 / Specialisation of regions of Ukrain e relative to country as a whole
A B C-E F G-N, R-T O-Q
Agriculture,
forestry and
fishing
Mining and
quarrying Industry Construction
Market
services
Non-market
services
City of Kyiv -1.00 -1.00 -0.64 0.53 0.63 -0.30
Kyiv 0.51 -0.94 -0.03 0.16 0.07 -0.12
Chernivtsi 1.25 -0.96 -0.48 0.42 -0.22 0.84
Ivano-Frankivsk 0.36 0.37 0.16 0.96 -0.31 0.20
Khmelnytskiy 1.46 -0.90 0.08 -0.37 -0.34 0.59
Lviv 0.00 -0.49 -0.20 -0.12 0.05 0.34
Rivne 0.90 -0.68 0.32 -0.01 -0.31 0.35
Ternopil 1.70 -0.83 -0.32 -0.27 -0.20 0.43
Vinnytsya 1.50 -0.84 -0.06 -0.15 -0.31 0.56
Volyn 0.84 -0.89 -0.14 -0.18 -0.08 0.34
Zakarpattya 0.59 -0.94 0.07 -0.21 -0.14 0.44
Zhytomyr 1.14 0.09 -0.15 -0.34 -0.33 0.57
Chernihiv 1.32 0.26 -0.09 -0.56 -0.34 0.39
Donetsk -0.53 1.19 0.39 0.13 -0.12 -0.33
Kharkiv -0.02 -0.59 0.02 -0.01 0.03 0.15
Luhansk -0.30 1.65 0.52 -0.41 -0.34 0.01
Poltava 0.58 1.76 0.43 -0.28 -0.41 -0.26
Sumy 0.81 0.32 0.02 -0.50 -0.24 0.21
Cherkasy 1.43 -0.89 0.29 -0.43 -0.27 0.12
Dnipropetrovsk -0.45 2.67 0.27 -0.40 -0.25 -0.33
Kherson 1.69 -0.97 -0.14 -0.58 -0.25 0.48
Kirovohrad 1.59 -0.30 -0.04 -0.48 -0.28 0.22
Mykolayiv 0.82 -0.94 0.38 -0.35 -0.18 0.12
Odesa -0.17 -0.99 -0.29 0.33 0.21 0.14
Zaporizhzhya -0.06 -0.57 1.24 -0.51 -0.34 -0.06
Autonomous Republic of Crimea -0.04 -0.72 -0.21 -0.12 0.03 0.52
Sevastopol -1.00 -0.76 -0.24 0.12 0.08 0.93
Note: The figures refer to the share of a particular economic activity in region's value added minus the share of that economic activity in the whole economy of Ukraine minus one ‘Industry’ includes ‘C Manufacturing’, ‘D Electricity, gas, steam, air conditioning supply’, ‘E Water supply, sewerage, waste management, remediation’ (NACE Rev. 2). ‘Market services’ includes ‘G Wholesale, retail trade, repair of motor vehicles etc.’, ‘H Transportation and storage’, ‘I Accommodation and food service activities’, ‘J Information and communication’, ‘K Financial and insurance activities’, ’L Real estate activities’, ‘M Professional, scientific and technical activities’, ‘R Arts, entertainment and recreation’, ‘S Other service activities’, ‘T Activities of househ.as employers and for own use ‘ (NACE Rev. 2). ‘Non-market services’ includes ‘O Public administration, defence, compulsory social security’, ‘P Education’, ‘Q Human health and social work activities’ (NACE Rev. 2). Source: State Statistics Service of Ukraine.
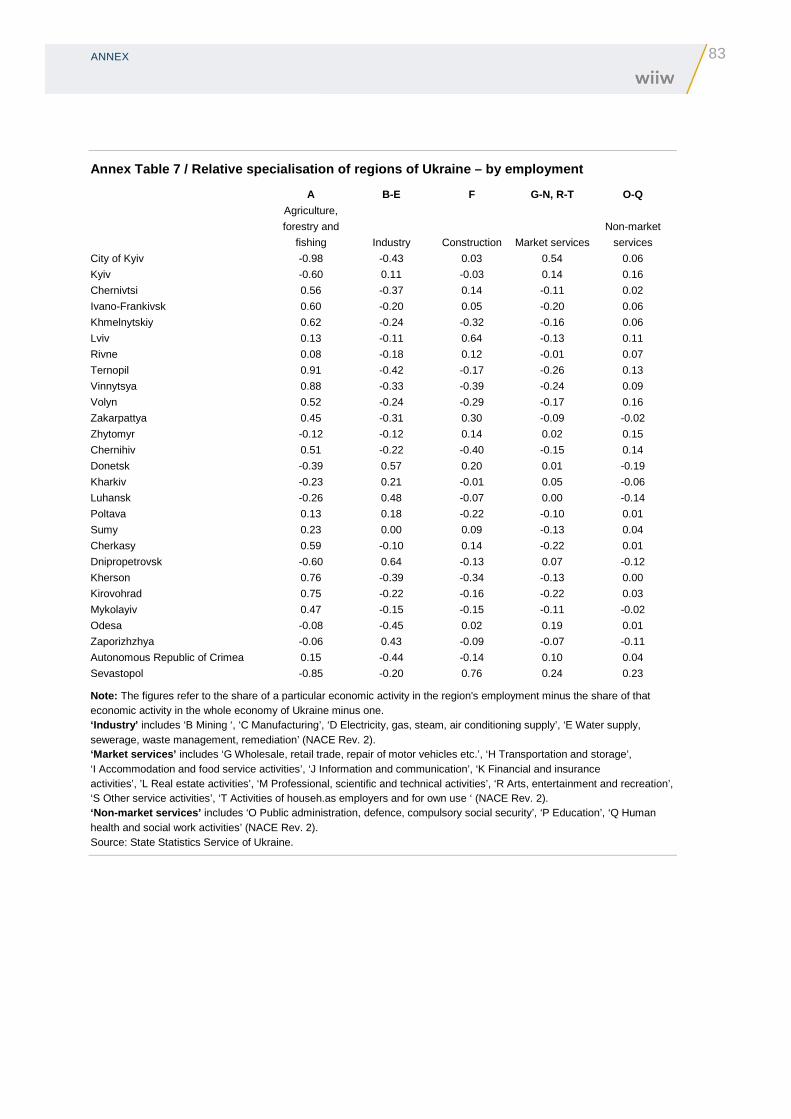
ANNEX
83
Annex Table 7 / Relative specialisation of regions of Ukraine – by employment
A B-E F G-N, R-T O-Q
Agriculture,
forestry and
fishing Industry Construction Market services
Non-market
services
City of Kyiv -0.98 -0.43 0.03 0.54 0.06
Kyiv -0.60 0.11 -0.03 0.14 0.16
Chernivtsi 0.56 -0.37 0.14 -0.11 0.02
Ivano-Frankivsk 0.60 -0.20 0.05 -0.20 0.06
Khmelnytskiy 0.62 -0.24 -0.32 -0.16 0.06
Lviv 0.13 -0.11 0.64 -0.13 0.11
Rivne 0.08 -0.18 0.12 -0.01 0.07
Ternopil 0.91 -0.42 -0.17 -0.26 0.13
Vinnytsya 0.88 -0.33 -0.39 -0.24 0.09
Volyn 0.52 -0.24 -0.29 -0.17 0.16
Zakarpattya 0.45 -0.31 0.30 -0.09 -0.02
Zhytomyr -0.12 -0.12 0.14 0.02 0.15
Chernihiv 0.51 -0.22 -0.40 -0.15 0.14
Donetsk -0.39 0.57 0.20 0.01 -0.19
Kharkiv -0.23 0.21 -0.01 0.05 -0.06
Luhansk -0.26 0.48 -0.07 0.00 -0.14
Poltava 0.13 0.18 -0.22 -0.10 0.01
Sumy 0.23 0.00 0.09 -0.13 0.04
Cherkasy 0.59 -0.10 0.14 -0.22 0.01
Dnipropetrovsk -0.60 0.64 -0.13 0.07 -0.12
Kherson 0.76 -0.39 -0.34 -0.13 0.00
Kirovohrad 0.75 -0.22 -0.16 -0.22 0.03
Mykolayiv 0.47 -0.15 -0.15 -0.11 -0.02
Odesa -0.08 -0.45 0.02 0.19 0.01
Zaporizhzhya -0.06 0.43 -0.09 -0.07 -0.11
Autonomous Republic of Crimea 0.15 -0.44 -0.14 0.10 0.04
Sevastopol -0.85 -0.20 0.76 0.24 0.23
Note: The figures refer to the share of a particular economic activity in the region's employment minus the share of that economic activity in the whole economy of Ukraine minus one. ‘Industry’ includes ‘B Mining ‘, ‘C Manufacturing’, ‘D Electricity, gas, steam, air conditioning supply’, ‘E Water supply, sewerage, waste management, remediation’ (NACE Rev. 2). ‘Market services’ includes ‘G Wholesale, retail trade, repair of motor vehicles etc.’, ‘H Transportation and storage’, ‘I Accommodation and food service activities’, ‘J Information and communication’, ‘K Financial and insurance activities’, ’L Real estate activities’, ‘M Professional, scientific and technical activities’, ‘R Arts, entertainment and recreation’, ‘S Other service activities’, ‘T Activities of househ.as employers and for own use ‘ (NACE Rev. 2). ‘Non-market services’ includes ‘O Public administration, defence, compulsory social security’, ‘P Education’, ‘Q Human health and social work activities’ (NACE Rev. 2). Source: State Statistics Service of Ukraine.
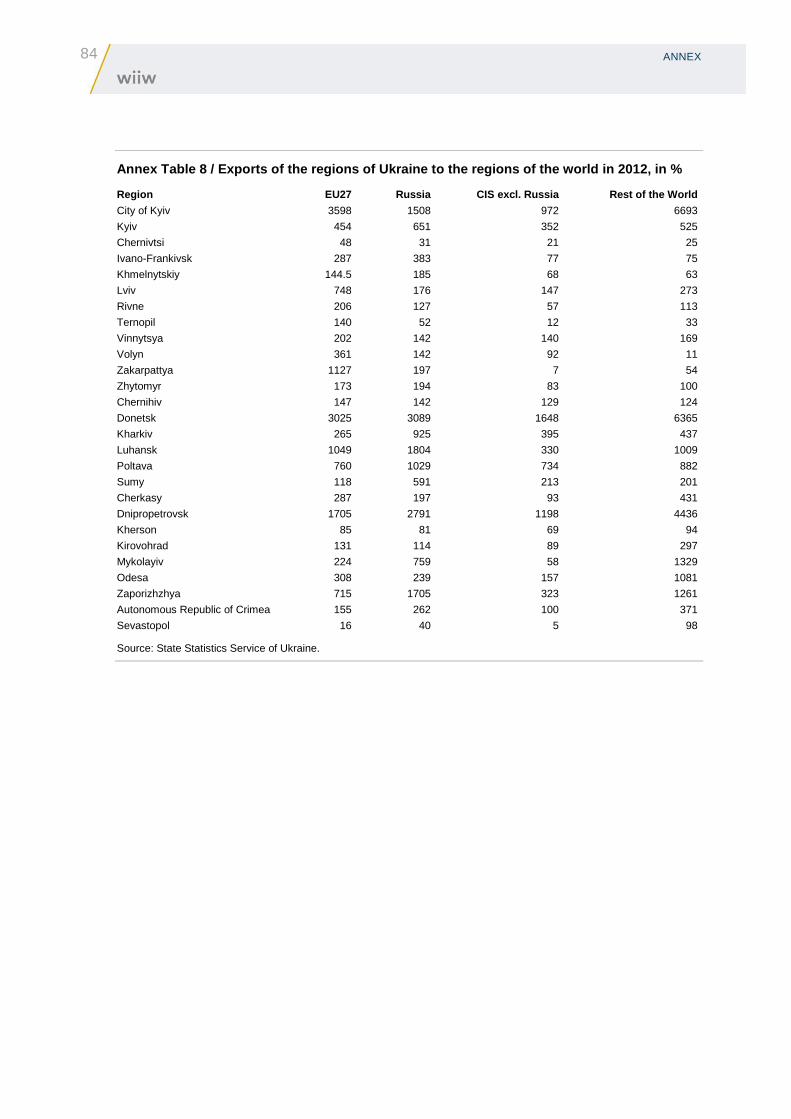
84 ANNEX
Annex Table 8 / Exports of the regions of Ukraine t o the regions of the world in 2012, in %
Region EU27 Russia CIS excl. Russia Rest of the World
City of Kyiv 3598 1508 972 6693
Kyiv 454 651 352 525
Chernivtsi 48 31 21 25
Ivano-Frankivsk 287 383 77 75
Khmelnytskiy 144.5 185 68 63
Lviv 748 176 147 273
Rivne 206 127 57 113
Ternopil 140 52 12 33
Vinnytsya 202 142 140 169
Volyn 361 142 92 11
Zakarpattya 1127 197 7 54
Zhytomyr 173 194 83 100
Chernihiv 147 142 129 124
Donetsk 3025 3089 1648 6365
Kharkiv 265 925 395 437
Luhansk 1049 1804 330 1009
Poltava 760 1029 734 882
Sumy 118 591 213 201
Cherkasy 287 197 93 431
Dnipropetrovsk 1705 2791 1198 4436
Kherson 85 81 69 94
Kirovohrad 131 114 89 297
Mykolayiv 224 759 58 1329
Odesa 308 239 157 1081
Zaporizhzhya 715 1705 323 1261
Autonomous Republic of Crimea 155 262 100 371
Sevastopol 16 40 5 98
Source: State Statistics Service of Ukraine.
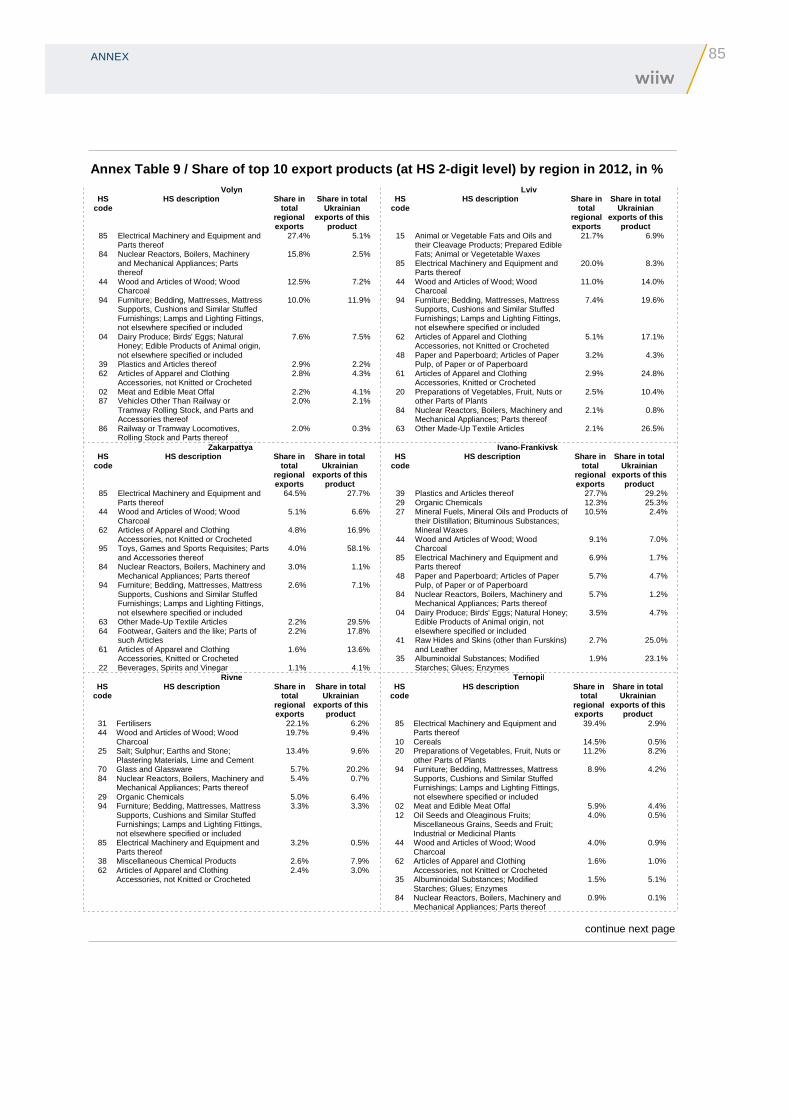
ANNEX
85
Annex Table 9 / Share of top 10 export products (at HS 2-digit level) by region in 2012, in % Volyn
HS code
HS description Share in total
regional exports
Share in total Ukrainian
exports of this product
85 Electrical Machinery and Equipment and Parts thereof
27.4% 5.1%
84 Nuclear Reactors, Boilers, Machinery and Mechanical Appliances; Parts thereof
15.8% 2.5%
44 Wood and Articles of Wood; Wood Charcoal
12.5% 7.2%
94 Furniture; Bedding, Mattresses, Mattress Supports, Cushions and Similar Stuffed Furnishings; Lamps and Lighting Fittings, not elsewhere specified or included
10.0% 11.9%
04 Dairy Produce; Birds' Eggs; Natural Honey; Edible Products of Animal origin, not elsewhere specified or included
7.6% 7.5%
39 Plastics and Articles thereof 2.9% 2.2% 62 Articles of Apparel and Clothing
Accessories, not Knitted or Crocheted 2.8% 4.3%
02 Meat and Edible Meat Offal 2.2% 4.1% 87 Vehicles Other Than Railway or
Tramway Rolling Stock, and Parts and Accessories thereof
2.0% 2.1%
86 Railway or Tramway Locomotives, Rolling Stock and Parts thereof
2.0% 0.3%
Lviv HS
code HS description Share in
total regional exports
Share in total Ukrainian
exports of this product
15 Animal or Vegetable Fats and Oils and their Cleavage Products; Prepared Edible Fats; Animal or Vegetetable Waxes
21.7% 6.9%
85 Electrical Machinery and Equipment and Parts thereof
20.0% 8.3%
44 Wood and Articles of Wood; Wood Charcoal
11.0% 14.0%
94 Furniture; Bedding, Mattresses, Mattress Supports, Cushions and Similar Stuffed Furnishings; Lamps and Lighting Fittings, not elsewhere specified or included
7.4% 19.6%
62 Articles of Apparel and Clothing Accessories, not Knitted or Crocheted
5.1% 17.1%
48 Paper and Paperboard; Articles of Paper Pulp, of Paper or of Paperboard
3.2% 4.3%
61 Articles of Apparel and Clothing Accessories, Knitted or Crocheted
2.9% 24.8%
20 Preparations of Vegetables, Fruit, Nuts or other Parts of Plants
2.5% 10.4%
84 Nuclear Reactors, Boilers, Machinery and Mechanical Appliances; Parts thereof
2.1% 0.8%
63 Other Made-Up Textile Articles 2.1% 26.5%
Zakarpattya HS
code HS description Share in
total regional exports
Share in total Ukrainian
exports of this product
85 Electrical Machinery and Equipment and Parts thereof
64.5% 27.7%
44 Wood and Articles of Wood; Wood Charcoal
5.1% 6.6%
62 Articles of Apparel and Clothing Accessories, not Knitted or Crocheted
4.8% 16.9%
95 Toys, Games and Sports Requisites; Parts and Accessories thereof
4.0% 58.1%
84 Nuclear Reactors, Boilers, Machinery and Mechanical Appliances; Parts thereof
3.0% 1.1%
94 Furniture; Bedding, Mattresses, Mattress Supports, Cushions and Similar Stuffed Furnishings; Lamps and Lighting Fittings, not elsewhere specified or included
2.6% 7.1%
63 Other Made-Up Textile Articles 2.2% 29.5% 64 Footwear, Gaiters and the like; Parts of
such Articles 2.2% 17.8%
61 Articles of Apparel and Clothing Accessories, Knitted or Crocheted
1.6% 13.6%
22 Beverages, Spirits and Vinegar 1.1% 4.1%
Ivano -Frankivsk HS
code HS description Share in
total regional exports
Share in total Ukrainian
exports of this product
39 Plastics and Articles thereof 27.7% 29.2% 29 Organic Chemicals 12.3% 25.3% 27 Mineral Fuels, Mineral Oils and Products of
their Distillation; Bituminous Substances; Mineral Waxes
10.5% 2.4%
44 Wood and Articles of Wood; Wood Charcoal
9.1% 7.0%
85 Electrical Machinery and Equipment and Parts thereof
6.9% 1.7%
48 Paper and Paperboard; Articles of Paper Pulp, of Paper or of Paperboard
5.7% 4.7%
84 Nuclear Reactors, Boilers, Machinery and Mechanical Appliances; Parts thereof
5.7% 1.2%
04 Dairy Produce; Birds' Eggs; Natural Honey; Edible Products of Animal origin, not elsewhere specified or included
3.5% 4.7%
41 Raw Hides and Skins (other than Furskins) and Leather
2.7% 25.0%
35 Albuminoidal Substances; Modified Starches; Glues; Enzymes
1.9% 23.1%
Rivne HS
code HS description Share in
total regional exports
Share in total Ukrainian
exports of this product
31 Fertilisers 22.1% 6.2% 44 Wood and Articles of Wood; Wood
Charcoal 19.7% 9.4%
25 Salt; Sulphur; Earths and Stone; Plastering Materials, Lime and Cement
13.4% 9.6%
70 Glass and Glassware 5.7% 20.2% 84 Nuclear Reactors, Boilers, Machinery and
Mechanical Appliances; Parts thereof 5.4% 0.7%
29 Organic Chemicals 5.0% 6.4% 94 Furniture; Bedding, Mattresses, Mattress
Supports, Cushions and Similar Stuffed Furnishings; Lamps and Lighting Fittings, not elsewhere specified or included
3.3% 3.3%
85 Electrical Machinery and Equipment and Parts thereof
3.2% 0.5%
38 Miscellaneous Chemical Products 2.6% 7.9% 62 Articles of Apparel and Clothing
Accessories, not Knitted or Crocheted 2.4% 3.0%
Ternopil HS
code HS description Share in
total regional exports
Share in total Ukrainian
exports of this product
85 Electrical Machinery and Equipment and Parts thereof
39.4% 2.9%
10 Cereals 14.5% 0.5% 20 Preparations of Vegetables, Fruit, Nuts or
other Parts of Plants 11.2% 8.2%
94 Furniture; Bedding, Mattresses, Mattress Supports, Cushions and Similar Stuffed Furnishings; Lamps and Lighting Fittings, not elsewhere specified or included
8.9% 4.2%
02 Meat and Edible Meat Offal 5.9% 4.4% 12 Oil Seeds and Oleaginous Fruits;
Miscellaneous Grains, Seeds and Fruit; Industrial or Medicinal Plants
4.0% 0.5%
44 Wood and Articles of Wood; Wood Charcoal
4.0% 0.9%
62 Articles of Apparel and Clothing Accessories, not Knitted or Crocheted
1.6% 1.0%
35 Albuminoidal Substances; Modified Starches; Glues; Enzymes
1.5% 5.1%
84 Nuclear Reactors, Boilers, Machinery and Mechanical Appliances; Parts thereof
0.9% 0.1%
continue next page
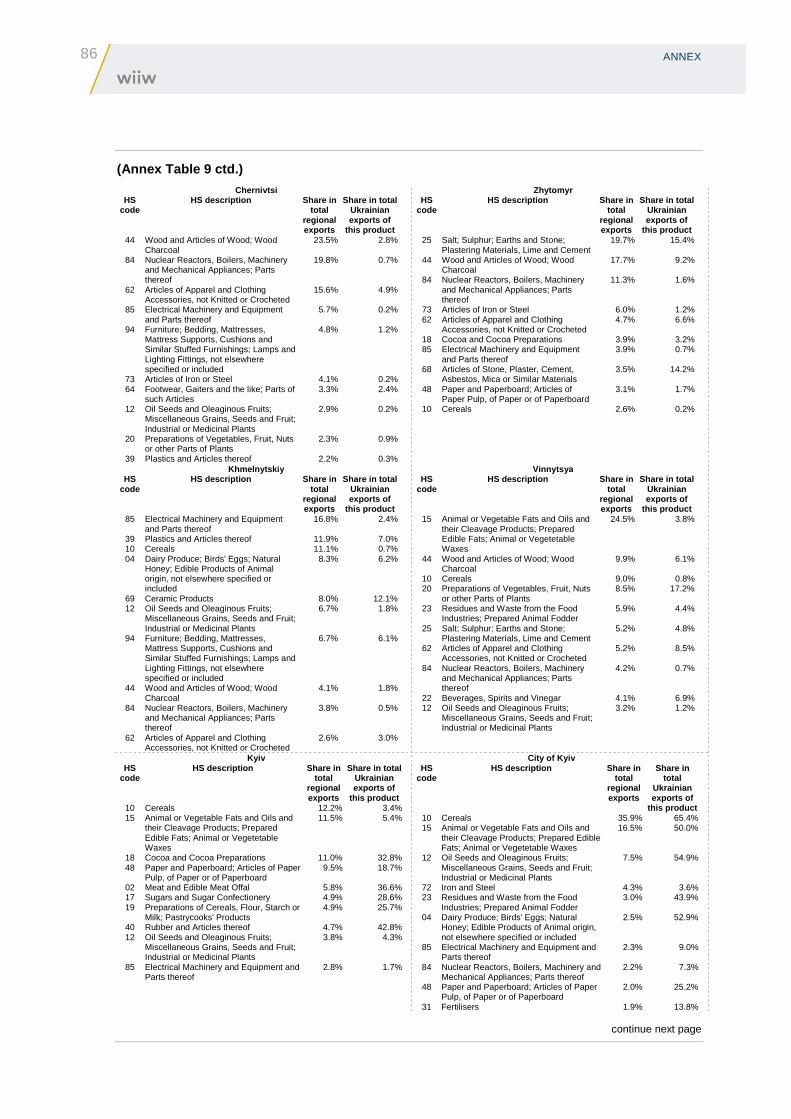
86 ANNEX
(Annex Table 9 ctd.) Chernivtsi
HS code
HS description Share in total
regional exports
Share in total Ukrainian exports of
this product 44 Wood and Articles of Wood; Wood
Charcoal 23.5% 2.8%
84 Nuclear Reactors, Boilers, Machinery and Mechanical Appliances; Parts thereof
19.8% 0.7%
62 Articles of Apparel and Clothing Accessories, not Knitted or Crocheted
15.6% 4.9%
85 Electrical Machinery and Equipment and Parts thereof
5.7% 0.2%
94 Furniture; Bedding, Mattresses, Mattress Supports, Cushions and Similar Stuffed Furnishings; Lamps and Lighting Fittings, not elsewhere specified or included
4.8% 1.2%
73 Articles of Iron or Steel 4.1% 0.2% 64 Footwear, Gaiters and the like; Parts of
such Articles 3.3% 2.4%
12 Oil Seeds and Oleaginous Fruits; Miscellaneous Grains, Seeds and Fruit; Industrial or Medicinal Plants
2.9% 0.2%
20 Preparations of Vegetables, Fruit, Nuts or other Parts of Plants
2.3% 0.9%
39 Plastics and Articles thereof 2.2% 0.3%
Zhytomyr HS
code HS description Share in
total regional exports
Share in total Ukrainian exports of
this product 25 Salt; Sulphur; Earths and Stone;
Plastering Materials, Lime and Cement 19.7% 15.4%
44 Wood and Articles of Wood; Wood Charcoal
17.7% 9.2%
84 Nuclear Reactors, Boilers, Machinery and Mechanical Appliances; Parts thereof
11.3% 1.6%
73 Articles of Iron or Steel 6.0% 1.2% 62 Articles of Apparel and Clothing
Accessories, not Knitted or Crocheted 4.7% 6.6%
18 Cocoa and Cocoa Preparations 3.9% 3.2% 85 Electrical Machinery and Equipment
and Parts thereof 3.9% 0.7%
68 Articles of Stone, Plaster, Cement, Asbestos, Mica or Similar Materials
3.5% 14.2%
48 Paper and Paperboard; Articles of Paper Pulp, of Paper or of Paperboard
3.1% 1.7%
10 Cereals 2.6% 0.2%
Khmelnytskiy HS
code HS description Share in
total regional exports
Share in total Ukrainian exports of
this product 85 Electrical Machinery and Equipment
and Parts thereof 16.8% 2.4%
39 Plastics and Articles thereof 11.9% 7.0% 10 Cereals 11.1% 0.7% 04 Dairy Produce; Birds' Eggs; Natural
Honey; Edible Products of Animal origin, not elsewhere specified or included
8.3% 6.2%
69 Ceramic Products 8.0% 12.1% 12 Oil Seeds and Oleaginous Fruits;
Miscellaneous Grains, Seeds and Fruit; Industrial or Medicinal Plants
6.7% 1.8%
94 Furniture; Bedding, Mattresses, Mattress Supports, Cushions and Similar Stuffed Furnishings; Lamps and Lighting Fittings, not elsewhere specified or included
6.7% 6.1%
44 Wood and Articles of Wood; Wood Charcoal
4.1% 1.8%
84 Nuclear Reactors, Boilers, Machinery and Mechanical Appliances; Parts thereof
3.8% 0.5%
62 Articles of Apparel and Clothing Accessories, not Knitted or Crocheted
2.6% 3.0%
Vinnytsya HS
code HS description Share in
total regional exports
Share in total Ukrainian exports of
this product 15 Animal or Vegetable Fats and Oils and
their Cleavage Products; Prepared Edible Fats; Animal or Vegetetable Waxes
24.5% 3.8%
44 Wood and Articles of Wood; Wood Charcoal
9.9% 6.1%
10 Cereals 9.0% 0.8% 20 Preparations of Vegetables, Fruit, Nuts
or other Parts of Plants 8.5% 17.2%
23 Residues and Waste from the Food Industries; Prepared Animal Fodder
5.9% 4.4%
25 Salt; Sulphur; Earths and Stone; Plastering Materials, Lime and Cement
5.2% 4.8%
62 Articles of Apparel and Clothing Accessories, not Knitted or Crocheted
5.2% 8.5%
84 Nuclear Reactors, Boilers, Machinery and Mechanical Appliances; Parts thereof
4.2% 0.7%
22 Beverages, Spirits and Vinegar 4.1% 6.9% 12 Oil Seeds and Oleaginous Fruits;
Miscellaneous Grains, Seeds and Fruit; Industrial or Medicinal Plants
3.2% 1.2%
Kyiv HS
code HS description Share in
total regional exports
Share in total Ukrainian exports of
this product 10 Cereals 12.2% 3.4% 15 Animal or Vegetable Fats and Oils and
their Cleavage Products; Prepared Edible Fats; Animal or Vegetetable Waxes
11.5% 5.4%
18 Cocoa and Cocoa Preparations 11.0% 32.8% 48 Paper and Paperboard; Articles of Paper
Pulp, of Paper or of Paperboard 9.5% 18.7%
02 Meat and Edible Meat Offal 5.8% 36.6% 17 Sugars and Sugar Confectionery 4.9% 28.6% 19 Preparations of Cereals, Flour, Starch or
Milk; Pastrycooks' Products 4.9% 25.7%
40 Rubber and Articles thereof 4.7% 42.8% 12 Oil Seeds and Oleaginous Fruits;
Miscellaneous Grains, Seeds and Fruit; Industrial or Medicinal Plants
3.8% 4.3%
85 Electrical Machinery and Equipment and Parts thereof
2.8% 1.7%
City of Kyiv HS
code HS description Share in
total regional exports
Share in total
Ukrainian exports of
this product 10 Cereals 35.9% 65.4% 15 Animal or Vegetable Fats and Oils and
their Cleavage Products; Prepared Edible Fats; Animal or Vegetetable Waxes
16.5% 50.0%
12 Oil Seeds and Oleaginous Fruits; Miscellaneous Grains, Seeds and Fruit; Industrial or Medicinal Plants
7.5% 54.9%
72 Iron and Steel 4.3% 3.6% 23 Residues and Waste from the Food
Industries; Prepared Animal Fodder 3.0% 43.9%
04 Dairy Produce; Birds' Eggs; Natural Honey; Edible Products of Animal origin, not elsewhere specified or included
2.5% 52.9%
85 Electrical Machinery and Equipment and Parts thereof
2.3% 9.0%
84 Nuclear Reactors, Boilers, Machinery and Mechanical Appliances; Parts thereof
2.2% 7.3%
48 Paper and Paperboard; Articles of Paper Pulp, of Paper or of Paperboard
2.0% 25.2%
31 Fertilisers 1.9% 13.8%
continue next page

ANNEX
87
(Annex Table 9 ctd.) Chernihiv
HS code
HS description Share in total
regional exports
Share in total Ukrainian
exports of this product
10 Cereals 23.6% 1.8% 48 Paper and Paperboard; Articles of Paper
Pulp, of Paper or of Paperboard 20.3% 10.9%
44 Wood and Articles of Wood; Wood Charcoal
7.7% 3.9%
04 Dairy Produce; Birds' Eggs; Natural Honey; Edible Products of Animal origin, not elsewhere specified or included
4.7% 4.1%
12 Oil Seeds and Oleaginous Fruits; Miscellaneous Grains, Seeds and Fruit; Industrial or Medicinal Plants
4.6% 1.4%
22 Beverages, Spirits and Vinegar 3.4% 4.7% 64 Footwear, Gaiters and the like; Parts of
such Articles 3.1% 9.9%
85 Electrical Machinery and Equipment and Parts thereof
3.0% 0.5%
84 Nuclear Reactors, Boilers, Machinery and Mechanical Appliances; Parts thereof
2.7% 0.4%
62 Articles of Apparel and Clothing Accessories, not Knitted or Crocheted
2.6% 3.6%
Cherkasy HS
code HS description Share in
total regional exports
Share in total Ukrainian
exports of this product
31 Fertilisers 28.2% 15.9% 12 Oil Seeds and Oleaginous Fruits;
Miscellaneous Grains, Seeds and Fruit; Industrial or Medicinal Plants
11.1% 6.4%
15 Animal or Vegetable Fats and Oils and their Cleavage Products; Prepared Edible Fats; Animal or Vegetetable Waxes
8.2% 2.0%
29 Organic Chemicals 6.5% 16.4% 10 Cereals 5.3% 0.8% 23 Residues and Waste from the Food
Industries; Prepared Animal Fodder 5.3% 6.0%
87 Vehicles Other Than Railway or Tramway Rolling Stock, and Parts and Accessories Thereof
3.1% 5.3%
84 Nuclear Reactors, Boilers, Machinery and Mechanical Appliances; Parts thereof
3.1% 0.8%
20 Preparations of Vegetables, Fruit, Nuts or other Parts of Plants
2.5% 7.7%
44 Wood and Articles of Wood; Wood Charcoal
2.4% 2.3%
Sumy HS
code HS description Share in
total regional exports
Share in total Ukrainian
exports of this product
84 Nuclear Reactors, Boilers, Machinery and Mechanical Appliances; Parts thereof
49.6% 14.7%
32 Tanning or Dyeing Extracts; Tannins and Their Derivatives; Dyes, Pigments and Other Colouring Matter
8.0% 24.7%
31 Fertilisers 7.3% 4.6% 83 Miscellaneous Articles of Base Metal 4.5% 37.6% 18 Cocoa and Cocoa Preparations 4.2% 7.1% 10 Cereals 3.3% 0.5% 85 Electrical Machinery and Equipment and
Parts thereof 2.8% 1.0%
44 Wood and Articles of Wood; Wood Charcoal
2.7% 2.8%
19 Preparations of Cereals, Flour, Starch or Milk; Pastrycooks' Products
2.4% 7.2%
64 Footwear, Gaiters and the like; Parts of such Articles
2.1% 14.1%
Poltava HS
code HS description Share in
total regional exports
Share in total Ukrainian
exports of this product
86 Railway or Tramway Locomotives, Rolling Stock and Parts thereof
40.0% 33.2%
27 Mineral Fuels, Mineral Oils and Products of their Distillation; Bituminous Substances; Mineral Waxes
6.2% 5.8%
10 Cereals 5.3% 2.6% 84 Nuclear Reactors, Boilers, Machinery and
Mechanical Appliances; Parts thereof 3.6% 3.2%
87 Vehicles Other Than Railway or Tramway Rolling Stock, and Parts and Accessories Thereof
3.1% 18.3%
28 Inorganic Chemicals; Organic or Inorganic Compounds of Precious Metals, of Rare-Earth Metals
1.9% 3.8%
04 Dairy Produce; Birds' Eggs; Natural Honey; Edible Products of Animal origin, not elsewhere specified or included
1.0% 5.5%
15 Animal or Vegetable Fats and Oils and their Cleavage Products; Prepared Edible Fats; Animal or Vegetetable Waxes
0.9% 0.8%
12 Oil Seeds and Oleaginous Fruits; Miscellaneous Grains, Seeds and Fruit; Industrial or Medicinal Plants
0.7% 1.4%
85 Electrical Machinery and Equipment and Parts thereof
0.7% 0.7%
Kirovohrad HS
code HS description Share in
total regional exports
Share in total Ukrainian
exports of this product
15 Animal or Vegetable Fats and Oils and their Cleavage Products; Prepared Edible Fats; Animal or Vegetetable Waxes
34.7% 5.2%
84 Nuclear Reactors, Boilers, Machinery and Mechanical Appliances; Parts thereof
16.0% 2.7%
27 Mineral Fuels, Mineral Oils and Products of their Distillation; Bituminous Substances; Mineral Waxes
13.5% 2.3%
10 Cereals 9.7% 0.9% 23 Residues and Waste from the Food
Industries; Prepared Animal Fodder 8.7% 6.2%
25 Salt; Sulphur; Earths and Stone; Plastering Materials, Lime and Cement
3.4% 3.1%
12 Oil Seeds and Oleaginous Fruits; Miscellaneous Grains, Seeds and Fruit; Industrial or Medicinal Plants
2.5% 0.9%
17 Sugars and Sugar Confectionery 2.1% 3.9% 85 Electrical Machinery and Equipment and
Parts thereof 1.7% 0.3%
44 Wood and Articles of Wood; Wood Charcoal
1.2% 0.7%
Mykolayiv HS
code HS description Share in
total regional exports
Share in total Ukrainian
exports of this product
10 Cereals 36.0% 12.2% 28 Inorganic Chemicals; Organic or Inorganic
Compounds of Precious Metals, of Rare-Earth Metals
23.8% 33.3%
84 Nuclear Reactors, Boilers, Machinery and Mechanical Appliances; Parts thereof
13.9% 8.7%
15 Animal or Vegetable Fats and Oils and their Cleavage Products; Prepared Edible Fats; Animal or Vegetetable Waxes
7.6% 4.3%
12 Oil Seeds and Oleaginous Fruits; Miscellaneous Grains, Seeds and Fruit; Industrial or Medicinal Plants
7.6% 10.2%
22 Beverages, Spirits and Vinegar 1.6% 9.6% 20 Preparations of Vegetables, Fruit, Nuts or
other Parts of Plants 1.4% 10.5%
23 Residues and Waste from the Food Industries; Prepared Animal Fodder
1.3% 3.6%
89 Ships, Boats and Floating Structures 1.2% 8.4% 17 Sugars and Sugar Confectionery 0.9% 6.2%
continue next page
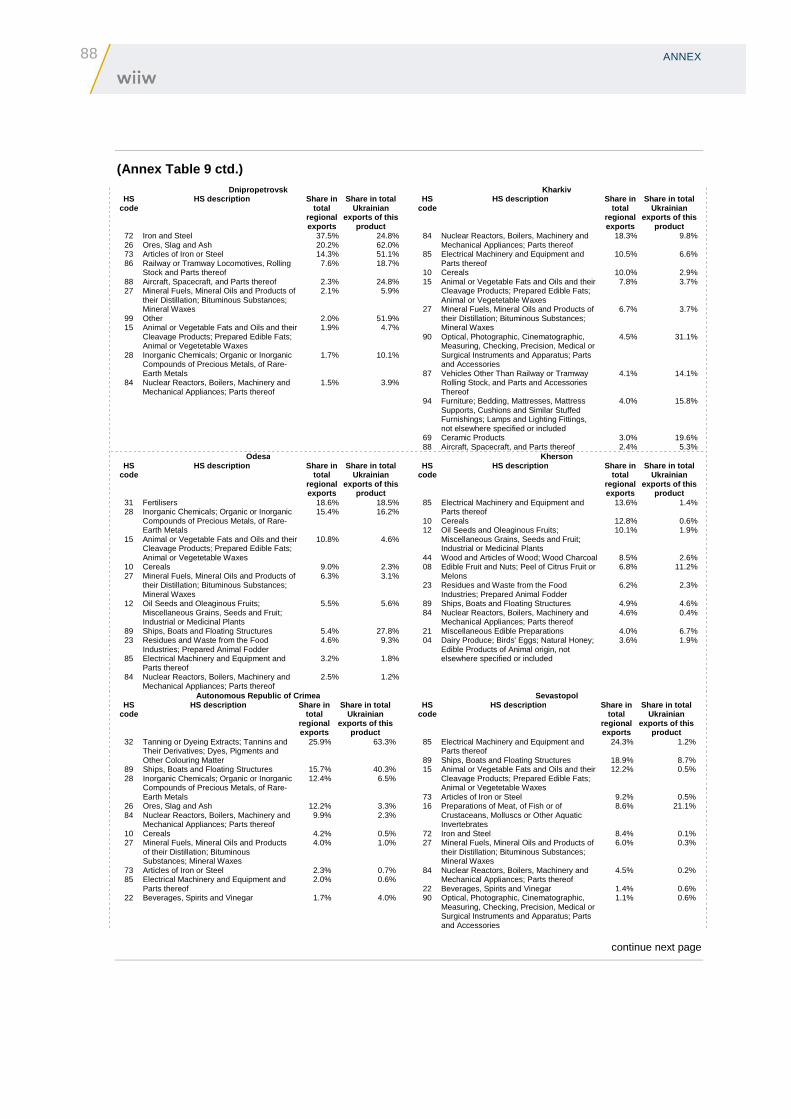
88 ANNEX
(Annex Table 9 ctd.) Dnipropetrovsk
HS code
HS description Share in total
regional exports
Share in total Ukrainian
exports of this product
72 Iron and Steel 37.5% 24.8% 26 Ores, Slag and Ash 20.2% 62.0% 73 Articles of Iron or Steel 14.3% 51.1% 86 Railway or Tramway Locomotives, Rolling
Stock and Parts thereof 7.6% 18.7%
88 Aircraft, Spacecraft, and Parts thereof 2.3% 24.8% 27 Mineral Fuels, Mineral Oils and Products of
their Distillation; Bituminous Substances; Mineral Waxes
2.1% 5.9%
99 Other 2.0% 51.9% 15 Animal or Vegetable Fats and Oils and their
Cleavage Products; Prepared Edible Fats; Animal or Vegetetable Waxes
1.9% 4.7%
28 Inorganic Chemicals; Organic or Inorganic Compounds of Precious Metals, of Rare-Earth Metals
1.7% 10.1%
84 Nuclear Reactors, Boilers, Machinery and Mechanical Appliances; Parts thereof
1.5% 3.9%
Kharkiv HS
code HS description Share in
total regional exports
Share in total Ukrainian
exports of this product
84 Nuclear Reactors, Boilers, Machinery and Mechanical Appliances; Parts thereof
18.3% 9.8%
85 Electrical Machinery and Equipment and Parts thereof
10.5% 6.6%
10 Cereals 10.0% 2.9% 15 Animal or Vegetable Fats and Oils and their
Cleavage Products; Prepared Edible Fats; Animal or Vegetetable Waxes
7.8% 3.7%
27 Mineral Fuels, Mineral Oils and Products of their Distillation; Bituminous Substances; Mineral Waxes
6.7% 3.7%
90 Optical, Photographic, Cinematographic, Measuring, Checking, Precision, Medical or Surgical Instruments and Apparatus; Parts and Accessories
4.5% 31.1%
87 Vehicles Other Than Railway or Tramway Rolling Stock, and Parts and Accessories Thereof
4.1% 14.1%
94 Furniture; Bedding, Mattresses, Mattress Supports, Cushions and Similar Stuffed Furnishings; Lamps and Lighting Fittings, not elsewhere specified or included
4.0% 15.8%
69 Ceramic Products 3.0% 19.6% 88 Aircraft, Spacecraft, and Parts thereof 2.4% 5.3%
Odesa HS
code HS description Share in
total regional exports
Share in total Ukrainian
exports of this product
31 Fertilisers 18.6% 18.5% 28 Inorganic Chemicals; Organic or Inorganic
Compounds of Precious Metals, of Rare-Earth Metals
15.4% 16.2%
15 Animal or Vegetable Fats and Oils and their Cleavage Products; Prepared Edible Fats; Animal or Vegetetable Waxes
10.8% 4.6%
10 Cereals 9.0% 2.3% 27 Mineral Fuels, Mineral Oils and Products of
their Distillation; Bituminous Substances; Mineral Waxes
6.3% 3.1%
12 Oil Seeds and Oleaginous Fruits; Miscellaneous Grains, Seeds and Fruit; Industrial or Medicinal Plants
5.5% 5.6%
89 Ships, Boats and Floating Structures 5.4% 27.8% 23 Residues and Waste from the Food
Industries; Prepared Animal Fodder 4.6% 9.3%
85 Electrical Machinery and Equipment and Parts thereof
3.2% 1.8%
84 Nuclear Reactors, Boilers, Machinery and Mechanical Appliances; Parts thereof
2.5% 1.2%
Kherson HS
code HS description Share in
total regional exports
Share in total Ukrainian
exports of this product
85 Electrical Machinery and Equipment and Parts thereof
13.6% 1.4%
10 Cereals 12.8% 0.6% 12 Oil Seeds and Oleaginous Fruits;
Miscellaneous Grains, Seeds and Fruit; Industrial or Medicinal Plants
10.1% 1.9%
44 Wood and Articles of Wood; Wood Charcoal 8.5% 2.6% 08 Edible Fruit and Nuts; Peel of Citrus Fruit or
Melons 6.8% 11.2%
23 Residues and Waste from the Food Industries; Prepared Animal Fodder
6.2% 2.3%
89 Ships, Boats and Floating Structures 4.9% 4.6% 84 Nuclear Reactors, Boilers, Machinery and
Mechanical Appliances; Parts thereof 4.6% 0.4%
21 Miscellaneous Edible Preparations 4.0% 6.7% 04 Dairy Produce; Birds' Eggs; Natural Honey;
Edible Products of Animal origin, not elsewhere specified or included
3.6% 1.9%
Autonomous Republic of Cri mea HS
code HS description Share in
total regional exports
Share in total Ukrainian
exports of this product
32 Tanning or Dyeing Extracts; Tannins and Their Derivatives; Dyes, Pigments and Other Colouring Matter
25.9% 63.3%
89 Ships, Boats and Floating Structures 15.7% 40.3% 28 Inorganic Chemicals; Organic or Inorganic
Compounds of Precious Metals, of Rare-Earth Metals
12.4% 6.5%
26 Ores, Slag and Ash 12.2% 3.3% 84 Nuclear Reactors, Boilers, Machinery and
Mechanical Appliances; Parts thereof 9.9% 2.3%
10 Cereals 4.2% 0.5% 27 Mineral Fuels, Mineral Oils and Products
of their Distillation; Bituminous Substances; Mineral Waxes
4.0% 1.0%
73 Articles of Iron or Steel 2.3% 0.7% 85 Electrical Machinery and Equipment and
Parts thereof 2.0% 0.6%
22 Beverages, Spirits and Vinegar 1.7% 4.0%
Sevastopol HS
code HS description Share in
total regional exports
Share in total Ukrainian
exports of this product
85 Electrical Machinery and Equipment and Parts thereof
24.3% 1.2%
89 Ships, Boats and Floating Structures 18.9% 8.7% 15 Animal or Vegetable Fats and Oils and their
Cleavage Products; Prepared Edible Fats; Animal or Vegetetable Waxes
12.2% 0.5%
73 Articles of Iron or Steel 9.2% 0.5% 16 Preparations of Meat, of Fish or of
Crustaceans, Molluscs or Other Aquatic Invertebrates
8.6% 21.1%
72 Iron and Steel 8.4% 0.1% 27 Mineral Fuels, Mineral Oils and Products of
their Distillation; Bituminous Substances; Mineral Waxes
6.0% 0.3%
84 Nuclear Reactors, Boilers, Machinery and Mechanical Appliances; Parts thereof
4.5% 0.2%
22 Beverages, Spirits and Vinegar 1.4% 0.6% 90 Optical, Photographic, Cinematographic,
Measuring, Checking, Precision, Medical or Surgical Instruments and Apparatus; Parts and Accessories
1.1% 0.6%
continue next page

ANNEX
89
(Annex Table 9 ctd.) Zaporizhzhya
HS code
HS description Share in total
regional exports
Share in total Ukrainian
exports of this product
72 Iron and Steel 42.6% 11.1% 84 Nuclear Reactors, Boilers, Machinery
and Mechanical Appliances; Parts thereof
17.2% 18.1%
85 Electrical Machinery and Equipment and Parts thereof
13.2% 16.4%
26 Ores, Slag and Ash 4.3% 5.2% 87 Vehicles Other Than Railway or
Tramway Rolling Stock, and Parts and Accessories Thereof
4.3% 29.2%
15 Animal or Vegetable Fats and Oils and their Cleavage Products; Prepared Edible Fats; Animal or Vegetetable Waxes
4.1% 3.9%
81 Other Base Metals; Cermets; Articles thereof
1.9% 48.1%
28 Inorganic Chemicals; Organic or Inorganic Compounds of Precious Metals, of Rare-Earth Metals
1.6% 3.7%
10 Cereals 1.4% 0.8% 22 Beverages, Spirits and Vinegar 1.4% 14.3%
Donetsk HS
code HS description Share
in total regional exports
Share in total Ukrainian
exports of this product
72 Iron and Steel 54.7% 50.3% 27 Mineral Fuels, Mineral Oils and
Products of their Distillation; Bituminous Substances; Mineral Waxes
10.3% 40.0%
86 Railway or Tramway Locomotives, Rolling Stock and Parts thereof
8.1% 28.0%
73 Articles of Iron or Steel 6.5% 32.5% 84 Nuclear Reactors, Boilers, Machinery
and Mechanical Appliances; Parts thereof
3.3% 12.4%
31 Fertilisers 3.0% 23.8% 25 Salt; Sulphur; Earths and Stone;
Plastering Materials, Lime and Cement 2.0% 39.7%
28 Inorganic Chemicals; Organic or Inorganic Compounds of Precious Metals, of Rare-Earth Metals
1.9% 15.5%
18 Cocoa and Cocoa Preparations 1.8% 38.2% 74 Copper and Articles thereof 1.1% 80.2%
Luhansk HS
code HS descripti on Share
in total regional exports
Share in total Ukrainian
exports of this product
72 Iron and Steel 34.7% 9.5% 27 Mineral Fuels, Mineral Oils and
Products of their Distillation; Bituminous Substances; Mineral Waxes
21.6% 24.8%
86 Railway or Tramway Locomotives, Rolling Stock and Parts thereof
16.4% 16.8%
31 Fertilisers 6.8% 16.0% 28 Inorganic Chemicals; Organic or
Inorganic Compounds of Precious Metals, of Rare-Earth Metals
3.0% 7.4%
29 Organic Chemicals 2.8% 29.0% 84 Nuclear Reactors, Boilers, Machinery
and Mechanical Appliances; Parts thereof
2.3% 2.6%
39 Plastics and Articles thereof 2.0% 11.0% 48 Paper and Paperboard; Articles of
Paper Pulp, of Paper or of Paperboard 2.0% 8.3%
73 Articles of Iron or Steel 1.6% 2.4%
Source: State Statistics Service of Ukraine.


wiiw.ac.at


