Veggie Compass: A Whole Farm Profit Management Tool
16
Veggie Compass: A Whole Farm Profit Management Tool Growing Farm Profits Southern Sustainable Agriculture Working Group 2014 Ellen Polishuk
Transcript of Veggie Compass: A Whole Farm Profit Management Tool

Veggie Compass: A
Whole Farm Profit
Management Tool
Growing Farm Profits
Southern Sustainable Agriculture Working Group
2014
Ellen Polishuk
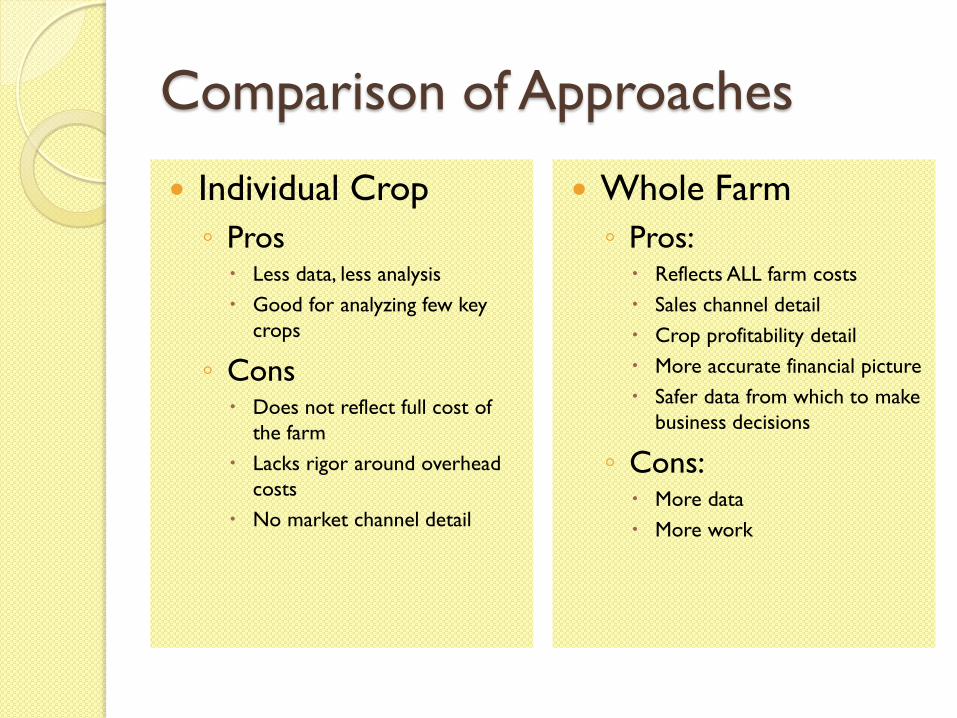
Comparison of Approaches
Individual Crop
◦ Pros Less data, less analysis
Good for analyzing few key
crops
◦ Cons Does not reflect full cost of
the farm
Lacks rigor around overhead
costs
No market channel detail
Whole Farm
◦ Pros: Reflects ALL farm costs
Sales channel detail
Crop profitability detail
More accurate financial picture
Safer data from which to make
business decisions
◦ Cons: More data
More work

Whole-farm Cost Analysis for Managing a Market Vegetable
Farm
There are many “whole-farm” systems…
•Schedule F
Which you choose and how much work you are
willing to put into them depends on how you want
to use the information. What is your goal?

Whole-farm Cost Analysis for
Managing a Market Vegetable Farm
There are many “whole-farm” systems:
•Packaged accounting systems
Tax & reporting focus
Cash management focus

Whole-farm Cost Analysis for
Managing a Market Vegetable Farm
•Packaged accounting systems?
•Schedule F?
•Something else?
What is your goal?

Veggie Compass:
•Whole farm tool
•Compares external enterprises
•Includes cost of production plus
cost of distribution and overhead
•Has rigor of assigning all costs
including direct and indirect
•Looks at individual crops in the
overall enterprise
•Looks at actual, past results but
can be used as forecasting tool
One New Approach…….

A key to comprehensive, whole
farm cost approach is the
assignment of every expense
somewhere!
• The “somewhere” depends on what
you need to manage the business
• One approach is to look at
“activities” in logical groups that can be
managed
• This becomes even more meaningful
if you can do it by Crop!
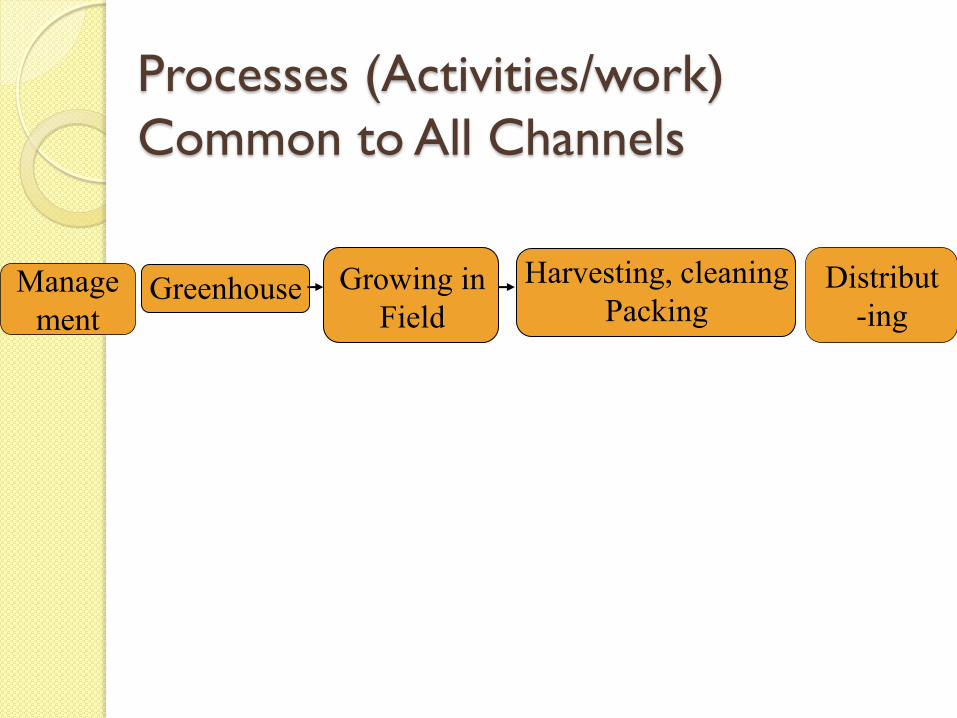
Processes (Activities/work)
Common to All Channels
Greenhouse Growing in
Field
Harvesting, cleaning
Packing Manage
ment
Distribut
-ing

Costs to Produce (Grow)
Greenhouse Growing in
Field
Harvesting, cleaning
Packing
“Cost to Grow” “Cost to harvest,
clean and pack”
“Total Production Cost”

Distribution Costs vary by Channel
Production
Farmers
Market CSA
Roadside
Stand Wholesale
Delivered staff
Staff
delivery
staff Drive
time
packaging

Are you Ready?

Veggie Compass Organization
◦ YOU input data on 3 separate pages
◦ Page 1 = All expenses
◦ Page 2 = All Sales
◦ Page 3 = Labor hours by crop, and production
costs
◦ IT generates a farm financial picture on the
next 3 pages
Cost of production by crop
Sales Output Page = Per Crop Profit and
breakeven prices
Profit and Loss Whole Farm and by Market
Channel

Inputs Outputs
Farm Expenses
Farm Sales
Growing area of each crop
Crop specific expenses
# of plants in GH
Hours by crop - growing, harvest
Non Crop Specific hours
The cost of a crop up to harvest
Total cost of crop through harvest
and pack
Cost $/lb by crop
Break even prices
Total labor costs by crop
Gross margin by market channel

Data collection methods are similar to Individual
Crop Cost system but cover all crops. The Whole-
farm system is a lot of work!
Ways to mitigate the work load:
Do whole farm system only periodically.
Group crops with similar labor inputs.
Focus data detail on a few target crops only.
Workload is high but information is rich………
Is the juice worth the squeeze?

Now let’s look at the tool itself.
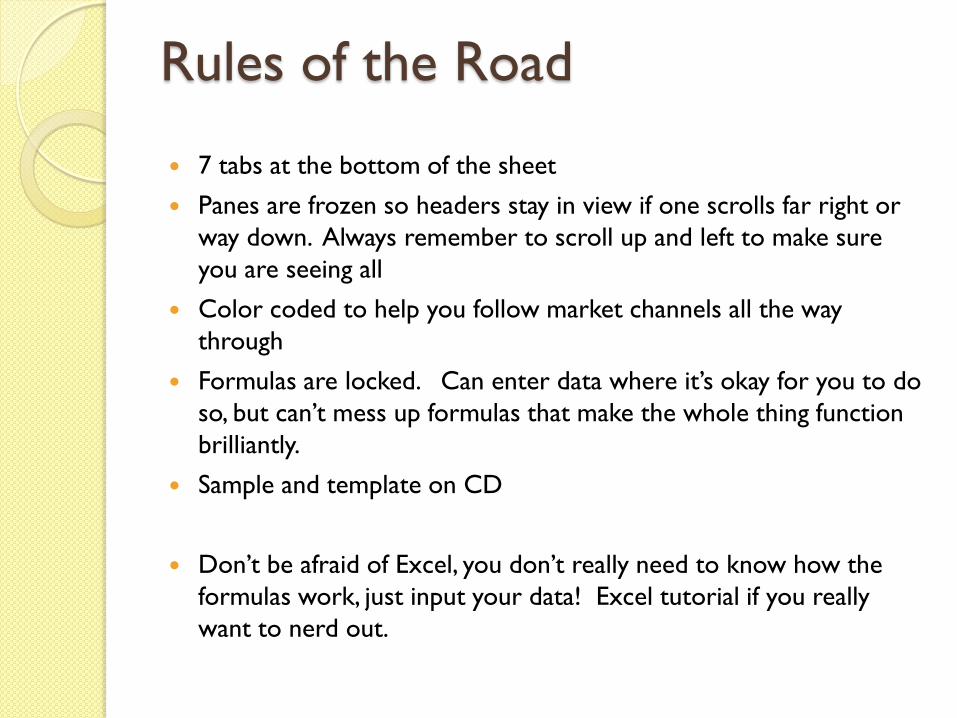
Rules of the Road
7 tabs at the bottom of the sheet
Panes are frozen so headers stay in view if one scrolls far right or
way down. Always remember to scroll up and left to make sure
you are seeing all
Color coded to help you follow market channels all the way
through
Formulas are locked. Can enter data where it’s okay for you to do
so, but can’t mess up formulas that make the whole thing function
brilliantly.
Sample and template on CD
Don’t be afraid of Excel, you don’t really need to know how the
formulas work, just input your data! Excel tutorial if you really
want to nerd out.