USING REAL -TIME TELEMETRY SYSTEM FOR ASSESSING … · USING REAL -TIME TELEMETRY SYSTEM FOR...
43
USING REAL -TIME TELEMETRY SYSTEM FOR ASSESSING WATER QUALITY AND IMPROVING ROUTINE MONITORING BY Habash A. El-Sadek A. and Shaban M. Ministry of Water Resources and Irrigation National Water Research Center Drainage Research Institute
Transcript of USING REAL -TIME TELEMETRY SYSTEM FOR ASSESSING … · USING REAL -TIME TELEMETRY SYSTEM FOR...
USING REAL -TIME TELEMETRY SYSTEM FOR ASSESSING
WATER QUALITY AND IMPROVING ROUTINE
MONITORING
BY
Habash A. El-Sadek A. and Shaban M.
Ministry of Water Resources and Irrigation
National Water Research Center
Drainage Research Institute
CONTENTS
Introduction and Problems Definition.
Research Objectives.
Methodology.
Results and Discussions.
Conclusions and Recommendations.

Introduction and Problems Definition.
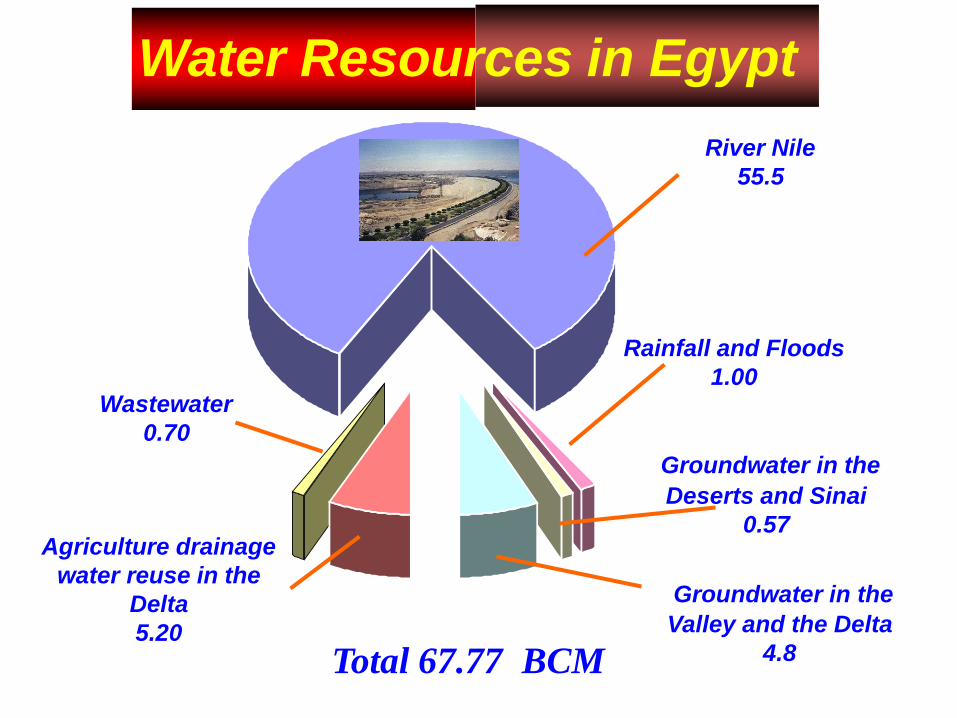
Rainfall and Floods
1.00
Groundwater in the
Valley and the Delta
4.8
Groundwater in the
Deserts and Sinai
0.57 Agriculture drainage
water reuse in the
Delta
5.20
Wastewater
0.70
Total 67.77 BCM
River Nile
55.5
Water Resources in Egypt

Rural Areas
Urban Areas
Industrial
Areas
Point Sources
Non-Point Sources 20% of urban
areas are not
caught in
sewers
92% of rural areas
are not caught in
sewers
Livestock
Production
Suburbans
„Random“
Many industries
discharge inadequately
treated / untreated
wastewater into the system
CHALLENGES
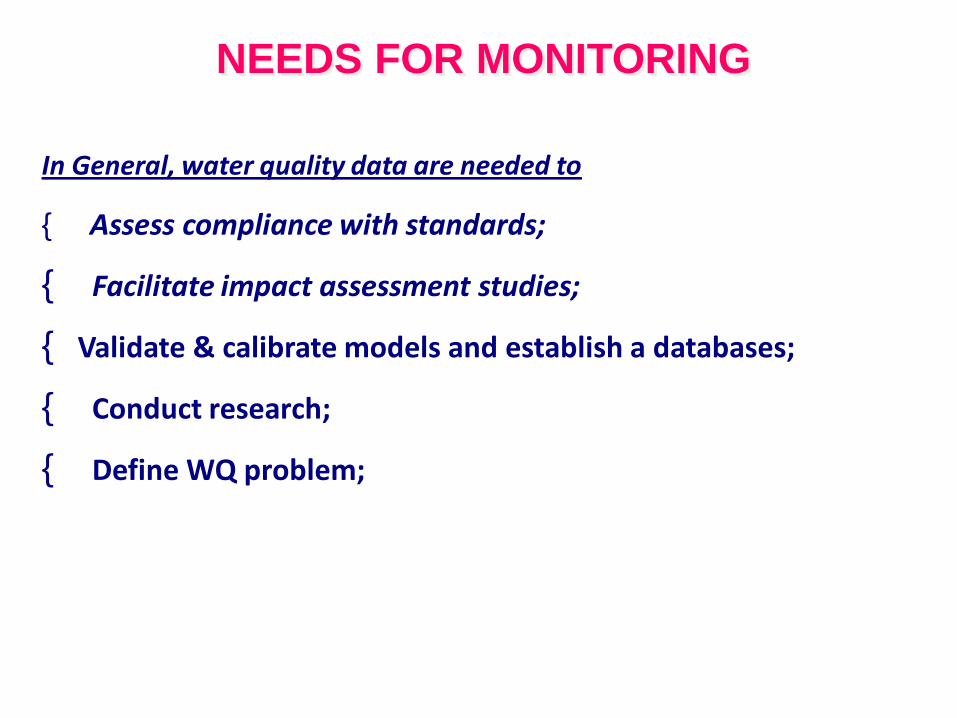
In General, water quality data are needed to
{ Assess compliance with standards;
{ Facilitate impact assessment studies;
{ Validate & calibrate models and establish a databases;
{ Conduct research;
{ Define WQ problem;
NEEDS FOR MONITORING

I E 1 4
I E 2 0
I E 1 9
I E 1 3
I W 1 0
I M 0 3I W 0 6
B e n i M a z a r
IU06
IU07
IU09 IU08
IU04
IU03IU05
IU02
IU01
DU25
DU38
DU43DU42DU41DU40
DU39
DU32
DU31
DU30
DU29
DU27
DU28
DU23DU21
DU26
DU19
DU22DU24
DU20
DU18
DU17
DU16
DU14DU15 DU13
DU10DU09DU07
DU11DU12
DU37
DU36
DU34
DU35
DU33
DU08
DU06DU05
DU02
DU04DU03
DU01
NL15
NL28
NL27
NL26
NL35
NL37
NL21
NL20
NL38
NL19
NL18
NL17
NL16
NL12
NL13
NL14
NL11NL10
NL09
NL08
NL07
NL30
NL29
NL25
NL31
NL32
NL33NL34
NL36
NL24
NL23
NL22
NL40
NL39NL44
NL43
NL45NL41
NL42NL46
NL06
NL05
NL04
NL03
NL02NL01
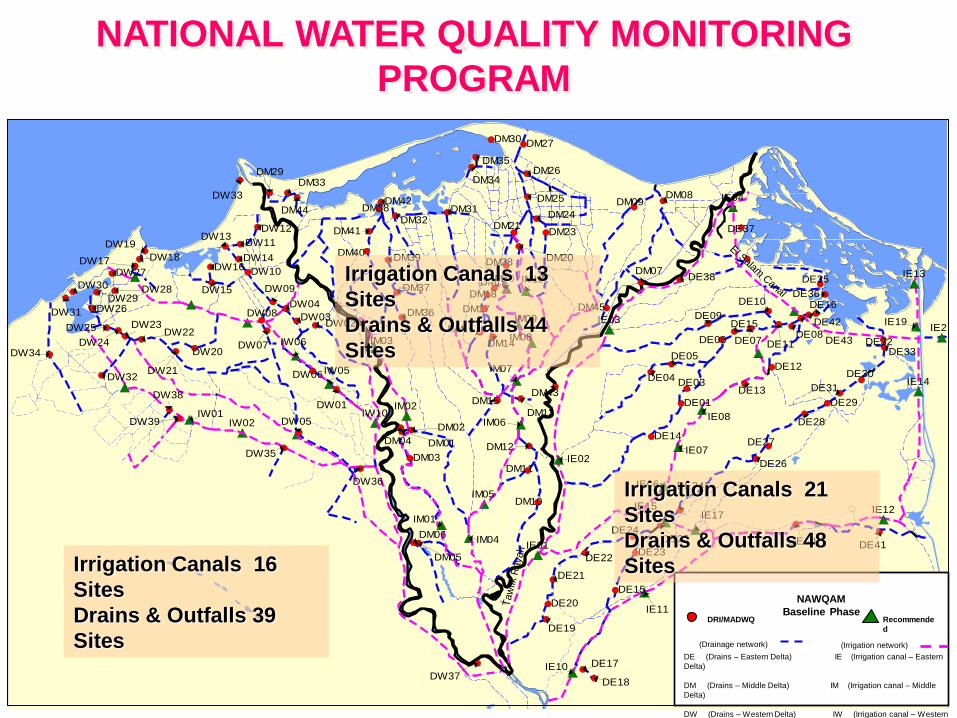
NAWQAM
Baseline Phase NRI
Network
NL (River Nile)
DU (Drains – Upper
Egypt ) $ IU (Irrigation Canal – Upper
Egypt )
IF03
IF08
IF09
IF04
DF04
DF05
DF08
DF01
DF02
DF06
DF07
DF03
Monitoring Sites in Upper
Egypt and Nile Branches
Monitoring Sites in
Fayoum
Outfalls to
Northern Lakes
15 sites
Lake Naser
4 sites
Irrigation Canals 4
sites
Drains 8
sites
Nile River
Nile Water 48
sites
Irrigation Canals 9
sites
Drains 43
sites
Nile Delta
Irrigation
Canals 50 sites
Drains 116 sites
IE15IE17
IE06
IM04
IE11
IE10
IM06
IE02IE07
IE08
IM01
IM08
IM09
IM07
IE19
IM03
IM10 IM13
IW05
IW06
IW01
DM11
DE34
DE25DE24
DE22
DE21
DE40
DM10
DE19
DE17
DE41
DE18
DM43
DM13
DM15
DM12
DE31
DE28
DE03DE04
DE13
DE27
DE26
DW37
DM01
DM02
DM06
DM05
DM14
DM18
DM17 DM45
DM16
DE30
DE06
DE05
DE07
DE10
DE15DE09
DE08DE43DE11
DE36
DE42
DE16
DE33DE32
DW06
DW03DW02
DW01
DW04
DM19
DM28 DM20DM40
DM39
DM37
DM36
DM04
DW36
DM07DE35DE38
DW07
DW14
DW09
DW08
DW35
DW16
DW05
DW21
DW22
DW39
DW38
DW18
DW20
DW15DW28
DM41DM32
DM21DM24
DM38DM42
DM31DM09
DE37
DM25
DW11
DW12
DW33
DM44
DM33DM29
DM08
DW29
DW32
DW23
DW26
DW19
DW17DW27
DW13
DM34DM26
DM35
DW24
DW25
DW30
DW31
DW34
IE12
IE04
IE03
IE01
IE14
IE13
IW10IW02
IM05
IM02
IE20
Taw
fik R
aya
h
El Salam C
anal
DE20
DE23
DE29DE01
DE12
DE14
DE15
DM30
DM23
DM27
DM03
DW10
DE (Drains – Eastern Delta) IE (Irrigation canal – Eastern
Delta)
DM (Drains – Middle Delta) IM (Irrigation canal – Middle
Delta)
DW (Drains – Western Delta) IW (Irrigation canal – Western
Delta)
NAWQAM
Baseline Phase
(Drainage network)
Recommende
d
(Irrigation network)
DRI/MADWQ
Irrigation Canals 16
Sites
Drains & Outfalls 39
Sites
Irrigation Canals 13
Sites
Drains & Outfalls 44
Sites
Irrigation Canals 21
Sites
Drains & Outfalls 48
Sites
NATIONAL WATER QUALITY MONITORING
PROGRAM
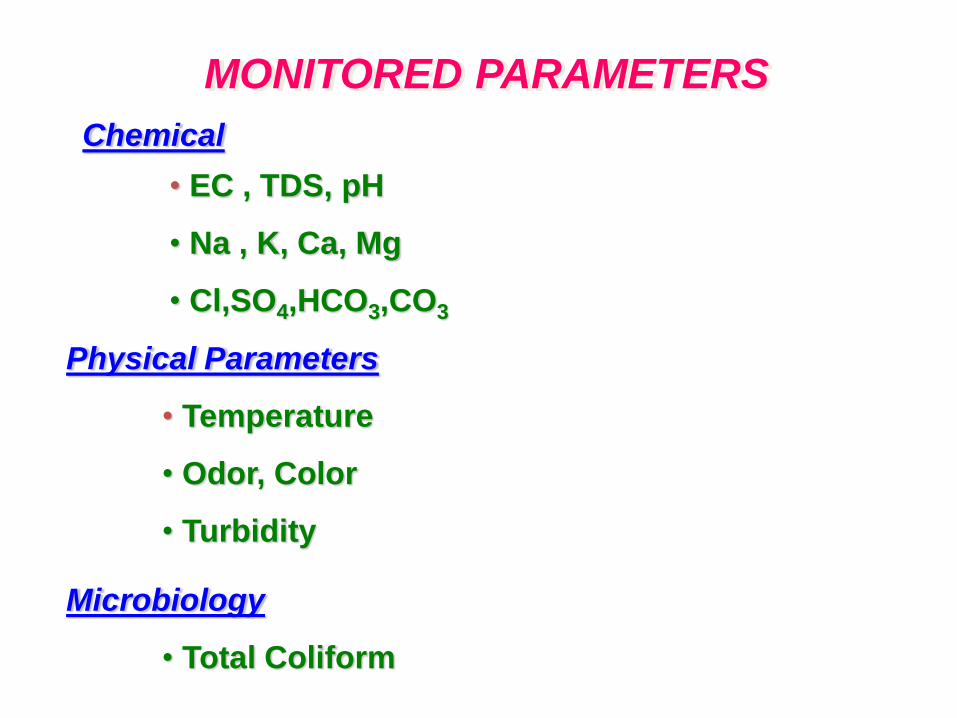
Chemical
• EC , TDS, pH
• Na , K, Ca, Mg
• Cl,SO4,HCO3,CO3
Physical Parameters
• Temperature
• Odor, Color
• Turbidity
MONITORED PARAMETERS
Microbiology
• Total Coliform
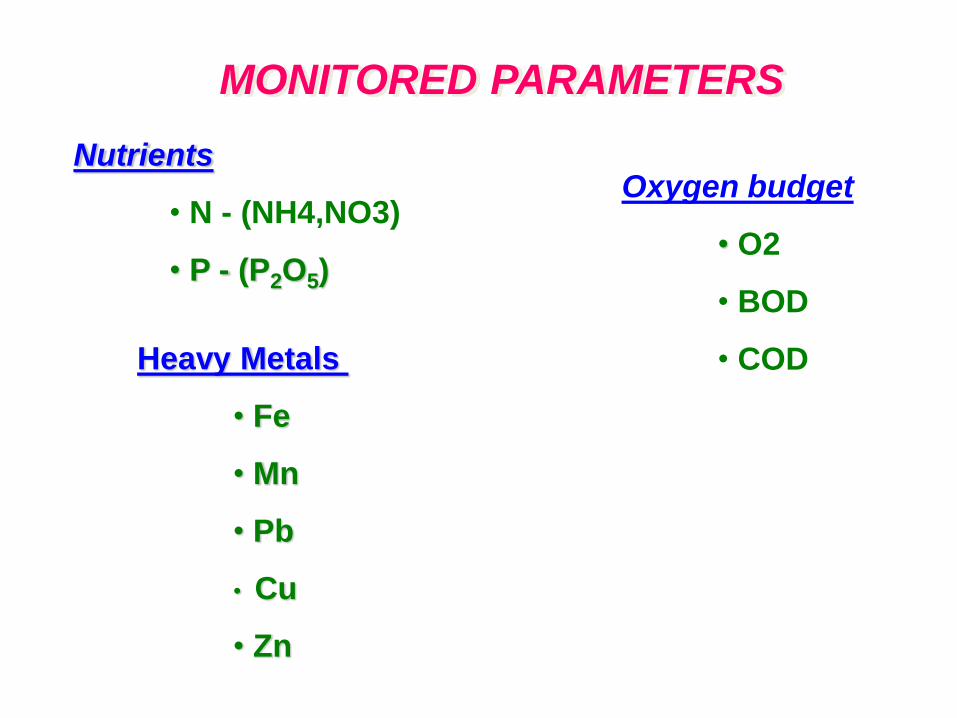
MONITORED PARAMETERS
Nutrients
• N - (NH4,NO3)
• P - (P2O5)
Heavy Metals
• Fe
• Mn
• Pb
• Cu
• Zn
Oxygen budget
• O2
• BOD
• COD
Sampling Frequency
Sampling frequency is a function of the statistical
objective of the monitoring program.
More measurements will increase the precision,
reduce the bias, and increase the power
of the statistical component of the program but will
increase the overall monitoring cost.
The MWRI take 12 samples per year.
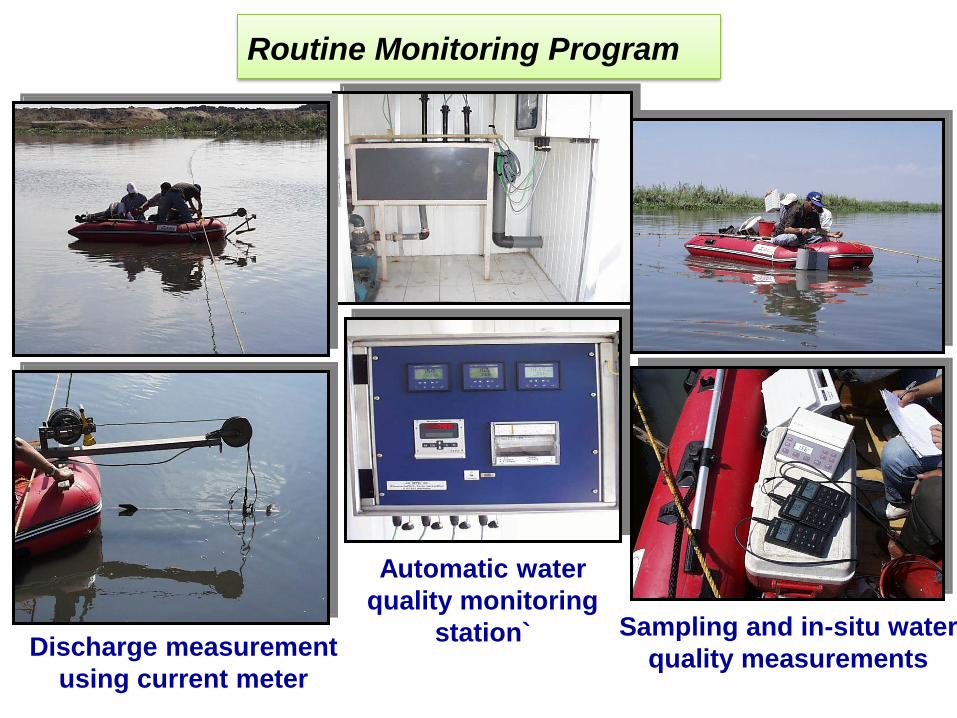
Automatic water
quality monitoring
station` Discharge measurement
using current meter
Sampling and in-situ water
quality measurements
Routine Monitoring Program
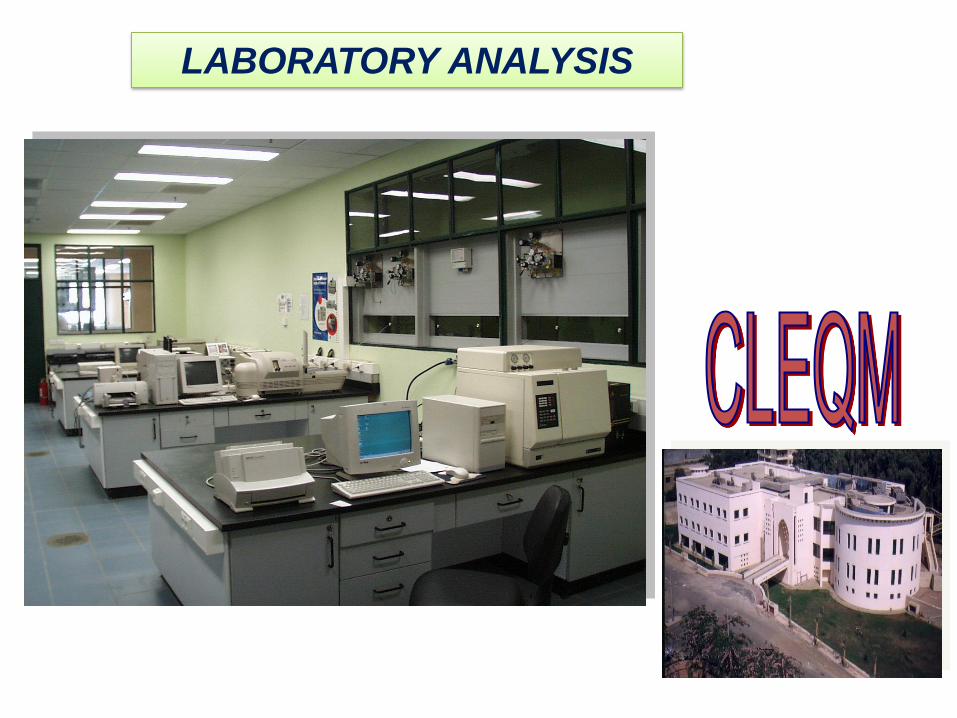
LABORATORY ANALYSIS
Disadvantage of Routine Water Quality Monitoring
In routine WQM, water samples are typically collected and
stored for shipment to a laboratory, where they are analyzed.
The time interval between data records is long too much.
The system can not detect the pollutions in the same time.
The decision maker has not enough knowledge to take the
fast solution to solve any sudden problems in the
water quality .
Research Objectives
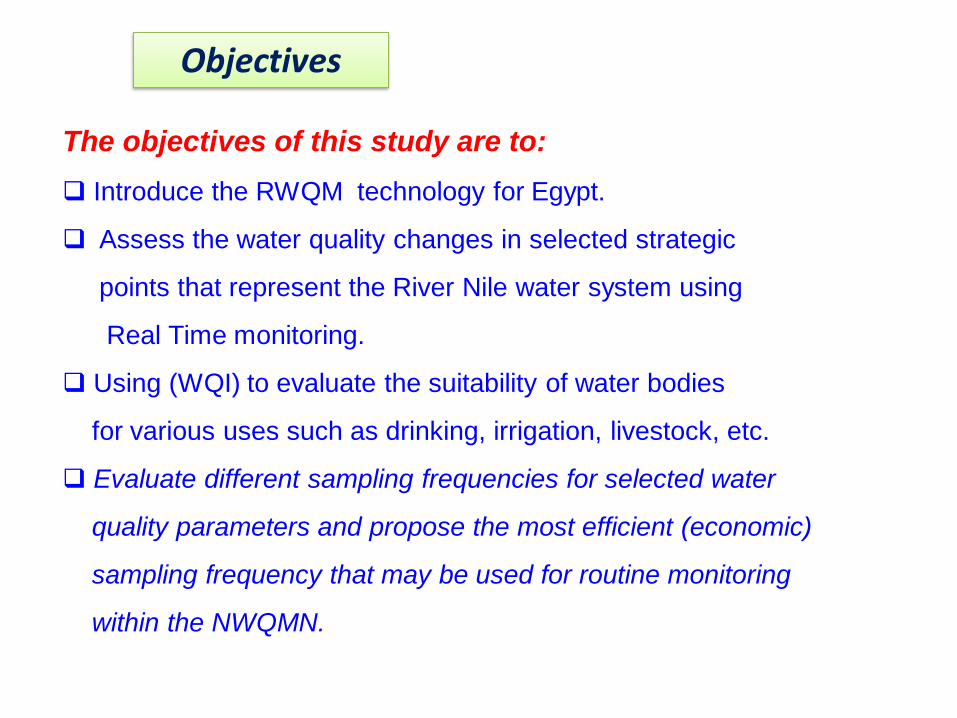
Objectives
The objectives of this study are to:
Introduce the RWQM technology for Egypt.
Assess the water quality changes in selected strategic
points that represent the River Nile water system using
Real Time monitoring.
Using (WQI) to evaluate the suitability of water bodies
for various uses such as drinking, irrigation, livestock, etc.
Evaluate different sampling frequencies for selected water
quality parameters and propose the most efficient (economic)
sampling frequency that may be used for routine monitoring
within the NWQMN.

Advantages of Real Time Data:
1) Increasing data-collection frequency provides an improved
understanding of cause-and-effect relations that result in
observed water-quality characteristics.
2) Notifying water resource managers in real time, eliminating
delay between sample collection and lab analysis may be
critical for warning the public.
4) Decreasing time and costs associated with routine sampling.
5) Measuring water quality changes at night and during storms
when samples are seldom collected and when storm events
can have major effects on concentrations and loads.
Real Time Water Quality Monitoring System
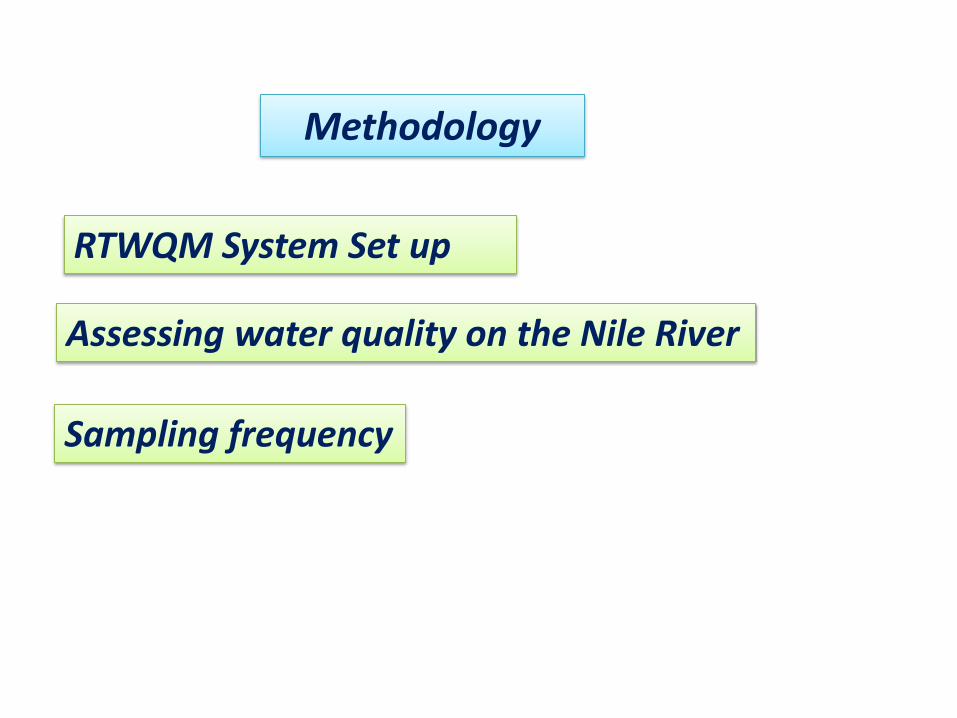
Methodology
RTWQM System Set up
Sampling frequency
Assessing water quality on the Nile River
RTWQM System Set up
NL Nile Locations
DU Drainage Locations
IU Irrigation Locations
Lake
Nasser
First
Reach
Second
Reach
Third
Reach
Fourth
Reach
RTWQ Locations
NL Nile Locations
DU Drainage Locations
IU Irrigation Locations
Lake
Nasser
First
Reach
Second
Reach
Third
Reach
Fourth
Reach
RTWQ Locations
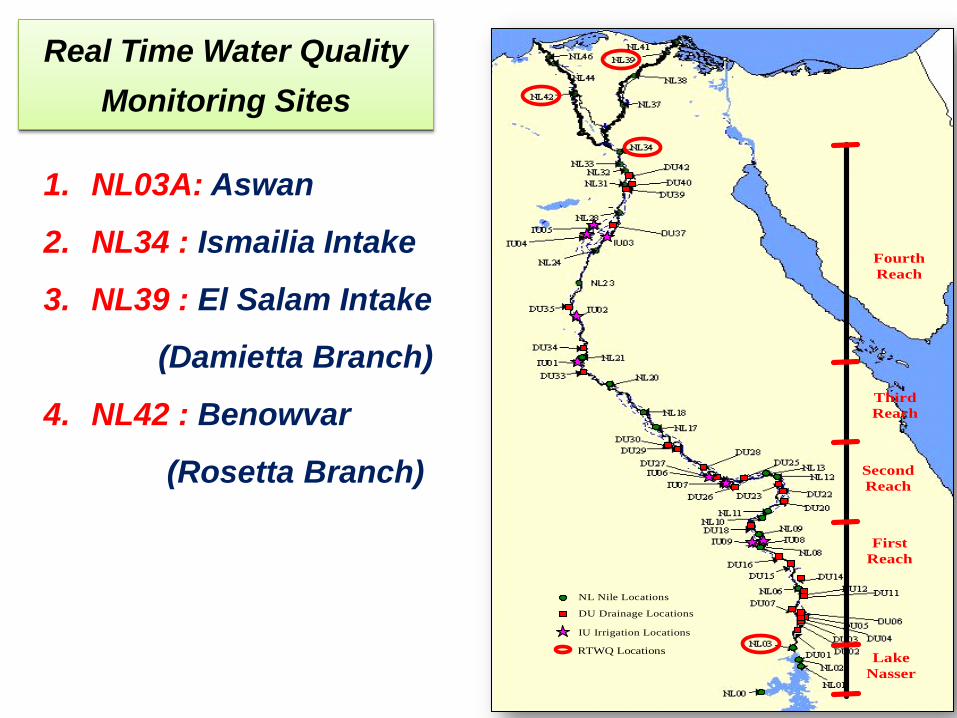
Real Time Water Quality
Monitoring Sites
1. NL03A: Aswan
2. NL34 : Ismailia Intake
3. NL39 : El Salam Intake
(Damietta Branch)
4. NL42 : Benowvar
(Rosetta Branch)
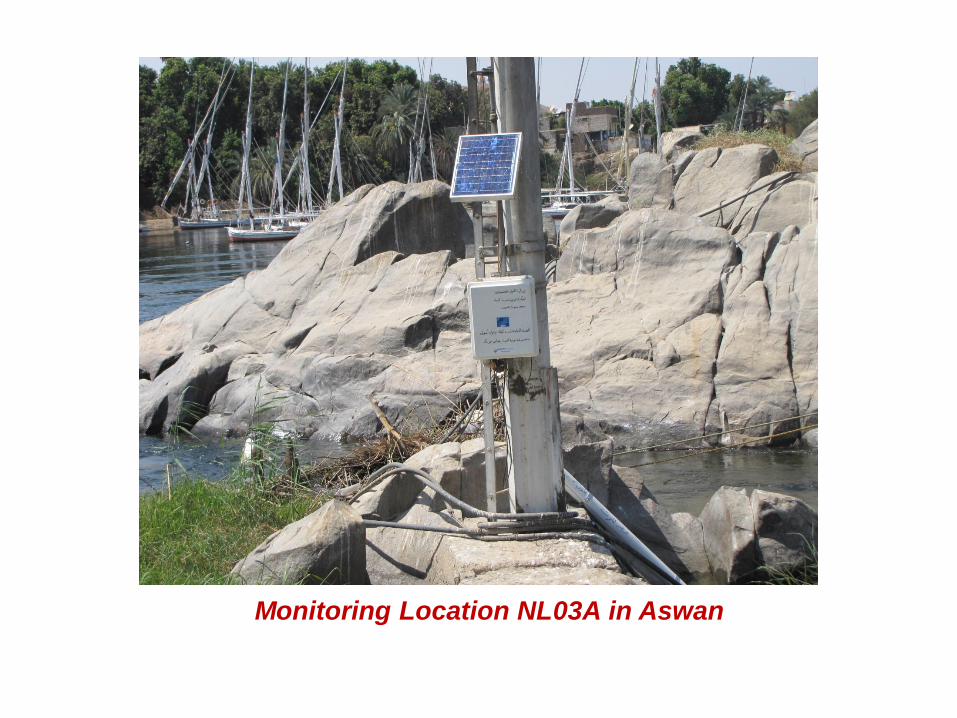
Monitoring Location NL03A in Aswan
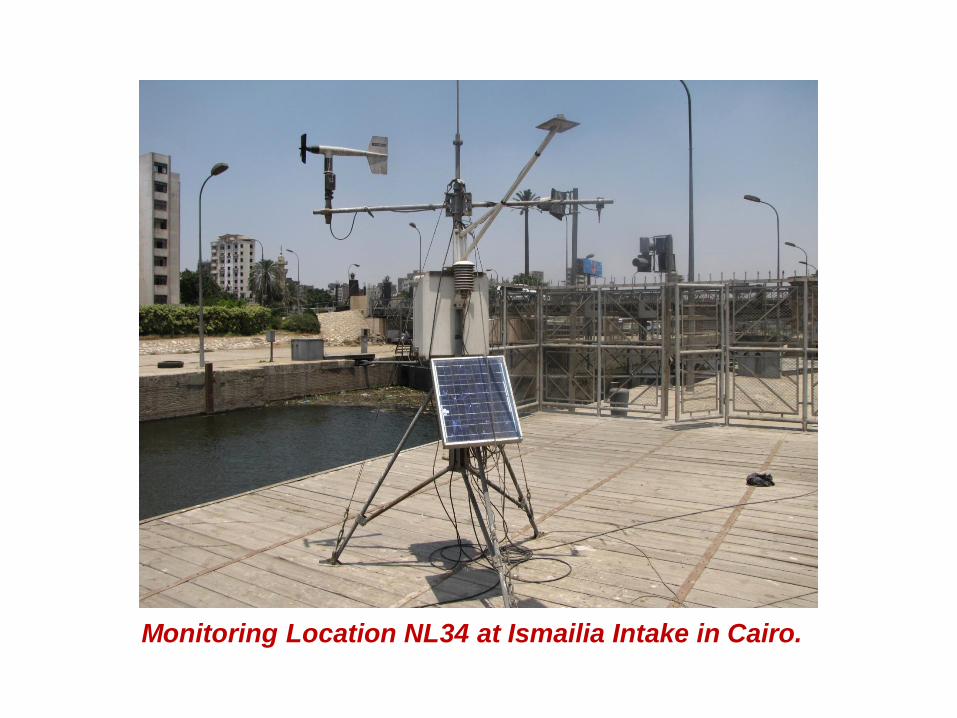
Monitoring Location NL34 at Ismailia Intake in Cairo.
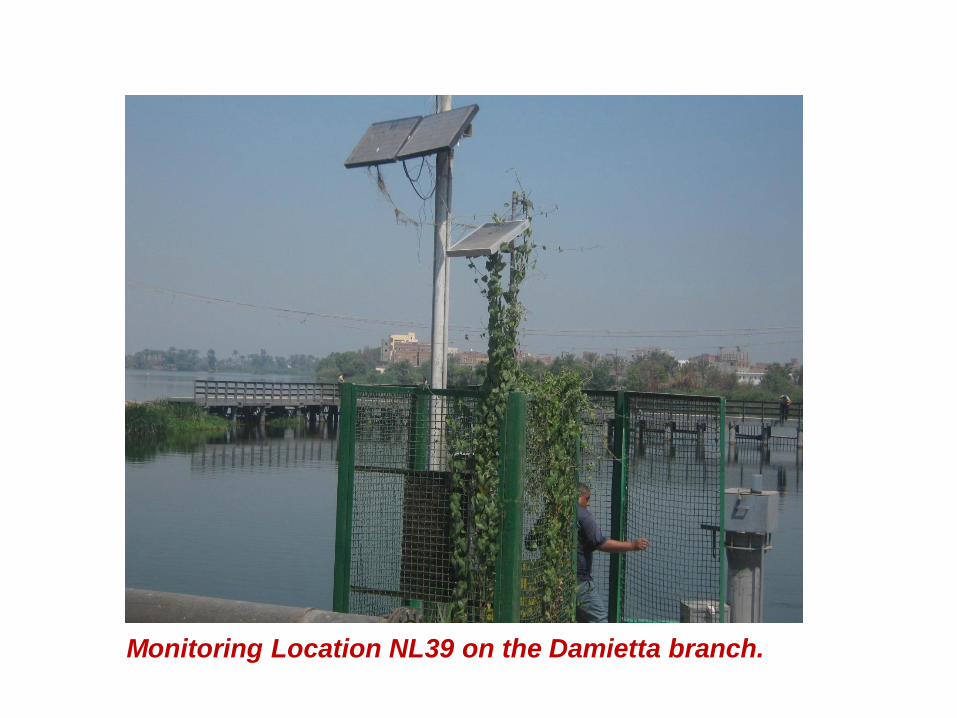
Monitoring Location NL39 on the Damietta branch.
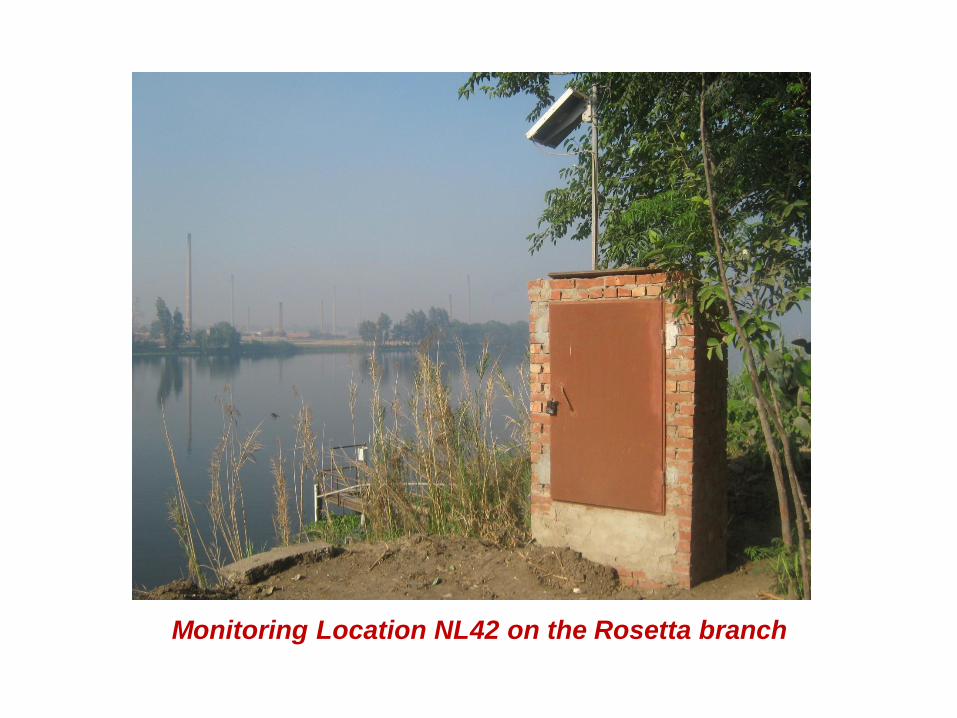
Monitoring Location NL42 on the Rosetta branch

RTWQ System Description:
1.Station Design
The station contains two main parts :
Hydrolab sonde
Data logger to record data
Hydrolab sonde
Data logger

2.Sampling Equipment
The equipments can be categorized
in three parts:
Sensors.
Power Source.
Data retrieval system.
Sensors
Data retrieval system
(Laptop and Modem) Power Source (Betray)
(Power Source)
Solar Cell

3. Sensor Deployment
The water quality instrument is placed in the downstream
end of a 3 to 6 m length and 7 to10 cm diameter of PVC
pipe that has the lower 1.5 m slotted Sensors.
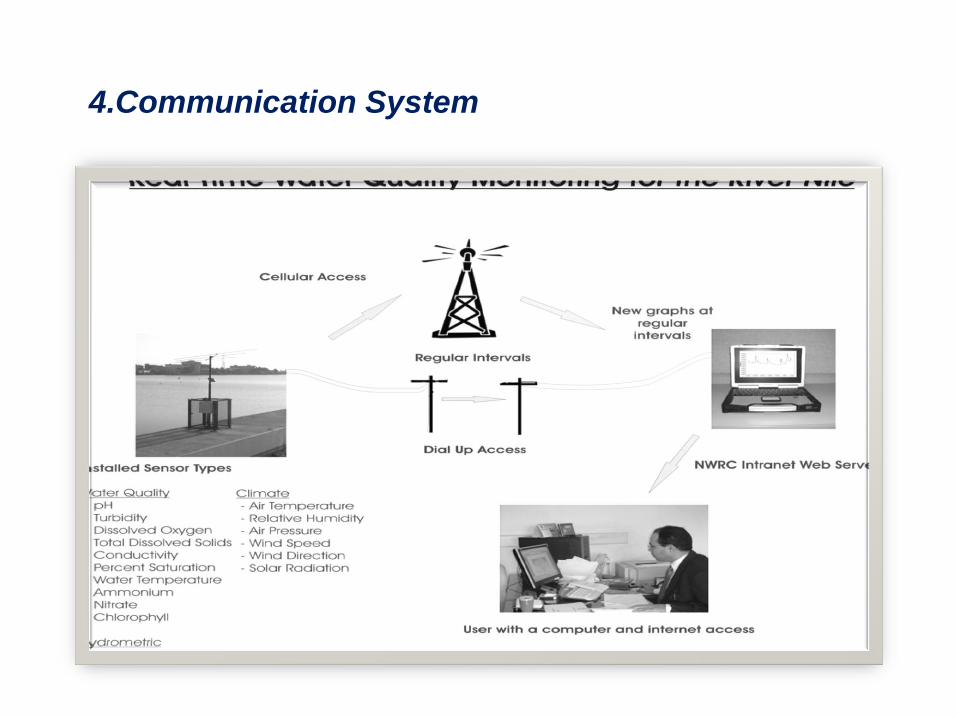
4.Communication System
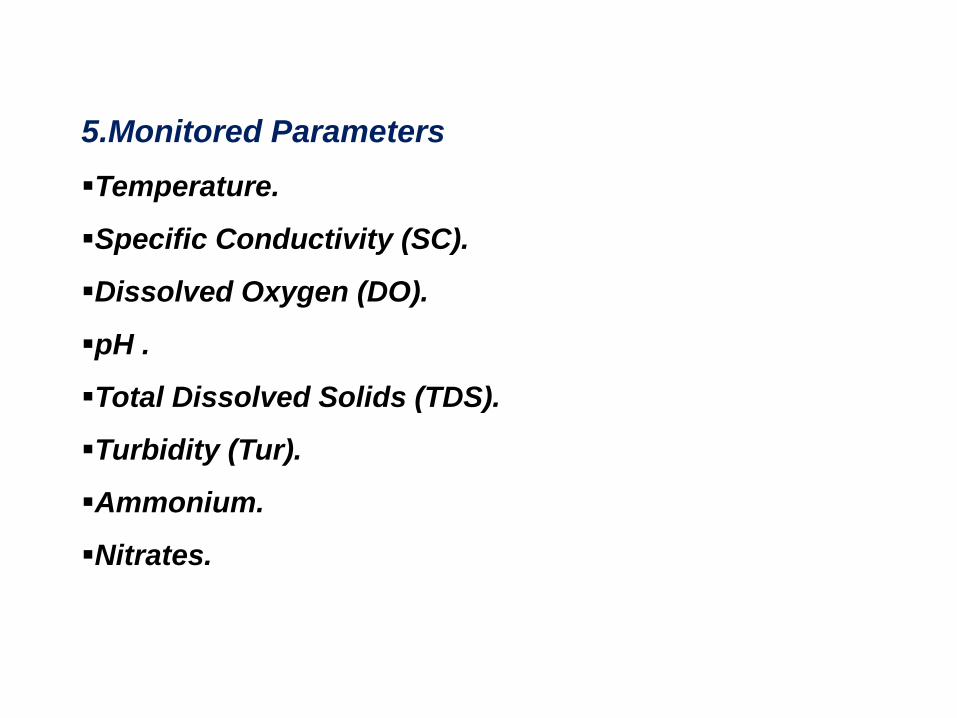
5.Monitored Parameters
Temperature.
Specific Conductivity (SC).
Dissolved Oxygen (DO).
pH .
Total Dissolved Solids (TDS).
Turbidity (Tur).
Ammonium.
Nitrates.
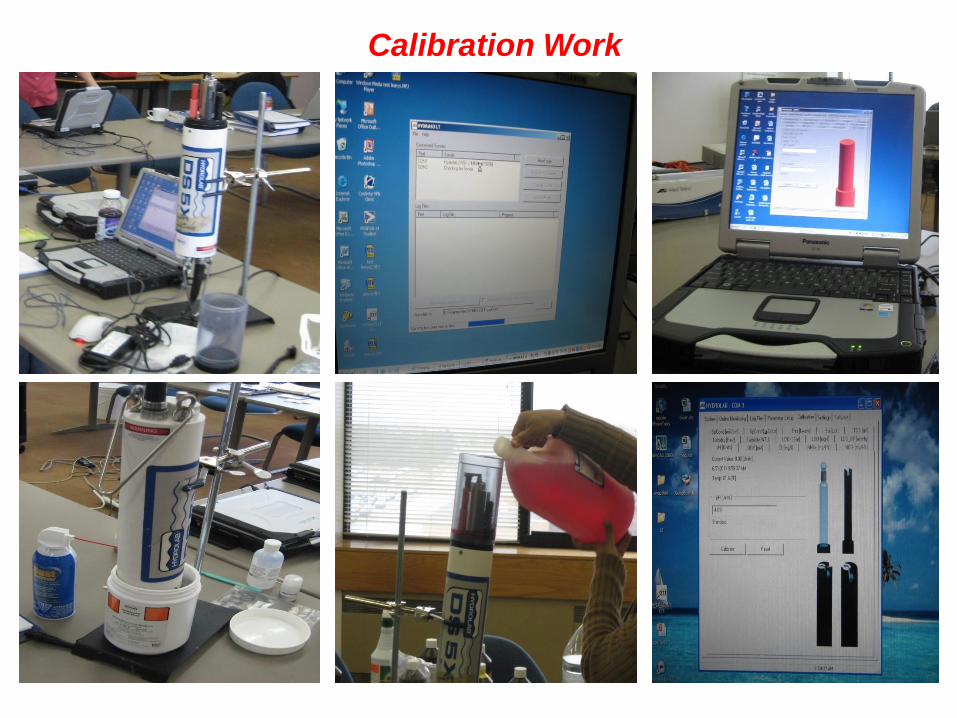
Calibration Work

WATER QUALITY INDEX

Water Quality Index
732.1
23
22
21
100fff
WQl
Scope (F1) - number of variables not meeting
water quality objectives
Frequency (F2) - the number of times the
objectives are not met
Amplitude (F3) - the extent to which
objectives exceeded.

RANKING WATER QUALITY VALUE
Excellent 95 - 100
Good 80 - 94
Fair 65 - 79
Marginal 45 - 64
Poor 0 - 44
WQI Categorization
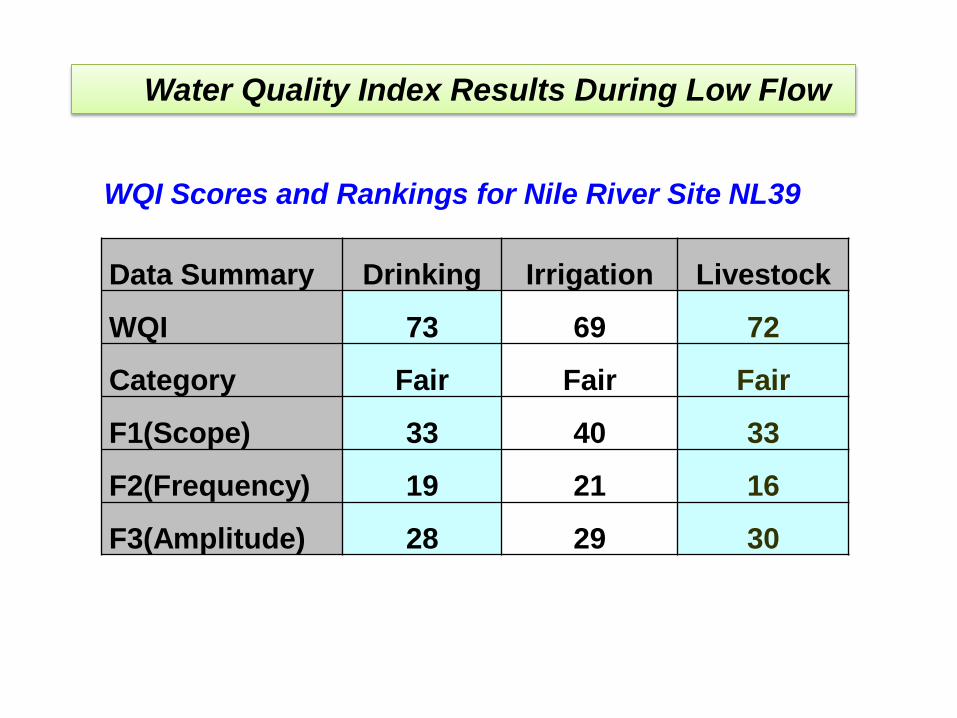
Data Summary Drinking Irrigation Livestock
WQI 73 69 72
Category Fair Fair Fair
F1(Scope) 33 40 33
F2(Frequency) 19 21 16
F3(Amplitude) 28 29 30
WQI Scores and Rankings for Nile River Site NL39
Water Quality Index Results During Low Flow
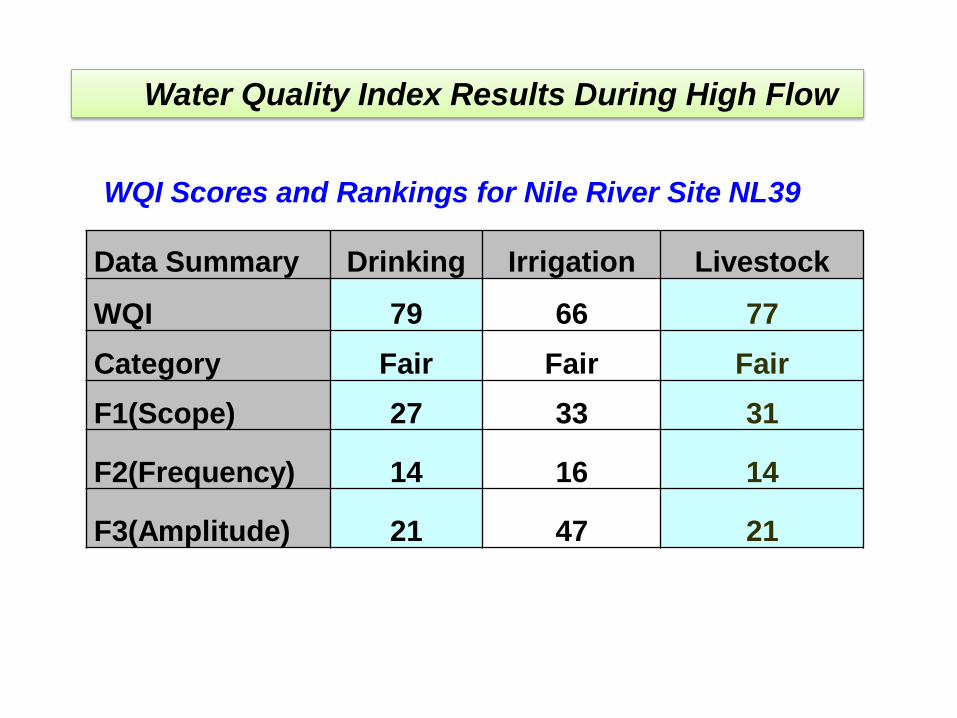
Data Summary Drinking Irrigation Livestock
WQI 79 66 77
Category Fair Fair Fair
F1(Scope) 27 33 31
F2(Frequency) 14 16 14
F3(Amplitude) 21 47 21
WQI Scores and Rankings for Nile River Site NL39
Water Quality Index Results During High Flow
Sampling frequency
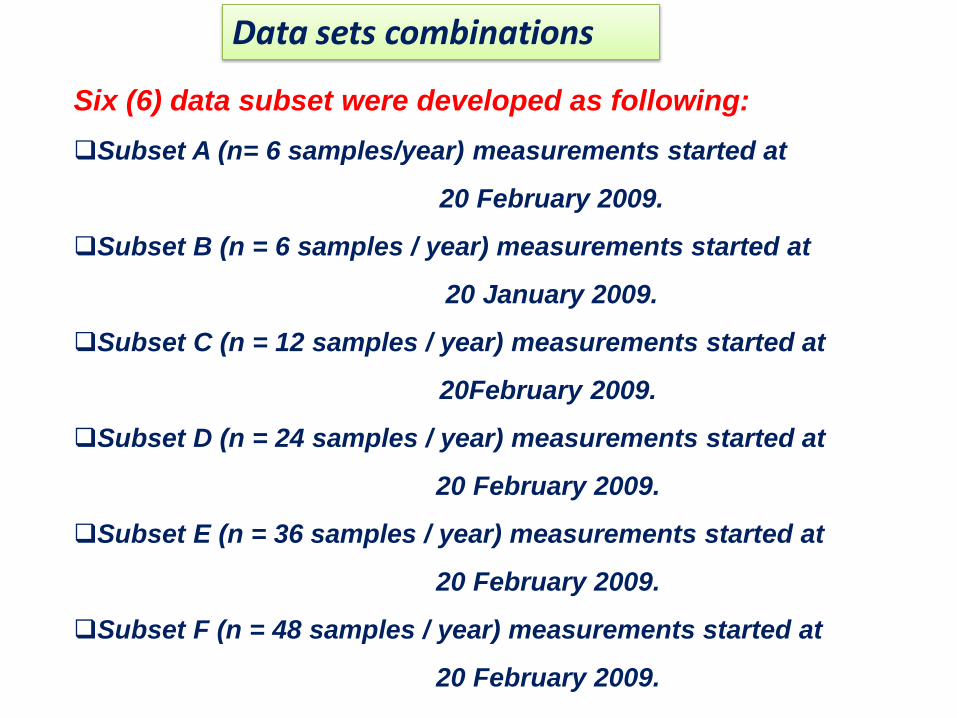
Data sets combinations
Six (6) data subset were developed as following:
Subset A (n= 6 samples/year) measurements started at
20 February 2009.
Subset B (n = 6 samples / year) measurements started at
20 January 2009.
Subset C (n = 12 samples / year) measurements started at
20February 2009.
Subset D (n = 24 samples / year) measurements started at
20 February 2009.
Subset E (n = 36 samples / year) measurements started at
20 February 2009.
Subset F (n = 48 samples / year) measurements started at
20 February 2009.

Median Changes at different sampling frequencies
for WQPs at NL39
7.94
7.96
7.98
8.00
8.02
8.04
8.06
8.08
6 sampleper year
(A)
6 sampleper year
(B)
12 sampleper year
24 sampleper year
36 sampleper year
48 sampleper year
pH
0.00
1.00
2.00
3.00
4.00
5.00
6.00
6 sampleper year
(A)
6 sampleper year
(B)
12 sampleper year
24 sampleper year
36 sampleper year
48 sampleper year
DO
(m
g/l)
0.0
3.0
6.0
9.0
12.0
15.0
6 sampleper year
(A)
6 sampleper year
(B)
12 sampleper year
24 sampleper year
36 sampleper year
48 sampleper year
Tu
rb.
(NT
U)
0.267
0.268
0.269
0.270
0.271
0.272
6 sampleper year
(A)
6 sampleper year
(B)
12 sampleper year
24 sampleper year
36 sampleper year
48 sampleper year
TD
S (
mg
/l)
1.12 % 6.4 %
9 % 2.77 %
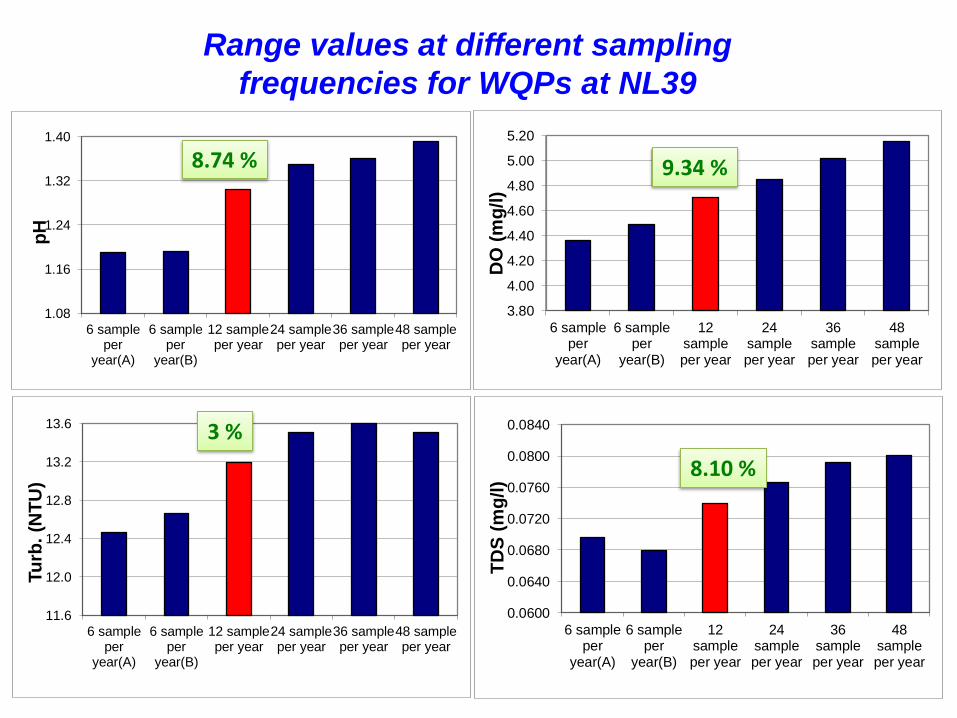
Range values at different sampling
frequencies for WQPs at NL39
1.08
1.16
1.24
1.32
1.40
6 sampleper
year(A)
6 sampleper
year(B)
12 sampleper year
24 sampleper year
36 sampleper year
48 sampleper year
pH
3.80
4.00
4.20
4.40
4.60
4.80
5.00
5.20
6 sampleper
year(A)
6 sampleper
year(B)
12sampleper year
24sampleper year
36sampleper year
48sampleper year
DO
(m
g/l)
11.6
12.0
12.4
12.8
13.2
13.6
6 sampleper
year(A)
6 sampleper
year(B)
12 sampleper year
24 sampleper year
36 sampleper year
48 sampleper year
Tu
rb.
(NT
U)
0.0600
0.0640
0.0680
0.0720
0.0760
0.0800
0.0840
6 sampleper
year(A)
6 sampleper
year(B)
12sampleper year
24sampleper year
36sampleper year
48sampleper year
TD
S (
mg
/l)
9.34 % 8.74 %
3 %
8.10 %
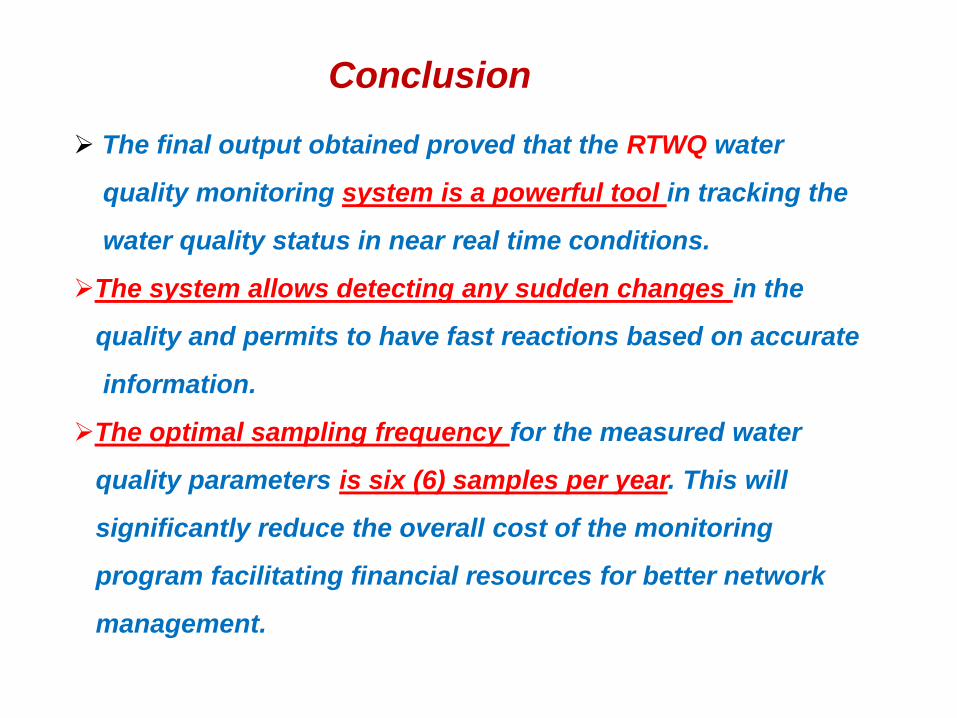
The final output obtained proved that the RTWQ water
quality monitoring system is a powerful tool in tracking the
water quality status in near real time conditions.
The system allows detecting any sudden changes in the
quality and permits to have fast reactions based on accurate
information.
The optimal sampling frequency for the measured water
quality parameters is six (6) samples per year. This will
significantly reduce the overall cost of the monitoring
program facilitating financial resources for better network
management.
Conclusion

The drinking water quality category for the River Nile
site (NL39) was fair for low and high flow rates,
respectively.
The irrigation and livestock water quality category was
fair in
both cases (low and high flow rates).
Conclusion (cont.)
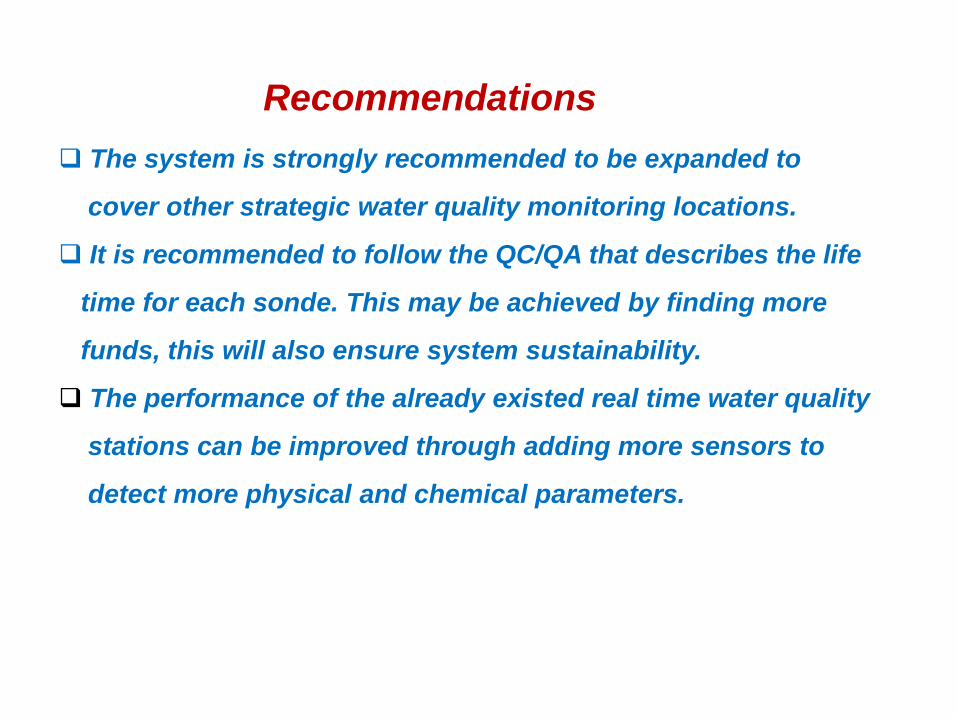
Recommendations
The system is strongly recommended to be expanded to
cover other strategic water quality monitoring locations.
It is recommended to follow the QC/QA that describes the life
time for each sonde. This may be achieved by finding more
funds, this will also ensure system sustainability.
The performance of the already existed real time water quality
stations can be improved through adding more sensors to
detect more physical and chemical parameters.