Useful Applications of Smart micro Gas Chromatography with the NeSSI Platform
25
Useful Applications of Smart micro Gas Chromatography with the NeSSI Platform John Crandall, Falcon Analytical Mike Cost, Parker Hannifin George Schreiner, Justice Laboratory Software 1/24/2011
Transcript of Useful Applications of Smart micro Gas Chromatography with the NeSSI Platform

Useful Applications of Smart micro Gas Chromatography with the NeSSI Platform
John Crandall, Falcon Analytical Mike Cost, Parker Hannifin
George Schreiner, Justice Laboratory Software 1/24/2011

Outline of Presentation
NeSSI, micro Gas Chromatography and Chemometrics are still (after all these years) considered new technology.
Thought leaders and early adopters alike are excited, make lots of positive noise about these new technologies and have implemented to an extent, a limited extent.
However, to reach genuine commercial viability for the technologies, some dragons must be slain. While light gas NeSSI systems are widely accepted, reliability and robustness of
NeSSI use must be PROVEN for “heavy liquids” in the eyes of large scale users. Depth and breadth of micro GC applications must be PROVEN to meet or beat
requirements of the old traditional GCs. Chemometric applications must be PROVEN to be useful in the hands of the
average user. Here are real world and very useful applications of the triangular
relationship of the technologies. A batch approach to automated process analytical chemistry A micro scale bioreactor continuous monitoring system UltraFast ASTM D-2887 at-line & potential for on-line use

Batch Application: Coolant Leak Detection into Blood Product Freeze Dryers Previous State
Human olfactory sensory panels “sniffed” out the leaks The “measurement” was subjective. What if the nose
has a cold? Current State
A micro GC and Chemometrics measure the freeze dryer compartment after cleaning and after freeze drying. Reference: “Lyophilizer Heat Transfer Fluid Monitoring via Gas Chromatographic Methods” by John Kutney, Talecris, IFPAC, 2008 Baltimore. Can be viewed at falconfast.net.
Quantitative analysis at the ppb level results. However…
The level of automation implemented is minimal Personnel turnover makes system operations difficult The microGC instrumentation is at the end of product life
cycle and out of production
Vacuum pump
GC
psi
Flow meter
Sample Tee
Air
H2
Manual Valve
Analyzer Cart
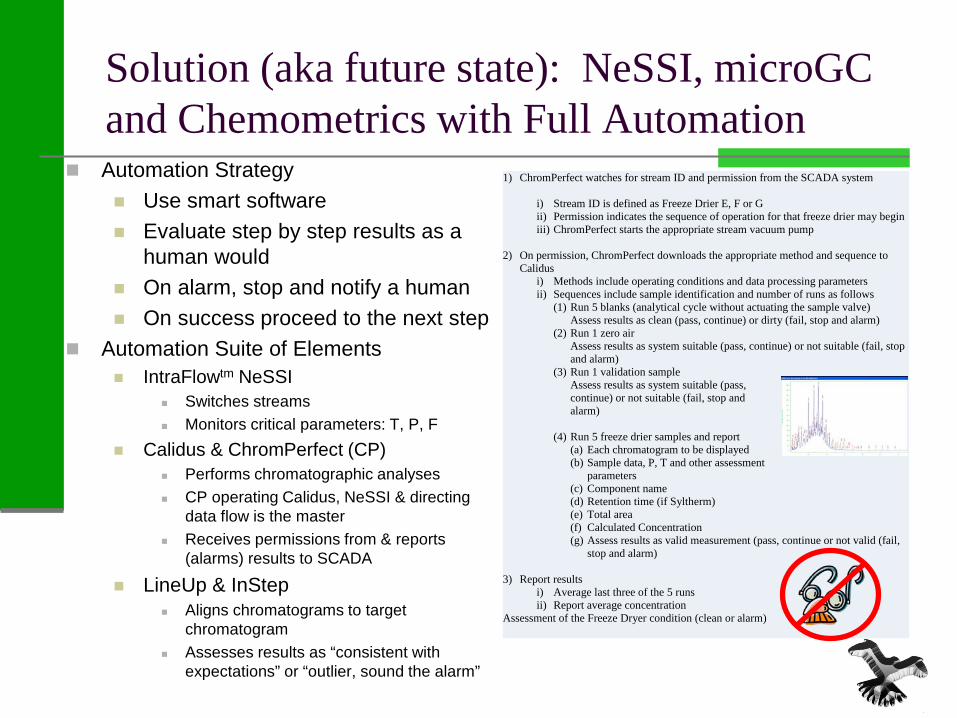
Solution (aka future state): NeSSI, microGC and Chemometrics with Full Automation
Automation Strategy Use smart software Evaluate step by step results as a
human would On alarm, stop and notify a human On success proceed to the next step
Automation Suite of Elements IntraFlowtm NeSSI
Switches streams Monitors critical parameters: T, P, F
Calidus & ChromPerfect (CP) Performs chromatographic analyses CP operating Calidus, NeSSI & directing
data flow is the master Receives permissions from & reports
(alarms) results to SCADA
LineUp & InStep Aligns chromatograms to target
chromatogram Assesses results as “consistent with
expectations” or “outlier, sound the alarm”
1) ChromPerfect watches for stream ID and permission from the SCADA system
i) Stream ID is defined as Freeze Drier E, F or G ii) Permission indicates the sequence of operation for that freeze drier may begin iii) ChromPerfect starts the appropriate stream vacuum pump
2) On permission, ChromPerfect downloads the appropriate method and sequence to
Calidus i) Methods include operating conditions and data processing parameters ii) Sequences include sample identification and number of runs as follows
(1) Run 5 blanks (analytical cycle without actuating the sample valve) Assess results as clean (pass, continue) or dirty (fail, stop and alarm)
(2) Run 1 zero air Assess results as system suitable (pass, continue) or not suitable (fail, stop and alarm)
(3) Run 1 validation sample Assess results as system suitable (pass, continue) or not suitable (fail, stop and alarm)
(4) Run 5 freeze drier samples and report (a) Each chromatogram to be displayed (b) Sample data, P, T and other assessment
parameters (c) Component name (d) Retention time (if Syltherm) (e) Total area (f) Calculated Concentration (g) Assess results as valid measurement (pass, continue or not valid (fail,
stop and alarm)
3) Report results i) Average last three of the 5 runs ii) Report average concentration
Assessment of the Freeze Dryer condition (clean or alarm)

System Overview for the 3 Stream Batch NeSSI/microGC/Chemometric System (not to scale)
Water
Zero Air
Hydrogen
Freeze Dryer
Controls
SCADA FD 1
FD 2
FD 3
Actuation Signals
Analog Inputs
Ethernet
Stream Switching
Compressed Air
Permission
Reporting

Continuous Application: 8 Stream micro-Scale Bioreactor System Continuous monitoring is required
Production monitoring for a specialty chemical Nutrient monitoring & feed rate for microbes Oxygen monitoring & feed rate for microbes
Fermentor off gas analysis is required Sampling the broth is complicated The microbes will plug virtually any automatic
sampling mechanism (they continue to grow… things shut)
The off gas concentration indicates production yield There are multiple small systems
In this case there are 8 reactors (90 second cycles)
Process flow rates are small < 1 liter/minute Calibration for the semivolatile organic is problematic Manual sampling & monitoring is virtually impossible

Automation Strategy
Automation Strategy Use smart software Control critical parameters: T, P, and especially flow rate
(don’t suck the reactors dry) Automation Suite of Elements
IntraFlowtm NeSSI Switches streams & controls flow rates Performs periodic autocalibration sample via a permeation calibration
system Monitors critical parameters: T, P, F
Calidus & ChromPerfect (CP) Performs chromatographic analyses CP operating Calidus, NeSSI & directing data flow is the master Receives permissions & reports (alarms) results from/to LIMS
LineUp & InStep Aligns chromatograms to target chromatogram Assesses results as “consistent with expectations” or “outlier, sound the
alarm”

System Overview for the 8 Stream Continuous NeSSI/microGC/Chemometric System (not to scale)
8 Stream IntraFlowtm
8 Stream Bundle from Left Hood
Knee Space
I/O Gear
Ethernet
Stream Switching Digital Outputs
Ethernet
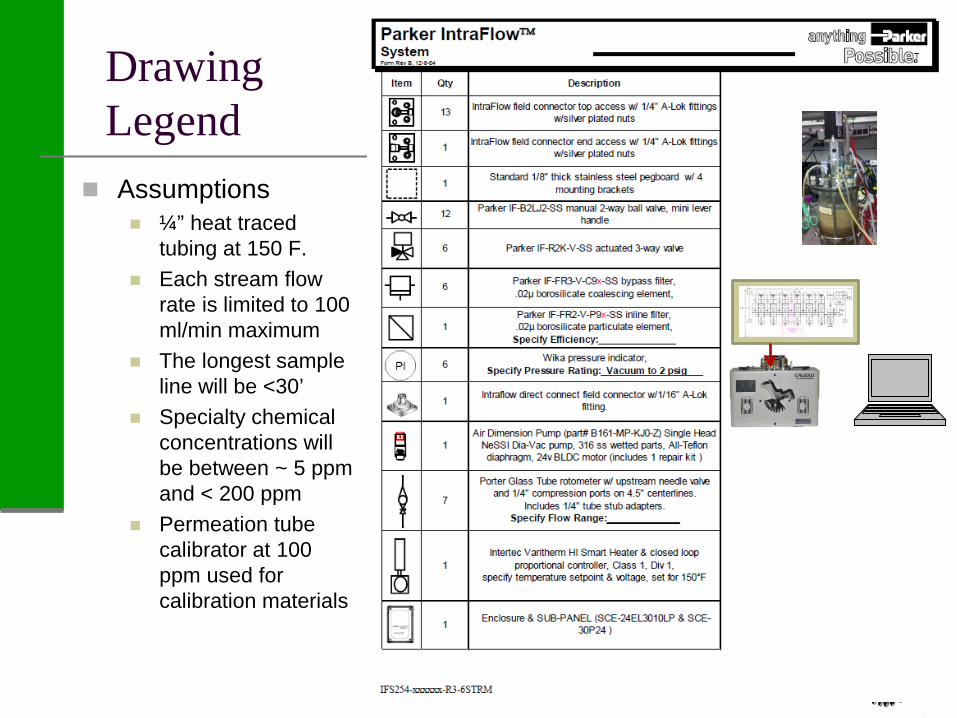
Drawing Legend
Assumptions ¼” heat traced
tubing at 150 F. Each stream flow
rate is limited to 100 ml/min maximum
The longest sample line will be <30’
Specialty chemical concentrations will be between ~ 5 ppm and < 200 ppm
Permeation tube calibrator at 100 ppm used for calibration materials

Parker IntraFlowtm NeSSI Sample System
This is the permeation tube for automatic calibration gas?
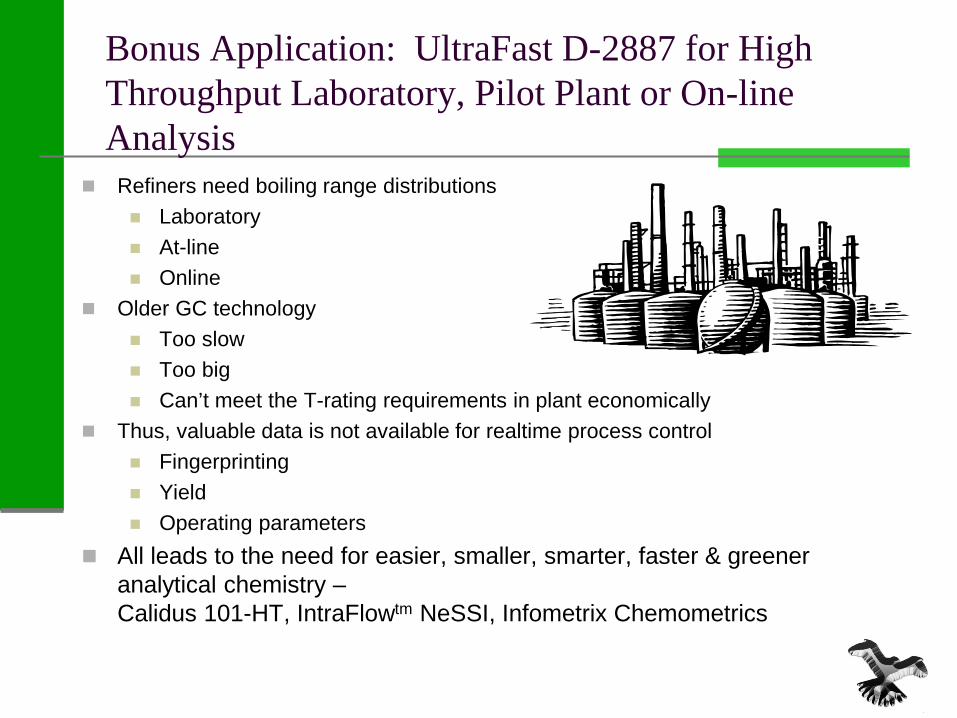
Bonus Application: UltraFast D-2887 for High Throughput Laboratory, Pilot Plant or On-line Analysis
Refiners need boiling range distributions Laboratory At-line Online
Older GC technology Too slow Too big Can’t meet the T-rating requirements in plant economically
Thus, valuable data is not available for realtime process control Fingerprinting Yield Operating parameters
All leads to the need for easier, smaller, smarter, faster & greener analytical chemistry – Calidus 101-HT, IntraFlowtm NeSSI, Infometrix Chemometrics
Status of ASTM’s Proposed Standard Method
“Boiling Range Distribution of Petroleum Distillates With Final Boiling Points up to 535°C by Ultra Fast Gas Chromatography (UF GC)” draft authors Bostic, DiSanzo, Lubkowitz
ASTM D2.04 members Reviewed the draft and voted before the 12/5/2011 meeting Negatives were related to text and table entry errors Industry users stated a compelling need for the draft method Voted to submit corrected method (text and table) for concurrent
balloting by both the subcommittee and the D2 committee before the 6/25/2012 meeting
An affirmative vote by both will confirm the draft as a standard method. Here are current results demonstrating conformance with the existing D-
2887 requirements. (Repeatability & Reproducibility requirements will be the same for the new method but require < 5 minute analysis time)

Purchased RT Calibration Standard
Standard GC Capillary
column 40 minute
run time

Calidus 101-HT Purchased Restek D-2887 Standard Overlaid Blank
84 Seconds
40 Minutes

Purchased Standard Gas Oil
Certificate of analysis Consensus
values 30 participating
laboratories

Purchased Standard Gas Oil
Standard GC Packed
column 20 minute
run time Certificate of
analysis follows

Calidus 101-HT Purchased Supelco D-2887 Standard Gas Oil, Run Time 84 Seconds
20 Minutes

Blank, RT Standard & Gas Oil Overlaid, Run Time 84 Seconds

D-2887 Report
Points of Interest Chromatogram
shown with BP curve and blank chromatogram overlaid
Selected BP data shown in the table.
Comparison follows

Calidus 101-HT Results Compared to Consensus Values Reported by Certificate of Analysis
Values Shown Correspond to the cut points
reported in the certificate Indicate excellent comparison Calculated using raw
chromatograms LineUp will improve all values
LineUp use Absolutely necessary over time
for data QC automation, no human can keep up with ~500 runs/day (~ 3 minute cycles)
Extend maintenance interval time
Elevate confidence in the results
Degrees FMeasured Accepted Difference F Limit FIBP 240 239 1.0 13.7
5 304 304 0.0 6.810 349 349 0.0 7.415 395 393 2.0 8.120 437 435 2.0 8.625 472 469 3.0 8.530 500 499 1.0 8.535 528 526 2.0 8.140 554 552 2.0 7.745 578 576 2.0 7.750 595 594 1.0 7.755 611 610 1.0 7.760 629 629 0.0 7.765 649 649 0.0 7.770 669 669 0.0 7.775 690 690 0.0 7.780 713 712 1.0 7.785 737 736 1.0 7.790 765 764 1.0 7.795 805 803 2.0 9.0
FBP 887 887 0.0 21.2

Absolute Values of Difference from the Consensus Values (red is the D-2887 tolerance)

What about Repeatability?
100 run campaign, every 10th run overlaid.
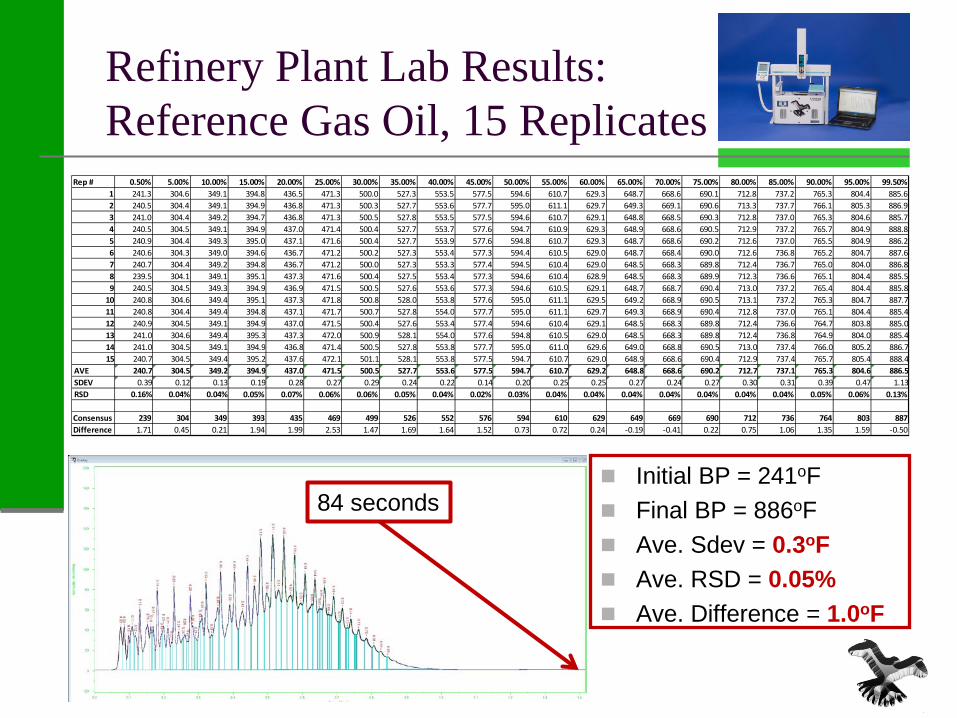
Refinery Plant Lab Results: Reference Gas Oil, 15 Replicates
Initial BP = 241oF Final BP = 886oF Ave. Sdev = 0.3oF Ave. RSD = 0.05% Ave. Difference = 1.0oF
84 seconds
Rep # 0.50% 5.00% 10.00% 15.00% 20.00% 25.00% 30.00% 35.00% 40.00% 45.00% 50.00% 55.00% 60.00% 65.00% 70.00% 75.00% 80.00% 85.00% 90.00% 95.00% 99.50%1 241.3 304.6 349.1 394.8 436.5 471.3 500.0 527.3 553.5 577.5 594.6 610.7 629.3 648.7 668.6 690.1 712.8 737.2 765.3 804.4 885.62 240.5 304.4 349.1 394.9 436.8 471.3 500.3 527.7 553.6 577.7 595.0 611.1 629.7 649.3 669.1 690.6 713.3 737.7 766.1 805.3 886.93 241.0 304.4 349.2 394.7 436.8 471.3 500.5 527.8 553.5 577.5 594.6 610.7 629.1 648.8 668.5 690.3 712.8 737.0 765.3 804.6 885.74 240.5 304.5 349.1 394.9 437.0 471.4 500.4 527.7 553.7 577.6 594.7 610.9 629.3 648.9 668.6 690.5 712.9 737.2 765.7 804.9 888.85 240.9 304.4 349.3 395.0 437.1 471.6 500.4 527.7 553.9 577.6 594.8 610.7 629.3 648.7 668.6 690.2 712.6 737.0 765.5 804.9 886.26 240.6 304.3 349.0 394.6 436.7 471.2 500.2 527.3 553.4 577.3 594.4 610.5 629.0 648.7 668.4 690.0 712.6 736.8 765.2 804.7 887.67 240.7 304.4 349.2 394.8 436.7 471.2 500.0 527.3 553.3 577.4 594.5 610.4 629.0 648.5 668.3 689.8 712.4 736.7 765.0 804.0 886.88 239.5 304.1 349.1 395.1 437.3 471.6 500.4 527.5 553.4 577.3 594.6 610.4 628.9 648.5 668.3 689.9 712.3 736.6 765.1 804.4 885.59 240.5 304.5 349.3 394.9 436.9 471.5 500.5 527.6 553.6 577.3 594.6 610.5 629.1 648.7 668.7 690.4 713.0 737.2 765.4 804.4 885.8
10 240.8 304.6 349.4 395.1 437.3 471.8 500.8 528.0 553.8 577.6 595.0 611.1 629.5 649.2 668.9 690.5 713.1 737.2 765.3 804.7 887.711 240.8 304.4 349.4 394.8 437.1 471.7 500.7 527.8 554.0 577.7 595.0 611.1 629.7 649.3 668.9 690.4 712.8 737.0 765.1 804.4 885.412 240.9 304.5 349.1 394.9 437.0 471.5 500.4 527.6 553.4 577.4 594.6 610.4 629.1 648.5 668.3 689.8 712.4 736.6 764.7 803.8 885.013 241.0 304.6 349.4 395.3 437.3 472.0 500.9 528.1 554.0 577.6 594.8 610.5 629.0 648.5 668.3 689.8 712.4 736.8 764.9 804.0 885.414 241.0 304.5 349.1 394.9 436.8 471.4 500.5 527.8 553.8 577.7 595.0 611.0 629.6 649.0 668.8 690.5 713.0 737.4 766.0 805.2 886.715 240.7 304.5 349.4 395.2 437.6 472.1 501.1 528.1 553.8 577.5 594.7 610.7 629.0 648.9 668.6 690.4 712.9 737.4 765.7 805.4 888.4
AVE 240.7 304.5 349.2 394.9 437.0 471.5 500.5 527.7 553.6 577.5 594.7 610.7 629.2 648.8 668.6 690.2 712.7 737.1 765.3 804.6 886.5SDEV 0.39 0.12 0.13 0.19 0.28 0.27 0.29 0.24 0.22 0.14 0.20 0.25 0.25 0.27 0.24 0.27 0.30 0.31 0.39 0.47 1.13RSD 0.16% 0.04% 0.04% 0.05% 0.07% 0.06% 0.06% 0.05% 0.04% 0.02% 0.03% 0.04% 0.04% 0.04% 0.04% 0.04% 0.04% 0.04% 0.05% 0.06% 0.13%
Consensus 239 304 349 393 435 469 499 526 552 576 594 610 629 649 669 690 712 736 764 803 887Difference 1.71 0.45 0.21 1.94 1.99 2.53 1.47 1.69 1.64 1.52 0.73 0.72 0.24 -0.19 -0.41 0.22 0.75 1.06 1.35 1.59 -0.50
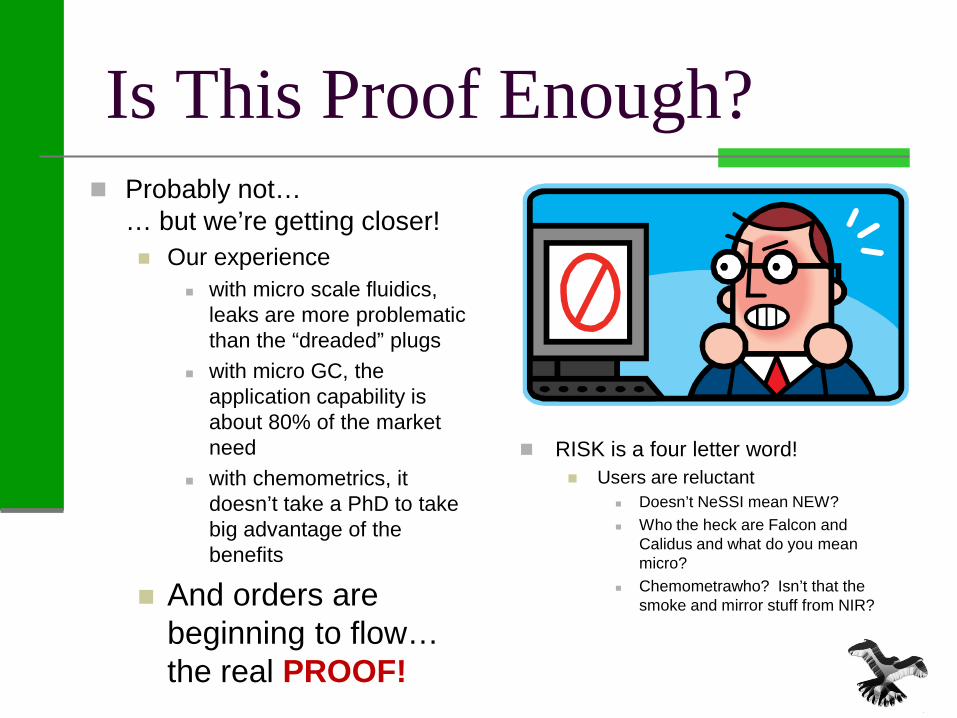
Is This Proof Enough? Probably not…
… but we’re getting closer! Our experience
with micro scale fluidics, leaks are more problematic than the “dreaded” plugs
with micro GC, the application capability is about 80% of the market need
with chemometrics, it doesn’t take a PhD to take big advantage of the benefits
And orders are beginning to flow… the real PROOF!
RISK is a four letter word! Users are reluctant
Doesn’t NeSSI mean NEW? Who the heck are Falcon and
Calidus and what do you mean micro?
Chemometrawho? Isn’t that the smoke and mirror stuff from NIR?

Easier, Smaller, Smarter, Faster, Greener
Thanks to our strategic friends at...
Justice Laboratory Software