Recent Progress in Tropical Cyclone Intensity Forecasting ...
Charan Singh
RSMC-New Delhi
Use of satellite in forecasting of Tropical Cyclone before and after 2011
RSMC New Delhi
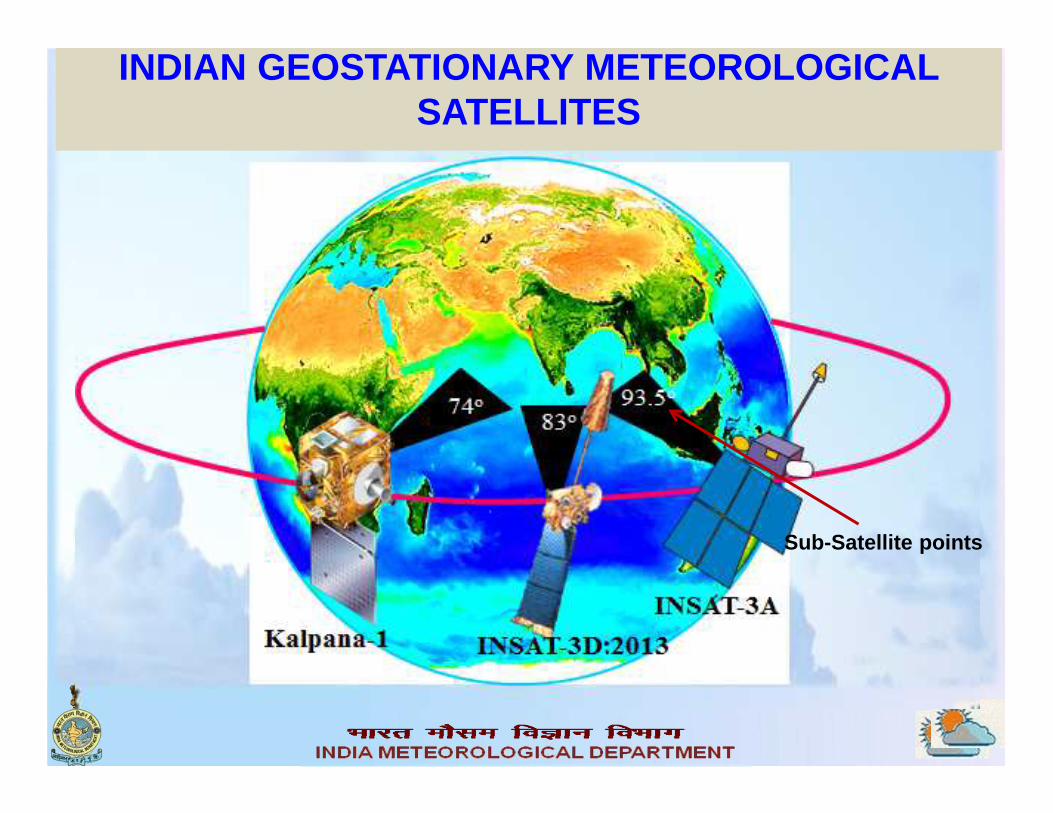
INDIAN GEOSTATIONARY METEOROLOGICAL SATELLITES
Sub-Satellite points
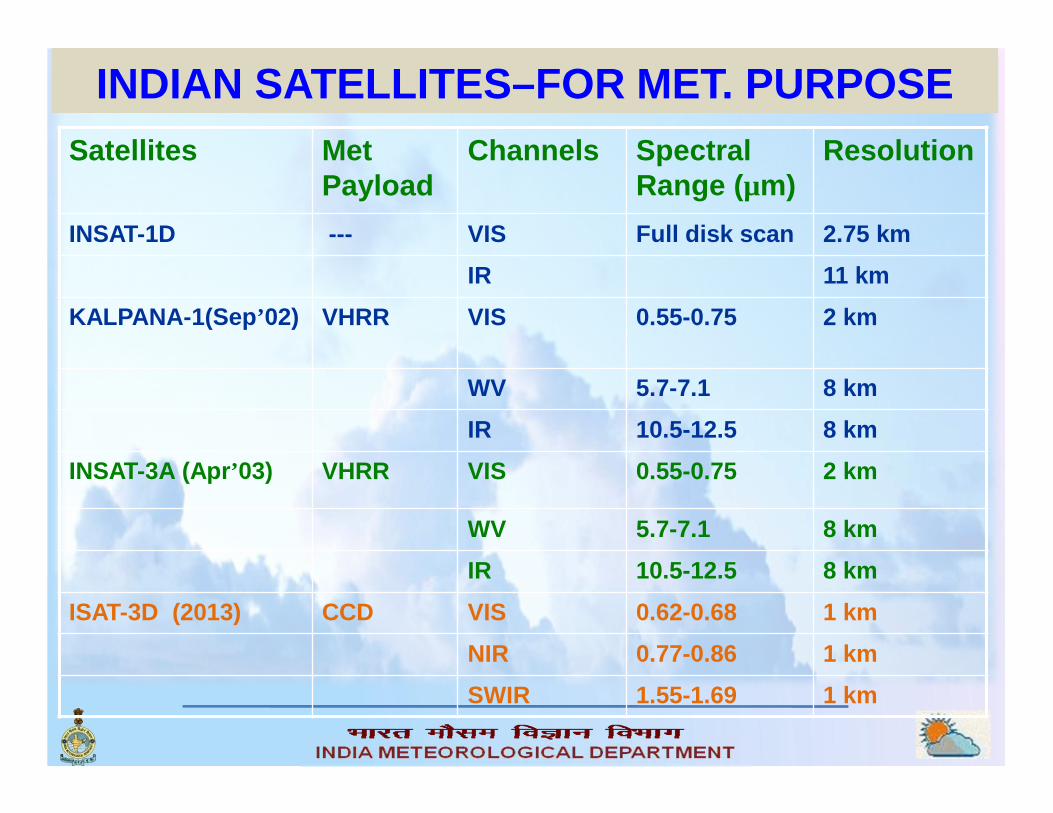
INDIAN SATELLITES –FOR MET. PURPOSESatellites Met
PayloadChannels Spectral
Range (µm)Resolution
INSAT-1D --- VIS Full disk scan 2.75 km
IR 11 km
KALPANA-1(Sep ’02) VHRR VIS 0.55-0.75 2 km
WV 5.7-7.1 8 km
IR 10.5-12.5 8 km
INSAT-3A (Apr ’03) VHRR VIS 0.55-0.75 2 km
WV 5.7-7.1 8 km
IR 10.5-12.5 8 km
ISAT-3D (2013) CCD VIS 0.62-0.68 1 km
NIR 0.77-0.86 1 km
SWIR 1.55-1.69 1 km


SATELLITE DERIVED PRODUCTS
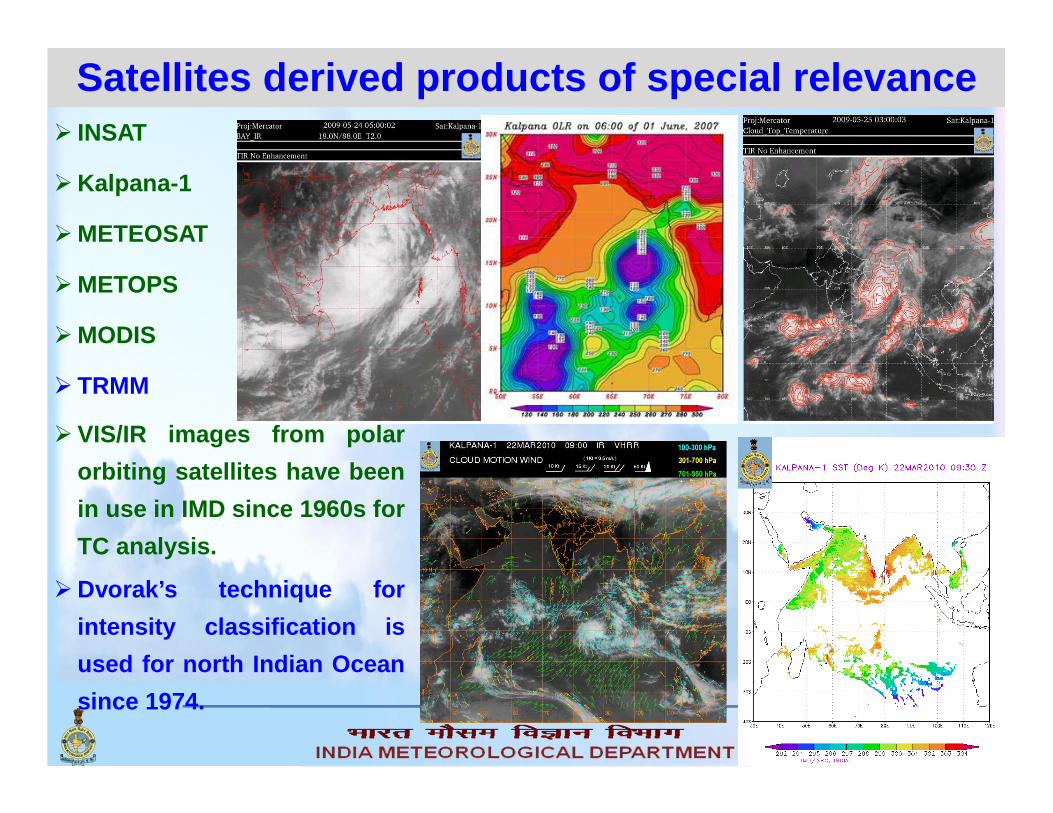
Satellites derived products of special relevance� INSAT
�Kalpana-1
�METEOSAT
�METOPS
�MODIS
� TRMM
�VIS/IR images from polar
orbiting satellites have been
in use in IMD since 1960s for
TC analysis.
�Dvorak’s technique for
intensity classification is
used for north Indian Ocean
since 1974.

Satellite based Ocean surface wind
� The above product is in use since its inception in 1999
� Oceansat-II launched in 2009 provides data since Phyancyclone (November 2009). However, data are notreceived in real time.
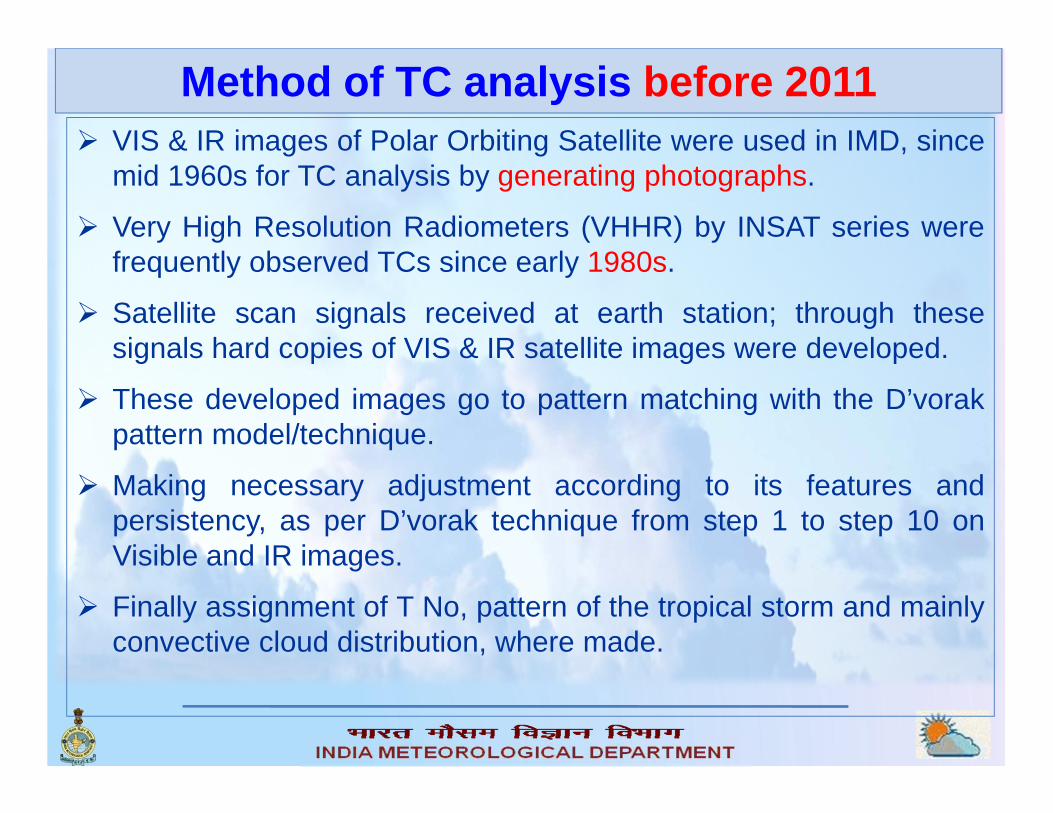
Method of TC analysis before 2011� VIS & IR images of Polar Orbiting Satellite were used in IMD, since
mid 1960s for TC analysis by generating photographs.
� Very High Resolution Radiometers (VHHR) by INSAT series werefrequently observed TCs since early 1980s.
� Satellite scan signals received at earth station; through thesesignals hard copies of VIS & IR satellite images were developed.
� These developed images go to pattern matching with the D’vorakpattern model/technique.
� Making necessary adjustment according to its features andpersistency, as per D’vorak technique from step 1 to step 10 onVisible and IR images.
� Finally assignment of T No, pattern of the tropical storm and mainlyconvective cloud distribution, where made.
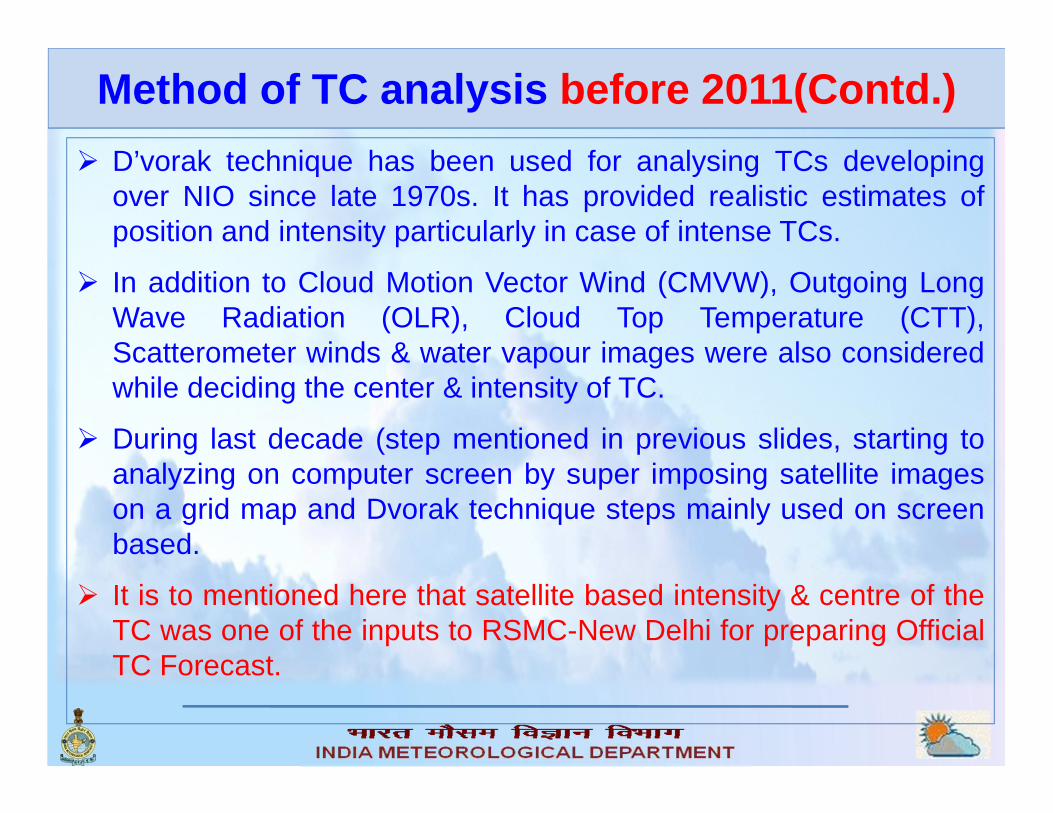
Method of TC analysis before 2011(Contd.)
� D’vorak technique has been used for analysing TCs developingover NIO since late 1970s. It has provided realistic estimates ofposition and intensity particularly in case of intense TCs.
� In addition to Cloud Motion Vector Wind (CMVW), Outgoing LongWave Radiation (OLR), Cloud Top Temperature (CTT),Scatterometer winds & water vapour images were also consideredwhile deciding the center & intensity of TC.
� During last decade (step mentioned in previous slides, starting toanalyzing on computer screen by super imposing satellite imageson a grid map and Dvorak technique steps mainly used on screenbased.
� It is to mentioned here that satellite based intensity & centre of theTC was one of the inputs to RSMC-New Delhi for preparing OfficialTC Forecast.
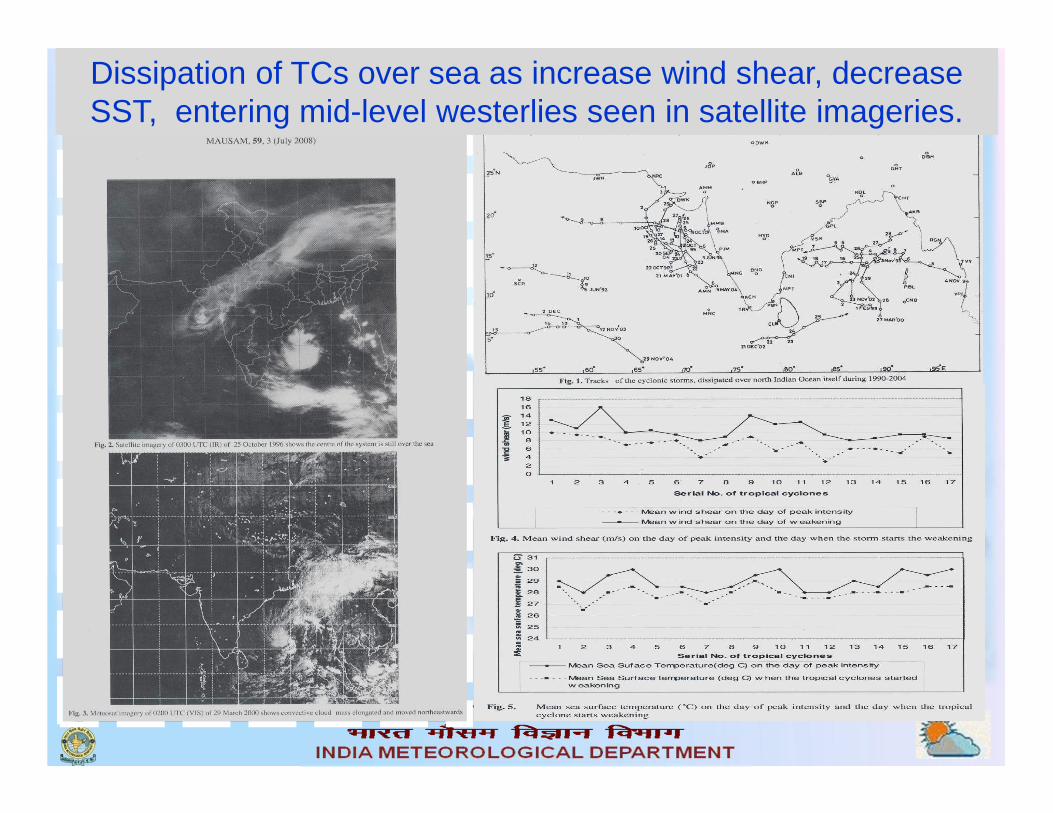
Dissipation of TCs over sea as increase wind shear, decrease SST, entering mid-level westerlies seen in satellite imageries.

�The rainfall occurred mostly overarea covered with convective cloudswith CCT -80 to -60 0C, prior/afterlandfall of TCs.
�In 93% TCs, 70 % convection layover area right of the TCs track.
�Slow moving TCs cause heavy rainrather than fast moving TCs.
�The BOB TCs which crossed coastas CS and VSCS caused:•71.4 % r/f within the ranges 5-10 cm•22.8% 10-20 cm and•4.3% within the ranges 20-30 cmAnd
� For Arabian Sea TCs, about 70 %rainfall within the ranges 15-25 cmin 24 hrs in general.
Rainfall and cloud top temperature (CCT)

Satellite Bulletins
� Satellite division of IMD issues three hourly bulletinsfor entire southeast Asia.
� Includes spatial distribution and intensity of convectiveclouds.
� Issued hourly, in case of deep depression and cyclonicstorm and more intensity cyclones with Centre of theTC, intensity (T No.) and features.
� Intense precipitation advisories are also issued as andwhen required, particularly during monsoon,thunderstorm or some time in case of TROPICALcyclone with 6 hours validity.


No. Parameters Input Channels No. Parameters Input Channels
1. Outgoing Long wave Radiation (OLR)
TIR -1, TIR -2, WV 10. Water Vapor Wind (WVW)
WV, TIR -1, TIR -2
2. Quantitative Precipitation Estimation ( QPE),IMSRA,HE
TIR -1, TIR -2, WV,Model FG.
11. Upper Tropospheric Humidity (UTH)
WV, TIR -1, TIR -2
3. Sea Surface Temperature (SST)
SWIR,TIR -1, TIR -2, MIR
12. Temperature, Humidity profile & Total ozone
Sounder all channels
4. Snow Cover VIS, SWIR, TIR -1, TIR -2
13. Value added parameters from sounder products
Sounder products
5. Snow Depth VIS, SWIR, TIR -1, TIR -2
14. FOG SWIR, MIR , TIR -1, TIR -2
6. Fire MIR, TIR -1 15. Normalized Difference Vegetation Index
CCD
7. Smoke VIS, TIR -1, TIR -2, MIR
16. Flash Flood Analyzer TIR -1, TIR -2, VIS
8. Aerosol VIS, TIR -1, TIR -2 17. HSCAS VIS
9. Cloud Motion Vector (CMV)
VIS, TIR -1, TIR -2 18. Tropical Cyclone-intensity /position
AODT technique,TIR-1,TIR-2
AFTER 2011 significant increase in Satellite products

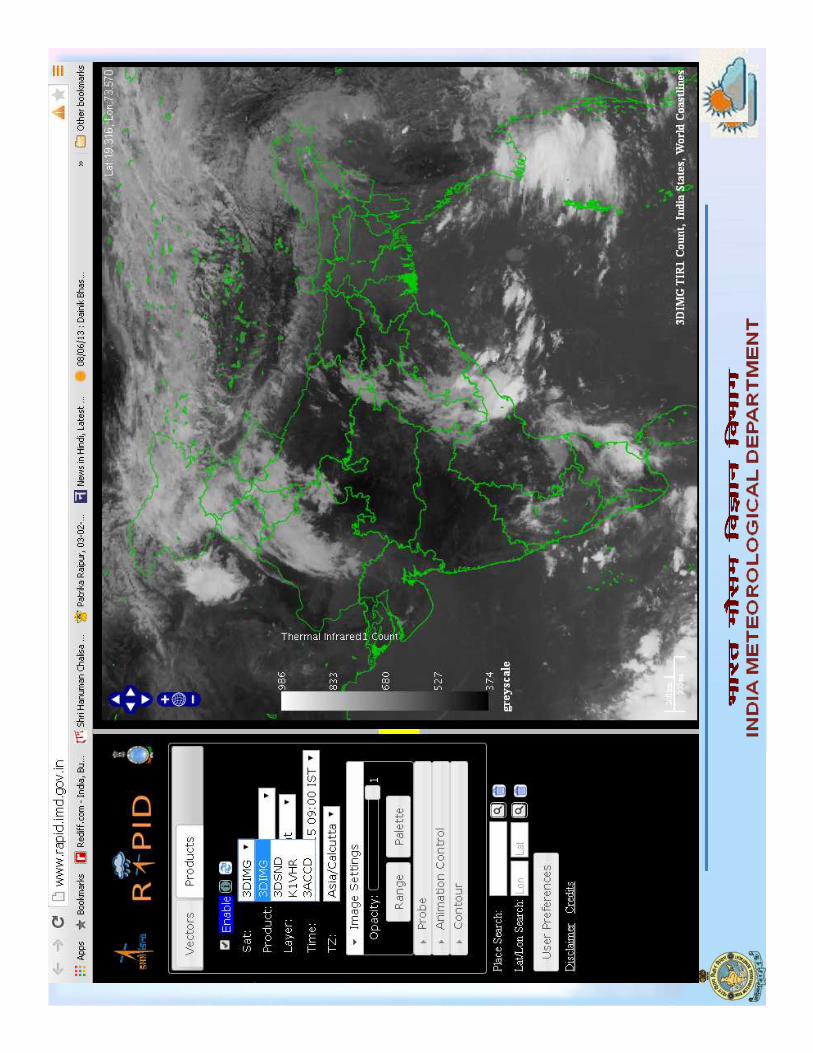
On-line INSAT -3D Data Visualization Tool RAPID
http://www.rapid.imd.gov.in/
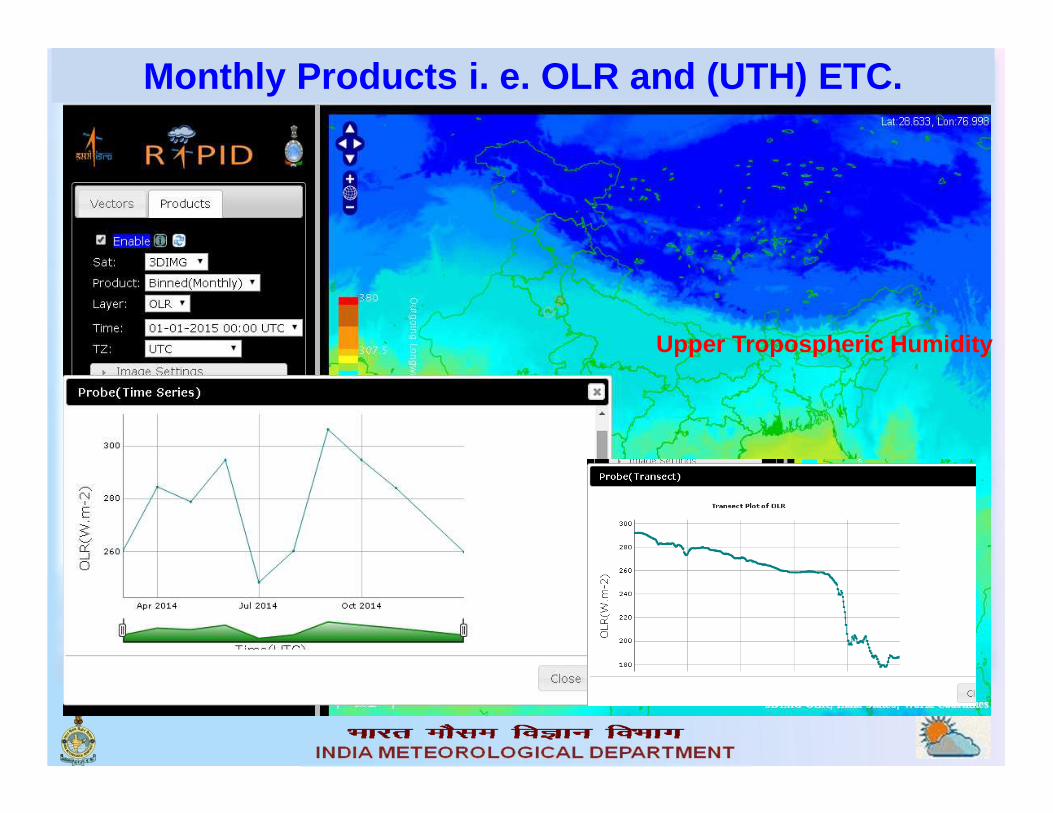
Monthly Products i. e. OLR and (UTH) ETC.
Upper Tropospheric Humidity
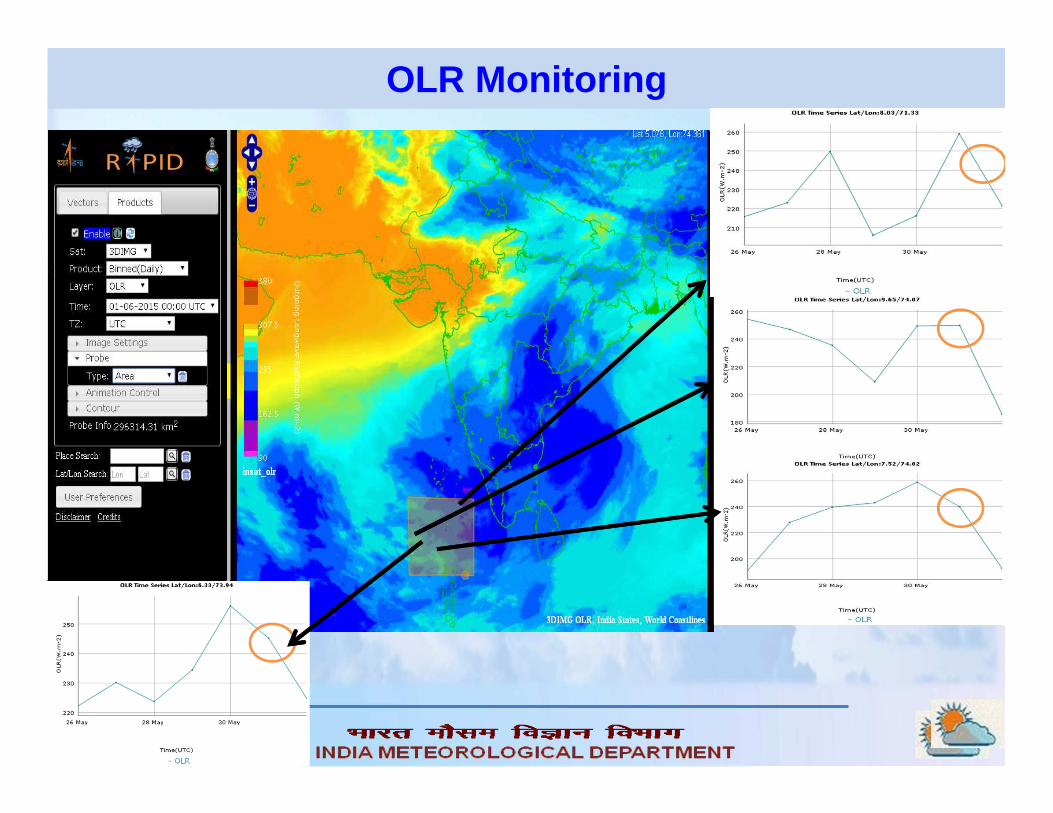
OLR Monitoring

INSAT-3D Sounder Products, LI, TPW
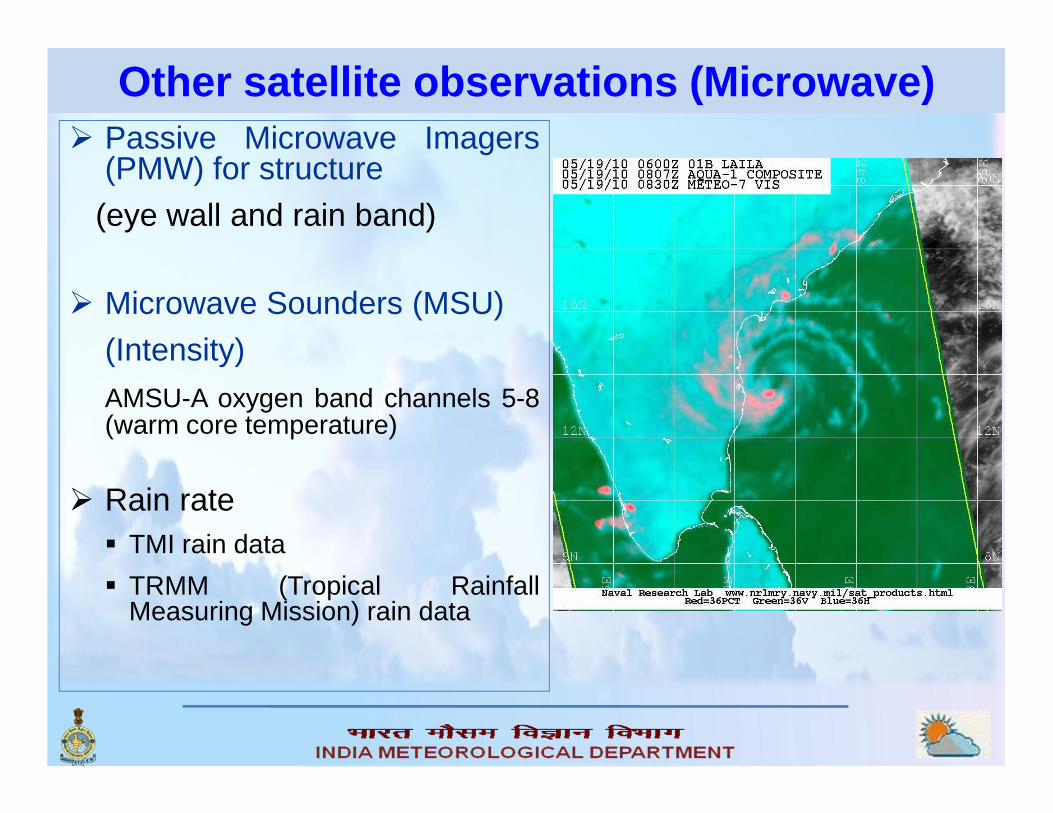
Other satellite observations (Microwave) � Passive Microwave Imagers
(PMW) for structure
(eye wall and rain band)
� Microwave Sounders (MSU)
(Intensity)
AMSU-A oxygen band channels 5-8(warm core temperature)
� Rain rate� TMI rain data
� TRMM (Tropical RainfallMeasuring Mission) rain data

Microwave imageries being used
� Tropical cyclone module has been installed and beutilised along with Navy NRL website to analysemicrowave imageries.
� Available satellite dérivéd products
High resolution AMVs; rapid scan winds; OLR; Oceansatand WINDSAT winds; local High Résolution PictureTransmission (HRPT) Temperature and moistureprofiles; MODIS moisture data; TMI; SSMI and AMSUdata sets etc.) for its utilization by the global andregional data assimilation-forecast systems of IMD.
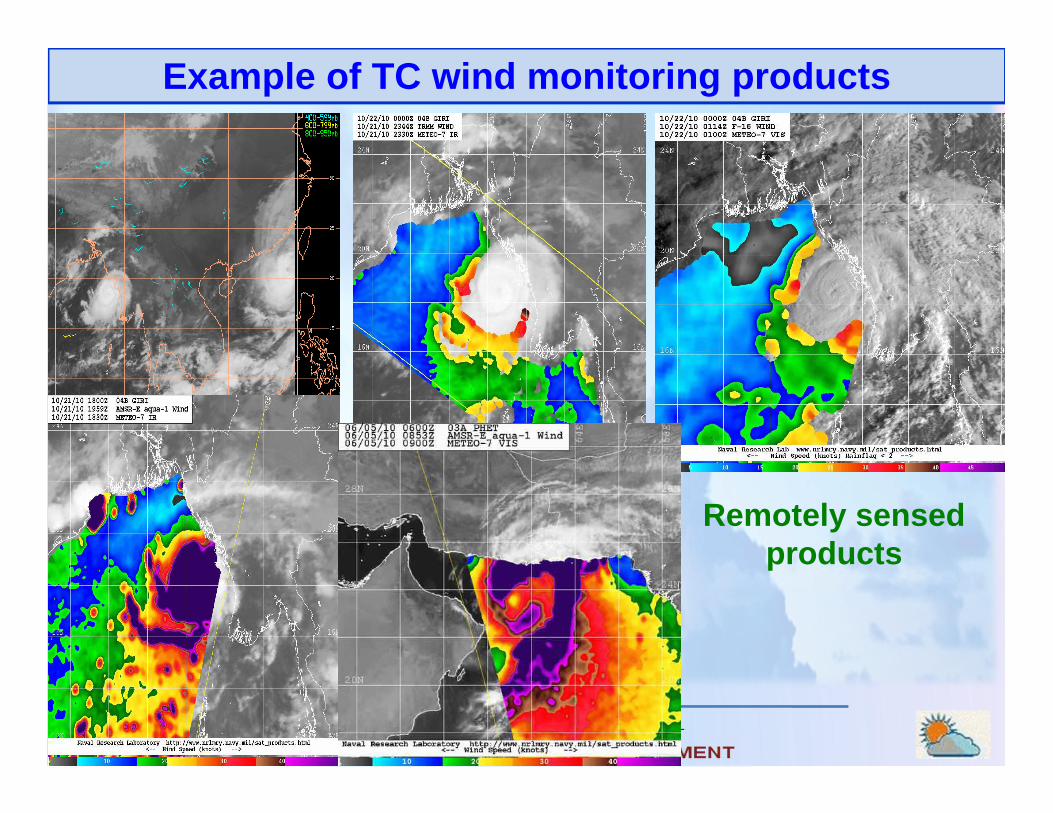
Example of TC wind monitoring products
Remotely sensed products

TC wind monitoring products
Scatterometry products
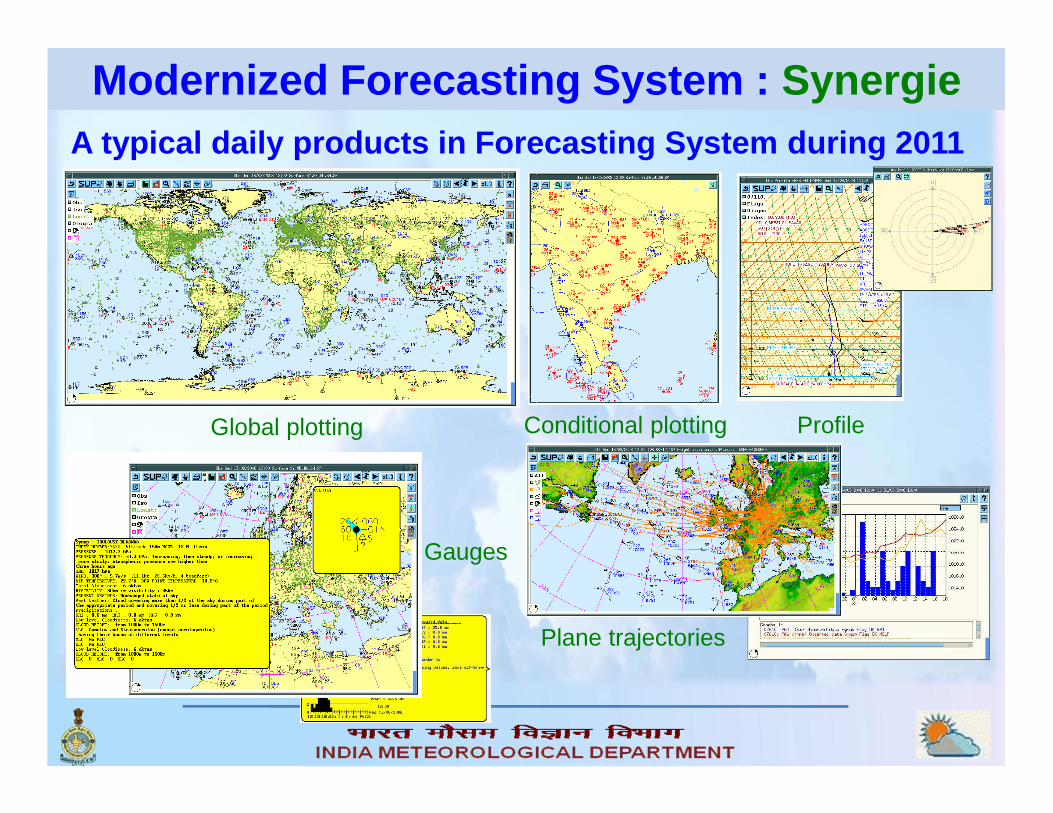
Modernized Forecasting System : Synergie
Global plotting Conditional plotting Profile
Gauges
Plane trajectories
A typical daily products in Forecasting System duri ng 2011
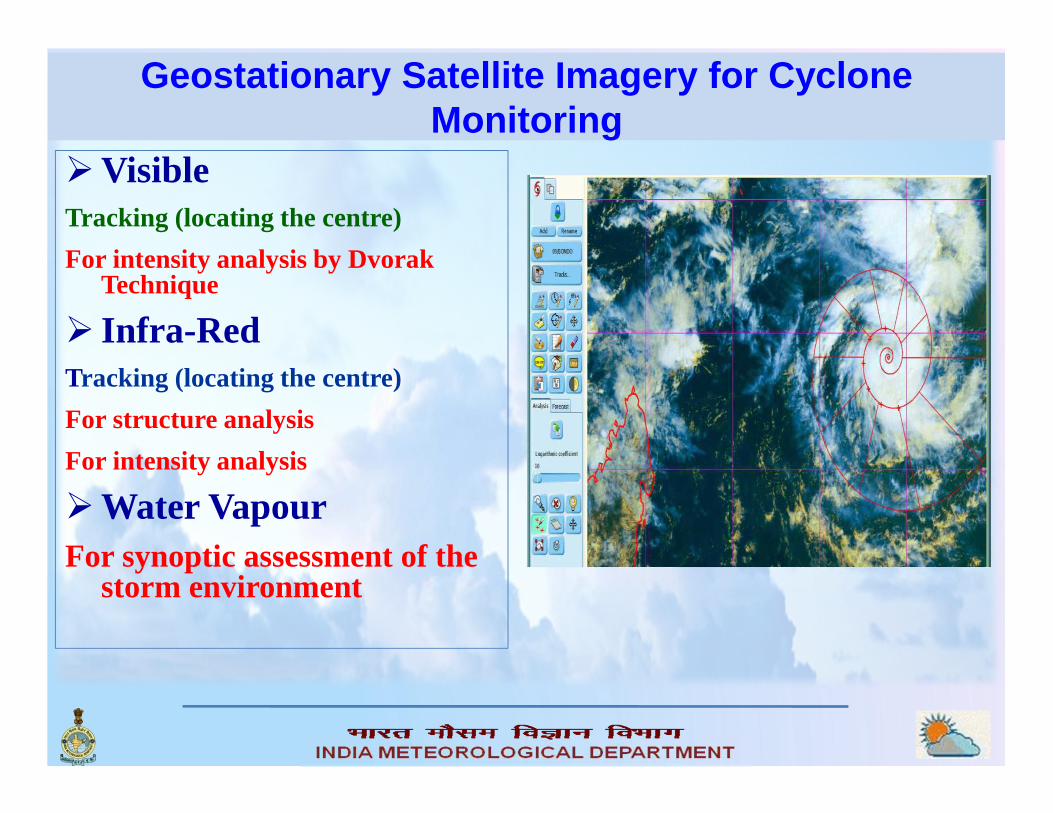
Geostationary Satellite Imagery for Cyclone Monitoring
�VisibleTracking (locating the centre)
For intensity analysis by Dvorak Technique
� Infra-RedTracking (locating the centre)
For structure analysis
For intensity analysis
�Water VapourFor synoptic assessment of the
storm environment
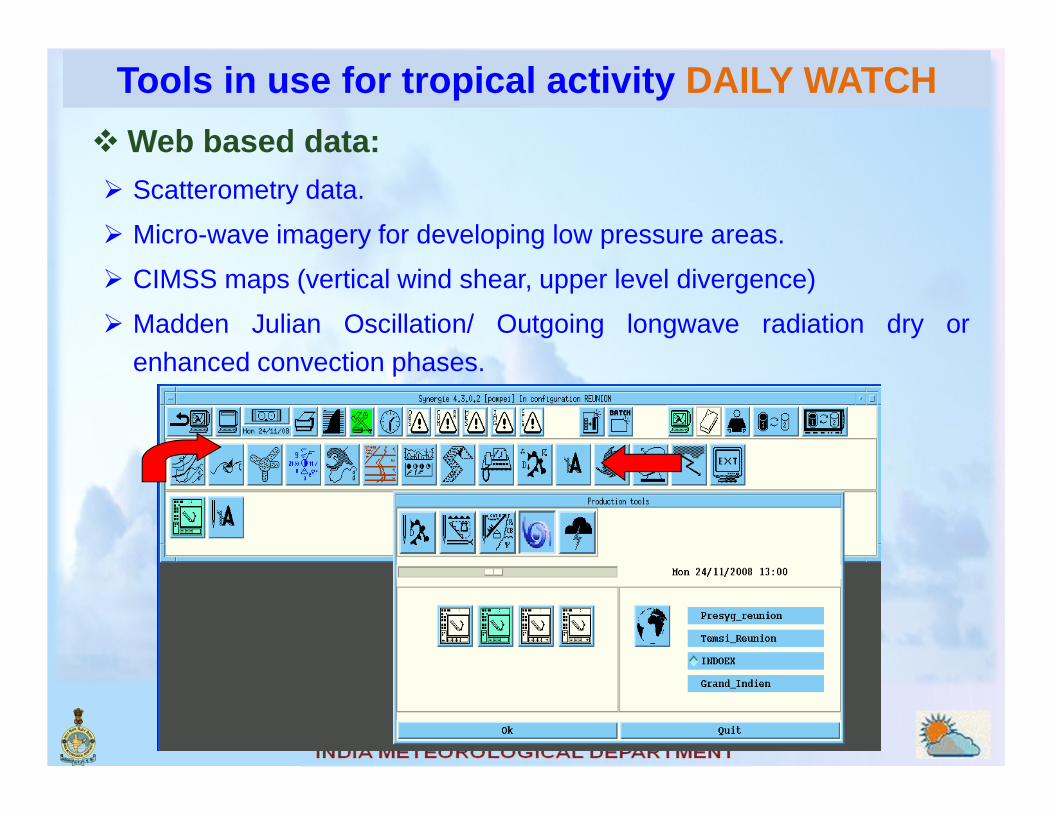
Tools in use for tropical activity DAILY WATCH
� Web based data:� Scatterometry data.
� Micro-wave imagery for developing low pressure areas.
� CIMSS maps (vertical wind shear, upper level divergence)
� Madden Julian Oscillation/ Outgoing longwave radiation dry orenhanced convection phases.

Tropical Cyclone Module & Microwave )
� Microwave imageries being used� Tropical cyclone module has been installed
and utilised along with Navy NRL website toanalyse microwave imageries.
Image of TRMM 2344Z of TC Giri, Eye is clearly seen .
Imagery of Giri Kalpana I of 2200UTC, Eye TC is not seen .
Imagery of F-16, 6 th Nov 2010 (01:29 UTC)

SATMET page on ID website before 2011


Thanks.