Recent Progress in Tropical Cyclone Intensity Forecasting ...
10
Recent Progress in Tropical Cyclone Intensity Forecasting at the National Hurricane Center JOHN P. CANGIALOSI,ERIC BLAKE,MARK DEMARIA,ANDREW PENNY,ANDREW LATTO, AND EDWARD RAPPAPORT NOAA/NWS/NCEP National Hurricane Center, Miami, Florida VIJAY TALLAPRAGADA NOAA/NWS/NCEP Environmental Modeling Center, College Park, Maryland (Manuscript received 20 April 2020, in final form 22 June 2020) ABSTRACT It has been well documented that the National Hurricane Center (NHC) has made significant im- provements in Atlantic basin tropical cyclone (TC) track forecasting during the past half century. In contrast, NHC’s TC intensity forecast errors changed little from the 1970s to the early 2000s. Recently, however, there has been a notable decrease in TC intensity forecast error and an increase in intensity forecast skill. This study documents these trends and discusses the advancements in TC intensity guidance that have led to the improvements in NHC’s intensity forecasts in the Atlantic basin. We conclude with a brief projection of future capabilities. 1. Introduction The National Hurricane Center (NHC) makes and issues public forecasts for tropical depressions, tropical storms, and hurricanes, henceforth referred to as tropi- cal cyclones (TCs) collectively, for the Atlantic and eastern North Pacific basins. Other centers, including the Central Pacific Hurricane Center, Joint Typhoon Warning Center, Japan Meteorological Agency, Indian Meteorological Department, France La Reunion, and Australian Bureau of Meteorology have similar re- sponsibilities for TC forecasting for different parts of the world. NHC has a long history of making TC forecasts and related products, with the earliest quan- titative forecasts known to the authors having been those issued for track for the 1-day (24-h) period beginning in 1954. 1 Since then, NHC has extended the emporal horizon of its forecasts, currently to five days, and added predictions of TC intensity, size, and associated hazards, such as wind, storm surge, and rainfall. In addition, NHC has increased the lead times for the issuance of tropical storm and hurricane watches and warnings, and estab- lished the issuance of storm surge watches and warnings that are based in part on the forecast to give the public additional time to prepare for these potentially devas- tating hazards associated with TCs. It has been well documented (McAdie and Lawrence 2000; Landsea and Cangialosi 2018) that NHC’s track forecast errors have steadily decreased during the past several decades. Figure 1 shows the Atlantic basin track forecast errors averaged by decade for tropical storms and hurricanes. NHC’s current average Atlantic basin track errors have been reduced by about half since the middle 1990s and by about two-thirds since the 1970s. Given the complexity of the issue and its great impor- tance to society, it would not be unreasonable to char- acterize TC track forecast improvement as one of the greatest advances in Earth science of the past half cen- tury. The dramatic improvements in track prediction have been credited largely to gains made in numerical weather prediction (NWP) models whose outputs are Corresponding author: John P. Cangialosi, john.p.cangialosi@ noaa.gov 1 The name National Hurricane Center did not become official until the 1960s, though that moniker was employed informally in the 1950s. Sheets (1990) provides a more comprehensive discussion of NHC’s history. OCTOBER 2020 CANGIALOSI ET AL. 1913 DOI: 10.1175/WAF-D-20-0059.1 For information regarding reuse of this content and general copyright information, consult the AMS Copyright Policy (www.ametsoc.org/ PUBSReuseLicenses). Downloaded from http://journals.ametsoc.org/waf/article-pdf/35/5/1913/4991405/wafd200059.pdf by NOAA Central Library user on 09 October 2020
Transcript of Recent Progress in Tropical Cyclone Intensity Forecasting ...
Recent Progress in Tropical Cyclone Intensity Forecasting at the NationalHurricane Center
JOHN P. CANGIALOSI, ERIC BLAKE, MARK DEMARIA, ANDREW PENNY, ANDREW LATTO,AND EDWARD RAPPAPORT
NOAA/NWS/NCEP National Hurricane Center, Miami, Florida
VIJAY TALLAPRAGADA
NOAA/NWS/NCEP Environmental Modeling Center, College Park, Maryland
(Manuscript received 20 April 2020, in final form 22 June 2020)
ABSTRACT
It has been well documented that the National Hurricane Center (NHC) has made significant im-
provements in Atlantic basin tropical cyclone (TC) track forecasting during the past half century. In
contrast, NHC’s TC intensity forecast errors changed little from the 1970s to the early 2000s. Recently,
however, there has been a notable decrease in TC intensity forecast error and an increase in intensity
forecast skill. This study documents these trends and discusses the advancements in TC intensity
guidance that have led to the improvements in NHC’s intensity forecasts in the Atlantic basin. We
conclude with a brief projection of future capabilities.
1. Introduction
The National Hurricane Center (NHC) makes and
issues public forecasts for tropical depressions, tropical
storms, and hurricanes, henceforth referred to as tropi-
cal cyclones (TCs) collectively, for the Atlantic and
eastern North Pacific basins. Other centers, including
the Central Pacific Hurricane Center, Joint Typhoon
Warning Center, Japan Meteorological Agency, Indian
Meteorological Department, France La Reunion, and
Australian Bureau of Meteorology have similar re-
sponsibilities for TC forecasting for different parts
of the world. NHC has a long history of making TC
forecasts and related products, with the earliest quan-
titative forecasts known to the authors having been
those issued for track for the 1-day (24-h) period beginning
in 1954.1 Since then, NHC has extended the emporal
horizon of its forecasts, currently to five days, and added
predictions of TC intensity, size, and associated hazards,
such as wind, storm surge, and rainfall. In addition, NHC
has increased the lead times for the issuance of tropical
storm and hurricane watches and warnings, and estab-
lished the issuance of storm surge watches and warnings
that are based in part on the forecast to give the public
additional time to prepare for these potentially devas-
tating hazards associated with TCs.
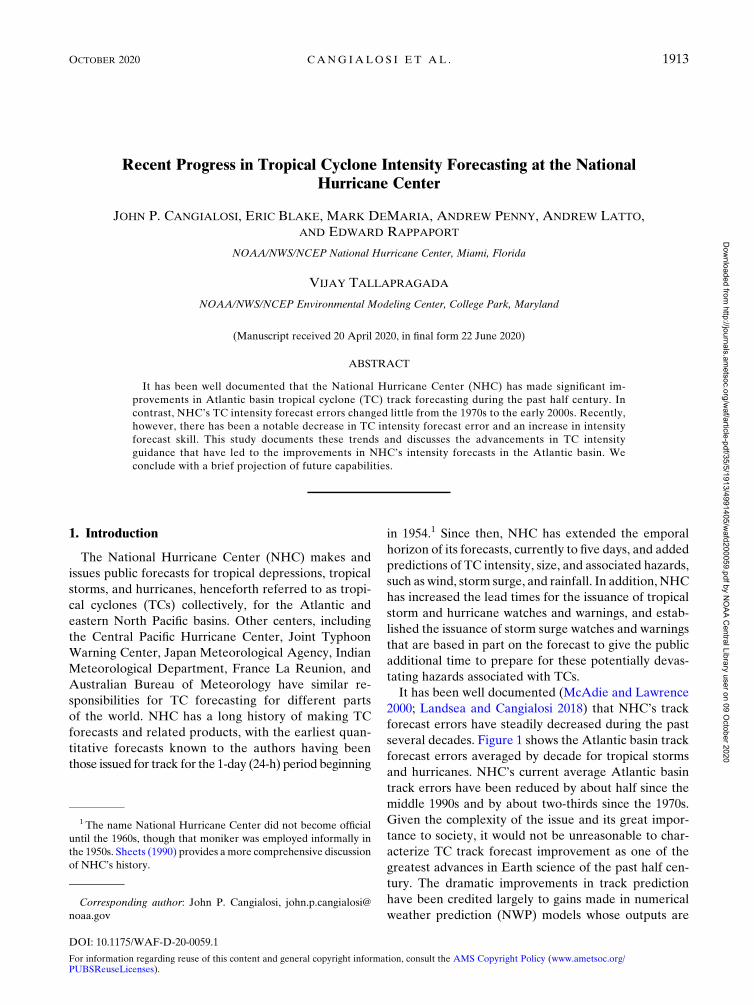
It has been well documented (McAdie and Lawrence
2000; Landsea and Cangialosi 2018) that NHC’s track
forecast errors have steadily decreased during the past
several decades. Figure 1 shows the Atlantic basin track
forecast errors averaged by decade for tropical storms
and hurricanes. NHC’s current average Atlantic basin
track errors have been reduced by about half since the
middle 1990s and by about two-thirds since the 1970s.
Given the complexity of the issue and its great impor-
tance to society, it would not be unreasonable to char-
acterize TC track forecast improvement as one of the
greatest advances in Earth science of the past half cen-
tury. The dramatic improvements in track prediction
have been credited largely to gains made in numerical
weather prediction (NWP) models whose outputs areCorresponding author: John P. Cangialosi, john.p.cangialosi@
noaa.gov
1 The name National Hurricane Center did not become official
until the 1960s, though that moniker was employed informally in
the 1950s. Sheets (1990) provides a more comprehensive discussion
of NHC’s history.
OCTOBER 2020 CANG IALOS I ET AL . 1913
DOI: 10.1175/WAF-D-20-0059.1
For information regarding reuse of this content and general copyright information, consult the AMS Copyright Policy (www.ametsoc.org/PUBSReuseLicenses).
Dow
nloaded from http://journals.am
etsoc.org/waf/article-pdf/35/5/1913/4991405/w
afd200059.pdf by NO
AA Central Library user on 09 O
ctober 2020
provided as guidance to NHC forecasters (Powell and
Aberson 2001; Goerss 2007).
It is important to distinguish between forecast error
and forecast skill. Forecast intensity error is defined as
the absolute value of the difference between the fore-
cast and best track intensity at the forecast verifying
time. Skill in an intensity forecast is assessed using
Decay-SHIFOR5 as the baseline and is expressed as a
percentage improvement over the baseline. The skill of
a forecast sf is given by
sf(%)5 1003 (eb – ef)/eb,
where eb is the error of the baseline model and ef is the
error of the forecast being evaluated. Skill is positive
when the forecast error is smaller than the error from the
baseline. The first step in obtaining the forecast is to run
SHIFOR5 (Jarvinen and Neumann 1979; Knaff et al.
2003). Where the center is forecast to be over land,
SHIFOR5 accounts for land interaction by applying the
decay rate of DeMaria et al. (2006). The application of
the decay component requires a forecast track, which is
given by CLIPER5.
Even though track predictions have been improving
for decades, intensity forecast errors dropped only
slightly from the 1970s through the first decade of the
2000s. During that time period, the advancing tech-
nology and improving NWP track models did not
lead to better intensity forecasts from NHC or the
intensity models. Some details of the evolution of the
intensity models are provided in the following sections.
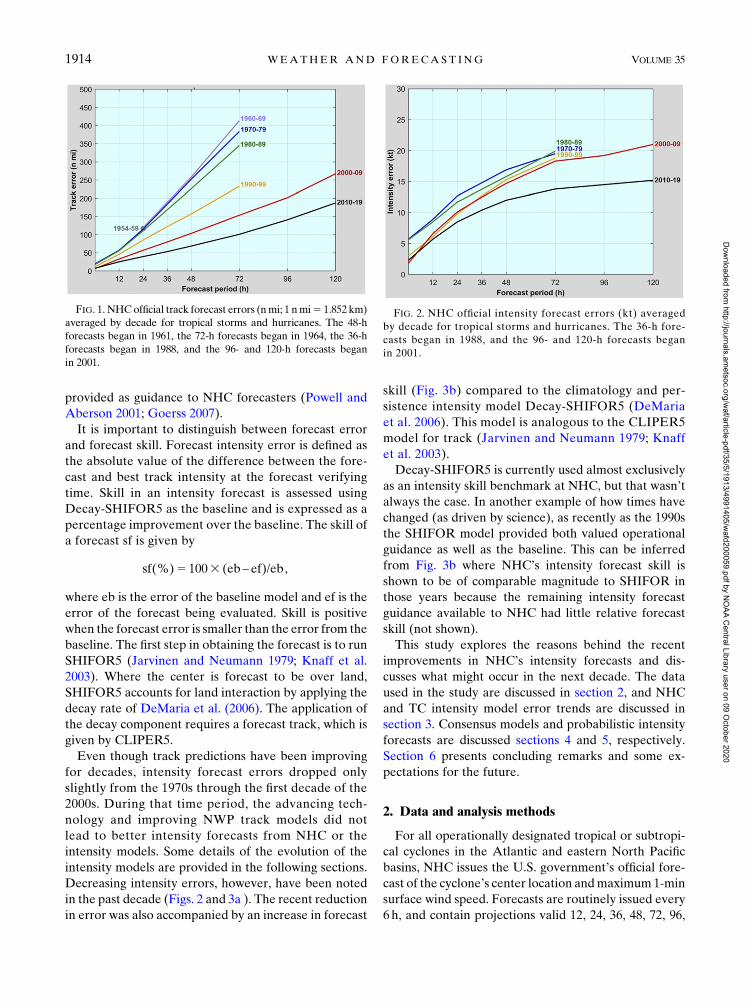
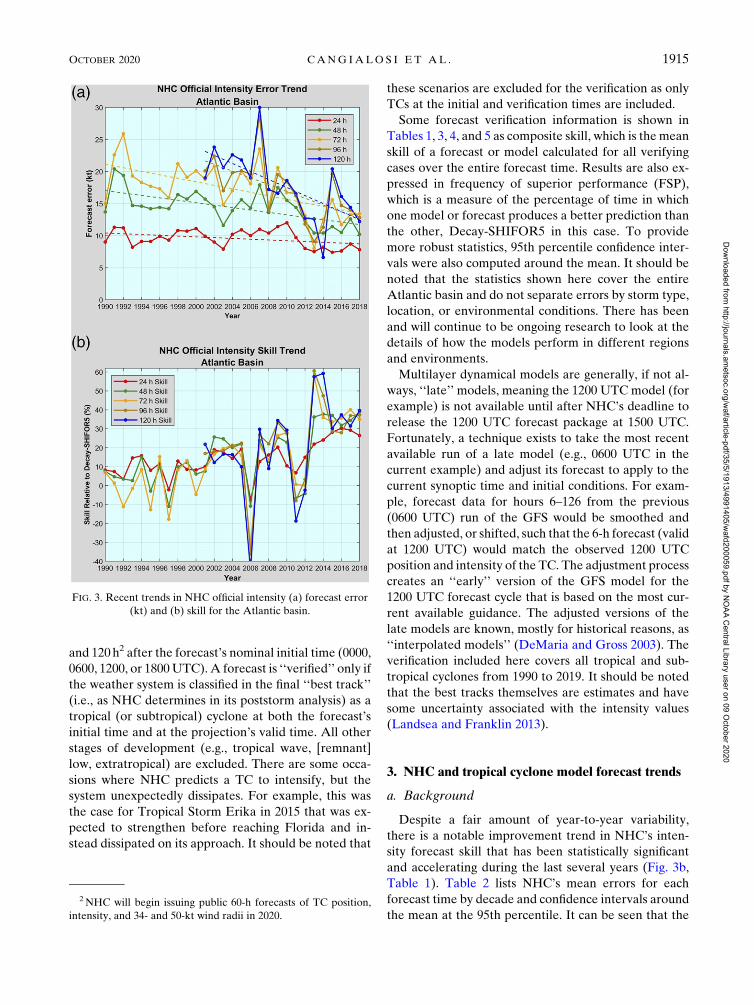
Decreasing intensity errors, however, have been noted
in the past decade (Figs. 2 and 3a ). The recent reduction
in error was also accompanied by an increase in forecast
skill (Fig. 3b) compared to the climatology and per-
sistence intensity model Decay-SHIFOR5 (DeMaria
et al. 2006). This model is analogous to the CLIPER5
model for track (Jarvinen and Neumann 1979; Knaff
et al. 2003).
Decay-SHIFOR5 is currently used almost exclusively
as an intensity skill benchmark at NHC, but that wasn’t
always the case. In another example of how times have
changed (as driven by science), as recently as the 1990s
the SHIFOR model provided both valued operational
guidance as well as the baseline. This can be inferred
from Fig. 3b where NHC’s intensity forecast skill is
shown to be of comparable magnitude to SHIFOR in
those years because the remaining intensity forecast
guidance available to NHC had little relative forecast
skill (not shown).
This study explores the reasons behind the recent
improvements in NHC’s intensity forecasts and dis-
cusses what might occur in the next decade. The data
used in the study are discussed in section 2, and NHC
and TC intensity model error trends are discussed in
section 3. Consensus models and probabilistic intensity
forecasts are discussed sections 4 and 5, respectively.
Section 6 presents concluding remarks and some ex-
pectations for the future.
2. Data and analysis methods
For all operationally designated tropical or subtropi-
cal cyclones in the Atlantic and eastern North Pacific
basins, NHC issues the U.S. government’s official fore-
cast of the cyclone’s center location andmaximum1-min
surface wind speed. Forecasts are routinely issued every
6 h, and contain projections valid 12, 24, 36, 48, 72, 96,
FIG. 1. NHCofficial track forecast errors (nmi; 1 nmi5 1.852 km)
averaged by decade for tropical storms and hurricanes. The 48-h
forecasts began in 1961, the 72-h forecasts began in 1964, the 36-h
forecasts began in 1988, and the 96- and 120-h forecasts began
in 2001.
FIG. 2. NHC official intensity forecast errors (kt) averaged
by decade for tropical storms and hurricanes. The 36-h fore-
casts began in 1988, and the 96- and 120-h forecasts began
in 2001.
1914 WEATHER AND FORECAST ING VOLUME 35
Dow
nloaded from http://journals.am
etsoc.org/waf/article-pdf/35/5/1913/4991405/w
afd200059.pdf by NO
AA Central Library user on 09 O
ctober 2020
and 120h2 after the forecast’s nominal initial time (0000,
0600, 1200, or 1800UTC). A forecast is ‘‘verified’’ only if
the weather system is classified in the final ‘‘best track’’
(i.e., as NHC determines in its poststorm analysis) as a
tropical (or subtropical) cyclone at both the forecast’s
initial time and at the projection’s valid time. All other
stages of development (e.g., tropical wave, [remnant]
low, extratropical) are excluded. There are some occa-
sions where NHC predicts a TC to intensify, but the
system unexpectedly dissipates. For example, this was
the case for Tropical Storm Erika in 2015 that was ex-
pected to strengthen before reaching Florida and in-
stead dissipated on its approach. It should be noted that
these scenarios are excluded for the verification as only
TCs at the initial and verification times are included.
Some forecast verification information is shown in
Tables 1, 3, 4, and 5 as composite skill, which is the mean
skill of a forecast or model calculated for all verifying
cases over the entire forecast time. Results are also ex-
pressed in frequency of superior performance (FSP),
which is a measure of the percentage of time in which
one model or forecast produces a better prediction than
the other, Decay-SHIFOR5 in this case. To provide
more robust statistics, 95th percentile confidence inter-
vals were also computed around the mean. It should be
noted that the statistics shown here cover the entire
Atlantic basin and do not separate errors by storm type,
location, or environmental conditions. There has been
and will continue to be ongoing research to look at the
details of how the models perform in different regions
and environments.
Multilayer dynamical models are generally, if not al-
ways, ‘‘late’’ models, meaning the 1200 UTC model (for
example) is not available until after NHC’s deadline to
release the 1200 UTC forecast package at 1500 UTC.
Fortunately, a technique exists to take the most recent
available run of a late model (e.g., 0600 UTC in the
current example) and adjust its forecast to apply to the
current synoptic time and initial conditions. For exam-
ple, forecast data for hours 6–126 from the previous
(0600 UTC) run of the GFS would be smoothed and
then adjusted, or shifted, such that the 6-h forecast (valid
at 1200 UTC) would match the observed 1200 UTC
position and intensity of the TC. The adjustment process
creates an ‘‘early’’ version of the GFS model for the
1200 UTC forecast cycle that is based on the most cur-
rent available guidance. The adjusted versions of the
late models are known, mostly for historical reasons, as
‘‘interpolated models’’ (DeMaria and Gross 2003). The
verification included here covers all tropical and sub-
tropical cyclones from 1990 to 2019. It should be noted
that the best tracks themselves are estimates and have
some uncertainty associated with the intensity values
(Landsea and Franklin 2013).
3. NHC and tropical cyclone model forecast trends
a. Background
Despite a fair amount of year-to-year variability,
there is a notable improvement trend in NHC’s inten-
sity forecast skill that has been statistically significant
and accelerating during the last several years (Fig. 3b,
Table 1). Table 2 lists NHC’s mean errors for each
forecast time by decade and confidence intervals around
the mean at the 95th percentile. It can be seen that the
FIG. 3. Recent trends in NHC official intensity (a) forecast error
(kt) and (b) skill for the Atlantic basin.
2 NHC will begin issuing public 60-h forecasts of TC position,
intensity, and 34- and 50-kt wind radii in 2020.
OCTOBER 2020 CANG IALOS I ET AL . 1915
Dow
nloaded from http://journals.am
etsoc.org/waf/article-pdf/35/5/1913/4991405/w
afd200059.pdf by NO
AA Central Library user on 09 O
ctober 2020
errors have dropped substantially in the 2010–19 period,
especially after 36 h, as compared to the prior two de-
cades and that the improvements are statistically sig-
nificant. Given the only modest decrease in intensity
forecast errors between 1970 and 2000 (Fig. 2), the 25%–
30% drop in 120-h forecast errors in just the most recent
10 years is especially impressive.
Much like the evolution of track forecast models a
decade or two earlier, there has been a progression
of the most accurate intensity forecast guidance com-
ing from statistical models, then statistical–dynamical
models, and finally dynamical models. As noted previ-
ously, prior to the middle 1990s NHC forecasters used
primarily SHIFOR, a rudimentary statistical model
based on climatology and persistence. Because little
other quantitative intensity guidance existed during that
period, and the limited skill of those models, we have
chosen to restrict the evaluation of the intensity models
to the period from 1996 to 2019. Although the primary
purpose of this paper is to evaluate the progress of the
intensity models, it should be noted that in addition
to the intensity guidance, NHC forecasters evaluate
trends in the available data (i.e., satellite, surface, air-
craft) and incorporate that information into their short-
term predictions.
b. The statistical–dynamical models era: 1996–2006
During the 1996–2006 period, each of the previously
mentioned forms of models made some contribution.
In addition to the purely statistical SHIFOR, whose
relative value began to decrease, NHC relied on a
combination of statistical–dynamical and regional dy-
namical hurricane models to predict TC intensity. During
this time, global NWP models had little skill for intensity
forecasting due in large part to their coarse horizontal
resolution. During the 1990s and 2000s, one of the pri-
mary statistical–dynamical models used by NHC was
the Statistical Hurricane Intensity Prediction Scheme
(SHIPS; DeMaria and Kaplan 1994). The SHIPS model
uses climatological, persistence, and synoptic predictors
in a multiple regression scheme to forecast TC intensity,
with the synoptic environmental conditions provided by
the GFSmodel and its predecessor. SHIPS also includes
predictors from ocean analyses and satellite imagery.
Another model heavily used by NHC during this period
was the Geophysical Fluid Dynamical Laboratory’s
hurricane prediction system (GFDL; Kurihara et al.
1998; Bender et al. 2019), which became operational
in the middle 1990s. The GFDL hurricane model was
the first operational model guidance used at NHC that
attempted to dynamically forecast TC intensity and
structure. From 1996 to 2006, SHIPS and GFDL were
the only forecast models beyond SHIFOR providing
intensity guidance to NHC forecasters. SHIPS had
lower errors than GFDL annually at 48 h for 10 of those
11 years (Fig. 4). Table 3 shows a comparison of the
composite skill and FSP of Decay-SHIFOR5, SHIPS
and GFDL for the 1996–2006 period. This analysis
TABLE 1. Composite intensity skill and the frequency of superior performance of NHC’s official forecast against Decay-SHIFOR5
averaged over the entire forecast period by decade.
Decades
Composite intensity skill of OFCL over
Decay-SHIFOR5
Frequency of superior performance of
OFCL over Decay-SHIFOR5
1990–99 (12–72 h) 9.4% 56.2%
2000–09a 15.7% 59.4%
2010–19 (12–120 h) 23.9% 63.9%
a The 120-h forecasts began in 2001.
TABLE 2. NHC’s mean intensity errors and 95th percent confidence intervals calculated by decade for all forecast times.
Forecast
time (h)
1990–99 mean
intensity
error (kt)
95th percent
confidence
interval (kt)
2000–09a mean
intensity error (kt)
95tha percent
confidence
interval (kt)
2010–19 mean
intensity
error (kt)
95th percent
confidence
interval (kt)
12 6.1 5.8–6.4 6.6 6.3–6.9 5.7 5.4–6.0
24 9.8 9.3–10.3 10.1 9.6–10.6 8.5 8.0–9.0
36 12.7 12.0–13.4 12.5 11.8–13.2 10.4 9.8–11.0
48 15.3 14.4–16.2 14.7 13.9–15.5 12.0 11.3–12.7
72 18.8 17.6–20.0 18.3 17.2–19.4 13.8 12.8–14.8
96 — — 19.3 17.9–20.7 14.5 13.4–16.4
120 — — 21.0 19.3–22.7 15.2 14.0–16.4
a The 96- and 120-h forecasts began in 2001.
1916 WEATHER AND FORECAST ING VOLUME 35
Dow
nloaded from http://journals.am
etsoc.org/waf/article-pdf/35/5/1913/4991405/w
afd200059.pdf by NO
AA Central Library user on 09 O
ctober 2020
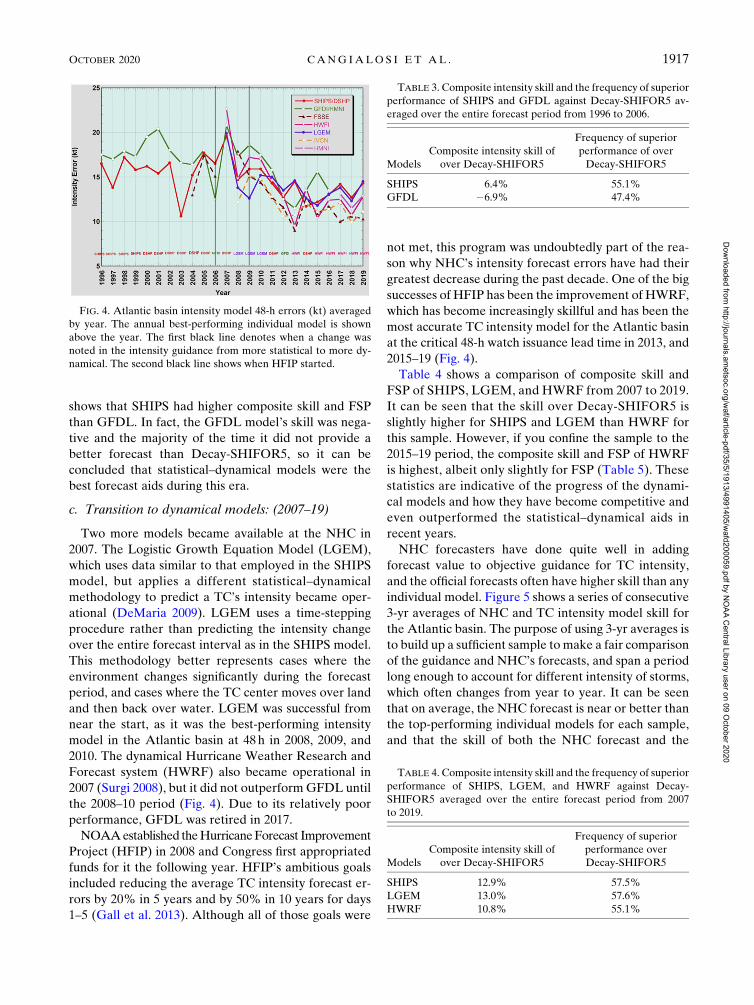
shows that SHIPS had higher composite skill and FSP
than GFDL. In fact, the GFDL model’s skill was nega-
tive and the majority of the time it did not provide a
better forecast than Decay-SHIFOR5, so it can be
concluded that statistical–dynamical models were the
best forecast aids during this era.
c. Transition to dynamical models: (2007–19)
Two more models became available at the NHC in
2007. The Logistic Growth Equation Model (LGEM),
which uses data similar to that employed in the SHIPS
model, but applies a different statistical–dynamical
methodology to predict a TC’s intensity became oper-
ational (DeMaria 2009). LGEM uses a time-stepping
procedure rather than predicting the intensity change
over the entire forecast interval as in the SHIPS model.
This methodology better represents cases where the
environment changes significantly during the forecast
period, and cases where the TC center moves over land
and then back over water. LGEM was successful from
near the start, as it was the best-performing intensity
model in the Atlantic basin at 48 h in 2008, 2009, and
2010. The dynamical Hurricane Weather Research and
Forecast system (HWRF) also became operational in
2007 (Surgi 2008), but it did not outperformGFDL until
the 2008–10 period (Fig. 4). Due to its relatively poor
performance, GFDL was retired in 2017.
NOAAestablished theHurricaneForecast Improvement
Project (HFIP) in 2008 and Congress first appropriated
funds for it the following year. HFIP’s ambitious goals
included reducing the average TC intensity forecast er-
rors by 20% in 5 years and by 50% in 10 years for days
1–5 (Gall et al. 2013). Although all of those goals were
not met, this program was undoubtedly part of the rea-
son why NHC’s intensity forecast errors have had their
greatest decrease during the past decade. One of the big
successes of HFIP has been the improvement of HWRF,
which has become increasingly skillful and has been the
most accurate TC intensity model for the Atlantic basin
at the critical 48-h watch issuance lead time in 2013, and
2015–19 (Fig. 4).
Table 4 shows a comparison of composite skill and
FSP of SHIPS, LGEM, and HWRF from 2007 to 2019.
It can be seen that the skill over Decay-SHIFOR5 is
slightly higher for SHIPS and LGEM than HWRF for
this sample. However, if you confine the sample to the
2015–19 period, the composite skill and FSP of HWRF
is highest, albeit only slightly for FSP (Table 5). These
statistics are indicative of the progress of the dynami-
cal models and how they have become competitive and
even outperformed the statistical–dynamical aids in
recent years.
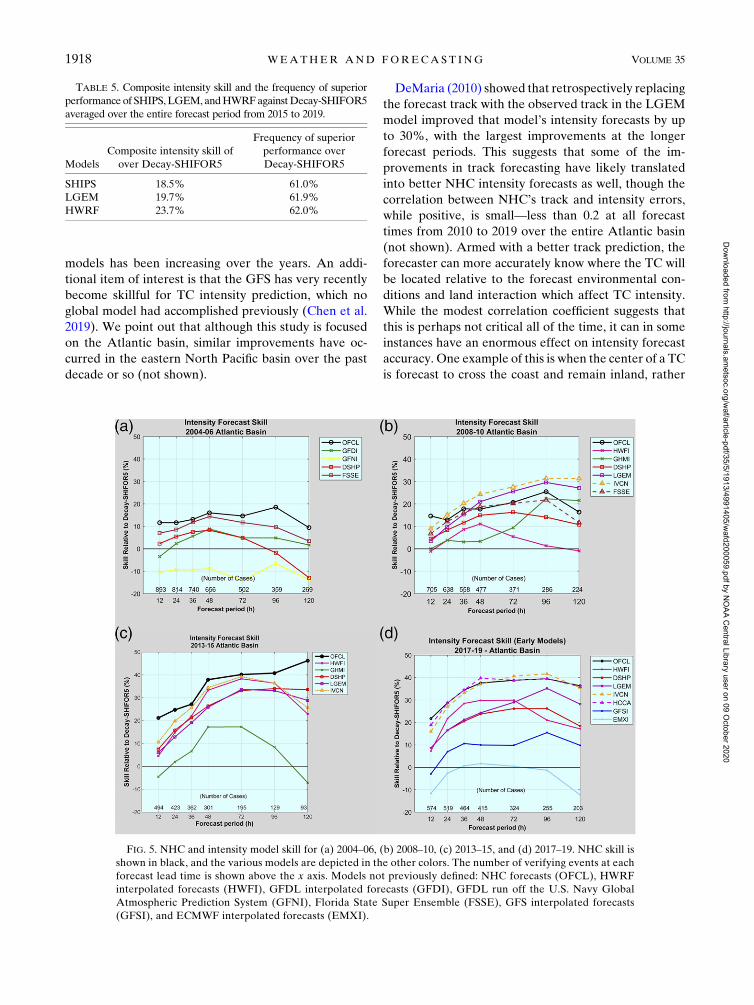
NHC forecasters have done quite well in adding
forecast value to objective guidance for TC intensity,
and the official forecasts often have higher skill than any
individual model. Figure 5 shows a series of consecutive
3-yr averages of NHC and TC intensity model skill for
the Atlantic basin. The purpose of using 3-yr averages is
to build up a sufficient sample to make a fair comparison
of the guidance and NHC’s forecasts, and span a period
long enough to account for different intensity of storms,
which often changes from year to year. It can be seen
that on average, the NHC forecast is near or better than
the top-performing individual models for each sample,
and that the skill of both the NHC forecast and the
FIG. 4. Atlantic basin intensity model 48-h errors (kt) averaged
by year. The annual best-performing individual model is shown
above the year. The first black line denotes when a change was
noted in the intensity guidance from more statistical to more dy-
namical. The second black line shows when HFIP started.
TABLE 3. Composite intensity skill and the frequency of superior
performance of SHIPS and GFDL against Decay-SHIFOR5 av-
eraged over the entire forecast period from 1996 to 2006.
Models
Composite intensity skill of
over Decay-SHIFOR5
Frequency of superior
performance of over
Decay-SHIFOR5
SHIPS 6.4% 55.1%
GFDL 26.9% 47.4%
TABLE 4. Composite intensity skill and the frequency of superior
performance of SHIPS, LGEM, and HWRF against Decay-
SHIFOR5 averaged over the entire forecast period from 2007
to 2019.
Models
Composite intensity skill of
over Decay-SHIFOR5
Frequency of superior
performance over
Decay-SHIFOR5
SHIPS 12.9% 57.5%
LGEM 13.0% 57.6%
HWRF 10.8% 55.1%
OCTOBER 2020 CANG IALOS I ET AL . 1917
Dow
nloaded from http://journals.am
etsoc.org/waf/article-pdf/35/5/1913/4991405/w
afd200059.pdf by NO
AA Central Library user on 09 O
ctober 2020
models has been increasing over the years. An addi-
tional item of interest is that the GFS has very recently
become skillful for TC intensity prediction, which no
global model had accomplished previously (Chen et al.
2019). We point out that although this study is focused
on the Atlantic basin, similar improvements have oc-
curred in the eastern North Pacific basin over the past
decade or so (not shown).
DeMaria (2010) showed that retrospectively replacing
the forecast track with the observed track in the LGEM
model improved that model’s intensity forecasts by up
to 30%, with the largest improvements at the longer
forecast periods. This suggests that some of the im-
provements in track forecasting have likely translated
into better NHC intensity forecasts as well, though the
correlation between NHC’s track and intensity errors,
while positive, is small—less than 0.2 at all forecast
times from 2010 to 2019 over the entire Atlantic basin
(not shown). Armed with a better track prediction, the
forecaster can more accurately know where the TC will
be located relative to the forecast environmental con-
ditions and land interaction which affect TC intensity.
While the modest correlation coefficient suggests that
this is perhaps not critical all of the time, it can in some
instances have an enormous effect on intensity forecast
accuracy. One example of this is when the center of a TC
is forecast to cross the coast and remain inland, rather
TABLE 5. Composite intensity skill and the frequency of superior
performance of SHIPS, LGEM,andHWRFagainstDecay-SHIFOR5
averaged over the entire forecast period from 2015 to 2019.
Models
Composite intensity skill of
over Decay-SHIFOR5
Frequency of superior
performance over
Decay-SHIFOR5
SHIPS 18.5% 61.0%
LGEM 19.7% 61.9%
HWRF 23.7% 62.0%
FIG. 5. NHC and intensity model skill for (a) 2004–06, (b) 2008–10, (c) 2013–15, and (d) 2017–19. NHC skill is
shown in black, and the various models are depicted in the other colors. The number of verifying events at each
forecast lead time is shown above the x axis. Models not previously defined: NHC forecasts (OFCL), HWRF
interpolated forecasts (HWFI), GFDL interpolated forecasts (GFDI), GFDL run off the U.S. Navy Global
Atmospheric Prediction System (GFNI), Florida State Super Ensemble (FSSE), GFS interpolated forecasts
(GFSI), and ECMWF interpolated forecasts (EMXI).
1918 WEATHER AND FORECAST ING VOLUME 35
Dow
nloaded from http://journals.am
etsoc.org/waf/article-pdf/35/5/1913/4991405/w
afd200059.pdf by NO
AA Central Library user on 09 O
ctober 2020
than staying offshore (or vice versa), because a TC’s
maximum wind speed decreases typically by around
50% during the first 12 h after the center crosses the
coastline and remains inland. Forecasting the center to
be on the ‘‘wrong’’ side of the coast can result in very
large intensity forecast errors.
4. Consensus models
a. Background
In NHC’s early years its forecasters were challenged
by having fewNWPmodels available to consider in their
efforts to produce the best official forecast. As the
number of skillful track forecast models increased in the
1970s–90s, however, they became faced with a new
challenge: how to make the best use of multiple models
that sometimes provided a wide geographical range of
guidance tracks. Lacking a priori knowledge of which
model outcomes were likely to be the most accurate,
NHC usually forecast the track to be within the geo-
graphic spread of the typically best-performing models,
often not far from the middle as they could determine
subjectively. The forecasters came to realize that that
approach over the long haul led to smaller errors than of
any of the individual models. Software was then devel-
oped to provide to the forecaster arithmetic averages of
the typically best-performing computer model forecasts
(Sampson and Schrader 2000). These so-called consen-
sus models have led the way in track forecasting accu-
racy during most of the past 15 years.
Beginning in 2008, NHC had a sufficient number of
intensity models to create an intensity consensus. There
are today two types of consensus aids. Both are discussed
below and each has its advantages. A ‘‘simple’’ consensus
model equally weights each member (Sampson et al.
2008). A corrected consensus often weights models dif-
ferently and considers past error characteristics in at-
tempting to correct for member biases.
b. Simple consensus models—Intensity variablemodel consensus (IVCN)
The intensity variable consensus model (IVCN) was
one of the first simple consensus aids used in NHC
operations. In 2008, the makeup of IVCN was a four-
member average of SHIPS, LGEM, and the interpo-
lated early versions of the GFDL and HWRF models.
The consensus model was quite successful that year, as it
had more skill than any of individual members and
slightly more skill than NHC (Fig. 4) (Franklin 2009).
It should be mentioned that IVCN is a variable con-
sensusmodel, meaning the composition of the consensus
changes based on model availability. For example, it is
sometimes the case that the 120-h forecast is based on
a different set of members than the 12-h forecast. At
the conclusion of every hurricane season, NHC evalu-
ates IVCN, looks at the performance of alternatives,
and makes adjustments accordingly. As of this writing,
IVCN is a five-member model that includes equal
weighting of SHIPS, LGEM, and the interpolated early
versions of HWRF, Hurricanes in a Multiscale Ocean–
Coupled Nonhydrostatic model (HMON), and the ver-
sion of the U.S. Navy’s Coupled Ocean–Atmosphere
Mesoscale Prediction System for TCs that uses GFS
initial and boundary conditions (CTCX). Because of the
improvement in the dynamical models (e.g., Fig. 5), a
new consensus aid, IVDR, was first computed at NHC in
2018. The composition of this model includes a double-
weight for the interpolated versions of CTCX, HWRF,
and HMON, and single weight for the interpolated
version of GFS, SHIPS, and LGEM. During the past
couple of hurricane seasons, IVDR has generally had
slightly more skill than IVCN (not shown).
c. Corrected consensus models—HFIP correctedconsensus approach (HCCA)
Beginning in 2015, the HFIP corrected consensus
approach (HCCA) was implemented at NHC to provide
‘‘in-house’’ track and intensity forecast guidance (Simon
et al. 2018). The consensus is broadly based on the
technique used in the Florida State Superensemble (see
Krishnamurti et al. 1999, 2010, 2011, and Williford et al.
2003) but specifically tailored to NHC’s operational
constraints. Since 2015, HCCA has been one of the best
performing guidance models for track and intensity in
the Atlantic basin (Fig. 5d).
The HCCA intensity forecasts rely on a mix of
statistical–dynamical and dynamical model forecasts
that are basin specific. Unequal weighting coefficients
are derived from a set of training forecasts and applied
to the input model predictions to create the HCCA fore-
cast. To allow for operational flexibility, a forecast-specific
training set is created in real time tomatch the inputmodel
availability of the current forecast. Based on input model
sensitivity experiments, the HWRF and CTCX forecasts
currently make the largest contribution to the positive
skill of the HCCA intensity forecasts in the Atlantic basin.
It is hoped that continued improvement of the equally
weighted and corrected consensus aids will allow for fur-
ther improvements in skill of the NHC intensity forecasts.
5. Probabilistic intensity guidance and rapidintensification
Although the statistical–dynamical models have im-
proved over the past two decades, they rarely predict
OCTOBER 2020 CANG IALOS I ET AL . 1919
Dow
nloaded from http://journals.am
etsoc.org/waf/article-pdf/35/5/1913/4991405/w
afd200059.pdf by NO
AA Central Library user on 09 O
ctober 2020
rapid intensity changes. Also, the limited horizontal
resolution of the GFDL and early versions of the
HWRF model restricted the ability of these two models
to predict large changes. Without reliable guidance, the
NHC official forecast rarely included large changes in
intensity (Blake et al. 2016). To partially address the
limitation of the statistical-dynamical models, a new
component was added to the SHIPS model called the
rapid intensification index (RII), beginning in 2001
(Kaplan and DeMaria 2003). Rapid intensification (RI)
was defined as a 30-kt (1 kt ’ 0.51m s21) or greater in-
crease in the maximum wind speed in 24h, based
roughly on the 95th percentile of the observed inten-
sity changes in the Atlantic basin. The RII treats RI
forecasting as a classification problem, where a subset
of the SHIPS predictors are used to discriminate RI
cases from non-RI cases. The output of the RII is a
probability of rapid intensification, which forecasters
subjectively use to supplement deterministic model
output. The RII has improved since the initial 2001
version (Kaplan et al. 2015).
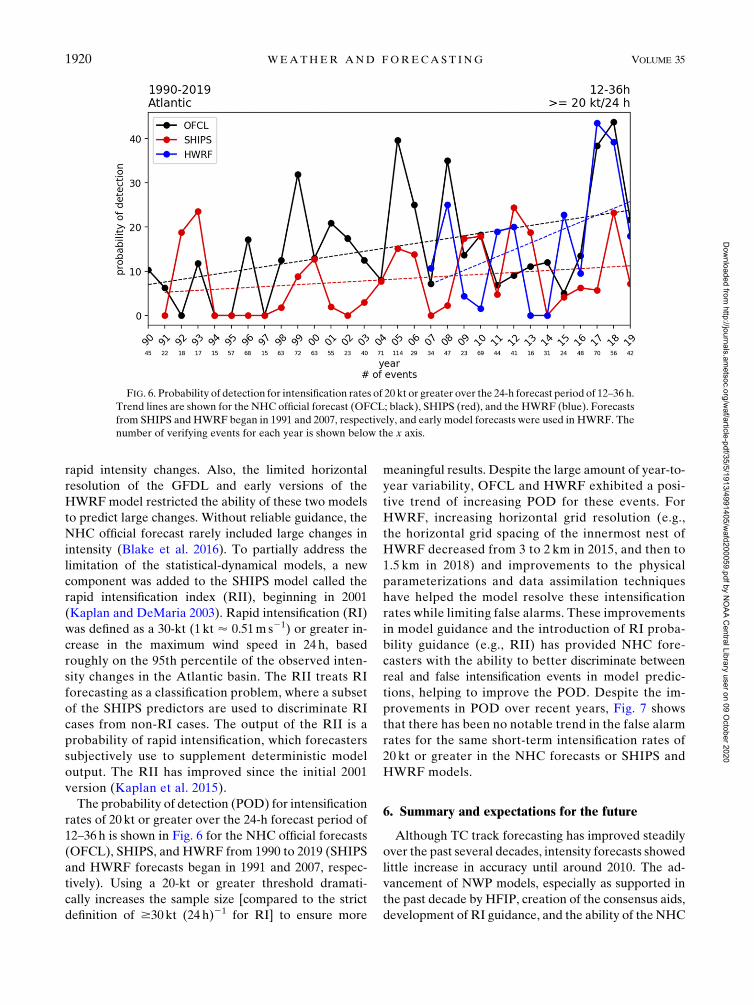
The probability of detection (POD) for intensification
rates of 20 kt or greater over the 24-h forecast period of
12–36 h is shown in Fig. 6 for the NHC official forecasts
(OFCL), SHIPS, and HWRF from 1990 to 2019 (SHIPS
and HWRF forecasts began in 1991 and 2007, respec-
tively). Using a 20-kt or greater threshold dramati-
cally increases the sample size [compared to the strict
definition of $30kt (24 h)21 for RI] to ensure more
meaningful results. Despite the large amount of year-to-
year variability, OFCL and HWRF exhibited a posi-
tive trend of increasing POD for these events. For
HWRF, increasing horizontal grid resolution (e.g.,
the horizontal grid spacing of the innermost nest of
HWRF decreased from 3 to 2 km in 2015, and then to
1.5 km in 2018) and improvements to the physical
parameterizations and data assimilation techniques
have helped the model resolve these intensification
rates while limiting false alarms. These improvements
in model guidance and the introduction of RI proba-
bility guidance (e.g., RII) has provided NHC fore-
casters with the ability to better discriminate between
real and false intensification events in model predic-
tions, helping to improve the POD. Despite the im-
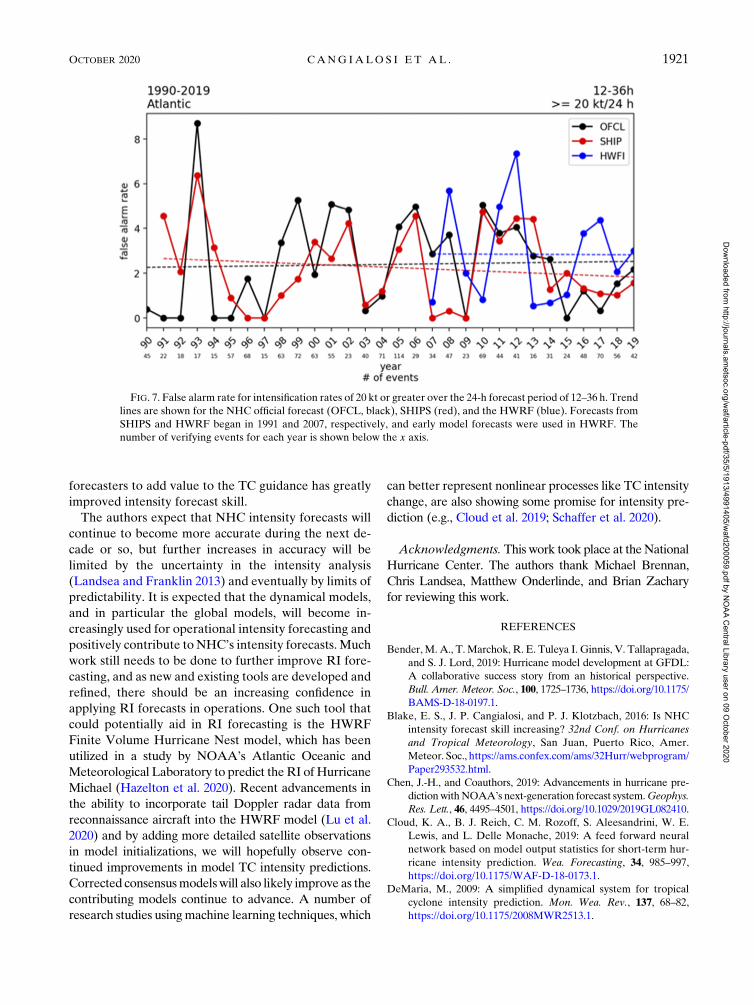
provements in POD over recent years, Fig. 7 shows
that there has been no notable trend in the false alarm
rates for the same short-term intensification rates of
20 kt or greater in the NHC forecasts or SHIPS and
HWRF models.
6. Summary and expectations for the future
Although TC track forecasting has improved steadily
over the past several decades, intensity forecasts showed
little increase in accuracy until around 2010. The ad-
vancement of NWP models, especially as supported in
the past decade by HFIP, creation of the consensus aids,
development of RI guidance, and the ability of the NHC
FIG. 6. Probability of detection for intensification rates of 20 kt or greater over the 24-h forecast period of 12–36 h.
Trend lines are shown for the NHC official forecast (OFCL; black), SHIPS (red), and the HWRF (blue). Forecasts
from SHIPS and HWRF began in 1991 and 2007, respectively, and early model forecasts were used in HWRF. The
number of verifying events for each year is shown below the x axis.
1920 WEATHER AND FORECAST ING VOLUME 35
Dow
nloaded from http://journals.am
etsoc.org/waf/article-pdf/35/5/1913/4991405/w
afd200059.pdf by NO
AA Central Library user on 09 O
ctober 2020
forecasters to add value to the TC guidance has greatly
improved intensity forecast skill.
The authors expect that NHC intensity forecasts will
continue to become more accurate during the next de-
cade or so, but further increases in accuracy will be
limited by the uncertainty in the intensity analysis
(Landsea and Franklin 2013) and eventually by limits of
predictability. It is expected that the dynamical models,
and in particular the global models, will become in-
creasingly used for operational intensity forecasting and
positively contribute to NHC’s intensity forecasts. Much
work still needs to be done to further improve RI fore-
casting, and as new and existing tools are developed and
refined, there should be an increasing confidence in
applying RI forecasts in operations. One such tool that
could potentially aid in RI forecasting is the HWRF
Finite Volume Hurricane Nest model, which has been
utilized in a study by NOAA’s Atlantic Oceanic and
Meteorological Laboratory to predict the RI ofHurricane
Michael (Hazelton et al. 2020). Recent advancements in
the ability to incorporate tail Doppler radar data from
reconnaissance aircraft into the HWRF model (Lu et al.
2020) and by adding more detailed satellite observations
in model initializations, we will hopefully observe con-
tinued improvements in model TC intensity predictions.
Corrected consensusmodelswill also likely improve as the
contributing models continue to advance. A number of
research studies usingmachine learning techniques, which
can better represent nonlinear processes like TC intensity
change, are also showing some promise for intensity pre-
diction (e.g., Cloud et al. 2019; Schaffer et al. 2020).
Acknowledgments. This work took place at theNational
Hurricane Center. The authors thank Michael Brennan,
Chris Landsea, Matthew Onderlinde, and Brian Zachary
for reviewing this work.
REFERENCES
Bender,M. A., T.Marchok, R. E. Tuleya I. Ginnis, V. Tallapragada,
and S. J. Lord, 2019: Hurricane model development at GFDL:
A collaborative success story from an historical perspective.
Bull. Amer. Meteor. Soc., 100, 1725–1736, https://doi.org/10.1175/
BAMS-D-18-0197.1.
Blake, E. S., J. P. Cangialosi, and P. J. Klotzbach, 2016: Is NHC
intensity forecast skill increasing? 32nd Conf. on Hurricanes
and Tropical Meteorology, San Juan, Puerto Rico, Amer.
Meteor. Soc., https://ams.confex.com/ams/32Hurr/webprogram/
Paper293532.html.
Chen, J.-H., and Coauthors, 2019: Advancements in hurricane pre-
dictionwithNOAA’s next-generation forecast system.Geophys.
Res. Lett., 46, 4495–4501, https://doi.org/10.1029/2019GL082410.
Cloud, K. A., B. J. Reich, C. M. Rozoff, S. Aleesandrini, W. E.
Lewis, and L. Delle Monache, 2019: A feed forward neural
network based on model output statistics for short-term hur-
ricane intensity prediction. Wea. Forecasting, 34, 985–997,
https://doi.org/10.1175/WAF-D-18-0173.1.
DeMaria, M., 2009: A simplified dynamical system for tropical
cyclone intensity prediction. Mon. Wea. Rev., 137, 68–82,
https://doi.org/10.1175/2008MWR2513.1.
FIG. 7. False alarm rate for intensification rates of 20 kt or greater over the 24-h forecast period of 12–36 h. Trend
lines are shown for the NHC official forecast (OFCL, black), SHIPS (red), and the HWRF (blue). Forecasts from
SHIPS and HWRF began in 1991 and 2007, respectively, and early model forecasts were used in HWRF. The
number of verifying events for each year is shown below the x axis.
OCTOBER 2020 CANG IALOS I ET AL . 1921
Dow
nloaded from http://journals.am
etsoc.org/waf/article-pdf/35/5/1913/4991405/w
afd200059.pdf by NO
AA Central Library user on 09 O
ctober 2020
——, 2010: Tropical cyclone intensity change predictability esti-
mates using a statistical-dynamical model. 29th Conf. on
Hurricanes and Tropical Meteorology, Tucson, AZ, Amer.
Meteor. Soc., 9C.5, https://ams.confex.com/ams/29Hurricanes/
techprogram/paper_167916.htm.
——, and J. Kaplan, 1994: A Statistical Hurricane Intensity
Prediction Scheme (SHIPS) for the Atlantic basin. Wea.
Forecasting, 9, 209–220, https://doi.org/10.1175/1520-0434(1994)009%3C0209:ASHIPS%3E2.0.CO;2.
——, and J. M. Gross, 2003: Evolution of tropical cyclone forecast
model.Hurricane! Coping with Disaster: Progress and Challenges
sinceGalveston 1900, Robert Simpson et al. Eds.,Wiley, 103–126.
——, J. A. Knaff, and J. Kaplan, 2006: On the decay of tropical
cyclone winds crossing narrow landmasses. J. Appl. Meteor.
Climatol., 45, 491–499, https://doi.org/10.1175/JAM2351.1.
Franklin, J. L., 2009: 2008 National Hurricane Center forecast verifi-
cation report. NOAA/National Hurricane Center Rep. 71 pp.,
https://www.nhc.noaa.gov/verification/pdfs/Verification_2008.pdf.
Gall, R., J. Franklin, F. Marks, E. N. Rappaport, and F. Toepfer,
2013: The Hurricane Forecast Improvement Project. Bull.
Amer.Meteor. Soc., 94, 329–343, https://doi.org/10.1175/BAMS-
D-12-00071.1.
Goerss, J. S., 2007: Prediction of consensus tropical cyclone track
forecast error. Mon. Wea. Rev., 135, 1985–1993, https://doi.org/
10.1175/MWR3390.1.
Hazelton, A., X. Zhang, S. Gopalakrishnan, W. Ramstrom,
F. Marks, and J. Zhang, 2020: High-resolution ensemble
HVF3 forecasts of Hurricane Michael (2018): Rapid intensi-
fication in shear. Mon. Wea. Rev., 148, 2009–2032, https://
doi.org/10.1175/MWR-D-19-0275.1.
Jarvinen, B. R., and C. J. Neumann, 1979: Statistical forecasts of
tropical cyclone intensity for the North Atlantic basin. NOAA
Tech. Memo. NWS NHC-10, 22 pp.
Kaplan, J., and M. DeMaria, 2003: Large-scale characteristics of
rapidly intensifying tropical cyclones in the North Atlantic
basin. Wea. Forecasting, 18, 1093–1108, https://doi.org/10.1175/
1520-0434(2003)018,1093:LCORIT.2.0.CO;2.
——, and Coauthors, 2015: Evaluating environmental impacts on
tropical cyclone rapid intensification predictability utilizing
statistical models. Wea. Forecasting, 30, 1374–1396, https://
doi.org/10.1175/WAF-D-15-0032.1.
Knaff, J. A., M. DeMaria, B. Sampson, and J. M. Gross, 2003:
Statistical, 5-day tropical cyclone intensity forecasts derived from
climatology and persistence.Wea. Forecasting, 18, 80–92, https://
doi.org/10.1175/1520-0434(2003)018,0080:SDTCIF.2.0.CO;2.
Krishnamurti, T. N., C. M. Kishtawal, T. LaRow, D. Bachiochi,
Z. Zhang, C. E. Williford, S. Gadgil, and S. Surendran, 1999:
Improved weather and seasonal climate forecasts from multi-
model superensemble. Science, 285, 1548–1550, https://doi.org/10.1126/science.285.5433.1548.
——, S. Pattnaik, M. K. Biswas, E. Bensman, M. Kramer, N. Surgi,
and T. S. V. V. Kumar, 2010: Hurricane forecasts with a
mesoscale suite of models. Tellus, 62A, 633–646, https://doi.org/
10.1111/j.1600-0870.2010.00469.x.
——, M. K. Biswas, B. P. Mackey, R. G. Ellingson, and P. H.
Ruscher, 2011: Hurricane forecasts using a suite of large-scale
models. Tellus, 63A, 727–745, https://doi.org/10.1111/j.1600-
0870.2011.00519.x.
Kurihara, Y., R. E. Tuleya, and M. A. Bender, 1998: The GFDL
hurricane prediction system and its performance in the 1995
hurricane season. Mon. Wea. Rev., 126, 1306–1322, https://
doi.org/10.1175/1520-0493(1998)126,1306:TGHPSA.2.0.CO;2.
Landsea, C. W., and J. L. Franklin, 2013: Atlantic hurricane da-
tabase uncertainty and presentation of a new database for-
mat. Mon. Wea. Rev., 141, 3576–3592, https://doi.org/10.1175/
MWR-D-12-00254.1.
——, and J. P. Cangialosi, 2018: Have we reached the limits of
predictability for tropical cyclone track forecasting? Bull.
Meteor. Amer. Soc., 99, 2237–2243, https://doi.org/10.1175/
BAMS-D-17-0136.1.
Lu, X., and W. Xuguang, 2020: Improving hurricane analyses and
predictions with TCI, IFEX field campaign observations, and
CIMSS AMVs using the advanced hybrid data assimilation
system for HWRF. Part II: Observation impacts on the anal-
ysis and Prediction of Patricia (2015). Mon. Wea. Rev., 148,
1407–1430, https://doi.org/10.1175/MWR-D-19-0075.1.
McAdie, C. J., and M. B. Lawrence, 2000: Improvements to trop-
ical cyclone track forecasting in the Atlantic basin, 1970–98.
Bull. Amer. Meteor. Soc., 81, 989–998, https://doi.org/10.1175/
1520-0477(2000)081,0989:IITCTF.2.3.CO;2.
Powell, M. D., and S. D. Aberson, 2001: Accuracy of United States
tropical cyclone landfall forecasts in the Atlantic basin, 1976–
2000. Bull. Amer. Meteor. Soc., 82, 2749–2767, https://doi.org/
10.1175/1520-0477(2001)082,2749:AOUSTC.2.3.CO;2.
Sampson, C. R., andA. J. Schrader, 2000: TheAutomated Tropical
Cyclone Forecasting System (version 3.2).Bull. Amer.Meteor.
Soc., 81, 1231–1240, https://doi.org/10.1175/1520-0477(2000)
081,1231:TATCFS.2.3.CO;2.
——, J. L. Franklin, J. A. Knaff, and M. DeMaria, 2008:
Experiments with a simple tropical cyclone intensity con-
sensus. Wea. Forecasting, 23, 304–312, https://doi.org/10.1175/
2007WAF2007028.1.
Schaffer, J. D., P. J. Roebber, and C. Evans, 2020: Development
and evaluation of an evolutionary programming-based tropi-
cal cyclone intensity model. Mon. Wea. Rev., 148, 1951–1970,
https://doi.org/10.1175/MWR-D-19-0346.1.
Sheets, R. C., 1990: TheNationalHurricaneCenter—Past, present,
and future. Wea. Forecasting, 5, 185–232, https://doi.org/
10.1175/1520-0434(1990)005,0185:TNHCPA.2.0.CO;2.
Simon, A., A. B. Penny, M. DeMaria, J. L. Franklin, R. J. Pasch,
E. N. Rappaport, andD. A. Zelinsky, 2018: A description of the
real-time HFIP Corrected Consensus Approach (HCCA) for
tropical cyclone track and intensity guidance.Wea. Forecasting,
33, 37–57, https://doi.org/10.1175/WAF-D-17-0068.1.
Surgi, N., 2008: Advanced hurricane prediction at NCEP’s
EnvironmentalModel Center: The operational implementation
of the HWRF. NCEP, 32 pp.
Williford, C. E., T. N. Krishnamurti, R. C. Torres, S. Cocke,
Z. Christidis, and T. S. V. Kumar, 2003: Real-time multimodel
superensemble forecasts of Atlantic tropical systems of 1999.
Mon.Wea. Rev., 131, 1878–1894, https://doi.org/10.1175//2571.1.
1922 WEATHER AND FORECAST ING VOLUME 35
Dow
nloaded from http://journals.am
etsoc.org/waf/article-pdf/35/5/1913/4991405/w
afd200059.pdf by NO
AA Central Library user on 09 O
ctober 2020


![Ocean heat content for tropical cyclone intensity forecasting and …homepage.ntu.edu.tw/.../201304_iilin_[Nat_Hazards].pdf · 2018-07-13 · ORIGINAL PAPER Ocean heat content for](https://static.fdocuments.net/doc/165x107/5f5ddfea76bf8e08335d2385/ocean-heat-content-for-tropical-cyclone-intensity-forecasting-and-nathazardspdf.jpg)