U.S. Port and Inland Waterway Modernization Strategy .... Port and Inland Waterway Modernization...
30
U.S. Port and Inland Waterway Modernization Strategy: Options for the Future Galveston, Texas 8M h 2012 8 March 2012 Kevin Knight Economist Economist Institute for Water Resources BUILDING STRONG ®
Transcript of U.S. Port and Inland Waterway Modernization Strategy .... Port and Inland Waterway Modernization...

U.S. Port and Inland Waterway Modernization Strategy: Options for the Futuregy
Galveston, Texas8 M h 20128 March 2012
Kevin KnightEconomistEconomist
Institute for Water Resources
BUILDING STRONG®

The U S Navigation SystemThe U.S. Navigation System
Kalama P
Seattle
St. Paul
PortlandLewiston
Kalama
AlbanyLa Crosse
VancouverClarkston
Pasco
Umatilla
Boston
New York /New Jersey
H ti t
Indiana Hbr
Cincinnati
Chicago Pittsburgh
La Crosse
Omaha
K Cit
Quad CitiesDubuque
Milwaukee
Parkersburg
Sacramento
Oakland
NorfolkSt. LouisHuntington
MemphisWilmington
Tulsa
Little Rock Decatur Chattanooga
KnoxvilleNashville
LouisvilleMt. Vernon
Paducah
Kansas City
Los AngelesLong Beach
Houston
Baton Rouge
Texas City
Lake Charles
Tampa
JacksonvilleSavannah
Charleston
Pascagoula
Mobile
Little RockBirmingham
Decatur
ShreveportVicksburg
Panama City
Corpus ChristiS. Louisiana
New Orleans
y
PlaqueminesTampa
BeaumontPort ArthurFreeport
Port Everglades
MatagordaGulfport

NavigationInland and Intracoastal Waterwaysy• 12,000 miles; 9’ – 14’• 240 Lock Chambers
630 million tons ann all 50%• 630 million tons annually; ~50% coal & petroleum
• Grain Exports >70 m tons/yr• 50% of grain, soybeans &
prepared feed exports by barge
Coastal Harbors• 300 major seaports; 2 billion
short tons annually; 95% of yimport/export
• Over 700 small harbors; 600 million tons annuallyy
• 13 million US jobs

Forecast Total World Container Trade
2000 - 2024 Doubled from 60 illi TEU imillion TEUs in
2000 to about 120 million in 2008
Slight decline forecast in 2009
Million TEUs
forecast in 2009 Renewed growth to
about 260 million TEUs by 2024
That is down 40
Decline fromPrevious forecast
That is down 40 million TEU from earlier forecasts
BUILDING STRONG®Source: IHS Global Insight, Inc. Dec 08

Forecast: U.S. Trade More Than Doubles2008 - 2028
60
70Millions of TEUs
40
50
60
20
30
0
10
2008 2010 2012 2014 2016 2018 2020 2022 2024 2026 20282008 2010 2012 2014 2016 2018 2020 2022 2024 2026 2028
Imports Exports TotalSource: I H S G I World Trade Service
BUILDING STRONG®

Ever Larger ContainershipsDriving Need for Ever Larger ChannelsDriving Need for Ever Larger Channels
Pre 1970
1970-19802,305 TEU
10-11
19853,220 TEU
11-13
1986-20004,848 TEU
13-17
2000-20058,600+ TEU
17-22 Pre-19701,700 TEU
<10 Containers
Wide
Containers Wide
Containers Wide
Containers Wide
Containers Wide
SEALEVEL
33’<30’> 46’42’-46’38’-42’33’<30
BUILDING STRONG®

BUILDING STRONG®7

U.S. Port and Inland Waterways Modernization StrategyWorld Fleet: Historical and Forecasted Fully Cellular
Container Vessels
7 000
8,000 Number ofVessels
Container Vessels by TEU Class 2000-2030
5,000
6,000
7,000
3,000
4,000
1,000
2,000
2000 2011 2015 2020 2025 203012 k TEU + - 47 124 232 348 458 7.6 k to 12 k TEU - 291 388 515 632 742 5.2 k to 7.6 k TEU 104 456 498 577 654 747 3 9 k to 5 2 k TEU 203 707 735 826 905 991
-
3.9 k to 5.2 k TEU 203 707 735 826 905 991 2.9 k to 3.9 k TEU 272 364 393 497 600 708 1.3 k to 2.9 k TEU 850 1,420 1,446 1,684 1,869 2,051 0.1 k to 1.3k TEU 1,214 1,604 1,596 1,706 1,633 1,537

Source: Panama Canal Authority (ACP)Source: Panama Canal Authority (ACP)
BUILDING STRONG®
Source: Panama Canal Authority (ACP)Source: Panama Canal Authority (ACP)

Depth-Constrained Containership Calls in 2020, with and without Planned Harbor Projectsj
(in thousands of ship calls)
14.0
4.5 3.8 17.7
PacificCoast
7.4
5.1
2 5
Construction /Design FundsAuthorized – FundsPending
As of 2009:
AtlanticCoastGulf Coast
1.1 1.62.5
Study FundsUnder Construction/Study for AdditionalImprovements
Pending
10

U.S. Port and Inland Waterways M d i i SModernization Strategy
As directed by Congress: y g
Within the funds provided, the Institute for Water Resources is directed to submit to the Senate and House Committees on Appropriations within 180 days of enactment of this Act, a report on how the Congress should address the , p gcritical need for additional port and inland waterway modernization to accommodate post-Panamax vessels. This study will not impede nor delay port or inland waterway projects already authorized by Congress. Factors for consideration should include costs associated with deepening and widening deep draft harbors; the ability of the waterways and ports to enhance thedeep-draft harbors; the ability of the waterways and ports to enhance the nation's export initiatives benefitting the agricultural and manufacturing sectors; the current and projected population trends that distinguish regional ports and ports that are immediately adjacent to population centers; the availability of inland intermodal access; and the environmental impacts y ; presulting from the modernization of inland waterways and deep-draft ports.
- Conference Report on the Consolidated Appropriations Act of 2012 (H.R. 2055)
BUILDING STRONG®
Strategy Will IncorporateStrategy Will Incorporate
Shipper PerspectivesShipper Perspectives Carrier Perspectives
P t P ti Ports Perspectives Environmental Interests State and Federal Agencies Other GroupsOther Groups
BUILDING STRONG®

TeamsTeams
Deep Draft Center of ExpertiseDeep Draft Center of Expertise Inland Center of Expertise
E i t l T Environmental Team Dredging Team AIS Team Port Capacity TeamPort Capacity Team Public Communications Team
BUILDING STRONG®
Deep Draft PCXDeep Draft PCX
Forecasting International Trade and FutureForecasting International Trade and Future Container Vessel Fleet
Trends that distinguish regional ports and ports which are immediately adjacent to largeports which are immediately adjacent to large population centers
BUILDING STRONG®

Inland PCXInland PCX
Commodity Flows (esp grain & oilseeds)Commodity Flows (esp. grain & oilseeds) Trade Initiatives
W t Fl t & C t Waterway Fleets & Costs Profiles
►Waterways, Ports, Rail, Truck System Base and Future Condition Reportase a d utu e Co d t o epo t
BUILDING STRONG®
BUILDING STRONG®

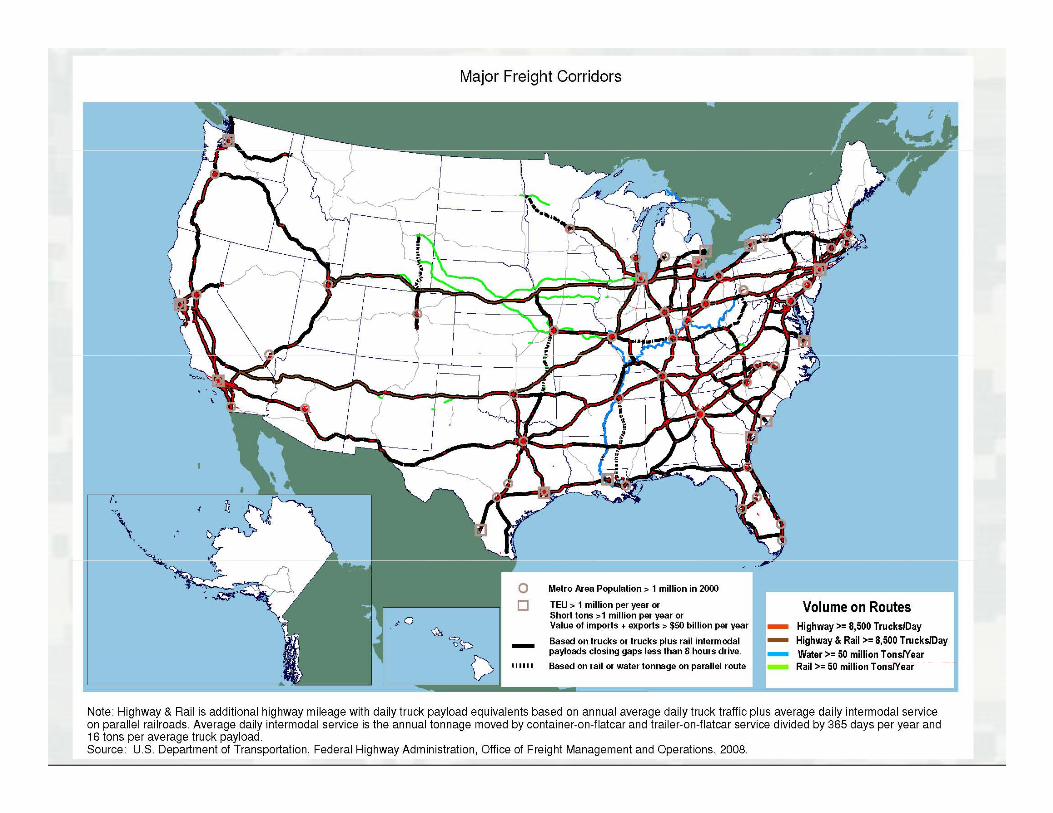
M i Hi h C idMarine Highway Corridors
BUILDING STRONG®

Environmental TeamEnvironmental Team Impacts from:Impacts from:
► Excavation and Maintenance Dredging► Port and Inland Waterway Structures► Vessel, Port and Waterway Operations► Intermodal Transport Development and Operation► Accidents► Impact Distribution and Environmental Justice
BUILDING STRONG®

Dredging TeamDredging Team
Examine impact on the Corps’ overallExamine impact on the Corps overall dredging program (both for O & M and New Starts)New Starts).
- Reviewing budget history establishing candidateReviewing budget history, establishing candidate dredging projects; determining existing info on dredging projects (channel lengths, dredging quantities, material
d d d i h d d l ) itype and dredging method and placement); computing cost estimates, and verification by Districts for parameters.
BUILDING STRONG®
p
AIS ContractAIS Contract
Route analysesRoute analyses Voyage costs
E i l t d d di Examine vessel trends and cascading effects Provides insights into to the post Panama
Canal Expansion
BUILDING STRONG®

Port Capacity AssessmentPort Capacity Assessment What are the near-term and long-term capacities of the g p
major container ports? What factors constrain the capacities of those ports? How well is capacity currently utilized? How well are the major ports prepared to handle larger
vessels?vessels? How do the smaller container ports or terminals fit into
the picture?
BUILDING STRONG®
Public Communications TeamPublic Communications Team Ensure that USACE conducts its investigationEnsure that USACE conducts its investigation
and communicates the findings in a clear, transparent, and sensitive manner to ensure p ,consideration of viewpoints of all stakeholders and to promote positive p pperceptions of the study and study process.
BUILDING STRONG®

Uncertainties Which May ImpactInvestment DecisionsInvestment Decisions
• Future trade growth rateF t l fl t d h ill th• Future vessel fleet – and where will they call?
• Panama Canal expansion –pimplications for vessel routings
• Use of Transshipment Hubs –? C ?Bahamas? Caribbean?
• Stimulus funds accelerated some projects but then funding uncertainprojects, but then funding uncertain
• Future funding levels may be constrained by growing federal deficit
BUILDING STRONG®

Challenge: Inland Waterway O&M FundingChallenge: Inland Waterway O&M Funding1977-2010 Current $ and 1996 Constant $ *
Challenge: Flat O&M funding in constant dollars, even as project portfolio grows and ages
Lock wall, Lower Mon 3project portfolio grows and ages…
700
400
500
600
on
200
300$ M
illio
Current$Constant$
0
100
BUILDING STRONG®
Lock wall deterioration, Chickamauga
* Fuel-Taxed Waterways Only

Navigation Funding – Pres Budget ($ million)($ million)
Pres Bud
Coastal Inland Nav CW total
NavPercent
FY12 $832 $744 $1576 $4631 34FY11 $873 $779 $1652 $4939 33FY10 $971 $796 $1767 $5125 35FY09 $969 $931 $1900 $4741 40FY08 $957 $1057 $2014 $4900 41
Trend is declining funds gNavigation down 22% in the last 5 years. Reductions masked by ARRA funding in FY09 and FY10Flood Damage Reduction increased due to DSAC results;
BUILDING STRONG®
Flood Damage Reduction increased due to DSAC results; Environment also increased.

U.S. Port and Inland Waterways M d i ti St tModernization Strategy
National Export Initiative seeks to increaseNational Export Initiative seeks to increase exports through trade missions, export credit and financing, effort to remove trade barriers,
f i d l d ienforcing trade rules and promoting international policies that lead to balanced world growthworld growth.
The Corps’ Modernization Strategy needs to be in context with ongoing efforts and reflex abe in context with ongoing efforts and reflex a multimodal transportation system.
BUILDING STRONG®
U.S. Port and Inland Waterways M d i ti St tModernization Strategy
Options for Financing Modernization
From greater Federal role to more reliability on local resources. Between these two end pointslocal resources. Between these two end points are an infinite combination of PPP, use of infrastructure banks, alternative cost sharinginfrastructure banks, alternative cost sharing and fee structures.
BUILDING STRONG®

U.S. Port & Inland Waterways Modernization StrategyModernization Strategy
ScheduleSchedule December 2011: Authorized by Congress Jan Apr 2012: Report Drafted Jan – Apr 2012: Report Drafted May – Jun 2012: Report Reviewed 30 June 2012: Report Delivered to
Congress
BUILDING STRONG®
Questions?Questions?
Kevin KnightInstitute for Water Resources(703) [email protected] g @ y
Keith HofsethInstitute for Water Resources(703) 428-6468
BUILDING STRONG®

Line of Site Requirements Restrict V l C itVessel Capacity
BUILDING STRONG®