Medium and long term perspectives of Inland Waterway ... · PDF fileMedium and long term...
30
Medium and long term Medium and long term perspectives perspectives of of Inland Inland Waterway Waterway Transport in the Transport in the European European Union Union Martin Quispel, NEA Brussels, 5th of July draft version 6a, 30 th of June 2011
Transcript of Medium and long term perspectives of Inland Waterway ... · PDF fileMedium and long term...
Medium and long term Medium and long term perspectivesperspectives of of InlandInland
WaterwayWaterway Transport in the Transport in the EuropeanEuropean UnionUnion
Martin Quispel, NEA
Brussels, 5th of July
draft version 6a, 30th of June 2011
ContentsContents
Introduction
Current position of IWT
Outlook for key industries and corridors
Conclusions on policy areas
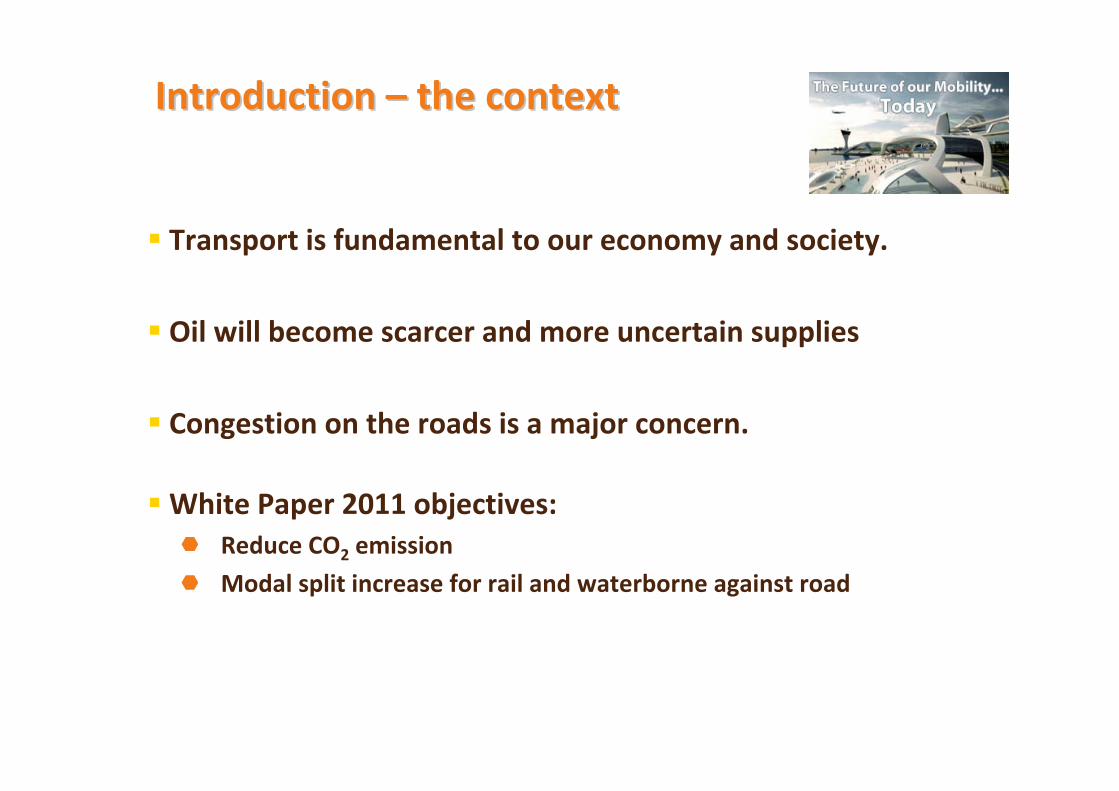
IntroductionIntroduction –– the contextthe context
Transport is fundamental to our economy and society.
Oil will become scarcer and more uncertain supplies
Congestion on the roads is a major concern.
White Paper 2011 objectives:Reduce CO2 emission
Modal split increase for rail and waterborne against road
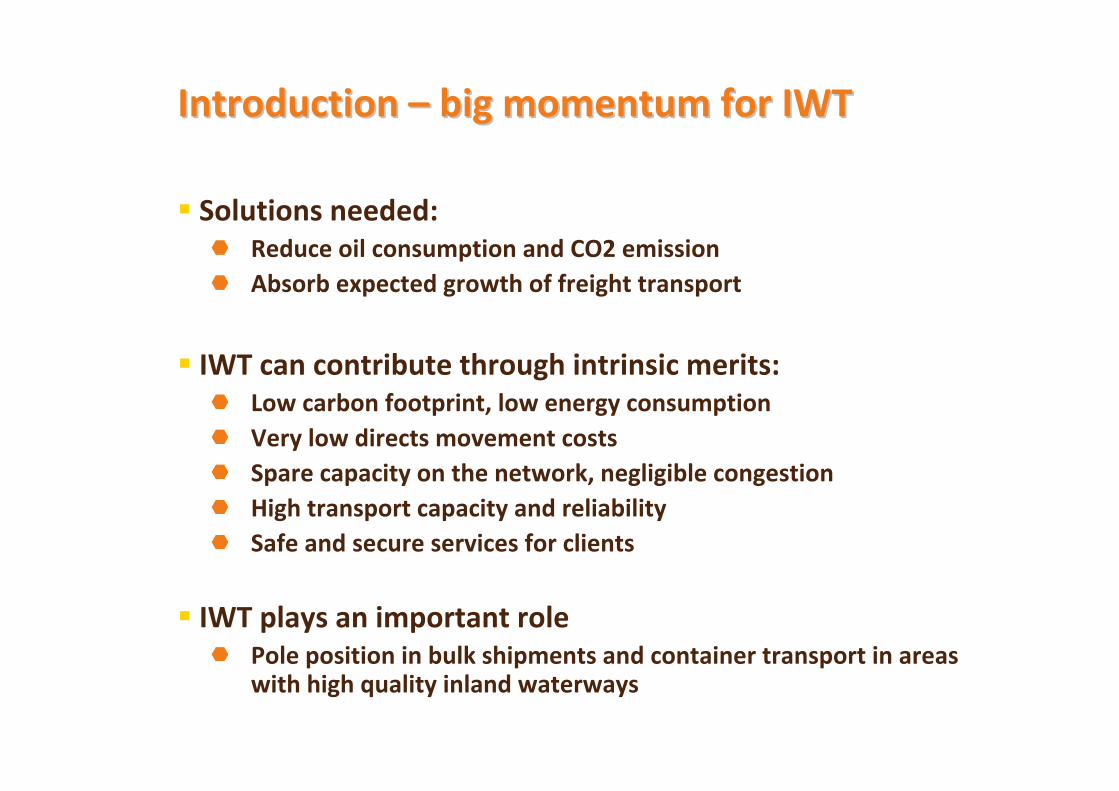
IntroductionIntroduction –– big big momentummomentum forfor IWTIWT
Solutions needed:Reduce oil consumption and CO2 emission Absorb expected growth of freight transport
IWT can contribute through intrinsic merits:Low carbon footprint, low energy consumptionVery low directs movement costsSpare capacity on the network, negligible congestionHigh transport capacity and reliability Safe and secure services for clients
IWT plays an important rolePole position in bulk shipments and container transport in areaswith high quality inland waterways
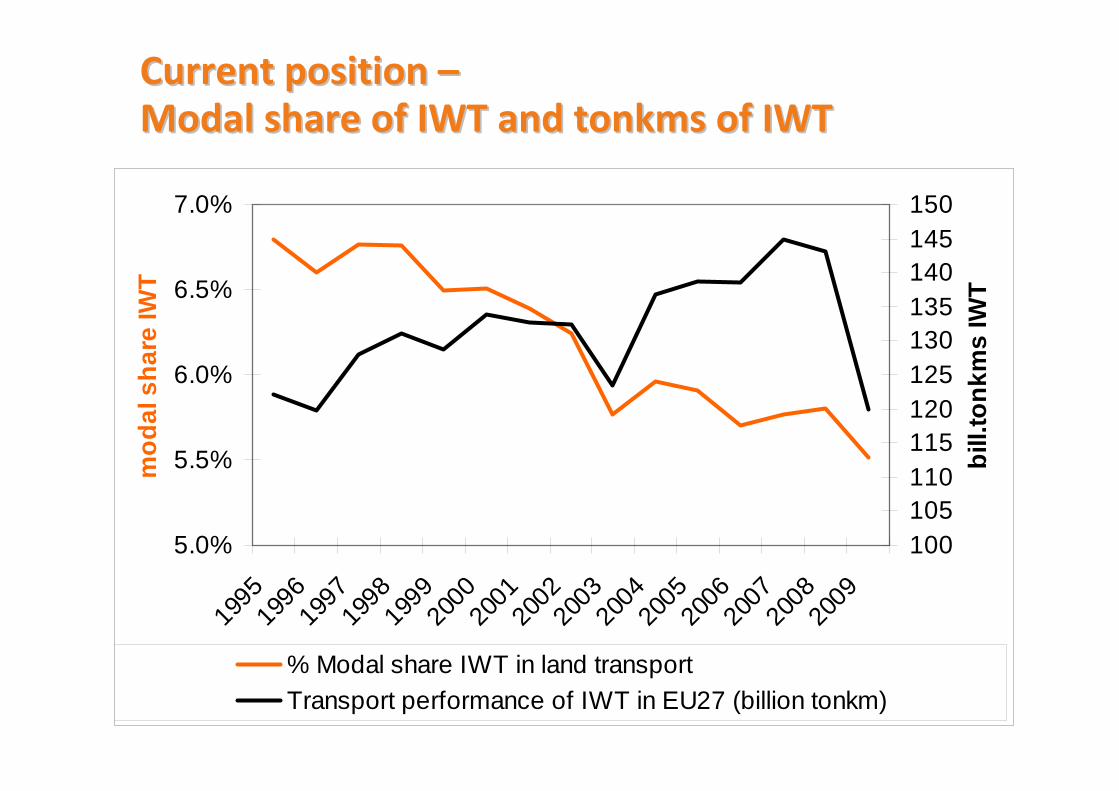
CurrentCurrent positionposition ––ModalModal shareshare of IWT and of IWT and tonkmstonkms of IWTof IWT
5.0%
5.5%
6.0%
6.5%
7.0%
1995
1996
1997
1998
1999
2000
2001
2002
2003
2004
2005
2006
2007
2008
2009
mod
al s
hare
IWT
100105110115120125130135140145150
bill.
tonk
ms
IWT
% Modal share IWT in land transportTransport performance of IWT in EU27 (billion tonkm)
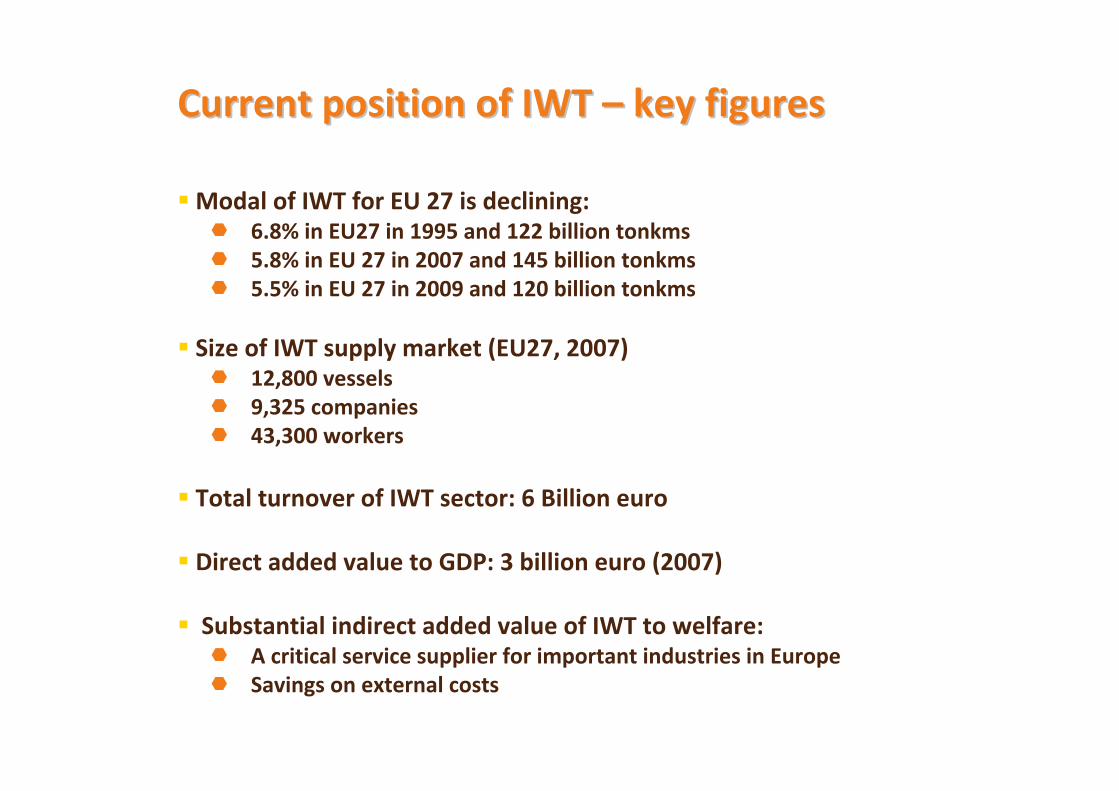
CurrentCurrent positionposition of IWT of IWT –– keykey figuresfigures
Modal of IWT for EU 27 is declining: 6.8% in EU27 in 1995 and 122 billion tonkms5.8% in EU 27 in 2007 and 145 billion tonkms5.5% in EU 27 in 2009 and 120 billion tonkms
Size of IWT supply market (EU27, 2007)12,800 vessels9,325 companies 43,300 workers
Total turnover of IWT sector: 6 Billion euro
Direct added value to GDP: 3 billion euro (2007)
Substantial indirect added value of IWT to welfare:A critical service supplier for important industries in EuropeSavings on external costs
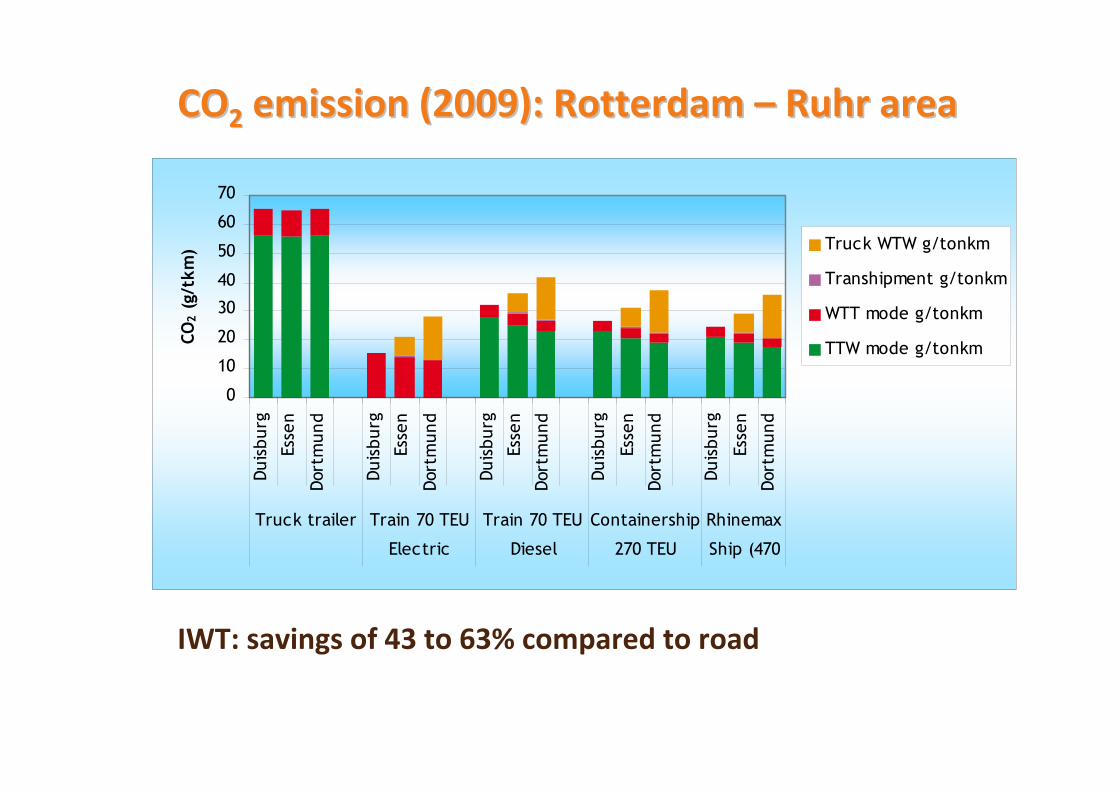
COCO22 emissionemission (2009): Rotterdam (2009): Rotterdam –– RuhrRuhr areaarea
0
10
20
30
40
50
60
70
Duis
burg
Esse
n
Dort
mun
d
Duis
burg
Esse
n
Dort
mun
d
Duis
burg
Esse
n
Dort
mun
d
Duis
burg
Esse
n
Dort
mun
d
Duis
burg
Esse
n
Dort
mun
d
Truck trailer Train 70 TEU
Electric
Train 70 TEU
Diesel
Containership
270 TEU
Rhinemax
Ship (470
CO2
(g/t
km) Truck WTW g/tonkm
Transhipment g/tonkm
WTT mode g/tonkm
TTW mode g/tonkm
IWT: savings of 43 to 63% compared to road
CurrentCurrent positionposition of IWT of IWT –– pollutantspollutants
IWT is lagging behind on performance on emissions of pollutants: PM2.5 and NOx
Trend 2020: increasing gap between emission performance of engines in barges and truck engines
Main causes: Long life-time of engines in vessels
Less strict emission standards for IWT
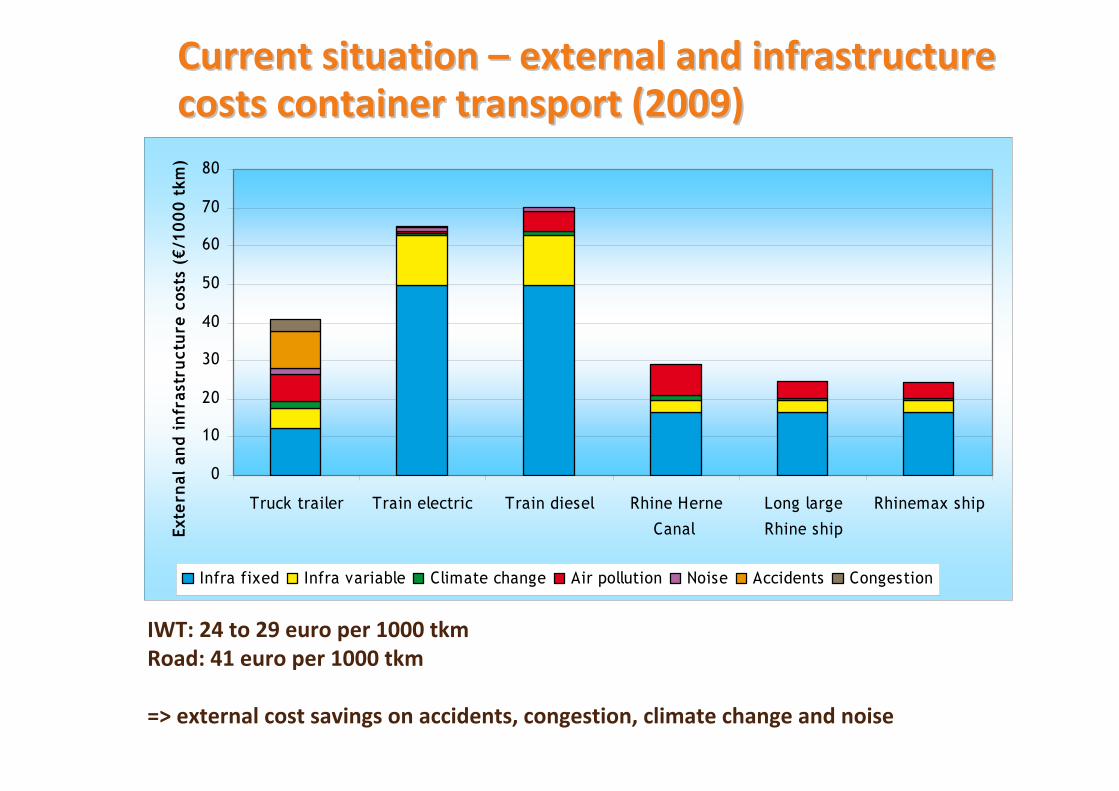
CurrentCurrent situationsituation –– externalexternal and and infrastructureinfrastructurecostscosts container transport (2009)container transport (2009)
IWT: 24 to 29 euro per 1000 tkmRoad: 41 euro per 1000 tkm
=> external cost savings on accidents, congestion, climate change and noise
0
10
20
30
40
50
60
70
80
Truck trailer Train electric Train diesel Rhine Herne
Canal
Long large
Rhine ship
Rhinemax ship
Exte
rnal
and
infr
astr
uctu
re c
osts
(€/
1000
tkm
)
Infra fixed Infra variable Climate change Air pollution Noise Accidents Congestion
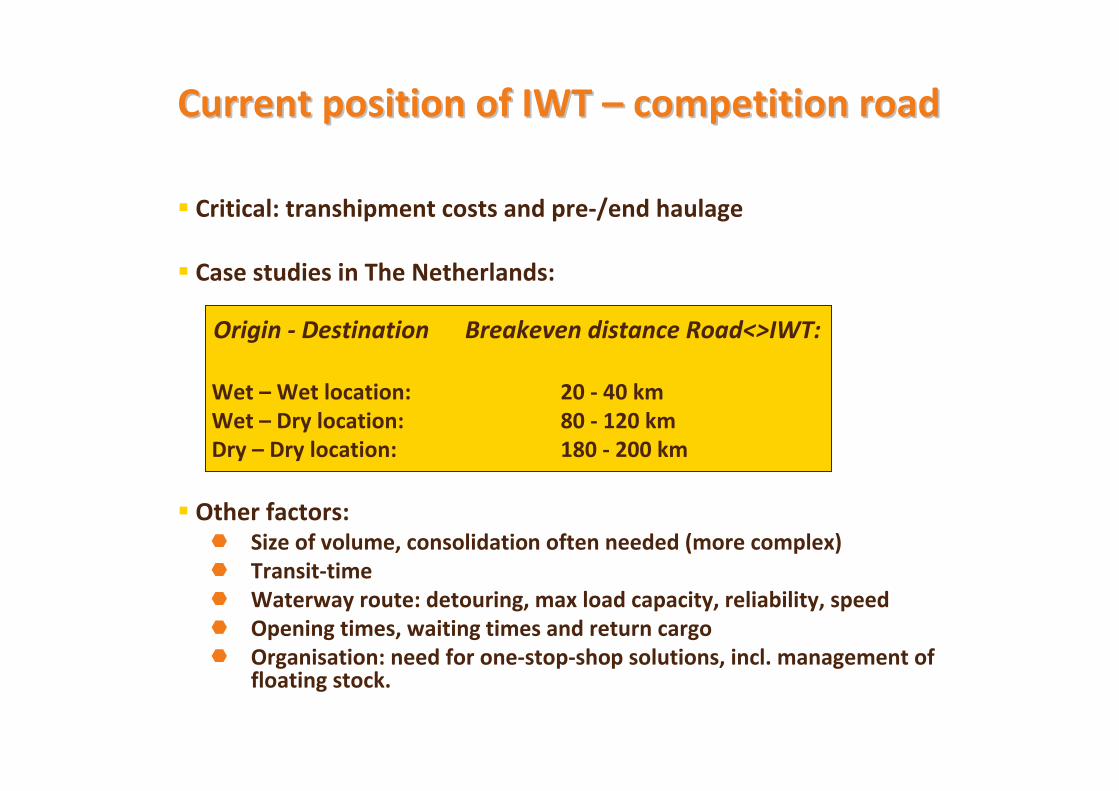
CurrentCurrent positionposition of IWT of IWT –– competitioncompetition roadroad
Critical: transhipment costs and pre-/end haulage
Case studies in The Netherlands:
Origin - Destination Breakeven distance Road<>IWT:
Wet – Wet location: 20 - 40 kmWet – Dry location: 80 - 120 kmDry – Dry location: 180 - 200 km
Other factors:Size of volume, consolidation often needed (more complex)Transit-timeWaterway route: detouring, max load capacity, reliability, speedOpening times, waiting times and return cargoOrganisation: need for one-stop-shop solutions, incl. management of floating stock.
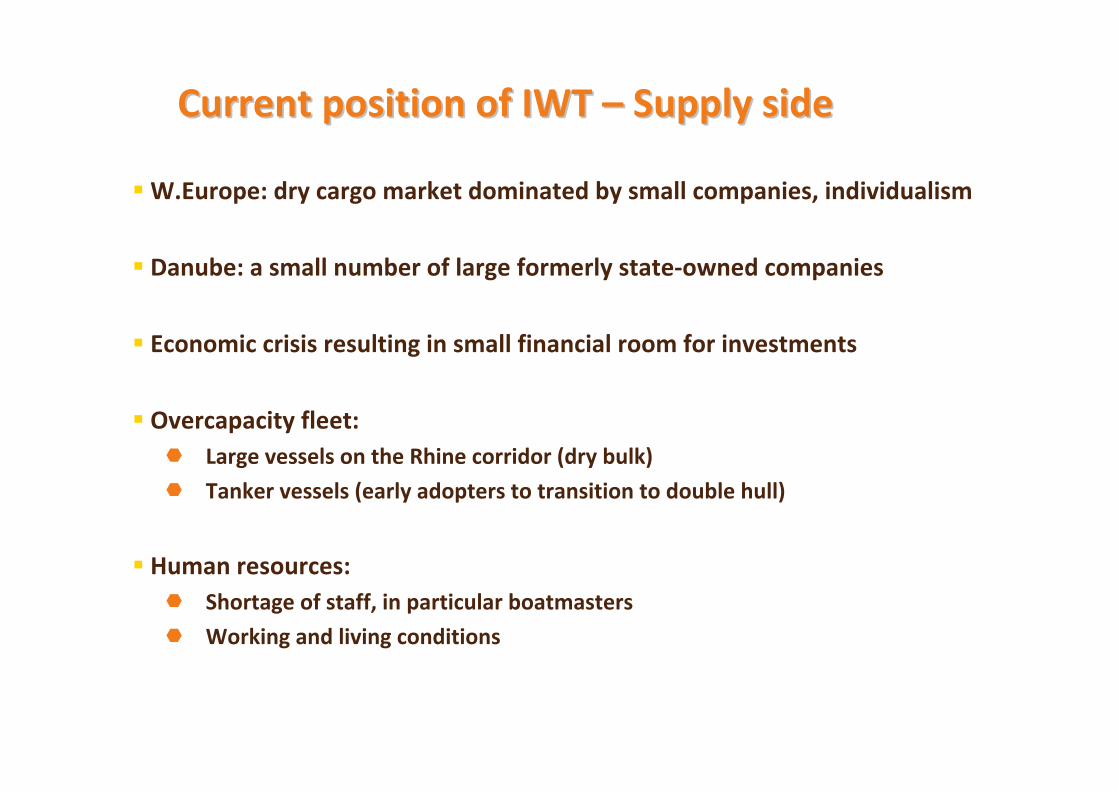
CurrentCurrent positionposition of IWT of IWT –– SupplySupply sideside
W.Europe: dry cargo market dominated by small companies, individualism
Danube: a small number of large formerly state-owned companies
Economic crisis resulting in small financial room for investments
Overcapacity fleet:Large vessels on the Rhine corridor (dry bulk)
Tanker vessels (early adopters to transition to double hull)
Human resources:Shortage of staff, in particular boatmasters
Working and living conditions
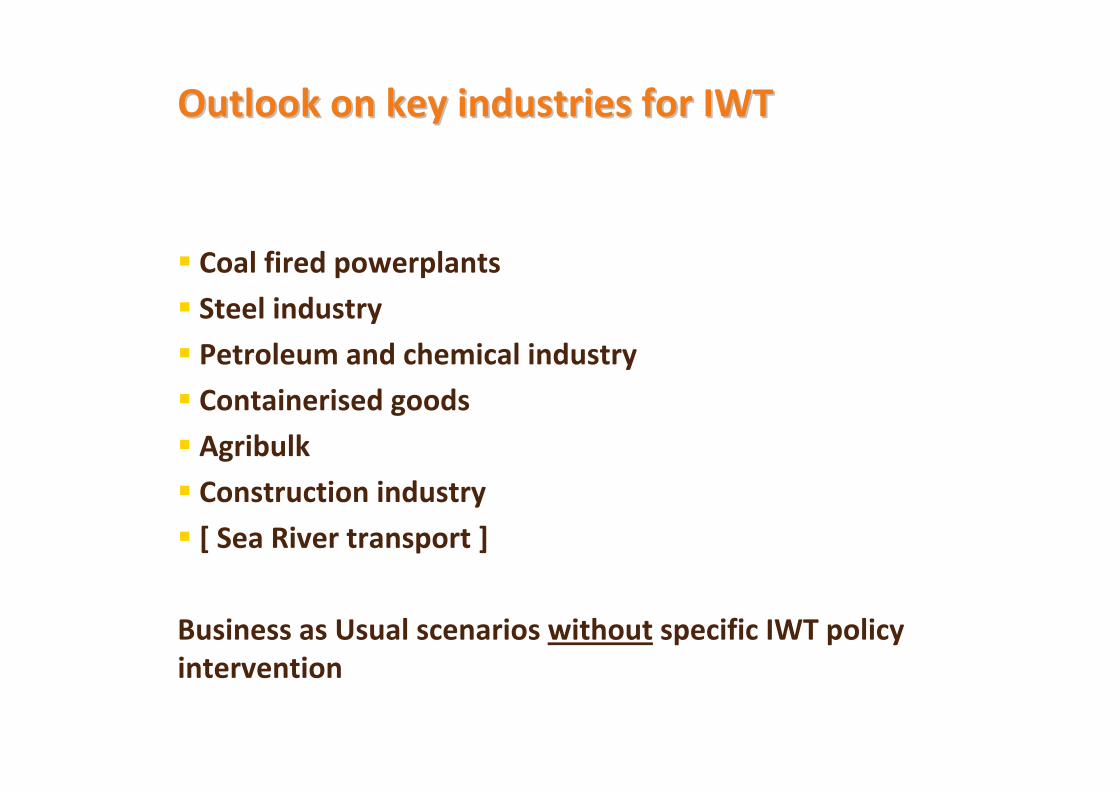
Outlook Outlook onon keykey industries industries forfor IWTIWT
Coal fired powerplants
Steel industry
Petroleum and chemical industry
Containerised goods
Agribulk
Construction industry
[ Sea River transport ]
Business as Usual scenarios without specific IWT policy intervention
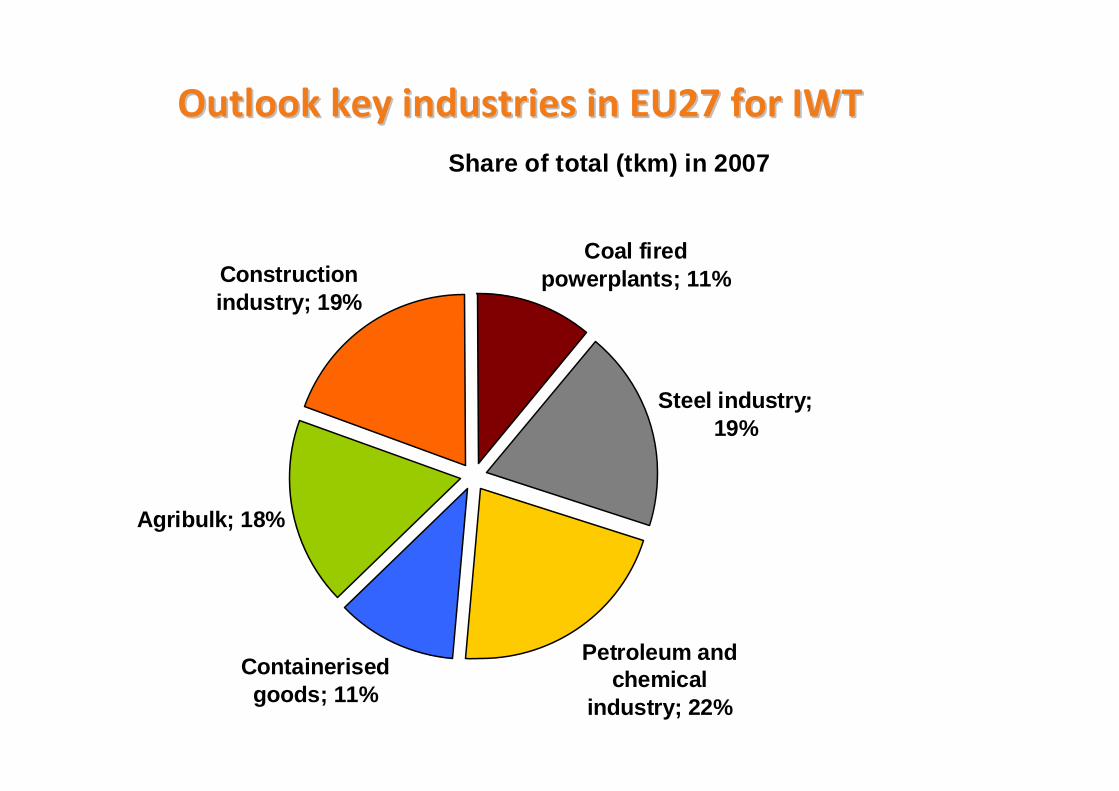
Outlook Outlook keykey industries in EU27 industries in EU27 forfor IWTIWTShare of total (tkm) in 2007
Coal fired powerplants; 11%
Steel industry; 19%
Petroleum and chemical
industry; 22%
Containerised goods; 11%
Agribulk; 18%
Construction industry; 19%
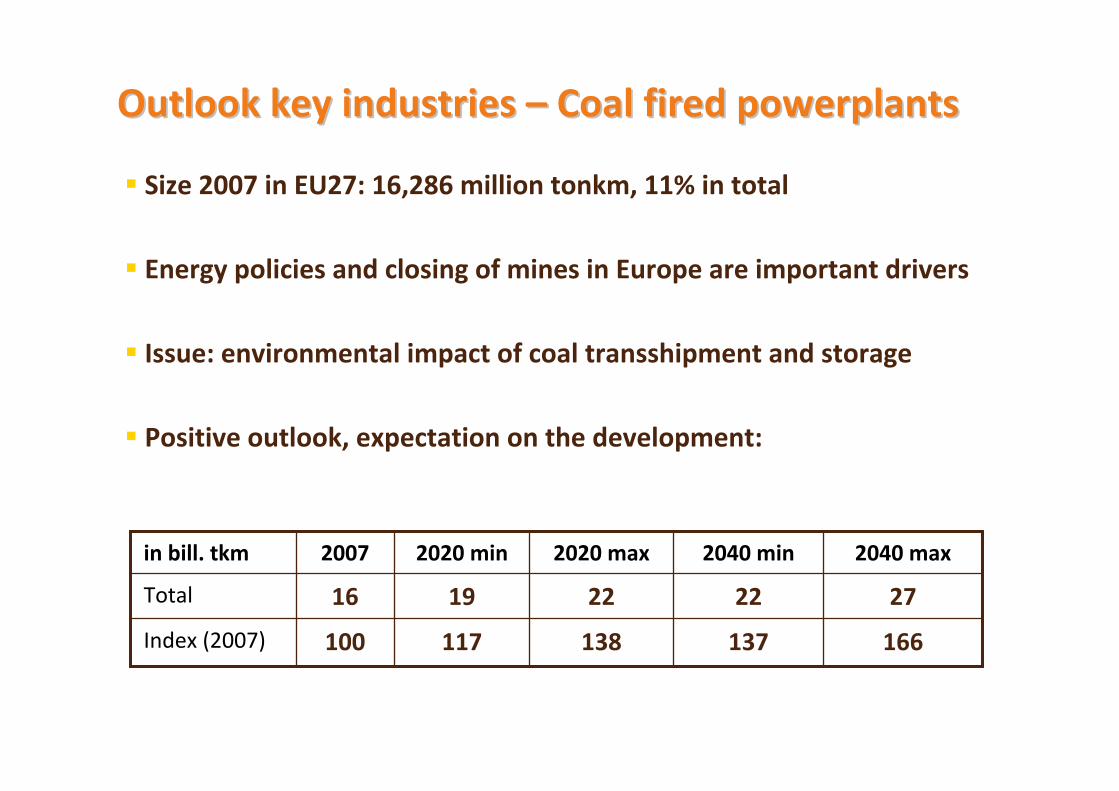
Outlook Outlook keykey industries industries –– Coal Coal firedfired powerplantspowerplants
Size 2007 in EU27: 16,286 million tonkm, 11% in total
Energy policies and closing of mines in Europe are important drivers
Issue: environmental impact of coal transshipment and storage
Positive outlook, expectation on the development:
166137138117100Index (2007)
19
2020 min
27222216Total
2040 max2040 min2020 max2007in bill. tkm
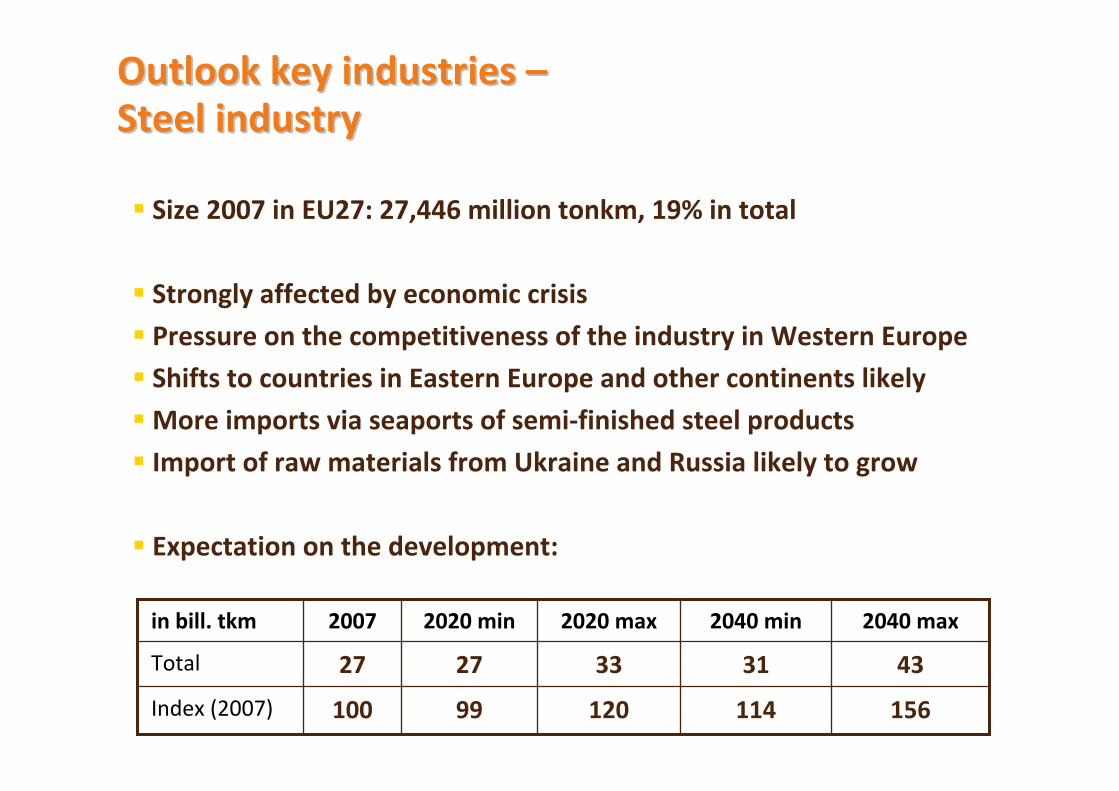
Outlook Outlook keykey industries industries ––Steel Steel industryindustry
Size 2007 in EU27: 27,446 million tonkm, 19% in total
Strongly affected by economic crisis
Pressure on the competitiveness of the industry in Western Europe
Shifts to countries in Eastern Europe and other continents likely
More imports via seaports of semi-finished steel products
Import of raw materials from Ukraine and Russia likely to grow
Expectation on the development:
15611412099100Index (2007)
27
2020 min
43313327Total
2040 max2040 min2020 max2007in bill. tkm
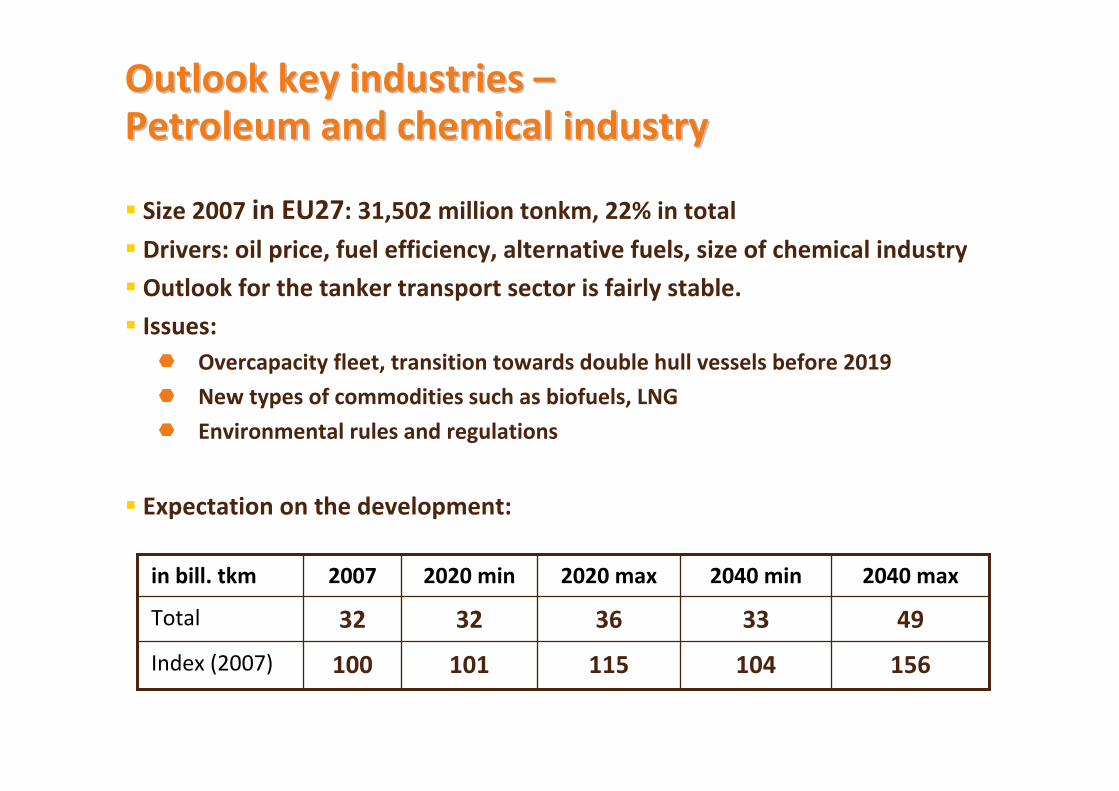
Outlook Outlook keykey industries industries ––Petroleum and Petroleum and chemicalchemical industryindustry
Size 2007 in EU27: 31,502 million tonkm, 22% in total
Drivers: oil price, fuel efficiency, alternative fuels, size of chemical industry
Outlook for the tanker transport sector is fairly stable.
Issues: Overcapacity fleet, transition towards double hull vessels before 2019
New types of commodities such as biofuels, LNG
Environmental rules and regulations
Expectation on the development:
156104115101100Index (2007)
32
2020 min
49333632Total
2040 max2040 min2020 max2007in bill. tkm
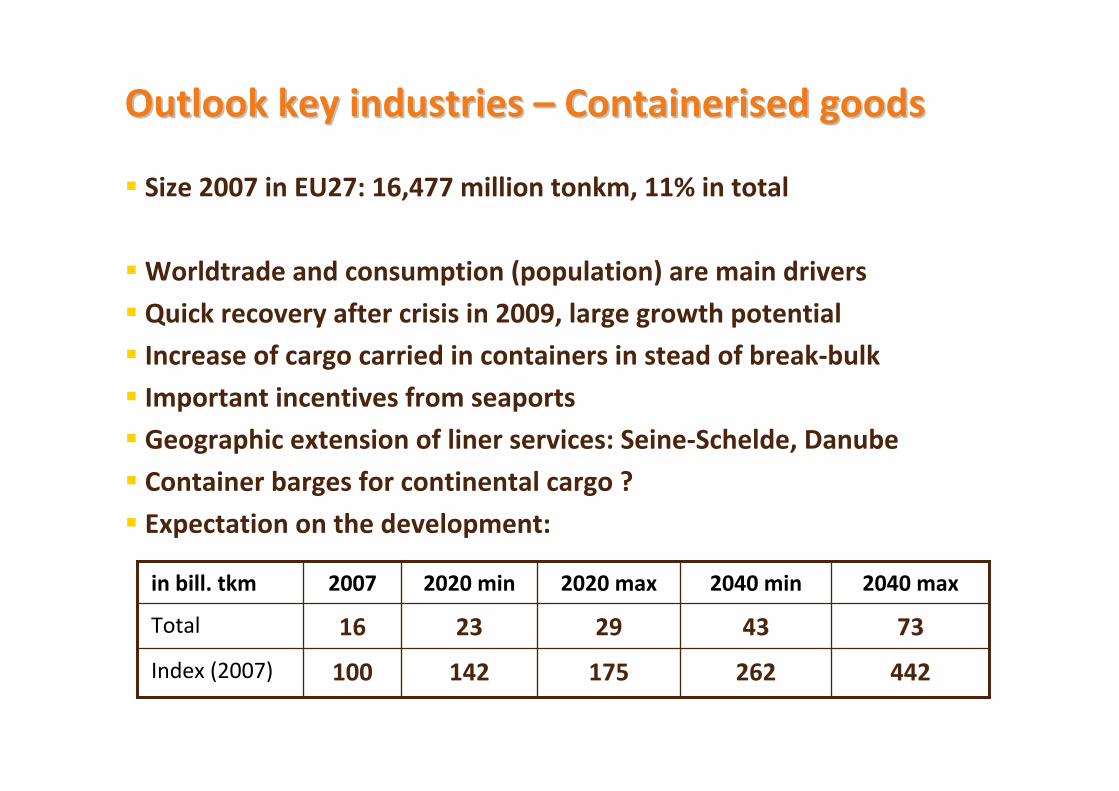
Outlook Outlook keykey industries industries –– ContainerisedContainerised goodsgoods
Size 2007 in EU27: 16,477 million tonkm, 11% in total
Worldtrade and consumption (population) are main drivers
Quick recovery after crisis in 2009, large growth potential
Increase of cargo carried in containers in stead of break-bulk
Important incentives from seaports
Geographic extension of liner services: Seine-Schelde, Danube
Container barges for continental cargo ?
Expectation on the development:
442262175142100Index (2007)
23
2020 min
73432916Total
2040 max2040 min2020 max2007in bill. tkm
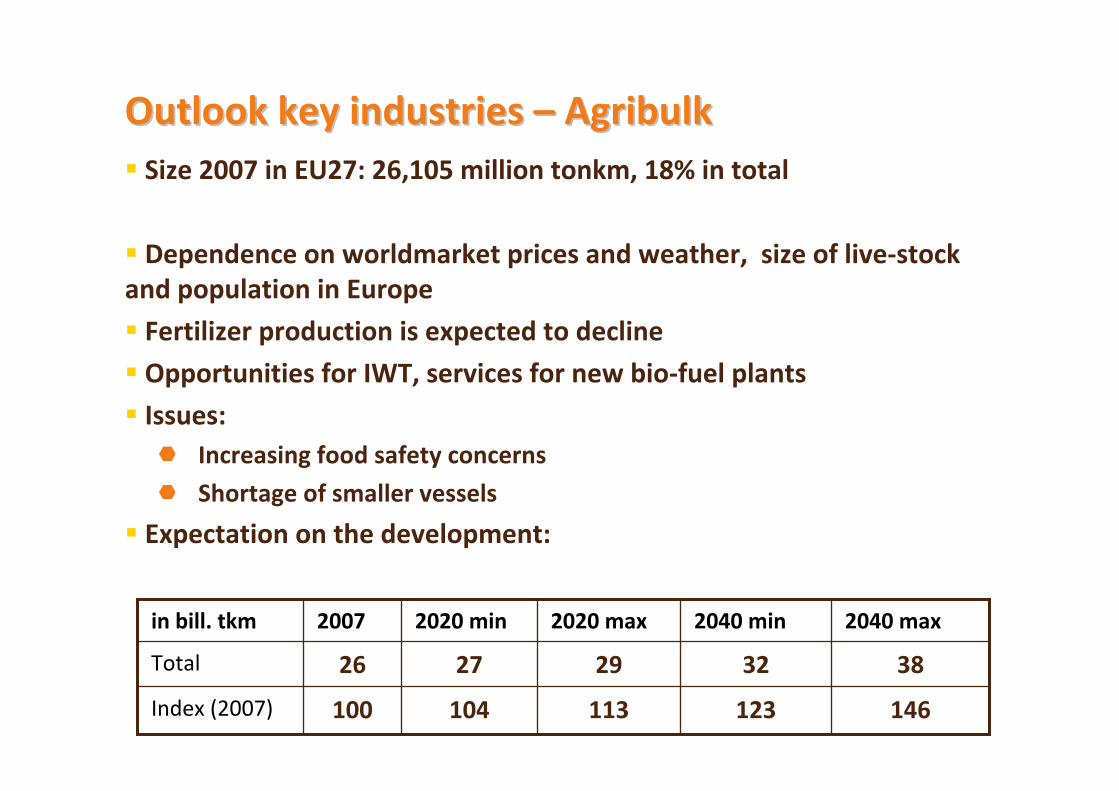
Outlook Outlook keykey industries industries –– AgribulkAgribulkSize 2007 in EU27: 26,105 million tonkm, 18% in total
Dependence on worldmarket prices and weather, size of live-stock and population in Europe
Fertilizer production is expected to decline
Opportunities for IWT, services for new bio-fuel plants
Issues:Increasing food safety concerns
Shortage of smaller vessels
Expectation on the development:
146123113104100Index (2007)
27
2020 min
38322926Total
2040 max2040 min2020 max2007in bill. tkm
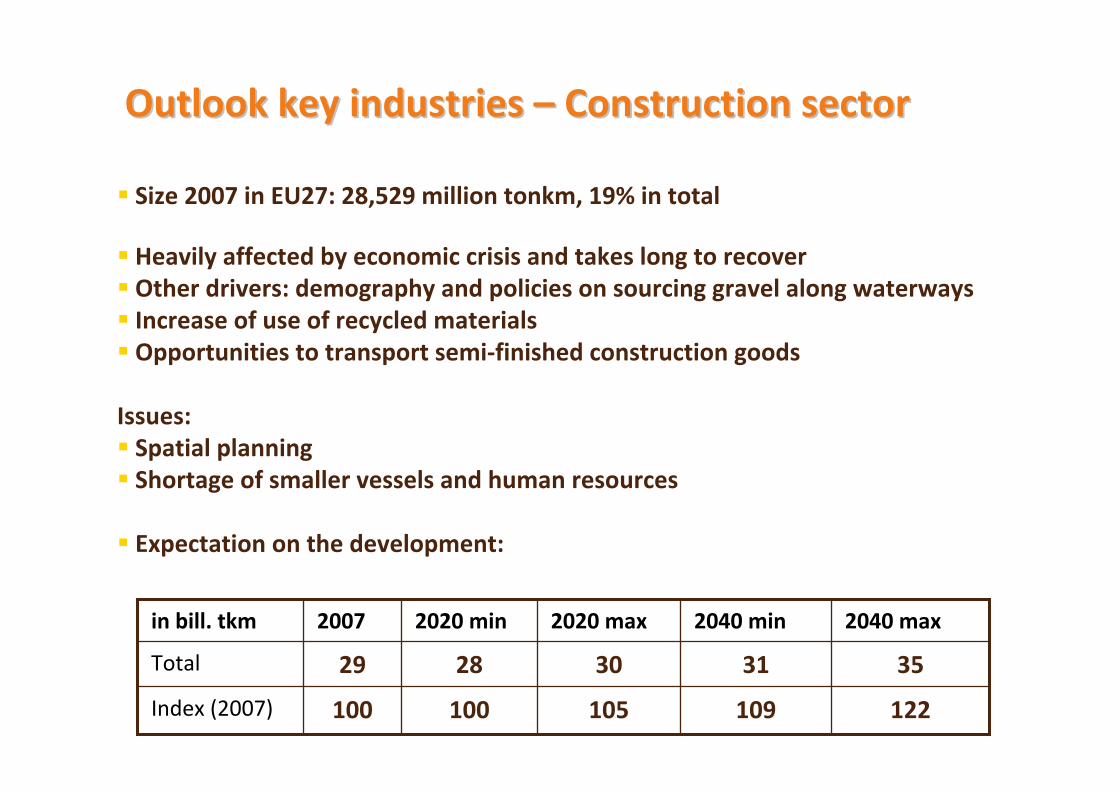
Outlook Outlook keykey industries industries –– Construction sectorConstruction sector
Size 2007 in EU27: 28,529 million tonkm, 19% in total
Heavily affected by economic crisis and takes long to recoverOther drivers: demography and policies on sourcing gravel along waterwaysIncrease of use of recycled materialsOpportunities to transport semi-finished construction goods
Issues:Spatial planningShortage of smaller vessels and human resources
Expectation on the development:
122109105100100Index (2007)
28
2020 min
35313029Total
2040 max2040 min2020 max2007in bill. tkm
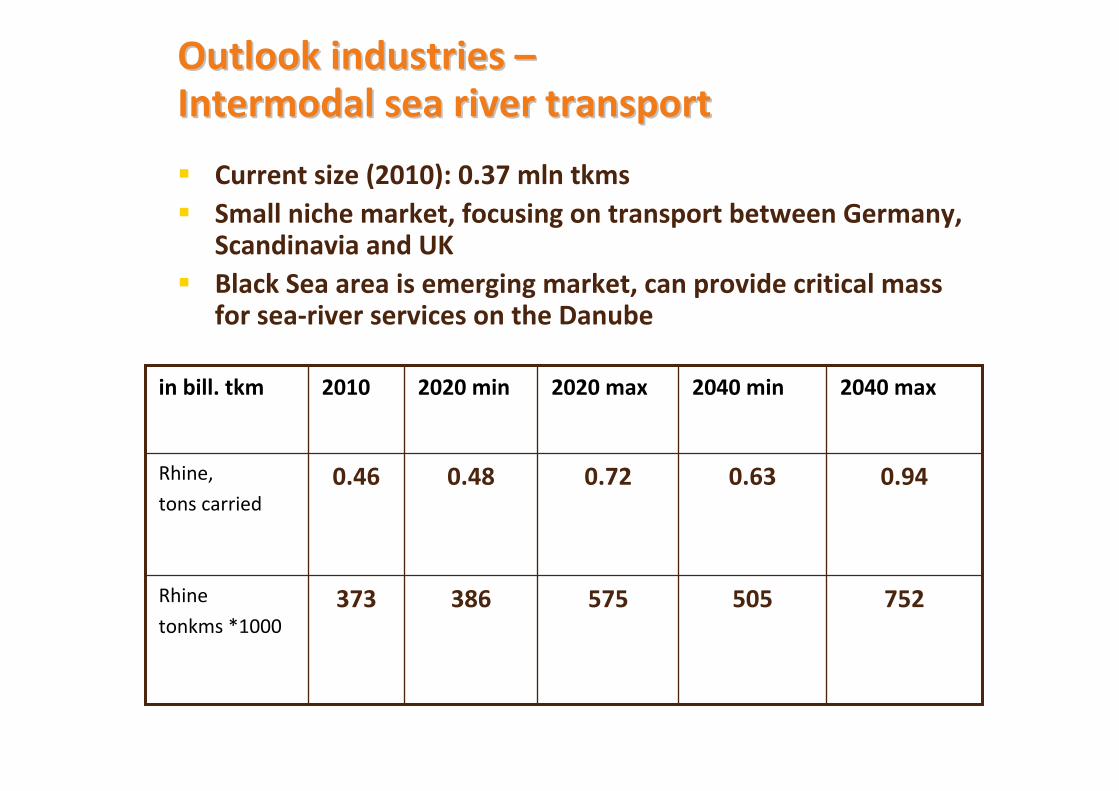
Outlook industries Outlook industries ––IntermodalIntermodal seasea riverriver transporttransport
Current size (2010): 0.37 mln tkmsSmall niche market, focusing on transport between Germany, Scandinavia and UKBlack Sea area is emerging market, can provide critical mass for sea-river services on the Danube
752505575386373Rhine
tonkms *1000
0.48
2020 min
0.940.630.720.46Rhine,
tons carried
2040 max2040 min2020 max2010in bill. tkm
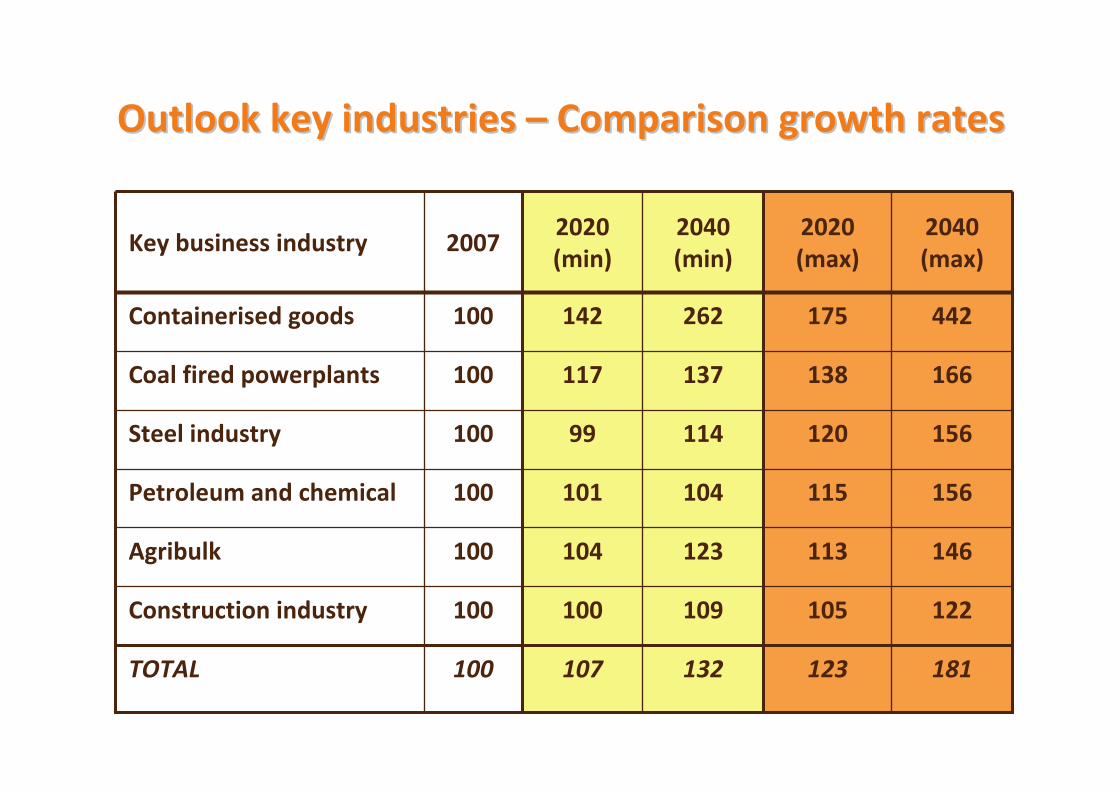
Outlook Outlook keykey industries industries –– Comparison growth ratesComparison growth rates
15612011499100Steel industry
442175262142100Containerised goods
156115104101100Petroleum and chemical
146113123104100Agribulk
122105109100100Construction industry
166138137117100Coal fired powerplants
123
2020 (max)
181
2040 (max)
132107100TOTAL
2040 (min)
2020 (min)
2007Key business industry
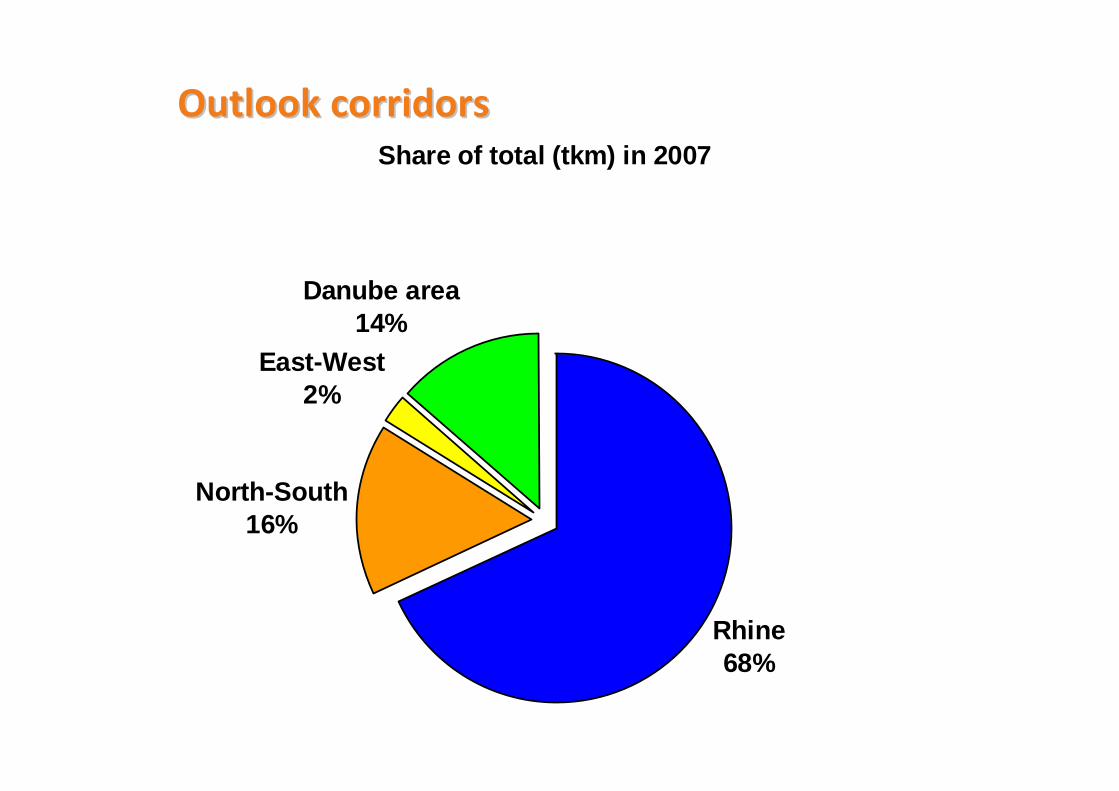
Outlook corridorsOutlook corridorsShare of total (tkm) in 2007
Rhine68%
North-South16%
East-West2%
Danube area14%

Outlook corridors Outlook corridors –– absolute valuesabsolute values
0255075
100125150175200225250275
2007 2020 min 2020 max 2040 min 2040 max
Billi
on to
nkm
EU27 Rhine North-South East-West Danube
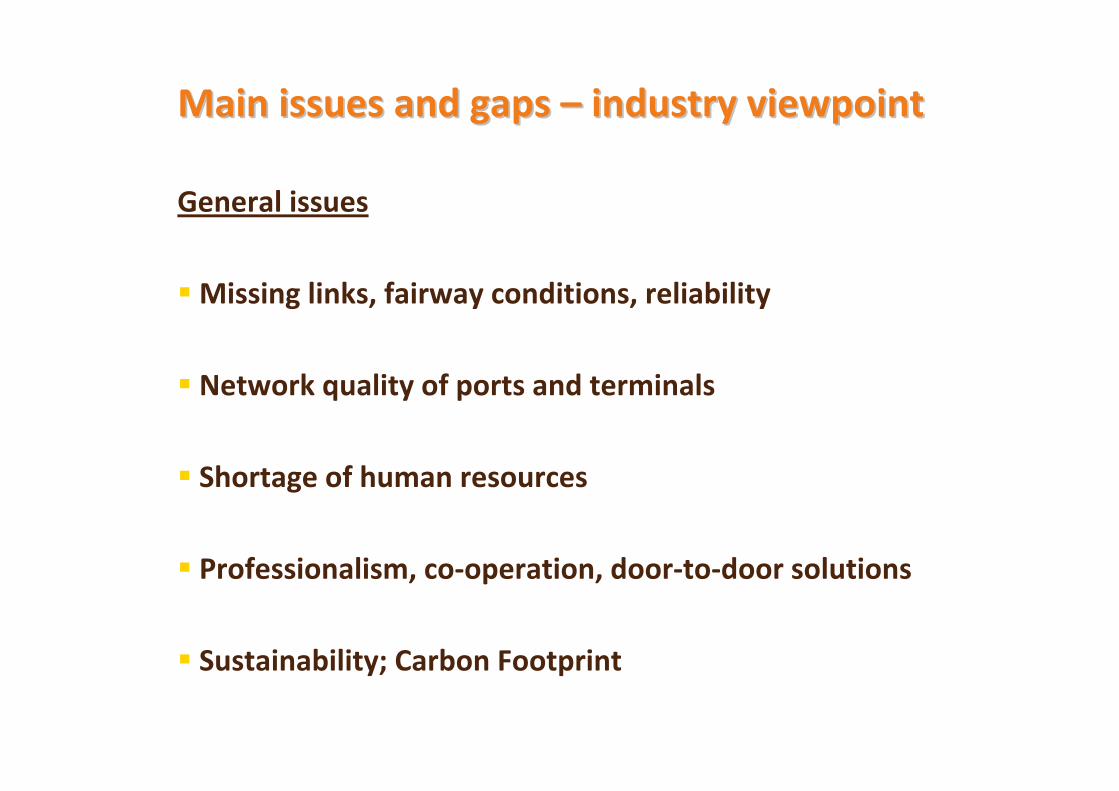
MainMain issues and issues and gapsgaps –– industryindustry viewpointviewpoint
General issues
Missing links, fairway conditions, reliability
Network quality of ports and terminals
Shortage of human resources
Professionalism, co-operation, door-to-door solutions
Sustainability; Carbon Footprint
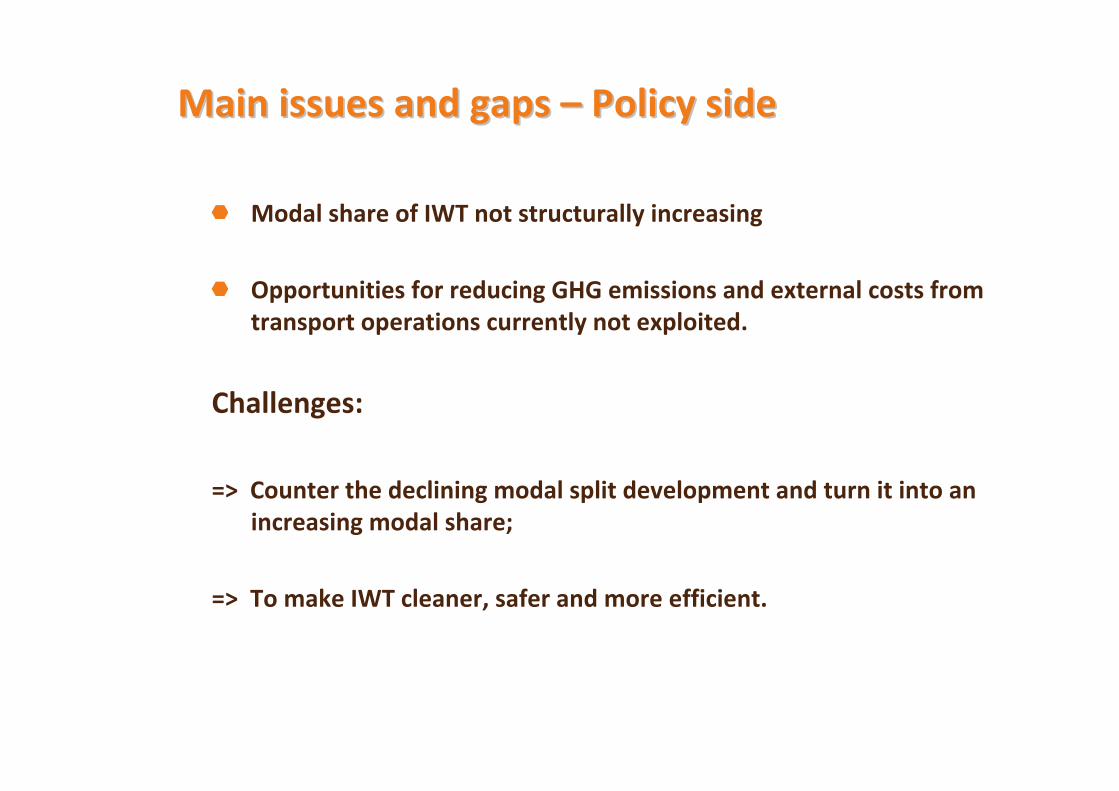
MainMain issues and issues and gapsgaps –– PolicyPolicy sideside
Modal share of IWT not structurally increasing
Opportunities for reducing GHG emissions and external costs fromtransport operations currently not exploited.
Challenges:
=> Counter the declining modal split development and turn it into an increasing modal share;
=> To make IWT cleaner, safer and more efficient.
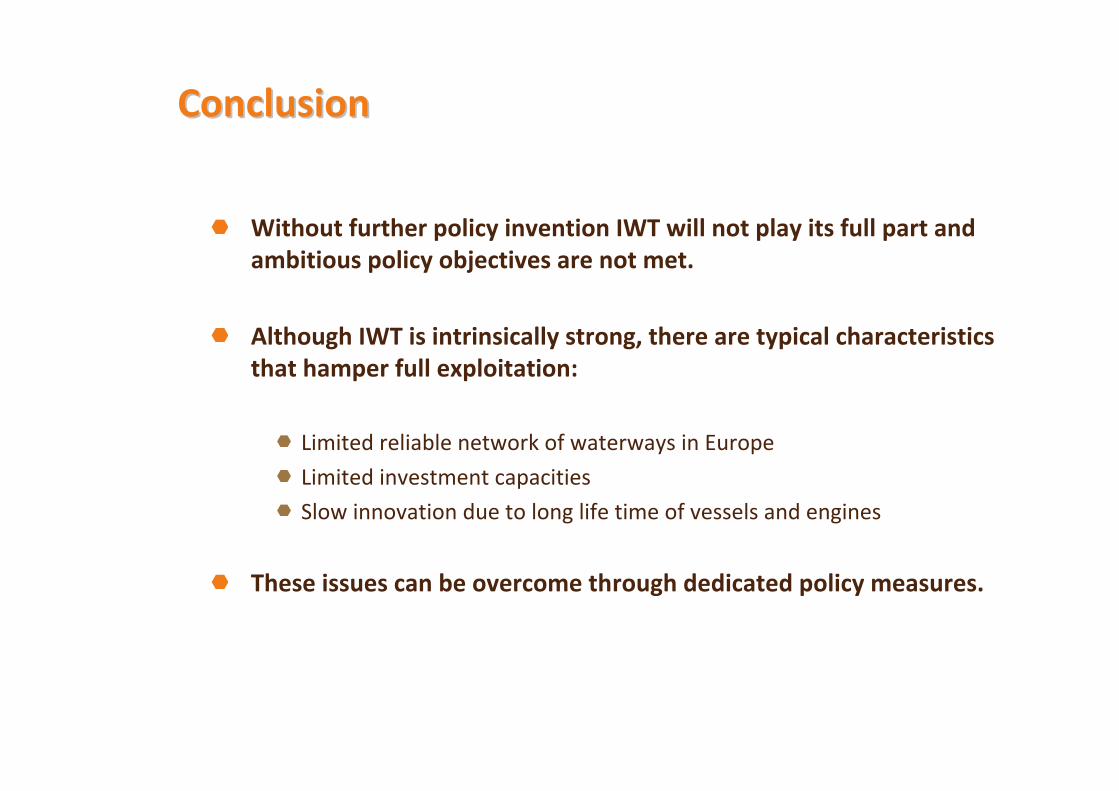
ConclusionConclusion
Without further policy invention IWT will not play its full part and ambitious policy objectives are not met.
Although IWT is intrinsically strong, there are typical characteristics that hamper full exploitation:
Limited reliable network of waterways in Europe
Limited investment capacities
Slow innovation due to long life time of vessels and engines
These issues can be overcome through dedicated policy measures.
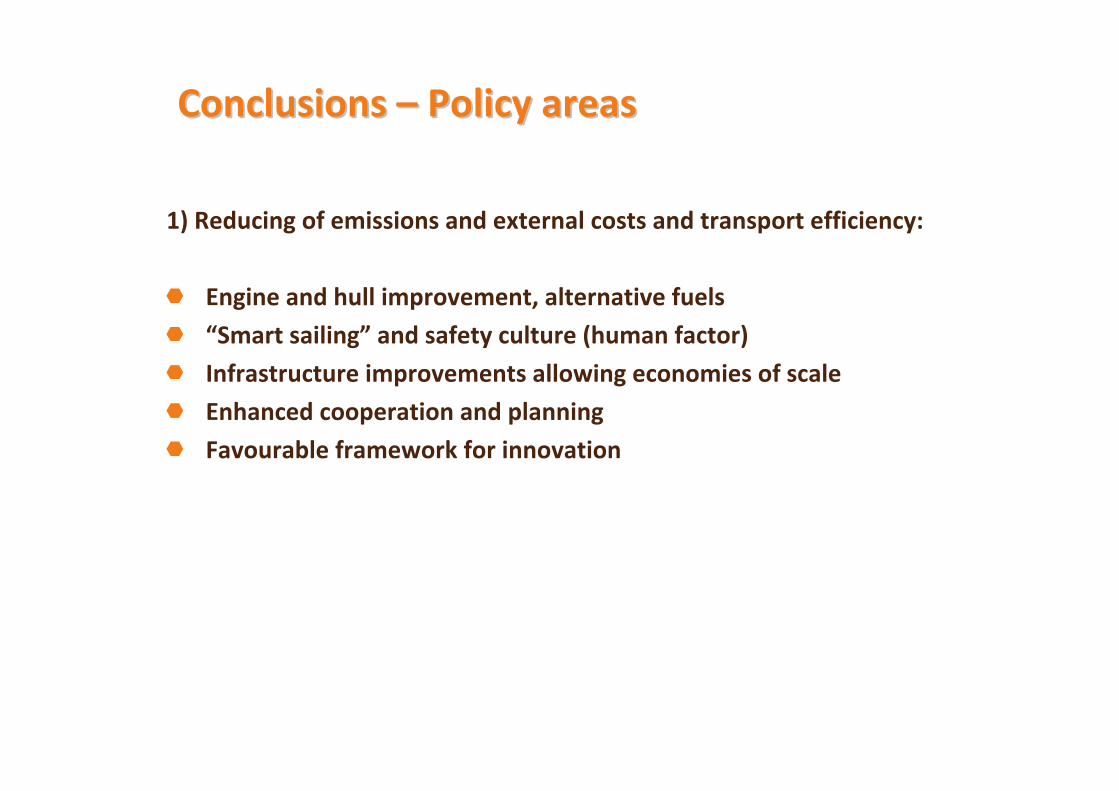
ConclusionsConclusions –– PolicyPolicy areasareas
1) Reducing of emissions and external costs and transport efficiency:
Engine and hull improvement, alternative fuels
“Smart sailing” and safety culture (human factor)
Infrastructure improvements allowing economies of scale
Enhanced cooperation and planning
Favourable framework for innovation
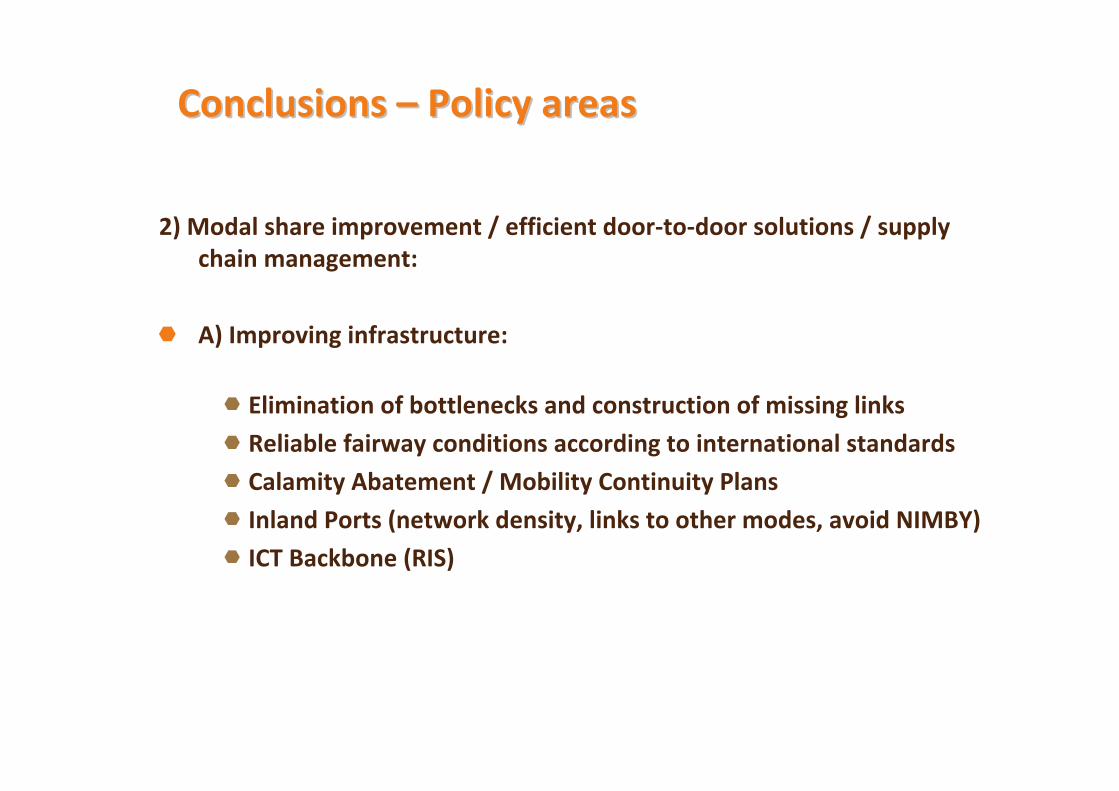
ConclusionsConclusions –– PolicyPolicy areasareas
2) Modal share improvement / efficient door-to-door solutions / supply chain management:
A) Improving infrastructure:
Elimination of bottlenecks and construction of missing links
Reliable fairway conditions according to international standards
Calamity Abatement / Mobility Continuity Plans
Inland Ports (network density, links to other modes, avoid NIMBY)
ICT Backbone (RIS)

ConclusionsConclusions –– PolicyPolicy areasareas2) Modal share improvement / efficient door-to-door solutions / supply
chain management:
B) Market organisation and professionalism:Enhanced cooperation within the supply side, between modes, with shippers
Human resources
Use of ICT
Minimising administrative costs and harmonisation across Europe
Market information: observation and forecasting
Provide information and data on available IWT services and funding opportunities
C) How to support to opening of new markets for IWT, e.g.:Continental container cargo
Pallet transport
Waste transport in urban areas
Biomass, alternative fuels and renewable raw materials
Roll-on/Roll-off, high & heavy cargo
Thank you for your attention!
Martin QuispelNEA Bredewater 26P.O. Box 276NL 2700 AG Zoetermeer
℡ +31 (0)79 322 2356 +31 (0) 6 129 52 392