Understanding Alaska: People, Economy, and Resources · Understanding Alaska: People, Economy, and...
21
Understanding Alaska: People, Economy, and Resources Institute of Social and Economic Research University of Alaska Anchorage
Transcript of Understanding Alaska: People, Economy, and Resources · Understanding Alaska: People, Economy, and...

Understanding Alaska: People, Economy, and ResourcesInstitute of Social and Economic Research University of Alaska Anchorage


Institute of Social and Economic Research • University of Alaska Anchorage May 2006
Understanding Alaska is a special series of ISER research studies examining Alaska economic development issues. They are paid for
by the University of Alaska Foundation.
ResearchersScottGoldsmith,professorofeconomics,ISERGunnarKnapp,professorofeconomics,ISERSharmanHaley,associateprofessorofpublicpolicy,ISERMatthewBerman,professorofeconomics,ISERLanceHowe,assistantprofessorofeconomics,ISERSteveColt,associateprofessorofeconomics,ISERMaryKillorin,researchassociate,ISERRosylandFrazier,researchassociate,ISERTerrenceCole,professorofhistory,UniversityofAlaskaFairbanksMarkFoster,MarkFosterandAssociatesFranUlmer,director,ISER
Editors:LindaLeask,MaryKillorin,andPamelaCravezGraphics:ClemenciaAmaya-Merrill
CoverphotoscourtesyofGunnarKnappandDianeHirshberg
An Overview of Understanding Alaska Research
Understanding Alaska: People, Economy, and Resources
www.alaskaneconomy.uaa.alaska.edu

DearReaders:
WelcometoUnderstanding Alaska.That’saspecialseriesofstudiesweat the InstituteofSocialandEconomicResearch (ISER)startedin2001,examiningeconomicdevelopmentissues inthestate.ThestudiesareintendedtohelpAlaskansunderstandhowtheireconomyworks—andtoshedlightonwaysitmightgrowinthefuture.
This publication summarizes our Understanding Alaska work todate.Wehopewhatyouseeheretemptsyoutoreadmoreinthefullpublications,whichyou’llfindonlineatwww.alaskaneconomy.edu.
TheUniversityofAlaskaFoundationpaysforUnderstanding Alaskaresearch,with funds it receives fromBPandConocoPhillips.Thesecompaniesprovidefundstothefoundationaspartoftheircommitmenttosupportingeducation,undertermsofa1999agreementwiththeStateofAlaska.
WethankUniversityofAlaskaPresident,MarkHamilton;theUABoardofRegents; and theUAFoundationBoard for deciding thatISER’s work merits foundation support. Our Understanding Alaskaworkisongoing,andweplantolookatmanymoreissuesimportanttoAlaska’sfuture.
PleasekeepinmindthatwhiletheUnderstanding AlaskaprogramisanimportantpartofISER’sresearch,itisonlyonepart.TheAlaskaLegislaturecreatedISERin1961,andISERhasbeenanalyzingsocialandeconomicissuesandtrendsinAlaskasincethen.
ISER does research for dozens of both public and privateorganizations, from theNational ScienceFoundation to theAlaskaDepartmentofEducationtotheAnnieE.CaseyFoundation.ISER’sfacultyalsoteachanddoawiderangeofpublicservice.
AlaskanshavecometorelyonISERforinformationaboutthestate’speopleandeconomy.Pleasegetintouchwithusifyouhavequestionsaboutthe Understanding AlaskaprogramorotherISERresearch,andvisitusonlineatwww.iser.uaa.alaska.edu.
FranUlmer,Director InstituteofSocialandEconomicResearch UniversityofAlaskaAnchorage

�
AnassessmentofAlaska’schangingeconomicstructureAn analysis of business taxes on various AlaskaindustriesAn investigation of the special problems that maycomewithresourcewindfallsAreviewofissuesassociatedwithallocatingsalmonamongdifferentusersAdatabasedescribingtourisminAlaskaAdescriptionofruralAlaska’seconomicstructure
About ISERUnderstanding Alaska is just one part of ISER’s broad-
ranging research. ISER is in the College of Business andPublic Policy at the University of Alaska Anchorage. It isAlaska’soldestpublicpolicyresearch institute,establishedbytheAlaskaLegislaturein1961.
ISER has over the years done research for hundredsof public and private organizations. You can find—andsearch—alistofmorethan1,000ISERpublicationssincethe1960sonISER’smainWebsite.Alsoonthatsiteyou’llfindmoreaboutISER,profilesofISERstaff,linkstoindividualfaculty Web sites, and announcements about new reportsandupcomingevents.Seewww.iser.uaa.alaska.edu.
Where to Get CopiesAll new Understanding Alaska research is posted on
the program Web site and is also available in hard copy.We announce new findings in our electronic newsletter,Research Matters.
To learn about our findings from either UnderstandingAlaska or ISER’s many other projects, sign up for ourelectronicnewsletterorourmailinglist—orboth.
To be added to Research Matters, our electronicnewsletter, send a message with your e-mail address to:[email protected]
Tobe added toourmailing list, call 907-786-7710andgiveusyourmailingaddress.
ISER Web SitesUnderstandingAlaska:
www.alaskaneconomy.uaa.alaska.edu
ISERHomePage:www.iser.uaa.alaska.edu
KidsCountAlaska:www.kidscount.alaska.edu
ALASKOOL:www.alaskool.org
GuidetotheBudget:www.citizensguide.uaa.alaska.edu
ISER AddressMailing:3211ProvidenceDrive,Anchorage,AK99508
PhysicalLocation:DiplomacyBuilding,5thFloor,4500DiplomacyDrive,Anchorage,Alaska
••
•
•
••
IntroductIon
Understanding Alaska is a special series of studies bythe Institute of Social and Economic Research (ISER), toexamine economicdevelopment issues andhelpAlaskansunderstandhowtheireconomyworks.Thestudiesbeganin2001,andherewehighlightsomeoftheworksofar.
TheUniversityofAlaskaFoundationhasprovidedmostofthefundingforUnderstanding Alaska—seethedirector’sletteronthefacingpage—butotherorganizationsthatrelyon ISER’s research and analysis have also supported thiswork.The studies examinehowAlaska’s economyworks,whyit’sdifferentfromthoseinotherstates,andhowAlaska’suniquecircumstancesaffecteconomicdevelopment.
Organization of PublicationThispublicationdividesUnderstanding Alaskaresearchinto
threecategories:People,Economy,andFisheries.Attheendofeachsectionisa listofthefullreportsorpresentationsexcerptedforthisoverviewandinformationonhowtogetcopies.Insomecases,we’veupdatedinformationspecificallyforthispublication.
Completed and Ongoing UA WorkSomeoftheworkcompletedsofarincludes:
A summary of the forces shaping Alaska’s peopleandeconomysincestatehoodAnassessmentofhowmuchoftherapidgrowthinAlaska’seconomyinrecentdecadesissustainableAcomprehensivedescriptionofsocialandeconomicconditionsamongAlaskaNativesAdescriptionofhowchangingmarketsandglobal-izationareaffectingAlaska’sseafoodindustryAperspectiveontheroleofNorthSlopeoilinAlaska’shistoryofresourcedevelopmentAnanalysisofgrowthinAlaskahealth-carespendingAdetailedlookattheimportanceoffederalspendingtoAlaska’seconomyAnassessmentofchallengesAlaska’ssalmonindustryfacesandpotentialsolutionsA picture of changing economic and demographicconditionsinAnchorage,where40%ofAlaskansliveAlookathowdifferentracialandethnicgroupsassessthequalityoflifeinAnchorageAnoverviewoftheissuessurroundingtheproposedAlaskanaturalgaspipelineAn analysis of the potential effects of a new statesystemfortaxingoilandgasproduction
More studies of Alaska’s unique economy, and thechallengesinherentinitsstructure,arealreadyunderwayorplanned.Workwehopetoaddincludes:
•
•
•
•
•
••
•
•
•
•
•

�
AlAskA’s PeoPle
Alaskahasabout665,000peopleandalandmassof375million acres—which is twice the size of the 13 originalAmerican colonies. More than 40% of all Alaskans live inAnchorage, and nearly two-thirds are concentrated in thecombined areas of Anchorage, the Mat-Su Borough to thenorth,andtheKenaiPeninsulaBoroughtothesouth.Mostof the rest live in a handful of large communities in thesouthcentral,interior,andsoutheastregions.About10%liveinhundredsofsmallremotecommunitiesaroundthestate,mostlyalongcoastlinesoronrivers,farfromroadsystems.
AlaskahasthehighestshareofindigenousAmericansofany state; one in five residents are Alaska Native. In theremotewesternandnorthernregions,AlaskaNativesmakeupmostofthepopulation.Butoverthepast30years,manyAlaska Natives have also moved to Anchorage and otherurbanplaceswheretherearemorejobs.
Alaska’snon-Nativepopulationhasalwaysbeenamongthecountry’smosttransient,waxingandwaningwithjobgrowthand theupsanddownsofa resource-basedeconomy.Thepopulationisstillmobile,butlesssothanitusedtobe.Sincethe1990stherehavebeennobigboomsandbusts,andthenumberofjobsandthepopulationhavegrown slowly but steadily for nearly 20years. Urban Alaska has become morelike the rest of the U.S.—with an agingpopulation,affluentbabyboomersnearingretirement,andgrowingdiversity.
Lifeinremotevillageshasalsochangedalotinthepast30years,withconstructionofnewhousing, localhealthclinics, andpublic water and sewer systems in mostcommunities.Buteventhoughconditionsarebetter,theystillfallfarshortofthoseinurbanareas.Ruralresidentscontinuetorely heavily on subsistence hunting andfishing,andincomesarelow.
DespitethegrowingsimilaritiesbetweenAlaskansandotherAmericans,Alaskansremain uniquely situated. No other
state has the vast roadless distances, the harsh climateandterrain,andthebroadexpansesofpermafrost.Thoseconditionssharplylimitwherepeoplecanliveandmakeeconomicdevelopmentdifficultandexpensive.
LandownershipinAlaskaisalsounique,withindividualAlaskans owning less than 1% of the land. The federalgovernmentowns60%,thestate28%,andAlaskaNativecorporations12%.Thosecorporationswereformedunderterms of the 1971 Alaska Native Land Claims SettlementAct,andtheyhavenoequivalentanywhereelseintheU.S.(Seepage12.)
Alaska’slocalgovernmentsystemisdifferentaswell.Thestate’s regional governments are calledboroughs insteadof counties, and about half the state has no organizedborough governments. The state government providesbasic services in those areas. Many small communitiesinsideandoutsideboroughsalso lackcitygovernments.AlaskaNativecommunitiesoftenhavesomecombinationoflocaltribalgovernments,councilsformedundertermsoftheIndianReorganizationAct,andcitygovernments.
Pages3through6discussUnderstanding Alaskafindingsaboutthestate’speople.
1900 1910 1920 1930 1940 1950 1960 1970 1980 1990 200032,000 64,000 55,000 59,000 72,000 129,000 226,000 301,000 402,000 550,000 627,000
1897-1906Gold Rush–population doubles
1890 -1920:Rapid growth in commercialsalmon industry
1930s:Revival ofgold mining
1940-1960:Military boom–population triples
1973-77:Pipeline construction boom –
Population up 25%1986-89:
Oil price crash–recession
1980-85: State oil-revenue boom–population up 30%
1989:Prince William Sound
oil spill–largeston U.S. shores1964: Largest
earthquake in U.S. history
1968: Discovery of Prudhoe Bayoil field, largest in North America
1959:Alaska becomes a state
1950s: Large-scale timber harvesting and processingbegin in Southeast Alaska
Alaska Population, 1900 - 2005
2005663,661
Sources: U.S. Bureau of the Census; ISER publications; George W. Rogers and Richard A. Cooley, Alaska Population and Economy; David Kresge, Thomas Morehouse, and George W. Rogers, Issues in Alaska Development
Juneau
OthercommunitiesLargestcities
Anchorage,Mat-Su,andKenaiPeninsulaBoroughs
Fairbanks
Anchorage

�
Long-Term Population TrendsAlaska’spopulationhastripledsinceAlaskabecameastatein1959.Alaskanstodayenjoyfarmorebusinessservicesandamenities,betterinfrastructure,andlowerlivingcoststhanjustafewdecadesago.
PeoplestillmoveintoandoutofAlaskawithboomsandbusts,butmoreofthosedrawntoAlaskaduringtheboomsofthe1970sand1980sstayedonwhentheeconomy slowed, giving Alaska a more stable, olderpopulationwithfeweryoungadults.
Alaskanshavebecomemorediverse,especiallyinurbanareas.TheshareofAlaskanswhoareBlack,Asian,orPacificIslandermorethandoubledsince1960.
ThedisparityinnumbersofmenandwomeninAlaskahas narrowed but not vanished. In 2005 there were106menper100women;in1960therewere132menper100women.
Alaskans have become increasingly concentrated inthesouthcentralregion—becausetheboroughsto thenorth and south of Anchorage grew so fast in recentdecades.In1970,Anchorage,theMat-Suborough,andtheKenaiPeninsulaBoroughmadeupjustunderhalfthestatepopulation.By2005thatsharewas61%.
Nearly80%ofAlaskansliveinthefivelargesturbanareas—the southcentral region plus the FairbanksNorthStarBoroughandJuneau.That’supfrom69%in1970.
The population of rural Alaska—defined here aseverywhereexceptthefivelargesturbanareas—grew50%between1970and2005.Butthepopulationinlargeurbanareasgrewmuchfaster—150%.Asaresult,the share of Alaskans living in rural areas declinedfrom31%in1970to21%by2005.
ISERprojectsthatAlaska’spopulationwilllikelygrowabout1%ayearthrough2020—considerablyslowerthaninthe1960sthroughthe1980s.ThatgrowthwillcontinuetobeconcentratedinsouthcentralAlaska.
•
•
•
•
•
•
•
•
National Parks, Refuges, and Forests151 million acres (including 56 million wilderness)
Native Corporation (Private) 44 million acres
Other Federal Land70 million acres
State Land105 million acres
Individual Private 3 million acres
Who Owns Alaska? (2000)
Total: 375 million acres*
Municipal, University, MentalHealth Trust lands 2 million acres
*Excludes tidelands and inland navigable bodies of water.
Boroughs and City Governments (2001)
OrganizedBoroughs49citygovernments83unincorporatedplaces
Sources:AlaskaLocalBoundaryCommission
NoOrganizedBoroughs96citygovernments92unincorporatedplaces
Past and ProjectedGrowth in Alaska Population
(AnnualAverageGrowthRate)
3.0% 3.1%2.8%
1.3% 1.0%
1960-70 1970-80 1980-90 1990-2000 2000-2020
Source:ISERdatabaseandeconomicprojections
Fairbanks NS Borough
Mat-Su and Kenai Peninsula boroughs
Other places,fewer than 1,000 residents
Anchorage
Where Do Alaskans Live? (2005)
11%
10%
5%
42%
19%
15%
Juneau
Other places, 1,000 or more residents
Source: Alaska Department of Labor, 2005 estimates
White69%
AlaskaNativea19%
Black3.5%
Asian4%
Racial Composition of the Alaska Population, 2000
NH/PacifIsl.1%Otherb3.5%
aIncludingAlaskaNativealoneandNativeandotherrace.bOtherracesandpersonsofmixedraceexceptAlaskaNative
Source:U.S.CensusBureau

�
Alaska Native PeopleAlaska’sNativepopulationmorethandoubledbetween1970and2000.Publichealthprogramsand muchbetterlivingconditionsinremotevillageshavehelpedAlaskaNativesreboundfromdevastatingoutbreaksofsmallpox,influenza,tuberculosis,andotherinfectiousdiseasesinthe1800sandearly1900s.
Morethan75%ofhomesinsmallruralplaces—mostlyAlaska Native villages—had public water and sewersystemsin2005,comparedwithanestimated10%in1970.(ThosefiguresarefromtheAlaskaVillageSafeWaterProgram,whichclassifiesas“rural”placesthathavefewerthan600residentsandmeetothercriteria.)The federal and state governments built publicsanitation systems in roughly 90 remotecommunitiesbetween1975and2003.
Alaska Natives have more jobs, higherincomes, and more education than ever.Buttheyremainseveraltimesmorelikelythan other Alaskans to be poor andunemployedandtodropoutofschool.
Alaska Natives are moving from villagestourbanareas for jobs.In2000,40%ofNativeslivedinurbanareas,andifcurrenttrendscontinuethatsharewillbe50%in2020.Nativewomenofworking age areespeciallylikelytoliveinurbanplaces.
Thepopulationof remote villageshas alsocontinued to grow, despite migration tourbanareas.
•
•
•
•
•
LargenumbersofyoungAlaskaNativeswillbelookingfor jobs inthenext15years.TheNative labor forcewillbe40%largerin2020thanitwasin2000.
ISER projects that at current trends, the Nativepopulationwillgrowfrom120,000in2000to165,000by2020.
•
•
FromRural 11,140 ToUrban
Estimated Number of Alaska Natives Moving From Rural To Urban Areas, 1990-2000
Source:ISERestimates,basedonU.S.censusdata
2000
2010
2020
45,935
57,635
64,335
Projected Growth in Native Labor Force, 2000-2020
+26%
+11%
Source:ISERprojections
Circa1740-8057,000
1867 1910 1940 1970 2000
-+25,000 32,000 51,000
Alaska Native Population
*Includes persons who identified themselves as either Alaska Native alone or Alaska Native and some other race.
Population more than doubles in
30 years
Population regainspre-contact level
DiptheriaepidemicSmallpox, measles
epidemics
Russians arrive
U.S. buys Alaska
Public healthprograms fightTB and otherdiseases
120,000*
Sources: See timeline, page 2
TBwidespread
Influenzaepidemics

�
Anchorage: Diversity and GrowthThe Municipality of Anchorage, with a population of
277,000in2005,isbyfarAlaska’slargestcity.Anchorage’seconomyisalsothebiggestandmostdominantinAlaska.
ThetwonextlargestcitiesafterAnchorage,FairbanksandJuneau,eachhadabout31,000residentsin2005—butthebroaderFairbanksNorthStarBoroughhadabout87,000.
FastgrowthinthenearbyMat-SuBoroughismakingAnchorage more of a commuter city. In 2005 anestimated8,000commutersdrovefromtheMat-SutoAnchoragedaily.That’snearlydouble thenumber in1990—and thenumberof commuters coulddoubleagainby2030,ifcurrenttrendscontinue.
Anchorageisbecomingmorediverse,withfastgrowthamong minorities and slow growth in the majoritywhitepopulation.
MorethanathirdofAnchorage’sresidentsin2000werebabyboomers—oneofthehighestsharesanywhereinthecountry.Theyarethecity’smostaffluentandbest-educated group, and what they decide to do whentheyretirewillhavebigeffectsonthecity’spopulationandeconomyinthefuture.
Thecity’sover-65populationisgrowingatfivetimesthe U.S. average, even before the baby boomers hitretirement age.At current rates, and given the city’slarge number of baby boomers, the number of cityresidents over 65 could triple by 2020. Older resi-dents canhelp stabilize the economy,becausemanyhaveincomesthatdon’tdependonlocaljobs.
Anchorage offers opportunity for immigrants, withinternational immigration 20% higher in the late1990sthanitwasadecadeearlier.ThemostcommonbirthplacesofrecentimmigrantsareSamoaandotherPacificIslandplaces,thePhilippines,andMexico.
•
•
•
•
•
Source:U.S.CensusBureau
Anchorage Civilian Population By Race
1990 2000 IncreaseWhite 164,136 170,145 +4%Black 9,952 11,942 +20%Asian 9,624 12,198 +27%Ak.Native 14,750 23,803 N/A*Pac.Isl 492 3,024 +415%Other N/A 10,954 N/A*
Figuresexcludepeoplelivingingroupquarters.*"Other"categoryincludespeopleofmixedrace,exceptAlaskaNativesofmixedrace,whoareinAlaskaNativecategory.Wecan'tcalculategrowthratesforthesecategories,becausethemixed-racecategorydidnotexistuntil2000.
Anchorage Residents 65 and Older
1980
ShareofCivilianPopulation
199020002004
3,6587,931
13,53916,244*
2.5%3.9%5.7%6.4%
Sources:2004,AlaskaDepartmentofLabor;otheryears,U.S.CensusBureau
U.S.Average65+:12.4% *Estimate
Number
Most Common Birth Places of Recent International Immigrants (1995-2000)
Notes:IncludesthoseborninU.S.territoriesorcommonwealths,butexcludesthoseborntoAmericanparentstemporarilylivingabroad.
Samoa,Guam,OtherPacificIslands
Philippines
MexicoCanada
KoreaPoland
ChinaRussia
Thailand
16%
11%9%
4.5%
4.5%
4%4%
3%3%
4.5%
Source:U.S.CensusBureau
Colombia
Projected Growth in 65+ Population
Number Share of Anchorage Population
2000:13,5392010:23,7932020:37,305
6%8%
11%
Sources:U.S.CensusdataandISERestimates
Under 2031%
35-5536%
20-3421%
56-64
65andolder6%
6%
Youngadults
Babyboomers
Anchorage People By Age, 2000
Source:U.S.CensusBureau

�
The 93 languages spoken by Anchorage’s schoolchildrenreflectthediversityofthepopulation.Alargemajority(86%)speakEnglishastheirfirstlanguage,but14% speak other languages, including Alaska Nativelanguages.Spanish,Tagalog(thePhilippines),Samoan(Pacific Island), and Hmong (southeast Asia) are themostcommonlanguagesotherthanEnglish.Manyoftheotherlanguageshaveonlyafewspeakerseach.
There’sbeenashift inAnchorage jobs inthepast25years,withmoreofthebetterpayingjobsrequiringacollegeeducation.In1980,high-schooldropoutscouldearnnearly75%ofwhatcollegegraduatesearned.By2000,thatsharehaddroppedto43%.
The rich aren’t quite so much richer than the poorin Anchorage as they are nationwide. That’s partlybecause the state makes annual payments to allresidents—including children—from the earnings ofthehuge state savingsaccountcalled thePermanentFund (see page 7). Also, Anchorage doesn’t havebillionaires—whoinotherpartsoftheU.S.makethedisparitybetweenlowandhighincomesmuchlarger.But there is stilla lotofpovertyamong thoseat thebottom of the economic rung—concentrated amongminorities, single mothers, old people living alone,andyoungpeoplewithoutmucheducation.
For More DetailsFor complete Understanding Alaska reports and presen-
tationsaboutAlaska’speople,go to theprogramWebsite:www.alaskaneconomy.uaa.alaska.edu
Anchorage in the 21st Century. Presentation by ScottGoldsmith.
Trends in Alaska’s People and Economy, byLindaLeask,MaryKillorin,andStephanieMartin.
Anchorage at 90: Changing Fast, With More to Come, byScottGoldsmith,LindaLeask,andLanceHowe.
ANCSA Regional Corporations: Financial Update. PresentationbySteveColt.
Status of Alaska Natives 2004, byScottGoldsmith,JaneAngvik,LanceHowe,AlexandraHill,andLindaLeask.
Alaska Native Population Overview. PresentationbyScottGoldsmithandLanceHowe.
Alaska Economic, Demographic, and Social Trends. PresentationbyScottGoldsmith.
Characteristics of Alaska Migrants, 1960-2000, byLanceHowe.
Alaska Rural Settlement Patterns, 1990-2000, byLanceHowe.
Racial and Ethnic Diversity in Anchorage, by ScottGoldsmithandRosylandFrazier.
•
•
•
Languages Spoken by Anchorage School District Students, 2006
14%
English86%
SpeaklanguageotherthanEnglishasprimaryorsecondarylanguage
Totalstudents:49,589
1.Spanish 1,8382.Tagalog(Philippines) 9493.Samoan(PacificIsland) 8194.Hmong(SoutheastAsia) 7655.Korean 3696.Lao(Laos) 3157.Yupik 2908.Russian 1619.Mien(Thailand) 15710.Inupiaq 90Allotherlanguages 971Total 6,724
Source:AnchorageSchoolDistrict
What Difference Does Education Make?
LessthanHighSchool
HighSchool
1to3yearsofCollegeFourormoreyearsofCollege
1980
1990
2000
Median Earnings of High-School Dropouts as a Share of Earnings of College Graduates
Median Earnings of Anchorage Workers,*By Education Level, 2000
72%
56%
43%
$21,300
$32,000
$36,000
$50,000
Source:U.S.CensusBureau
*Full-timeworkers
Who Lives in Households at theBottom and the Top of Income Range?
(AsShareofTotalGroup)
Bottom 20% of HH
51% 3%
24% 22%
7% 30%
7% 39%
Source:U.S.CensusBureau
Adultswith4ormoreyearsofcollege
ResidentsbyRaceWhiteBlack
Ak.NativeAsian
Pac.Isl.
Top 20% of HH
12% 27%29% 15%27% 13%19% 18%21% 5%
Childrenbeingraisedbysinglemothers
People65andolder
Full-timeworkers

�
AlAskA’s economy
When Alaska became a state, in 1959, some Americansthoughtitwasamistake:Alaskawastoofaraway,cold,andundeveloped.Ithadfewpeopleandafragileeconomythatreliedlargelyonmilitaryactivitiesandsalmonfisheries.
But Alaska now has six times the jobs it had then. Mostof that growth can be traced to oil development. In 1968,the Prudhoe Bay oil field—the largest in North America—wasdiscoveredonAlaska’sNorthSlope.Apipelinetocarrythat oil to market was completed in 1977. At the peak ofproductionin1988,thepipelinecarried2millionbarrelsofoiladay—about20%ofallU.S.oilproductionatthetime.
ThestategovernmentownstheNorthSlopeoilfields,soitcollectsnotonlytaxesbutalsoroyaltiesfromoilproduction.From1977 to 2005, the state collected (in today’s dollars)nearly $100 billion in oil revenues. It spent most of thoserevenues, paying for government operations, expandingservices,andbuildinginfrastructure.Butitalsosavedsome.
In1976,AlaskavoterscreatedthePermanentFund,tosaveashareofthestate’soilrevenues.TheprincipalofthefundisprotectedbytheAlaskaConstitution.Thestatecan,however,spendthefund’searnings,anditspendssomeeveryyeartosendchecks—PermanentFunddividends—toallresidents.
ISERestimatesthatoneinthreeAlaskajobsdependonoildevelopment—includingdirectindustryjobs,jobssupportedby state spending of oil revenues, and jobs supported byAlaskans’spendingofPermanentFunddividends.
Sincethe1990s,aninfusionoffederalmoneyforprojectsandprogramshasalsotriggerednewgrowth.ISERestimatesthatoneinthreeAlaskajobsdependonfederalspending.
So even though the economy is more diversified than itused to be, it still relies on resources—mainly oil—andfederal spending.Butoilproduction is less thanhalfwhatit was at its peak, and declining oil revenues led to statebudget deficits in most years from 1994 to 2004. Thereis also no guarantee that federal spending will remain atcurrent levels—although military activities, huge federallandholdings,andobligationstoAlaska’sindigenouspeoplemeanthatfederalspendingwillcontinuetobesubstantial.
Alaskaalsohasvaluableassetsitlacked30yearsago:morepeople,better infrastructure,reducedlivingcosts,andthestatePermanentFund—thebiggest legacyofoilrevenues.Thatfundhadabalanceofabout$34billioninearly2006.Alaska has, for the first time, transformed a temporaryresourceintoapermanentasset,capableofproducingabig,relativelystableincomeeveryyear.
What the future holds for Alaska’s economy is hardto know. Alaska has repeatedly been saved by surprisedevelopments,withPrudhoeBaybeingby far the largest.Muchhigheroilpricesbroughtthestatebudgetintobalanceandcreatedasurplusin2005—andlikelywillagainin2006.HigherpricesfornaturalgasmaymakeconstructionofagaspipelinefromtheNorthSlopefeasible.AndifNorthSlopegasismarketed,thestategovernmentwillhaveamajornewsourceofincomeandAlaskanswillhavemorejobs.
Pages7to13highlightUnderstanding Alaskastudiesofthestateeconomy.
Alaska’s Resource-Based EconomyAlaska’s economy has always depended on natural
resources.Tremendouswealthhasbeenproducedfromfur,gold,copper,fish,andoil.Between1868and2002,thevalueofAlaskaresourceproductionwasaround$400billion, intoday’sbuyingpower.
BeforeAlaskabecameastate,fishfromAlaskawaters—mostly salmon—were the territory’s most valuableresource,accountingfornearlytwo-thirdsofthevalueofallresourceproductionbetween1868and1958.
Since statehood, oil has made up nearly 85% of thevalue of all Alaska resource production. It’s also beenfarmorevaluable thananypreviousdevelopment.Oilproducedfrom1959to2002wasworthseven timesalltheresourceproductionfromthetimetheU.S.boughtAlaskain1868untilitbecameastatein1959.
•
•
Source: Terrence Cole and Pamela Cravez, “Blinded By Riches,” UA Research Summary No. 3
Value of Alaska Resource Production, 1868-2002(In 2002 Dollars)
Peak Value Copper
Peak Value SalmonPeak Value Gold
Peak Value Oil
1959-2002: $350 billion1868-1958: $40 billion
1868 1905 1916 1948 1959 1981 2002

�
Unlikewithpreviousdevelopments,Alaskahasseenbigbenefitsfromoildevelopment.ThestateownstheNorth Slope oil fields, and taxes and royalties overtheyearshaveamountedtoaboutonequarterofthevalueofoilproduction(measuredatValdez,thepipe-lineterminal).Thestate’soilrevenueshavepaidalmostallstategen-eralexpensessince1978,andstatespendingofthoserevenuesfueledeconomicgrowth,particularlyatthepeakofproductionandrevenuesinthe1980s.Alaska now has an asset—the Permanent Fund—capableofgeneratingmorethan$1.7billioninannu-alincome,inadditiontoearningsneededtoprotecttheprincipalfrominflation.Thefundhadabalanceofmore than$34billion inearly2006.TheAlaskaConstitution prohibits the state from spending theprincipalofthefundbutnottheearnings.Alaskahasalsotakenaportionofitsoilroyaltiesinkind—that is, in oil—and sold the oil under long-termcontracts,tohelpdeveloplocalrefineries.Thoserefinerieshaveprovidedjobs,addedtolocaltaxbases,andbenefitedAlaskaconsumersandbusinesses.
•
•
•
•
Proposed Natural Gas PipelineNaturalgasmaybe thenextbigresourcedevelopment
inAlaska.The state’sNorthSlopehasoneof the largestaccumulationsofnatural gas in the country—35 trillioncubicfeetofknownresources.Forperspective,that’stheenergyequivalentof6billionbarrelsofoil,orabouthalftheestimatedenergyinthePrudhoeBayfieldwhenitwasdiscovered.Totalreservesmaybeintherangeof100trillioncubicfeet,accordingtotheU.S.GeologicalSurvey.
Theknownresourceslieunderlandthestateowns,butithasleasedtheoilandgasrightstoBP,ConocoPhillips,and ExxonMobil. The state owns a royalty share ofthe gas—12.5%—and it has the authority to collectproduction,corporateincome,andpropertytaxes.
Untilrecently,investorsdidn’tthinkagasprojectwouldbeeconomic,giventhatthepipelineneededtocarrythegas to market is expected to cost in the range of $20to$25billion.Now,withhighernaturalgaspricesandchanges in the North American market, many peoplethinkapipelineprojectmaybefeasible.
What route the pipeline would follow, how it wouldbe financed, and who would own it had not yet beendetermined in early 2006. The two routes most talkedaboutare(1)fromPrudhoeBayintotheInteriorandthenalong the Alaska Highway into Canada and the Lower48,and(2) fromPrudhoeBay toValdez,paralleling theexistingtrans-Alaskaoilpipeline.
Even under the most optimistic projections, gasproduction wouldn’t start in this decade. But Alaskaultimatelystandstogainalotifagaspipelineisbuilt—anew long-term source of state revenues; more jobs andincreasedbusinessactivity;anincreasedlocalpropertytaxbase;andapotentialnewin-statesourceofnaturalgasforhomeheating,electricity,andindustrialuses.
Fish
Mining5%
Oil and Gas84%
11%
$40Billion(In$2002)
$350Billion*(In$2002)
*Excludesvalueoftimberproduced,sincenodataisavailable.Valueofagricultureisafractionof1percentoftotalresourcevalue.
(1959-2002)
Contribution of Individual Resources to Total Alaska Resource Production Value
Gold
Copper
Fur5%
Fish63% 7%
25%
(1868-1958)Before Statehood
After Statehood
Source:“BlindedbyRiches,”UA Research SummaryNo.3
From One-Time Resourceto Permanent Asset
Permanent Fund Balance,April 2006: $34 billion
Estimated Annual Earnings:$1.7 billion
(After Inflation-Proofing)
Oil
Sources: Alaska Permanent Fund Corporation and ISER estimates
Delta Junction
ValdezAnchorage
Prudhoe Bay
Prud
hoe
Bay
to V
alde
z ro
ute
Potential spur line
Alaska H
ighway route
Canada
LNG
Proposed Gas Pipeline Routes (2005)

�
Native non-profit organizations get about 8%,for providing health and other services to AlaskaNatives.TheUniversityofAlaska,privatecolleges,andschooldistrictsgetabout2%.
MilitaryspendingremainscriticaltoAlaska’seconomy.Forty years ago, military spending made up mostfederal spending inAlaska.With the fast growth inother kinds of federal spending and the closing ofsomemilitarybasesinAlaska,militaryactivitiesarenolongerasdominant.Buteventoday,withnumbersofmilitarypersonnelatlessthantwo-thirdstheir1960levels, Department of Defense spending in Alaskatotaledmorethan$2billionin2004.
•
•
AlaskaNativeNon-Profits*8%
Businesses18%
StateandLocalGovernments
28%
Universityandothers2%
Non-Profits3%
Individuals41%
Who Gets Federal Dollars?(As of 2002)
Sources:ConsolidatedFederalFundsReportandFederalAssistanceAwardsDataSystem
*Indiantribesunderfederallaw.
ThemilitaryhasbeenamainstayofAlaska'seconomysinceWorldWarII.
Themilitaryremainsthelargestsingleemployer,evenwithfewerpersonnel.
33,000
18,000
2000 20051960
DepartmentofDefensespendinginFY2004wasabout$2.3billion.
Payroll $1billion
Sources:ISERdatabase;ConsolidatedFederalFundsReport
The Military in Alaska
20,933
Construction,Equipment,Supplies$1.3billion
Still, despite improved conditions, the potential pipelineremainsabig,riskyinvestment.Thestatecan’tcontroliforwhenapipelineisbuilt.ButtheStrandedGasActallowsthestategovernmenttoencouragelargegasprojectsthatmightotherwisebeuneconomic,throughspecialfiscalterms.
ThestatehasusedthegasacttonegotiatewiththeNorthSlopeleaseholders,andinMay2006thegovernorreleasedadraftagreementbetweenthestateandtheleaseholders.Majorprovisionscallforthestatetoownashareofthepipeline;totakeitsroyaltiesandproductiontaxesingasratherthaninpaymentsfromtheproducers;tomarketthegasitself;andtokeeptaxprovisionsunchangedoverthetermoftheproject,iftheleaseholdersmeetspecificworkcommitments.
No agreementwill go into effectuntil it hashadpublicreviewandthelegislatureapprovesit.Evenifanagreementisapproved,thatdoesn’tmeanapipelinewillbebuilt.Theagreement would set terms if a pipeline is built. To helpAlaskans understand the policy issues associated with apotentialgaspipeline,ISERdescribedthoseissuesinashortpublication and held a public forum in November 2005.Thepublicationandforumpresentationsareavailableat:
www.alaskaneconomy.uaa.alaska.edu/pipeline.htm
Federal Spending in AlaskaThefederalgovernmentandafewprivateindustries—oil,
tourism,commercialfishing,mining,logging—bringinmostofthenewmoneythatmakesAlaska’seconomygrow.Howimportantisfederalspending?The$8.4billionthefederalgovernmentspentinAlaskain2004wasroughlyequivalenttoallthewagesprivateindustrypaid,andmorethantriplethestate’sGeneralFundrevenues.In2002,ISERestimatedthatfederalspendingsupportedoneinthreeAlaskajobs.
Federal spending has always been important to Alaska’seconomy, but it became even more prominent in recentyears,becauseitgrewsofast.Federalspendingmorethandoubledinthepast20years,evenadjustedforinflation.
Spending per Alaskan is high for a lot of reasons—includingmilitaryactivities,federalobligationstoAlaska’sindigenous people, large federal land holdings, highercostsof ruralconstruction,and thecontinuingneed fornew sanitation systems, roads, and other infrastructure.EverybodyinAlaskabenefitsinonewayoranotherfromfederalmoney.
Roughly 40% of federal spending is forindividual Alaskans—who collect pay checks,SocialSecurity,orotherfederalpayments.Stateandlocalgovernmentsgetabout30%offederalmoneyintheformofgrantsforeverythingfromroadconstructiontomedicalcareforthepoor.
Businesses get about 20%, because the federalgovernment buys equipment and supplies andhires companies to do construction, buildingmaintenance,andotherservices.
•
•
How Big is Federal Spending? (2004)
Source: ISER analysis of federal spending
$2.4 billion
$580 million
$8.4 billion $8.3 billion
State GeneralRevenues
Perm. FundDividends
FederalSpending
Private IndustryWages

10
higherrelativeincomesduringtheeconomicboomsofthe1970sand1980s.Slowerjobgrowth,eliminationof some high-paying jobs in the oil industry, andadditionoflower-payingtradeandservicejobsinthepast decade drew Alaska incomes closer to nationalaverages. However, keep in mind that in the pastseveral decades living costs in Anchorage and otherurbanAlaskaplaceshavealsodeclinedrelativetoU.S.averages(seefacingpage).
Growth in real (adjusted for inflation) per capitaincome in the coming years will likely be less thanhalf a percent a year, reflecting slower job growth, acontinuing shift to lower-paying jobs, and slowergrowthingovernmentpaymentstoindividuals.
•
Jobs and IncomeFormostofthetimesinceAlaskabecameastate,economic
growthhasbeendrivenbyoildevelopment.Theeconomyhasgone throughseveralboom-and-bustcycles related inonewayoranothertothefortunesofoil.Butthebustsdidn’teliminate all the growth the booms brought, and Alaskaalwaysendedupwithmoreeconomicactivitythanbefore.
Since 1990, economic growth has been slower, becauseboth oil production and state oil revenues have been indecline. Rapid growth in federal spending, and sharplyhigheroilpricesinthemostrecentyears,havehelpedoffsettheeffectsofdecliningoilproduction.
Thefutureisimpossibletopredict,especiallyinAlaska,where unexpected events have so often helped theeconomy. But barring any big surpises, it’s mostlikelythateconomicgrowthwillbeslowerinthecomingyears,astheeconomycontinuestoadjustto smaller oil production. If North Slope naturalgas is developed, it won’t be on the market foryears. Other commodity-producing industries—fishing, mining, and logging—will help supportthe economy but will also cycle up and down.And because government spending plays such abig role in Alaska’s economy, decisions made inWashington, D.C. and Juneau will continue toinfluencetheeconomy.
In2005Alaskahadnearlysixtimesmorejobsthanin1961.Serviceandtradeindustriescreatedabout half the new jobs since 1960, as the economymaturedandestablished local support industries andastourism increased. The labor force also changed, as theshare of working-age women with jobs increased fromunder40%in1960toabout68%now.
Jobgrowthinthe1990swasmuchslowerthanintheearlydecadesofstatehoodandwilllikelybesloweryetthrough2020,atanaverageofunder1%ayear.
PercapitaincomesofAlaskanswereabout3%abovetheU.S.averagein2004,insharpcontrasttothemuch
•
•
50
100
150
200
250
300
350
0400959085807570651961
Sources:AlaskaDepartmentofLabor;ISERdatabase.Excludesself-employedandmilitary.
Alaska Employment, 1961-2004(In Thousands of Wage and Salary Jobs)
301,385
57,000
5.6%
1960-70 1970-801980-901990-2000 2000-2020
3.3%
1.8%
0.8%
Sources:ISERdatabaseandeconomicprojections
6.3%
Past and Projected Growth in Alaska Jobs (Annual Average Growth Rate)
Source:U.S.BureauofEconomicAnalysis,May2006
How Does Income per Person in AlaskaCompare with the U.S. Average?
20001970
Alaska as percent of U.S.128%
103%
179%
(U.S.Average=100)20041976
152%
1983 1988
115%
1960-70
5.2%
3.3%
1.1% 1.0%0.2%
1970-80 1990-99 2000-20201980-90
Source:ISERdatabaseandeconomicprojections
Past and Projected GrowthIn Real Per Capita Income
(Annual Percent Change, Adjusted for Inflation)

11
Alaska CostsLivinginAlaskahashistoricallycostmorethaninother
U.S. places. Alaska is far from the contiguous states;transportinggoodshere—especiallytoremoteplaces—addsto their costs; small communities can’t take advantage ofeconomiesofscale;manyplacesareaccessibleonlybyairorwater.
Costs in remote rural areas are still very high, but overtimemostlivingcostsinAnchorageandurbanplaceshavemovedmuchclosertotheU.S.averages—thanksmostlytogrowinglocalpopulationsandmoreefficienttransportation.ISER estimates that in 2005 overall costs of living forfamiliesinAnchoragewereintherangeof10%abovetheU.S.average.
Thebigexceptionismedicalcosts,whichhaveremainedhigh.AsistrueacrosstheU.S.,health-carecostsinAlaskahavebeengrowingfasterthancostsofjustabouteverythingelse, takingmoreof familybudgetsanddrivinguplaborcostsforbusinesses.
ButmedicalcostswerehigherinAlaskatobeginwith,and theyseemtohaverisenas fastascostsnationwide.OverallAlaskamedicalcostsareintherangeof25%abovenational averages—but the difference varies quite a bitamongvariousservicesandprocedures.
In2006anUnderstandingAlaskastudylookedathealth-carespendinginthestateandfound:
Health-care spending in Alaskatotaled $5.3 billion in 2005, upfromabout$1.6billionin1991.Forperspective, $5 billion is one-thirdthe value ofNorth Slope oil exportsin 2005—a year when oil priceswere high. It’s nearly one-sixth thevalueofeverythingAlaska’seconomyproducedin2005.
Perpersonspending forhealthcare inAlaskaincreased176%injust15years.
•
•
Health-care spending could double again between2006and2013,ifcurrenttrendscontinue.
Everyonesawbig increases inhealth-carespending,but costs for employers (both private and public)increased the fastest, nearly quadrupling between1991and2005.CostsforindividualAlaskansroughlytripled, as did costs of government programs. Thelargestandthefastest-growingisMedicaid,thejointfederal-state program mainly for low-income anddisabledpeople.
Population growth and general price inflationaccount for roughly 40% of the annual growthin health-care spending in Alaska in recent years.What’s driving the rest of the growth? Just abouteverybody has an opinion, citing many possiblecontributors—including the U.S. system of healthcaredelivery;changesintreatmentsandtechnology;a growing number of older Americans and otherchanging demographics; high profits for insuranceand drug companies; over-eating and inactivityamong Americans; and others. The study drew noconclusionsaboutwhat’sdrivinghealth-carecosts—but future Understanding Alaska work will collectmore data on Alaska’s health-care industry andattempttoshedmorelightonwhat’sbehindthefastgrowthinhealth-carecosts.
•
•
•
100%
125%
150%
1990198019701961
Costs46%higheratstatehood
Costs11%highertoday
Sources:U.S.BureauofLaborStatistics,AnnualFamilyBudgets,1961-1981;ISERestimatesbasedonchangesinconsumerpriceindexes,1982-2005.
2000
Anchorage Living Costs as a Percentage of U.S. Average Costs, 1960-2005(Four-Person Family at Moderate Standard of Living, U.S.=100)
2005
Growth in Alaska Health-Care Spending, 1991-2005
$1.6 Billion
Total Spending Per Person Spending$5.3 Billion
1991 2005
$2,884
$7,970
1991 2005
+230% +176%
Source: Mark Foster and Scott Goldsmith, “Alaska’s $5 Billion Health-Care Bill,” UA Research Summary No. 6

12
Alaska Native CorporationsAlaska has both for-profit and non-profit Native
corporationsthathaveagrowingroleintheeconomy.
The1971AlaskaNativeClaimsSettlementAct(ANCSA)establishedfor-profitcorporationstomanagethe44millionacresand$1billionawardedAlaskaNatives insettlementof their aboriginal land claims. Those are 13 regionalcorporations (12 inAlaskaand1outside) andmore than
200 village corporations. The corporations are a uniqueexperimentinmethodsofsettlingaboriginalclaims.
There are also non-profit Native corporations that areseparatefromtheANCSAcorporations;theylargelygrewoutofNativeassociationsthatpre-dateANCSA.Thenon-profitsadministerfederalandstatehealth,housing,andothersocialserviceprograms.ThefigurebelowhighlightssomeoftheeconomiccontributionsofAlaskaNativecorporations.
$40,431
Doyon
NANA
Bering Straits
Cook Inlet
Ahtna
Calista
Chugach Alaska
Aleut CorporationKoniag
Sealaska
Cumulative Dividends Per Shareholder, Alaska Native Regional Corporations, 1971-2003*
$113,468
$8,353
$460
$49
Bristol Bay
$9,895
$1,249$11,564
$5,469
$6,908
$10,682
$8,319
*For consistency over time, dividends per shareholder are based on original number of shareholders owning 100 shares each. Includes special distributions by Cook Inlet corporation. Some corporations have also made special distributions to Native elders. Sources: Association of ANCSA Regional Corporation Presidents/CEOs; annual reports, regional corporations;Alaska Department of Labor and Workforce Development, Research and Analysis
Arctic Slope
The for-profit Native corporations formed under the 1971 Alaska Native Claims Settlement Actand the non-profit Native corporations that administer federal and state social service programscontribute to the economy in a number of ways. The for-profit corporations are by far Alaska’s largest private land owners, owning 12% of Alaska lands. Other private landowners own about 1%.
Together, the for-profit and non-profit Native corporations make up 1 in 6 of the state’s largest 100 employers and employ more than 11,000 people.
The for-profit corporations award more than $4 million in scholarships to an average of about 2,900 students per year.
The for-profit regional corporations have paid more than $1.3 billion in dividends to their shareholders through 2003. The map shows cumulative dividends per shareholder from 1971 through 2003.
Alaska Native Corporations in the State Economy, 2005

13
Effects of Permanent Fund DividendsAn important and unique influence on economic life
inAlaskaistheannualPermanentFunddividend.Everyyearsince1982,thestategovernmenthaspaidindividualAlaskans“dividends”fromtheearningsofthePermanentFund, the big state savings account established with ashareofoilrevenues.
Total dividend distributions vary by year, based onchangesinfundearnings.Inrecentyearsthey’veamountedtoanywherefrom$500millionto$1billionannually.In2005,thetotaldividenddistributionwas$558million,orabout$850perAlaskan.
These dividends have major economic effects. TheyboostincomesofallAlaskans,buttheireffectsonpoorerAlaskansarestriking.UnderstandingAlaskaresearchhasfound that dividends help make income distribution inAlaskamoreequitablethanitisinotherstates.
Dividends also reducepoverty inAlaska; for example,ISERestimatesthatwithoutthedividends,twiceasmanyAnchorageresidentswouldhavefallenbelowthefederalpovertylinein2000.
And in remote rural areas,where average incomes arelow,dividendsarebigcontributors.Forexample,in1999,whendividendswere close to$2,000perAlaskan, theymadeup15%ofpercapitaincomeintheWadeHamptoncensus area in western Alaska, which has the lowestincomesinthestate.
WhenAlaskansspendtheirdividends,theeffectsripplethroughout the economy, supporting thousands of jobs.ISERestimatesthatevery$1millionofPermanentFunddividendssupportsabout9.5jobsinprivateindustry.Soin2005,totaldividendsofabout$558millionwouldhavesupported roughly 5,300 jobs in private industry—orabout2in100ofallprivatejobs.(ThatestimateisbasedoncalculationsISERdidin1999,adjustedforpriceincreasessincethen.Seewww.citizensguide.uaa.alaska.edu.)
For More DetailsTo see complete Understanding Alaska reports and
presentationsontheeconomy,gototheprogramWebsite:www.alaskaneconomy.edu
Changing Alaska’s Oil and Gas Production Taxes: Issues and Consequences,byMatthewBerman.
The Alaska Natural Gas Pipeline: What’s It All About? (variousauthors).
Federal Spending and Revenues in Alaska, by EricLarsonandScottGoldsmith.
Understanding Alaska State Finances, by SharmanHaley.
Alaska’s $5 Billion Health-Care Bill, byMarkFosterandScottGoldsmith.
Trends in Alaska’s People and Economy, byLindaLeask,MaryKillorin,andStephanieMartin.
Alaska Business Development. PresentationbyLeeGorsuch.
Visitor Expenditures. PresentationbySteveColt.
Economic Contributions of University Research, byScottGoldsmithandPamelaCravez.
Alaska’s Economic Structure. PresentationbyScottGoldsmith.
Blinded by Riches: The Prudhoe Bay Effect, byTerrenceCole.
Economic Development Through State Ownership of Oil and Gas, byMatthewBerman.
Sustainable Development and Sustainable Income from Alaska’s Resources, byMatthewBerman
Status of Alaska Natives 2004, byScottGoldsmith, JaneAngvik,LanceHowe,AlexandraHill,andLindaLeask.
Anchorage at 90: Changing Fast, With More to Come,byScottGoldsmith,LanceHowe,andLindaLeask.
1982 83 84 85 86 8788 89 90 91 92 93 94 95 96 97 98 99 00
$1000*
$404
$845.76$952.63$990.30
$1963.86$1850.28
*1982dividendwasaspeciallegislativeappropriationfromtheGeneralFund,notPFearnings.
01 02 03 04 05
PermanentFundbalance,April2006:$34billion
Source:AlaskaPermanentFundCorporation
Permanent Fund DividendsPer Person, 1982-2005

14
FIsherIes
Alaska has subsistence, sport, and commercialfisheriesthatbenefitAlaskans,theircommunities,andtheeconomyinvariousways.Herewediscussonlythecommercialfisheries,becausethat’swhatUnderstanding Alaskaresearchhasexaminedsofar.Andbecausethereareanumberofreportsandpresentationsoncommercialfisheryissues,wesummarizethemseparatelyhere,inadditiontotheearliergeneraldiscussionaboutAlaska’sresource-basedeconomy.
What Are Alaska’s Commercial Fisheries?Alaska’sfisheriesareamongtherichestintheworld,
producinghalftheseafoodharvestedintheU.S.ThosefisheriesarecriticaltoAlaska’seconomy,supportingtensofthousandsofjobs,mainlyincoastalcommunities.Fishhave been harvested commercially in Alaska waters formorethan120years.BeforeAlaskabecameastate,fish—almostentirelysalmon—accountedfornearlytwo-thirdsofthevalueofAlaska’sresourceproduction.(Seepage8.)
In2004,fishermenharvestedabout5.4billionpoundsofseafoodwithavalueof$1.2billionfromAlaskawaters.Thestate’sseafoodcatchincludessalmon,halibut,shellfish(mainlycrab),herring,andgroundfish.
Groundfish,mostlyfromtheBeringSea,accountformorethan80%oftheweightofthecatch.Butsalmon,halibut,andshellfishareallmorevaluableperpound,sogroundfishmakeuponlyabouthalfthevalueofthecatch.
Ingeneral,thestategovernmentmanagesfisherieswithinthree miles of shore and the federal government managesfisheriesbeyondthethree-milelimit.Ofthefisheriesthestatemanages,salmonarebyfarthemostvaluable.Afewfisheriesaremanagedjointly,andmanagementofsome(halibut,forexample)isgovernedinpartbyinternationaltreaties.
Effects of Farmed Production and GlobalizationTheworldseafoodindustryisinaperiodofrapidand
profoundchange,drivenbygrowingproductionoffarmedfish—aquaculture—and by globalization. Those factorsare transforming seafood production, processing, anddistributioninAlaskaandaroundtheworld.
Production of farmed fish (including salmon and manyother species) is growing rapidly, because fish farmerscan meet market demand for predictable, year-roundsupplies.Growingsuppliesoffarmedfishhavefar-reachingimplicationsforwildseafood:
Increasing the supplyof farmedfishputsdownwardpressureonpricesofbothfarmedandwildfish.
Farmed fish set new standards for consistency,availability,andquality.
Farmed production changes the dynamics of seafoodmarkets.Pricesdon’tincreaseasmuchwhenwildcatchesfall,ordecreaseasmuchwhenwildcatchesrise.
•
•
•
Farmedproductionislikelytokeepgrowingrapidly.Theglobalfish-farmingindustryhasbigresourcestoinvest in research, production, and marketing—andtechnologicalinnovationisoccurringquickly.
Globalizationofseafoodmarketsisanothermajorforceaffecting Alaska seafood producers. It increases compe-titionfromothersuppliersaroundtheworldandpromptsnewdemandsfrombuyers—whichaddtoproducers’costs.Specificchangesresultingfromglobalizationinclude:
Rapid expansion of seafood trade and a shift ofprocessingtocountrieswithlowerlaborcosts
Increasing consolidation and market power in theretailandfood-serviceindustries
Restructuringofseafooddistributionnetworksandincreasingpressureonseafoodsupplierstoimprovequalityandreducecosts
Establishment of international standards for foodhandlingandsafety
More demands from buyers for new types ofproducts
Together, globalization and aquaculture will put down-ward pressure on prices for wild-fisheries products andcontribute toeconomic,social,political,andmanagementchangesforwildfisheries.
However, those two factors will also create newopportunities for wild fisheries, by expanding globaldemand and creating new niche markets. Wild fisheriesthatcanmeetmarketstandardsforqualityandconsistencywillbeabletotakeadvantageofthesenewopportunities.
•
•
•
•
•
•
13%
83%Groundfish
Salmon
Alaska Seafood Harvest, 2004
1.5%Halibut 14.5%Halibut1.3%Herring
1.2%Herring
1.1%Shellfish14%Shellfish
51%Groundfish
19%Salmon
$1.2 Billion 5.4 Billion Pounds Source:NationalMarineFisheriesService
By Weight By Value
Farmed: 8 Wild:
Wild: 847 Farmed: 1,367
1980
2004
Sources: Alaska Department of Fish and Game; National Marine FisheriesService; FAO Fisheries Division
Changes in World Salmon Supply, 1980 to 2004
Total: 541metric tons
533
Total: 2,214metric tons

15
NowherehavetheeffectsofaquacultureandglobalizationbeenmoreapparentthaninAlaska’ssalmonfisheries.Theworldsupplyof farmedsalmonincreased from8metrictonsin1980tonearly1,400metrictonsby2004.
Alaska’s Salmon FisheriesThe state government manages Alaska’s 26 commercial
salmon fisheries, with 5 species of wild salmon. Itsbiological salmonmanagementhasbeenvery successful.Alaska’s wild salmon harvests are the world’s largest,makingup40%ofwild salmonharvestsworldwideand15%ofcombinedwildandfarmedproduction.The2005Alaskasalmonharvestwasthesecond-largestinhistory.
Still, much of Alaska’s salmon industry has been ineconomictroublefor15years.Despitelargeharvests,real(adjustedforinflation)fishermen’searningsplummetedbynearlythree-quartersbetween1988and2002.Since2002,earnings inmanyfisherieshave rebounded significantly.But it’s important tokeep inmind twothingsabout thegoodnewsinthepastseveralyears:
Not all salmon species or areas have seen priceincreases.Pricesforchinookandcohohaveincreasedsignificantly. Prices for sockeye and chum salmonhave not increased as much, and prices for pinksalmonhavestayedaboutthesame.
Therecoveryinearningsvariesbyfishery,andinmostfisheriesearningsremainfarbelowtheirlevelsofthelate1980s.Thetableshows2002and2005earningsbyfishery,asapercentageoftheaveragesfrom1986-1990,whenearningspeaked.Inafewfisheries,2005earningswereasmuchas90%ofwhattheyhadbeeninthelate1980s.Butinmanytheywerelessthanhalf,andinafew,lessthan20%ofwhattheyhadbeen.
Earningsare lowerthaninthe1980sforcomplexreasonsthatvarybyfishery.Buttherearesomebroadcauses.
A steep fall in prices was the biggest reason for thedeclineinearningsinmostfisheries,andcompetition
•
•
•
from farmed salmon was the most important causeof lower prices. But large Alaska canned salmonproduction, an economic slowdown in Japan(historicallyAlaska’smostimportantsalmonmarket),andchangesinthefoodindustryalsocontributed.
Sockeyecatchesdeclinedbymorethanhalfbetween1995and2002,atthesametimepriceswerefalling.Sockeyestypicallycommandthesecond-highestpricesamong Alaska salmon (chinook being the highest)andaccountforhalfoftotalearnings.Thecombineddrop in sockeye catches and prices accounted formorethanhalfthedeclineinoverallearningsbetween1988and2002.
•
Har
v est
in
Mil
lion
s of
Fis
hAlaska Commercial Salmon Harvests and Fishermen's Earnings
1900-1958:Federal management
1959: State takes over management
1973: State limits entry to fisheries
Earni ngs i n M
illions of 2005 Dollars
1980
-88
Earn
ings
rise
as p
rices
rise
(In Millions of Fish and Inflation-Adjusted Dollars)
Sources: Alaska Department of Fish and Game and Commercial Fisheries Entry Commission. Earnings adjusted with Anchorage consumer price index.
0
50
100
150
200
250
1900 1910 1920 1930 1940 1950 1960 1970 1980 1990 20000
$200
$400
$600
$800
$1,000
$1,200
$1,400
2003- 05
Earnin
gs re
bound
as ca
tches
and pric
es ri
se
1989-2002: Earnings fall
as prices fall
2005
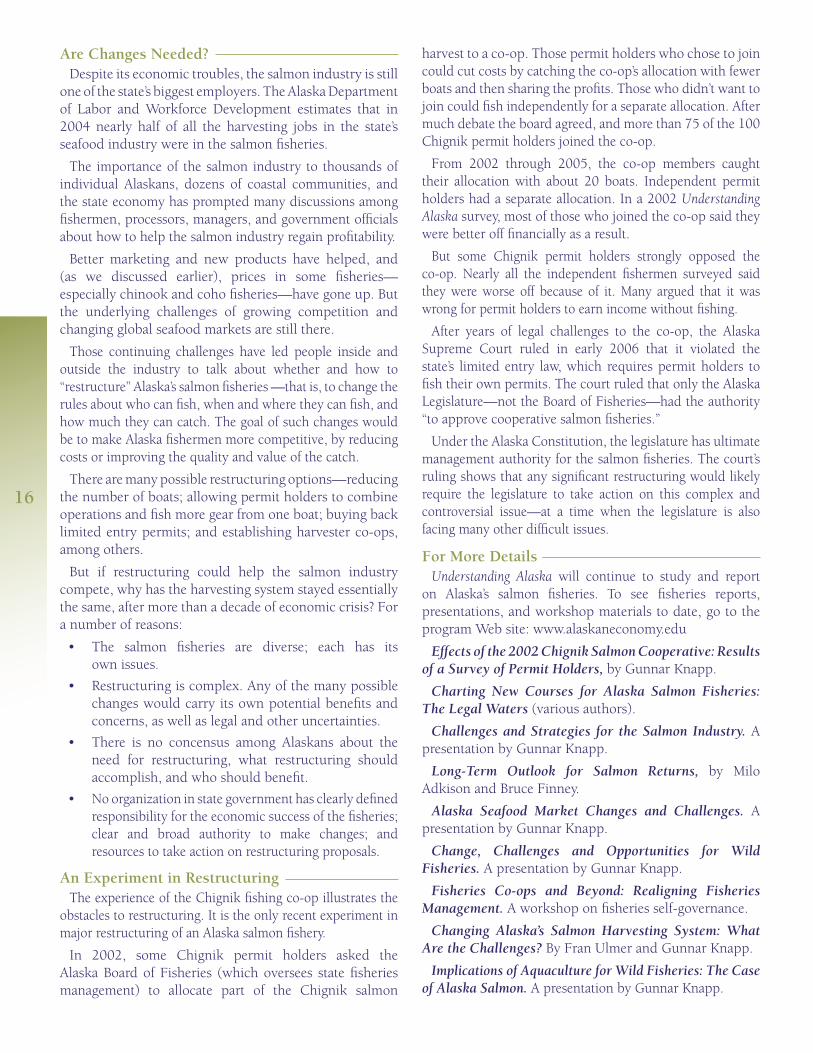
2002 and 2005 Earnings in Salmon Fisheries, as Percentage of 1986-90 Average
Bristol Bay Drift Gillnet 50%Southeast Purse Seine 56%Cook Inlet Drift Gillnet 39%Cook inlet Set Gillnet 42%Kodiak Purse Seine 50%Prince William Sd. Purse Seine 61%Prince William Sd. Drift Gillnet 92%Bristol Bay Set Gillnet 65%Alaska Peninsula Purse Seine 29%Statewide Power Troll 93%Chignik Purse Seine 28%Alaska Peninsula Drift Gillnet 52%Southeast Drift Gillnet 56%Kodiak Set Gillnet 49%Alaska Peninsula Set Gillnet 62%Lower Yukon Gillnet 31%Kuskokwim Set Gillnet 16%Yakutat Set Gillnet 18%Statewide Hand Troll 44%Cook Inlet Purse Seine 21%Kotzebue Gillnet 11%Other fisheries* 59%Total 52%
*Fisheries with average earnings of less than $1 million for 1986-90.Note: 2005 percentages are based on preliminary prices and may increase after post-season bonuses are included. Source: Commercial Fisheries Entry Commission
200216%38%14%15%31%18%83%26%10%53%24%20%39%22%25%24% 5%15%16%24% 0%66%26%
2005
16
Are Changes Needed?Despiteitseconomictroubles,thesalmonindustryisstill
oneofthestate’sbiggestemployers.TheAlaskaDepartmentof Labor and Workforce Development estimates that in2004 nearly half of all the harvesting jobs in the state’sseafoodindustrywereinthesalmonfisheries.
The importanceof thesalmonindustry to thousandsofindividual Alaskans, dozens of coastal communities, andthestateeconomyhaspromptedmanydiscussionsamongfishermen,processors,managers,andgovernmentofficialsabouthowtohelpthesalmonindustryregainprofitability.
Better marketing and new products have helped, and(as we discussed earlier), prices in some fisheries—especiallychinookandcohofisheries—havegoneup.Butthe underlying challenges of growing competition andchangingglobalseafoodmarketsarestillthere.
Those continuing challenges have led people inside andoutside the industry to talk about whether and how to“restructure”Alaska’ssalmonfisheries—thatis,tochangetherulesaboutwhocanfish,whenandwheretheycanfish,andhowmuchtheycancatch.ThegoalofsuchchangeswouldbetomakeAlaskafishermenmorecompetitive,byreducingcostsorimprovingthequalityandvalueofthecatch.
Therearemanypossiblerestructuringoptions—reducingthenumberofboats;allowingpermitholderstocombineoperationsandfishmoregearfromoneboat;buyingbacklimitedentrypermits;andestablishingharvesterco-ops,amongothers.
But if restructuring could help the salmon industrycompete,whyhastheharvestingsystemstayedessentiallythesame,aftermorethanadecadeofeconomiccrisis?Foranumberofreasons:
The salmon fisheries are diverse; each has itsownissues.
Restructuringiscomplex.Anyofthemanypossiblechangeswouldcarryitsownpotentialbenefitsandconcerns,aswellaslegalandotheruncertainties.
There is no concensus among Alaskans about theneed for restructuring, what restructuring shouldaccomplish,andwhoshouldbenefit.
Noorganizationinstategovernmenthasclearlydefinedresponsibilityfortheeconomicsuccessofthefisheries;clear and broad authority to make changes; andresourcestotakeactiononrestructuringproposals.
An Experiment in RestructuringTheexperienceoftheChignikfishingco-opillustratesthe
obstaclestorestructuring.ItistheonlyrecentexperimentinmajorrestructuringofanAlaskasalmonfishery.
In 2002, some Chignik permit holders asked theAlaskaBoardofFisheries (whichoversees statefisheriesmanagement) to allocate part of the Chignik salmon
•
•
•
•
harvesttoaco-op.Thosepermitholderswhochosetojoincouldcutcostsbycatchingtheco-op’sallocationwithfewerboatsandthensharingtheprofits.Thosewhodidn’twanttojoincouldfishindependentlyforaseparateallocation.Aftermuchdebatetheboardagreed,andmorethan75ofthe100Chignikpermitholdersjoinedtheco-op.
From 2002 through 2005, the co-op members caughttheir allocation with about 20 boats. Independent permitholdershadaseparateallocation.Ina2002Understanding Alaskasurvey,mostofthosewhojoinedtheco-opsaidtheywerebetterofffinanciallyasaresult.
But some Chignik permit holders strongly opposed theco-op. Nearly all the independent fishermen surveyed saidthey were worse off because of it. Many argued that it waswrongforpermitholderstoearnincomewithoutfishing.
After years of legal challenges to the co-op, the AlaskaSupreme Court ruled in early 2006 that it violated thestate’s limitedentry law,which requirespermitholders tofishtheirownpermits.ThecourtruledthatonlytheAlaskaLegislature—nottheBoardofFisheries—hadtheauthority“toapprovecooperativesalmonfisheries.”
UndertheAlaskaConstitution,thelegislaturehasultimatemanagementauthorityforthesalmonfisheries.Thecourt’srulingshowsthatanysignificantrestructuringwouldlikelyrequire the legislature to take action on this complex andcontroversial issue—at a time when the legislature is alsofacingmanyotherdifficultissues.
For More DetailsUnderstanding Alaska will continue to study and report
on Alaska’s salmon fisheries. To see fisheries reports,presentations,andworkshopmaterialstodate,gototheprogramWebsite:www.alaskaneconomy.edu
Effects of the 2002 Chignik Salmon Cooperative: Results of a Survey of Permit Holders, byGunnarKnapp.
Charting New Courses for Alaska Salmon Fisheries: The Legal Waters (variousauthors).
Challenges and Strategies for the Salmon Industry. ApresentationbyGunnarKnapp.
Long-Term Outlook for Salmon Returns, by MiloAdkisonandBruceFinney.
Alaska Seafood Market Changes and Challenges. ApresentationbyGunnarKnapp.
Change, Challenges and Opportunities for Wild Fisheries. ApresentationbyGunnarKnapp.
Fisheries Co-ops and Beyond: Realigning Fisheries Management. Aworkshoponfisheriesself-governance.
Changing Alaska’s Salmon Harvesting System: What Are the Challenges? ByFranUlmerandGunnarKnapp.
Implications of Aquaculture for Wild Fisheries: The Case of Alaska Salmon. ApresentationbyGunnarKnapp.

Wehopeyou’vefoundthispublicationusefulandthatyou’lllookforotherISERpublicationsonourmainWebsiteandonourspecialprogram Web sites. Hard copies of all our publications are alsoavailable.Singlecopiesofmanyareavailableatnocharge;othersarepricedaccordingtothecostsofcopying.
ISER Contact InformationPhone:907-786-7710
Fax:907-786-7739
Mailingaddress:3211ProvidenceDrive,Anchorage,Alaska99508
Physicallocation:DiplomacyBuilding,5thFloor,4500DiplomacyDrive,Anchorage
ISER Web sitesISERhomepage:www.iser.uaa.alaska.edu
UnderstandingAlaska:www.alaskaneconomy.uaa.alaska.edu
KidsCountAlaska:www.kidscount.alaska.edu
Citizen’sGuidetotheBudget:www.citizensguide.uaa.alaska.edu