REVISED Structural Analysis of the Alaska Economy - Institute of
144
REVISED Structural Analysis of the Alaska Economy: What are the Drivers? by Scott Goldsmith March, 2010 Institute of Social and Economic Research University of Alaska Anchorage 3211 Providence Drive Anchorage, Alaska 99508 (907) 786-7710 (telephone) (907) 786-7739 (fax) www.iser.uaa.alaska.edu
Transcript of REVISED Structural Analysis of the Alaska Economy - Institute of

REVISED Structural Analysis
of the Alaska Economy: What are the Drivers?
by
Scott Goldsmith
March, 2010
Institute of Social and Economic Research University of Alaska Anchorage
3211 Providence Drive Anchorage, Alaska 99508
(907) 786-7710 (telephone) (907) 786-7739 (fax)
www.iser.uaa.alaska.edu

This study is the first in a series of reports in the ISER program
Investing for Alaska’s Future
Underwritten by a generous grant from
Northrim Bank
With support from the University of Alaska Foundation

REVISED Structural Analysis of the Alaska Economy: What are the Drivers?
Table of Contents
I. Introduction ......................................................................................... 1 II. Overview .............................................................................................. 3 III. The 14 Sectors that Drive the Alaska Economy............................. 19
A. Petroleum Production.......................................................................................... 21 B. Petroleum Revenues........................................................................................... 29 C. Permanent Fund, Constitutional Budget Reserve, and
Other Reserves ................................................................................................... 37 D. Mining.................................................................................................................. 43 E. Seafood ............................................................................................................... 49 F. Tourism ............................................................................................................... 61 G. International Air Cargo ........................................................................................ 71 H. Timber ................................................................................................................. 77 I. Miscellaneous Manufacturing and Services ........................................................ 83 J. Agriculture ........................................................................................................... 87 K. Federal Nondefense............................................................................................ 91 L. National Defense................................................................................................. 97 M. Retirees ............................................................................................................. 101 N. Miscellaneous Non-earned Income................................................................... 107
IV. Special Characteristics of the Alaska Economy.......................... 113
IV.A. Diversity of Regional Economies ................................................................ 113 IV.B. Subsistence ................................................................................................ 114 IV.C. Land and Resource Ownership .................................................................. 115 IV.D. Government Employment ........................................................................... 118 IV.E. Nonprofit Sector .......................................................................................... 119 IV.F. Seasonality ................................................................................................. 120 IV.G. Non Resident Workers................................................................................ 122 IV.H. Population Turnover.................................................................................... 124 IV.I. Enclave Development ................................................................................. 125 IV.J. Dominance of Non-Alaska Firms in Natural Resource Sectors ....................................................................................... 127 IV.K. Self-employment ......................................................................................... 129 IV.L. Small Population ......................................................................................... 130 IV.M. Large Area with Scattered Remote Population........................................... 131 IV.N. Distance to Markets and Suppliers ............................................................. 132 IV.O. Severe Weather .......................................................................................... 132 IV.P. Fiscal Structure ........................................................................................... 133 IV.Q. Age Distribution........................................................................................... 134 IV.R. Data Quality ................................................................................................ 134
Appendix A. Note on Gross Domestic Product and Value Added Comparisons Across Arctic Regions ................................................... 137


Structural Analysis of the Alaska Economy ___________________________________________________________________ Introduction
March 2010 Institute of Social and Economic Research, UAA Page 1
I. Introduction Because of public ownership of much of the natural resource base, state
government has a unique role to play in Alaska fostering economic development. A clear understanding of the structure of the economy is a necessary prerequisite for formulating a successful development strategy. This paper describes and quantifies the 14 BASIC sectors (Economic Drivers) upon which all economic activity in the state depends. Without them, the Alaska economy would not exist.
Each of these 14 BASIC sectors draws money into the state, which directly generates revenues for businesses, wages and jobs for Alaskans, and other income. As Alaska businesses and households spend this new money within the state, additional revenues, wages, and jobs are created in other businesses (NON-BASIC sectors) through a process known as the economic multiplier.
The size and growth of the economy depends largely upon these BASIC sectors because, without the money they bring into the state, the NON-BASIC sectors would not exist.1
We begin this paper with an estimate of the contribution of each of the 14 BASIC sectors to total employment and resident income. We do this using a simple model to calculate how much new money each driver brings into the economy and then estimating how that new money works its way through the economy generating business revenue, wages, jobs, and other sources of income.2
The results of the analysis are summarized in Table I.1. in which total employment (resident and non resident) and personal income of Alaskan households averaged over the period 2004-2007 are parceled out among the 14 BASIC drivers—aggregated into 5 major categories. We find that the various activities of the federal government, both national defense and non-defense spending, account for the largest share of total economic activity. This economic activity is not only the personal income directly flowing to households as payrolls and transfer payments and federal government jobs. It also includes a measure of personal income and jobs generated throughout the economy as the federal dollars circulate through the NON-BASIC sectors in industries like retail trade, business and personal services, transportation, and construction. The total of $9.93 billion in personal income and 131 thousand jobs can be interpreted as the loss to the state if Alaska were to receive no federal dollars over the period 2004-2007.
1 Of course the capacity of the NON-BASIC sectors to provide support—goods and
services—to the BASIC sectors is also a factor in the growth process. The characteristics of the NON-BASIC sectors are not the focus of this paper.
2 For a description of the model, see Scott Goldsmith, “The Importance of Petroleum to the Alaska Economy: A Gedanken Experiment”, presented at the North American Regional Science Association Annual Meeting, San Francisco, Institute of Social and Economic Research, November 2009.
Structural Analysis of the Alaska Economy ___________________________________________________________________ Introduction
March 2010 Institute of Social and Economic Research, UAA Page 2
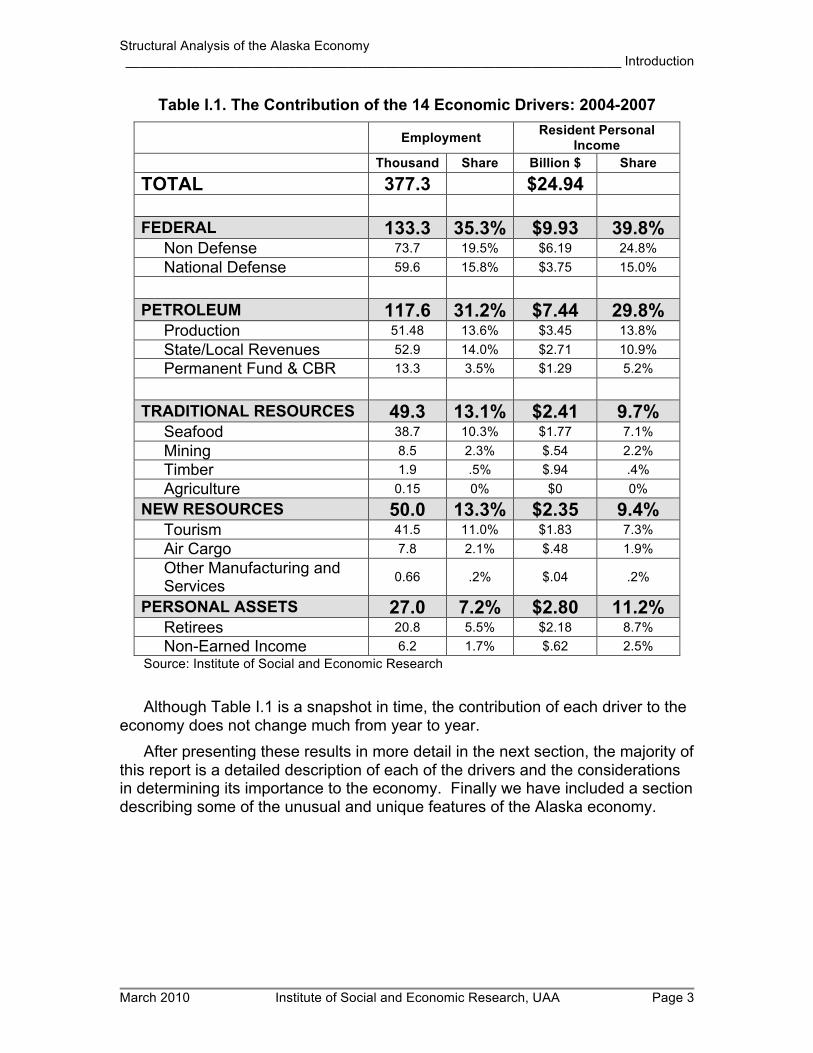
Petroleum was the largest private economic driver, contributing $7.44 billion to Alaska personal income and 117.6 thousand jobs. The contribution of petroleum comes from production-related activities, current petroleum revenues, and spending from the accumulated savings from revenues collected in prior years and deposited in the Alaska permanent fund and the constitutional budget reserve.
The other three driver categories—traditional natural resources, new resources, and personal assets--together accounted for personal income of $7.61 billion and employment of 121.9 thousand. Traditional natural resources are those private sectors that were most important to the economy at the time of statehood. New resources are activities that have developed more recently. The category of personal assets represents the purchasing power of households that is independent of current employment such as retirement income.
Structural Analysis of the Alaska Economy ___________________________________________________________________ Introduction
March 2010 Institute of Social and Economic Research, UAA Page 3
Table I.1. The Contribution of the 14 Economic Drivers: 2004-2007 Employment Resident Personal
Income Thousand Share Billion $ Share
TOTAL 377.3 $24.94 FEDERAL 133.3 35.3% $9.93 39.8%
Non Defense 73.7 19.5% $6.19 24.8% National Defense 59.6 15.8% $3.75 15.0%
PETROLEUM 117.6 31.2% $7.44 29.8%
Production 51.48 13.6% $3.45 13.8% State/Local Revenues 52.9 14.0% $2.71 10.9% Permanent Fund & CBR 13.3 3.5% $1.29 5.2%
TRADITIONAL RESOURCES 49.3 13.1% $2.41 9.7%
Seafood 38.7 10.3% $1.77 7.1% Mining 8.5 2.3% $.54 2.2% Timber 1.9 .5% $.94 .4% Agriculture 0.15 0% $0 0%
NEW RESOURCES 50.0 13.3% $2.35 9.4% Tourism 41.5 11.0% $1.83 7.3% Air Cargo 7.8 2.1% $.48 1.9% Other Manufacturing and Services 0.66 .2% $.04 .2%
PERSONAL ASSETS 27.0 7.2% $2.80 11.2% Retirees 20.8 5.5% $2.18 8.7% Non-Earned Income 6.2 1.7% $.62 2.5%
Source: Institute of Social and Economic Research Although Table I.1 is a snapshot in time, the contribution of each driver to the
economy does not change much from year to year. After presenting these results in more detail in the next section, the majority of
this report is a detailed description of each of the drivers and the considerations in determining its importance to the economy. Finally we have included a section describing some of the unusual and unique features of the Alaska economy.

Structural Analysis of the Alaska Economy _____________________________________________________________________ Overview
March 2010 Institute of Social and Economic Research, UAA Page 4
II. Overview
There is no shortage of descriptions of the Alaska economy contained in annual reports, on Web sites, and in special studies. The Alaska Department of Commerce, Community and Economic Development (ADCCED) publishes the Alaska Economic Performance Report each year and maintains the Alaska Economic Information System on its Web site. The Alaska Department of Labor (ADOL) provides economic descriptions in its monthly Alaska Economic Trends magazine as well as through the Web site of its research and analysis section. The Bureau of Economic Analysis of the U.S. Department of Commerce also maintains descriptions of regional and local economies in Alaska on its Web site.3
These descriptions are very useful for tracking the economy over time as well as comparing its performance to that of other states and regions. Table II.1 shows the variables commonly used for those purposes—gross domestic product, wages and total earnings, and employment by industry. For example, the retail trade sector generated gross domestic product of $1.88 billion, paid wages of $1 billion and total earnings (including benefits) of $1.37 billion, employed 36.9 thousand wage and salary employees, and supported a total of 46.2 thousand jobs (including the self-employed).
As useful as they are, these different ways of describing the size of each industry provide no insight into the underlying structure of the economy and, most importantly, what drives the economy. They do not tell what accounts for the jobs, income, and gross product produced by each industry. For example, they do not tell us where the money comes from that supports the 46.2 thousand jobs in the retail trade industry. They cannot tell us, for example, how the retail trade industry would change if federal spending in the state were to decline.
No economy is self-sufficient. All economies—whether local, state, regional, or national—need to purchase goods and services not produced locally from outside of their own area. The expenditures for these non-local purchases must be offset by the sale of locally produced goods and/or services to consumers from outside the local economy. Without a constant flow of money into the local economy from outside sources, the economy would eventually go broke. The sale of locally produced goods and services outside the local economy is what allows the local economy to survive and prosper.
3 Other reports and studies produced by the government concentrate on a description of one aspect of the economy. For example, the ADOL reports each year on the composition of nonresident employment in the state in Nonresidents Working in Alaska. The ADCCED publishes an annual report on the Fiscal Year Net Return to the State of Alaska of certain industries.

Structural Analysis of the Alaska Economy _____________________________________________________________________ Overview
March 2010 Institute of Social and Economic Research, UAA Page 5
Table II.1. Descriptions of the Alaska Economy Using Different Measures
Gross
Domestic Product
(Billion $)
Wages by Place of
Work (Billion $)
Earnings by Place of
Work (Billion $)
Wage and Salary
Employment (Thousand)
Total Jobs (Thousand)
Year of Data 2006 2006 2006 2005 2005 Total $41.105 $14.488 $21.254 339.2 437.0 Private $33.834 $9.758 $14.540 237.1 334.2
Agriculture, Forestry, & Fisheries $.306 $.035 $.226 .9 12.8
Mining $12.133 $1.208 $1.606 10.6 11.7 Utilities $.416 $.112 $.198 1.9 2.0 Construction $1.882 $1.081 $1.722 19.2 27.5 Manufacturing $.932 $.473 $.770 12.7 14.8 Wholesale Trade $.805 $.314 $.420 6.5 7.6 Retail Trade $1.881 $.998 $1.367 36.9 46.2 Transportation $3.561 $.960 $1.370 19.5 22.7 Information $.910 $.343 $.456 6.9 8.0 Finance $1.205 $.458 $.639 8.9 11.7 Real Estate $3.301 $.163 $.387 5.2 20.3 Professional & Technical Services $1.399 $.681 $1.213 12.4 22.5
Management of Companies
$.148 $.090 $.109 1.2 1.3
Administrative & Waste Services $.672 $.379 $.526 11.1 16.7
Education $.129 $.088 $.117 3.1 5.0 Health Care & Social Assistance $2.262 $1.393 $1.972 36.0 42.8
Arts, Entertainment & Recreation $.280 $.078 $.203 4.5 9.9
Accommodation & Food Service $.997 $.535 $.710 27.0 31.4
Other Services $.615 $.370 $.520 12.7 19.4 Government $7.272 $4.720 $6.700 101.8 101.8
Federal Civilian $1.037 $1.551 17.0 17.0 Military $1.157 $1.920 24.2 24.2 State & Local $2.526 $3.229 60.7 60.7
Source: U.S. Department of Commerce Bureau of Economic Analysis, Regional Economic Accounts Web site.
Economists often use economic base theory to describe the structure of a regional economy. This way of thinking about the regional economy asserts that there must be jobs that bring in dollars from outside the local economy. These jobs are known as basic employment, and they produce the basic income of the region—in the form of payroll, business profits, and public revenues. All the other jobs in the economy depend upon the presence of the basic income in the economy. They are known as non-basic employment. The non-basic jobs are in businesses that sell goods and services within the local economy and serve to recycle or turn over money within the local area (the multiplier effect).

Structural Analysis of the Alaska Economy _____________________________________________________________________ Overview
March 2010 Institute of Social and Economic Research, UAA Page 6
Of course both basic and non-basic jobs are essential to the economy. Although economic base theory emphasizes the role and importance of basic employment and income as the driver of the regional economy, the strength and depth of the non-basic sector is also important. A larger non-basic sector permits more recycling of the money that enters the economy from basic sector activity. More recycling--local purchases by businesses and households—leads to more job creation (a larger economic multiplier).
In Alaska the strength and depth of the non-basic sector has grown over time. The result is that each basic sector job or dollar of basic sector income now makes a greater contribution to the overall economy than was the case in the past.
The simplest economic base models use employment in resource production and manufacturing (sectors that directly export goods from the region) to describe the size of each basic sector, but this approach does not work well for a regional economy as complex as Alaska. There are several economic drivers, like the Alaska permanent fund dividend, that do not directly generate any jobs at all (except for administration of the program) but which indirectly generate considerable economic activity. Jobs are also not a good measure of the size and importance of several other basic sectors, including federal spending and petroleum, both of which include considerable monetary flows into the state in addition to the wages they pay to Alaska workers.
Because employment does not capture the importance of these basic sectors, in this analysis we use the inflow of dollars to characterize and measure the importance of each basic sector. Payroll is the primary source of economic contribution for some basic sectors. For others business profits and payments directly to individuals not based on employment are more important.
Few studies have attempted to describe the entire structure of the Alaska economic base. Most have been embedded in discussions of economic development strategies. Recent examples include the work of the now defunct Alaska Science and Technology Foundation and the report entitled An Economic Vision for a Prosperous Alaska4.
In developing our estimates of the importance and contribution of each basic sector to the economy, we rely upon the information from these earlier studies, publicly available economic data bases, special studies of a particular aspect of the economy such as the non-resident share of employment, and studies of particular industries.5 Unlike these studies that typically demonstrate the
4 Co-authored by Ginny Fay, Kay Brown, and Chris Rose in 2004 for the Prosperous Future Development Coalition. 5 There are numerous studies of particular basic sectors of the Alaska economy produced by governments, special interest groups, and the industries themselves. Some are primarily qualitative, such as the industry summaries on the Resource Development Council Web site, while others, like those appearing in the Alaska Economic Trends magazine contain considerable quantitative information. Most privately produced studies are quantitative exercises designed to demonstrate the importance of a particular industry to the aggregate economy. Recent examples

Structural Analysis of the Alaska Economy _____________________________________________________________________ Overview
March 2010 Institute of Social and Economic Research, UAA Page 7
importance of a single industry, our estimates are based on the application of a consistent technique across all the basic sectors to produce a set of indicators comparing all the drivers to one another and summing to the total for the entire economy. This provides a firm analytical basis for crafting economic policy and thinking about the economic opportunities and constraints facing Alaska in the future.
To build up the description of the economic base, we start with those economic activities most often identified as the ones that drive the economy—the natural resources that are produced and sold for export outside the state (petroleum, seafood, minerals, timber, and agricultural products). These are sometimes referred to as the export base, a more narrowly defined concept than economic base because it excludes some other important sectors that bring income into the regional economy.
The most commonly used ways to characterize the direct importance of these export-base activities are through the use of the following indicators: volume of production and sale, value of production and sale, employment engaged in production, and contribution to gross domestic product. Table II.2 summarizes recently available indicators for the natural resource export base of the Alaska economy.
There are several difficulties with the use of any of these indicators for the purpose of describing and comparing the economic importance of each sector in the export base. Most obviously, there are a lot of gaps in the data. The missing information is not collected or reported.
The volume of production is not available for all commodities, and the share that is for export, compared to the production for consumption in Alaska is also not available. This is important because the locally consumed production of these commodities is not part of the export base. For example, there is no published data on the total physical volume of timber harvest in the state.
But the biggest problem with the use of volume of production data is that comparisons across sectors are impossible. It makes no sense to try to compare the economic contribution of 1 million pounds of halibut to 1 million cubic feet of natural gas production.
would include The Economic Significance of the Ted Stevens Anchorage International Airport and the Economic Impact of the Oil and Gas Industry on Alaska.

Structural Analysis of the Alaska Economy _____________________________________________________________________ Overview
March 2010 Institute of Social and Economic Research, UAA Page 8
Table II.2. Natural Resource Export Base: Typical Direct Indicators
VOLUME VALUE
OF OUTPUT (Billion $)
DIRECT EMPLOYMENT
(Thousand)
GROSS DOMESTIC PRODUCT (Million $)
Year of Data 2002 2005 2005 2002 FISHING 17.696
Harvesting $1.296 - $258 Groundfish Halibut Salmon (million lb.) 624.060 Shellfish (million lb.) 68.370 Other
Processing - $285 TIMBER $.132 0.850
Harvesting $14 Processing
MINING $1.402 1.539 Production $503
Zinc (thousand tons) 718.106 Gold (thousand oz.) 562.099 .099
Processing - - PETROLEUM $17.615 11.317
Production $5,343 Oil (million barrel) 359.000 Gas (bcf of marketed production) 200.871
Processing $114 AGRICULTURE -
Production $26 Processing - -
The conversion of all production volumes into values using market prices is
an obvious improvement. However, the dollars entering the state from the sale of different natural resources can have quite different effects on the local economy. For example, in 2005 the value of the sales of the mining sector was $1.4 billion, while that of the seafood harvest was slightly lower at $1.3 billion. But since the seafood harvesting sector is much more labor intensive (employs much more labor per dollar of output), the number of jobs directly generated by fish harvesting was several times that of the mining sector. Since jobs and their associated payroll is one of the primary sources of economic contribution to the economy from any basic sector activity, this suggests the value of output is not a good measure of relative importance.

Structural Analysis of the Alaska Economy _____________________________________________________________________ Overview
March 2010 Institute of Social and Economic Research, UAA Page 9
Employment might be a better measure, but it also has several shortcomings. First, there is a wide range of pay scales across jobs in different sectors. Each high-paying job in the petroleum sector adds several times the purchasing power to the local economy that each job in the seafood harvesting sector represents. Second, jobs and the wages they represent are not the only way an industry contributes to the economy. For example, an important contribution of the petroleum sector comes from the revenues collected by state and local governments and spent to support public programs. And finally, as we will see below, some economic base sectors do not have a readily identifiable direct employment component at all.
Gross domestic product comes closest to being a useful indicator of the contribution of each natural resource export-base sector to the economy because it includes not only wages but also taxes and profits. However, since it measures the value of production within the region without regard to the residence of the workers or where the taxes and profits are going, it does not describe the flow of dollars into the state. For example, a large share of the value of production of the seafood industry goes to nonresident harvesters as the return on their labor. These dollars do not contribute to the Alaska economy. Furthermore, changes in the value of production from year to year may bear little relation to changes in the flow of dollars into the economy. For example, petroleum gross product depends upon the extremely volatile market price of oil. A dramatic change in gross state product could be due to a change in the price of oil at a time when employment was not changing at all. (Some of the general issues regarding the use of gross state product to measure economic performance for Alaska are discussed in the appendix.)
Tourism and the international air-cargo are two sectors that do not export commodities but which nonetheless generate a flow of dollars into the state. The federal government also pumps billions of dollars into Alaska each year. As Table II.3 shows, indicators summarizing the direct contribution of these industries to the economy are also difficult to obtain, particularly because there are no easy ways to measure either the volume or the value of output of these sectors.
Table II.3. Other Basic Sectors Part 1: Direct Indicators
VOLUME
(000)
VALUE OF OUTPUT
(Billion $)
DIRECT EMPLOYMENT
(Thousand)
GROSS DOMESTIC PRODUCT (Million $)
Year of Data 2002 2005 2005 2002 TOURISM 1.221 $1.482 21.820 $675 AIR CARGO - - 3.500 FEDERAL GOVERNMENT
Civilian and Military - 41.130 $2,861 Tourism volume reported in millions of tourist visitors.

Structural Analysis of the Alaska Economy _____________________________________________________________________ Overview
March 2010 Institute of Social and Economic Research, UAA Page 10
Tourism information can be calculated from the number of tourists and their instate purchases, but it is not readily available in published form on an annual basis. The air-cargo carriers are engaged in activities that have considerable value for their companies, but there is no published information on the value of these services.
Although employment and gross domestic product information is readily available for the federal government, they both seriously understate the importance of the federal dollar flows into the economy. A large share of the federal government’s economic contribution comes from capital spending, grants, and transfers directly to individuals which are not captured in the gross domestic product figure.
We include in the economic base the three other sources of money flowing into the state that are listed in Table II.4. These sources of purchasing power are easily overlooked, because they are not associated with an easily identifiable category of jobs and also because data to measure their importance is limited.
Retirees are not tied down to living in a particular place because of work commitments. When they choose to live in Alaska, they bring their retirement income with them. That income creates jobs in businesses that sell to and support retirees.
The category of other manufacturing and services consists of the small-scale manufacturing for export not included in the natural resource industries as well as the business services that Alaska firms sell outside the state.
Non-earned income consists of the income of households not associated with working in the labor force and not associated with retirement income. It also includes the income of other enterprises not associated with current production activities. For example, this category would include the dividends paid on stock owned by persons and the earnings of Alaska foundations with investments outside the state.
Table II.4. Other Basic Sectors Part 2: Direct Indicators
VOLUME
VALUE OF OUTPUT
(Billion $)
DIRECT EMPLOYMENT
(Thousand)
GROSS DOMESTIC PRODUCT (Million $)
2004 2004 RETIREES 52 $1.461 - - OTHER MANUFACTURING AND SERVICES - - - - NON-EARNED INCOME - - Retiree volume is the number in thousands and value is their purchasing power.
In total, we identify 14 activities that bring new money into the state and
consequently represent the economic base for the Alaska economy (Table II.5). Because of the importance of petroleum and federal spending, we divide the former into three sectors and the latter into two. We separate petroleum

Structural Analysis of the Alaska Economy _____________________________________________________________________ Overview
March 2010 Institute of Social and Economic Research, UAA Page 11
revenues from production to highlight the importance of the link between current revenues and public spending. And we separately identify the permanent fund and other savings accounts (constitutional budget reserve) that have been capitalized by petroleum revenues not spent when received. We divide federal spending between military and non-military-related spending (net of federal retirement income included with other retiree income).
We use a 4 step process to determine the contribution of each of the BASIC sectors to the Alaska economy, as illustrated in Figure II.1.6
1. Calculate “core” employment” by driver 2. Calculate “core” personal income by driver 3. Calculate “non-core” personal income as a residual 4. Calculate “non-core” employment
Figure II.1. 4 Steps to Calculate Alaska Economic Drivers
6 For a description of the model, see Scott Goldsmith, “The Importance of Petroleum to the
Alaska Economy: A Gedanken Experiment”, presented at the North American Regional Science Association Annual Meeting, San Francisco, Institute of Social and Economic Research, November 2009.

Structural Analysis of the Alaska Economy _____________________________________________________________________ Overview
March 2010 Institute of Social and Economic Research, UAA Page 12
In this formulation all employment and personal income can be divided into
the two categories of “core” and “non-core”. The “core” consists of those jobs and personal income that can be directly or indirectly associated with each driver. All other jobs and income are “non-core”.
As an example, consider mining for export. The direct employment associated with this driver is the sum of mine workers engaged in production, mine and construction workers engaged in exploration and development, self employed miners, and government workers directly supported by taxes and other revenues paid by the industry. The indirect employment consists of jobs created by the non labor expenditures of these businesses. These are primarily wholesale trade, transportation, and infrastructure—utilities, business services, information, and finance.7 8
Core income associated with mining would include the payroll of these workers as well as their net employee benefits, adjusted by a residence adjustment to account for the income of non resident workers that has no further impact on the economy.
In step 3 the core income of each driver determines how much non-core income is attributable to that driver. Drivers with more core income account for a greater share of non core income.
Finally the non core employment is determined by the size of non core income.
Table II.5. shows the estimates of core income for each driver. Although these dollar amounts do not correspond to the values for any of the indicators for these drivers shown in Tables II.1-4, they are a better representation of the importance of each to the Alaska economy.
7 These industry sales may be thought of as the largest components of the first round of inter-
industry sales described by an input output model. 8 For some drivers, like the Permanent Fund dividend, there is no direct core employment, because that money flows into the economy “effortlessly”. However it does have a large economic impact, and consequently there is indirect core employment and core income associated with it.

Structural Analysis of the Alaska Economy _____________________________________________________________________ Overview
March 2010 Institute of Social and Economic Research, UAA Page 13
Table II.5. Core Income for Economic Drivers—2005-2007 Billion $ FEDERAL SPENDING
Non Defense $4.07 National Defense $2.13
PETROLEUM
Production $1.57 State/Local Revenues $1.29 Permanent Fund & CBR $.98
TRADITIONAL RESOURCES
Seafood $.73 Mining $.26 Timber $.05 Agriculture $0
NEW RESOURCES Tourism $.83 Air Cargo $.23 Other Manufacturing and
Services $.02
PERSONAL ASSETS Retirees $1.71 Non Earned Income $.48
Using these estimates, we can calculate total Alaska employment (including
both residents and non residents) and the Alaska personal income attributable to each of the 14 economic drivers (Table II.6).
Federal funds accounts for the largest share of both employment and personal income, followed by petroleum as the largest private sector. The traditional natural resource sectors (private economic base at the time of statehood) and the newer resource sectors (those that have developed largely since statehood) account for about equal shares of total economic activity. Personal assets account for the smallest share of jobs, but make a contribution to total personal income that is comparable to that of the traditional and new resources.

Structural Analysis of the Alaska Economy _____________________________________________________________________ Overview
March 2010 Institute of Social and Economic Research, UAA Page 14
Table II.6. The Contribution of the 14 Economic Drivers: 2004-2007 Employment Resident Personal
Income Thousand Share Billion $ Share
TOTAL 377.3 $24.94 FEDERAL 133.3 35.3% $9.93 39.8%
Non Defense 73.7 19.5% $6.19 24.8% National Defense 59.6 15.8% $3.75 15.0%
PETROLEUM 117.6 31.2% $7.44 29.8%
Production 51.48 13.6% $3.45 13.8% State/Local Revenues 52.9 14.0% $2.71 10.9% Permanent Fund & CBR 13.3 3.5% $1.29 5.2%
TRADITIONAL RESOURCES 49.3 13.1% $2.41 9.7%
Seafood 38.7 10.3% $1.77 7.1% Mining 8.5 2.3% $.54 2.2% Timber 1.9 .5% $.94 .4% Agriculture 0.15 0% $0 0%
NEW RESOURCES 50.0 13.3% $2.35 9.4% Tourism 41.5 11.0% $1.83 7.3% Air Cargo 7.8 2.1% $.48 1.9% Other Manufacturing and Services 0.66 .2% $.04 .2%
PERSONAL ASSETS 27.0 7.2% $2.80 11.2% Retirees 20.8 5.5% $2.18 8.7% Non-Earned Income 6.2 1.7% $.62 2.5%
Source: Institute of Social and Economic Research Employment in Table II.6 is measured as the annual average number of
jobs.9 This figure is larger than annual average resident employment, but smaller than peak summer employment. The peak employment in the summer is higher than the annual average by at least 30 thousand jobs.
A comparison of the difference between the July and January employment (swing) shows that much of the seasonality is concentrated in the fishing, tourist, 9 This is the sum of the Alaska Department of Labor wage and salary employment, active duty military, and proprietor employment (self-employed). Our estimate of the self employed is the sum of fish harvesters and other. Although the Department of Commerce reports the self employed as a count of workers rather than average annual employment, our self employed figure is an estimate of the annual average equivalent. Annual average fish harvester employment comes from the Alaska Department of Labor. We estimate annual average employment for other self employed based on information on self employed earnings in relation to wage earnings in similar industries.

Structural Analysis of the Alaska Economy _____________________________________________________________________ Overview
March 2010 Institute of Social and Economic Research, UAA Page 15
and construction industries (Table II.7). These are also the industries that generally report the largest share of nonresident workers (Table II.8), suggesting that a large share of the seasonal employment is taken by nonresidents.
Table II.7. Seasonality in Alaska Industries: 2005 Employment (Thousand) Ratio July January Swing (July/Jan) Total 349.2 299.8 49.4 1.16 Private 283.0 220.8 62.2 1.28
Timber Harvest .5 .2 .3 2.90 Fish Harvesting 20.2 7.3 12.9 2.77 Fish Processing 18.2 7.3 10.8 2.48 Tourism-related* 42.0 25.5 16.5 1.65 Construction 21.4 14.5 6.9 1.48 Mining 12.5 11.0 1.5 1.13
Source: Alaska Department of Labor. *Employment in industries that serve both tourists and residents, like eating and drinking
establishments. The ratio of summer-to-winter tourist visitors is about 10 to 1, so the seasonality in that sector of the economy is much greater than reflected in these figures.
Table II.8. Nonresident Workers in 2005 Share of Workers ALL PRIVATE 22%
Fish Processing 73% Fish Harvesting* 39% Logging and Wood Products 38% Accommodation and Food Service 29% Oil and Gas 25% Mining 25%
*Fish harvesting not included in share of all private, which is wage and salary only. Note that this is a count of workers rather than jobs.
Source: Nonresidents Working in Alaska 2005, Alaska Department of Labor except fish harvesting from Alaska Department of Labor special analysis of participation.
Unlike employment, personal income is measured by place of residence.
Total income earned in Alaska is much higher with the difference concentrated in the highly seasonal seafood, timber, and tourism sectors as well as in other non seasonal sectors such as petroleum where enclave development often is the norm. Enclave development involves operations usually owned by nonresidents with few, if any, links to the local economy.
Personal income in Table II.6 is the income that accrues to households during the year.10 It consists of both the earned (70 percent) and non-earned (30
10 This is the measure used by the U.S. Department of Commerce, Bureau of Economic Analysis. Two somewhat different measures of personal income are those of the U.S. Census and the Internal Revenue Service.

Structural Analysis of the Alaska Economy _____________________________________________________________________ Overview
March 2010 Institute of Social and Economic Research, UAA Page 16
percent) income of Alaskans.11 Earned income is income from payroll (wages), benefits, and self-employed income (proprietor income).12 Non-earned income comes from the return on assets (dividends-interest-rent) as well as transfer payments from government.13
Table II.9. Alaska Personal Income 2005 (Billion $)
EARNED INCOME $17.133 Wages $13.742 Supplements $4.200 Contributions for Government Social
Insurance $-2.003 Residence Adjustment $-1.142 Proprietor Income $2.336 NON EARNED INCOME Dividends-Interest-Rent $3.611 Transfers $3.529
TOTAL PERSONAL INCOME $24.273
Source: U.S. Department of Commerce, Bureau of Economic Analysis. Supplements represents all non-wage payments of employers benefiting
workers—pension and insurance payments as well as employer contributions for Social Security.
Contributions for Government Social Insurance represents both worker and employer Social Security payments.
The shares of employment and personal income attributable to each of the 14
economic drivers are roughly comparable, but not equal due to several factors. First, some sectors—like retirees—pump money directly into personal income without directly creating employment. It is only when retirees spend this income within Alaska that employment is generated. Consequently, the personal income contribution of retirees is larger than the employment contribution. Second, some sectors—like seafood and tourism—employ large numbers of workers, but at relatively low wages. For these sectors, the employment contribution is larger than that of personal income.
Table II.6 confirms what has become known as the “1/3 rule,” which is that about 1/3 of the economy depends on federal spending, 1/3 depends upon petroleum, and 1/3 depends upon all the other drivers. The table also confirms the continuing importance of federal spending for the economy. Finally, it 11 Wage payments alone are only 58 percent of total personal income, making payroll a very incomplete measure of the income of Alaska households. 12 The private pension component of supplements to wages reported here is the contribution employers made into pension plans rather than the payments individuals received as retirees from their pension plans. 13 Some of the personal income reported as dividends-interest-rent does not represent current cash income of persons. Likewise, the majority of transfers are Medicare, Medicaid, and food stamps which are not cash income of persons.

Structural Analysis of the Alaska Economy _____________________________________________________________________ Overview
March 2010 Institute of Social and Economic Research, UAA Page 17
confirms that had Alaska remained dependent on the private resource sectors that were driving the economy at the time of statehood (the traditional resources), the economy would be much smaller today than it actually is.
As with any exercise of this type, the sectoral allocations of activity are, in some instances, arbitrary. We chose to define federal military to include civilian department of defense employees, but they could also have been included in federal civilian. We allocated federal retirement payments to retirees, but we could have included them in the federal military and civilian sectors. The size of each sector is only marginally sensitive to these allocations.
Estimating the importance of each sector is complicated by a dearth of information about their economic characteristics. In an ideal world, this exercise could be done using an Input-Output model, but the data to build a model that completely and accurately represents the structure of the economy does not exist.14 Because of this, the approach in this study is less formal, but hopefully more useful and accurate because it relies on interpretation of the information that is available—tempered by long experience in observing the Alaska economy and in working with and interpreting the data which we have,15 as well as earlier attempts at presenting a complete picture of the structure of the economy.16
A snapshot of the characteristics of the labor market would provide an interesting counterpoint to the structural analysis presented in this paper since it is ultimately the well-being of individuals, families, and other households that is the reason for economic production. However, we do not have the information to construct a complete picture of the number of people working, either in the cash economy or in subsistence-related activities at any point in time during the year.17
14 A recent attempt to measure the relative importance of the different basic activities in Alaska using an Input-Output model was done by Chang Seung and Edward Waters and will be published in the Annals of Regional Science. 15 Input-Output analysis is useful for describing the importance of certain sectors of the economy although the technique must be applied with care because of the many unusual features of the Alaska economic structure. It can also be used as a general check on the results of the analysis in this study. 16 See Structural Analysis of the Alaska Economy: A Perspective from 1997 by Scott Goldsmith, Institute of Social and Economic Research, for the Alaska Science and Technology Foundation, 1997. 17 Unlike information about production, which is automatically generated by administrative records such as unemployment insurance payments, information about households generally comes from surveys. Because of the expense of conducting surveys, detailed descriptive information is limited, and only a few items like the poverty rate, the unemployment rate, and the share of the population without health insurance are readily available.

Structural Analysis of the Alaska Economy ________________________________________________________ Fourteen Driving Sectors
March 2010 Institute of Social and Economic Research, UAA Page 18

Structural Analysis of the Alaska Economy ________________________________________________________ Fourteen Driving Sectors
March 2010 Institute of Social and Economic Research, UAA Page 19
III. The 14 Sectors that Drive the Alaska Economy In this section of the report, we provide basic information about each of
the driving sectors of the economy in a consistent format in the following categories:
VALUE OF OUTPUT—the value of sales or an equivalent indicator of the money generated by the driver. PERSPECTIVE—Alaska compared to other states. DIRECT JOBS—the number of annual average jobs in Alaska directly attributable to the activities of the sector. DIRECT EARNINGS—the wages and other earnings (benefits and proprietor income) directly attributable to the activities of the sector. AVERAGE EARNINGS—the average annual earnings of workers directly involved in the sector. SOURCE OF ECONOMIC CONTRIBUTION—how the sector is linked to the rest of the economy. STATE AND LOCAL GOVERNMENT REVENUES—the public revenues directly generated by the sector. GROSS DOMESTIC PRODUCT—an interpretation of the gross domestic product measure of activity in this sector. MEASUREMENT ISSUES—problems with the currently available information about the sector and its interpretation. PRIMARY DATA SOURCES—information sources for following trends in the sector. RECENT LITERATURE—studies of the structure and characteristics of the sector.

Structural Analysis of the Alaska Economy ________________________________________________________ Fourteen Driving Sectors
March 2010 Institute of Social and Economic Research, UAA Page 20

Structural Analysis of the Alaska Economy ___________________________________________________________ Petroleum Production
March 2010 Institute of Social and Economic Research, UAA Page 21
A. PETROLEUM PRODUCTION
Petroleum is the most important natural resource sector in the state. Production of crude oil is concentrated on the North Slope and transported by pipeline (Alyeska Pipeline) to Valdez for shipment out of the state. A small share of the crude feeds several refineries at Fairbanks, Nikiski, and Valdez that provide the majority of local product demand, including jet fuel. Natural gas produced with the crude oil is re-injected to maintain field pressure, except for a small share used for various purposes on the leases and for power generation.
Natural gas is the more important product of the Cook Inlet region in South Central Alaska, where a small amount of crude oil is also produced. Most gas production is now consumed in the domestic market for space heating or used for electricity generation. However, a portion is converted into LNG for export. Until recently a larger share was also exported as ammonia-urea.
A large part of the economic contribution of the petroleum sector comes from the exploration and development activities of the industry, much of which is contracted to other firms. The estimated capital construction budget for the industry in 2007 was $2.65 billion.
VALUE OF OUTPUT Since 1990 annual production of crude oil has fallen by more than half. The
wellhead value of crude oil production (including natural gas liquids) is determined not only by production but also by price. Because of volatility in the crude oil price, the annual wellhead value has fluctuated considerably and has increased dramatically in the last 4 years. Marketed production of natural gas from Cook Inlet has remained relatively constant over this period and the value of production has trended upward as a result of an upward price trend. The value of natural gas production excludes natural gas used on the North Slope for re-injection and other purposes. In 2005 for example, 3,166 bcf (billion cubic feet) of natural gas was re-injected to maintain field pressure on the North Slope to maximize crude production.

Structural Analysis of the Alaska Economy ___________________________________________________________ Petroleum Production
March 2010 Institute of Social and Economic Research, UAA Page 22
Table III.A1. Petroleum Production, Price and Value, 1990 - 2006 1990 1995 2000 2001 2002 2003 2004 2005
Annual Production Crude Oil in Million
Barrels (NS + Cook Inlet)
647 541 355 351 359 355 332 315
Natural Gas Liquids in Million Barrels 18 30 33 30 29 27 28 24
Cook Inlet Natural Gas in Billion Cubic Feet*
205 214 216 222 210 205 208 208
Price Crude Oil (ANS
Wellhead / barrel) $15.21 $11.16 $26.40 $21.27 $21.68 $26.44 $35.00 $50.14
Natural Gas (Prevailing Value per mcf)
$1.35 $1.40 $1.53 $2.20 $2.50 $2.29 $2.82 $3.40
Value of Production (Million $)
Total $10,460 $6,748 $10,362 $8,394 $8,656 $10,385 $13,138 $17,615 Crude Oil $9,898 $6,104 $9,328 $7,417 $7,710 $9,346 $11,622 $15,788 Natural Gas Liquids $284 $344 $704 $489 $422 $569 $929 $1,119
Natural Gas $278 $300 $331 $487 $525 $470 $587 $708
Source: Production--State of Alaska, Department of Natural Resources, Oil and Gas Report, Annual; Price--Department of Revenue; Value of Production--ISER calculation. *Excludes gas used for re-injection and production on the North Slope. Value of production measured at wellhead. PERSPECTIVE
Alaska ranks behind Texas and the federal OCS in annual crude oil production. In 2004 production from the federal OCS was 567 million barrels, or 29 percent of the total U.S. Texas produced 393 million barrels, and Alaska produced 332 million, or 17 percent of the total. Both total U.S. and Alaska production have been declining, but because production in Alaska has been falling faster than the U.S. average, the Alaska share of total U.S. production has fallen since at least 1990.
Table III.A2. Domestic Crude Oil Production (Million Barrels) 1990 1995 2000 2001 2002 2003 2004 TOTAL 2,685 2,394 2,131 2,118 2,097 2,073 1,983
Texas 678 560 443 424 412 406 393 Alaska 647 542 355 351 359 356 332 California 321 279 271 261 258 250 240 Other, Incl. Federal OCS 1,038 1,014 1,061 1,081 1,068 1,062 1,018
Item: Alaska Share 24.1% 22.6% 16.7% 16.6% 17.0% 17.1% 16.8%
Source: U.S. Energy Information Administration Petroleum Supply Annual.

Structural Analysis of the Alaska Economy ___________________________________________________________ Petroleum Production
March 2010 Institute of Social and Economic Research, UAA Page 23
Alaska marketed production of natural gas of about 200 bcf (billion cubic feet) annually represented only about 1 percent of total U.S. gas production of 19 tcf (trillion cubic feet) in 2004.
In 2005 petroleum accounted for 34 percent of the gross state product of Alaska but only 13 percent of the gross state product of Texas. DIRECT JOBS
About 10 thousand wage and salary jobs are directly associated with petroleum production, transportation, and manufacturing. These are reported in the following 4 categories—oil and gas extraction, support activities for mining (which includes some jobs in support of mineral mining), chemical manufacturing, and pipelines. Refining (petroleum manufacturing) is excluded because the refineries serve the local Alaska market. A small number of extraction and pipeline jobs also serve the Alaska market and are not part of the export base of the industry.
There are not many self-employed in petroleum production, transportation, and manufacturing so total jobs (wage and salary plus self-employed) are not much greater than wage and salary jobs.
These figures do not include many jobs associated with the exploration activities of the oil and gas companies, which are reported in other categories including construction, transportation, business services, utilities, communications, and other industries.
Table III.A3. Petroleum Production—Wage and Salary and Total Jobs
(Thousand) 1990 1995 2000 2001 2002 2003 2004 2005 2006
Wages and Salary Jobs (annual average) Extraction (211) 2.99 2.83 2.59 2.58 2.66
Mining Support (213) 6.6 6.01 5.54 5.78 6.34 Chemical Manufacturing (325) NA NA NA NA 0.24
Pipelines (486) NA NA NA NA NA Total Jobs
Extraction 5.44 3.98 3.17 3.31 3.1 2.95 2.86 2.94 Mining Support 5.71 5.29 5.94 6.66 6.1 5.68 5.91 6.49
Chemical Manufacturing 0.37 0.46 0.32 NA NA NA NA 0.31 Pipelines 1.57 1.23 1.14 NA NA NA NA NA
Source: USDC BEA Regional Economic Accounts Web site, wage and salary employment—Table SA27, total employment—Table SA25. NAICS codes in parentheses.
Structural Analysis of the Alaska Economy ___________________________________________________________ Petroleum Production
March 2010 Institute of Social and Economic Research, UAA Page 24
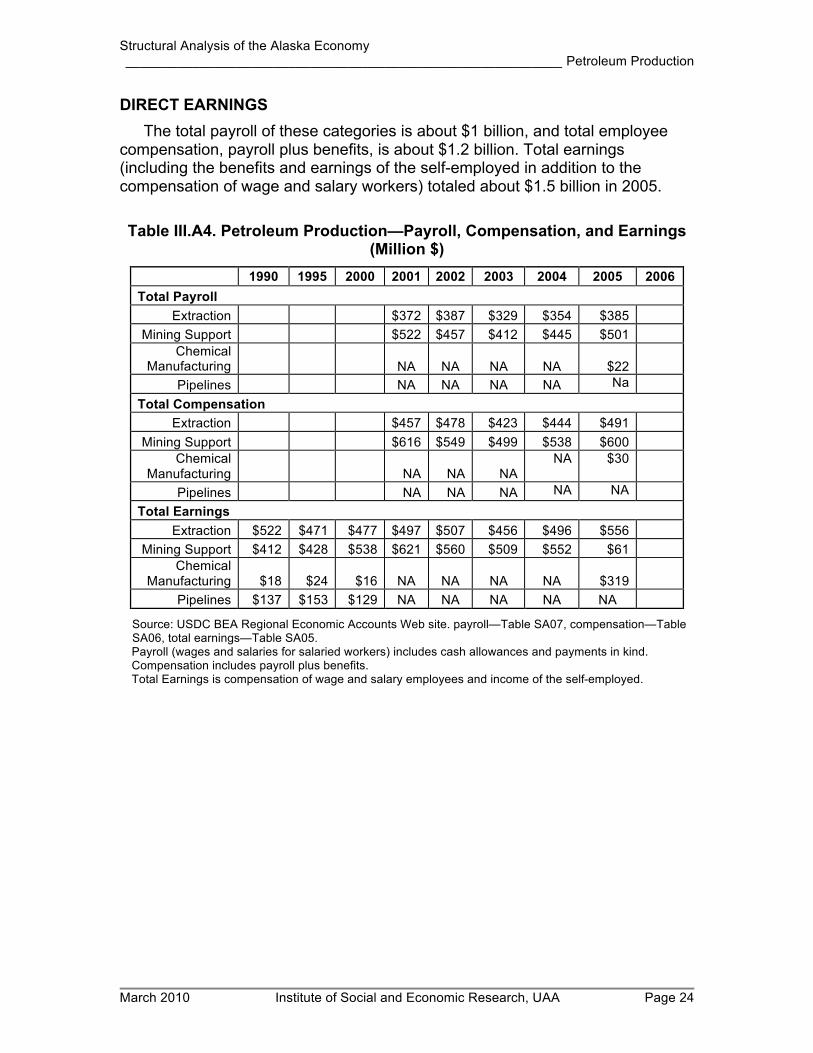
DIRECT EARNINGS The total payroll of these categories is about $1 billion, and total employee
compensation, payroll plus benefits, is about $1.2 billion. Total earnings (including the benefits and earnings of the self-employed in addition to the compensation of wage and salary workers) totaled about $1.5 billion in 2005. Table III.A4. Petroleum Production—Payroll, Compensation, and Earnings
(Million $) 1990 1995 2000 2001 2002 2003 2004 2005 2006
Total Payroll Extraction $372 $387 $329 $354 $385
Mining Support $522 $457 $412 $445 $501 Chemical
Manufacturing NA NA NA NA $22 Pipelines NA NA NA NA Na
Total Compensation Extraction $457 $478 $423 $444 $491
Mining Support $616 $549 $499 $538 $600 Chemical
Manufacturing NA NA NA NA $30
Pipelines NA NA NA NA NA
Total Earnings Extraction $522 $471 $477 $497 $507 $456 $496 $556
Mining Support $412 $428 $538 $621 $560 $509 $552 $61 Chemical
Manufacturing $18 $24 $16 NA NA NA NA $319 Pipelines $137 $153 $129 NA NA NA NA NA
Source: USDC BEA Regional Economic Accounts Web site. payroll—Table SA07, compensation—Table SA06, total earnings—Table SA05. Payroll (wages and salaries for salaried workers) includes cash allowances and payments in kind. Compensation includes payroll plus benefits. Total Earnings is compensation of wage and salary employees and income of the self-employed.

Structural Analysis of the Alaska Economy ___________________________________________________________ Petroleum Production
March 2010 Institute of Social and Economic Research, UAA Page 25
AVERAGE EARNINGS Average payroll and compensation is the highest of all industries.
Table III.A5. Petroleum Production—Average Annual Wage and
Compensation (Thousand $) 1990 1995 2000 2001 2002 2003 2004 2005 2006
Wage Extraction $124.5 $136.5 $127.0 $137.4 $144.9
Mining Support $79.2 $76.0 $74.5 $77.0 $79.1 Chemical
Manufacturing NA NA NA NA $89.9
Pipelines NA NA NA NA NA Compensation
Extraction $152.7 $168.7 $163.1 $172 $184.6 Mining Support $93.5 $91.3 $90.1 $93.1 $94.6
Chemical Manufacturing NA NA NA NA $125.4
Pipelines NA NA NA NA NA
Source: ISER calculation. SOURCE OF ECONOMIC CONTRIBUTION
The economic contribution of the petroleum sector includes not only the effects of exploration, development, and production but also pipeline transportation and manufacturing (lng and, until 2007, ammonia-urea). The petroleum companies involved in these activities contract with mining support firms and other businesses for much of the work. The total economic contribution is based on the combined payroll of oil companies and their instate procurement.
A 2001 study by the McDowell Group and Information Insights provides some quantification of this contribution. It estimated that in 1999—a year of low oil prices—total industry payroll was $422 million, and procurement was $1,655 million. The payroll represented 4,532 jobs with petroleum companies, pipelines, refineries, and manufacturing firms. The procurement spending directly supported about 5,000 jobs in oil-field-support businesses as well as 8,295 jobs in other services, construction, transportation, etc., for a total of 17,827 (direct, indirect, and induced). (Petroleum employment as defined in this study was 9,532). Procurement clearly accounted for a large share of the workers supported by petroleum-industry spending in that year, and in times of higher oil prices, that share could be expected to be higher.
Petroleum production is one of the basic industries in Alaska with a large number of nonresident workers. A large share of the activity is concentrated in camps on the North Slope to which workers commute, either from urban Alaska or from outside the state. The payroll accruing to nonresident workers does not contribute significantly to the Alaska economy.

Structural Analysis of the Alaska Economy ___________________________________________________________ Petroleum Production
March 2010 Institute of Social and Economic Research, UAA Page 26
Table III.A6. Petroleum Sector Sources of Economic Contribution 1999 Million $ Jobs Total $2,077 17,827
Payroll $422 4,532 Procurement $1,655 13,295
Oil Field Support $736 5,000 All Other Procurement $919 8,295
Services $309 Construction $226 Transportation* $224 Trade $142 Other $18
Item: Payroll + Oil Field Support 9,532
Source: McDowell and Information Insights; ISER. *Includes communications and utilities
STATE AND LOCAL GOVERNMENT REVENUES Petroleum revenues dominate state finances and are also important in
providing support to local governments. Because of this, they are described in a separate section of this report.
GROSS DOMESTIC PRODUCT Gross domestic product is equal to gross output (sales) less the value of
intermediate inputs (goods and services purchased from other U.S. industries or imported). Total gross product can be divided into three components—labor compensation, indirect business taxes, and capital income (including depreciation). Most of the gross domestic product of the petroleum sector falls into the category of capital income, which includes federal and state income taxes, royalties, and depreciation as well as profit.
Because gross output (the value of sales) fluctuates from year-to-year with the price of crude while the purchase of intermediate inputs is less volatile, the gross domestic product of the petroleum sector varies considerably from year-to-year. This volatility is a reflection of the short-term profitability of the sector rather than the level of current economic activity associated with the sector. Because of its large size relative to the rest of the Alaska economy, this volatility causes total state gross domestic product also to fluctuate from year-to-year.
Table III.A7. Petroleum Production—Gross Domestic Product (Million $) 1990 1995 2000 2001 2002 2003 2004 2005
Gross Product $7,266 $6,082 $7,314 $8,093 $10,056 $13,365 Extraction $4,784 $3,394 $4,292 $5,356 $7,316 $10,276
Mining Support $560 $714 $546 $612 $667 $1,073 Chemical
Manufacturing
$40 $49 $57 $55 $57 $58 Pipelines $1,882 $1,925 $2,419 $2,070 $2,016 $1,958
Source: USDC BEA Regional Economic Accounts Web site.

Structural Analysis of the Alaska Economy ___________________________________________________________ Petroleum Production
March 2010 Institute of Social and Economic Research, UAA Page 27
MEASUREMENT ISSUES Much of the employment associated with exploration, development,
production, transportation, and manufacturing of petroleum is in businesses that have contracted with the petroleum companies and consequently is not reported as petroleum production. Data on procurement by the petroleum companies, that would allow us to estimate the level of this contract employment, is not reported. Disclosure of employment and payroll figures for pipelines and chemical manufacturing firms is prevented by the small number of firms operating in these industries.
PRIMARY DATA SOURCES U.S. Department of Commerce, Bureau of Economic Analysis, Regional
Economic Accounts Web site. Alaska Department of Labor, Annual Employment and Earnings. Alaska Department of Revenue, Revenue Sources, semi annual. Alaska Department of Natural Resources, Alaska Oil and Gas Report, annual. ISER, Alaska’s Construction Spending, annual.
RECENT LITERATURE McDowell Group and Information Insights. “Economic Impact of the Oil and
Gas Industry on Alaska,” prepared for the Alaska Oil and Gas Association, January 2001.
Goldsmith, Scott. “Fiscal and Socioeconomic Impact of Marginal Oil Field Development in Alaska: Does It Pay Its Own Way?” Journal of Energy Finance and Development, Vol 2., Number 1.
Huskey, Lee. “The Petroleum Industry and the Fairbanks Economy,” November 1995.
Goldsmith, Scott. “The Importance of Petroleum in the Alaska Economy,” ISER Working Paper, April 1985.
Fried, Neal, and Brigitta Windisch-Cole. “The Oil Industry,” Alaska Department of Labor, Alaska Economic Trends, September 2003.
Alaska’s Oil and Gas Industry, Resource Development Council Web site at www.akrdc.org.
“A Survey of the Socio-Economic Impact of Alaska’s Petroleum Industry on the Private and Public Sectors of the State of Alaska and its Political Subdivisions,” prepared for the Alaska Oil and Gas Association by Chuck Becker, Marc Hellenthal, and Bob Richards, 1984.
Berman, Matthew. and Teresa Hull. Petroleum Sector Report, ISER for AIDEA and ADCED, October 1989.

Structural Analysis of the Alaska Economy ___________________________________________________________ Petroleum Production
March 2010 Institute of Social and Economic Research, UAA Page 28

Structural Analysis of the Alaska Economy ____________________________________________________________Petroleum Revenues
March 2010 Institute of Social and Economic Research, UAA Page 29
B. PETROLEUM REVENUES
Most state general-fund revenues come from taxes (production, corporate, and property) and royalties collected from oil and gas activities and, to highlight their importance, we describe the economic contribution of public revenues from petroleum separately from the activities associated with production. A portion of petroleum royalties is deposited in the Permanent Fund and is not available for appropriation; and settlements received by the state from tax and royalty disputes have been deposited in the Constitutional Budget Reserve (CBR) since 1990. These accounts are discussed in the next section. With the exception of a portion of the state petroleum property tax paid to localities in which petroleum property is located, all other petroleum revenues go into the state general fund. In 2008 the Alaska Department of Revenue estimates that more than 89 percent of general-fund revenues will come from petroleum.
There are three other sources of funding for state government capital and operating spending in addition to the general fund—restricted funds, federal funds, and the permanent fund dividend account. Consequently, the economic dependence of total state government activities on the petroleum industry, although large, is less than suggested by the dominance of petroleum revenues in the state general fund. Federal spending is clearly important as is the spending associated with the permanent fund dividend.
In addition, other basic industries—most notably seafood, mining, and tourism—contribute to the support of state and local government. Isolating the relationship between petroleum revenues and state/local government activity requires netting out the importance of all these other contributors. The permanent fund is addressed in the next section and federal spending later in this report.
To simplify the analysis, we assume that all state general-fund petroleum revenues are allocated to the operating budget and none to the state capital budget. This allows us to assume that none of the state capital budget is financed by petroleum revenues. It also allows us to assume that all of the general fund allocated to operations is financed by petroleum revenues. Although the federal funds portion of the operating budget supports some state employees, a large share consists of transfers to individuals or payments on their behalf such as Medicaid. As a result, most state government employment is financed by the general fund (petroleum) and the various restricted funds.
Excluding federal funds, the general fund accounted for 78 percent of the operating budget. But about $1 billion of state operations spending consists of transfers to support local government operations (see next paragraph). If the entire transfer amount came from the general fund (petroleum), then the share of state operations spending financed by the general fund (petroleum) falls to 72 percent.

Structural Analysis of the Alaska Economy ____________________________________________________________Petroleum Revenues
March 2010 Institute of Social and Economic Research, UAA Page 30
Table III.B1. Sources of Funding for 2008 Alaska State Budget (Million $) Operating Capital Permanent
Fund TOTAL
TOTAL $6,731 $1,241 $1,841 $9,813 “Own” Sources
General Fund $3,887 $356 - $4,243 Restricted Funds $1,098 $101 - $1,199
Federal Funds $1,746 $784 - $2,530 Permanent Fund $1,841 $1,841 Item: GF Share of “Own” Sources 78 % 78 % Item: GF Share of “Own” Sources Net Local Transfers 72 %
Source: State of Alaska, Office of Management and Budget, FY2008 Conference Committee Less Vetoes.
Note: Operating includes Debt, Fund Capitalization, Supplementals, and New Legislation; Permanent Fund includes Inflation proofing and the Permanent Fund dividend.
Petroleum revenues support local government expenditures directly through two mechanisms: The petroleum property tax accounts directly for about 8 percent of local government revenues. In addition, state government support, most of which comes out of the state general fund, accounts for about 32 percent of local government revenues. So about 40 percent of local government is directly supported by petroleum revenues.
Table III.B2. Alaska Local Government Revenue Sources, 2005 Million $ Share Total general revenue $2,863
State government $ 915 32 % Federal government $ 240 8 % Petroleum property $ 215 8 % All other $1,493 52 %
Source: U.S. Census, State and Local Government Finances; Alaska Department of Commerce and Community Development, Alaska Taxable
VALUE OF OUTPUT General fund petroleum revenues fluctuate dramatically from year-to-year
because of the volatility of the price of oil. Price volatility has masked the production decline which began in 1989. In 2007 the production tax was restructured into a net profits tax (PPT and then ACES) which will have the effect, in a high-price environment, of increasing petroleum revenues. Since 1990 petroleum revenues have accounted for between 68 and 90 percent of state general-fund revenues with no apparent trend in the share. Years when the share is low occur when the price of oil is low.

Structural Analysis of the Alaska Economy ____________________________________________________________Petroleum Revenues
March 2010 Institute of Social and Economic Research, UAA Page 31
Table III.B3. State general fund revenues from petroleum
Fiscal Year GF Petroleum Revenues
Share from Petroleum
ANS Wellhead Oil
Price 1990 $2,121 84.6% $11.90 1991 $2,571 86.1% $15.38 1992 $2,007 81.5% $11.21 1993 $1,968 83.7% $12.81 1994 $1,293 78.2% $9.57 1995 $1,617 77.6% $11.51 1996 $1,665 78.0% $12.60 1997 $2,010 80.6% $16.40 1998 $1,333 73.0% $11.91 1999 $913 67.5% $8.47 2000 $1,642 76.5% $19.06 2001 $1,875 79.8% $22.24 2002 $1,320 76.5% $16.80 2003 $1,639 80.7% $23.27 2004 $2,057 84.4% $26.78 2005 $2,850 86.4% $38.82 2006 $3,699 85.6% $55.33 2007 $4,481 87.1% $55.67 2008 $7,685 90.3% $77.92
Source: Alaska Department of Revenue, Revenue Sources
PERSPECTIVE No other state is so dependent on a single industry for revenues to support
state and local government activities.
DIRECT JOBS State and local governments directly employ about 60 thousand, but not all of
these jobs are dependent upon petroleum revenues. As indicated above, roughly 72 percent of state jobs and 40 percent of local jobs are directly dependent upon petroleum revenues. Combining these totals, we can estimate that about 31 thousand state and local government jobs—about half—are directly dependent on petroleum revenues.
These estimates are based on the assumption that all petroleum revenues are allocated to the operating budget.
In years when the petroleum revenue share of general fund revenues is lower, it is not because nonpetroleum revenues are higher. In those years current petroleum revenues are augmented by draws from the Constitutional Budget Reserve to balance the budget (see next section), so the dependence of government spending on petroleum revenues is unchanged.

Structural Analysis of the Alaska Economy ____________________________________________________________Petroleum Revenues
March 2010 Institute of Social and Economic Research, UAA Page 32
Table III.B4. Alaska State and Local Government—Wage and Salary and Total Jobs (Thousand)
1990 1995 2000 2001 2002 2003 2004 2005 2006 State Government 21.23 21.49 22.28 23.1 23.92 23.63 23.26 23.46
Local Government 29.48 32.77 35.09 36.05 37.14 37.38 36.85 37.2
Source: USDC BEA Regional Economic Accounts Web site, wage and salary employment—Table SA27, total employment—Table SA25.
There are no self-employed state/local government workers. DIRECT EARNINGS
The combined payroll of state and local government workers is over $2 billion, and with benefits included, the total is over $3 billion.
Table III.B5. Alaska State and Local Government—Payroll, Compensation and Earnings (Million $)
1990 1995 2000 2001 2002 2003 2004 2005 2006 Payroll State Government $928 $993 $1,020 $1,024 $1,093 $928 Local Government $1,225 $1,281 $1,317 $1,341 $1,377 $1,225
Compensation State Government $910 $1,053 $1,055 $1,103 $1,200 $1,256 $1,283 $1,377 Local Government $1,118 $1,429 $1,441 $1,488 $1,578 $1,652 $1,709 $1,777
Source: USDC BEA Regional Economic Accounts Web site. payroll—Table SA07, compensation—Table SA06, total earnings—Table SA05
Payroll (wages and salaries for salaried workers) includes cash allowances and payments in kind. Compensation includes payroll plus benefits.
Total Earnings is compensation of wage and salary employees and income of the self-employed. Since there are no self-employed in state/local government, total earnings is the same as employee
compensation. AVERAGE EARNINGS
The average state government wage was $47 thousand in 2005, compared to $37 thousand for local government. With benefits, average compensation was $59 thousand and $48 thousand, respectively.

Structural Analysis of the Alaska Economy ____________________________________________________________Petroleum Revenues
March 2010 Institute of Social and Economic Research, UAA Page 33
Table III.B6. Alaska State and Local Government—Average Annual Wage and Compensation (Thousand $)
1990 1995 2000 2001 2002 2003 2004 2005 2006 Wage
State Government $40.2 $41.5 $43.2 $44.0 $46.6
Local Government $34.0 $34.5 $35.2 $36.4 $37.0
Compensation State
Government $47.8 $50.12 $53.2 $55.2 $58.7
Local Government $41.3 $42.5 $44.2 $46.4 $47.8
Source: ISER Calculation. SOURCES OF ECONOMIC CONTRIBUTION
In this section we have used simplifying assumptions to concentrate the economic contribution of petroleum revenues on state/local government employment. Alternatively, one could assume that petroleum revenues support the full range of government spending. Here we discuss those various types of spending and their different economic effects.
State and local government appropriations affect the economy through four kinds of spending—labor cost, grants to local governments and nonprofit organizations, payments to individuals, and purchases from private businesses (both for operations and capital projects). The two other categories of appropriations—inflation proofing and intra-governmental charges—are essentially transfers from one agency of government to another and do not generate economic activity.
Table III.B7. Composition of Alaska state government appropriations--1998/1999
Total State Appropriations for FY 1999 in Billions $6.71 Labor Cost $1.20 Grants to Local Governments and Nonprofits $1.02 Payments to Individuals $1.69 Purchases from Private Businesses $1.79 Inflation Proofing, Debt Service, Special $0.55 Intra-governmental Charges $0.45
Source: Legislative Finance, Summary of Appropriations, the FY98 Session (for FY 1999), 1999 capital and 1999 operating budget spreadsheets, and ISER calculations.
Note: This is what the legislature appropriated for spending in the fiscal year from July 1, 1998, through June 30, 1999.
State appropriations do not correspond to “cash on the street” because they
exclude some other activities of state government, as shown in the following

Structural Analysis of the Alaska Economy ____________________________________________________________Petroleum Revenues
March 2010 Institute of Social and Economic Research, UAA Page 34
table, such as payments to retirees, unemployment compensation, the operations of the Alaska Railroad, and shared taxes (collected by the state but directly distributed to local governments without being included in the state budget appropriation). With the exception of shared petroleum property tax revenues, these components of “cash on the street” are not funded by petroleum revenues.
Table III.B8. Derivation of "Cash on the Street" from 1999 Appropriations (billion $)
Category Appropriations Minus Plus Cash on the Street
TOTAL $6.708 $.975 $1.025 $6.758 Operations $4.031 $ .454 - $3.577 Capital $1.403 $ .100 - $1.303 PF Dividend $ .8853 - - $ .853 Other $ .421 $ .421 - - Public Employees Retirement - - $ .600 $ .600 Unemployment Compensation - - $ .100 $ .100 Alaska Railroad - - $.075 $.075 State Shared Taxes - - $ .250 $ .250 Loans - - - -
Source: ISER, Citizen’s Guide to the Alaska Budget.
The analysis of the 1999 state appropriations (Citizen’s Guide to the Alaska Budget) calculated that operations expenditures generated 67 thousand total jobs in the economy (direct, indirect, and induced). The capital budget produced 12.6 thousand jobs.

Structural Analysis of the Alaska Economy ____________________________________________________________Petroleum Revenues
March 2010 Institute of Social and Economic Research, UAA Page 35
Table III.B9. Jobs Generated by "Cash on the Street" for 1999 State Budget (annual average in
thousands) TOTAL 97.8 Operations 67.0
Personnel 31.6 Local Operating Grants 25.0 Local Debt Service - Grants to Persons 5.5 Contracts 3.1 Debt Service - Commodities .9 Travel .4 Equipment .1 Miscellaneous .4
Capital 12.6 PF Dividend 9.4 Public Employee Retirement 3.3 Unemployment Comp .6 AK Railroad .8 State Shared Taxes 4.1
Source: ISER calculation. STATE REVENUES
NA
GROSS DOMESTIC PRODUCT State and local government GSP is reported as a single number. It is primarily
employee compensation (wages and salaries, employer contributions for employee pension and insurance funds, and employer contributions for government social insurance) with small adjustments for the estimated consumption of fixed capital stock (a measure of the value of current services of fixed assets) and the surplus (deficit) of certain public enterprises like the Alaska ferry system. As such, it does not capture several important activities of state and local government that directly contribute to the economy, including capital expenditures, transfers to individuals and non-profit organizations, and the Permanent Fund dividend. In 2005 state and local government gross domestic product was $3.413 billion.
Table III.B10. Alaska State and Local Government--Gross Domestic Product (Million $)
1990 1995 2000 2001 2002 2003 2004 2005 State and Local Government $2,696 $2,820 $3,021 $3,150 $3,229 $3,413

Structural Analysis of the Alaska Economy ____________________________________________________________Petroleum Revenues
March 2010 Institute of Social and Economic Research, UAA Page 36
Source: USDC BEA Regional Economic Accounts Web site MEASUREMENT ISSUES
The contribution of petroleum revenues to the economy varies from year-to-year because of both the amount of revenues spent and the composition of public programs and services funded by those revenues. There is not a strict relationship between the amount of petroleum revenues appropriated and the size of the economic contribution. This is because, in years of high revenues, it is more likely that the state will appropriate funds for capital projects and fund capitalization, debt service, and other programs that have little or no direct effect on the economy. In years of low petroleum revenues, these programs tend to get less funding. Time lags between appropriations and when cash hits the street also complicate the relationship.
PRIMARY DATA SOURCES U.S. Department of Commerce, Bureau of Economic Analysis, Regional
Economic Accounts Web site. Alaska Department of Labor, Annual Employment and Earnings. Alaska Department of Revenue, Revenue Sources, semi annual. Alaska Office of Management and Budget, Fiscal Summary.
RECENT LITERATURE Goldsmith, Scott. “Alaska’s Budget: Where the Money Came From and
Where it Went, 1990-2002” Fiscal Policy Papers No 13, ISER, May 2003. Goldsmith, Scott. “Safe Landing: Charting a Flight Path through the Clouds”
Fiscal Policy Papers No 12, ISER, October 1999. Goldsmith, Scott, et al. “Alaska’s Dependence on State Spending” Fiscal
Policy Papers No 5, ISER, October 1990. Goldsmith, Scott. “How State Spending Reductions Affect Economic Activity”
ISER Working Paper, March 1986. Goldsmith, Scott. “Variations in Economic Activity in Alaska Due to Different
World Oil Prices,” ISER Working Paper, April 1985. Goldsmith, Scott. “Regional Economic Impacts of State Budget Reductions,”
ISER, for State of Alaska OMB, 1989. Goldsmith Scott. “A Comparative Analysis of the Economic Effects of Re-
imposing Personal Income Taxes, Reducing Permanent Fund Dividends, or Reducing State Spending,” for Alaska State Legislature, 1987.
Goldsmith, Scott. Citizens Guide to the Budget Web site, Institute of Social and Economic Research. http://citizensguide.uaa.alaska.edu/.

Structural Analysis of the Alaska Economy ______________________________________________ Permanent Fund and Other Reserves
March 2010 Institute of Social and Economic Research, UAA Page 37
C. PERMANENT FUND, CONSTITUTIONAL BUDGET RESERVE, AND OTHER RESERVES
Alaska has created two dedicated funds by Constitutional amendment that set
aside a portion of petroleum revenues (royalties) for specific uses other than current state appropriations. A least 25 percent of petroleum royalties are deposited into the Alaska Permanent Fund, the principal of which cannot be spent. Permanent fund earnings, available for appropriation by the legislature, fund the annual permanent fund dividend (a cash payment to all residents) and an appropriation for inflation proofing. The remaining earnings accumulate in a reserve account which has periodically been added to the principal.
Money received by the state from the settlement of tax and royalty disputes is deposited into the Constitutional Budget Reserve (CBR). The principal and earnings of the CBR can only be used to fund state appropriations in the event of a current revenue shortfall and must subsequently be repaid to the fund.
By siphoning off a share of state petroleum revenues, these funds reduce the current contribution of the petroleum sector to the economy, but subsequently, when fund earnings or principal is spent, they add to the level of economic activity.
VALUE OF OUTPUT The Alaska Permanent Fund (including the constitutionally protected corpus,
unrealized capital gains, and the reserve account, but excluding the dividend account) stood at about $39 billion at the end of FY 2007. At the target real rate of return of 5%, the fund could produce about $2 billion of appropriable income each year in perpetuity without diminishing its real (inflation adjusted) value, and with future royalty contributions this amount will increase.
Actual appropriations have been less than this because of the formulas used to determine the annual appropriations for the dividend and inflation proofing. Somewhat less than half the earnings are appropriated for the dividend, and inflation proofing is based on the growth in the consumer price index.
For example, if the fund balance were $40 billion, it would generate a nominal return of 8 percent; and if inflation were 3 percent, then the dividend account would receive $1 billion and inflation proofing would be $750 million. This would leave $250 million of earnings in reserve. The $250 million represents additional spending that could take place out of fund earnings while maintaining the value of the corpus.

Structural Analysis of the Alaska Economy ______________________________________________ Permanent Fund and Other Reserves
March 2010 Institute of Social and Economic Research, UAA Page 38
Table III.C1. Alaska Permanent Fund
Fiscal Year
PF Year-End Balance
(Billion $)
PF Dividend Account
(Million $)
Individual PF Dividend
Amount ($) 1990 $10.99 $474 $953 1991 $12.01 $477 $931 1992 $13.05 $479 $916 1993 $14.71 $501 $949 1994 $14.61 $526 $984 1995 $16.39 $637 $990 1996 $18.40 $617 $1,131 1997 $21.20 $719 $,1297 1998 $23.83 $871 $1,541 1999 $25.09 $1,014 $1,770 2000 $26.52 $1,145 $1,964 2001 $24.61 $1,085 $1,850 2002 $23.53 $908 $1,541 2003 $24.19 $660 $1,108 2004 $27.40 $550 $920 2005 $29.96 $505 $846 2006 $32.91 $661 $1,107 2007 $37.83 $989 $1,654 2008 $35.88 $1,255 $2,069
Source: Alaska Permanent Fund Corporation, Annual Financial Report, and Alaska Permanent Fund Division, Department of Revenue, Annual Report.
Permanent Fund Balance includes earnings reserve.
The assets of the CBR were $7.5 billion at the end of FY 2006, but the fund balance was $2.267 billion. The majority of the assets of the fund consisted of loans to the state general fund, which are unlikely to be repaid given the history of the fund. Over $5.2 billion in loans to the general fund have augmented current general fund revenues nearly every year since 1993, and only $56 million has been returned to the CBR. Settlement contributions have been modest in recent years, as have been fund earnings (not shown in the table).

Structural Analysis of the Alaska Economy ______________________________________________ Permanent Fund and Other Reserves
March 2010 Institute of Social and Economic Research, UAA Page 39
Table III.C2. The Constitutional Budget Reserve
Fiscal Year
Assets at Year End (Billion $)
Liabilities at Year End (Billion $)
Actual Fund Balance at Year End (Billion $)
Settlement Contributions
(Million $) Loans to GF (Million $)
1990 $0 $0 $0 $0 1991 $.297 $.297 $291 $0 1992 $.563 $.563 $247 $0 1993 $1.534 $.849 $.685 $914 $849 1994 $2.032 $1.418 $.614 $437 $569 1995 $3.697 $1.703 $1.994 $1,543 $285 1996 $4.394 $1.876 $2.518 $586 $173 1997 $5.131 $1.959 $3.172 $570 $83 1998 $5.843 $2.284 $3.559 $343 $325 1999 $6.013 $3.384 $2.628 $50 $1,101 2000 $6.575 $3.841 $2.734 $448 $457 2001 $6.827 $3.833 $2.994 $49 ($9) 2002 $7.040 $4.571 $2.469 $90 $738 2003 $7.207 $5.114 $2.093 $22 $544 2004 $7.26 $5.205 $2.064 $8 $91 2005 $7.394 $5.158 $2.235 $27 ($47) 2006 $7.511 $5.244 $2.267 $44 $86
Source: Alaska Department of Revenue, Revenue Sources.
Recently, the high oil price has resulted in a surplus in the state general fund. This surplus, however it is held, also represents another source of economic activity ultimately dependent on petroleum.
PERSPECTIVE Although several other states have established funds based on mineral
revenues in recognition of the nonsustainable nature of those revenues, none is as large as the Alaska Permanent Fund, and none distributes its earnings as a dividend to all residents.
DIRECT JOBS The Permanent Fund dividend cash payment is a direct increase in
household income for all Alaska residents. When households spend this cash, it creates jobs, primarily in trade and services. A recent estimate of the number of jobs (annual average) created by $1 billion in dividend distributions was 9.24 thousand (Citizen’s Guide to the Alaska Budget). Over time the number of jobs created by $1 billion in dividends will decline because inflation erodes the purchasing power of the dollar. The jobs created by the dividend will be concentrated in the trades and services.

Structural Analysis of the Alaska Economy ______________________________________________ Permanent Fund and Other Reserves
March 2010 Institute of Social and Economic Research, UAA Page 40
DIRECT EARNINGS There have been no recent estimates of the payroll associated with the jobs
created by the Permanent Fund Dividend program. However, a $1 billion dividend account distribution would directly represent 4 percent of 2006 state personal income, which was $25 billion.
AVERAGE EARNINGS The dividend itself adds about 4 percent to personal income for the average
person. The average earnings of the jobs generated by the dividend, because they are primarily in trade and services, is relatively low.
SOURCES OF ECONOMIC CONTRIBUTION Because the principal of the Permanent Fund cannot be spent and is invested
outside the state, the economic contribution of the fund comes from the appropriation of fund earnings. At present that consists solely of the Permanent Fund dividend, but because of the method used to calculate the annual dividend, some of the annual earnings (net of inflation proofing) remains unspent in most years. If these funds were spent, they would create jobs within the economy (dependent upon how they were spent).
The contribution of the CBR in the past has been to support a stable level of state general fund spending in spite of fluctuating petroleum prices and revenues. That role will decline in the future since fund contributions (settlements) are now quite modest, and the demand for loans to the general fund will eventually re-emerge, resulting in depletion of the fund balance.
STATE AND LOCAL GOVERNMENT REVENUES Since the Permanent Fund is a fund of the state of Alaska, its earnings are
state revenues. The dividend program produces taxes to the state to the extent that people purchase taxable goods and services—primarily alcohol, tobacco, and gasoline. This spending also generates local sales and property tax revenues although their importance has never been estimated.
GROSS DOMESTIC PRODUCT The income of the Permanent Fund and other financial holdings of
government do not appear in the gross domestic product of the state. This is because gross domestic product is based on the location where the income is earned rather than the residence of the owner of the asset.
MEASUREMENT ISSUES Little is known about how the Permanent Fund dividend influences consumer
spending and other economic behavior (labor force participation, wage rates, population movements). Because the program has now been in existence for 25 years, most residents are likely to treat it as “permanent income“ rather than as a one-time “windfall” that would largely be saved.

Structural Analysis of the Alaska Economy ______________________________________________ Permanent Fund and Other Reserves
March 2010 Institute of Social and Economic Research, UAA Page 41
PRIMARY DATA SOURCES Alaska Department of Revenue, Annual Report of the Alaska Permanent
Fund Corporation. Alaska Department of Revenue, Annual Report of the Permanent Fund
Dividend Division. Alaska Department of Revenue, Revenue Sources, semi annual.
RECENT LITERATURE Knapp, Gunnar, et al. The Alaska Permanent Fund Dividend Program:
Economic Effects and Public Attitudes, Institute of Social and Economic Research, September 1984.
Goldsmith, Scott, and Jeff Wanamaker. The Economic Impact of the Alaska Permanent Fund Dividend, Institute of Social and Economic Research, September 1989.
Goldsmith, Scott. Citizens Guide to the Budget Web site, Institute of Social and Economic Research. http://citizensguide.uaa.alaska.edu/.

Structural Analysis of the Alaska Economy ______________________________________________ Permanent Fund and Other Reserves
March 2010 Institute of Social and Economic Research, UAA Page 42

Structural Analysis of the Alaska Economy ______________________________________________________________________Seafood
March 2010 Institute of Social and Economic Research, UAA Page 43
D. MINING
The mining sector consists of three different activities: (1) hard rock mining for export, (2) coal mining that serves both local and export markets, and (3) production of construction materials—sand, gravel, and rocks—for the local market. Hard rock mining and about half of the coal mining activity comprise the economic base portion of this sector.
The economic base, in turn can be divided into three components: exploration and development of new mineral prospects; production of zinc, lead, gold, and silver from large-scale mines (Red Dog, Fort Knox, Pogo, and Greens Creek); and production of a variety of minerals from smaller operations that include both business and recreational operations. Most direct employment is associated with operations of the large-scale mines although exploration and development employment, which varies considerably from year-to-year, can be significant when a large prospect, such as a Donlin Creek or Pebble is under investigation or development. Only primary processing of minerals occurs within the state.
VALUE OF OUTPUT In 2005 the estimated market value of the four most important products of the
mining industry—zinc, lead, gold, and silver—was $1.25 billion, based on world prices.18 This jumped in 2006 to an estimated $2.65 billion, mostly due to high world commodity prices. Zinc, produced at the Red Dog Mine, accounted for most of the value.
The value of coal production in 2005 was $49 million, and the value of production of construction materials was $99 million. Aside from the export of a portion of coal production, these products are for the Alaska market and, consequently, not considered part of the economic base of the mining industry.
18 The values reported by the State of Alaska, Department of Natural Resources are based on the prices of refined metals. The values at the mine mouth are considerably lower particularly for metals requiring significant refining.

Structural Analysis of the Alaska Economy ______________________________________________________________________Seafood
March 2010 Institute of Social and Economic Research, UAA Page 44
Table III.D1. Value of Mining Production Calendar Year 1990 1995 2000 2001 2002 2003 2004 2005 2006
Annual Production Zinc (000 tons) 181 360 669 635 718 715 680 684 675 Lead (000 tons) 151 131 157 Gold (000 oz.) 232 142 546 551 562 528 457 427 576 Silver (000,000 oz.) 10 1 18 17 18 19 17 12 99 Coal (000,000 tons) 1.6 1.7 1.5 1.5 1.2 1.1 1.5 1.4 1.4
Price $/metric ton Zinc $1,640 $1,230 $1,230 $969 $852 $896 $1,160 $1,480 $3,500 Lead $1,010 $1,080 $961 $962 $961 $965 $1,200 $1,350 $1,710 Gold (Million $) $12.4 $12.4 $9.0 $8.8 $10 $11.7 $13.2 $14.3 $19.5 Silver (Thousand $) $155 $166 $161 $140 $148 $157 $207 $236 $373
Value of Production (Million $) Zinc $254 $345 $682 $508 $503 $536 $651 $862 $2,003 Lead $31 $34 $52 $56 $62 $64 $121 $115 $184 Gold $89 $56 $152 $149 $174 $192 $192 $190 $336 Silver $51 $7 $90 $73 $82 $95 $113 $86 $130 Other $0.20 $0.00 $2.30 $1.99 $2.27 $0.00 $0.00
Source: Production and Value--State of Alaska, Department of Natural Resources, Alaska’s Mineral Industry. Price—U.S. Geological Survey. Value of production is based on market price. Other includes mercury, tin, antimony, platinum, copper, chromium. PERSPECTIVE
Alaska moved up from 13th to 6th among states between 2005 and 2006 in the value of production. This was largely the result of the high zinc price.
Table III.D2. Non-Fuel Mineral Production in the U.S., 2006 Rank State Value (Billion $) Percent of U.S.
1 Arizona $6.71 10.4% 2 Nevada $5.24 8.1% 3 California $4.50 7.0% 4 Utah $3.99 6.2% 5 Texas $2.91 4.5% 6 Alaska $2.85 4.4%
Total $64.40
Source: U.S. Geological Survey, Mineral Commodity Summaries 2007. DIRECT JOBS
There were 1.539 thousand direct annual average wage and salary jobs in mining in 2005. In addition, there were about 700 self-employed engaged in mining for a total of 2.3 thousand. Although there are a small number of employees in the mining support sector associated with metal mining, we have included them all in the petroleum production sector.

Structural Analysis of the Alaska Economy ______________________________________________________________________Seafood
March 2010 Institute of Social and Economic Research, UAA Page 45
Table III.D3. Mining—Wage and Salary and Total Jobs (Thousand) 1990 1995 2000 2001 2002 2003 2004 2005
Wage and Salary
(212) (Annual Average) NA 1.47 1.45 1.38 1.57
Proprietors (Self- Employed)
Total 1.73 2.07 2.68 2.31 2.53 2.13 2.3
Source: USDC BEA Regional Economic Accounts Web site, wage and salary employment—Table SA27, total employment—Table SA25.
NAICS codes in parentheses.
A separate employment estimate for the mining industry prepared by the Alaska Department of Natural Resources is slightly higher. This higher estimate is largely due to the inclusion of mining exploration support activities (part of NAICS code 213) as well as some construction employment associated with the development of new mines. This data source shows considerable variation from year-to-year in exploration and development, as one would expect. However, it also shows more variation in the categories of sand and gravel and rock than one might expect.
Table III.D4. Mining—Wage and Salary Employment, Alaska DNR 1990 1995 2000 2001 2002 2003 2004 2005 2006
Total 3,510 3,406 3,183 2,835 2,824 1,906 3,048 2,821 3,014 Exploration 374 157 83 79 86 88 184 303 347 Development 95 637 345 333 135 64 283 498 701 Coal 115 120 121 121 100 65 90 95 95 Sand And Gravel 645 577 603 556 702 349 567 400 197 Recreational 315 255 250 210 180 175 175 175 98 Rock 160 200 150 137 177 35 475 148 22 Other (Gold, Silver, Base, Etc.) 1,806 1,460 1,631 1,399 1,444 1,130 1,274 1,202 1,554
Source: State of Alaska, Department of Natural Resources, Alaska’s Mineral Industry. DIRECT EARNINGS
Wage and salary payroll for the mining industry in 2005 was $112 million and $143 million including benefits. Proprietor income was modest and total earnings totaled $158 million. This amount excludes any payroll associated with mining support (NAICS 213) or construction employment engaged in development of new mines.

Structural Analysis of the Alaska Economy ______________________________________________________________________Seafood
March 2010 Institute of Social and Economic Research, UAA Page 46
Table III.D5. Mining—Payroll, Compensation, and Earnings (Million $) 1990 1995 2000 2001 2002 2003 2004 2005
Payroll NA $93.9 $96.0 $95.1 $112.4 Compensation NA $116.6 $122.6 $120.4 $142.7 Proprietor Income NA $10.4 $9.5 $13.3 $15.5 Total Earnings $83.6 $94.7 $114.0 NA $127.0 $132.1 $133.8 $158.1
Source: USDC BEA Regional Economic Accounts Web site. payroll—Table SA07, compensation—Table SA06, total earnings—Table SA05
Payroll (wages and salaries for salaried workers) includes cash allowances and payments in kind. Compensation includes payroll plus benefits.
Total Earnings is compensation of wage and salary employees and income of the self-employed. AVERAGE EARNINGS
The average wage was $72 thousand in 2005 and average total compensation was $91 thousand.
Table III.D6. Mining—Average Annual Wage and Compensation (Thousand $)
1990 1995 2000 2001 2002 2003 2004 2005 Wage NA $ 63.9 $ 66.1 $ 68.8 $ 71.8 Compensation NA $ 79.4 $ 84.4 $ 87.1 $ 91.2
Source: ISER estimate.
SOURCE OF ECONOMIC CONTRIBUTION The economic contribution of the mining industry comes from a combination
of payroll and procurement associated with production of minerals, expenditures associated with exploration and development, and royalties paid to resource owners. Exploration and development expenditures fluctuate considerably from year-to-year.
Table III.D7. Mineral Exploration and Development Expenditures 1990 1995 1996 2000 2001 2002 2003 2004 2005 2006
Total $78 $183 $439 $177 $105 $61 $67 $280 $452 $508 Exploration $63 $34 $45 $35 $24 $27 $28 $71 $104 $177 Development $14 $149 $394 $142 $81 $34 $39 $209 $348 $331
Source: State of Alaska, Department of Natural Resources, Alaska’s Mineral Industry.
Several large producing and proposed mines located on private and Native land pay royalties to the landowners. In particular, the Red Dog mine (the largest zinc mine in the world) pays royalties to the NANA Regional Native Corporation, and under the terms of ANCSA (Alaska Native Claims Settlement Act), shares

Structural Analysis of the Alaska Economy ______________________________________________________________________Seafood
March 2010 Institute of Social and Economic Research, UAA Page 47
62% of those royalties with the other Regional Native Corporations. Red Dog mine royalty payments have increased from $17 million in 2005 to $130 million in 2007, due to both the increase in the price of zinc and the terms of the royalty agreement. Royalties are expected to reach $200 million in 2008. The royalty is calculated as a share of profits, and the rate jumped to 25% after the development costs of the mine were paid off. It will eventually rise to 50%.
STATE AND LOCAL GOVERNMENT REVENUES The mining license tax and the corporate income tax have been the largest
components of state revenues from mining in recent years, followed by rents and royalties, sales, and fees. State revenues have increased rapidly in the last several years due to increases in the value of production driven by high commodity prices. Total state revenues in 2005, based on information from the Alaska Department of Natural Resources (ADNR), was $25.4 million (FY 2004). Preliminary data for 2006 and 2007 projects state revenues closer to $150 million annually. (Mining revenue reported by the Alaska Department of Revenue is smaller, partly because they do not separately identify all categories of revenues paid by the mining industry.)
Local government revenues from mining activity were $12 million in 2005 (ADNR).
Table III.D8. Mining State and Local Revenues (Million $) 1990 1995 2000 2001 2002 2003 2004 2005
State Total $6.89 $5.43 $5.43 $8.25 $15.58 $25.39 Corp Tax NA $.295 $.02 $.03 $.13 $.12 NA Mining License Tax $.48 $1.86 $.49 $.38 $3.25 $10.32 $18.64 Mineral Rents $.75 $2.06 $1.84 $.06 $2.39 $2.93 $3.69 Coal Rents $2.04 $2.09 $1.37 $1.12 $.30 $1.48 $1.86 Material Sales $.48 $0.52 $1.65 $1.77 $.89 $.66 $1.12 Misc Fees $.09 $0.08 $.07 $.06 $.07 $.08 $0.08
Local Total* $9.20 $9.76 $9.70 $10.51 $11.0 $11.98
Source: State of Alaska, Department of Natural Resources, Alaska’s Mineral Industry. * Includes payments in lieu of taxes.
GROSS DOMESTIC PRODUCT
Gross Domestic Product in 2005 was $295 million. It is small relative to the value of output because mining is very capital-intensive with a relatively small labor component.
Table III.D9. Mining--Gross Domestic Product (Million $) 1990 1995 2000 2001 2002 2003 2004 2005 $380 $265 $236 $248 $284 $295
Source: USDC BEA Regional Economic Accounts Web site.

Structural Analysis of the Alaska Economy ______________________________________________________________________Seafood
March 2010 Institute of Social and Economic Research, UAA Page 48
MEASUREMENT ISSUES This sector has good data contained in the annual Alaska’s Mineral Industry
report. However, information on proprietor activity—participants, income, value of output, residence—is very limited. Construction employment associated with the development of mineral prospects and transportation employment associated with shipping of inputs and products should be included when calculating the importance of the sector.
PRIMARY DATA SOURCES U.S. Department of Commerce, Bureau of Economic Analysis, Regional
Economic Accounts Web site. Alaska Department of Labor, Annual Employment and Earnings. Alaska Department of Natural Resources, Alaska’s Mineral Industry, annual. Alaska Department of Revenue, Revenue Sources, semi annual. U.S. Department of Commerce—Statistical Abstract. U.S. Geological Survey, Historical Statistics for Mineral and Material
Commodities in the United States.
RECENT LITERATURE McDowell Group. The Economic Impact of Alaska’s Mining Industry, prepared
for the Alaska Miners’ Association, February 2006. McDowell Group and Information Insights. The Economic Impact of the Fort
Knox Mine on the Fairbanks North Star Borough, February 1999. Northern Economics. An Assessment of the Contribution of the Red Dog Mine
Operations to the Economy of the Northwest Arctic Borough, prepared for the Alaska Industrial Development and Export Authority, October 2002.
L. A. Peterson and Assoc. The Role of Placer Mining in the Alaska Economy, for the Alaska Department of Commerce and Economic Development, January 1986.
Power, Thomas. The Role of Metal Mining in the Alaska Economy, prepared for the Southeast Alaska Conservation Council and the Northern Alaska Environmental Center, February 2002.
Larson, Eric. And Bradford Tuck. Mineral Mining Sector Report. ISER for AIDEA and ADCED, October 1989.
Gilbertsen, Neal, and Dan Robinson. Natural Resources: Mining and Timber, Alaska Economic Trends, December 2003.
Tromble, Kristen, and Brigitta Windisch-Cole. Metal Mining: Revival of a Basic Industry, Alaska Economic Trends, November 1997.
Tromble, Kristen. Case Study of a Layoff—Life After Greens Creek, Alaska Economic Trends, January 1996.

Structural Analysis of the Alaska Economy ______________________________________________________________________Seafood
March 2010 Institute of Social and Economic Research, UAA Page 49
E. SEAFOOD
The Alaska seafood industry consists of the harvest and processing of a number of species found in the waters surrounding the state, some of which are managed by the state and others by federal agencies. Participant boats are based not only in Alaska but also in other ports along the west coast.
Although salmon have historically been the most important species, both in terms of value and number of participants in harvesting and processing, groundfish (bottomfish) have now become the highest value fishery. The salmon fishery continues to engage the largest number of participants. Competition from farmed salmon has reduced the value of the Alaska salmon harvest and the resident share of the value of the harvest has also declined over time as fishing permits (limited-entry permits) have become more concentrated among nonresident fishermen.
The other important state-managed fisheries, in addition to salmon, are the shellfish and herring fisheries. As is the case with the salmon fishery, entry into these other fisheries is limited by the state, as is the annual harvest. The crab fishery, in particular, tends to be dominated by non-Alaska boats.
“Americanization” of the groundfish harvest (dominated by pollock) in the Bering Sea and Aleutian Island area occurred between 1980 and 1990 with the passage of the American Fisheries Promotion Act in 1980. However, this fishery is dominated, not by Alaska boats, but rather by big trawlers based outside the state. Alaskan participants generally have smaller vessels with less catch power. This is a federal fishery managed by the National Marine Fisheries Service (MMFS).
The 1998 American Fisheries Act established the CDQ (Community Development Quota) program, making a portion of federally managed groundfish harvest available to Alaska communities. This has provided revenues and employment opportunities to many smaller communities in western Alaska. The act also allocated the catch between onshore processors and boats that combined harvesting and processing capabilities (catch processors).
The halibut fishery is also managed as a limited entry fishery by the International Pacific Halibut Commission.
The harvest fleet consists of three distinct types of vessels: (1) small open boats (Mosquito fleet); (2) vessels designed for salmon drift net, power troll, and purse seine—up to 58 feet; and (3) large, specialized vessels that target offshore crab and groundfish. The larger vessels have greater productivity and tend to be based outside the state.
The processing facilities are located in communities throughout the state except for the processing facilities located on some of the larger ships operating in the ground fishery.

Structural Analysis of the Alaska Economy ______________________________________________________________________Seafood
March 2010 Institute of Social and Economic Research, UAA Page 50
VALUE OF OUTPUT The gross value of the catch is based on the volume of fish landed both in
state waters and in the EEZ (Exclusive Economic Zone) between 3 and 200 miles off Alaska shores. Somewhat different estimates of the value of the catch are produced by the Alaska Department of Fish and Game and the National Marine Fisheries Service based on differences in measuring the catch and assigning it a value. Variation from year-to-year is due to fluctuations in both catch and price. The ex vessel value of the catch in 2005 was $1.3 billion.
Table III.E1. Value of Fish Landed in Alaska (including EEZ) by Species (Million $)
1990 1995 2000 2001 2002 2003 2004 2005 Total $1,526 $1,239 $942 $1,116 $997 $1,119 $1,197 $1,295
Salmon $574 $441 $288 $229 $163 $212 $272 $303 Groundfish $475 $434 $369 $632 $553 $560 $565 $660 Halibut $85 $65 $145 $112 $121 $171 $175 $169 Shellfish $362 $256 $133 $129 $151 $164 $170 $148 Herring $29 $42 $7 $14 $10 $12 $15 $15
Source: Alaska Department of Fish and Game, Division of Commercial Fisheries, Annual Overview.
Most of the catch is processed within the state. After instate processing, the value of the seafood harvest is more than double the ex-vessel value. Current data on the wholesale value of the fishery (value after processing) is not readily available, but in 1994 the processor margin was $1.46 billion on a harvest with an ex-vessel value of $1.17 billion. The wholesale value of the fishery in that year was $2.63 billion.
Table III.E2. Wholesale Value of Alaska Fishery and Processor Margin in 1994 (Million $)
Fishery Wholesale Ex vessel Processor Margin
Processor Margin/Ex
vessel TOTAL $2,628 $1,172 $1,456 1.24
Salmon $1,088 $494 $594 1.20 Crab $466 $314 $152 .48 Shrimp $3 $2 $1 .5 Miscellaneous Shellfish $9 $5 $4 .8 Herring $73 $25 $48 1.92 Groundfish $887 $232 $655 2.82 Halibut* $85 $99 –
Source: Alaska Department of Fish and Game, ISER calculation. *Wholesale value reported in source document is less than ex-vessel value.
One can also track the value of the fishery using data on annual exports, but
since not all of the harvest is exported, the export value of fish products is an underestimate of the wholesale value of production.

Structural Analysis of the Alaska Economy ______________________________________________________________________Seafood
March 2010 Institute of Social and Economic Research, UAA Page 51
Table III.E3. Total Value of Alaska Fish Product Exports (Million $) 1990 1995 2000 2001 2002 2003 2004 2005 2006
TOTAL $1,447 $1,459 $1,034 $1,190 $1,335 NA $1,684 $2,000 $2,017
Source: U.S. Bureau of the Census, Foreign Trade Statistics.
PERSPECTIVE In 2002 the value of the domestic seafood harvest was $3.1 billion. Alaska
accounted for more than 40 percent of the total. Table III.E4. Domestic Fish and Shellfish Value of Catch
in 2002 (Million $) TOTAL $3,092 Fish $1,359
Pollock $204 Salmon $155 Halibut $136 Flounder $102 Other $762
Shellfish $1,706 Shrimp $461 Crabs $398 Lobsters $293 Scallops $204 Clams $167 Other $183
Source: U.S. Dept of Commerce, US Census Bureau, Statistical Abstract.
DIRECT JOBS Employment can be divided between harvesting and processing although,
with the advent of the catch and process fleet in the bottomfishery, this distinction is not always easy to make.
Table III.E5. Seafood—Wage and Salary and Total Jobs (Thousand) 1990 1995 2000 2001 2002 2003 2004 2005 2006
Wage and Salary Harvesting (114) NA NA 0.12 0.13 0.15 Processing (311) 9.32 8.01 8.49 9.14 9.28
Total Harvesting 13.18 14.12 13.41 NA NA 9.68 11.83 11.51 Processing 10.24 11.29 8.87 9.46 8.21 8.66 9.34 9.47
Sum 23.42 25.41 22.28 NA NA 18.34 21.17 20.98
Source: USDC BEA Regional Economic Accounts Web site, wage and salary employment--Table SA27, total employment—Table SA25.
NAICS codes in parentheses. Harvesting includes hunting and trapping. Processing includes all food manufacturing in the state.

Structural Analysis of the Alaska Economy ______________________________________________________________________Seafood
March 2010 Institute of Social and Economic Research, UAA Page 52
Harvesting employment consists almost entirely of proprietors (self-employed boat captains and crew members). Because proprietor information comes primarily from tax returns, the harvest employment data in the table above is essentially a count of resident participants, rather than a measure of annual average employment by place of work.
However, it is possible to obtain an estimate of annual average employment based on total (resident and nonresident) participation in the fishery. Participation information comes from a count of limited-entry permits fished, along with the number of crew-member licenses issued. For example, in 2005 a count of the total workers engaged in the seafood harvest (participation) was 27.8 thousand (including the EEZ).
Table III. E6. Alaska Seafood Harvest Participation and Earnings 2000 2001 2002 2003 2004 2005 2006
Total Alaska Seafood Harvest (including EEZ) Fishing Permit Holders 11,440 10,053 9,444 9,485 9,749 9,899 Crew License Holders 22,977 19,523 16,614 17,657 17,688 17,866 Total Participants (Workforce) 34,417 29,576 26,058 27,442 27,437 27,765 Percent Nonresident 39% 40% 38% 38% 39% 39% Gross Earnings (Million $) $1,142 $1,149 $998 $1,008 $1,095 $1,172 Percent Earnings Nonresident 57% 62% 63% 65% 61% 60% Item: Alaska Exclusive Economic Zone (EEZ) Seafood Harvest Worker Count 577 569 564 543 538 538 Gross Earnings (Million $) $203 $215 $230 $211 $189 $180
Source: ADOL.
Participation can be converted into the number of annual average jobs in fish harvesting to be comparable to the job figures for other industries reported by the U.S. Department of Commerce and the Alaska Department of Labor (wage and salary industries). The conversion is based on estimates of the average number of months worked by each permit holder and estimates of the number of crew members engaged in each type of fishery (crew factors). After conversion annual average employment in the harvest of Alaska seafood was estimated to be 7.3 thousand in 2006. (This is a full time equivalent measure, similar to but not identical to annual average employment.). The resident share is about 4.5 thousand.
(At the time of this writing it is not clear how this methodology applies to the groundfish harvest in the EEZ since it is not managed by the state of Alaska. It is under the jurisdiction and management of the North Pacific Fisheries Management Council (NPFMC) which makes policy and the National Marine Fisheries Service (NFMS) which manages the fishery. In addition, the International Pacific Halibut Commission (IPHC) manages halibut.)

Structural Analysis of the Alaska Economy ______________________________________________________________________Seafood
March 2010 Institute of Social and Economic Research, UAA Page 53
Table III.E7. Alaska Annual Average Fish Harvesting Employment by Species by Place of Work
2000 2001 2002 2003 2004 2005 2006
Total 8,706 7,959 7,168 7,404 7,330 7,486 7,287
Salmon 4,295 3,761 3,073 3,424 3,526 3,817 3,788
Groundfish 1,575 1,361 1,224 1,209 1,191 1,132 1,126 Halibut 1,413 1,383 1,356 1,327 1,279 1,264 1,264
Crab 504 596 692 577 517 455 413
Herring 284 223 215 232 202 220 117 Miscellaneous Shellfish 183 168 173 172 165 159 135
Sablefish 453 466 437 463 450 436 441
Source: Alaska Dept of Labor. Count is based on the number of permits fished. If a person fishes multiple permits in a month,
they will be counted more than once. Halibut figure for 2006 is preliminary.
Because harvesting is highly seasonal, the number of annual average jobs is much smaller than the number of participants during the year. Most of the seasonality is attributable to the salmon harvest, while the crab harvest, concentrated in the winter, provides a small, counter-cyclical influence. Employment in the halibut and groundfish (primarily pollock) harvests is much more stable over the year.
Based on an analysis of permit holders and crew members, over half of resident Alaska fishermen relied on a wage and salary job in addition to their fish harvest work to earn living in 2006.
Total food processing employment in 2005 was 9.5 thousand of which almost all was wage and salary employment. Food processing employment in Alaska, with the exception of baking, is almost all associated with the fishery.
Table III.E8. Food Processing—Wage and Salary Employment (Thousand) 2002 2003 2004 2005
All Food Processing 7.941 8.413 9.037 9.228 Seafood 7.406 7.873 8.535 8.727
Source: Alaska Department of Labor
Processing employment data excludes many floating processors fishing off the state but based outside the state. (These processors pay unemployment insurance in other states and their workers are counted where the unemployment insurance is paid.). The number of workers excluded because of this is not known, but it could be in the range of about 2 thousand.
DIRECT EARNINGS As with the harvest employment data, the harvest earnings information from
the U.S. Department of Commerce is essentially an estimate of the net earnings

Structural Analysis of the Alaska Economy ______________________________________________________________________Seafood
March 2010 Institute of Social and Economic Research, UAA Page 54
of captains and crew members who are Alaska residents, rather than of the entire work force.
Table III.E9. Seafood—Payroll, Compensation, and Earnings (Million $) 1990 1995 2000 2001 2002 2003 2004 2005 2006
Wages Harvesting NA NA $11 $12 $12 Processing $235 $225 $259 $268 $293
Compensation Harvesting NA NA $12 $13 $14 Processing $301 $298 $330 $350 $388
Proprietor Income Harvesting NA NA $166 $154 $163 Processing $3 $4 $3 $3 $3
Total Earnings Harvesting $284 $130 $203 NA NA $178 $167 $177 Processing $282 $330 $297 $304 $301 $333 $354 $392
Sum $566 $459 $501 NA NA $511 $520 $568
Source: USDC BEA Regional Economic Accounts Web site: payroll—Table SA07, compensation—Table SA06, total earnings—Table SA05.
Payroll (wages and salaries for salaried workers) includes cash allowances and payments in kind. Compensation includes payroll plus benefits.
Total Earnings is compensation of wage and salary employees and income of the self-employed.
Information on net earnings of harvesters comes from Schedule C of the federal income tax returns filed by captains and crew.
Gross earnings of harvesters, before the deduction of costs, is estimated by the Alaska Department of Labor and is approximately equal to the ex vessel value of the harvest.
Table III.E10. Gross Earnings by Species (Million $) 2000 2001 2002 2003 2004 2005
TOTAL $1,142.0 $1,149.4 $ 998.4 $1,008.3 $1,095.0 $1,172.3
Salmon $262.6 $205.1 $144.9 $193.1 $254.9 $293.7 Groundfish $528.8 $484.5 $509.3 $468.5 $493.7 $429.1 Halibut $130.1 $110.4 $127.3 $163.1 $169.4 NA Crab $131.1 $115.9 $142.3 $167.8 $154.0 $144.5 Herring $10.5 $12.9 $11.8 $11.9 $14.0 $13.3 Miscellaneous Shellfish $11.9 $8.6 $9.6 $9.9 $11.9 $12.5 Sablefish $74.5 $60.6 $63.1 $80.5 $74.2 $77.6
Source: Alaska Department of Labor.
Processor earnings are mostly in the form of wages and salaries. They totaled $392 million in 2005.

Structural Analysis of the Alaska Economy ______________________________________________________________________Seafood
March 2010 Institute of Social and Economic Research, UAA Page 55
AVERAGE EARNINGS The average wage for harvesters is not a useful measure because of the
small number of harvesters who are wage and salary workers. The average proprietor income, which was $14.3 thousand in 2005, is a more useful estimate of average earnings of resident participants, but generally represents seasonal rather than annual earnings.
Table III.E11. Seafood--Average Annual Wage and Compensation (Thousand $)
1990 1995 2000 2001 2002 2003 2004 2005 Wages
Harvesting NA NA $90.3 $88.6 $82.7 Processing $25.3 $28.1 $30.5 $29.3 $31.6
Compensation Harvesting NA NA $99.9 $98.3 $92.2 Processing $32.3 $37.2 $38.9 $38.3 $41.8
Proprietor Income Harvesting NA NA $17.3 $13.2 $14.3 Processing $22.0 $7.9 $17.4 $17.4 $18.3
Source: ISER Calculation.
Gross earnings per participant (both resident and non residents) in the various fisheries can be calculated from gross earnings and the number of participants; however, this does not take account of the costs associated with the harvest so it overestimates the net earnings.
Table III.E12. Gross Earnings per Participant—Captain and Crew (Thousand $)
2000 2001 2002 2003 2004 2005 Salmon $13.7 $11.9 $10.6 $12.8 $16.3 $18.3 Groundfish $138.1 $158.9 $202.9 $174.7 $191.1 $176.1 Halibut $25.1 $23.3 $28.4 $38.2 $42.4 NA Crab $54.7 $41.2 $54.8 $66.1 $60.7 $66.2 Herring $4.8 $7.3 $7.3 $7.1 $9.8 $9.0 Miscellaneous Shellfish $13.6 $10.7 $12.7 $12.9 $16.0 $17.4 Sablefish $42.0 $36.9 $42.9 $51.1 $49.4 $53.6
Source: ISER calculation.
The average annual processing wage is relatively low at $29 thousand. Average annual total compensation was $38 thousand.
SOURCE OF ECONOMIC CONTRIBUTION The economic contribution of the seafood industry comes primarily from the
wages and procurement associated with harvesting and processing of the catch. In recent years royalty payments by vessels operating in the EEZ have become

Structural Analysis of the Alaska Economy ______________________________________________________________________Seafood
March 2010 Institute of Social and Economic Research, UAA Page 56
an important source of income for CDQ groups. These payments were about $50 million in 2005.
The contribution is moderated by the fact that a large share of the workforce in both harvesting and processing is nonresident. This is partly the result of the seasonality of the industry—especially harvesting of salmon. For example, harvesting employment in the peak summer month was over 20 thousand compared to less than 1 thousand in December.
Table III.E13. Monthly Seafood Industry Employment in 2006 (Thousand)
Harvesting Processing January 2.70 7.30 February 3.09 8.63 March 4.49 8.94 April 4.46 7.51 May 5.73 6.49 June 17.67 12.49 July 20.18 18.17 August 13.53 16.11 September 7.67 11.23 October 4.84 7.12 November 2.42 5.27 December .72 3.19 Annual Average 7.287 9.37
Source: Alaska Department of Labor.
The resident share of gross earnings of harvesters varies with the fishery from a low of 19 percent for groundfish to a high of 74 percent for herring.
Table III.E14. Resident Share of Gross Earnings of Harvesters 2000 2001 2002 2003 2004 2005
Salmon 63% 66% 68% 68% 66% 65% Groundfish 17% 17% 15% 17% 16% 19% Halibut 67% 65% 67% 67% 69% NA Crab 30% 28% 30% 26% 27% 27% Herring 72% 71% 75% 77% 81% 74% Miscellaneous Shellfish 73% 71% 75% 73% 73% 70% Sablefish 55% 54% 55% 52% 51% 48%
Source: Alaska Department of Labor.
For the entire harvest, the resident gross earnings were $464 million in 2004, which was just 41 percent of the total. Resident net earnings would be considerably less.

Structural Analysis of the Alaska Economy ______________________________________________________________________Seafood
March 2010 Institute of Social and Economic Research, UAA Page 57
Table III.E15. Resident Gross Earnings of Harvesters 2000 2001 2002 2003 2004 2005
TOTAL $439.1 $369.9 $353.7 $422.1 $463.6 NA Salmon $165.4 $135.4 $98.5 $131.3 $168.2 $190.9 Groundfish $89.9 $82.4 $76.4 $79.6 $79.0 $81.5 Halibut $87.2 $71.8 $85.3 $109.3 $116.9 NA Crab $39.3 $32.5 $42.7 $43.6 $41.6 $39.0 Herring $7.6 $9.2 $8.9 $9.2 $11.3 $9.8 Miscellaneous Shellfish $8.7 $6.1 $7.2 $7.2 $8.7 $8.8 Sablefish $41.0 $32.7 $34.7 $41.9 $37.8 $37.2
Source: ISER Calculation.
The resident share of processor employment is about 27 percent, so only about $100 million of total processor earnings goes to Alaska residents.
STATE AND LOCAL GOVERNMENT REVENUES The fish-processing tax and the resource-landing tax (raw fish taxes), based
on the value of fish landed in Alaska, are the largest sources of state revenues from the seafood harvest. Half of the proceeds of these taxes are shared with the local communities where the fish are landed. Local governments also collect revenues from property taxes on processing facilities and harvesting equipment.
Table III.E16. Revenues Generated by Fishing Industry FY 2005 (Million $)
TOTAL $53.12 Fish Processing Tax (Business Tax) $25.56 Fishery Resource Landing Tax $8.65 Salmon Enhancement Tax $3.81 Seafood Marketing Assessment $3.52 Salmon Marketing Tax $2.46 Processor Corporate Income Tax $2.94 Dive Fishery Management Assessment $.41 CFEC License Fees $3.89 Crewmember License Fees $1.90
Source: ADFG, Division of Commercial Fisheries, Annual Overview.
GROSS DOMESTIC PRODUCT The gross domestic product of the seafood industry, including both harvesting
and processing, was estimated in 2005 to be $736 million. Table III.E17. Seafood--Gross Domestic Product (Million $)
1990 1995 2000 2001 2002 2003 2004 2005 Harvesting $506 $274 $243 $276 $311 $290 Processing $311 $333 $326 $336 $366 $446 Sum $817 $607 $569 $612 $677 $736
Source: USDC BEA Regional Economic Accounts Web site.

Structural Analysis of the Alaska Economy ______________________________________________________________________Seafood
March 2010 Institute of Social and Economic Research, UAA Page 58
MEASUREMENT ISSUES The estimation of annual average employment in harvesting is based on a
number of assumptions that may not be accurate, including the crew factors and the actual time spent in the activities surrounding the harvest.
The residence of crew members is not based on a check of Social Security Number against the Permanent Fund dividend. It seems to be based on the address used on the permit application.
Gross earnings is not a good measure of the true earnings of participants in the harvest since it includes the capital and operating costs associated with obtaining the catch.
PRIMARY DATA SOURCES U.S. Department of Commerce, Bureau of Economic Analysis, Regional
Economic Accounts Web site. U.S. Department of Commerce, Bureau of Census, Annual Survey of
Manufacturers. Alaska Department of Labor, Annual Employment and Earnings. Alaska Department of Fish and Game, Division of Commercial Fisheries and
Commercial Fisheries Entry Commission. National Oceanic and Atmospheric Administration (NOAA), National Marine
Fisheries Service (NMFS). U.S. Department of Commerce, Statistical Abstract.
RECENT LITERATURE Berman, Matthew, and Teresa Hull. The Commercial Fishing Industry in
Alaska’s Economy, ISER, March 1987. McDowell, Eric, James Calvin, and Neal Gilbertsen. Alaska Seafood Industry
Study: A Technical Report. An Economic Profile of the Seafood industry in Alaska, for the Seafood Industry Study Commission Anchorage, Alaska, May 1989.
Knapp, Gunnar, and Terrence Smith. The Alaska Seafood Industry: Seafood Sector Report. For AIDEA and ADCED, by ISER, 1991.
Fried, Neal, Alaska Seafood Processing—A Growing Job Source? Alaska Department of Labor, Alaska Economic Trends, March 1996.
Patton, Michael, and Dan Robinson. Employment in the Alaska Fisheries. Alaska Department of Labor, Alaska Economic Trends, February 2006.
Windisch-Cole, Brigitta, and Josh Warren. Alaska is the No.1 Fishing State. Alaska Department of Labor, Alaska Economic Trends, November 2008.
Robinson, Dan, and Neal Gilbertsen. Fish Harvesting Employment. Alaska Department of Labor, Alaska Economic Trends, December 2006.

Structural Analysis of the Alaska Economy ______________________________________________________________________Seafood
March 2010 Institute of Social and Economic Research, UAA Page 59
Gilbertsen, Neil. Residency and the Alaska Fisheries, Alaska Department of Labor, Alaska Economic Trends, December 2004.
Olson, Paul, and Dan Robinson. Employment in Alaska Fisheries. Alaska Department of Labor, Alaska Economic Trends, December 2004.
Wink, Andrew, Jeff Hadland, and Brian Laurent. Alaska’s Fishermen: They Don’t Just Fish for a Living, Alaska Department of Labor, Alaska Economic Trends, November 2007.
Northern Economics, The Seafood Industry in Alaska’s Economy, 2009. Alaska Department of Fish and Game, Commercial Fisheries Ex Vessel and
Wholesale Values by Major Fishery, October 1995. Hartman, Jeff. Economic Impact Analysis of the Seafood Industry in
Southeast Alaska: Importance, Personal Income, and Employment in1994, Alaska Department of Fish and Game, October 2002.
Structural Analysis of the Alaska Economy ______________________________________________________________________Seafood
March 2010 Institute of Social and Economic Research, UAA Page 60

Structural Analysis of the Alaska Economy ______________________________________________________________________ Tourism
March 2010 Institute of Social and Economic Research, UAA Page 61
F. TOURISM
Visitors from outside Alaska who come to the state for vacations and pleasure comprise the tourism industry. Although their numbers are often combined with business visitors or residents who are engaged in recreational activities, pleasure visitors from outside Alaska are distinct because they bring new money into the state (not associated with a business activity). In the summer of 2006, about 82 percent of visitors were tourists (not counting those visitors combining a business trip with pleasure).
Table III.F1. Visitors to Alaska by Trip Purpose (000): Summer 2006 Number Percent Total 1,632 100%
Vacation/Pleasure 1,338 82% Visiting Friends or Relatives 146 9% Business 82 5% Business and Pleasure 66 4%
Source: McDowell Group, Alaska Visitor Statistics Program: Summer 2006. Note: Seasonal workers excluded.
About 90 percent of tourist visitors come during the summer months (May
through September), and cruise-ship passengers comprise the largest share of tourists—959 thousand or 62 percent of the total during the summer of 2006. Most other tourist visitors arrive by air, with smaller numbers driving or taking the ferry. Several international cruise-ship companies—Royal Caribbean (including Holland America and Princess Cruise Lines subsidiaries) and Norwegian Cruise Line—dominate the large cruise-ship business in the state. The other businesses that directly serve the tourist market—tour operators—are a combination of mostly smaller Alaskan-owned businesses and outside companies.
There is no “typical” tourist visitor. Although cruise-ship packages accounted for the largest share of total tourists in 2006, about 20 percent of cruise-ship packages include a cruise in one direction and air travel in the other, and 22 percent include a land component. In addition, 12 percent of cruise-ship package tourists spend time within Alaska on their own either before or after their package.
Of visitors arriving by air, 21 percent purchased a “package” of at least two days length; and of these, 46 percent were fishing packages. Interestingly, 31 percent of air visitors lodged for at least a portion of their visit in a private home.
The total number of 2006 tourist-visitor nights was 14.8 million, or an average of 9.1 nights per tourist. If these tourist visitors were distributed equally across all seasons of the year, they would number 40.7 thousand each night. Excluding tourists on a cruise-ship package without a land component (78 percent of 959 thousand cruise-ship visitors, or 48 percent of total tourist visitors), they would number 21 thousand—enough to populate a good-sized Alaska community.

Structural Analysis of the Alaska Economy ______________________________________________________________________ Tourism
March 2010 Institute of Social and Economic Research, UAA Page 62
VALUE OF OUTPUT The best measure of the value of output of this sector is total instate
expenditures of tourist visitors. This was estimated to be $1.524 billion during the summer of 2006. Since this information is not available annually, the number of tourists is another useful measure. Although the most commonly available figure is the number of total summer visitors (including business visitors), this serves as a rough estimate of the annual number of tourist visitors. (Subtracting the number of summer business visitors roughly offsets the number of winter tourist visitors.) Although the methods and definitions used in the collection of this information have not been consistent over time, the data do provide a general picture of the size of this sector.
Table III.F2. Alaska Visitors: Number and Spending 1990 1995 2000 2001 2002 2003 2004 2005 2006
Total Visitors (000) 1,456 1,528 1,567 Summer 690 967 1,203 1,275 1,310 1,447 1,632 1,632 Winter 255 253 253 257
Tourists 716 962 1,150 1,159 1,221 1,252 1,371 Summer 861 1,021 1,083 1,113 1,231 1,550 Winter 139 139 138
Instate Spending/ Summer Visitor ($) $1,258 $934 Total Summer Visitor Spending (Million $) $1,513
$1,524
Source: Alaska Department of Community, Commerce, and Economic Development, Alaska Office of Tourism Development, Alaska Visitor Statistics Program.
PERSPECTIVE
Total travel expenditures in Alaska are small compared to the other states in the west, particularly California. However, Alaska ranks high on the basis of per capita visitor spending, behind only Nevada, Hawaii, and Wyoming.

Structural Analysis of the Alaska Economy ______________________________________________________________________ Tourism
March 2010 Institute of Social and Economic Research, UAA Page 63
Table III.F3. Tourist Activity in Western States
Travel Expenditures (Millions $) Per Capita Receipts
Domestic International Total
Population (Million) Dollars U.S. Rank
Alaska $1,164 $116 $1,280 0.6 $2,133 6 Arizona $5,867 $1,297 $7,164 3.94 $1,818 10 California $43,982 $11,530 $55,512 31.2 $1,779 13 Colorado $6,396 $501 $6,897 3.57 $1,932 8 Hawaii $6,179 $5,680 $11,858 1.17 $10,135 2 Idaho $1,536 $57 $1,593 1.1 $1,448 22 Montana $1,446 $151 $1,597 0.84 $1,901 9 Nevada $14,485 $1,791 $16,276 1.39 $11,709 1 New Mexico $2,837 $107 $2,944 1.62 $1,817 11 Oregon $3,938 $272 $4,210 3.03 $1,389 27 Utah $2,846 $469 $3,314 1.86 $1,781 12 Washington $5,590 $805 $6,395 5.26 $1,215 34 Wyoming $1,130 $124 $1,254 0.45 $2,786 5
Total $97,394 $22,900 $120,295 56.03 $2,147
Source: Western States Tourism Policy Council Web page. Year of activity not shown in source document.
DIRECT JOBS Because tourists spend their money at the same businesses where Alaska
residents and other visitors shop—such as restaurants, hotels, campgrounds, and gift shops—the employment figures for these business categories cannot be used to measure the economic importance of tourism. The job categories that come closest to capturing the employment associated with tourism are scenic and sightseeing transportation, accommodations, and food services and drinking places.
Table III.F4. Visitors and Recreation—Wage and Salary and Total Jobs (Thousand)
1990 1995 2000 2001 2002 2003 2004 2005 2006 Wage and Salary (Annual Average)
Scenic/sightseeing Transportation (487) 1.55 1.52 1.48 1.63 1.79 Accommodations (721) 7.14 7.4 7.73 8.05 7.97 Food Services and Drinking Places (722) 17.41 17.95 18.29 18.55 19.08
Total Scenic/sightseeing Transportation 0.74 1.32 1.72 1.77 1.78 1.68 1.8 1.92 Accommodations 6.14 7.77 8.73 9.09 9.77 10.04 10.38 10.34 Food Services and Drinking Places 14.13 16.18 18.92 19.11 19.6 20.14 20.41 21.07
Source: USDC BEA Regional Economic Accounts Web site, wage and salary employment—Table SA27, total employment—Table SA25.
NAICS codes in parentheses.

Structural Analysis of the Alaska Economy ______________________________________________________________________ Tourism
March 2010 Institute of Social and Economic Research, UAA Page 64
A comparison of total accommodations and food-services sector sales with tourist spending for those categories provides a very rough estimate of the relative importance of tourism as a source of employment in these sectors. Tourists are estimated to account for 40 percent of jobs in accommodations and 12 percent in food services and drinking places.
Table III.F5. Tourist Spending Component of the Leisure and Hospitality Sector (Million $)
Total Sales (2002)
Tourist Spending (2006)
Tourist Share
Accommodations $478 $191 40% Food Services and Drinking Places $1,371 $158 12%
Source: U.S. Department of Commerce and Alaska Visitor Statistics Program. DIRECT EARNINGS
As with jobs, it is not possible to identify the payroll associated with tourist activities in the published data independent of other visitors and resident recreationalists.
Table III.F6. Visitors and Recreation—Payroll, Compensation, and Earnings (Million $)
1990 1995 2000 2001 2002 2003 2004 2005 2006 Wages and Salaries
Scenic/sightseeing Transportation $41 $38 $39 $44 $49 Accommodations $151 $160 $170 $185 $187 Food Services and Drinking Places $262 $280 $300 $315 $325
Total Compensation Scenic/sightseeing Transportation $48 $47 $48 $54 $61 Accommodations $180 $193 $205 $224 $228 Food services and Drinking Places $304 $334 $361 $380 $394
Total Earnings Scenic/sightseeing Transportation $16 $29 $49 $56 $55 $59 $67 $74 Accommodations $107 $151 $184 $200 $211 $221 $242 $245 Food Services and Drinking Places $210 $239 $323 $326 $360 $391 $415 $432
Source: USDC BEA Regional Economic Accounts Web site, payroll—Table SA07, compensation—Table SA06, total earnings—Table SA05.
Payroll (wages and salaries for salaried workers) includes cash allowances and payments in kind. Compensation includes payroll plus benefits. Total Earnings is compensation of wage and salary employees and income of the self-employed.

Structural Analysis of the Alaska Economy ______________________________________________________________________ Tourism
March 2010 Institute of Social and Economic Research, UAA Page 65
AVERAGE EARNINGS The average annual wage and compensation in the sectors serving visitors and
residents engaged in recreation are relatively low. The earnings of the self-employed (proprietors) also tend to be low. (The high values for scenic/sightseeing transportation in recent years are likely due to an error in the source data.)
Table III.F7. Visitors and Recreation—Average Annual Wage and Compensation (Thousand $)
1990 1995 2000 2001 2002 2003 2004 2005 2006 Wage
Scenic/sightseeing Transportation $26.2 $25.1 $26.5 $27.0 $27.6 Accommodations $21.2 $21.7 $21.9 $23.0 $23.4 Food services and Drinking Places $15.0 $15.6 $16.4 $17.0 $17.1
Compensation Scenic/sightseeing Transportation $31.3 $30.7 $32.5 $33.3 $34.1 Accommodations $25.3 $26.1 $26.5 $27.9 $28.7 Food services and Drinking Places $17.5 $18.6 $19.7 $20.5 $20.7
Proprietor Scenic/sightseeing Transportation $35.60 $33.37 $54.19 $79.76 $99.38 Accommodations $9.93 $7.62 $7.01 $7.63 $7.16 Food services and Drinking Places $12.45 $15.34 $16.32 $18.97 $18.87
Source: ISER Calculation. SOURCES OF ECONOMIC CONTRIBUTION
Out of pocket expenditures by tourists while in Alaska are concentrated on lodging, food, tours, entertainment, transportation, and souvenirs. These expenditures support employment, expand the payrolls, and generate profits for the businesses operating in these industries.
The composition of tourist expenditures is difficult to determine with any degree of accuracy because it is based on survey data. The survey requires that respondents can recall their spending over a number of days, locations, and categories. Since different survey methods and instruments have been used over the years to try to make it easier to collect this information, the results from different studies cannot be directly compared.
The surveys collect information on “out of pocket” expenditures while in the state, including instate purchases of “packages.” These “packages” normally consist of some combination of lodging, food, entertainment, transportation, and so forth. Therefore, when measuring the economic contribution of tourism, “package” expenditures should be allocated to those sectors.

Structural Analysis of the Alaska Economy ______________________________________________________________________ Tourism
March 2010 Institute of Social and Economic Research, UAA Page 66
Table III.F8. Instate “Out of Pocket” Visitor Expenditures per Person, Summer 2006
Transportation Market All Categories Air Cruise Hwy/Ferry
TOTAL $934 $1,376 $636 $1,310 Lodging $117 $289 $16 $174 Tours/Activities/Entertainment $188 $115 $237 $103 Gifts/Souvenirs/Clothing $177 $114 $217 $95 Food/Beverage $97 $188 $40 $209 Cars/Fuel/Transportation $68 $157 $8 $209 Package excluding Cruise $150 $453 * * Other $109 $333 $2 $31 Item: Expenditures per Day $103 $146 $79 $70 Item: Avg. Nights per Stay 9.1 9.4 8.1 18.8 Number of Visitors (000) 1,631.5 587.8 958.9 84.8
Source: McDowell Group, Alaska Visitor Statistics Program: Summer 2006. Note: Air category defined as persons entering and exiting state by air. Cruise category is all cruise ship
passengers, some of whom enter or exit by air. Expenditures includes all “out of pocket” spending (including pre-paid spending on shore excursion and
other day tours).
More importantly, package tours purchased prior to visiting the state are excluded from the visitor expenditure data because most of these involve a cruise-ship package. (The average cruise-ship package cost was about $1,900 in 2006.) These packages include transportation to and from Alaska as well as accommodations on the cruise ship (rather than on shore)—expenditures that don’t count as in-state. However, 22 percent of cruise-ship packages include a land component, during which tourists consume lodging, food, transportation, and other services from Alaska businesses even though they are not paying for them “out of pocket.” Total in-state visitor-related expenditures are underestimated if the land component of these cruise packages is excluded. Furthermore, other package tours not involving a cruise that are purchased prior to arriving in Alaska may also be excluded from the reported totals if visitors on these tours only report their out-of-pocket in-state expenditures.

Structural Analysis of the Alaska Economy ______________________________________________________________________ Tourism
March 2010 Institute of Social and Economic Research, UAA Page 67
Table III.F9. Total Instate “Out of Pocket” Visitor Expenditures Transportation Market
All Categories Air Cruise Hwy/Ferry Total $1,524 $809 $610 $111
Lodging $191 $170 $15 $15 Tours/Activities/Entertainment $307 $68 $227 $9 Gifts/Souvenirs/Clothing $289 $67 $208 $8 Food/Beverage $158 $111 $38 $18 Cars/Fuel/Transportation $111 $ 92 $8 $18 Package excluding Cruise $245 $266 Other $178 $196 $2 $3
Source: McDowell Group, Alaska Visitor Statistics Program: Summer 2006. Note: Air category defined as persons entering and exiting state by air. Cruise category is all cruise-ship
passengers, some of whom enter or exit by air. Expenditures includes all “out of pocket” spending (including pre-paid spending on shore excursion and
other day tours).
Some of the expenditures associated with travel to and from the state have an economic impact on Alaska. Cruise-ship crew members come ashore to make purchases while in Alaska ports. (One estimate suggests these purchases might be about 7 percent as large as the spending of cruise-ship passengers themselves in Southeast ports.) The cruise ships themselves purchase maritime services, repair services, and some groceries locally. (This has been estimated to be about 15 percent as large as the spending of cruise-ship passengers themselves in Southeast ports.) Furthermore. some of the expenditures associated with air and ferry travel to the state generate jobs and income in Alaska. For example, air passenger traffic creates an in-state demand for services at airports.
Because it is seasonal and tends to be concentrated in more rural parts of the state, tourism is one of Alaska’s “enclave” industries (along with seafood, mining, petroleum, and timber). This means that a significant share of the workforce consists of nonresidents, and parts of the industry, such as the large cruise ships, have weak links to the local economy. Most of the inputs required by these businesses are not purchased locally within Alaska but rather imported directly and bypass the local economies within which they seasonally operate.
STATE AND LOCAL GOVERNMENT REVENUES The state instituted a car-rental tax in 2004, a portion of which is paid by tourist
visitors to the state. In 2007 several new state taxes were introduced to cruise companies and their passengers. These included a $46 head tax, a $4 ocean range tax, and a gambling proceeds tax. Cruise ship company profits also became liable for the state corporate income tax. These measures are expected to generate about $75 million to the state annually.
Several local governments have head taxes on cruise-ship passengers and lodging taxes.
Like Alaska resident consumers, tourists also contribute directly to state and local governments through payment of sales and excise taxes (tobacco, alcohol,

Structural Analysis of the Alaska Economy ______________________________________________________________________ Tourism
March 2010 Institute of Social and Economic Research, UAA Page 68
and motor fuels) and indirectly when the businesses where they spend their money pay property taxes.
GROSS DOMESTIC PRODUCT Gross domestic product, like jobs and payroll, is available only for sectors that
serve tourists as well as other visitors and Alaska residents. Table III.F10. Visitors and Recreation—Gross Domestic
Product (Million $) 1990 1995 2000 2001 2002 2003 2004 2005
Scenic/sightseeing Transportation
NA NA NA NA NA NA
Accommodations $323 $304 $326 $335 $374 $386 Food services and Drinking Places
$411 $426 $477 $517 $552 $574
Source: USDC BEA Regional Economic Accounts Web site. MEASUREMENT ISSUES
Precise data on the number of tourists and the in-state expenditures that they make “out of pocket,” as well as the expenditures made on their behalf by tour operators, is difficult to obtain because it must be collected by survey.
The share of payroll paid to nonresident seasonal workers that “leaks” out of the economy without generating further in-state economic activity is unknown. The same is true for the share of nonresident profits.
PRIMARY DATA SOURCES U.S. Department of Commerce, Bureau of Economic Analysis, Regional
Economic Accounts Web site. Alaska Department of Labor, Annual Employment and Earnings. Alaska Department of Community, Commerce, and Economic Development,
Alaska Office of Tourism Development, Alaska Visitor Statistics Program, various reports.
U.S. Department of Commerce, 2002 Economic Census for Alaska, Accommodation and Food Service.
RECENT LITERATURE McDowell Group. Alaska Visitor Industry Economic Impact Study, prepared
for the Division of Tourism, Alaska Department of Commerce and Economic Development, May 1998 and May 1999, Update.
McDowell Group. Alaska Visitor Statistics Program: Summer 2006, prepared for State of Alaska Department of Commerce, Community, and Economic Development, April 2007.
Structural Analysis of the Alaska Economy ______________________________________________________________________ Tourism
March 2010 Institute of Social and Economic Research, UAA Page 69
McDowell Group. The Economic Impacts of the Cruise Industry in Southeast Alaska, prepared for the Southeast Conference, October 2000.
Global Insight. The Alaska Tourism Satellite Account, prepared for Alaska Department of Community and Economic Development, April 2004.
Northern Economics. Alaska Visitor Arrivals, Summer 2004, prepared for State of Alaska, Department of Commerce, Community, and Economic Development, December 2004.
Fried, Neal, and Brigitta Windisch-Cole. Leisure and Hospitality, Alaska Department of Labor, Alaska Economic Trends, January, 2004.
Alaska’s Tourism Industry, Resource Development Council Web site at www.akrdc.org.

Structural Analysis of the Alaska Economy ______________________________________________________________________ Tourism
March 2010 Institute of Social and Economic Research, UAA Page 70

Structural Analysis of the Alaska Economy __________________________________________________________ International Air Cargo
March 2010 Institute of Social and Economic Research, UAA Page 71
G. INTERNATIONAL AIR CARGO
A large share of the air cargo traffic between the Far East and the U.S. stops in Anchorage to refuel, change crews, and perform routine maintenance. Even though many of the newest jets have a range that allows them to overfly Alaska, most still find it more economical to carry a heavier payload and a limited amount of fuel.
Three major carriers—FEDEX, Northwest, and UPS—have established sorting facilities at Ted Stevens Anchorage International Airport for small packages; and a number of other carriers move cargo between planes to consolidate shipments for different destinations.
Several international cargo carriers used the Fairbanks International Airport in the early part of this decade; however, all but one have since left and the total weight of transit freight moving through that airport has dropped quite low.
VALUE OF OUTPUT There is no public data on the value of the services provided by the
international air cargo carriers that operate through the Anchorage airport. The nearest proxy is information on the number of revenue landings and the weight of the aircraft and cargo moving through the airport. Data are reported for international carriers and for total cargo operations, which include carriers that operate only within the state and domestic carriers that operate internationally.
The international carriers are a growing share of total cargo landings as well as the gross weight of aircraft. International cargo also dominates the net weight figure. (Total cargo is often reported in metric tones for international comparisons.)
Table III. G1. International Air Cargo Indicators
Fiscal Year 1990 1995 2000 2001 2002 2003 2004 2005 2006 Number of Revenue Landings (thousand)
International Carriers 11.5 15.37 24.39 25.87 Total 19.08 23.36 38.14 39.88 39.36 41.38 42.35 Gross Weight* (Billion lb.)
International Carriers 8.38 10.91 17.68 19.12 Total 10.35 12.86 20.27 21.14 20.92 23.97 24.46 Net Weight of Cargo** (Billion lb)
International Carriers 1.69 3.29 Total 1.99 3.97 Item: Total Cargo
Traffic (Million metric tons)
1.8 1.87 1.77 2.1 2.25 2.55 2.8
Source: Ted Stevens Anchorage International Airport. *Certified Maximum Gross Takeoff Weight is the basis for determining landing fees. **Net weight of cargo includes cargo loaded, unloaded, and in transit.

Structural Analysis of the Alaska Economy __________________________________________________________ International Air Cargo
March 2010 Institute of Social and Economic Research, UAA Page 72
PERSPECTIVE Ted Stevens Anchorage International Airport was ranked number three in the
world in 2006 in total cargo handled, after Memphis and Hong Kong. It has moved up the ranking over time from number 7 in 2000. However, unlike the other major world cargo airports, most of the cargo handled at Anchorage is transit freight, which requires less manpower than loading or unloading.
DIRECT JOBS International air cargo direct employment associated with activity at Ted
Stevens Anchorage International Airport has been recently estimated to be about 3.5 thousand (Goldsmith, 2007), including pilots who live in Anchorage. Most employment is wage and salary with only a small number of self-employed in this sector of the economy.
The Alaska Department of Labor reports employment in air transportation, air support services, and couriers/messengers, but these categories aggregate all cargo and passenger activity together (including domestic). The only way to isolate international cargo activity is by using the detailed data on airport activity combined with employment estimates for each carrier, support business, and courier. Furthermore, some of the jobs directly associated with servicing the planes, such as catering, are in other employment categories altogether.
The air transportation category includes most of the carriers, such as Northwest Airlines, but also Alaska-only carriers and the larger air taxis and leasing operators. Support activities (businesses providing services to all types of carriers) include the larger service providers like Swissport, which serve passenger as well as cargo carriers. The courier category includes the largest carriers, FEDEX and UPS, that have their own sorting facilities in Anchorage.
Table III.G2. Air Transportation—Wage and Salary and
Total Jobs (Thousand) 1990 1995 2000 2001 2002 2003 2004 2005 2006
Wage and Salary Workers (thousand) Air Transportation (481) 6.59 6.53 6.57 6.44 6.19 Support Activities (488) 3.09 3.03 2.88 2.8 2.85 Couriers/Messengers (492) NA NA NA NA 1.97 Total Workers Air Transportation 5.46 5.98 6.9 6.91 6.78 6.83 6.7 6.48 Support Activities 2.74 2.63 3.3 3.44 3.37 3.13 3.07 3.11 Couriers/Messengers 1.32 1.75 2.4 NA NA NA NA 2.47
Source: USDC BEA Regional Economic Accounts Web site, wage and salary employment--Table SA27, total employment—Table SA25.
NAICS codes in parentheses.

Structural Analysis of the Alaska Economy __________________________________________________________ International Air Cargo
March 2010 Institute of Social and Economic Research, UAA Page 73
DIRECT EARNINGS The payroll of the international air cargo sector has recently been estimated to
be about $150 million (Goldsmith, 2007), including employees of the air carriers and the support businesses.
Payroll for the entire air transportation sector, which includes scheduled and unscheduled domestic passenger and freight activity, is of course much larger.
Table III.G3. Air Transportation—Payroll, Compensation, and Earnings (Million $)
1990 1995 2000 2001 2002 2003 2004 2005 2006 Payroll
Air Transportation $287.90 $292.90 $312.30 $339.20 $319.80 Support Activities $107.10 $107.70 $106.60 $111.70 $117.60
Couriers/Messengers* NA NA NA NA $107.80 Compensation
Air Transportation $367.90 $381.40 $411.40 $457.70 $441.90 Support Activities $129.90 $132.20 $131.10 $137.90 $145.30
Couriers/Messengers NA NA NA NA $134.00 Total Earnings
Air Transportation $371.70 $385.60 $416.00 $460.80 $439.00 Support Activities $176.20 $166.00 $162.50 $180.00 $194.30
Couriers/Messengers NA NA NA NA $135.00
Source: USDC BEA Regional Economic Accounts Web site; payroll—Table SA07, compensation—Table SA06, total earnings—Table SA05.
Payroll (wages and salaries for salaried workers) includes cash allowances and payments in kind. Compensation includes payroll plus benefits.
Total Earnings is compensation of wage and salary employees and income of the self-employed. *Includes couriers and messengers as well as scenic and sightseeing transportation.
AVERAGE EARNINGS The average wage for the entire air transportation industry ranged from $41
thousand to $55 thousand in 2005. If the international air cargo component of the industry could be isolated, the average wage would be higher due to the fact that many pilots are based in Anchorage.

Structural Analysis of the Alaska Economy __________________________________________________________ International Air Cargo
March 2010 Institute of Social and Economic Research, UAA Page 74
Table III.G4. Air Transportation—Average Annual Wage and Compensation (Thousand $)
1990 1995 2000 2001 2002 2003 2004 2005 2006 Wage
Air Transportation $43.70 $44.80 $47.60 $52.70 $51.60 Support Activities $34.70 $35.50 $37.00 $39.90 $41.30
Couriers/Messengers* NA NA NA NA $54.60 Compensation
Air Transportation $55.80 $58.40 $62.60 $71.10 $71.40 Support Activities $42.10 $43.60 $45.50 $49.30 $51.10
Couriers/Messengers NA NA NA NA $67.90
Source: USDC BEA Payroll (wages and salaries for salaried workers) includes cash allowances and payments in kind.
Compensation includes payroll plus benefits. *Includes couriers and messengers as well as scenic and sightseeing transportation. SOURCE OF ECONOMIC CONTRIBUTION
The economic contribution of international air cargo operations comes from the jobs and procurement of the airlines and the companies providing ground services to the cargo planes such as maintenance, refueling, and catering. A large number of jobs are also associated with the sorting facilities. In addition, many pilots make Anchorage their home, and flight crews overnight in Anchorage since all international flights have a crew change when they pass through Anchorage.
STATE AND LOCAL GOVERNMENT REVENUES International carriers, but not domestic carriers or corporations providing
support activities, are exempt from the state corporate income tax. Sales of jet fuel for foreign flights are exempt from the motor-fuel tax. Real property is subject to the local property tax.
GROSS DOMESTIC PRODUCT Gross domestic product in air transportation (including passenger activity, both
domestic and international) is primarily composed of employee compensation. An estimate of the capital consumption allowance portion of gross domestic product is based on the amount of passenger and cargo traffic moving through airports in the state.
Table III.G5. Air Transportation—Gross Domestic Product (Million $) 1990 1995 2000 2001 2002 2003 2004 2005
Air Transportation $427 $412 $422 $506 $522 $502 Other Transportation and Support Activities* $430 $449 $465 $452 $490 $535
Source: USDC BEA Regional Economic Accounts Web site. * Includes couriers and messengers as well as scenic and sightseeing transportation.

Structural Analysis of the Alaska Economy __________________________________________________________ International Air Cargo
March 2010 Institute of Social and Economic Research, UAA Page 75
MEASUREMENT ISSUES International air cargo employment, wages, and other measures of activity are
not reported separately from the other components of air transportation activity—domestic cargo, international passenger, domestic passenger, and unscheduled services. Consequently, only rough approximations of the size and economic importance of this sector can be constructed using surveys and other data sources.
PRIMARY DATA SOURCES U.S. Department of Commerce, Bureau of Economic Analysis, Regional
Economic Accounts Web site. Alaska Department of Labor, Annual Employment and Earnings. Ted Stevens Anchorage International Airport, activity reports.
RECENT LITERATURE Goldsmith, Scott. Economic Significance of the Ted Stevens Anchorage
International Airport, Institute of Social and Economic Research, September 2007.
Goldsmith, Scott. Economic Significance of the Ted Stevens Anchorage International Airport, Institute of Social and Economic Research, June 2001.
Goldsmith, Scott, and Eric Larson. The Economic Contribution of the Anchorage International Airport, Institute of Social and Economic Research, October, 1995.

Structural Analysis of the Alaska Economy __________________________________________________________ International Air Cargo
March 2010 Institute of Social and Economic Research, UAA Page 76

Structural Analysis of the Alaska Economy _______________________________________________________________________ Timber
March 2010 Institute of Social and Economic Research, UAA Page 77
H. TIMBER Timber was formerly a large component of the economy of Southeast Alaska.
The federal government helped to establish a wood pulp industry in the 1950s by entering into long-term contracts to supply federal timber to pulp mills in Ketchikan and Sitka. Pulp mills processed lower-grade timber from federal lands, while sawmills provided minimal processing (required by law for federal timber) before export of better quality logs. In addition, both the regional Native corporation (Sealaska) and village Native corporations were able to harvest and export raw logs; these corporations’ ability to sell their net operating losses helped support large private timber harvests in the 1980s. An increasingly competitive world market (including new supplies of inexpensive timber from Russia and from plantations in South America) and environmental concerns (including the resulting dramatic reductions in timber supplied from the Tongass) combined to end the pulp industry in the nineties. The same pressures have also forced many of the region’s sawmills to close.
Timber is now a small sector consisting of the harvest and limited processing of timber resources in Southeast and South Central Alaska. Much of the activity is seasonal and takes place in enclaves. Ownership of Alaska’s timber resources is split between the public (Tongass and Chugach National Forests, BLM lands, and state forests) and the private sectors; private ownership is almost entirely by regional and village Native corporations.
Table III.H1. Ownership of Alaska Forests
Owner Share Federal Government 51% State Government 25% Native Corporations 24% Other Private >1%
Source: Resource Development Council Web site.
VALUE OF OUTPUT The value of timber output depends upon the harvest (measured in millions of
board feet), the type of wood, how (if at all) it is processed, and world prices. The harvest in recent years has been slightly less than 200 million board feet, compared to over 1,000 million board feet at the start of the 1990s. The harvest from both national forests and private lands has declined.
Table III.H2. Timber Harvest (Million Board Feet) 1990 1995 2000 2001 2002 2003 2004 2005 2006
TOTAL 1,033 816 398 291 191 189 172 196 160 National Forests 474 200 119 44 32 48 49 47 40 State 11 19 62 55 58 50 28 46 45 Private 548 597 217 191 185 138 120 120 74
Source: U.S. Department of Agriculture, Forest Service, Pacific Northwest Research Station; may exclude small amounts of harvest from BLM lands.

Structural Analysis of the Alaska Economy _______________________________________________________________________ Timber
March 2010 Institute of Social and Economic Research, UAA Page 78
The value of exports has in recent years ranged between $100 and $150 million. Most of the harvest is exported as raw logs, processed timber, or chips. The value of exports is a reasonable, although not exact, measure of the value of output of this sector. Some timber is consumed within the state, and in recent years some output has been sold domestically outside of Alaska. In the early 1990s, before the pulp mills closed and when harvests were much higher than they are today, the value of exports peaked at $650 million.
Table III.H3. Value of Timber Exports (Million $) 1990 1995 2000 2001 2002 2003 2004 2005 2006
TOTAL $614 $573 $197 $146 $124 $147 $100 $128 $111 Logs $336 $390 $186 $136 $118 $140 $97 $121 $108 Lumber $84 $39 $3 $1 $0 $2 $2 $3 $3 Chips $2 $20 $7 $9 $7 $5 $1 $3 $0 Pulp 192 $123 $0 $0 $3 $0 $0 $0 $0
Source: U.S. Department of Agriculture, Forest Service, Pacific Northwest Research Station.
PERSPECTIVE The two national forests in Alaska (22 million acres) are the largest among the
155 in the nation (total acreage in national forests is 188 million). The Tongass National Forest is the larger of the two at 17 million acres, or 26 thousand square miles. The Chugach National Forest is 5 million acres (8 thousand square miles). Together they represent about half of the acreage of forest land in the state. As large as it is, however, the Tongass is only about one-tenth of one percent of all the forested land in the world. Both the Pacific Northwest of North America and eastern Russia have vast forest resources. Russia contains 22% of the forested land in the world, and those forests contain over half of the world’s standing softwood. Even within the Pacific region of Canada and the United States, Alaska’s timber harvest is only a small share.
Table III.H4. Western Region Timber Harvest in 2005 Area Million Board Feet
British Columbia NA Oregon 4,355 Washington 3,316 Idaho 1,159 Montana 663 ALASKA 189 California 2
Source: U.S. Department of Agriculture, Forest Service, Pacific Northwest Research Station.
British Columbia reported a harvest of 83,136,000 cubic meters. Simple conversion to board feet is not possible without detailed information about the composition of the harvest; however, by any measure the British Columbia harvest is large compared to Alaska.

Structural Analysis of the Alaska Economy _______________________________________________________________________ Timber
March 2010 Institute of Social and Economic Research, UAA Page 79
DIRECT JOBS Annual average employment has fallen from nearly 4.5 thousand in 1990 to 1.7
thousand in 2005 as a result of declines in harvesting, the manufacture of wood products, and the closure of the two pulp mills in the 1990s. Many workers are self-employed (proprietors).
Table III.H5. Forest Products—Wage and Salary and Total Jobs (Thousand)
1990 1995 2000 2001 2002 2003 2004 2005 2006 Wage and Salary
Forestry (Harvesting) (113) 0.82 0.67 0.66 NA 0.58 Wood Products Mfg (321) 0.46 0.32 0.27 0.37 0.38 Paper Mfg (Pulp Mills) (322) 0 0 0 0 0
Total Forestry (Harvesting) 2.78 2.27 1.42 1.07 0.92 0.87 NA 0.82 Wood Products Mfg 1.04 0.75 0.7 0.76 0.6 0.58 0.77 0.85 Paper Mfg (Pulp Mills) 0.6 0.35 0.06 0 0 0 0 0
Source: USDC BEA Regional Economic Accounts Web site, wage and salary employment—Table SA27, total employment—Table SA25.
NAICS codes in parentheses; NAICS wage and salary employment not available before 2001.
DIRECT EARNINGS Total earnings in the forest-products sector, including both harvesting and
processing, were about $60 million in 2005. Wages totaled about $37 million; total compensation of wage and salary employees, $46 million; and proprietor income (earnings of the self-employed), about $16 million.
(In 2005 the U.S. Department of Commerce reported earnings of $68 million in paper manufacturing (pulp mill). This is clearly an error in the data since the two pulp mills in Alaska closed in the 1990s.)

Structural Analysis of the Alaska Economy _______________________________________________________________________ Timber
March 2010 Institute of Social and Economic Research, UAA Page 80
Table III.H6. Forest Products—Payroll, Compensation, and Earnings (Million $)
1990 1995 2000 2001 2002 2003 2004 2005 2006 Wages
Forestry (Harvesting) $34.60 $30.80 $29.50 NA $25.00 Wood Products Mfg $15.00 $10.00 $8.20 $11.60 $12.20 Paper Mfg (Pulp Mills) – – – – –
Compensation Forestry (Harvesting) $40.50 $36.70 $35.10 NA $30.10 Wood Products Mfg $18.80 $12.70 $10.60 $14.90 $15.70 Paper Mfg (Pulp Mills) – – – – –
Proprietors Income Forestry (Harvesting) $19.80 $12.20 $16.40 NA $13.40 Wood Products Mfg $0.50 $0.50 $0.70 $1.10 $1.10 Paper Mfg (Pulp Mills)* – – – – $43.80
Total Forestry and logging $135 $121 $76 $60 $49 $51 NA $43 Wood product Mfg $27 $18 $17 $19 $13 $11 $16 $17 Paper Mfg* $65 $59 $48 – – – – $68 Source: USDC BEA Regional Economic Accounts Web site. payroll—Table SA07, compensation—Table SA06,
total earnings—Table SA05 Payroll (wages and salaries for salaried workers) includes cash allowances and payments in kind. Compensation
includes payroll plus benefits. Total Earnings is compensation of wage and salary employees and income of the self-employed. *Paper Manufacturing earnings reported by the BEA is clearly an error, but we report it here to be consistent with
the source document. AVERAGE EARNINGS
Average earnings in harvesting was $43 thousand and in manufacturing $33 thousand in 2005. Average compensation was $52 thousand and $42 thousand, respectively.
Table III.H7. Forest Products—Average Annual Wage and Compensation (Thousand $)
1990 1995 2000 2001 2002 2003 2004 2005 2006 Wage and Salary
Forestry (Harvesting) $42.50 $45.90 $44.50 NA $43.30 Wood Products Mfg $32.80 $31.50 $30.10 $31.30 $32.5 Paper Mfg (Pulp Mills) – – – – –
Compensation Forestry (Harvesting) $49.80 $54.60 $52.90 NA $52.10 Wood Products Mfg $41.20 $39.90 $38.70 $40.20 $41.80 Paper Mfg (Pulp Mills) – – – – –
Source: ISER calculation. SOURCES OF ECONOMIC CONTRIBUTION
The primary way that the timber sector contributes to the economy is through the locally generated jobs and income associated with harvesting and processing (wood manufacture and, in years past, pulp production). An important component

Structural Analysis of the Alaska Economy _______________________________________________________________________ Timber
March 2010 Institute of Social and Economic Research, UAA Page 81
of this activity is the construction of access roads into forested areas. Local income—private as well as public—is also generated by the stumpage fees, which are payments to resource owners for the right to harvest timber.
STATE AND LOCAL GOVERNMENT REVENUES The state receives the proceeds of timber sales on state lands, which are less
than $1 million annually. Because of the small size of firms in this sector, state corporate income tax receipts are minimal.
Local governments adjacent to the national forests receive a share of the proceeds of timber sales from those forests. They may also receive a payment in lieu of taxes (PILT) to compensate them for the fact that public lands are not subject to local property taxes. Because federal timber sales have been modest in recent years, these revenue amounts have been small.
GROSS DOMESTIC PRODUCT There is no historical data series on the gross domestic product of the timber
sector because the official statistics combine timber harvesting with fish harvesting. The federal reporting for state product for these sectors is combined because they are small for the U.S. as a whole.
Table III.H8. Forest Products—Gross Domestic Product (Million $) 1990 1995 2000 2001 2002 2003 2004 2005 2006
Forestry NA NA NA NA NA NA Wood Products $23 $22 $13 $11 $15 $16 Paper $1 $1 NA NA NA NA
Source: USDC BEA Regional Economic Accounts Web site
MEASUREMENT ISSUES Because of the ownership pattern of the forests and large number of small
harvester and processor operations, aggregate data on the economic contribution of this sector of the economy is not available. Information on the total harvest is not reported each year for all of the public and private owners. Information on timber offered and sold on public lands is of limited usefulness because timber is often not harvested the year that it is sold.
Since most sales are for the export market, the volume and value of export sales are the best available data on the size of this sector, but they do not include either sales for the Alaska market (not part of the economic base) or exports to other states which, although not large, comprise a growing component of total sales.
The total earnings data for paper manufacturing from the U.S. Department of Commerce, Bureau of Economic Analysis is inconsistent with both their employment figures for that sector and the fact that both the Alaska pulp mills closed in the 1990s.

Structural Analysis of the Alaska Economy _______________________________________________________________________ Timber
March 2010 Institute of Social and Economic Research, UAA Page 82
PRIMARY DATA SOURCES U.S. Department of Commerce, Bureau of Economic Analysis, Regional
Economic Accounts Web site. Alaska Department of Labor, Annual Employment and Earnings. Alaska Department of Natural Resources, Division of Forestry, Annual Report. U.S. Department of Commerce, Bureau of the Census. U.S. Department of Agriculture, Forest Service, Production, Price,
Employment, and Trade in Northwest Forest Industries, annual.
RECENT LITERATURE Gilbertsen, Neal, and Dan Robinson. Natural Resources: Mining and Timber,
Alaska Department of Labor, Alaska Economic Trends, December 2003. Fay, Ginny. “Alaska Timber Harvests and Export Volumes,” for the Alaska
Conservation Alliance, May 2003. Colt, Steve, Darcy Dugan, and Ginny Fay. “The Regional Economy of
Southeast Alaska,” for Alaska Conservation Foundation, March 2007. Robertson, Guy. A Test of the Economic Base Hypothesis in the Small Forest
Communities of Southeast Alaska, USDA, Pacific Northwest Research Station, Technical Report PNW-GTR-592, December 2003.
Mazza, Rhonda. Editor. Economic Growth and Change in Southeast Alaska. USDA, Pacific Northwest Research Station, Technical Report PNW-GTR-611, July 2004.
Berman, Matthew. and Teresa Hull. Forest Products Sector Report. ISER for AIDEA and ADCED, October 1989.

Structural Analysis of the Alaska Economy _________________________________________________ Misc. Manufacturing and Services
March 2010 Institute of Social and Economic Research, UAA Page 83
I. MISCELLANEOUS MANUFACTURING AND SERVICES
Most manufacturing in Alaska consists of the processing of seafood, petroleum, and timber. Some manufacturing of food and construction products serves the local market. However, there are some small “niche” manufacturing activities that export their products outside the state. Perhaps the most important of these is Native handicrafts and artwork. Other examples would be specialty products designed for Arctic conditions, like clothing and furs. To the extent that these products are either sold to visitors to the state—purchases of the products of Alaskan artists, both Native and non-Native, by tourists could be included as part of the tourist industry or given separate treatment as is done here—or directly exported outside the state, they can be considered basic activity since they bring new money into Alaska.
Alaska businesses and individual workers also export services, and this also brings new money into the state. As Alaska firms gain experience working at home, they are sometimes able to compete successfully for work outside the state—for example, in the provision of oil field services in Sakhalin or architectural services in Hawaii. Firms that are based in Alaska and do work outside the state can generate profits from that work that flow back to Alaska as well as jobs for employees either at home or on assignment away from Alaska. The Native corporations and their subsidiaries, such as ASRC Energy Services and NANA Management Services, are good examples of firms that have grown and diversified their activities into businesses outside of Alaska. Those businesses generate benefits that flow back into the state.
Individuals will also sometimes commute outside the state in pursuit of work. During times when the local economy is soft, skilled construction workers are likely to look for work temporarily outside the state while retaining an Alaska residence.
VALUE OF OUTPUT There is no data source that tracks the value of export-based manufacturing
(excluding natural resources) or the volume of out-of-state sales by Alaska service-providing firms. A review of the list of Alaska’s largest manufacturing and service-providing firms suggests that these activities form only a small share of total activity for the manufacturing and service sectors.
The gross receipts of Alaskan artists in 1999 according to the U.S. Census were $14 million. A more recent survey-based study has estimated the income of Alaskans from the sale of art to be $20 million (McDowell Group).
PERSPECTIVE The headquarters of the largest (2,500 employees) U.S. firms operating
worldwide tend to be concentrated in the largest metropolitan areas. New York leads the nation with 239, followed by Chicago with 109, and San Francisco with 91. Closer to Anchorage, Seattle has 19 and Portland has 13. Although there are none in Alaska, several smaller firms—Native corporations and their subsidiaries—

Structural Analysis of the Alaska Economy _________________________________________________ Misc. Manufacturing and Services
March 2010 Institute of Social and Economic Research, UAA Page 84
are taking on some of the characteristics of these firms. Two Native corporations reported more than $1 billion in annual revenues in 2007.
Headquarters employ a sizable and highly skilled white-collar work force and generate local demand for numerous specialized business services such as accounting and legal. In addition, headquarters often play a major role in corporate giving as well as what are generally referred to as corporate citizen activities. It is not unusual to find the landscape of a town has been defined by the presence of one or more corporate headquarters.
DIRECT JOBS Only a small number of manufacturing jobs (apparel) can be easily identified as
potentially serving a market extending beyond the state. Of total manufacturing jobs in 2005, both durable and nondurable goods, apparel accounted for only 1 percent.
Table III.I1. Manufacturing—Wage and Salary and Total Jobs (Thousand)
1990 1995 2000 2001 2002 2003 2004 2005 Wage and Salary
Durable Goods NA NA 1.8 1.9 2 Nondurable Goods NA NA 9.9 10.5 10.7
Food (311) 9.3 8 8.5 9.1 9.3 Apparel (315) NA NA NA 0.01 0.01
Total Jobs Durable Goods 3.2 2.9 2.9 NA NA 2.9 3.2 3.4 Nondurable Goods 12.4 13.7 10.8 NA NA 10.5 11.2 11.4
Food 10.2 11.3 8.9 9.5 8.2 8.7 9.3 9.5 Apparel NA NA NA NA NA 0.1 0.2 0.2
Source: USDC BEA Regional Economic Accounts Web site, wage and salary employment—Table SA27, total employment—Table SA25.
NAICS codes in parentheses.
No information is available about service-related jobs dependent upon sales outside the state.
DIRECT EARNINGS Without employment estimates information on payroll cannot be constructed.
AVERAGE EARNINGS NA
SOURCES OF ECONOMIC CONTRIBUTION New money flows into Alaska through the wages of Alaska workers engaged in
these activities as well as from the profits earned by the Alaska firms employing them.

Structural Analysis of the Alaska Economy _________________________________________________ Misc. Manufacturing and Services
March 2010 Institute of Social and Economic Research, UAA Page 85
STATE AND LOCAL GOVERNMENT REVENUES Domestic corporations allocate their income for corporate tax purposes across
states based on sales, payroll, and property. A firm with sales outside the state but headquartered within Alaska would consequently allocate a portion of its profit to Alaska and have a corporate tax liability within the state.
GROSS DOMESTIC PRODUCT Gross domestic product cannot be estimated.
MEASUREMENT ISSUES The monetary importance of miscellaneous manufacturing exports is small,
although it would be useful to have a better understanding of its composition and potential.
The importance of service exports has been growing. Documenting and tracking this activity could be done but would require surveys or the use of information from federal tax returns.
PRIMARY DATA SOURCES U.S. Department of Commerce, Bureau of Economic Analysis, Regional
Economic Accounts Web site. Alaska Department of Labor, Annual Employment and Earnings.
RECENT LITERATURE McDowell Group. Economics of Alaska’s Arts Industry, prepared for the
Alaska State Council for the Arts, November 2002. Gilbertsen, Neal. Manufacturing, Alaska Department of Labor, Alaska
Economic Trends, January 2002. Klier, Thomas, and William Testa. “Location Trends of Large Company
Headquarters during the 1990s,” Economic Perspectives, 2002.

Structural Analysis of the Alaska Economy _________________________________________________ Misc. Manufacturing and Services
March 2010 Institute of Social and Economic Research, UAA Page 86

Structural Analysis of the Alaska Economy ____________________________________________________________________ Agriculture
March 2010 Institute of Social and Economic Research, UAA Page 87
J. AGRICULTURE
The modest amount of agricultural production in Alaska is primarily for the local market rather than for export outside the state and, consequently, it is not truly one of our basic industries. However, we include it here because of recent attempts to develop the industry as an export base for the economy.
VALUE OF OUTPUT The total cash receipts of the agriculture sector average about $50 million per
year, with the two largest contributors being aquaculture (nonprofit hatcheries) and greenhouses/nurseries, which together account for about 60 percent of the total. (This data include reindeer herding, but not trapping which, if included, would increase the total only marginally.)The gross value added measured by the U.S. Department of Agriculture is between $30 and $35 million.
Table III.J1. Value of Agricultural Sector—Cash Receipts (Million $) Calendar Year 1990 1995 2000 2001 2002 2003 2004 2005
TOTAL $53.0 $51.9 $50.2 $50.6 $50.9 $48.8 Aquaculture 26.5 22.6 20.0 20.6 18.6 $16.9 Greenhouse/Nursery 13.8 14.0 14.2 14.3 14.6 $14.6
Sources: Alaska Agricultural Statistics, annual; U.S. Department of Agriculture.
PERSPECTIVE In 2002 there were 2.158 million farms in the United States, with 941 million
acres of farmland. In 2005 Alaska had 640 farms and 900 thousand acres of farmland. In 2001 farm income in Alaska was $50 million compared to $203 billion for the nation.
DIRECT JOBS About one thousand jobs are reported in this industry, with a large share being
proprietors (self-employed).
Table III.J2. Agriculture—Wage and Salary and Total Jobs (Thousand) 1990 1995 2000 2001 2002 2003 2004 2005
Wage and Salary (111,112) 0.6 0.5 0.6 0.6 0.6 0.6 0.6 0.6
Total, including Proprietors 0.8 0.7 0.8 0.9 1.0 0.9 1.0 1.0
Source: USDC BEA Regional Economic Accounts Web site, wage and salary employment—Table SA27, total employment—Table SA25.
NAICS codes in parentheses.

Structural Analysis of the Alaska Economy ____________________________________________________________________ Agriculture
March 2010 Institute of Social and Economic Research, UAA Page 88
DIRECT EARNINGS Total farm earnings, mostly wages and salaries, was about $13 million in 2005.
(This excludes the return to capital of the farm owners.) The sharp drop in proprietor income in recent years has no obvious explanation and may be a measurement error.
Table III.J3. Agriculture—Payroll, Compensation, and Earnings (Million $) 1990 1995 2000 2001 2002 2003 2004 2005 2006
Farm Wages $7.00 $8.70 $8.70 $10.00 $10.30 $10.50 Farm Compensation $8.60 $10.50 $10.70 $11.80 $12.10 $12.50 Farm Proprietors’ Income $3.90 $7.90 $8.10 $7.80 $6.10 $4.10 $3.40 $1.20 $0.60 Farm Earnings $7.60 $13.00 $14.90 $16.40 $16.70 $14.80 $15.20 $13.30 $13.00
Source: USDC BEA Regional Economic Accounts Web site, payroll—Table SA07, compensation—Table SA06, total earnings—Table SA05.
Payroll (wages and salaries for salaried workers) includes cash allowances and payments in kind. Compensation includes payroll plus benefits.
Total Earnings is compensation of wage and salary employees and income of the self-employed. AVERAGE EARNINGS
Average wages were about $30 thousand in 2005; and total compensation, $35 thousand.
Table III.J4. Agriculture—Average Annual Wage and Compensation (Thousand $)
1990 1995 2000 2001 2002 2003 2004 2005 Wage and Salary $24.60 $24.20 $24.40 $27.90 $29.60 Compensation $29.80 $29.30 $29.80 $32.90 $34.90 Proprietors $13.30 $10.20 $7.00 $5.80 $1.90
Source: ISER Calculation. SOURCES OF ECONOMIC CONTRIBUTION
Since most of the sales of the agriculture sector are into the local market rather than for export, we cannot classify agriculture as a basic industry. Its sales do not bring new money into the economy.
STATE AND LOCAL GOVERNMENT REVENUES Farm property, primarily in the Fairbanks and Matanuska-Susitna Boroughs, is
not assessed at less than full and true value. The value of farm property was reported to be $47 million in 2005 which was .1 percent of the total assessed value of property in the state, excluding oil and gas facilities.

Structural Analysis of the Alaska Economy ____________________________________________________________________ Agriculture
March 2010 Institute of Social and Economic Research, UAA Page 89
GROSS DOMESTIC PRODUCT Gross domestic product is the difference between the value of cash sales and
purchases from other sectors. It has historically been in the range of $20 million to $30 million annually and consists primarily of wages and other earnings of workers.
Table III.J5. Agriculture—Gross Domestic Product (Million $) 1990 1995 2000 2001 2002 2003 2004 2005
Farm GDP $28 $26 $27 $25 $27 $22
Source: USDC BEA Regional Economic Accounts Web site. MEASUREMENT ISSUES
Sales for export are not reported by the Department of Agriculture, so it is not possible to identify what share of activity in this sector might be considered basic activity.
PRIMARY DATA SOURCES U.S. Department of Commerce, Bureau of Economic Analysis, Regional
Economic Accounts Web site. Alaska Department of Labor, Annual Employment and Earnings. U.S. Department of Agriculture, Alaska Agricultural Statistics, annual.
RECENT LITERATURE Wolfe, Robert, Trapping in Alaska Communities With Mixed, Subsistence-
Cash Economies, Alaska Department of Fish and Game, Technical Paper # 217, 1991.

Structural Analysis of the Alaska Economy ____________________________________________________________________ Agriculture
March 2010 Institute of Social and Economic Research, UAA Page 90

Structural Analysis of the Alaska Economy ____________________________________________________________ Federal Nondefense
March 2010 Institute of Social and Economic Research, UAA Page 91
K. FEDERAL NONDEFENSE Nondefense federal spending in Alaska can be divided into three main
categories. The first is the direct operations of federal government agencies like the Departments of Interior, the Postal Service, and Transportation. The personnel expenditures and procurement of goods and services by these agencies are an important source of economic activity in the state.
Table III.K1. Nondefense Federal Employment in Alaska by Department, 2000 Number Share
TOTAL 10,396 Interior 2,325 22% Postal Service 2,185 21% Transportation (FAA) 1,615 16% Agriculture (Forest Service) 1,139 11% Health and Human Services (HHS) 957 9% Commerce 961 9% Veterans’ Administration 440 4% Treasury 234 2% Justice 215 2% U.S. Courts 140 1% All Other 185 2%
Source: Alaska Economic Trends, February 2002. Excludes the Department of Defense civilian employees.
The second consists of the direct payments (transfers) to individuals and private and public entities. The most important programs in terms of dollar amounts are Social Security, federal-civilian retirement and health-related programs like Medicare.
Table III.K2. Nondefense Federal Transfers in Alaska, 2004
Amount (Million $) Share
TOTAL $1,625 Retirement / Disability Payments to Individuals $960.3 59%
Social Security $662.9 41% Civilian Retirement $153.2 9% Veterans Disability Compensation $99.2 6% Other $45.0 3%
Direct Payments to Individuals $515.6 32% Medicare $232.0 14% Unemployment Compensation $142.3 9% Food Stamps $64.4 4% Excess Earned Income Tax Credits $50.7 3% Other $26.2 2%
Direct Payments to Others $149.5 9% Tribal Self Governance $70.3 4% Temporary State Fiscal Relief Fund $25.0 2% Other $54.2 3%
Source: USDC, Consolidated Federal Funds Report, 2004.

Structural Analysis of the Alaska Economy ____________________________________________________________ Federal Nondefense
March 2010 Institute of Social and Economic Research, UAA Page 92
The third component consists of capital and operating grants to state and local governments as well as to nonprofits, including the Alaska Native nonprofit corporations. The largest are the federal share of Medicaid, transportation funding for state infrastructure, and health-care programs for the Alaska Native community. The range of grants, however, is quite broad in terms of both categories and geography.
Table III.K3. Nondefense Federal Grants to Alaska, 2004
Amount (Million $) Share
TOTAL $3,146 Medicaid $653.8 21% Highway Planning and Construction $486.3 15% Indian Health Services Management $329.8 10% Airport Improvement Program $222.0 7% Education Impact Aid $124.8 4% Indian Housing Block Grants $ 90.5 3% Temporary Assistance for Needy Families $ 68.9 2% Special Purpose Grants (EPA) $ 45.1 1% Water and Sewer for Rural Communities $ 36.1 1% Housing Vouchers (Section 8) $ 35.6 1% Alaska Native Education $ 33.0 1% Head Start $ 30.8 1% Special Education Grants $ 30.4 1% Other (less than $30 million each) $958.9 30%
Source: USDC, Consolidated Federal Funds Report, 2004.
Of course, the federal government influences the economy in many other ways through regulations, tax policy, bypass mail, etc., including about $1.5 billion in 2004 in direct loans, guaranteed and insured loans (mortgage insurance), and insurance (flood insurance).
We include retirement payments to former federal employees with other retirement income rather than here with other federal spending.
VALUE OF OUTPUT Nondefense federal spending in Alaska in 2004 was $5.92 billion. This was
70% of total federal spending in the state.

Structural Analysis of the Alaska Economy ____________________________________________________________ Federal Nondefense
March 2010 Institute of Social and Economic Research, UAA Page 93
Table III.K4. Nondefense Federal Expenditures in Alaska (Billion $) 1995 2000 2001 2002 2003 2004
Total $2,804 $4,252 $4,639 $5,587 $5,636 $5,924 Agency Operations $682 $888 $908 $1,082 $1,139 $1,152 Wages $528 $615 $612 $648 $696 $714 Procurement $154 $273 $296 $434 $443 $438 Transfers $910 $1,129 $1,366 $1,414 $1,495 $1,626 Grants $1,211 $2,234 $2,364 $3,089 $3,001 $3,146
Item: Total Federal Spending $4,230 $5,964 $6,417 $7,562 $7,944 $8,445 Department of Defense Share of Total 34% 29% 28% 26% 29% 30%
Source: USDC Consolidated Federal Funds Report.
PERSPECTIVE Federal spending in Alaska, excluding the Department of Defense, was $9,038
per capita in 2004, compared to a national average of $6,075. Only Maryland at $9,163 and New Mexico at $9,139 were ranked higher than Alaska. (Utah was lowest at $4,334.)
Table III.K5. Per Capita Federal Expenditures
1995 2000 2001 2002 2003 2004 Civilian
Alaska $6,766 $7,377 $8,677 $8,687 $9,038 U.S. Average $4,905 $5,365 $5,686 $5,880 $6,075 Alaska Rank 4 4 2 2 3
Military Alaska $2,731 $2,837 $3,068 $3,556 $3,847 U.S. Average $835 $903 $964 $1,030 $1,148 Alaska Rank 3 3 3 3 2
Source: USDC Consolidated Federal Funds Report.
Alaska’s high rank is attributable to the large number of federal grants we receive. In terms of per-capita grants, Alaska ranked number one among the states in 2004. However, Alaska was ranked 49 in retirement and disability payments (including military retirement) and 48 in other direct payments—largely because of our young population. In spite of the concentration of government spending in Alaska, the state receives only .3% of federal spending (excluding the Department of Defense budget).

Structural Analysis of the Alaska Economy ____________________________________________________________ Federal Nondefense
March 2010 Institute of Social and Economic Research, UAA Page 94
Table III.K6. Per Capita Federal Expenditures (Military and Civilian) 1995 2000 2001 2002 2003 2004
TOTAL Alaska $9,496 $10,220 $11,746 $12,244 $12,885 U.S. Average $5,740 $6,267 $6,527 $6,910 $7,223 Alaska Rank 1 1 1 1 1
Grants Alaska $3,468 $3,690 $4,857 $4,658 $4,908 U.S. Average $1,082 $1,189 $1,410 $1,496 $1,545 Alaska Rank 1 1 1 1 1
Agency Operations Alaska $3,920 $4,058 $4,496 $5,082 $5,230 U.S. Average $1,430 $1,536 $1,557 $1,724 $1,839 Alaska Rank (Wages / Procurement) 2 / 4 1 / 4 1 / 4 1 / 4 1 / 5
Retirement/Disability Alaska $1,347 $1,492 $1,523 $1,604 $1,732 U.S. Average $1,948 $2,112 $2,106 $2,168 $2,250 Alaska Rank 50 50 50 50 49
Source: USDC Consolidated Federal Funds Report.
DIRECT JOBS There were 17 thousand federal civilian jobs in Alaska in 2005. About seven
thousand were in the Department of Defense with 10 thousand in other federal departments.
Table III.K7. Federal Civilian—Wage and Salary and Total Jobs (Thousand)
1990 1995 2000 2001 2002 2003 2004 2005 2006 Employees 18.62 17.42 17.02 16.37 16.32 17.15 17.22 17.02
Source: USDC BEA Regional Economic Accounts Web site, wage and salary employment—Table SA27, total employment—Table SA25.
NAICS codes in parentheses. DIRECT EARNINGS
The federal civilian payroll was $1 billion in 2005. Including benefits, total compensation was $1.53 billion.
Table III.K8.Federal Civilian—Payroll, Compensation, and Earnings (Million $)
1990 1995 2000 2001 2002 2003 2004 2005 2006 Payroll $828 $867 $932 $996 $1,020 $1,037 Compensation $873 $1,039 $1,221 $1,239 $1,295 $1,368 $1,494 $1,529 $1,551
Source: USDC BEA Regional Economic Accounts Web site. payroll—Table SA07, compensation—Table SA06, total earnings—Table SA05
Payroll (wages and salaries for salaried workers) includes cash allowances and payments in kind. Compensation includes payroll plus benefits.
Total Earnings is compensation of wage and salary employees and income of the self-employed.

Structural Analysis of the Alaska Economy ____________________________________________________________ Federal Nondefense
March 2010 Institute of Social and Economic Research, UAA Page 95
AVERAGE EARNINGS The average annual wage among federal civilian employees was $60
thousand. Including benefits, average compensation was $90 thousand. Table III.K9. Federal Civilian—Average Annual Wage
and Compensation (Thousand $) 1990 1995 2000 2001 2002 2003 2004 2005 2006
Payroll $50.6 $53.1 $54.4 $57.8 $59.9 Compensation $75.7 $79.4 $79.8 $86.8 $89.9
Source: ISER Calculation.
SOURCES OF ECONOMIC CONTRIBUTION Federal spending is felt in the state economy in a number of ways. The first is
through the wages and procurement spending (both for operations and investment in new facilities) of federal agencies. Grants account for most of the state capital budget and for important shares of some state agency operating budgets like the Departments of Health and Social Services and Labor. Grants are also important for the operation of Alaska Native nonprofit health and housing programs. Finally, transfers to individuals (and other entities) are a source of income and purchasing power.
STATE AND LOCAL GOVERNMENT REVENUES The federal government makes an annual payment in lieu of taxes (PILT) to
local governments adjacent to federal property managed by the U.S. Forest Service, Fish and Wildlife Service, National Park Service, and the Bureau of Land Management. In 2007 the PILT was about $16 million. The federal government also gives impact aid to state and local school districts impacted by federal property.
GROSS DOMESTIC PRODUCT Federal civilian gross domestic product consists primarily of employee
compensation (wages and salaries, employer contributions for employee pension and insurance funds, and employer contributions for government social insurance) with smaller amounts for the estimated consumption of fixed capital stock (a measure of the value of current services of fixed assets) and the surplus (deficit) of certain public enterprises like the U.S. Postal Service. As such, it does not capture several important activities of the federal government that directly contribute to the economy, including procurement expenditures, transfers to individuals, and grants to governments and nonprofit organizations. In 2005 federal civilian GDP was $1.640 billion.
Table III.K.10. Federal Civilian—Gross Domestic Product (Million $) 1990 1995 2000 2001 2002 2003 2004 2005 2006
Total GDP $1,320 $1,343 $1,405 $1,494 $1,614 $1,640
Source: USDC BEA Regional Economic Accounts Web site.

Structural Analysis of the Alaska Economy ____________________________________________________________ Federal Nondefense
March 2010 Institute of Social and Economic Research, UAA Page 96
MEASUREMENT ISSUES It is difficult to determine what share of federal expenditures should be
attributed to retirees.
PRIMARY DATA SOURCES U.S. Department of Commerce, Bureau of Economic Analysis, Regional
Economic Accounts Web site. Alaska Department of Labor, Annual Employment and Earnings. U.S. Department of Commerce, Consolidated Federal Funds Report.
RECENT LITERATURE Goldsmith, Scott, and Eric Larson. What Does $7.6 Billion Federal Money
Mean for Alaska? Institute of Social and Economic Research, UA Research Summary No. 2, November 2003.
Goldsmith, Scott, and Larson, Eric, Federal Spending and Revenues in Alaska, Institute of Social and Economic Research, November 2003.
Fried, Neal, and Brigitta Windisch-Cole. The Federal Government in Alaska, Alaska Department of Labor, Alaska Economic Trends, February 2002.
Goldsmith, Scott, and Mary Killorin. Institute of Social and Economic Research, Alaska’s Construction Spending, annual.
Boucher, John, and Kristen Tromble. Federal Agencies Prominent Despite Downturn, Alaska Department of Labor, Alaska Economic Trends, September 1996.
Boucher, John. Federal Government: The Largest Alaskan Employer, Alaska Department of Labor, Alaska Economic Trends, February 1994.
Goldsmith, Scott. Institute of Social and Economic Research. Federal Spending in Alaska: A Vulnerability Analysis, 2008.

Structural Analysis of the Alaska Economy _______________________________________________________________National Defense
March 2010 Institute of Social and Economic Research, UAA Page 97
L. NATIONAL DEFENSE
There are large army and air force bases located in Anchorage (Fort Richardson and Elmendorf Air Force Base) and Fairbanks (Fort Wainwright and Eielson Air Force Base) and coast guard bases in Kodiak and Ketchikan. Smaller numbers of active-duty military personnel are stationed in other locations around the state. Components of the new missile defense system have been deployed to a number of sites, including Fort Greely in Southeast Fairbanks. A large number of civilian Department of Defense employees support the military mission in the state. The reserve, including the national guard, also has an important presence in the state. Finally, Alaska bases also host training operations that bring military personnel into the state on a temporary basis. The Department of Defense, like other departments of the federal government, employs many private firms and many private-sector workers can be found employed at military installations.
Alaska has one of the highest concentrations of veterans of any state. Services to veterans are administered by the Department of Veterans Affairs, and their effect on the economy is included with other civilian departments of the federal government. Retiree payments to former Department of Defense employees are included with other retiree income rather than here.
VALUE OF OUTPUT A proxy for the value of output of the military sector is the $2.52 billion of
federal expenditures in 2004 (excluding the coast guard which is now in the Department of Homeland Security.) This represented 30 percent of total federal spending in Alaska. Procurement for both operations and capital construction was the largest component of federal military spending in Alaska in 2004 at $1.26 billion, about half the total. Most of the remainder went to wages and salaries, with smaller amounts allocated to military retirement pay and grants (to the National Guard and others).
Table III.L1. Department of Defense Expenditures in Alaska (Billion $)
1995 2000 2001 2002 2003 2004 Total $1,426 $1,712 $1,778 $1,975 $2,307 $2,522
Wages $759 $734 $801 $850 $920 $1,014 Procurement (Capital and Operations) $554 $844 $834 $961 $1,237 $1,262 Military Retirement $99 $117 $124 $127 $130 $175 Grants $14 $17 $19 $38 $21 $71
Item: Total Federal Spending $4,230 $5,964 $6,417 $7,562 $7,944 $8,445 Dept. of Defense share of Total 34% 29% 28% 26% 29% 30%
Source: USDC Consolidated Federal Funds Report.

Structural Analysis of the Alaska Economy _______________________________________________________________National Defense
March 2010 Institute of Social and Economic Research, UAA Page 98
PERSPECTIVE Department of Defense spending in Alaska was $3,847 per capita (military
included) in 2004, compared to $1,148 for the nation as a whole. This placed Alaska number two among the states in the importance of Department of Defense expenditures, behind only Virginia (and Washington D.C.). Per-capita spending in Hawaii is almost as high as in Alaska. In spite of the concentration of military spending in Alaska, the state receives less than 1% of the entire Department of Defense budget.
DIRECT JOBS The USDC BEA reported 24.16 thousand active-duty military in Alaska in 2005
(including coast guard). This represents the average annual number of active-duty military plus members of the reserves assigned to Alaska bases (although they may be deployed elsewhere). It excludes civilian Department of Defense employees, civilian private-sector workers on military bases, and all other workers employed by private firms involved in military procurement.
Table III.L2. Active Duty Military—Wage and Salary and Total Jobs
(Thousand) 1990 1995 2000 2001 2002 2003 2004 2005 2006
Number 30.12 24.86 22.39 22.40 22.86 22.74 23.76 24.16
Source: USDC BEA Regional Economic Accounts Web site, wage and salary employment—Table SA27, total employment—Table SA25.
NAICS codes in parentheses.
The Alaska Department of Labor reported 20.17 thousand military in 2004. This figure excluded reserves.
DIRECT EARNINGS The total payroll (including allowances and in-kind payments) of active duty
military (including coast guard and reserves) was $1.157 billion in 2006. When health insurance and retirement contributions are added (not included in payroll), total compensation was $1.92 billion.
Table III.L4. Active Duty Military—Payroll, Compensation, and Earnings
(Million $) 1990 1995 2000 2001 2002 2003 2004 2005 2006
Payroll $717 $843 $891 $969 $1,059 $1,157 Compensation $981 $950 $1,046 $1,108 $1,307 $1,417 $1,578 $1,747 $1,920
Source: USDC BEA Regional Economic Accounts Web site, payroll—Table SA07, compensation—Table SA06, total earnings—Table SA05.
Payroll (wages and salaries for salaried workers) includes cash allowances and payments in kind. Compensation includes payroll plus benefits.
Total Earnings is compensation of wage and salary employees and income of the self-employed.

Structural Analysis of the Alaska Economy _______________________________________________________________National Defense
March 2010 Institute of Social and Economic Research, UAA Page 99
AVERAGE EARNINGS Average payroll in 2005 was $43.8 thousand—including benefits, average
compensation was $72.3 thousand. Table III.L5. Active Duty Military—Average Annual Wage and Compensation
(Thousand $) 1990 1995 2000 2001 2002 2003 2004 2005 2006
Payroll $32.0 $36.9 $39.2 $40.8 $43.8 Average Annual Compensation $32.6 $38.2 $46.7 $49.5 $52.7 $59.0 $66.4 $72.3
Source: ISER Calculation. SOURCES OF ECONOMIC CONTRIBUTION
The military presence is felt in the state primarily through the military payroll and procurement spending. The best, single indicator of this is total dollars spent.
STATE AND LOCAL GOVERNMENT REVENUES The federal government provides educational impact aid to state and local
school districts affected by federal property, including military bases.
GROSS DOMESTIC PRODUCT Public sector gross domestic product is measured as employee compensation
augmented by an estimate of the decline in the value of the fixed capital stock of military equipment. (It is the capital consumption allowance which is a measure of the value of current services of fixed military assets.) In 2005 federal military GDP in Alaska was $1.924 billion.
Table III.L6. Military—Gross Domestic Product (Million $)
1990 1995 2000 2001 2002 2003 2004 2005 2006 GDP $1,196 $1,274 $1,457 $1,567 $1,742 $1,924
Source: USDC BEA Regional Economic Accounts Web site. MEASUREMENT ISSUES
Different agencies and reports use different definitions of the military. Activities of the coast guard (now in the Department of Homeland Security), the reserves, civilian Department of Defense, and Department of Veterans’ Affairs may or may not be included.
PRIMARY DATA SOURCES U.S. Department of Commerce, Bureau of Economic Analysis, Regional
Economic Accounts Web site. Alaska Department of Labor, Annual Employment and Earnings.

Structural Analysis of the Alaska Economy _______________________________________________________________National Defense
March 2010 Institute of Social and Economic Research, UAA Page 100
Alaska Department of Labor, Alaska Population Overview. U.S. Department of Commerce, Consolidated Federal Funds Report.
RECENT LITERATURE Goldsmith, Scott, and Eric Larson. What Does $7.6 Billion Federal Money
Mean for Alaska? Institute of Social and Economic Research, UA Research Summary No. 2, November 2003.
Goldsmith, Scott, and Eric Larson. Federal Spending and Revenues in Alaska, ISER, November 2003.
Windisch-Cole, Brigitta. Base Realignment and Closure, Alaska Department of Labor, Alaska Economic Trends, August 2005.
Fried, Neal, and Brigitta Windisch-Cole. The Military is Big Business in Anchorage, Alaska Department of Labor, Alaska Economic Trends, June 2006.
Fried, Neal. Defense: Still One of Alaska’s Biggest Exports, Alaska Department of Labor, Alaska Economic Trends, September 1996.
Fried, Neal, and Brigitta Windisch-Cole. The Federal Government in Alaska, Alaska Department of Labor, Alaska Economic Trends, February 2002.
Goldsmith, Scott, and Mary Killorin. Institute of Social and Economic Research, Alaska’s Construction Spending, annual.

Structural Analysis of the Alaska Economy ______________________________________________________________________Retirees
March 2010 Institute of Social and Economic Research, UAA Page 101
M. RETIREES
Since retirees can choose to live in any state, those who reside in Alaska represent one of our basic industries. The retiree cash flow comes primarily from retirement income and third-party health-care spending, with a small amount contributed from non-health-related federal funds targeting seniors.
VALUE OF OUTPUT In 2004, 52 thousand retired Alaska seniors, aged 60+, directly contributed
$1.461 billion to the Alaska economy by their presence. The cash flow was equal to about $28 thousand for the average retired senior.
Table III.M1. Cash Flow to Alaska in 2004 from Retired Seniors 60+
Million $ Per Capita Total $1,461 $28,167 Retirement Income $1,139 $21,947 Health Care $302 $5,821 Other $21 $400
Source: ISER Calculation.
The majority of this contribution, more than $1.1 billion, was composed of retirement income from Social Security, public retirement accounts, private pensions, and income from accumulated assets. Some personal income from Social Security, retirement accounts, pensions, and other assets is paid to people under the age of 60, and some goes to people older than 60 who are not retired. We include here only the share of income from these sources paid to Alaskans aged 60+ who are retired.
Table III.M2. Cash Flow to Alaska in 2004 from Senior Retirement Income (Million $)
60+ Retirees
60+ Total
Total Paid to Alaskans
TOTAL $1,138 $1,344 $1,803 FEDERAL $589 $683 $915
Social Security $392 $461 $461 Federal Civilian Retirement $95 $112 $172 Federal Military Retirement $48 $57 $174 Veteran Compensation $54 $54 $108
STATE-LOCAL $265 $311 $489 Public Employee Retirement System (PERS) $148 $174 $287 Teachers’ Retirement System (TRS) $113 $133 $197 Other Retirement $4 $5 $5
PRIVATE $285 $350 $400 Pensions $135 $150 $200 Investment Income $150 $200 $200
Source: ISER.

Structural Analysis of the Alaska Economy ______________________________________________________________________Retirees
March 2010 Institute of Social and Economic Research, UAA Page 102
The other large component of money flowing into Alaska due to the presence of the retired senior population is health-care spending for seniors from both public and private sources. This totaled $302 million, an average of $5,821 for each retired senior. Federal Medicare and Medicaid payments together accounted for about 75% of health-related dollars (including long-term care). The rest was insurance payments associated with private and public retirement programs. The total of $302 million is less than the total amount of spending on health care for these seniors. It excludes self-paid health insurance, out-of-pocket expenditures by retired seniors for health care, and state government spending on senior health care (the state shares in the cost of the Medicaid program).
Table III.M3. Cash Flow to Alaska in 2004 from Spending for Senior Health Care (Million $)
TOTAL $302 Medicare $167 Federal Share of Medicaid $71
Nursing Homes $26 Waivers $13 Personal Care $19 Dual Eligibles $12
State Public Employee $33 Federal Public Employee $12 Private Retirement Plan Insurance $19
Source: ISER.
In addition to retirement income and health-care spending, small amounts of cash flow into the state from federal programs for low-income Alaskans, including some seniors. These totaled about $21 million in 2004. There are also a number of federal grant programs that target seniors, but the dollar amount of these grants is not directly related to the size of the senior retiree population. One cannot assume that the flow of dollars into the economy from these grant programs would increase if the senior retiree population were to grow.
Table III.M4. Cash Flow to Alaska from Other Federal Programs Benefiting Seniors, 2004 (Million $)
Federal Programs for Low-Income Seniors $21 Social Security (SSI) $16 Food Stamps $5
Source: ISER.
A large share of the income associated with retirees comes from the federal government. We avoid double counting these dollars by excluding them from the determination of the importance of federal spending in Alaska in the previous section.

Structural Analysis of the Alaska Economy ______________________________________________________________________Retirees
March 2010 Institute of Social and Economic Research, UAA Page 103
PERSPECTIVE Data on the number of retirees in the state is unavailable, but the senior
population aged 65+ can serve as an estimate. Only 6.6 percent of Alaskans are aged 65+, the smallest percentage of any state. However it ranks near the top in the growth rate of its 65+ population—currently about 4 percent annually. Even though their numbers are small, 13 percent of Alaska households contain one or more senior according to the 2005 American Community Survey (ACS)
Seventeen percent of Alaska households (equal to the U.S. average) receive retirement income according to the ACS of the U.S. Department of Commerce, Bureau of the Census, 2005, although the recipients may still be working.
Alaska seniors are relatively well off financially. In 2005, according to the ACS, only 7 percent were below the poverty threshold—the second lowest percentage in the United States.
DIRECT JOBS Like tourism, the retiree sector generates jobs when retirees spend their
income locally (including health-care spending made by others on their behalf). Since this spending is for the full range of consumer goods and services that all Alaskans purchase, the jobs attributable to retiree spending fall mostly in the trade and service industries. There are no industries specifically identified as retiree industries.
In general, it is not possible to associate particular jobs with retiree spending. For example, retiree spending may account for 10 percent of the revenue of a particular department store and 10 percent of the jobs at that store. However, it is not possible to identify which specific jobs at the store depend on retiree spending.
DIRECT EARNINGS Like jobs, we cannot directly estimate the payroll in various sectors of the
economy that is generated by retiree spending.
AVERAGE EARNINGS NA
SOURCES OF ECONOMIC CONTRIBUTION Like tourism, the retiree sector generates jobs when retirees spend their
income locally (including health-care spending made by others on their behalf).
STATE AND LOCAL REVENUES There are no state taxes or fees that specifically target the retiree population.
Based on the average for all adults, the average retiree pays about $400 annually in taxes and fees to the state general fund for a total of about $21 million for the entire retiree population. Some communities provide tax breaks for seniors, but not specifically for retirees.

Structural Analysis of the Alaska Economy ______________________________________________________________________Retirees
March 2010 Institute of Social and Economic Research, UAA Page 104
GROSS DOMESTIC PRODUCT The gross domestic product attributable to retirees consists of a fraction of the
gross product of the various industries providing goods and services to Alaska households.
MEASUREMENT ISSUES There is no data source reporting the number of retirees, their income from
various sources, the third-party health care payments made on their behalf, or non-health-care-related federal expenditures targeting seniors.
Data from the U.S. Census and the American Community Survey must be used to estimate the number of retirees.
Data from those sources can provide some information on the income of retirees, but more specific data from administrative records such as federal retirement payments and state PERS and TRS payments are potentially more accurate. The difficulty with these administrative records is determining the age and work status of recipients. For example, not all PERS and TRS payments go to residents who are not working. Information on private pensions as well as the financial assets of retirees (stocks and bonds, etc.) are also not generally available.
Data on public and private health-care expenditures made on behalf of retirees is also unavailable and must be estimated from administrative records. Medicare spending is available but the share going to retirees must be estimated.
Personal income data from the BEA is defined on an accrual basis. That means that personal income includes the contributions workers make to pension and retirement accounts while they are working. The earnings of those deposits also appear in the personal income accounts when they accrue. When the deposits and earnings are later withdrawn after retirement, spent, and affect the economy, they do not appear again in the personal income accounts.
PRIMARY DATA SOURCES U.S. Department of Commerce, U.S. Census and American Community
Survey. U.S. Department of Commerce, Consolidated Federal Funds Report. Alaska Department of Administration, PERS TRS, Actuarial Valuation. U.S. Department of Defense, Statistical Report on the Military Retirement
System, Office of the Actuary. Alaska Department of Health and Social Services, Budget Information.
RECENT LITERATURE McDowell Group, Issues Affecting the Economic Wellbeing of Alaska Seniors,
prepared for the Alaska Commission on Aging, December 2000.

Structural Analysis of the Alaska Economy ______________________________________________________________________Retirees
March 2010 Institute of Social and Economic Research, UAA Page 105
Goldsmith, Scott, and Jane Angvik. Issues Affecting the Economic Wellbeing of Alaska Seniors: 2005, Institute of Social and Economic Research, unpublished document, March 2006.
Goldsmith, Scott, and Jane Angvik. $1.5 Billion a Year and Growing: Economic Contribution of Older Alaskans, Institute of Social and Economic Research, UA Research Summary No. 7, September 2006.
Goldsmith, Scott. Economic Importance of Alaska Labor Union Pension Funds, for Alaska AFL-CIO, June 2006.
“Seniors in Alaska,” Alaska Economic Trends, December 2001.

Structural Analysis of the Alaska Economy ______________________________________________________________________Retirees
March 2010 Institute of Social and Economic Research, UAA Page 106

Structural Analysis of the Alaska Economy ________________________________________________________ Misc. Non-earned Income
March 2010 Institute of Social and Economic Research, UAA Page 107
N. MISCELLANEOUS NON-EARNED INCOME
Some economic activity in Alaska is generated by the purchasing power that flows into the state that is not directly related to current production of goods and services in Alaska. There are a number of sources for this non-earned income. (The flows of income from the Permanent Fund and retiree assets both fall in this category, but they are accounted for separately because of their magnitude and clearly identifiable sources.)
One modest but stable source consists of the dividends, interest, and rents earned by Alaskan households on their assets held outside the state. These assets consist of things like ownership shares in corporations, bonds, and real estate. Of course, a large share of the non-earned income of Alaskan households comes from Alaska assets, and this income should be attributed to the basic sector where it is earned. For example, if an Alaskan household owns stock in an oil company operating in the state, the purchasing power of the dividends paid to that household should be attributed to the petroleum sector. (Since the portion of this oil company stock owned by Alaskans is small, we can effectively ignore it when considering the importance of the petroleum industry within the state.) Rent earned on a retail mall should be attributed to non-basic activity.
The largest asset for most households is their home. The net worth of housing (its market value minus any outstanding mortgages) occasionally can change rapidly if interest rates are falling and mortgages can be refinanced. This can free up large amounts of cash that increases the purchasing power of households.
Another source of purchasing power flowing into the state consists of institutional donations to individuals and nonprofit organizations. An example of this type of income is the distributed earnings of foundations such as the Rasmuson Foundation. Of course, this flow into the economy is largely offset by the donations of Alaska institutions to organizations outside the state.
Private transfers like child support and alimony payments can also supplement Alaska incomes and purchasing power. A potentially large transfer would be the payment of damages by Exxon to Alaska households and businesses in compensation for the Exxon Valdez oil spill of 1989.
VALUE OF OUTPUT The median U.S. household net worth in 2000 was $55 thousand, and of that
about half was held in financial assets and real estate that produced dividends, interest, or rent. The rest consisted of housing, vehicles, and retirement accounts.

Structural Analysis of the Alaska Economy ________________________________________________________ Misc. Non-earned Income
March 2010 Institute of Social and Economic Research, UAA Page 108
Table III.N1. Asset Ownership in the U.S. in 2000 Percent
Households Owning
Percent of Household Net
Worth All Assets 100%
Interest Earnings Assets at Financial Institutions 65 8.9% Other Interest Earning Assets 3.3 1.7% Regular Checking Accounts 37.5 .3% Stocks and Mutual Funds 27.1 15.6% Own Home 67.2 32.3% Rental Property 4.9 3.7% Other Real Estate 6.6 3.6% Vehicles 85.5 3.7% Business or Profession 10.8 7.7% U.S. Savings Bonds 14.7 .5% IRA and Keogh Accounts 23.1 8.6% 401k and Thrift Savings Plans 29.9 9.7% Other 3.9 1.6% Unsecured Liabilities 52.7 -3%
Source: USDC Bureau of the Census.
Alaska taxpayers reported about $500 million in taxable interest and dividend income on their federal tax returns in 2005—$1,450 per return. Only a portion of this total consists of income earned on assets held outside the state (and much of that is earned by retirees), but it is impossible to quantify that portion.
The reported interest and dividend income from tax returns is considerably less than the total non-earned income of Alaska residents presented in the personal income data reported by the federal government, excluding government transfers, of $3.9 billion in 2006. This was equivalent to $5,822 per person. (Capital gains and losses are not included in these figures.)
Table III.N2. Dividends-Interest-Rent in Alaska Personal Income
1990 1995 2000 2001 2002 2003 2004 2005 2006 Total (Million $) $1,950 $2,624 $3,191 $3,148 $3,022 $2,966 $3,107 $3,611 $3,901 Per Capita $3,524 $4,341 $5,085 $4,979 $4,717 $4,579 $4,731 $5,445 $5,822
Source: USDC BEA.
The unearned income data in the personal income measure overestimates the cash that households receive because about half is “imputed” or retained by pension plans or other fiduciaries. For example, the rent component includes an “imputed” estimate of the income homeowners would receive if they were to rent out their homes (net of ownership and operating costs).
Based on the national composition of dividends-interest-rent, about half of the payments in Alaska might become current cash income of households—about $2 billion in the aggregate or $3,000 per capita. Of the total, 60 percent would be dividends; 35 percent would be interest; and the remainder would be rent.

Structural Analysis of the Alaska Economy ________________________________________________________ Misc. Non-earned Income
March 2010 Institute of Social and Economic Research, UAA Page 109
Table III.N3. U.S. Personal Income from Assets in 2004 (Billion $) Dividends Interest Rent Total
Total reported in personal income accounts $537 $891 $127 $1,555
Less: Imputed $0 $192 $78 $270 Retained by Life Insurance Carriers and Pensions $44 $394 $2 $440
Retained by Fiduciaries $23 $27 $6 $56 Net $470 $278 $41 $789 Less:
Exempt from Federal Income Tax $226 $52 0 $278 Accounting Adjustment $29 $34 $13 $76
Net $215 $192 $28 $435
Source: USDC BEA.
The dividends-interest-rent net of imputed values and amounts retained by fiduciaries is still considerably larger than the amount reported as part of adjusted gross income because 45 percent of net dividend-interest-rent income in the personal income measure is exempt from federal taxes (or excluded from adjusted gross income due to accounting differences).
Using this national ratio, the Alaska per-capita taxable dividend-interest-rent would be about $1,650. This is about double the amount actually reported (per return), suggesting that the dividend-interest-rent data in the personal income accounts overestimates the cash that Alaska households receive on their asset holding even after adjustments have been made.
PERSPECTIVE Dividend-interest-rent accounted for 15 percent of Alaska personal income in
2005—slightly less than the national average of 15.6 percent. Taxable dividends and interest reported per tax return in Alaska in 2005 were
$1,450 compared to the national average of $2,400. This is consistent with the observation that household net worth increases with age and the average age in Alaska is considerably below the U.S. average.
DIRECT JOBS There is no data on the number of jobs that are directly dependent on the non-
earned income that flows into Alaska each year from the earnings of assets held outside the state and private transfers.
DIRECT EARNINGS Without employment estimates information on payroll cannot be constructed.
AVERAGE EARNINGS NA

Structural Analysis of the Alaska Economy ________________________________________________________ Misc. Non-earned Income
March 2010 Institute of Social and Economic Research, UAA Page 110
SOURCES OF ECONOMIC CONTRIBUTION The earnings on household assets held outside the state is a source of
disposable income for Alaskans similar to the Permanent Fund dividend. Private transfers such as alimony payments or the settlement of the Exxon Valdez lawsuit are also a source of disposable income from outside the state economy. Likewise, the earnings on assets held by businesses and nonprofit organizations and monetary transfers they receive from outside the Alaska economy can generate local economic activity to the extent that they support local spending by those organizations.
STATE AND LOCAL GOVERNMENT REVENUES No state or local revenues can be directly attributed to non-earned income from
outside the state.
GROSS DOMESTIC PRODUCT Gross domestic product cannot be estimated.
MEASUREMENT ISSUES Household net worth is not reported at the state level, but the survey upon
which national estimates are based has been used to generate an estimate for 2002 for Alaska which suggests Alaska ranks sixth among the states in median net worth of its households. The information published by the U.S. Census regarding that survey (Survey of Income and Program Participation) indicates that it is designed to collect information at the national level. Because of this and the fact that the Alaska sample is small, this estimate of net worth for Alaska is problematic. It is also not consistent with the other data that show dividend-interest-rent and taxable income from asset earnings to be close to or less than the national average.
Table III.N4. Median Household Net Worth Reported in 2002 Rank Median
Massachusetts 1 $140,575 Connecticut 2 $121,525 New Jersey 3 $110,846 New Hampshire 4 $110,491 Minnesota 5 $105,100 Alaska 6 $102,500 Arizona 46 $38,900 Alabama 47 $38,146 Texas 48 $34,500 Mississippi 49 $26,500 New Mexico 50 $24,832
Source: Corporation for Enterprise Development, based on USDC, Bureau of the Census.

Structural Analysis of the Alaska Economy ________________________________________________________ Misc. Non-earned Income
March 2010 Institute of Social and Economic Research, UAA Page 111
Dividend-interest-rent data from the U.S. BEA is not reported in any detail at the state or local level.
It is impossible to identify the shares of non-earned income generated within Alaska and outside the state.
PRIMARY DATA SOURCES U.S. Department of Commerce, Bureau of Economic Analysis, Regional
Economic Accounts Web site. U.S. Department of Commerce, Bureau of the Census, Survey of Income and
Program Participation. U.S. Department of the Treasury, Internal Revenue Service, Statistics of
Income.
RECENT LITERATURE Goldsmith, Scott, The Foraker Group Report on the Alaska Nonprofit
Economy, prepared for the Foraker Group, ISER, 2006. McDowell Group, Economics of Alaska’s Arts Industry, prepared for the
Alaska State Council for the Arts, November 2002.

Structural Analysis of the Alaska Economy ________________________________________________________ Misc. Non-earned Income
March 2010 Institute of Social and Economic Research, UAA Page 112

Structural Analysis of the Alaska Economy __________________________________________________________ Special Characteristics
March 2010 Institute of Social and Economic Research, UAA Page 113
IV. Special Characteristics of the Alaska Economy IV.A. Diversity of Regional Economies
Most Alaska population and jobs are located in south central Alaska in the Census areas adjacent to the Alaska Railroad known as the Railbelt—Anchorage, Matanuska-Susitna Borough, Kenai Peninsula Borough, and Fairbanks. Urban Alaska is usually thought of as the Railbelt plus the capital city of Juneau in southeast Alaska. Economic descriptions of Alaska are dominated by what is happening in this urban part of the state, which contains skyscrapers, shopping malls, and a broad compliment of consumer goods as well as business services. In these and many other ways, urban Alaska has many of the economic characteristics of urban areas in the rest of the U.S. Visitors who only experience urban Alaskan however leave with a very distorted view of the entire state however, because there are two other distinct and very different regions in the state as well.
Outside urban Alaska are a number of smaller communities that have road or ferry access that can be thought of as Rural Alaska. Most of these are maritime communities with economies dominated by seafood, tourism, and government. Most of southeast Alaska and parts of south central Alaska fall into this category. A recent description of this region can be found in “The Regional Economy of Southeast Alaska” by Steve Colt, Darcy Dugan, and Ginny Fay, Institute of Social and Economic Research, prepared for Alaska Conservation Foundation, 2007. This part of the state retains more of the characteristics of what Alaska was like before statehood.
In northern and western Alaska, access is by air and ship, but there are no roads or ferry services connecting the communities in this part of the state with the urban centers. With the exception of five modest-sized regional centers and a handful of resource extraction enclaves, the communities in this part of the state are very small Alaska Native villages with underdeveloped cash economies. Residents rely on subsistence activities for a large part of their well-being.
This part of the state, Remote Rural Alaska, is also the location of much of the natural resource production that supports the urban areas, including petroleum on the North Slope, mining in the Northwest Arctic, and fishing in Southwest Alaska. Some of these activities are integrated into their regional economies, but others are conducted as enclaves with little or no local economic links. A description of this region can be found in “Understanding Alaska’s Remote Rural Economy,” UA Research Summary No.10, Institute of Social and Economic Research, 2008.

Structural Analysis of the Alaska Economy __________________________________________________________ Special Characteristics
March 2010 Institute of Social and Economic Research, UAA Page 114
Figure IV.1. Alaska Regions (2000)
IV.B. Subsistence Subsistence is central to life in the Native communities throughout the state and
is important for Alaska Natives in urban areas as well. Because it contributes to the well-being of Native households and because those who engage in subsistence devote considerable time to it, subsistence should be reflected in descriptions of the economy. However, the value of subsistence activities is not included in the personal income data, and the time spent in subsistence activities is not included in the employment data. Consequently, the subsistence contribution does not appear at all in many descriptions of the Alaska economy. The economic importance of subsistence must be inferred from data on participation and physical harvest.
Table IV.1. Subsistence Participation by Rural Households Harvesting Game 60% Using Game 86% Harvesting Fish 83% Using Fish 95%
Rural includes all households in western, southeastern, interior, and parts of southeast Alaska.
Source: Alaska Department of Fish and Game, Subsistence in Alaska: A Year 2000 Update.

Structural Analysis of the Alaska Economy __________________________________________________________ Special Characteristics
March 2010 Institute of Social and Economic Research, UAA Page 115
Table IV.2. Wild Food Harvest in Pounds per Person: Average of 1990s
Rural Regions Western 664 Rural Interior 613 Arctic 516 Southwest 373 Rural Southeast 178 Kodiak 155 Rural South Central 153 Urban Alaska Kenai Peninsula 40 Juneau 35 Ketchikan 33 Matanuska-Susitna 27 Anchorage 19 Fairbanks 16
Source: Alaska Department of Fish and Game, Subsistence in Alaska: A Year 2000 Update.
Table IV.3. Composition of Subsistence Harvest by Weight Fish 60% Land Mammals 20% Marine Mammals 14% Birds 2% Shellfish 2% Plants 2%
Source: Alaska Department of Fish and Game, Subsistence in Alaska: A Year 2000 Update.
IV.C. Land and Resource Ownership The federal and state governments together own 89 percent of the land and a
large share of the natural resources in Alaska. Although the share of land in public ownership is high in several other western states, Alaska ranks number one in this category.
Table IV.4. Public Land Ownership by State Share Rank Alaska 89.2% 1 Nevada 81.1% 2 Utah 70.4% 3 Idaho 66.6% 4 Wyoming 54.7% 5 U.S. Average 35% Indiana 2.3% 46 Texas 1.9% 47 Nebraska 1.6% 48 Iowa 1.0% 49 Kansas .9% 50
Source: Natural Resources Council of Maine.

Structural Analysis of the Alaska Economy __________________________________________________________ Special Characteristics
March 2010 Institute of Social and Economic Research, UAA Page 116
The larger share of public land is owned by the federal government and is composed of wildlife refuges, public domain, parks, and national forests.
Table IV.5. Alaska Land Ownership 2000 Million
Acres Share
of Total Total 375 Federal 242 65%
Wildlife Refuges 76.5 Public Domain 61.4 Parks, Preserves, Monuments 52 NPRA 23 Forests 22 Military Reserves 1.8 Other 4.9
State 89.5 24% General 77.9 Parks, Refuges, Forests, Other 11.6
Other Public 1.8 - Private 40.1 11%
Alaska Native Corporations 37.4 Other 2.7
Source: “Dividing Alaska, 1867-2000: Changing Land Ownership and Management,” Teresa Hull and Linda Leask, Alaska Review of Social and Economic Conditions, November 2000, Volume XXXII, No. 1.
Given the size of the state, Alaska accounts for a large share of all federal
lands in these categories. For example, 85 percent of all National Wildlife Refuge land is located in Alaska.
Table IV.6. Alaska Share of Federal Land: Major Categories (Million Acres)
U.S. Total Alaska Alaska
Share Total 219.9 588.1 37% BLM 69.7 246.8 28% USFS 22.2 192.2 12% NPS 52.7 174.1 30% NWR 75.3 89 85% Military Bases 2.1 17.4 12%
Source: Natural Resources Council of Maine.

Structural Analysis of the Alaska Economy __________________________________________________________ Special Characteristics
March 2010 Institute of Social and Economic Research, UAA Page 117
In spite of this, Alaska ranks only 4th among the states in the share of land owned by the federal government because the state also owns 29 percent of the land—a share second only to New York state.19
Table IV.7. Federal Land Ownership by State Share Rank Nevada 89.9% 1 Utah 63.1% 2 Idaho 61.4% 3 Alaska 60.2% 4 Wyoming 48.4% 5 U.S. Average 26% Kansas .3% 46 Iowa .3% 47 New York .3% 48 Rhode Island .3% 49 Connecticut .2% 50
Source: Natural Resources Council of Maine.
Table IV.8. State Land Ownership by State Share Rank New York 36.7% 1 Alaska 29.0% 2 New Jersey 15.6% 3 Florida 13.7% 4 Pennsylvania 12.8 5 U.S. Average 8.7% North Carolina .4% 46 Kentucky .4% 47 Missouri .4% 48 South Dakota .2% 49 Nevada .2% 50
Source: Natural Resources Council of Maine.
Public ownership removes a large share of land from the potential property tax base but offers the opportunity for public revenues from resource exploitation in the form of royalties and other payments. However, large portions of publicly owned land have limited access.
19 The different sources used in this description of land ownership report slightly different percentages for public ownership.

Structural Analysis of the Alaska Economy __________________________________________________________ Special Characteristics
March 2010 Institute of Social and Economic Research, UAA Page 118
IV.D. Government Employment Alaska ranks number one among the states in the share of jobs directly
provided by public spending (including active duty military).
Table IV.9. Public Employment by State, 2006 Share Rank Alaska 23.5% 1 Hawaii 20.3% 2 New Mexico 19.5% 3 Wyoming 18.2% 4 Mississippi 17.9% 5 U.S. Average 13.4% Florida 11.3% 46 Pennsylvania 11.3% 47 New Hampshire 10.8% 48 Mass 10.5% 49 Nevada 10.0% 50
Source: U.S. Department of Commerce, 2006.
The public share of employment is largely due to federal employment which is more than three times the average for the entire United States and second only to Hawaii.20 State and local government employment also ranks high among the states but does not diverge nearly as much from the national average.
Table IV.10. Federal Employment by State, 2006 Share Rank Hawaii 10.0% 1 Alaska 9.7% 2 Virginia 6.9% 3 Maryland 6.0% 4 North Dakota 4.5% 5 U.S. Average 2.7% Indiana 1.5% 46 Iowa 1.5% 47 Michigan 1.4% 48 New Hampshire 1.4% 49 Wisconsin 1.3% 50
Source: U.S. Department of Commerce, 2006.
20 Alaska’s federal civilian employment concentration was more than twice the national average, second only to Maryland. Alaska’s military personnel concentration was about five times the national average, second only to Hawaii.

Structural Analysis of the Alaska Economy __________________________________________________________ Special Characteristics
March 2010 Institute of Social and Economic Research, UAA Page 119
Table IV.11. State and Local Employment by State, 2006 Share Rank New Mexico 15.3% 1 Wyoming 14.6% 2 Mississippi 14.2% 3 Alaska 13.8% 4 West Virginia 12.9% 5 U.S. Average 10.8% Rhode Island 9.4% 46 Pennsylvania 9.2% 47 Florida 9.1% 48 Massachusetts 8.8% 49 Nevada 8.1% 50
Source: U.S. Department of Commerce, 2006.
The dominant role of the public sector makes the labor market less responsive. It also creates a potential fiscal distortion since government enterprises enjoy tax-exempt status but contribute to the demand for public goods and services. Although some forms of payment by the federal government are designed to compensate the state and local governments for this distortion, it is not clear whether this tax-exempt status shifts some of the burden of paying for public services to the private economy.
IV.E. Nonprofit Sector The nonprofit sector is more important for Alaska than for the average state and
ranks in the top 10 in share of employment.
Table IV.12. Share of Employment in Nonprofit Sector Vermont 11.6% North Dakota 10.5% Massachusetts 10.5% Rhode Island 10.3% Pennsylvania 10.3% Maine 10.2% New York 9.7% South Dakota 9.5% Minnesota 9.4% Alaska 9.2% U.S. Average 7.1%
Source: The Foraker Group Report on the Alaska Nonprofit Economy, prepared for Foraker Alaska, December 2006, Institute of Social and Economic Research.
The tax-exempt status of these activities shifts some of the burden of paying for
public services to the private economy. In Alaska a large share of nonprofit activity

Structural Analysis of the Alaska Economy __________________________________________________________ Special Characteristics
March 2010 Institute of Social and Economic Research, UAA Page 120
is financed by the federal government and, consequently, sensitive to the availability of public funds.
IV.F. Seasonality Several Alaska industries—particularly seafood harvesting and processing,
tourism, construction, and timber—are highly seasonal and result in total employment in the summer exceeding that in the winter by at least 16 percent or 50 thousand (not counting the self employed who are not fish-harvesters). The seasonality can be summarized by the ratio of employment in July relative to January.
Table IV.13. Seasonality in Selected Alaska Industries: 2005 Employment (Thousand)
July January Swing (July-Jan)
Seasonal Index
(July/Jan) Total 349.2 299.8 49.4 1.16 Private 283.0 220.8 62.2 1.28
Timber Harvest .5 .2 .3 2.90 Fish Harvesting 20.2 7.3 12.9 2.77 Fish Processing 18.2 7.3 10.8 2.48 Tourism Related* 42.0 25.5 16.5 1.65 Construction 21.4 14.5 6.9 1.48 Mining 12.5 11.0 1.5 1.13
Source: Alaska Department of Labor. *Employment in industries that serve both tourists and residents, like eating and drinking establishments. The ratio of summer-to-winter tourist visitors is about 10-to-1, so the seasonality in that sector of the economy is much greater than reflected in these figures.
Seasonal employment is concentrated in communities where these industries
dominate. For example, in the Bristol Bay Region the peak summer employment was 16.6 thousand in 2004, nearly five times the number in the winter.
A consequence of this seasonality is that the economy is unable to sustain many year-round businesses serving the needs of local residents. Of the annual average jobs in the Bristol Bay region, only 1.4 thousand—or 19 percent—were non-basic.
A comparison of two small Alaska communities—Haines and Bristol Bay Borough—provides another example of this phenomenon. Although both are highly seasonal, based on the seasonal index, Bristol Bay Borough is much more so. Partly as a result of this, the service sector of the Bristol Bay Borough economy is much less developed, in spite of the fact that average annual employment is higher.

Structural Analysis of the Alaska Economy __________________________________________________________ Special Characteristics
March 2010 Institute of Social and Economic Research, UAA Page 121
Table IV.14. Employment in the Bristol Bay Region, 2004
Annual Average Summer Winter Swing (Summer
minus Winter) Total Jobs by Place of Work 7,691 16,631 3,640 12,991 Basic 6,251 15,028 2,304 12,724
Fish Harvesting 2,552 7,657 0 7,657 Fish Processing 1,150 4,193 200 3,993 Recreation 311 933 0 933 Government + Health 2,098 1,795 2,104 -309 Mining 150 450 0 450
Non-Basic 1,440 1,603 1,336 267 Construction 64 80 56 24 Trade/Transport/Leisure 642 765 580 185 Finance 127 118 116 2 Other Wage and Salary 180 213 157 56 Non-Basic Self Employed 427 427 427 0
Jobs by Place of Residence Local Resident 4,233 5,741 3,640 2,101 All Non Local 3,458 10,890 0 10,890
Source: Economics of Wild Salmon Watersheds: Bristol Bay, Alaska, Duffield, Patterson, & Neher; Trout Unlimited, Alaska, 2007. Region includes Bristol Bay, Dillingham, and Lake and Peninsula Boroughs.
Table IV.15. Wage and Salary Employment in Two Alaska Communities, 2006
Haines Bristol Bay Bristol Bay/
Haines Annual Average 1,056 1,308 124%
Seasonal Index 2.38 6.16 July 1,737 3,655 210% December 730 593 81%
Government 190 249 131% Private 540 344 64%
Goods 55 102 185% Resources 1 0 0% Construction 40 49 123% Manufacturing 14 53 379%
Services 485 242 50% Wholesale Trade 2 0 0% Retail Trade 145 41 28% Transportation/Utilities 43 117 272% Information 31 19 61% Financial 22 13 59% Professional 12 4 33% Health/Education 101 5 5% Leisure/Hospitality 76 39 51% Other 51 4 8%
Source: Alaska Department of Labor.

Structural Analysis of the Alaska Economy __________________________________________________________ Special Characteristics
March 2010 Institute of Social and Economic Research, UAA Page 122
A statewide survey conducted in mid-summer in 2006, when cash employment reaches its annual peak, suggests that at that point only 65% of private wage and salary jobs are full time (and presumably year-round).21 Nineteen percent are seasonal and sixteen percent are part time. The place of residence of the workers filling those jobs was not reported, but logically a larger share of the seasonal and part-time workers were likely to be nonresidents.
IV.G. Nonresident Workers Seasonality is a contributing factor, but not the only one, to the large share of
nonresident workers in the labor force, estimated at 74 thousand or 23 percent of private-sector wage and salary workers in 2006. (According to Table IV.14, about two-thirds of the summer workers in the Bristol Bay Region were not local residents.)
Nonresident workers are also the result of a mismatch between the local supply of labor and the demand for highly technical and skilled workers. A further factor is the turnover in the population of the state, whereby a share of workers is always leaving Alaska, only to be replaced by new arrivals from outside the state.
Insight into the nonresident work force can be gained by analyzing the data prepared each year by the Alaska Department of Labor (ADOL). Table IV.16 adjusts the 2006 ADOL estimate of 74 thousand private-sector nonresident workers to 64 thousand by subtracting normal turnover and adding in nonresident fish harvesters.22 (Normal turnover is estimated at 6.5 percent of the workforce, based on the experience in the public sector.)
Table IV.16. Adjusted Nonresident Work Force Estimate, 2006 Total Private Wage and Salary 320,165 Normal Year-to-Year Change 6.5% Nonresident Private Wage and Salary 73,789 Minus: Normal Turnover 20,811 Equals: Nonresident Net Normal Turnover 52,978 Add: Nonresident Self Employed Fish Harvesters 10,828 Equals: Nonresidents Net Turnover 63,807
Source: Nonresidents Working in Alaska 2006, Alaska Department of Labor, except fish harvesting from Alaska Department of Labor special analysis of participation, ISER.
Table IV.17 then shows the industrial distribution of the 64 thousand
nonresident workers net of turnover—assumed to be the same percentage (6.5%) in each industry. Commercial fishing accounts for 40 percent of the total nonresident work force, and tourism accounts for an estimated 20 percent. 21 See “Employer Based Health Insurance,” in Alaska Economic Trends, December 2007. 22 Because of turnover and seasonality, the number of workers each year is considerably greater than the number of annual average jobs even though some workers held more than one job.

Structural Analysis of the Alaska Economy __________________________________________________________ Special Characteristics
March 2010 Institute of Social and Economic Research, UAA Page 123
Nonresident workers in the tourism sector cannot be determined accurately from the reported data because the businesses that serve tourists (accommodation and food service, amusement, entertainment, scenic and sightseeing transportation, retail trade, travel reservation agencies, and building services) also serve the resident population throughout the year. However, since the ratio of tourist visitors in the summer to those in the winter is about 10-to-1, our estimate is likely to be a lower bound on the actual nonresident number and share.23
Table IV.17. Nonresident Workers in 2006
Nonresident
Share of Industry
Number Share of
Total Nonresidents
Total Nonresidents 63,807 100% Fish Processing 68.1% 14,992 23.5%
Fish Harvesting 39.0% 10,828 17.0% Tourism 25.0% 12,857 20.2%
Retail 8.0% 3,883 6.1% Construction 13.1% 3,810 6.0% Petroleum 21.7% 3,599 5.6% Administrative Support* 21.0% 3,222 5.0% Professional Scientific and Technical 11.8% 1,729 2.7% Other Transport 12.7% 1,691 2.7% Health Care 3.6% 1,461 2.3% Air Transport 16.0% 1,268 2.0% Mining 21.5% 551 0.9% Timber 28.1% 353 0.6% Other 3,562 5.6%
Source: Nonresidents Working in Alaska 2006, Alaska Department of Labor except fish harvesting from Alaska Department of Labor special analysis of participation, ISER. * Includes travel agents.
The remaining 39 percent of nonresident workers are distributed across the
other industries, some of which are highly seasonal like construction; some of which require highly skilled workers like petroleum; some of which are rapidly growing like health care; and some of which are low paying like retail trade.
Since average annual unemployment in Alaska was 23 thousand in 2006, it is clear that residents could not have taken all the jobs that nonresident workers filled that year.
True nonresident workers (excluding recent arrivals who have not yet obtained resident status according to the ADOL—estimated at about 11 percent of total
23 The employees of large cruise ships are mostly nonresident workers, but since they are not based in Alaska, their numbers do not appear as nonresident workers in the state report.

Structural Analysis of the Alaska Economy __________________________________________________________ Special Characteristics
March 2010 Institute of Social and Economic Research, UAA Page 124
nonresident workers in 2006) spend only a part of their earnings within the state economy and, thus, make a limited contribution to the overall size of the economy.
IV.H. Population Turnover Alaska ranks fourth among the states in the share of population recently
moving into the state. The large military presence is one factor contributing to this high rate of turnover (both active-duty personnel and their dependents), but historically the state has attracted young people while older residents have tended to leave the state.
Table IV.18. New Residents within Last 5 Years (2000)
State Share Rank Nevada 29.2% 1 Arizona 20.6% 2 Colorado 19.4% 3 Alaska 18.7% 4 Idaho 17% 5 U.S. Average 11.3% Wisconsin 8% 46 Pennsylvania 7.2% 47 Louisiana 7.1% 48 Michigan 6.8% 49 Ohio 6.7% 50
Source: U.S. Census of Population, 2000.
The annual gross flows in and out of the state have been trending downward slowly over time, but in 2004 there were 41 thousand in-migrants—6.3 percent of the population. Approximately the same number (and percentage) out-migrated during the year.
This turnover of the population means that a significant share of Alaska residents has a limited understanding of the unusual economic and fiscal characteristics of Alaska. Because of the importance of the public sector in managing the economy, this lack of knowledge is an impediment to informed public policy decision making.

Structural Analysis of the Alaska Economy __________________________________________________________ Special Characteristics
March 2010 Institute of Social and Economic Research, UAA Page 125
Table IV.19. Gross In-Migration Year Ending
June of In-migrants
(000) In-migration
Rate 1990 42.8 7.9% 1991 44.9 8.1% 1992 51.4 9.0% 1993 47.2 8.0% 1994 42.3 7.1% 1995 39.0 6.5% 1996 40.3 6.7% 1997 41.5 6.9% 1998 41.0 6.7% 1999 39.9 6.5% 2000 38.3 6.2% 2001 35.6 5.7% 2002 38.8 6.1% 2003 39.6 6.2% 2004 40.5 6.3%
Source: Alaska Department of Labor, Alaska Population Overview, 2003-2004 estimates.
IV.I. Enclave Development Several Alaska industries—notably commercial fishing, oil and gas, timber,
tourism, and mining—are characterized by enclave development. They tend to be concentrated in remote locations where there is neither a resident labor supply nor support infrastructure to provide goods and services. Workers are typically housed at camps at these remote sites and commute from their place of residence on a rotating basis. Workers may come from other locations within Alaska or come from other states, either on a rotational or seasonal basis.
The support infrastructure might be supplied from urban centers in Alaska, or it could also come from outside the state. For example, the petroleum industry on the North Slope has very limited linkages (purchases of goods and services) with Barrow, the regional center. Anchorage and Fairbanks provide transportation, logistics, and warehousing services for the petroleum industry operations on the North Slope. In recent years small modules associated with oil production have been fabricated in south central Alaska, but larger modules are fabricated outside the state and barged directly to the North Slope.
The cruise ship sector of the tourism industry is an example of an enclave of a different sort. Most workers are nonresidents and the ships are outfitted before leaving their home ports, which are outside the state. Tourist purchases when ashore are the main link between the cruise ships and the local economy.
Because enclave development involves limited direct interaction with the regional economy in which it is operating, the region does not benefit from the

Structural Analysis of the Alaska Economy __________________________________________________________ Special Characteristics
March 2010 Institute of Social and Economic Research, UAA Page 126
direct jobs and business activity associated with the development and also misses out on the multiplier effects that would be generated by these activities if they occurred in a more developed economic setting. The composition of employment associated with commercial fishing, tourism, and recreational activities in the Bristol Bay region is a case in point. A recent analysis estimated that 3.2 thousand jobs (annual average) in the Bristol Bay region were directly created by these activities. Of those direct jobs, only 16 percent were filled by local residents. Alaskans from outside the region filled 18 percent, and nonresidents of Alaska filled 65 percent.
Because of limited support infrastructure in the local economy, the 2.3 thousand indirect and induced (multiplier) jobs created within Alaska by this activity were concentrated outside the local economy where the non local resident workers live and from where many of the support services are provided.
Of the total 5.5 thousand jobs generated within the state by this activity, only 29 percent went to local residents. Non local residents filled 33 percent of the jobs, and non-Alaska residents filled 38 percent.
This calculation ignores the multiplier jobs created outside Alaska by the commercial fishing, tourism, and recreation activities in the Bristol Bay region. These “lost” multiplier jobs are generated when the nonresident workers spend their Alaska earnings in their home states and when business outside the state supply goods and services —directly and indirectly—in support of the fishing, tourism, and recreation businesses operating in the region. Although figures are not available on the numbers of these jobs, they are likely to be at least as great as the number of multiplier jobs created within the state. If that is true, more than half of the jobs created occur outside the state.

Structural Analysis of the Alaska Economy __________________________________________________________ Special Characteristics
March 2010 Institute of Social and Economic Research, UAA Page 127
Table IV.20. Residence of Workers in Jobs Created in Alaska by Bristol Bay Ecosystems, 2005
Residence of Worker
Total Residents Non-residents
Total Local Non local
ANNUAL AVERAGE JOBS 5,490 3,380 1,585 1,795 2,110 Direct 3,230 1,120 528 592 2,110 Indirect and Induced 2,260 2,260 1,057 1,204 0 SHARES 100% 62% 29% 33% 38%
Direct 100% 35% 16% 18% 65% Indirect and Induced 100% 100% 47% 53% -
Item: Summer Peak Direct Jobs 13,248 4,513 2,161 2,352 8,735 NOTE: All direct jobs are in Bristol Bay region which includes Bristol Bay, Dillingham, and Lake and Peninsula Boroughs.
Indirect and Induced jobs are located in both Bristol Bay and South central Alaska. Indirect and Inducted jobs are all taken by residents of region where they occur. This summary excludes subsistence and ecosystem management.
Source: Economics of Wild Salmon Watersheds: Bristol Bay, Alaska, Duffield, Patterson, & Neher; Trout Unlimited, Alaska, 2007.
IV.J. Dominance of Non-Alaska Firms in Natural Resource Sectors Although most commercial natural resources are owned by the state or federal
government or by local private entities (Alaska Native corporations), the private sectors that drive the Alaska economy are dominated by large firms headquartered outside of Alaska that are national or international in scope. This is partly due to the large capital requirements to successfully explore, develop, and produce the natural resources of the state, particularly petroleum and minerals.
The largest Alaska-owned firms are primarily in the support, or non-basic sector of the economy. These include banking, construction, transportation, retail, and utilities.24
However, in recent years a number of regional and village Native corporations have become involved in the natural resource industries through subsidiaries of their parent companies. These have been largely in a supporting role in the petroleum sector in activities like oil field services and drilling, and directly in the production of timber and seafood (as well as providing services to tourists).
24 The Alaska Business Monthly publishes an annual list of the 49 largest (ranked by revenues) Alaska-owned companies. In 2007 19 of the 49 largest Alaska-owned firms, based on revenues, were Alaska Native regional and village corporations. Only one of the 49, Usibelli Coal Mine Inc., was a producer of natural resources. The rest were providers of services to business and households—including construction and oil field service firms, financial services, transportation, utilities, health services, and trade.

Structural Analysis of the Alaska Economy __________________________________________________________ Special Characteristics
March 2010 Institute of Social and Economic Research, UAA Page 128
Table IV.21 The Largest Firms in the Private Resource Production Sectors
Petroleum BP Exploration Alaska ConocoPhillips Exxon Chevron Shell Tesoro Mining Northern Dynasty Teck Cominco Alaska Rio Tinto Kennecott Minerals Co. Hecla Mining Co. Kinross Gold Inc. Tourism Royal Caribbean Norwegian Cruise Line Westmark Princess Hotels Seafood Trident Seafood Unisea Icicle Seafoods Westward Seafood Peter Pan Seafood Ocean Beauty* International Air Cargo FEDEX UPS China Air Lines
Source: ISER. *Partial Alaska ownership.
The fact that the private drivers of the economy are dominated by outside firms
means that Alaska benefits from the resources—financial, technical, managerial, and others—of these firms, but at the same time local firms may have a hard time competing successfully in these sectors except in a secondary role. It also creates concerns about the extent to which the business interests of these non-Alaska firms correspond to the interests of Alaska and Alaskans.

Structural Analysis of the Alaska Economy __________________________________________________________ Special Characteristics
March 2010 Institute of Social and Economic Research, UAA Page 129
IV.K. Self-employment The share of the jobs in Alaska that are accounted for by resident workers who
are self-employed (proprietors) is slightly higher than the national average—21.8 percent.
Table IV.22. Resident Self Employment by State State Share Rank
Montana 27.5% 1 Vermont 25.0% 2 South Dakota 24.5% 3 Idaho 24.2% 4 Maine 23.9% 5
Alaska 21.8% 12 U.S .Average 19.7%
Virginia 17.6% 46 Nevada 17.5% 47 South Carolina 17.4% 48 Rhode Island 17.0% 49 Delaware 16.2% 50
Source: U.S. Department of Commerce, 2006.
However, if nonresident fish harvesters (virtually all self-employed) are added to the resident self-employed, then the share of proprietors in the total job count would be about 25 percent and would put Alaska close to the top in the state ranking.
The self-employed are represented in every sector of the economy to varying degrees.
The distribution of the self-employed among full-time, part-time, and seasonal workers is not known, nor do we know how many of these self-employed also have wage and salary jobs. Without this information, the description of the economy is incomplete.

Structural Analysis of the Alaska Economy __________________________________________________________ Special Characteristics
March 2010 Institute of Social and Economic Research, UAA Page 130
Table IV.23. Resident Self-employment by Industry, 2006
Number
Percent of Total Self-employed Workers
Percent of Total Workers
in Industry Forestry, fishing, related activities, and other 12,484 13% 95% Real estate and rental and leasing 9,936 10% 66% Professional and technical services 9,828 10% 44% Retail trade 9,599 10% 21% Construction 9,582 10% 34% Other services, except public administration 8,711 9% 41% Health care and social assistance 6,261 6% 14% Administrative and waste services 5,493 6% 33% Arts, entertainment, and recreation 5,471 6% 55% Accommodation and food services 4,457 5% 14% Transportation and warehousing 3,506 4% 15% Finance and insurance 2,856 3% 24% Educational services 2,298 2% 43% Manufacturing 2,013 2% 13% Information 1,151 1% 14% Wholesale trade 1,144 1% 15% Mining 1,139 1% 8% Management of companies and enterprises 146 0% 11% Utilities 79 0% 4%
Source: U.S. Department of Commerce, Bureau of Economic Analysis. This source includes resident proprietors only (exludes non resident fish harvestors). IV.L. Small Population Only three states have a smaller population than Alaska.
Table IV.24. State Population in 2007
State Population in Thousands Rank
California 36,553.2 1 Texas 23,904.4 2 New York 19,297.7 3 Florida 18,251.2 4 Illinois 12,852.5 5 South Dakota 796.2 46 Alaska 683.5 47 North Dakota 639.7 48 Vermont 621.3 49 Wyoming 522.8 50
Source: U.S Department of Commerce, Bureau of Census.

Structural Analysis of the Alaska Economy __________________________________________________________ Special Characteristics
March 2010 Institute of Social and Economic Research, UAA Page 131
Among these small population states, the Alaska population is more concentrated in one large metropolitan area. More than half the Alaska population resides in the Greater Anchorage Area (Anchorage and the Matanuska-Susitna Borough). In contrast, the largest metropolitan area in Wyoming contains less than 1/6 of the total state population.
Although it dominates the state, the Greater Anchorage Area metropolitan area is small in absolute population compared to most other states. With a population of 351 thousand, 42 states have a larger metropolitan area.
Table IV.25. Largest Metropolitan Area by State (2005) State Metro Area Population (000) Rank Delaware Wilmington 43 50 Wyoming Cheyenne 85 49 Montana Billings 147 48 North Dakota Fargo 185 47 Vermont Burlington 205 46 South Dakota Sioux Falls 208 45 West Virginia Charleston 306 44 Alaska Anchorage 351 43 New Hampshire Manchester 401 42 Maine Portland 514 41 Iowa Des Moines 522 40 Mississippi Jackson 523 39 Idaho Boise 544 38 Kansas Wichita 587 37 Arkansas Little Rock 643 36 South Carolina Columbia 690 35 New Mexico Albuquerque 798 34 Nebraska Omaha 813 33 Connecticut Bridgeport 903 32 Hawaii Honolulu 905 31
Source: U.S. Department of Commerce, Bureau of the Census.
The small population means that the domestic market is small. This leads to a lack of competition in some industries and the inability of firms serving the domestic market to take advantage of economies of scale in operations. The result in higher prices to consumers and a higher cost of living (although Alaska’s remote location, severe weather, and institutional rigidities in the labor market are also contributing factors). The small population also limits the size of the labor market and the range of expertise it includes.
IV.M. Large Area with Scattered Remote Population With a population density of 1 person per square mile, Alaska is the least
densely populated state. And, in spite of the dominance of its largest metropolitan center, the population is widely scattered in a large number of small communities, some of which are more than 1,000 miles from the Greater Anchorage metropolitan area (Dutch Harbor is 1,250 miles from Anchorage).

Structural Analysis of the Alaska Economy __________________________________________________________ Special Characteristics
March 2010 Institute of Social and Economic Research, UAA Page 132
Table IV.26. Population Density
State Population per
Square Mile Rank New Jersey 1,138.0 1 Rhode Island 1,003.2 2 Massachusetts 809.8 3 Connecticut 702.9 4 Maryland 541.9 5 U.S. Average 80.7 South Dakota 9.9 46 North Dakota 9.3 47 Montana 6.2 48 Wyoming 5.1 49 Alaska 1.1 50
Source: U.S. Department of Commerce, Census of Population, 2000.
Although some communities outside the metropolitan area are accessible by road, many are off the road system and accessible only by water or air. Because of the high cost of transporting goods (and services) to these remote communities, the cost of living in rural Alaska tends to be considerably higher than in the urban areas—a condition which is just the opposite of the rest of the nation where the cost of living is typically lower in rural compared to urban areas.
IV.N. Distance to Markets and Suppliers Anchorage is 1,435 miles from Seattle, the nearest larger metropolitan area, by
air. No other state, with the exception of Hawaii, is as physically remote from the rest of the nation and larger markets. For example, Billings, the largest city in Montana, is 387 miles from Salt Lake City by road.
This relative isolation contributes to a higher cost of living by increasing the cost of shipping goods and services to Alaska and by limiting opportunities for competition from businesses in adjacent and accessible locations.
In spite of this, the cost of living in the Greater Anchorage area is not the highest in the nation, largely because the cost of housing is higher in some other large, urban locations; for example, San Francisco.
IV.O. Severe Weather Low winter temperatures and winter storm conditions often impede the
movement of goods and the efficiency of machines. This is an important factor in the cost of many types of business.

Structural Analysis of the Alaska Economy __________________________________________________________ Special Characteristics
March 2010 Institute of Social and Economic Research, UAA Page 133
IV.P. Fiscal Structure There are several unusual features of the Alaska fiscal structure. These include • The state general fund is overwhelmingly dependent on a single, non-
renewable and depleting natural resource—petroleum. • Natural resource extraction activities that form an important part of the tax
base are located in only a few, often isolated locations, resulting in inequitable geographical distribution of local tax base.
• The Alaska Permanent Fund is the largest potential “tax base.” It has been created by saving a portion of the revenues from non sustainable petroleum production.
• Tax capacity is concentrated at the state level due to limited local property and sales tax bases in many communities.
• The property and corporate income tax bases are limited due to a large concentration of government and nonprofit enterprises in the state. This shifts an excess tax burden onto private taxable enterprises.
• The corporate income tax base is limited due to the organization of a large share of businesses as sole proprietorships, limited partnerships, and s-corporations that pass their profits through to shareholders. (Alaska has no personal income tax.)
• The sales tax base in some communities is limited due to low average cash income.
• “Payments in lieu of taxes” support from the federal and state governments is designed to cover the local public service costs associated with their activities, but may not necessarily be sufficient, potentially creating an “excess burden” for the private sector.
• The absence of a personal income tax prevents the state from collecting revenues from the activities of the large nonprofit sector of the economy.
• The structure of taxes collected from Alaska businesses is piecemeal and inconsistent. The primary basic industries—tourism, mining, petroleum, seafood, and wood products—all have different tax structures. The support industries also differ. For example, the construction industry is largely organized in business structures that are exempt from the corporate income tax. The insurance sector pays a tax that falls only on that industry.
• The high cost of government services combined with the low average revenues generated by new economic activity under the current fiscal structure results in a phenomenon known as the “Alaska Disconnect”. This is the observation that most economic development does not pay for itself in the state.
• The nature of business activity in the natural resource industries that dominate the Alaska economy—mining, petroleum, seafood, timber, and tourism—makes it difficult to identify the “appropriate” level of tax liability for these industries, leading to a continuous debate over their tax capacity, rates, and economic impacts.
• The presence and importance of interstate and extra-territorial corporations complicates the ability of the state to tax.

Structural Analysis of the Alaska Economy __________________________________________________________ Special Characteristics
March 2010 Institute of Social and Economic Research, UAA Page 134
• The large number of nonresident workers and visitors to the state complicates discussions of who pays for public services.
• Public sector costs are high because of a number of factors—most notably the young average age of the population that results in a large per capita education budget, and the wide geographic spread of the population that prevents economies of scale in service delivery.
IV.Q. Age Distribution The median age of the Alaska population is among the youngest in the nation.
This is the result of a small senior (aged 65+) population and a large Alaska Native population that is relatively young.
Table IV.27. Median Age by State in 2003 State Age Rank Maine 40.2 1 Vermont 40.1 2 West Virginia 40.0 3 Florida 39.1 4 Pennsylvania 39.1 5 U.S. Average 36.0 Arizona 33.9 46 Georgia 33.8 47 Alaska 33.2 48 Texas 32.7 49 Utah 27.7 50
Source: U.S. Department of Commerce, Bureau of Census.
In spite of the young median age of the population, the share of “baby boomers” in the population (persons born between 1946 and 1964) is among the highest of any state due to a surge of in-migration of young workers during and after the Alyeska pipeline construction boom of the late 1970s.
The large baby-boomer population means that in future years the senior population will be growing rapidly (fewer seniors are leaving the state when then retire than in the past) and the turnover in the work force will be rapid.
IV.R. Data Quality Because of its small size, its dominance by the Greater Anchorage metropolitan
area, its wide geographical dispersion, and its regional variation, good data describing the characteristics of the economy are difficult and expensive to collect.
Data from Alaska Department of Labor attempts, within the constraints under which it operates, to take these conditions into account, but much of the data available and used to describe the economy comes from the federal government. This information is usually based on surveys with small Alaska samples; examples include the consumer expenditure survey (CES), the current population survey (CPS), the survey of income and program participation (SIPP), and the American
Structural Analysis of the Alaska Economy __________________________________________________________ Special Characteristics
March 2010 Institute of Social and Economic Research, UAA Page 135
community survey (ACS). The indicators generated from these surveys must be used carefully since they may not accurately reflect actual conditions in the state.
In addition, nationally generated indicators may be misleading if they fail to take into account unusual or unique conditions in the state. A good example of this is the federal government’s estimate of the share of the Alaska population without health insurance. The figure is overstated because it neglects to include Alaska Natives among the covered population (because the Native health service, which provides health coverage to Natives, is not considered to be “insurance”).

Structural Analysis of the Alaska Economy __________________________________________________________ Special Characteristics
March 2010 Institute of Social and Economic Research, UAA Page 136

Structural Analysis of the Alaska Economy ___________________________________________________________________ Appendix A
March 2010 Institute of Social and Economic Research, UAA Page 137
Appendix A Note on Gross Domestic Product and Value Added Comparisons across Arctic Regions
Gross Domestic Product (GDP) is the total value of final goods and services25 produced within a territory in a specified time period. It is one of the important measures of the level of economic activity in a region, along with employment and personal income.
GDP can be measured in 3 equivalent ways: 1. Expenditures—the sum of aggregate demand for consumption,
investment, government spending, and net exports from the region (C+I+G+[X-M]).
2. Income—the sum of the returns to the factors of production used in the production of output for final demand, primarily labor and capital, regardless of whether the owners of those factors of production live in the region or elsewhere.
3. Output—the production of goods and services for final demand by each sector of the economy.
Thus GDP is a measure of how much output a region can produce as well as how much income it can generate from that production. In this regard GDP is equivalent to Value Added (VA), defined as the economic contribution to goods and services production at each step in the production process by the factors of production—mostly labor and capital. Since the sum of value added equals both the value of output and the income to factors of production, total income equals total output.
The international standard for measuring GDP is established in the System of National Accounts (SNA93) prepared by representatives of the International Monetary Fund, European Union, Organization for Economic Cooperation and Development, United Nations, and World Bank. The rules and measures for the measurement of national accounts are designed to be flexible, to allow for differences in local statistical needs and conditions.26 GDP statistics are available for most countries and are commonly used to track and compare economic performance.
GDP is generally measured in the local currency, and so to compare the economic activity or performance between different countries requires that they be converted to a common base, typically using either the currency exchange rate or the purchasing power parity exchange rate. The choice depends on the objective of the comparison. The former compares the international purchasing power of
25 Including exports. 26 Countries may differ in the types of non-market activities they choose to include in GDP. They also may differ in which prices they use to present output figures. Among the alternatives are market prices (including any sales, property, and excise taxes) or factor costs (market prices net of taxes which are not a return to a factor of production).

Structural Analysis of the Alaska Economy ___________________________________________________________________ Appendix A
March 2010 Institute of Social and Economic Research, UAA Page 138
different economies. The latter is a better measure of the domestic purchasing power of the average producer or consumer within the countries.
Analysts using GDP as a measure of economic performance for a country need to keep in mind that it has a number of well-known shortcomings including:
1. Non-market transactions (child rearing, homemaker production, etc.) are generally excluded.
2. The underground economy (illegal activities, etc.) is generally excluded. 3. Economic “bads” are included. More production simply means a higher
GDP, regardless of what is produced. 4. The value of leisure and other aspects of the quality of life are excluded. 5. The distribution of income across the population is not measured. 6. The sustainability of production is ignored.
In many countries GDP is also calculated at a regional level, allowing comparisons between regions within a country as well as between regions in different countries. These comparisons need to recognize certain features of regional GDP calculations (particularly when the regions are small and remote). 1. Residency—GDP is a measure of the value of production within a region,
regardless of the residence of the labor used in production or the ownership of the capital. A companion measure at the national level—Gross National Product (GNP)—measures the value of production by the residence of the owners of the inputs used in production, wherever that production takes place, but there is no comparable figure at the regional level, at least not in the United States. This can be a problem when using GDP as a measure of the income of a small
and remote regional economy. A significant share of the work force could consist of commuters or seasonal workers who live outside the region. A large share of the capital could be owned by nonresidents and the profits from production could leave the region. If these conditions are true, then the income accruing to the residents of the regional economy will be less than the value of production.
It is also possible that the opposite would be the case. The state of Alaska controls a large investment fund—the Alaska Permanent Fund—with a portfolio of investments that is entirely outside the state. Each year the Fund generates several billion dollars of income that is not included in Alaska GDP because the production associated with those investments occurs outside the state. 2. Federal Assistance—A remote, rural region of a national economy may be
dependent upon assistance from the central government to pay for and provide public services, over and above the level that taxes from the region to the central government can provide. In such a case the GDP, which generally includes all public sector spending in the region, will be an overestimate of the productive capacity of the region by the amount of the “subsidy.” For example,

Structural Analysis of the Alaska Economy ___________________________________________________________________ Appendix A
March 2010 Institute of Social and Economic Research, UAA Page 139
an increase in the subsidy will increase GDP, even though it does not represent a strengthening of the regional economy.
3. Location of Production—When production involves inputs located in different regions, it can be difficult to allocate the share of value added attributable to each region. For example, oil production on Alaska’s North Slope depends not only on the inputs physically located in Alaska but also on capital and labor inputs located in the headquarters offices of the oil companies outside the state. Allocating economic rents (the value of output in excess of that required to compensate capital and labor) between regions in this case is arbitrary. Production may occur in one region and be reported in another. A share of the
seafood harvested in the ocean adjacent to Alaska is done by boats headquartered outside the state. The value of their harvest is reported as occurring in other locations rather than in Alaska. 4. Valuing Subsistence Activities—A share of the population in many remote, rural
regional economies engages in productive activities outside normal economic markets, such as the subsistence activities of indigenous people. The valuation of these subsistence activities can be handled in several different ways in the GDP accounts. They may be excluded altogether as is the case in the United States. If they are included, there may be differences in the types of activities included. For those included activities, valuation may be done by comparison of the outputs to similar outputs that have market prices (replacement value), by valuing the outputs at the cost of the inputs, or by some other method of imputing a value to the activity.
5. Price Variation—Small, remote regional economies may be dominated by a limited number of primary commodity-producing industries. The value added in the production of those commodities can be quite volatile from year-to-year because of volatility in their market prices. The Alaska GDP is heavily influenced by the importance of oil production, and much of the change in GDP from year-to-year is a result of the change in the price of oil rather than any change in the physical output of the economy. This volatility means that comparisons with other regions are sensitive to the
year in which the comparison is made. A comparison when the price of oil is high will indicate a larger Alaska economy relative to other locations than would be the case of a comparison when the price of oil is low. 6. Data Collection Difficulties—The small size of regional economies results in
less precision in estimates of GDP based on sampling (due to sampling error). Remoteness can also contribute to imprecision due to the challenges of data collection associated with travel, weather, and other variables.

Structural Analysis of the Alaska Economy ___________________________________________________________________ Appendix A
March 2010 Institute of Social and Economic Research, UAA Page 140