
Understanding Orlando's Tech Economy
8
301 E. Pine Street, Suite 900 // Orlando, FL 32801 // P/ 407.422.7159 // orlandoedc.com Orlando Insight is a publication of the Orlando Economic Forum, an initiative of the Orlando Economic Development Commission (EDC). Comprised of local industry leaders, the Forum meets quarterly to discuss both current economic conditions and issues of regional significance in the four-county Orlando Metropolitan Statistical Area (MSA). Orlando Insight reflects those discussions and draws from the most recent data available at time of preparation. Understanding Orlando’s Tech Economy Technology has long been a crucial part of Orlando’s overall economic development strategy. The region’s tech economy actually predates the tourism industry when Lockheed Martin and other major defense contractors established a presence in the region to support the space race in the mid-1950s. Over the years as technology evolved, the sector grew to include many different industries. This has made it difficult to properly quantify the size and reach of the entire breadth of the tech sector. The EDC recently documented a regional economic contribution of $22 billion but questions remain regarding the sector’s overall reach and influence. A New Approach Any analysis of Orlando’s tech economy requires a full accounting of the area’s tech ecosystem. Traditionally, data has been generated based on a determination of those industries whose output may be considered ‘tech’ in nature. However, an industry-focused definition fails to capture the cross-cutting economic contributions of a functional role whose success permits the broad growth of many industries. Tech is no longer the product of a few select industries but a skill-set woven throughout the economy and embedded in tech and non- tech companies alike. Total employment in the Orlando economy is thus not limited to tech firms. Rather, it is spread across three domains: tech jobs in tech industries, non-tech jobs in tech industries and tech jobs in non-tech industries. A web developer in a large corporate environment is no less tech-oriented than a web developer in a digital media startup. Approximately 80,000 jobs in Orlando, or seven percent of the 1.2 million people working within the region, are enabled by, produce, or facilitate technology. That number includes 34,000 jobs outside of traditional ‘tech’ industries and exceeds total employment at the United States’ largest single-site employer, Walt Disney World Resort. If taking a less conservative approach, including more occupations would likely see the number swell closer to 100,000. “We are living in a technology-driven world that continues to shift, evolve, and innovate at a rapid pace. Orlando is now part of this global conversation as our technical environment and start-up culture continues to expand and grow – moving from an awkward adolescence to a key contributor in the shift to a knowledge economy.” –– Daryl Holt Vice President and Group COO Electronic Arts (EA Studios) 19,000 (24%) 27,000 (34%) 34,000 (42%) Tech Jobs in Tech Industries Example: Programmer at EA Non-Tech Jobs in Tech Industries Example: Sales Rep at Lockheed Martin ORLANDO TECH ECONOMY 80,000 JOBS Tech Jobs in Non-Tech Industries Example: Web Developer at SunTrust
-
Upload
duonghuong -
Category
Documents
-
view
218 -
download
0
Transcript of Understanding Orlando's Tech Economy
301 E. Pine Street, Suite 900 // Orlando, FL 32801 // P/ 407.422.7159 // orlandoedc.com
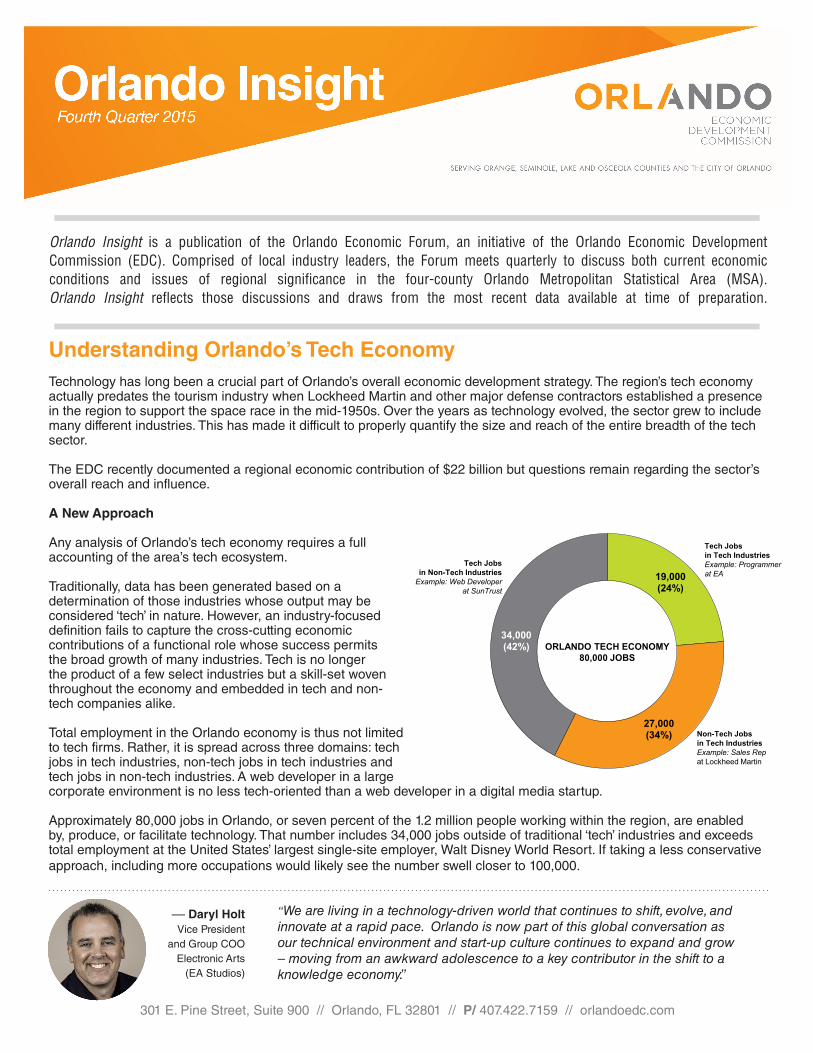
Orlando Insight is a publication of the Orlando Economic Forum, an initiative of the Orlando Economic Development Commission (EDC). Comprised of local industry leaders, the Forum meets quarterly to discuss both current economic conditions and issues of regional significance in the four-county Orlando Metropolitan Statistical Area (MSA). Orlando Insight reflects those discussions and draws from the most recent data available at time of preparation.
Understanding Orlando’s Tech EconomyTechnology has long been a crucial part of Orlando’s overall economic development strategy. The region’s tech economy actually predates the tourism industry when Lockheed Martin and other major defense contractors established a presence in the region to support the space race in the mid-1950s. Over the years as technology evolved, the sector grew to include many different industries. This has made it difficult to properly quantify the size and reach of the entire breadth of the tech sector. The EDC recently documented a regional economic contribution of $22 billion but questions remain regarding the sector’s overall reach and influence.
A New Approach
Any analysis of Orlando’s tech economy requires a full accounting of the area’s tech ecosystem.
Traditionally, data has been generated based on a determination of those industries whose output may be considered ‘tech’ in nature. However, an industry-focused definition fails to capture the cross-cutting economic contributions of a functional role whose success permits the broad growth of many industries. Tech is no longer the product of a few select industries but a skill-set woven throughout the economy and embedded in tech and non-tech companies alike.
Total employment in the Orlando economy is thus not limited to tech firms. Rather, it is spread across three domains: tech jobs in tech industries, non-tech jobs in tech industries and tech jobs in non-tech industries. A web developer in a large corporate environment is no less tech-oriented than a web developer in a digital media startup.
Approximately 80,000 jobs in Orlando, or seven percent of the 1.2 million people working within the region, are enabled by, produce, or facilitate technology. That number includes 34,000 jobs outside of traditional ‘tech’ industries and exceeds total employment at the United States’ largest single-site employer, Walt Disney World Resort. If taking a less conservative approach, including more occupations would likely see the number swell closer to 100,000.
“We are living in a technology-driven world that continues to shift, evolve, and innovate at a rapid pace. Orlando is now part of this global conversation as our technical environment and start-up culture continues to expand and grow – moving from an awkward adolescence to a key contributor in the shift to a knowledge economy.”
–– Daryl HoltVice President
and Group COO Electronic Arts
(EA Studios)
19,000(24%)
27,000(34%)
34,000(42%)
Tech Jobsin Tech IndustriesExample: Programmerat EA
Non-Tech Jobsin Tech IndustriesExample: Sales Repat Lockheed Martin
ORLANDO TECH ECONOMY80,000 JOBS
Tech Jobsin Non-Tech Industries
Example: Web Developerat SunTrust
“Orlando’s innovation economy is alive and well. Through visionary leadership and community collaborators, Central Florida
has created a dynamic environment for innovation which drives opportunities throughout our region for small businesses and
entrepreneurs alike.”
Expect the 80,000 to also grow. Over the last decade, employment in the Orlando tech economy expanded by almost 10,000 jobs, growing at a faster rate (13 percent) than both total Orlando (12 percent) and total U.S. employment (5 percent). Those statistics gloss over a recession whose impact on tech workers was relatively minimal and a subsequent recovery in which the tech economy’s acceleration has outperformed almost all others.
Expansion of the region’s tech employment aligns perfectly with Orlando’s high-skill / high-wage strategy. Nearly three-quarters of local tech jobs are in high-wage sectors. That includes 28,000 in the business services sector (15 percent of all employment, $62,053 average annual wage) and 10,000 in manufacturing (25 percent of all employment, $58,247 average annual wage).
Generating Opportunity For All
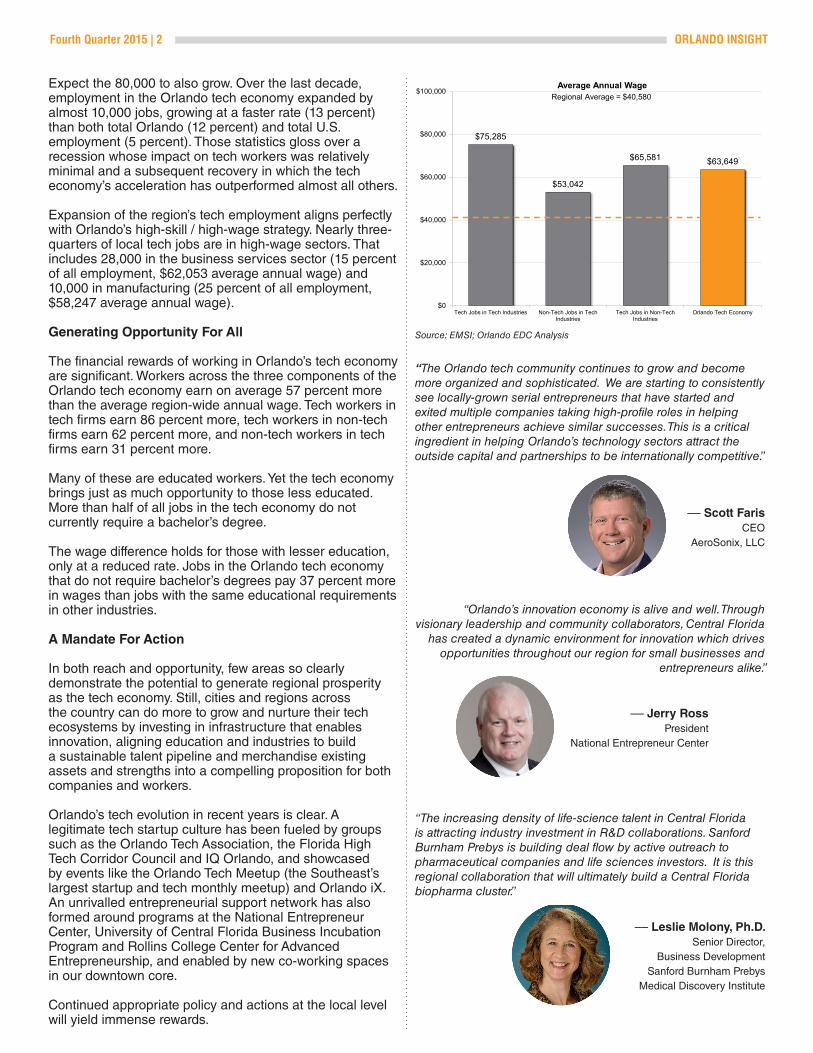
The financial rewards of working in Orlando’s tech economy are significant. Workers across the three components of the Orlando tech economy earn on average 57 percent more than the average region-wide annual wage. Tech workers in tech firms earn 86 percent more, tech workers in non-tech firms earn 62 percent more, and non-tech workers in tech firms earn 31 percent more.
Many of these are educated workers. Yet the tech economy brings just as much opportunity to those less educated. More than half of all jobs in the tech economy do not currently require a bachelor’s degree.
The wage difference holds for those with lesser education, only at a reduced rate. Jobs in the Orlando tech economy that do not require bachelor’s degrees pay 37 percent more in wages than jobs with the same educational requirements in other industries.
A Mandate For Action
In both reach and opportunity, few areas so clearly demonstrate the potential to generate regional prosperity as the tech economy. Still, cities and regions across the country can do more to grow and nurture their tech ecosystems by investing in infrastructure that enables innovation, aligning education and industries to build a sustainable talent pipeline and merchandise existing assets and strengths into a compelling proposition for both companies and workers.
Orlando’s tech evolution in recent years is clear. A legitimate tech startup culture has been fueled by groups such as the Orlando Tech Association, the Florida High Tech Corridor Council and IQ Orlando, and showcased by events like the Orlando Tech Meetup (the Southeast’s largest startup and tech monthly meetup) and Orlando iX. An unrivalled entrepreneurial support network has also formed around programs at the National Entrepreneur Center, University of Central Florida Business Incubation Program and Rollins College Center for Advanced Entrepreneurship, and enabled by new co-working spaces in our downtown core.
Continued appropriate policy and actions at the local level will yield immense rewards.
“The Orlando tech community continues to grow and become more organized and sophisticated. We are starting to consistently see locally-grown serial entrepreneurs that have started and exited multiple companies taking high-profile roles in helping other entrepreneurs achieve similar successes. This is a critical ingredient in helping Orlando’s technology sectors attract the outside capital and partnerships to be internationally competitive.”
Fourth Quarter 2015 | 2 ORLANDO INSIGHT
Source: EMSI; Orlando EDC Analysis
–– Scott FarisCEO
AeroSonix, LLC
–– Jerry RossPresident
National Entrepreneur Center
“The increasing density of life-science talent in Central Florida is attracting industry investment in R&D collaborations. Sanford Burnham Prebys is building deal flow by active outreach to pharmaceutical companies and life sciences investors. It is this regional collaboration that will ultimately build a Central Florida biopharma cluster.”
–– Leslie Molony, Ph.D. Senior Director,
Business Development Sanford Burnham Prebys
Medical Discovery Institute
$75,285
$53,042
$65,581 $63,649
$0
$20,000
$40,000
$60,000
$80,000
$100,000
Tech Jobs in Tech Industries Non-Tech Jobs in TechIndustries
Tech Jobs in Non-TechIndustries
Orlando Tech Economy
Average Annual WageRegional Average = $40,580
Around the Region
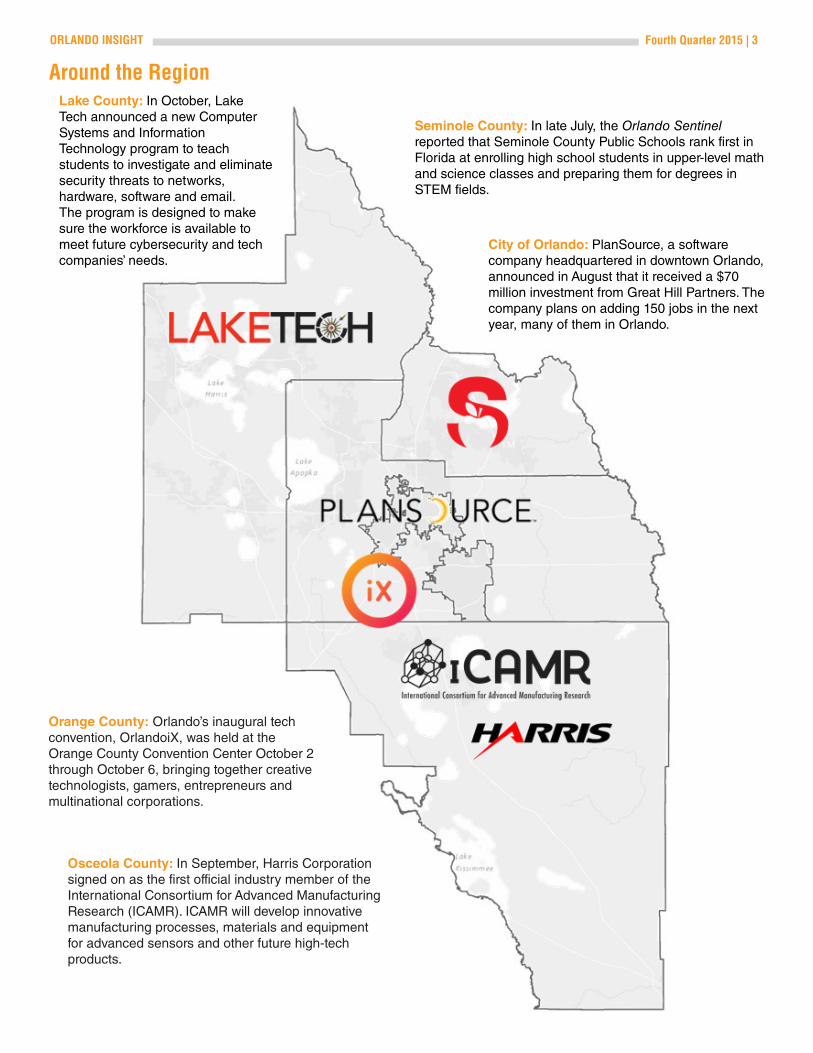
Osceola County: In September, Harris Corporation signed on as the first official industry member of the International Consortium for Advanced Manufacturing Research (ICAMR). ICAMR will develop innovative manufacturing processes, materials and equipment for advanced sensors and other future high-tech products.
Orange County: Orlando’s inaugural tech convention, OrlandoiX, was held at the Orange County Convention Center October 2 through October 6, bringing together creative technologists, gamers, entrepreneurs and multinational corporations.
City of Orlando: PlanSource, a software company headquartered in downtown Orlando, announced in August that it received a $70 million investment from Great Hill Partners. The company plans on adding 150 jobs in the next year, many of them in Orlando.
Seminole County: In late July, the Orlando Sentinel reported that Seminole County Public Schools rank first in Florida at enrolling high school students in upper-level math and science classes and preparing them for degrees in STEM fields.
Lake County: In October, Lake Tech announced a new Computer Systems and Information Technology program to teach students to investigate and eliminate security threats to networks, hardware, software and email. The program is designed to make sure the workforce is available to meet future cybersecurity and tech companies’ needs.
ORLANDO INSIGHT Fourth Quarter 2015 | 3

Labor Market
Labor Force1,231,667
Unemployment Rate4.8%
Initial Claims2,627
New Job Postings27,266
Arrows indicate change from previous year. Data for September 2015 unless otherwise specified.
• Unemployment closed the third quarter of 2015 at 4.8 percent, a decrease of one full percentage point from one year earlier and marginally lower than the national rate of 4.9 percent. Of the four counties in the region, Lake County has seen the greatest decline over the period.
Fourth Quarter 2015 | 4 ORLANDO INSIGHT
Source: U.S. Department of Labor, Bureau of Labor Statistics
Source: The Conference Board, Help Wanted OnLine; prepared by the Florida Department of Economic Opportunity
Source: Florida Department of Economic Opportunity
• Area companies with the most new online job postings for STEM occupations reflect both the emergence of Orlando’s tech economy and the region’s longtime economic structure. Newcomer Deloitte Consulting is joined by companies in the area’s dominant healthcare and tourism industries.
• The upward wage pressure seen earlier in the recovery has largely abated, despite continued reduction in the unemployed. Average weekly earnings of $806 in September 2015 were nominally smaller than in September 2014.
5.1%
4.7%
5.5%
4.6%
6.3%
5.7%
6.6%
5.5%
2% 4% 6% 8%
Lake
Orange
Osceola
Seminole
Orlando MSA County Unemployment RatesSeptember 2015, Not Seasonally Adjusted
Sep-15
Sep-14
ORLANDO MSA: 4.8%
“The EDC’s project pipeline has swelled over the last few months. That’s partly the result of an improving economy but also an endorsement of the region’s growing talent base and branding efforts.”
–– Dave Porter, CEcD Senior Vice President,
Business Development Orlando Economic
Development Commission
$700
$750
$800
$850
2
4
6
8
10
12
2011 2012 2013 2014 2015
Unemployment Rate vs. Average Weekly Earnings, Orlando MSAThrough September 2015
Unemployment Rate (%, left axis)
Average Weekly Earnings ($, right axis, 3-MMA)
Company Number
Florida Hospital 512
The Walt Disney Company 247
Nemours 186
Oracle 183
Deloitte 139
HCA – The Healthcare Company 134
NBC Universal 121
Lockheed Martin 114
Top Employers by Online STEM Job Ads, Orlando MSASeptember 2015
Payroll Employment / Consumer Spending
Total PayrollEmployment1,155,600
Business ServicesEmployment189,700
ConstructionEmployment59,800
ManufacturingEmployment40,000
Taxable Sales$5.2 billion(July 2015)
Index of Retail Activity175.5(July 2015)
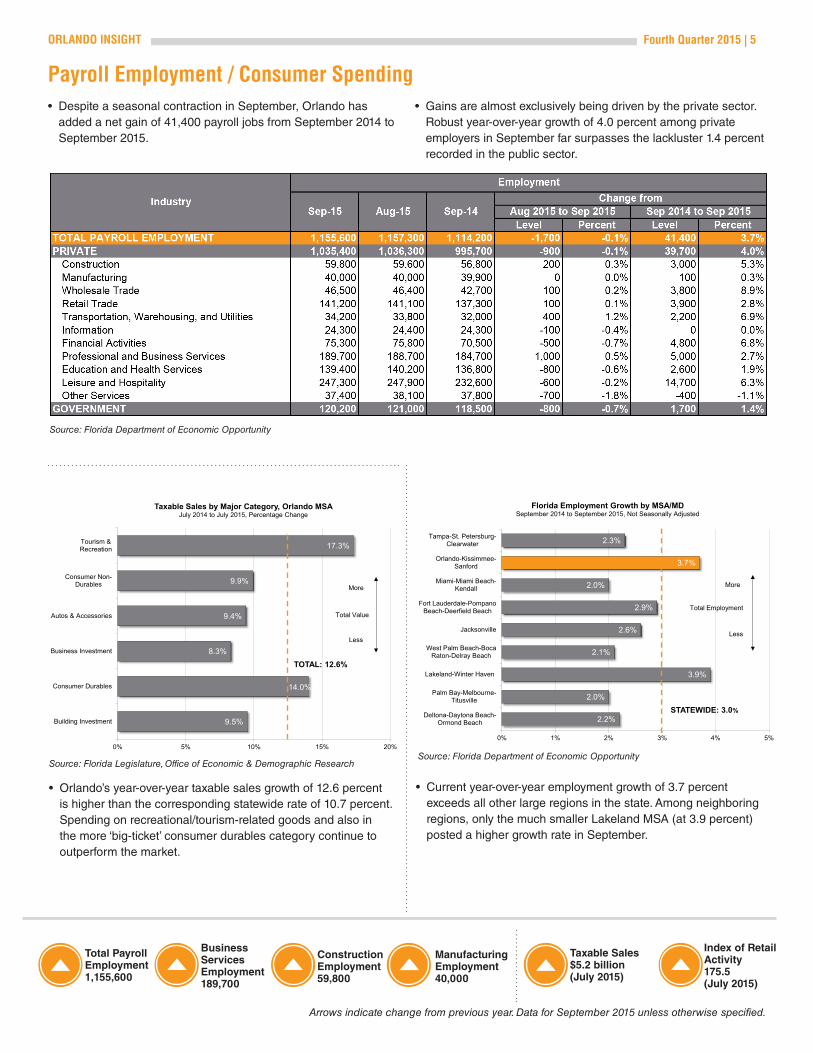
• Despite a seasonal contraction in September, Orlando has added a net gain of 41,400 payroll jobs from September 2014 to September 2015.
Arrows indicate change from previous year. Data for September 2015 unless otherwise specified.
ORLANDO INSIGHT Fourth Quarter 2015 | 5
Source: Florida Legislature, Office of Economic & Demographic Research
• Current year-over-year employment growth of 3.7 percent exceeds all other large regions in the state. Among neighboring regions, only the much smaller Lakeland MSA (at 3.9 percent) posted a higher growth rate in September.
Source: Florida Department of Economic Opportunity
2.2%
2.0%
3.9%
2.1%
2.6%
2.9%
2.0%
3.7%
2.3%
0% 1% 2% 3% 4% 5%
Deltona-Daytona Beach-Ormond Beach
Palm Bay-Melbourne-Titusville
Lakeland-Winter Haven
West Palm Beach-BocaRaton-Delray Beach
Jacksonville
Fort Lauderdale-PompanoBeach-Deerfield Beach
Miami-Miami Beach-Kendall
Orlando-Kissimmee-Sanford
Tampa-St. Petersburg-Clearwater
Florida Employment Growth by MSA/MDSeptember 2014 to September 2015, Not Seasonally Adjusted
More
Total Employment
Less
STATEWIDE: 3.0%9.5%
14.0%
8.3%
9.4%
9.9%
17.3%
0% 5% 10% 15% 20%
Building Investment
Consumer Durables
Business Investment
Autos & Accessories
Consumer Non-Durables
Tourism &Recreation
Taxable Sales by Major Category, Orlando MSAJuly 2014 to July 2015, Percentage Change
More
Total Value
Less
TOTAL: 12.6%
• Orlando’s year-over-year taxable sales growth of 12.6 percent is higher than the corresponding statewide rate of 10.7 percent. Spending on recreational/tourism-related goods and also in the more ‘big-ticket’ consumer durables category continue to outperform the market.
• Gains are almost exclusively being driven by the private sector. Robust year-over-year growth of 4.0 percent among private employers in September far surpasses the lackluster 1.4 percent recorded in the public sector.
Source: Florida Department of Economic Opportunity
Commercial / Residential Real Estate
Office Vacancy16.0%(Q3 2015)
Office Asking Rate$20.20(Q3 2015)
Industrial Vacancy9.2%(Q3 2015)
Industrial Asking Rate$5.47(Q3 2015)
Existing Home Sales2,857
Median Home Price$182,000
Arrows indicate change from previous year. Data for September 2015 unless otherwise specified.
Fourth Quarter 2015 | 6 ORLANDO INSIGHT
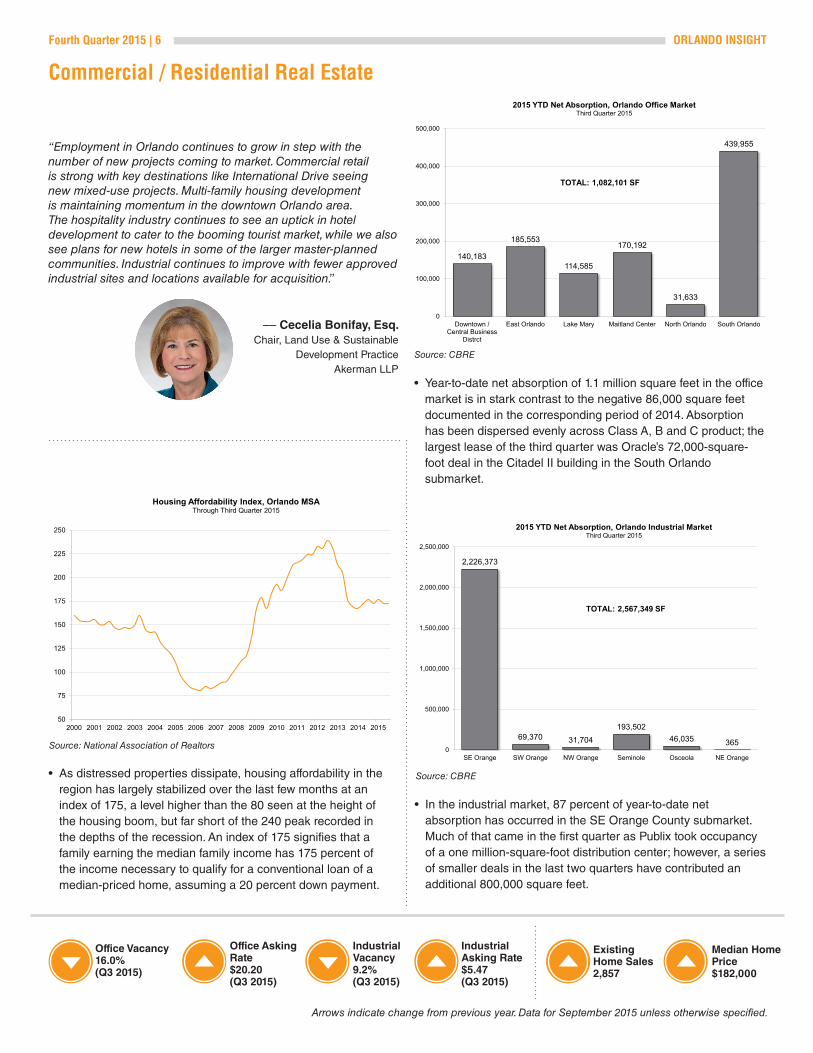
• Year-to-date net absorption of 1.1 million square feet in the office market is in stark contrast to the negative 86,000 square feet documented in the corresponding period of 2014. Absorption has been dispersed evenly across Class A, B and C product; the largest lease of the third quarter was Oracle’s 72,000-square-foot deal in the Citadel II building in the South Orlando submarket.
Source: CBRE
140,183
185,553
114,585
170,192
31,633
439,955
0
100,000
200,000
300,000
400,000
500,000
Downtown /Central Business
Distrct
East Orlando Lake Mary Maitland Center North Orlando South Orlando
2015 YTD Net Absorption, Orlando Office MarketThird Quarter 2015
TOTAL: 1,082,101 SF
• In the industrial market, 87 percent of year-to-date net absorption has occurred in the SE Orange County submarket. Much of that came in the first quarter as Publix took occupancy of a one million-square-foot distribution center; however, a series of smaller deals in the last two quarters have contributed an additional 800,000 square feet.
2,226,373
69,370 31,704193,502
46,035 3650
500,000
1,000,000
1,500,000
2,000,000
2,500,000
SE Orange SW Orange NW Orange Seminole Osceola NE Orange
2015 YTD Net Absorption, Orlando Industrial MarketThird Quarter 2015
TOTAL: 2,567,349 SF
Source: CBRE• As distressed properties dissipate, housing affordability in the region has largely stabilized over the last few months at an index of 175, a level higher than the 80 seen at the height of the housing boom, but far short of the 240 peak recorded in the depths of the recession. An index of 175 signifies that a family earning the median family income has 175 percent of the income necessary to qualify for a conventional loan of a median-priced home, assuming a 20 percent down payment.
Source: National Association of Realtors
50
75
100
125
150
175
200
225
250
2000 2001 2002 2003 2004 2005 2006 2007 2008 2009 2010 2011 2012 2013 2014 2015
Housing Affordability Index, Orlando MSAThrough Third Quarter 2015
“Employment in Orlando continues to grow in step with the number of new projects coming to market. Commercial retail is strong with key destinations like International Drive seeing new mixed-use projects. Multi-family housing development is maintaining momentum in the downtown Orlando area.The hospitality industry continues to see an uptick in hotel development to cater to the booming tourist market, while we also see plans for new hotels in some of the larger master-planned communities. Industrial continues to improve with fewer approved industrial sites and locations available for acquisition.”
–– Cecelia Bonifay, Esq. Chair, Land Use & Sustainable
Development Practice Akerman LLP
Transportation / Visitor Industry
Orlando InternationalPassengers3,211,431 (August 2015)
Orlando Sanford InternationalPassengers140,506
Hotel Occupancy62.8%
Average Daily Rate$92.59
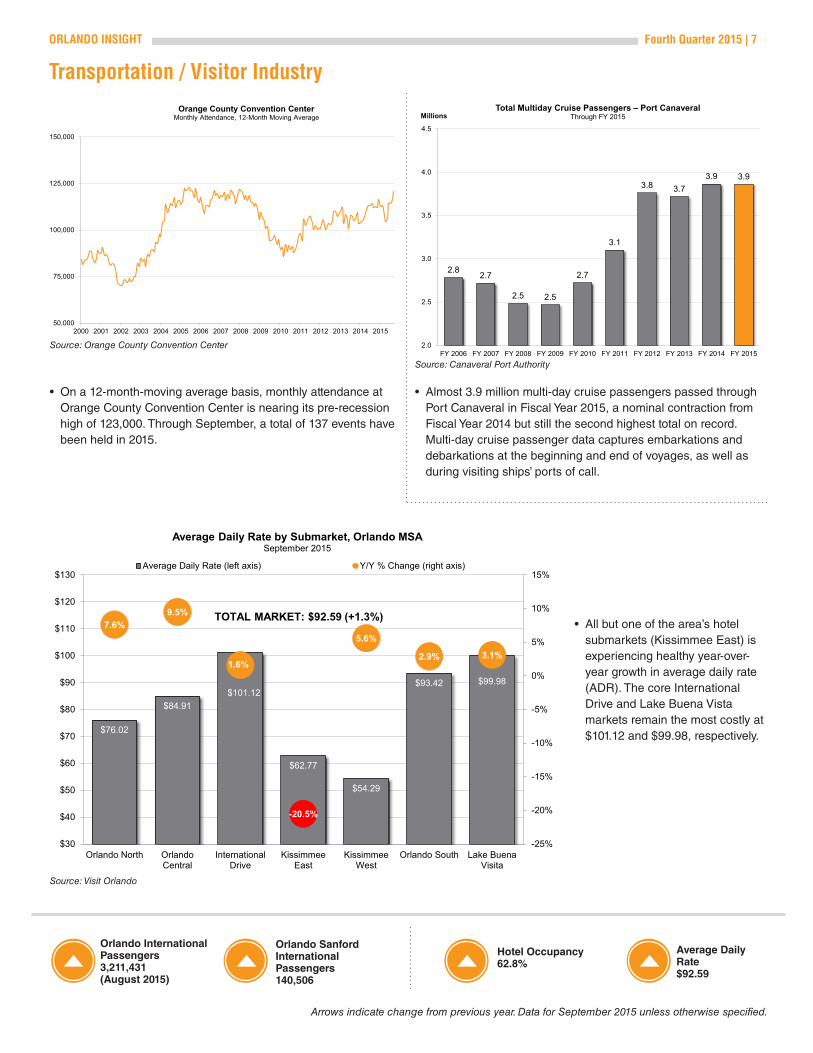
• On a 12-month-moving average basis, monthly attendance at Orange County Convention Center is nearing its pre-recession high of 123,000. Through September, a total of 137 events have been held in 2015.
Arrows indicate change from previous year. Data for September 2015 unless otherwise specified.
ORLANDO INSIGHT Fourth Quarter 2015 | 7
Source: Orange County Convention Center
Source: Visit Orlando
50,000
75,000
100,000
125,000
150,000
2000 2001 2002 2003 2004 2005 2006 2007 2008 2009 2010 2011 2012 2013 2014 2015
Orange County Convention CenterMonthly Attendance, 12-Month Moving Average
$76.02
$84.91$101.12
$62.77
$54.29
$93.42 $99.98
7.6%9.5%
1.6%
-20.5%
5.6%
2.9% 3.1%
-25%
-20%
-15%
-10%
-5%
0%
5%
10%
15%
$30
$40
$50
$60
$70
$80
$90
$100
$110
$120
$130
Orlando North OrlandoCentral
InternationalDrive
KissimmeeEast
KissimmeeWest
Orlando South Lake BuenaVisita
Average Daily Rate by Submarket, Orlando MSASeptember 2015
Average Daily Rate (left axis) Y/Y % Change (right axis)
TOTAL MARKET: $92.59 (+1.3%)• All but one of the area’s hotel
submarkets (Kissimmee East) is experiencing healthy year-over-year growth in average daily rate (ADR). The core International Drive and Lake Buena Vista markets remain the most costly at $101.12 and $99.98, respectively.
• Almost 3.9 million multi-day cruise passengers passed through Port Canaveral in Fiscal Year 2015, a nominal contraction from Fiscal Year 2014 but still the second highest total on record. Multi-day cruise passenger data captures embarkations and debarkations at the beginning and end of voyages, as well as during visiting ships’ ports of call.
2.8 2.7
2.5 2.5
2.7
3.1
3.8 3.73.9 3.9
2.0
2.5
3.0
3.5
4.0
4.5
FY 2006 FY 2007 FY 2008 FY 2009 FY 2010 FY 2011 FY 2012 FY 2013 FY 2014 FY 2015
MillionsTotal Multiday Cruise Passengers – Port Canaveral
Through FY 2015
Source: Canaveral Port Authority
301 E. Pine Street, Suite 900 // Orlando, FL 32801 // P/ 407.422.7159 // orlandoedc.com
ABOUT THE EDCThe Orlando Economic Development Commission (EDC) is a not-for-profit, public-private partnership that works to aggressively attract, retain and grow jobs for the Orlando region while advocating, championing and educating in support of efforts to improve competitive position. The EDC serves Orange, Seminole, Lake and Osceola counties and the City of Orlando in Florida.
For more information, contact:
NEIL HAMILTONDirector, Business Intelligence [email protected]
Orlando Economic Forum
ELIZABETH RAMIREZAssociate Director, Business Intelligence [email protected]
Kimberly MakiBright House Networks
Leslie Molony, Ph.D.Sanford Burnham Prebys Medical Discovery Institute
Bill MossCBRE Co-Chair, EDC Business Development Committee
Pamela NaborsCareerSource Central Florida
Bob ProvitolaMitsubishi Hitachi Power Systems Americas, Inc.Chair, Manufacturers Association of Central Florida
Jon RambeauLockheed Martin Training and Logistics Solutions (TLS)
Jerry RossNational Entrepreneur Center
Thomas K. SittemaCNL Financial GroupPast Chair, Orlando EDC
Jacob StuartCentral Florida Partnership
Rasesh ThakkarTavistock Group
Rick WeddleOrlando EDC
Vickie WhiteFlorida Hospital
CHAIRSean Snaith, Ph.D.University of Central Florida
MEMBERSThomas Baptiste, Lt. Gen., USAF (Ret.)National Center for Simulation
Cecelia BonifayAkerman, LLPChair, EDC Economic Strategy Committee
Phillip BrownGreater Orlando Aviation Authority
Bill MartinGreater Osceola Partnership for Economic ProsperityChair, Regional Economic Developers (RED) Team
Orlando EvoraGreenberg Traurig, LLP
Scott FarisAeroSonix, Inc.
David FullerSunTrust Foundation Chair, Orlando EDC
Larry HenrichsVisit Orlando
Daryl Holt Electronic Arts (EA Studios)
Steven JamiesonThe Mall at Millenia
Tony JenkinsFlorida Blue