Trade liberalisation and economic restructuring
25
Trade Liberalisation and Economic Restructuring: Can India skip the Industrial Phase? Jayati Ghosh 1 Paper for IDEAs Conference on Post Liberalisation Constraints on Macroeconomic Policies Muttukadu, 27-29 January 2006 Economic integration through trade and investment has now become the dominant development strategy in the world, and a similar strategy has been pursued by India for the last one and a half decades. The explicit goals of the economic reform strategy in India after 1991 with respect to the external sector, were to create a major shift in the momentum of export growth, and to attract very large inflows of foreign capital (particularly in the form of export-oriented FDI) to augment domestic savings and therefore allow much higher rates of gross domestic investment. However, it can be argued (Chandrasekhar and Ghosh, 2004) that in actual fact, the reform process has accomplished neither of these objectives. Rather, it has involved rates of export expansion more or less similar to those of the past, with the exception of the services sector. Meanwhile, it has reduced the viability of cultivation by exposing domestic farmers to very volatile international prices. The potential (and in some cases actual) threat of greater import penetration in manufacturing has reduced manufacturing investment and put particular pressure on employment-intensive small-scale industries. At the same time, financial liberalisation measures have created a much bigger space for volatile short term capital inflows without causing increases in aggregate investment rates. In this paper, the nature and implications of trade liberalisation for the Indian economy are examined in more detail. The first section describes the broad pattern and macroeconomic effects of trade liberalisation. In the second section, the implications for agriculture are considered; while the third section takes up the experience of industry. While the effects of trade liberalisation on the material producing sectors are now acknowledged to have been adverse, it is increasingly common to hear the argument that this does not matter so much because India can benefit from its revealed comparative advantage in tradeable services. This issue is examined in the fourth section. 1 This paper incorporates work done in collaboration with C. P. Chandrasekhar, and reflects continuous discussion with Abhijit Sen and Prabhat Patnaik.
Transcript of Trade liberalisation and economic restructuring
Trade Liberalisation and Economic Restructuring: Can India skip the Industrial Phase?
Jayati Ghosh1
Paper for IDEAs Conference on
Post Liberalisation Constraints on Macroeconomic Policies Muttukadu, 27-29 January 2006
Economic integration through trade and investment has now become the dominant development strategy in the world, and a similar strategy has been pursued by India for the last one and a half decades. The explicit goals of the economic reform strategy in India after 1991 with respect to the external sector, were to create a major shift in the momentum of export growth, and to attract very large inflows of foreign capital (particularly in the form of export-oriented FDI) to augment domestic savings and therefore allow much higher rates of gross domestic investment. However, it can be argued (Chandrasekhar and Ghosh, 2004) that in actual fact, the reform process has accomplished neither of these objectives. Rather, it has involved rates of export expansion more or less similar to those of the past, with the exception of the services sector. Meanwhile, it has reduced the viability of cultivation by exposing domestic farmers to very volatile international prices. The potential (and in some cases actual) threat of greater import penetration in manufacturing has reduced manufacturing investment and put particular pressure on employment-intensive small-scale industries. At the same time, financial liberalisation measures have created a much bigger space for volatile short term capital inflows without causing increases in aggregate investment rates. In this paper, the nature and implications of trade liberalisation for the Indian economy are examined in more detail. The first section describes the broad pattern and macroeconomic effects of trade liberalisation. In the second section, the implications for agriculture are considered; while the third section takes up the experience of industry. While the effects of trade liberalisation on the material producing sectors are now acknowledged to have been adverse, it is increasingly common to hear the argument that this does not matter so much because India can benefit from its revealed comparative advantage in tradeable services. This issue is examined in the fourth section.
1 This paper incorporates work done in collaboration with C. P. Chandrasekhar, and reflects continuous discussion with Abhijit Sen and Prabhat Patnaik.
1
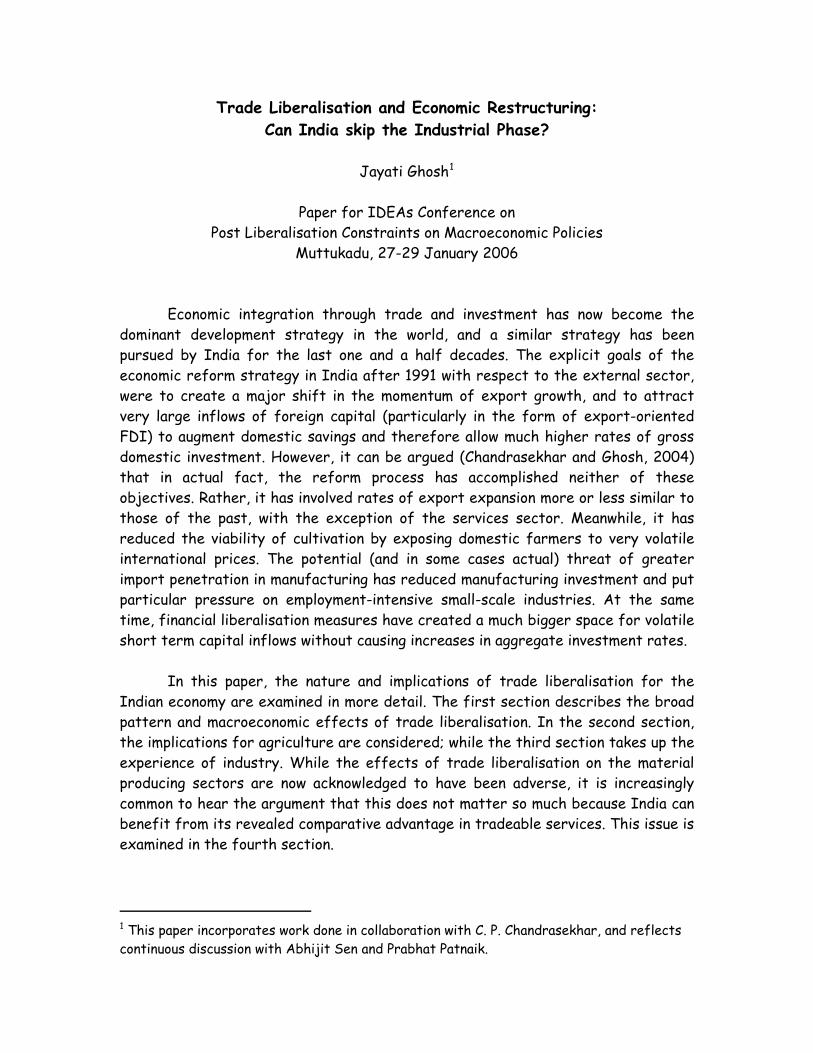
I. Trade liberalisation in India External trade liberalisation which marked a departure from the import substitution strategy began in the mid 1980s, but received a major impetus with the launch of the neoliberal “economic reform” strategy in 1991. While it occurred most significantly in the early 1990s, it was once again accelerated after 1998, when the BJP-led government acted aggressively in terms of opening up the economy to import penetration. Not only were import controls lifted and quantitative restrictions removed, but import tariffs were continuously lowered. In most cases these measures went well beyond the country’s commitments in this regard to the World Trade Organisation. Thus, despite tariff bindings of as much as 150 per cent in particular sectors, and average tariff bindings of around 80 to 100 per cent, the average rate of tariffs in the Indian economy in 2004 was only around 20 per cent. So a significant part of the growing competitive difficulties faced by domestic producers was the direct effect of trade policy chosen by the government.
Chart 1: Simple and weighted average import duty rates
Source: Mathur and Sachdeva, 2005
The shift from quantitative restrictions on imports to tariffs, and gradual reduction of tariffs, formed the basis of the change from the early 1990s. The changes were significant for manufacturing goods from the early 1990s; in agriculture the shift from quotas to tariffs reflected the requirements of WTO membership and occurred in the late 1990s. Chart 1 indicates the nature of reduction in import duties, which were down to an average of around 20 per cent by 20044-05. The decline in tariffs is also evident from Table 1, indicating the dispersion of import duties between 1991-92 and 2004-05.
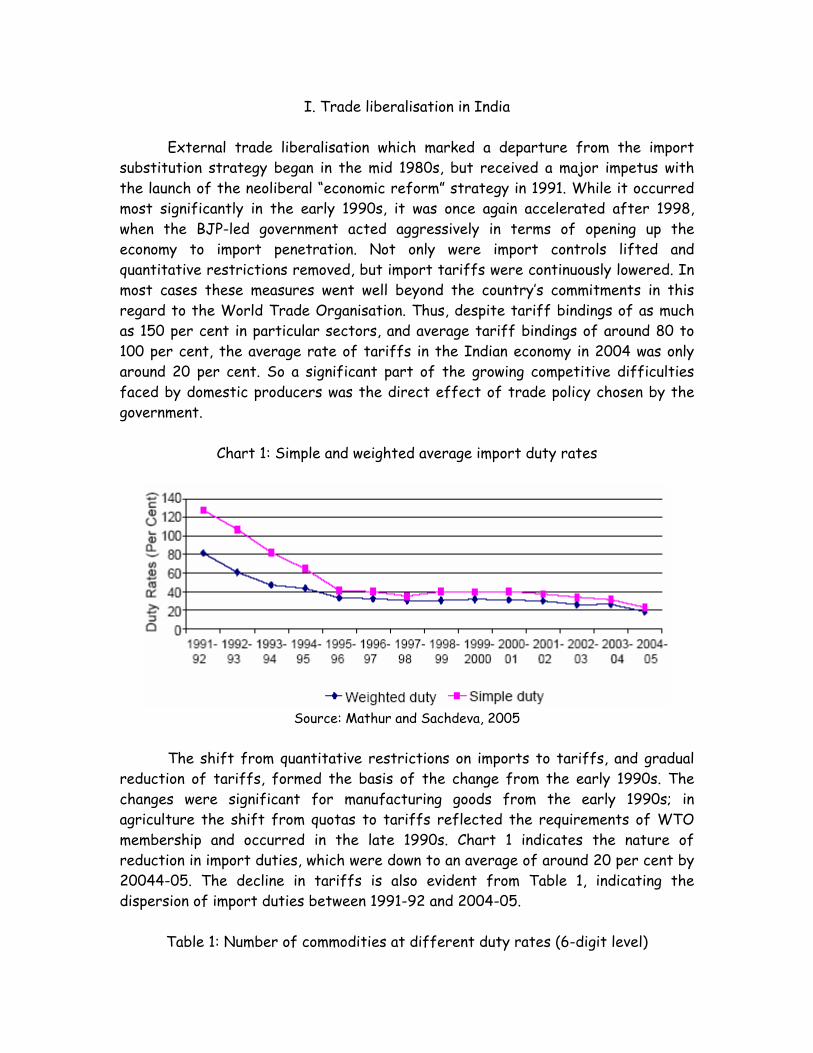
Table 1: Number of commodities at different duty rates (6-digit level)
2
Source: Mathur and Sachdeva, 2005
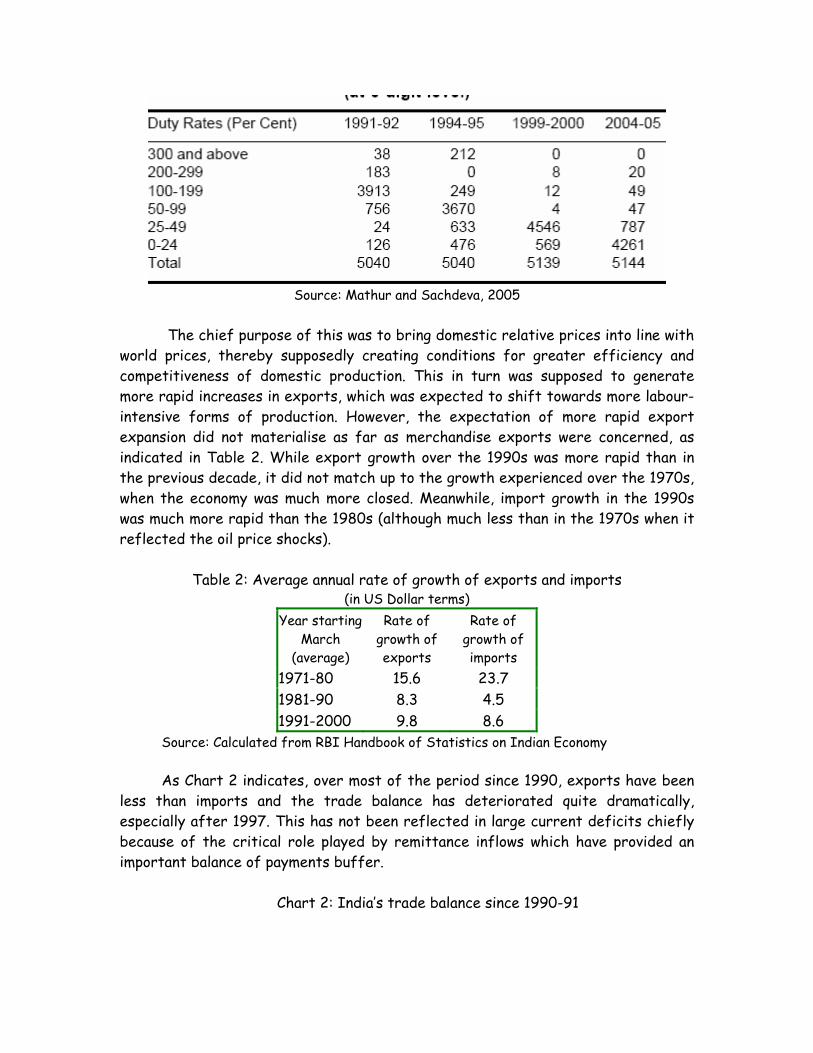
The chief purpose of this was to bring domestic relative prices into line with world prices, thereby supposedly creating conditions for greater efficiency and competitiveness of domestic production. This in turn was supposed to generate more rapid increases in exports, which was expected to shift towards more labour-intensive forms of production. However, the expectation of more rapid export expansion did not materialise as far as merchandise exports were concerned, as indicated in Table 2. While export growth over the 1990s was more rapid than in the previous decade, it did not match up to the growth experienced over the 1970s, when the economy was much more closed. Meanwhile, import growth in the 1990s was much more rapid than the 1980s (although much less than in the 1970s when it reflected the oil price shocks).
Table 2: Average annual rate of growth of exports and imports (in US Dollar terms)
Year starting March
(average)
Rate of growth of exports
Rate of growth of imports
1971-80 15.6 23.7 1981-90 8.3 4.5 1991-2000 9.8 8.6
Source: Calculated from RBI Handbook of Statistics on Indian Economy As Chart 2 indicates, over most of the period since 1990, exports have been
less than imports and the trade balance has deteriorated quite dramatically, especially after 1997. This has not been reflected in large current deficits chiefly because of the critical role played by remittance inflows which have provided an important balance of payments buffer.
Chart 2: India’s trade balance since 1990-91
3

Exports, imports and trade balance ($ mn)
0
10000
20000
30000
40000
50000
60000
70000
80000
90000
1990-91
1991-92
1992-93
1993-94
1994-95
1995-96
1996-97
1997-98
1998-99
1999-2000
2000-01
2001-02
2002-03
2003-04
-16000
-14000
-12000
-10000
-8000
-6000
-4000
-2000
0
Exports Imports Trade balance
This pattern also reflects a significant increase in volatility of Indian
exports, evident from Chart 3. This also brings out another important characteristic of Indian export behaviour, which is quite similar to a number of other developing countries in the recent past: the very strong inverse relationship between volume of exports and unit values, indicating that there is severe price competition in the export markets that are currently important for India.
4
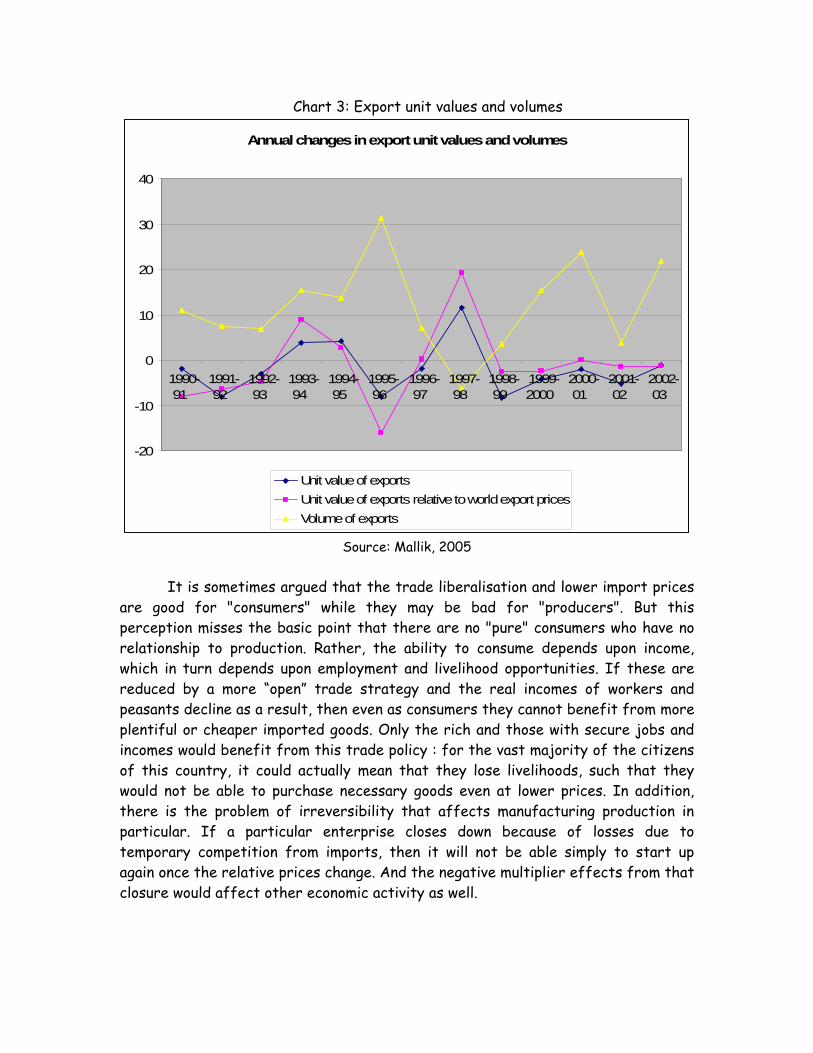
Chart 3: Export unit values and volumes
Annual changes in export unit values and volumes
-20
-10
0
10
20
30
40
1990-91
1991-92
1992-93
1993-94
1994-95
1995-96
1996-97
1997-98
1998-99
1999-2000
2000-01
2001-02
2002-03
Unit value of exportsUnit value of exports relative to world export pricesVolume of exports
Source: Mallik, 2005
It is sometimes argued that the trade liberalisation and lower import prices are good for "consumers" while they may be bad for "producers". But this perception misses the basic point that there are no "pure" consumers who have no relationship to production. Rather, the ability to consume depends upon income, which in turn depends upon employment and livelihood opportunities. If these are reduced by a more “open” trade strategy and the real incomes of workers and peasants decline as a result, then even as consumers they cannot benefit from more plentiful or cheaper imported goods. Only the rich and those with secure jobs and incomes would benefit from this trade policy : for the vast majority of the citizens of this country, it could actually mean that they lose livelihoods, such that they would not be able to purchase necessary goods even at lower prices. In addition, there is the problem of irreversibility that affects manufacturing production in particular. If a particular enterprise closes down because of losses due to temporary competition from imports, then it will not be able simply to start up again once the relative prices change. And the negative multiplier effects from that closure would affect other economic activity as well.
5
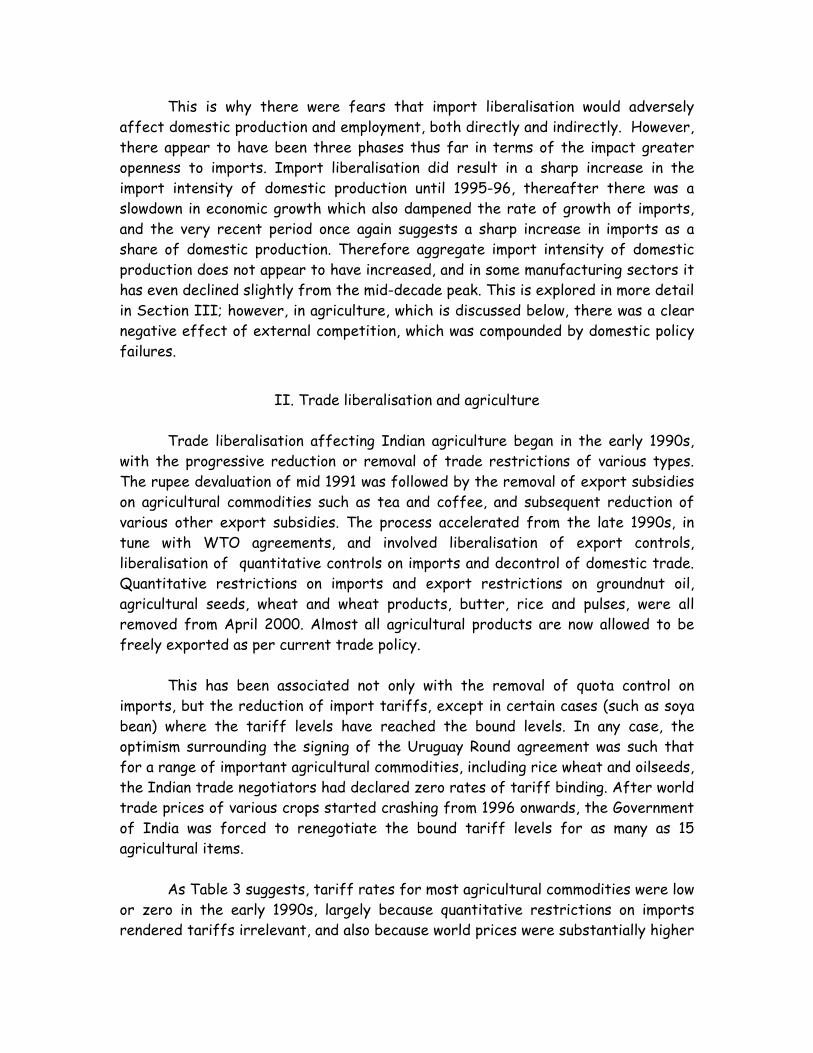
This is why there were fears that import liberalisation would adversely affect domestic production and employment, both directly and indirectly. However, there appear to have been three phases thus far in terms of the impact greater openness to imports. Import liberalisation did result in a sharp increase in the import intensity of domestic production until 1995-96, thereafter there was a slowdown in economic growth which also dampened the rate of growth of imports, and the very recent period once again suggests a sharp increase in imports as a share of domestic production. Therefore aggregate import intensity of domestic production does not appear to have increased, and in some manufacturing sectors it has even declined slightly from the mid-decade peak. This is explored in more detail in Section III; however, in agriculture, which is discussed below, there was a clear negative effect of external competition, which was compounded by domestic policy failures.
II. Trade liberalisation and agriculture
Trade liberalisation affecting Indian agriculture began in the early 1990s,
with the progressive reduction or removal of trade restrictions of various types. The rupee devaluation of mid 1991 was followed by the removal of export subsidies on agricultural commodities such as tea and coffee, and subsequent reduction of various other export subsidies. The process accelerated from the late 1990s, in tune with WTO agreements, and involved liberalisation of export controls, liberalisation of quantitative controls on imports and decontrol of domestic trade. Quantitative restrictions on imports and export restrictions on groundnut oil, agricultural seeds, wheat and wheat products, butter, rice and pulses, were all removed from April 2000. Almost all agricultural products are now allowed to be freely exported as per current trade policy.
This has been associated not only with the removal of quota control on
imports, but the reduction of import tariffs, except in certain cases (such as soya bean) where the tariff levels have reached the bound levels. In any case, the optimism surrounding the signing of the Uruguay Round agreement was such that for a range of important agricultural commodities, including rice wheat and oilseeds, the Indian trade negotiators had declared zero rates of tariff binding. After world trade prices of various crops started crashing from 1996 onwards, the Government of India was forced to renegotiate the bound tariff levels for as many as 15 agricultural items.
As Table 3 suggests, tariff rates for most agricultural commodities were low
or zero in the early 1990s, largely because quantitative restrictions on imports rendered tariffs irrelevant, and also because world prices were substantially higher
6
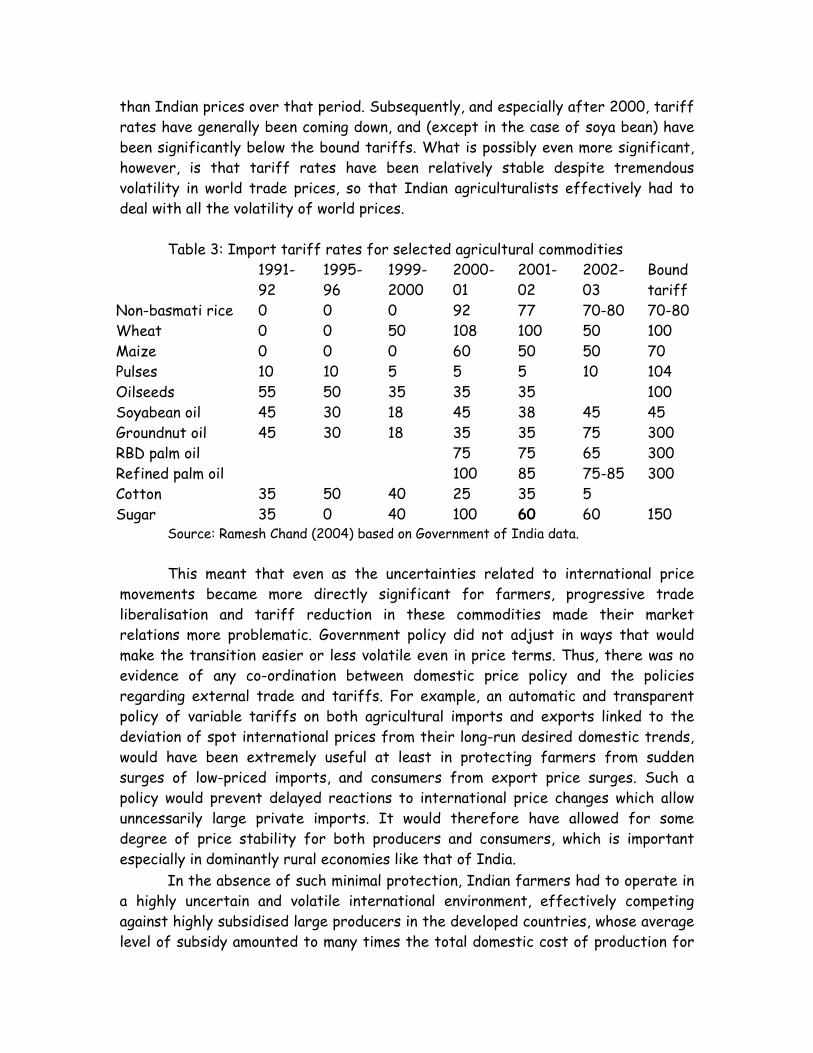
than Indian prices over that period. Subsequently, and especially after 2000, tariff rates have generally been coming down, and (except in the case of soya bean) have been significantly below the bound tariffs. What is possibly even more significant, however, is that tariff rates have been relatively stable despite tremendous volatility in world trade prices, so that Indian agriculturalists effectively had to deal with all the volatility of world prices.
Table 3: Import tariff rates for selected agricultural commodities
1991-92
1995-96
1999-2000
2000-01
2001-02
2002-03
Bound tariff
Non-basmati rice 0 0 0 92 77 70-80 70-80 Wheat 0 0 50 108 100 50 100 Maize 0 0 0 60 50 50 70 Pulses 10 10 5 5 5 10 104 Oilseeds 55 50 35 35 35 100 Soyabean oil 45 30 18 45 38 45 45 Groundnut oil 45 30 18 35 35 75 300 RBD palm oil 75 75 65 300 Refined palm oil 100 85 75-85 300 Cotton 35 50 40 25 35 5 Sugar 35 0 40 100 60 60 150
Source: Ramesh Chand (2004) based on Government of India data.
This meant that even as the uncertainties related to international price movements became more directly significant for farmers, progressive trade liberalisation and tariff reduction in these commodities made their market relations more problematic. Government policy did not adjust in ways that would make the transition easier or less volatile even in price terms. Thus, there was no evidence of any co-ordination between domestic price policy and the policies regarding external trade and tariffs. For example, an automatic and transparent policy of variable tariffs on both agricultural imports and exports linked to the deviation of spot international prices from their long-run desired domestic trends, would have been extremely useful at least in protecting farmers from sudden surges of low-priced imports, and consumers from export price surges. Such a policy would prevent delayed reactions to international price changes which allow unncessarily large private imports. It would therefore have allowed for some degree of price stability for both producers and consumers, which is important specially in dominantly rural economies like that of India. e
In the absence of such minimal protection, Indian farmers had to operate in a highly uncertain and volatile international environment, effectively competing against highly subsidised large producers in the developed countries, whose average level of subsidy amounted to many times the total domestic cost of production for
7
many crops. Also, the volatility of such prices – for example in cotton – has created uncertain and often misleading signals for farmers who respond by changing cropping patterns. It has directly affected cultivators of oilseeds such as soya bean and groundnut farmers due to palm oil imports. While there has been some diversification in crop production, the downside of this has been the reduction of production of traditional staple foodgrains and declining food consumption in rural areas.
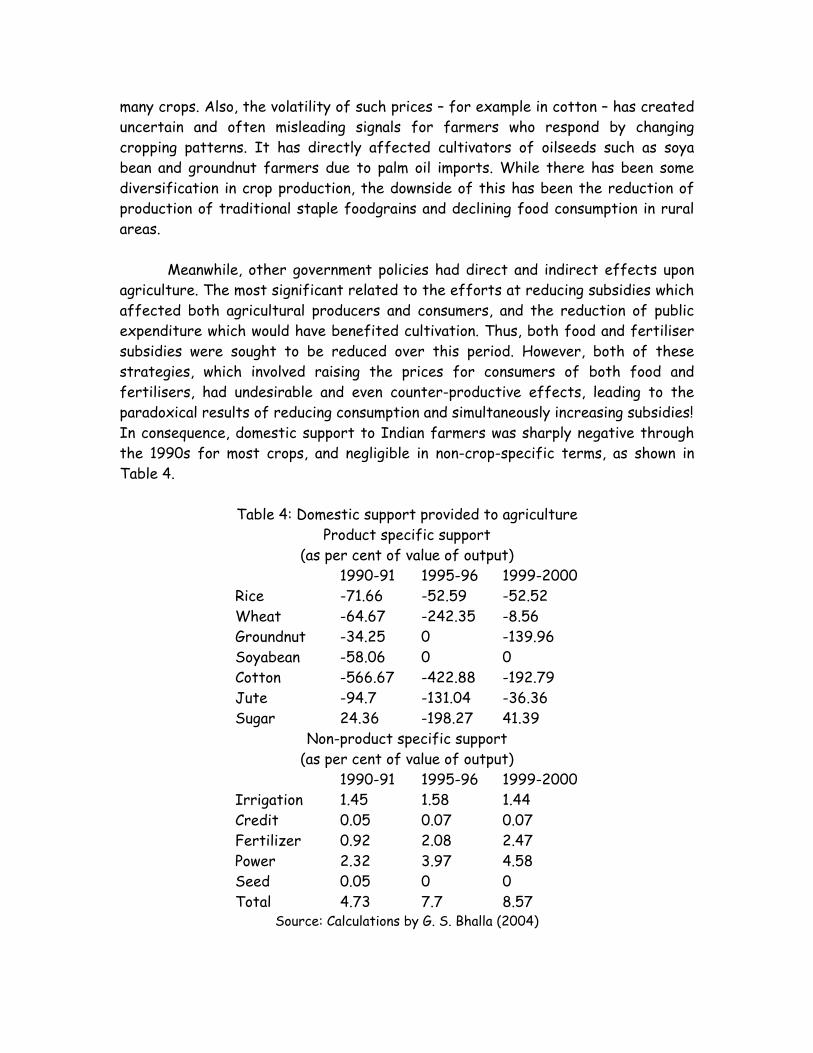
Meanwhile, other government policies had direct and indirect effects upon agriculture. The most significant related to the efforts at reducing subsidies which affected both agricultural producers and consumers, and the reduction of public expenditure which would have benefited cultivation. Thus, both food and fertiliser subsidies were sought to be reduced over this period. However, both of these strategies, which involved raising the prices for consumers of both food and fertilisers, had undesirable and even counter-productive effects, leading to the paradoxical results of reducing consumption and simultaneously increasing subsidies! In consequence, domestic support to Indian farmers was sharply negative through the 1990s for most crops, and negligible in non-crop-specific terms, as shown in Table 4.
Table 4: Domestic support provided to agriculture
Source: Calculations by G. S. Bhalla (2004)
Product specific support (as per cent of value of output)
1990-91 1995-96 1999-2000 Rice -71.66 -52.59 -52.52 Wheat -64.67 -242.35 -8.56 Groundnut -34.25 0 -139.96 Soyabean -58.06 0 0 Cotton -566.67 -422.88 -192.79 Jute -94.7 -131.04 -36.36 Sugar 24.36 -198.27 41.39
Non-product specific support (as per cent of value of output)
1990-91 1995-96 1999-2000 Irrigation 1.45 1.58 1.44 Credit 0.05 0.07 0.07 Fertilizer 0.92 2.08 2.47 Power 2.32 3.97 4.58 Seed 0.05 0 0 Total 4.73 7.7 8.57
8
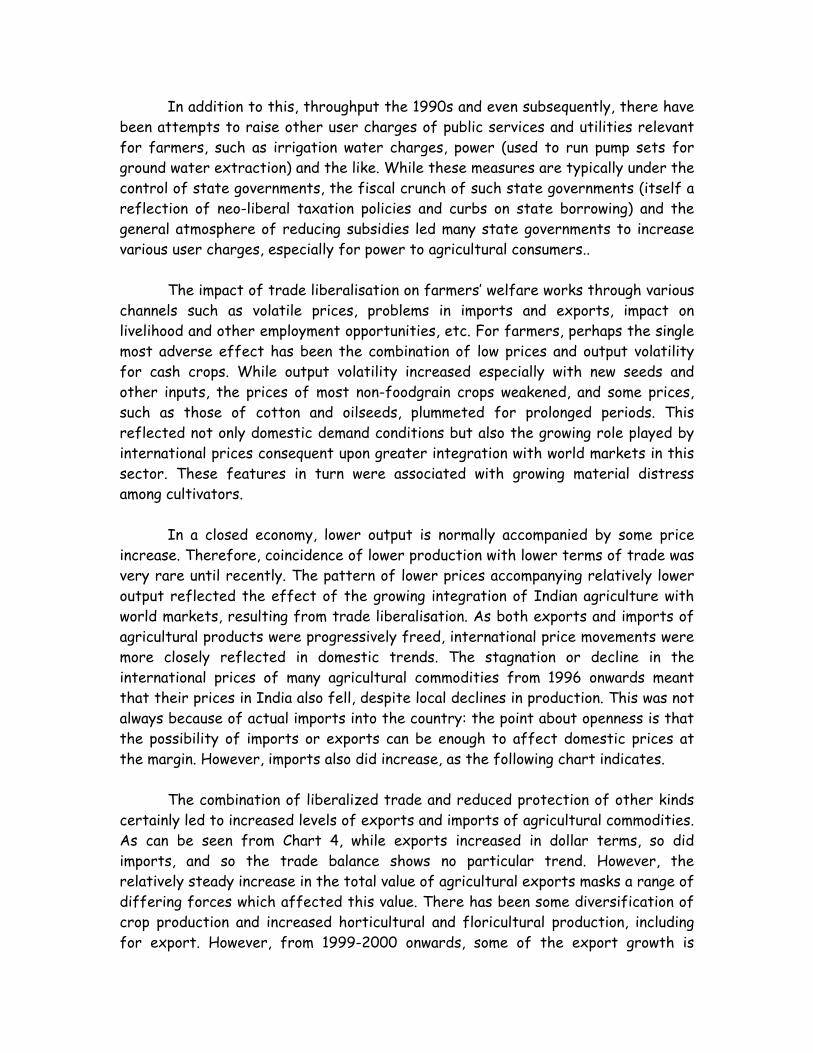
In addition to this, throughput the 1990s and even subsequently, there have been attempts to raise other user charges of public services and utilities relevant for farmers, such as irrigation water charges, power (used to run pump sets for ground water extraction) and the like. While these measures are typically under the control of state governments, the fiscal crunch of such state governments (itself a reflection of neo-liberal taxation policies and curbs on state borrowing) and the general atmosphere of reducing subsidies led many state governments to increase various user charges, especially for power to agricultural consumers..
The impact of trade liberalisation on farmers’ welfare works through various channels such as volatile prices, problems in imports and exports, impact on livelihood and other employment opportunities, etc. For farmers, perhaps the single most adverse effect has been the combination of low prices and output volatility for cash crops. While output volatility increased especially with new seeds and other inputs, the prices of most non-foodgrain crops weakened, and some prices, such as those of cotton and oilseeds, plummeted for prolonged periods. This reflected not only domestic demand conditions but also the growing role played by international prices consequent upon greater integration with world markets in this sector. These features in turn were associated with growing material distress among cultivators. In a closed economy, lower output is normally accompanied by some price increase. Therefore, coincidence of lower production with lower terms of trade was very rare until recently. The pattern of lower prices accompanying relatively lower output reflected the effect of the growing integration of Indian agriculture with world markets, resulting from trade liberalisation. As both exports and imports of agricultural products were progressively freed, international price movements were more closely reflected in domestic trends. The stagnation or decline in the international prices of many agricultural commodities from 1996 onwards meant that their prices in India also fell, despite local declines in production. This was not always because of actual imports into the country: the point about openness is that the possibility of imports or exports can be enough to affect domestic prices at the margin. However, imports also did increase, as the following chart indicates. The combination of liberalized trade and reduced protection of other kinds certainly led to increased levels of exports and imports of agricultural commodities. As can be seen from Chart 4, while exports increased in dollar terms, so did imports, and so the trade balance shows no particular trend. However, the relatively steady increase in the total value of agricultural exports masks a range of differing forces which affected this value. There has been some diversification of crop production and increased horticultural and floricultural production, including for export. However, from 1999-2000 onwards, some of the export growth is
9
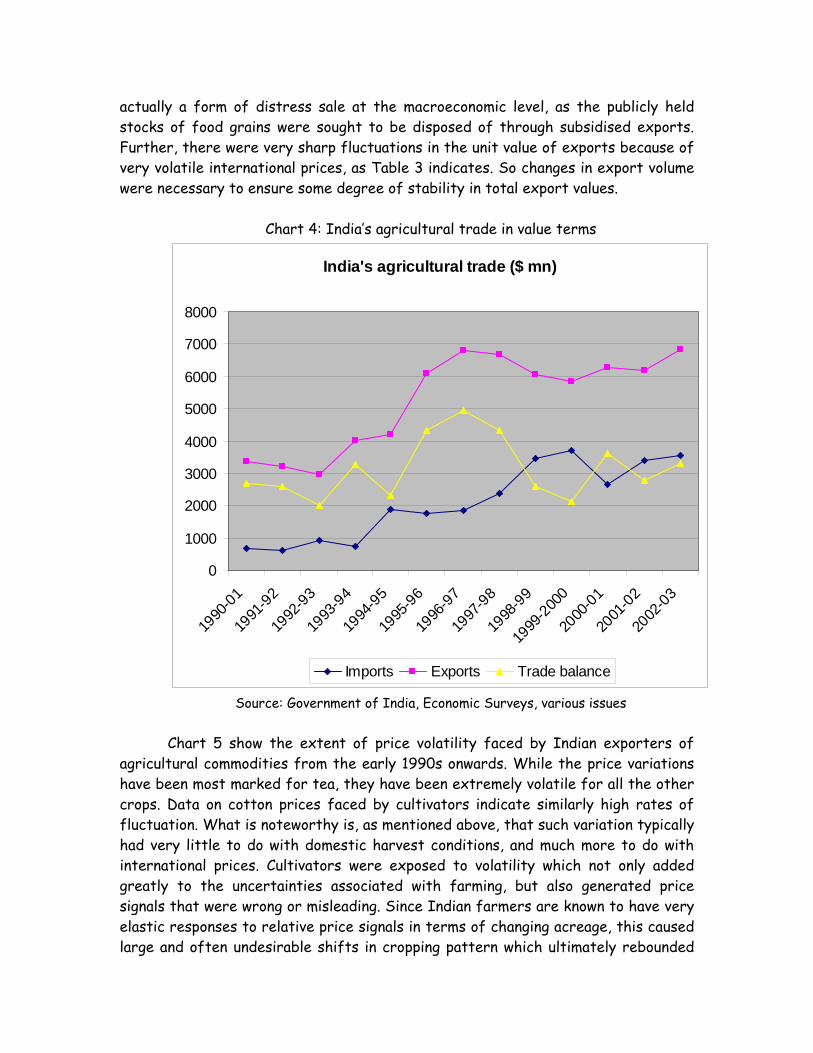
actually a form of distress sale at the macroeconomic level, as the publicly held stocks of food grains were sought to be disposed of through subsidised exports. Further, there were very sharp fluctuations in the unit value of exports because of very volatile international prices, as Table 3 indicates. So changes in export volume were necessary to ensure some degree of stability in total export values.
Chart 4: India’s agricultural trade in value terms
India's agricultural trade ($ mn)
0
1000
2000
3000
4000
5000
6000
7000
8000
1990
-01
1991
-92
1992
-93
1993
-94
1994
-95
1995
-96
1996
-97
1997
-98
1998
-99
1999
-2000
2000
-01
2001
-02
2002
-03
Imports Exports Trade balance
Source: Government of India, Economic Surveys, various issues Chart 5 show the extent of price volatility faced by Indian exporters of
agricultural commodities from the early 1990s onwards. While the price variations have been most marked for tea, they have been extremely volatile for all the other crops. Data on cotton prices faced by cultivators indicate similarly high rates of fluctuation. What is noteworthy is, as mentioned above, that such variation typically had very little to do with domestic harvest conditions, and much more to do with international prices. Cultivators were exposed to volatility which not only added greatly to the uncertainties associated with farming, but also generated price signals that were wrong or misleading. Since Indian farmers are known to have very elastic responses to relative price signals in terms of changing acreage, this caused large and often undesirable shifts in cropping pattern which ultimately rebounded
10
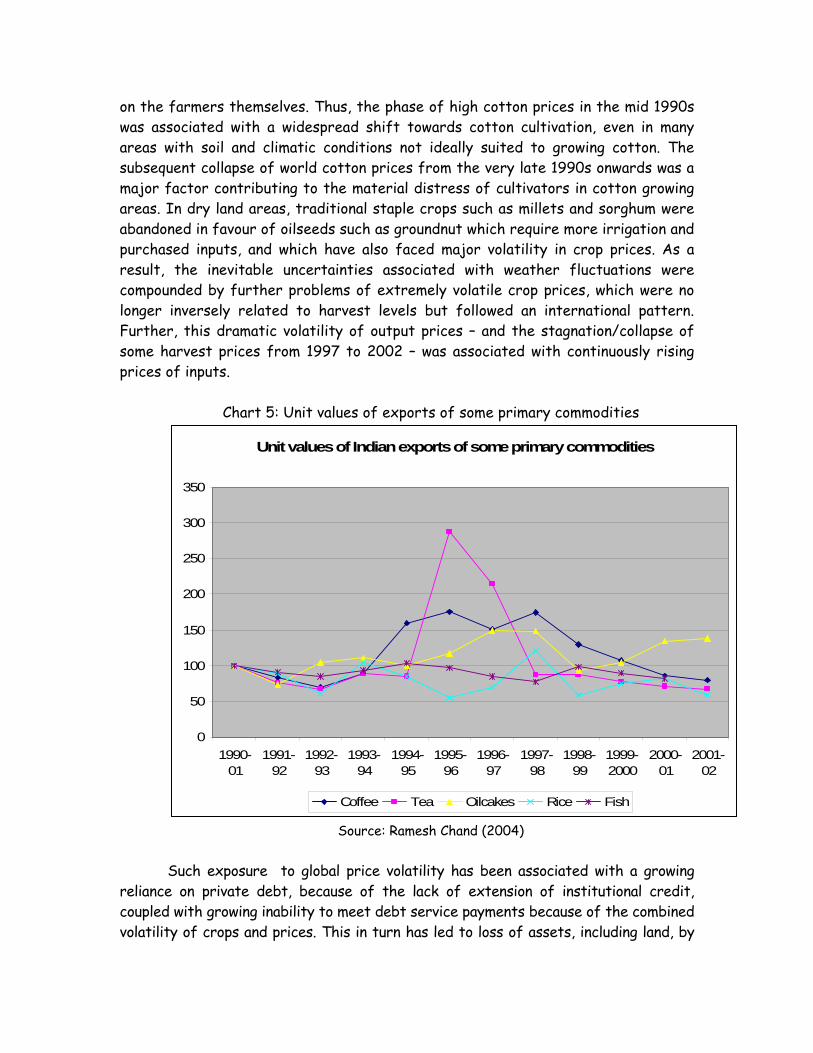
on the farmers themselves. Thus, the phase of high cotton prices in the mid 1990s was associated with a widespread shift towards cotton cultivation, even in many areas with soil and climatic conditions not ideally suited to growing cotton. The subsequent collapse of world cotton prices from the very late 1990s onwards was a major factor contributing to the material distress of cultivators in cotton growing areas. In dry land areas, traditional staple crops such as millets and sorghum were abandoned in favour of oilseeds such as groundnut which require more irrigation and purchased inputs, and which have also faced major volatility in crop prices. As a result, the inevitable uncertainties associated with weather fluctuations were compounded by further problems of extremely volatile crop prices, which were no longer inversely related to harvest levels but followed an international pattern. Further, this dramatic volatility of output prices – and the stagnation/collapse of some harvest prices from 1997 to 2002 – was associated with continuously rising prices of inputs.
Chart 5: Unit values of exports of some primary commodities
Unit values of Indian exports of some primary commodities
0
50
100
150
200
250
300
350
1990-01
1991-92
1992-93
1993-94
1994-95
1995-96
1996-97
1997-98
1998-99
1999-2000
2000-01
2001-02
Coffee Tea Oilcakes Rice Fish
Source: Ramesh Chand (2004) Such exposure to global price volatility has been associated with a growing
reliance on private debt, because of the lack of extension of institutional credit, coupled with growing inability to meet debt service payments because of the combined volatility of crops and prices. This in turn has led to loss of assets, including land, by
11
the small peasantry. This has been so marked that the proportion of rural households without any land increased dramatically over the 1990s, and by 1999-2000 accounted for around 45 per cent of rural households according to National Sample Survey data. The pervasive agrarian crisis has been most harshly illustrated by the increase in suicides by farmers, which amounted to more than 20,000 documented cases across India by the end of 2005.
In addition, there has been a deterioration of conditions of food security
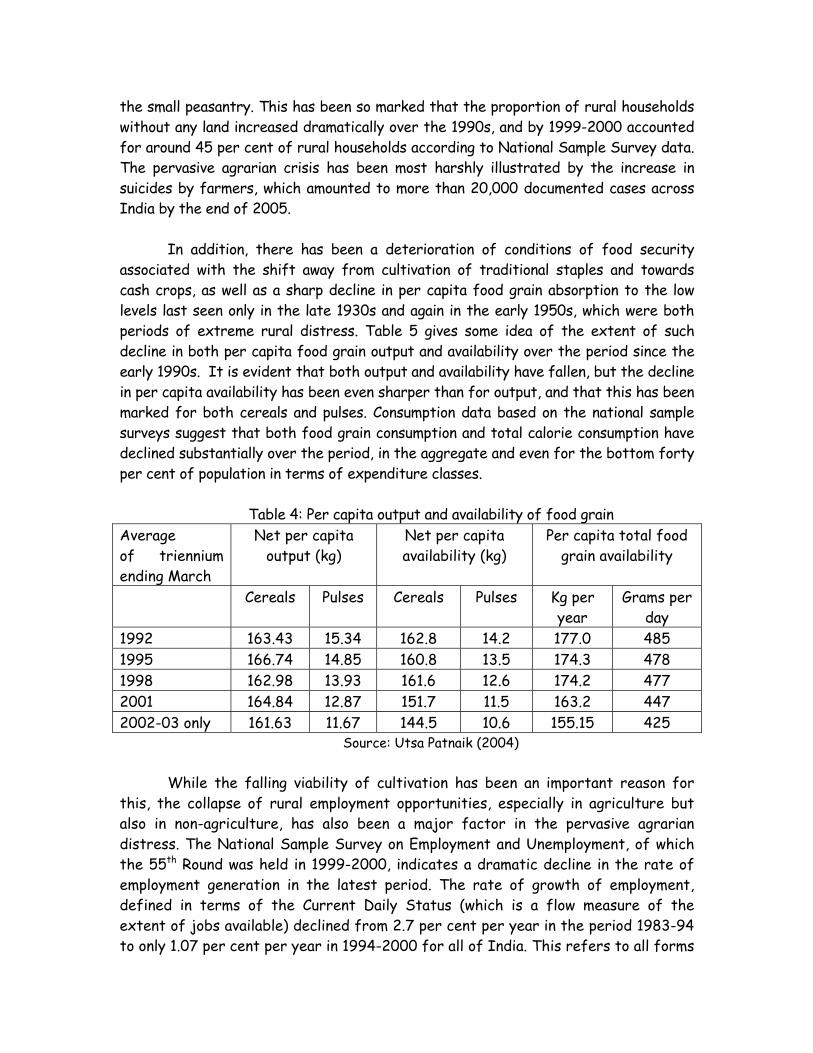
associated with the shift away from cultivation of traditional staples and towards cash crops, as well as a sharp decline in per capita food grain absorption to the low levels last seen only in the late 1930s and again in the early 1950s, which were both periods of extreme rural distress. Table 5 gives some idea of the extent of such decline in both per capita food grain output and availability over the period since the early 1990s. It is evident that both output and availability have fallen, but the decline in per capita availability has been even sharper than for output, and that this has been marked for both cereals and pulses. Consumption data based on the national sample surveys suggest that both food grain consumption and total calorie consumption have declined substantially over the period, in the aggregate and even for the bottom forty per cent of population in terms of expenditure classes.
Table 4: Per capita output and availability of food grain
Average of triennium ending March
Net per capita output (kg)
Net per capita availability (kg)
Per capita total food grain availability
Cereals Pulses Cereals Pulses Kg per year
Grams per day
1992 163.43 15.34 162.8 14.2 177.0 485 1995 166.74 14.85 160.8 13.5 174.3 478 1998 162.98 13.93 161.6 12.6 174.2 477 2001 164.84 12.87 151.7 11.5 163.2 447 2002-03 only 161.63 11.67 144.5 10.6 155.15 425
Source: Utsa Patnaik (2004)
While the falling viability of cultivation has been an important reason for this, the collapse of rural employment opportunities, especially in agriculture but also in non-agriculture, has also been a major factor in the pervasive agrarian distress. The National Sample Survey on Employment and Unemployment, of which the 55th Round was held in 1999-2000, indicates a dramatic decline in the rate of employment generation in the latest period. The rate of growth of employment, defined in terms of the Current Daily Status (which is a flow measure of the extent of jobs available) declined from 2.7 per cent per year in the period 1983-94 to only 1.07 per cent per year in 1994-2000 for all of India. This refers to all forms
12
of employment – casual, part-time, self-employment, everything. For permanent or secure jobs, the rate of increase was close to zero. In rural areas, the decline in all employment growth was even sharper, from 2.4 per cent in the previous period to less than 0.6 per cent over 1994-2000. This included all forms of employment, as principal or subsidiary activity and for part days work. This was well below the rate of growth of population. In both rural and urban areas, the absolute number of unemployed increased substantially, and the rate of unemployment went up as well. The daily status unemployment rate in rural India as a whole increased from 5.63 per cent in 1993-94 to 7.21 per cent in 1999-00, and was more than 15 per cent in some states. In addition to this, there was a sharp decline in the rate of growth of labour force. More people declared themselves to be not in the labour force, possibly driven to this by the shortage of jobs. A significant part of the collapse in employment occurred in agriculture, where the employment elasticity of output growth (the extent to which additional output creates additional demand for jobs) declined from 0.7 in 1983-94 to only 0.01 in 1994-2000. This was related both to growing mechanization of agriculture and to the cropping pattern shifts mentioned above. But even non-agricultural employment growth was slower than before. Aggregate employment elasticity of output fell from 0.52 to 0.16 over the same two periods. Some of this was because of the decline in public spending on rural employment programmes since the mid-nineties. As a percentage of GDP, expenditure on both rural wage employment programmes and special programmes for rural development declined from the mid-1990s. The total central allocation for rural wage employment programmes was already only 0.4 per cent of GDP in 1995-6, but it declined further to a minuscule 0.13 percent of GDP in 2000-1. This is probably why employment generation has emerged as not only the most important socio-economic issue in the country today, but also the most pressing political concern. In the 2004 general elections, the electorate decisively rejected policies that have implied reduced employment opportunities and reduced access to and quality of public goods and services. This was also associated with the demand for and subsequent formulation of the National Rural Employment Guarantee Act, under which the central government will guarantee the provision of 100 days employment for every rural household, for a range of public works.
III. Trade liberalisation and industrial performance When launching the 1990s reforms, the impression conveyed by the advocates of reform was that in course of time the "animal spirits" of private entrepreneurs would respond adequately to the incentives created by liberalisation.
13
In addition to trade liberalisation, various elements of the liberalisation programme aimed at facilitating private investment : the dismantling of government controls on capacity creation, production and pricing practices of even large firms and groups; improved access to imported capital equipment, raw materials and intermediates; easier possibilities of technical and financial collaboration with foreign entrepreneurs; and disinvestments of public equity to private players. It was argued that the stimulus to private investment provided by these new incentives would take Indian industry onto a whole new growth trajectory. However, the record appears far from satisfactory. The trend rate of growth of the index of industrial production, which stood at 7.8 per cent between 1980-81 and 1989-90, fell to 6.7 per cent between 1990-91 and 2000-01. In the case of the manufacturing sector, the deceleration was of a much smaller order, with the rate of growth of manufacturing output falling from 7.6 to 7.1 per cent between these two periods. With the choice of time periods being a perennial source of dispute, such small changes can hardly be made much of. All that can be said is that the 1980s were not any worse than the reformist 1990s, or vice-versa. However, a closer look at the distribution of rates of growth in individual years is quite revealing. As Chart 5.1 shows, in the case of both manufacturing and the overall index of industrial production, in the 1980s, most years excepting two or three were characterized by rates of growth at or above the trend rate. However, in the 1990s, rates at or above the trend were far less frequent. The picture that emerges is that in the 1980s industrial growth was generally high. But over the 1990s, a boom in industrial growth during the three year period 1993-94 to 1995-96 was followed by a downturn from which growth did not recover by the turn of the decade.
14
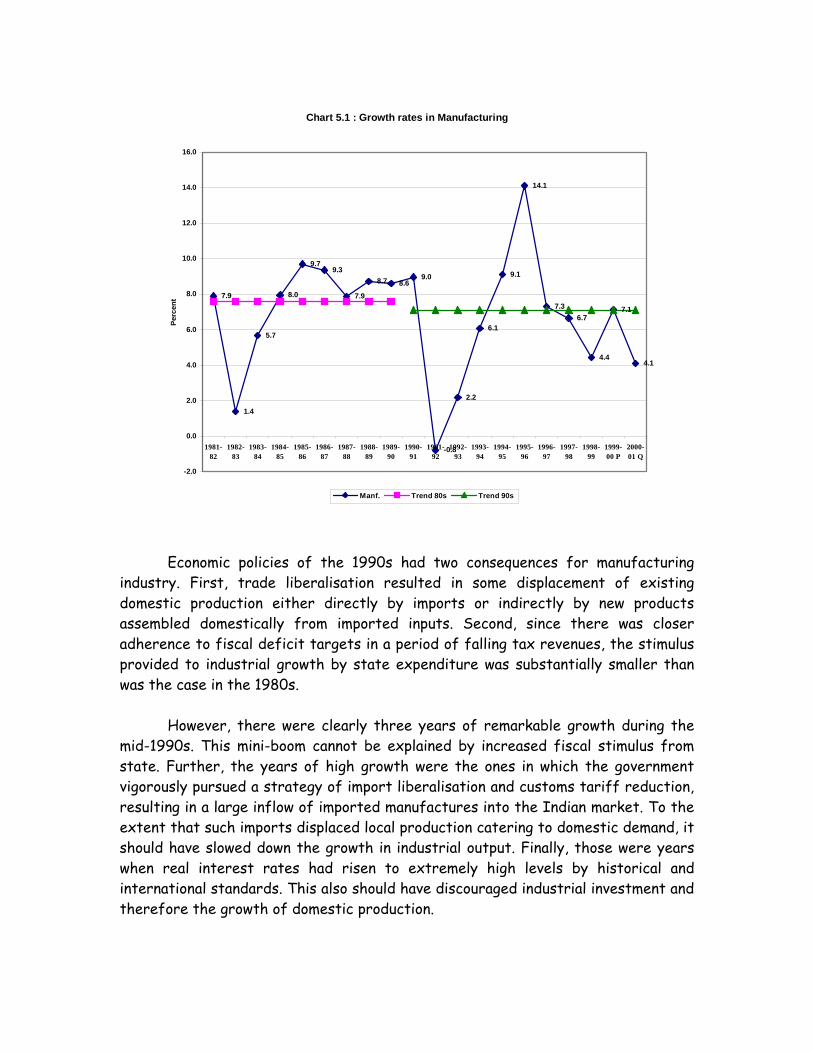
Chart 5.1 : Growth rates in Manufacturing
7.9
1.4
5.7
8.0
9.79.3
7.9
8.7 8.69.0
-0.8
2.2
6.1
9.1
14.1
7.36.7
4.4
7.1
4.1
-2.0
0.0
2.0
4.0
6.0
8.0
10.0
12.0
14.0
16.0
1981-82
1982-83
1983-84
1984-85
1985-86
1986-87
1987-88
1988-89
1989-90
1990-91
1991-92
1992-93
1993-94
1994-95
1995-96
1996-97
1997-98
1998-99
1999-00 P
2000-01 Q
Perc
ent
Manf. Trend 80s Trend 90s
Economic policies of the 1990s had two consequences for manufacturing industry. First, trade liberalisation resulted in some displacement of existing domestic production either directly by imports or indirectly by new products assembled domestically from imported inputs. Second, since there was closer adherence to fiscal deficit targets in a period of falling tax revenues, the stimulus provided to industrial growth by state expenditure was substantially smaller than was the case in the 1980s. However, there were clearly three years of remarkable growth during the mid-1990s. This mini-boom cannot be explained by increased fiscal stimulus from state. Further, the years of high growth were the ones in which the government vigorously pursued a strategy of import liberalisation and customs tariff reduction, resulting in a large inflow of imported manufactures into the Indian market. To the extent that such imports displaced local production catering to domestic demand, it should have slowed down the growth in industrial output. Finally, those were years when real interest rates had risen to extremely high levels by historical and international standards. This also should have discouraged industrial investment and therefore the growth of domestic production.
15
In fact, elements of the import liberalisation also had the effect of spurring manufacturing production. One consequence of the complex of import substitution policies pursued by India till the mid 1980s was the pent-up demand for a range of manufactured goods, including specific brands of such goods. While knowledge of these could be acquired by consumers from the international market, the products themselves could either not be acquired within India or acquired only at prohibitive costs. Liberalisation of the kind pursued in India, which freed access to intermediates, components and capital goods while protecting most end-products, along with reducing tariffs substantially, allowed for the expansion of domestic production/assembly and sale of these commodities in a relatively short span of time. This occurred at two levels: first, by relatively small firms that combine cheap imports and domestic parts to service what is not always correctly described as the "grey market"; and second, by larger firms, very often in collaboration with international producers with a well-cultivated brand image. While such products did have a ready market, they would not have contributed to a net addition to domestic production to the extent that they displaced similar or other products in the consumer's basket of purchases. If the availability of new goods were to spur growth it needed to be accompanied by a net accretion to demand after accounting for the displacement of previously available "substitutes". In the short run such net additions to demand can be financed either with the flow of hitherto unaccounted incomes into the market for goods, or with an element of dissaving reflected by reduced financial savings, or through increased recourse to consumer credit. There is reason to believe that in much of urban India and some parts of rural India, such a tendency was underway, driven by easier access to consumer credit. The 1993-1995 “mini-boom” was thus the result of a combination of several once-for-all influences, in particular the release of the pent-up demand for a host of import-intensive goods, which (because of liberalisation) could be serviced through domestic assembly or production using imported inputs and components. Once that demand had been satisfied, further growth had to be based on an expansion of the domestic market or a surge in exports. Since neither of these conditions was realised, industry then entered a phase of slow growth. This argument is reinforced by the poor showing of fixed investment in manufacturing, which has been substantially negative between 1997 and 2001, and has revived only marginally since then. (Chart 7). Balakrishnan et al (2000) found the absence of any significant effect on productivity growth in manufacturing.
16
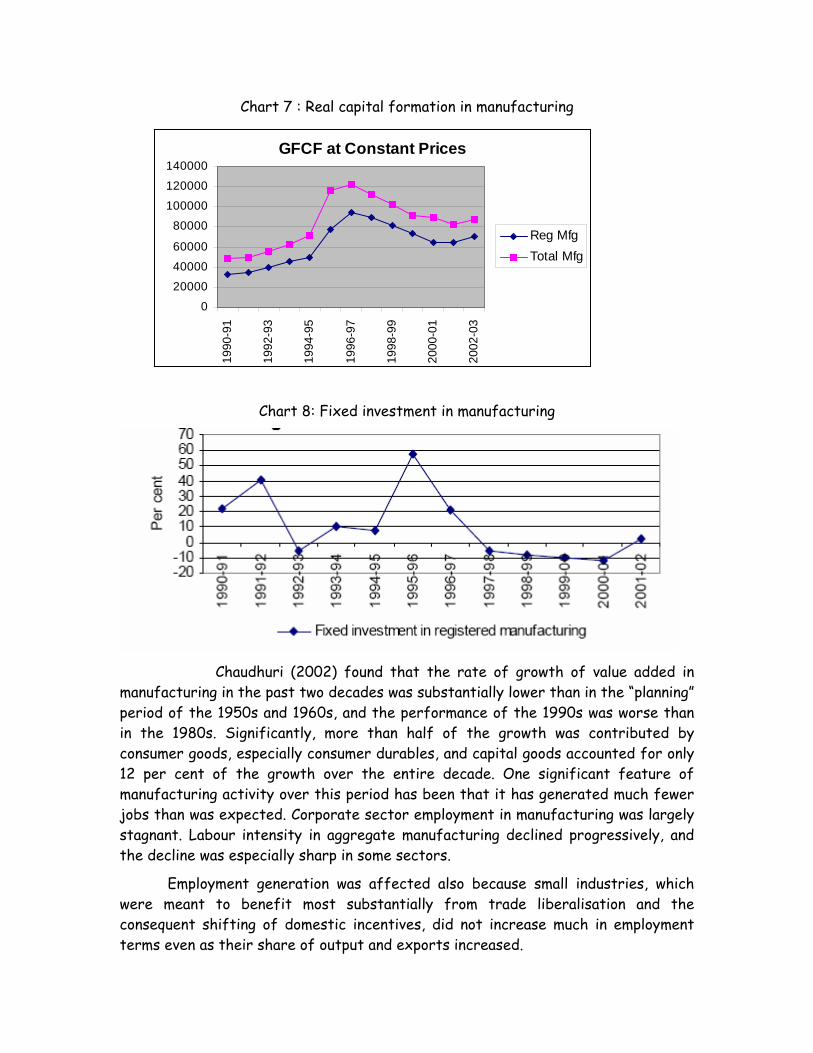
Chart 7 : Real capital formation in manufacturing
Chart 8: Fixed invest ent in manufacturing
GFCF at Constant Prices
0
20000
40000
60000
80000
100000
120000
140000
1990
-91
1992
-93
1994
-95
1996
-97
1998
-99
2000
-01
2002
-03
Reg MfgTotal Mfg
m
Chaudhuri (2002) found that the rate of growth of value added
anufa uring
because small industries, which ere m
in m ct in the past two decades was substantially lower than in the “planning” period of the 1950s and 1960s, and the performance of the 1990s was worse than in the 1980s. Significantly, more than half of the growth was contributed by consumer goods, especially consumer durables, and capital goods accounted for only 12 per cent of the growth over the entire decade. One significant feature of manufacturing activity over this period has been that it has generated much fewer jobs than was expected. Corporate sector employment in manufacturing was largely stagnant. Labour intensity in aggregate manufacturing declined progressively, and the decline was especially sharp in some sectors.
Employment generation was affected alsow eant to benefit most substantially from trade liberalisation and the consequent shifting of domestic incentives, did not increase much in employment terms even as their share of output and exports increased.
17
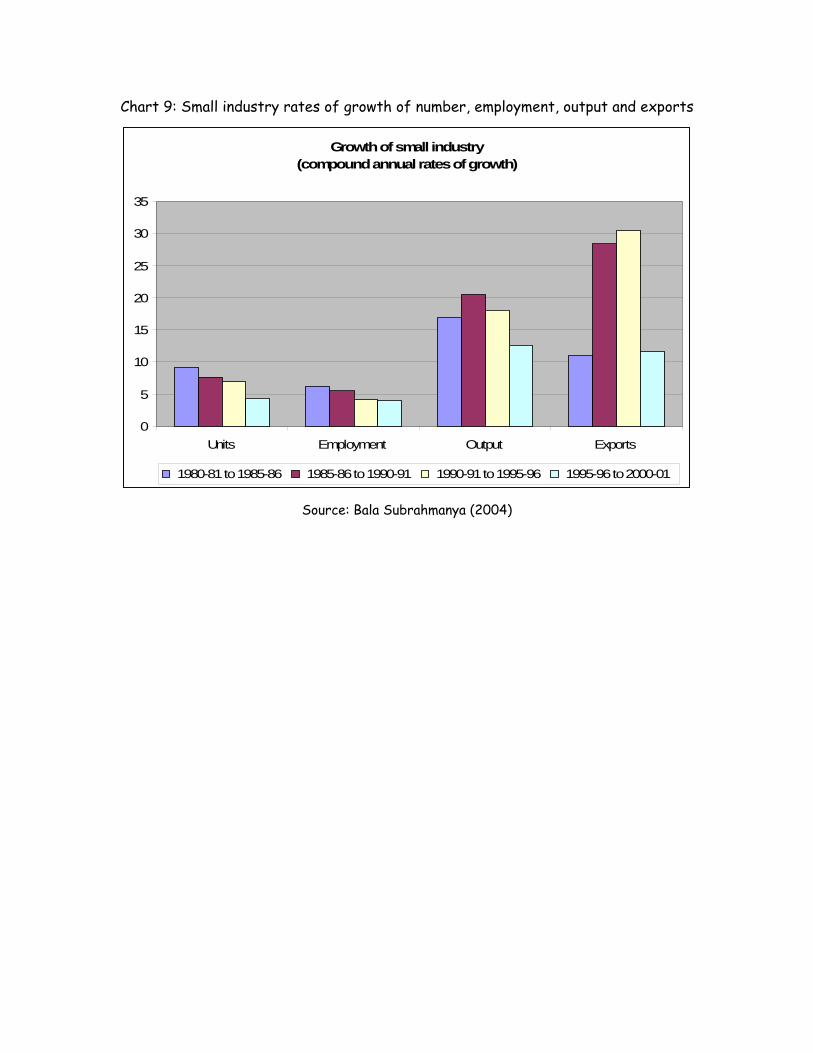
Chart 9: Small industry rates of growth of number, employment, output and exports
Growth of small industry (compound annual rates of growth)
0
5
10
15
20
25
30
35
Units Employment Output Exports
1980-81 to 1985-86 1985-86 to 1990-91 1990-91 to 1995-96 1995-96 to 2000-01
Source: Bala Subrahmanya (2004)
18
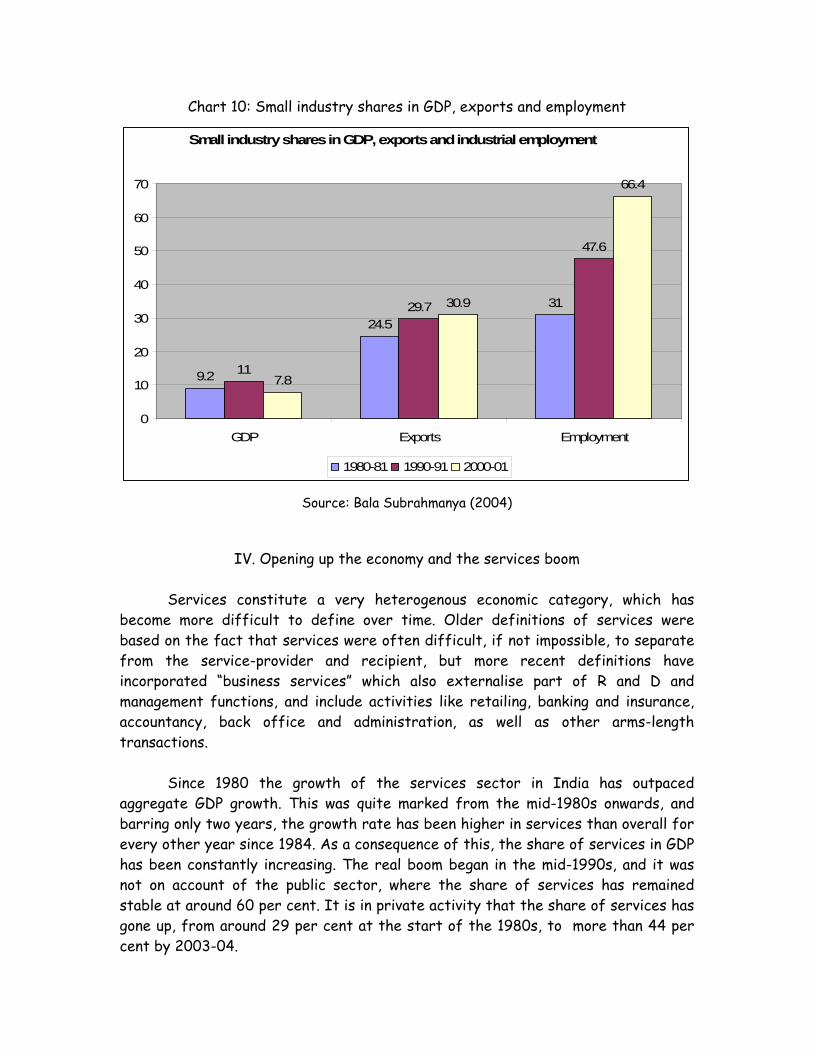
Chart 10: Small industry shares in GDP, exports and employment
Small industry shares in GDP, exports and industrial employment
9.2
24.5
31
11
29.7
47.6
7.8
30.9
66.4
0
10
20
30
40
50
60
70
GDP Exports Employment
1980-81 1990-91 2000-01
Source: Bala Subrahmanya (2004)
IV. Opening up the economy and the services boom Services constitute a very heterogenous economic category, which has become more difficult to define over time. Older definitions of services were based on the fact that services were often difficult, if not impossible, to separate from the service-provider and recipient, but more recent definitions have incorporated “business services” which also externalise part of R and D and management functions, and include activities like retailing, banking and insurance, accountancy, back office and administration, as well as other arms-length transactions. Since 1980 the growth of the services sector in India has outpaced aggregate GDP growth. This was quite marked from the mid-1980s onwards, and barring only two years, the growth rate has been higher in services than overall for every other year since 1984. As a consequence of this, the share of services in GDP has been constantly increasing. The real boom began in the mid-1990s, and it was not on account of the public sector, where the share of services has remained stable at around 60 per cent. It is in private activity that the share of services has gone up, from around 29 per cent at the start of the 1980s, to more than 44 per cent by 2003-04.
19
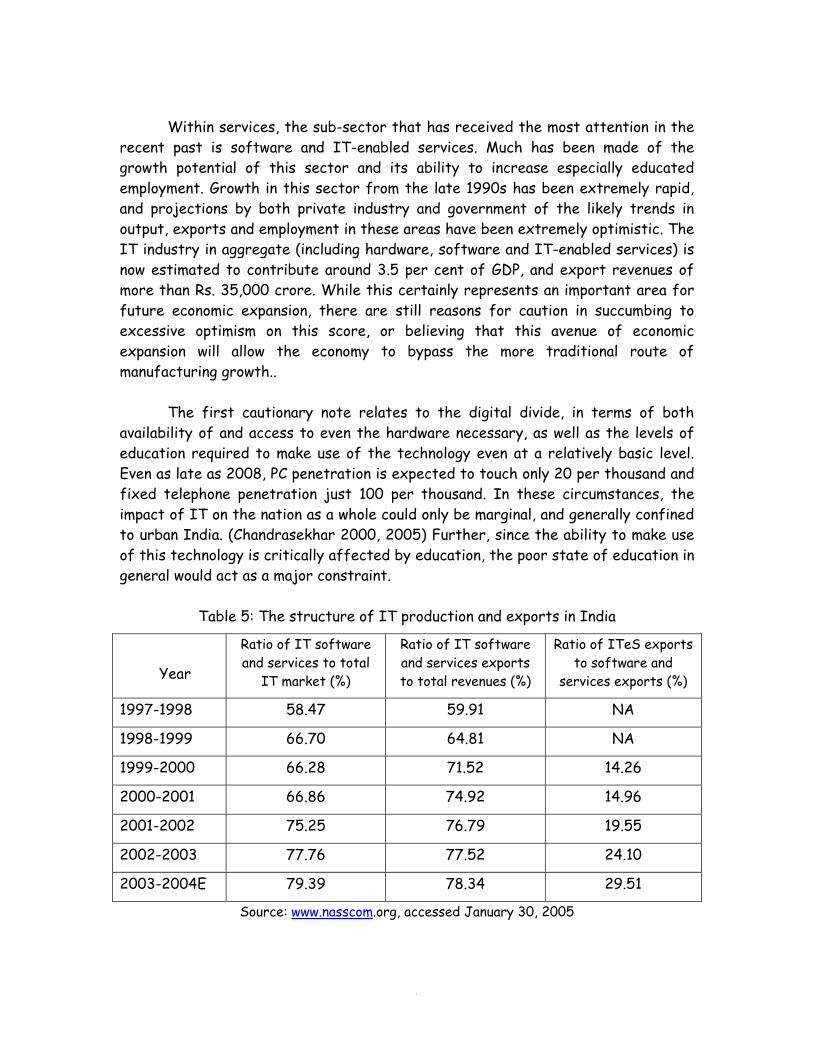
Within services, the sub-sector that has received the most attention in the recent past is software and IT-enabled services. Much has been made of the growth potential of this sector and its ability to increase especially educated employment. Growth in this sector from the late 1990s has been extremely rapid, and projections by both private industry and government of the likely trends in output, exports and employment in these areas have been extremely optimistic. The IT industry in aggregate (including hardware, software and IT-enabled services) is now estimated to contribute around 3.5 per cent of GDP, and export revenues of more than Rs. 35,000 crore. While this certainly represents an important area for future economic expansion, there are still reasons for caution in succumbing to excessive optimism on this score, or believing that this avenue of economic expansion will allow the economy to bypass the more traditional route of manufacturing growth.. The first cautionary note relates to the digital divide, in terms of both availability of and access to even the hardware necessary, as well as the levels of education required to make use of the technology even at a relatively basic level. Even as late as 2008, PC penetration is expected to touch only 20 per thousand and fixed telephone penetration just 100 per thousand. In these circumstances, the impact of IT on the nation as a whole could only be marginal, and generally confined to urban India. (Chandrasekhar 2000, 2005) Further, since the ability to make use of this technology is critically affected by education, the poor state of education in general would act as a major constraint.
Table 5: The structure of IT production and exports in India
Year
Ratio of IT software and services to total
IT market (%)
Ratio of IT software and services exports to total revenues (%)
Ratio of ITeS exports to software and
services exports (%)
1997-1998 58.47 59.91 NA
1998-1999 66.70 64.81 NA
1999-2000 66.28 71.52 14.26
2000-2001 66.86 74.92 14.96
2001-2002 75.25 76.79 19.55
2002-2003 77.76 77.52 24.10
2003-2004E 79.39 78.34 29.51
Source: www.nasscom.org, accessed January 30, 2005
20

As Table 6 indicates, the total employment in all IT activities is still just a drop in the ocean of the India labour force. Further, the impact of IT on growth and employment is still uncertain. The rapid rates of growth of the late 1990s were from very small bases, and the sector typically remained very small relative to the rest of the economy, and with fewer domestic multiplier effects because of high import dependence. For software alone, for the growth potential in this sector to be fully realised, software firms needed to diversify in term of sources and destinations, keep qualified personnel from the lure of migration and migrate up the value chain. In fact, even as an outsourcer India still remains a lower-end software supplier and a supplier of IT-enabled services.
Table 6: Total employment in IT sector
Sector Employment Non-agricultural workers, 1999-2000 135,756,855 Weekly status textile workers, 1999-2000 8,351,313 IT sector workers, 1999-2000 284,000 IT sector workers, 2004-05 1,000,000
Also, at one level much of even the export revenue was effectively the sale of cheap skilled and not-so-skilled IT-enabled labour services whose output is transmitted via modern communication technologies to sites where those services are required. The possibility of such service delivery helped India circumvent the obstacle to service exports created by immigration laws in the developed countries. This meant that a large part of software exports was not very different from the exports of nursing, carpentry, masonry and other such services, except for the fact that unlike those exports, the presence of the service provider at the point of sale was not required in the case of IT-enabled services.
The new pattern of growth is apparently based on a newly emerging form of dualism. The manufacturing sector in India seems to be witnessing its own version of jobless growth as companies shed workers to gain cost efficiencies and automation of menial jobs drives down the need for more workers. On the other hand, IT and IT-enabled services companies are hiring and leveraging technology to grab the worldwide outsourcing market.
But there are sobering patterns here which need to be recognised. India’s operations in this area are characterised by the increasing dominance of one area, Customer Care, which accounted for close to a third of BPO revenues in 2003-04. Further, while the IT-enabled services sector is diversified, excepting for medical transcription, which records abysmally low revenue per worker, there is not too much difference in the revenue per worker, which averaged Rs. 600,000 (or around $12,200) per year. This points to the fact that low wages do drive the industry. As
21
countries like the Philippines and even China seek to enter this market, the possibility of a profit squeeze in the IT-enabled services area cannot be ruled out. What seems to be likely is that as in the case of manufactured exports, a few developing countries would account for an overwhelming share of total exports and even limited spread could be accompanied by a race to the bottom.
In fact, the real beneficiaries from the offshoring movement are the firms engaging in offshoring themselves, which reap substantial cost-reduction benefits and profits. Not surprisingly, therefore, globalisation of services has created a trade surplus in IT services for the US.
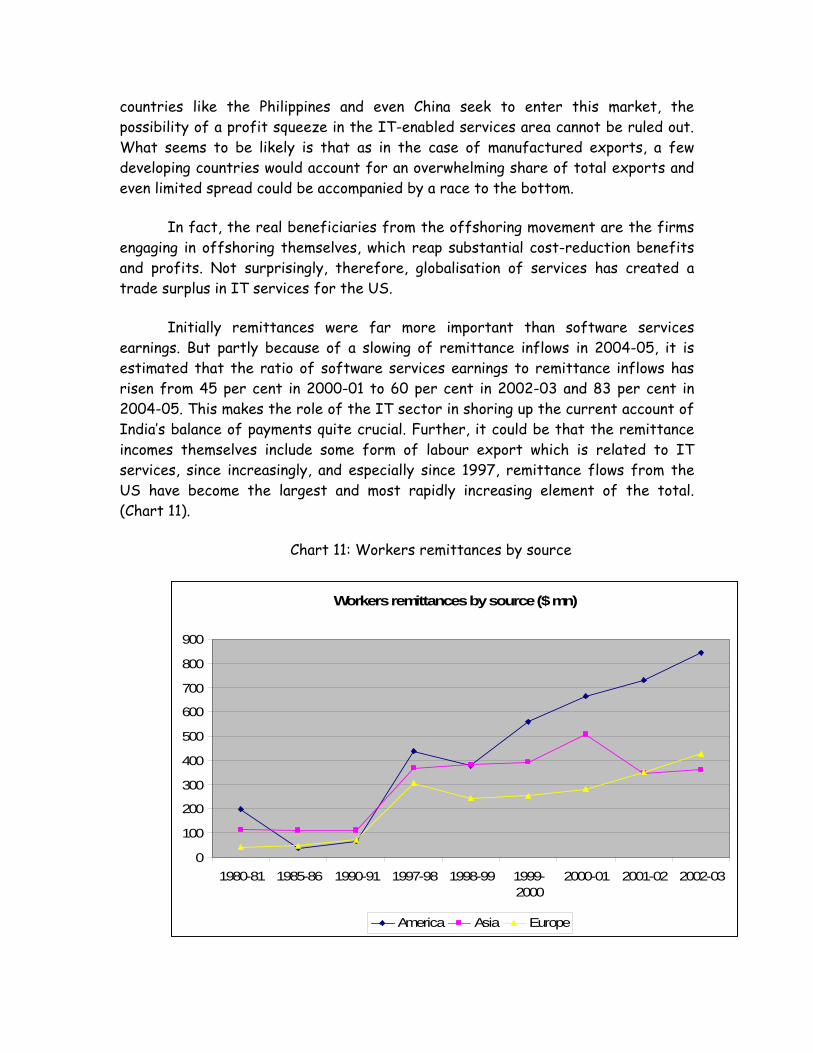
Initially remittances were far more important than software services earnings. But partly because of a slowing of remittance inflows in 2004-05, it is estimated that the ratio of software services earnings to remittance inflows has risen from 45 per cent in 2000-01 to 60 per cent in 2002-03 and 83 per cent in 2004-05. This makes the role of the IT sector in shoring up the current account of India’s balance of payments quite crucial. Further, it could be that the remittance incomes themselves include some form of labour export which is related to IT services, since increasingly, and especially since 1997, remittance flows from the US have become the largest and most rapidly increasing element of the total. (Chart 11).
Chart 11: Workers remittances by source
Workers remittances by source ($ mn)
0
100
200
300
400
500
600
700
800
900
1980-81 1985-86 1990-91 1997-98 1998-99 1999-2000
2000-01 2001-02 2002-03
America Asia Europe
22

Source: Reserve Bank of India
While the external market is the prime driver of growth in this sector, that market is dominated by one country: the US, which accounts for 64 per cent of exports. This makes the industry vulnerable. Any slow down in the US can have a dramatic impact on the fortunes of the industry. Since India today dominates the global market for outsourced software and IT-enabled services that is offshored, with around half the market, it may become more difficult to ensure increases in market share. Further, Since the ITeS-BPO sector accounts for a rising share of total revenues, India’s dependence on the less skill-intensive segments of the software and IT-services sector is rising. This makes it even more difficult to maintain market shares, especially without a substantial drop in revenues per employee, since competitors are more easily generated.
Even if India’s share of outsourcing revenues remains high, the net benefits of this are still unclear because of the dominance of a few firms and a substantial share for captive offshore outsourcing by international firms in the ITeS-BPO sector. According to NASSCOM captive ITeS-BPO providers accounted for as much as 65 per cent of the value of ITeS contracts outsourced to India. This kind of concentration not only makes the linkage effects of the growth of the industry less significant, it also has adverse implication for the net foreign exchange earning of the sector after taking into account repatriation of profits and other payments abroad.
Two kinds of divisions are occurring in the Indian industry: while the domestic market is increasingly being occupied by foreign providers of hardware and software, the domestic industry is increasingly focussed on the export market; while the domestic market for hardware and software is being occupied by foreign players, Indian firms are increasingly occupying the services space both domestically and abroad. This suggests that employment losses or jobless growth and an outflow of foreign exchange would characterise one segment of the industry, while employment gains and foreign exchange inflow would characterise the other. At present clearly the latter dominates, though not to a degree where the net employment generated by the industry is adequate to match its contribution to GDP or foreign exchange earnings. Thus, conceptually, India’s software thrust of the last decade is not as spectacular as it appears. It is substantially export of lower end software and IT-enabled services facilitated by the availability of cheap skilled labour. So it is in large part a technology-aided extension of the earlier waves of migration by service-providers of different descriptions: doctors, nurses, and blue-collared workers of various kinds. An expansion of that kind cannot be self-sustaining. Further, while this can continue to provide a source of employment for more skilled
23
labour for some time, it could not be seen as any kind of solution to the basic problem of inadequate economic growth and employment in the aggregate.
This suggests that hopes that promoting software and IT-enabled services as the basic development strategy, in the hope of being able to bypass the stage of industrialisation, are misplaced. Trade policies that imply deindustrialisation of the economy are still deeply damaging, and emphasising services expansion while allowing decrepitude in the material producing sectors will do little to ensure either sustained growth or adequate employment generation.
References: Bala Subrahmanya, M. H. (2004) “Small industry and globalisation: Implications, performance, prospects, Economic and Political Weekly, May 1. Balakrishnan, Pulapre, K. Pushpangadan, and M. Suresh Babu (2000) “Trade liberalisation and productivity growth in manufacturing: Evidence from firm-level panel data”, Economic and Political Weekly, October 7. Chandrasekhar, C. P. and Jayati Ghosh (2004) The market that failed: Neoliberal economic reforms in India, New Delhi: Leftword Books, 2nd edition. Chandrasekhar, C. P. and Jayati Ghosh (2006), “IT-driven offshoring: The exaggerated development opportunity”, forthcoming, available on www.macroscan.org. Chaudhuri, Sudeep (2002) “Economic reforms and industrial structure in India”, Economic and Political Weekly, January 12. Dholakia, Ravindra and Saradhi V Raveendra, (2000) “ Exchange rate pass-through and volatility: Impact on Indian foreign trade”, Economic and Political Weekly, November 18. Ghosh, Jayati (2005) Trade liberalisation in agriculture: An examination of impact and policy strategies with special reference to India, background paper for Human Development Report 2005, available on www.macroscan.org. Mallik, Jayanta Kumar (2005) “India’s exports: Policy defeating exchange rate arithmetic”, Economic and Political Weekly, December 24. Mathur, Archana S and Arvinder S. Sachdeva (2005) “Customs tariff structure in India”, Economics and Political Weekly, February 5.
24

Patnaik, Prabhat (2003) The retreat to unfreedom, New Delhi: Tulika. Patnaik, Utsa (2004) The republic of hunger, available on www.macroscan.org
25