Trade Liberalisation and Informality: New stylized...
21
Trade Liberalisation and Informality: New stylized facts Norbert Fiess The World Bank and University of Glasgow and Marco Fugazza UNCTAD
Transcript of Trade Liberalisation and Informality: New stylized...

Trade Liberalisation and Informality: New stylized facts
Norbert FiessThe World Bank and University of
Glasgow
and
Marco FugazzaUNCTAD

2
1.Introduction• The relationship between trade liberalisation
and informal activity has not received the attention, whether theoretical or empirical, that it may deserve
• The conventional view poses that trade liberalisation would cause a rise in informality
• This paper uses three different data sets to assess the sign of the relationship
• Empirical results suggest that while informal output increases with deeper trade liberalisation, informal employment falls

3
Plan
2. Insights from the Literature
3. Data and Empirical Strategy
4. Results
5. Discussion

4
2. Insights from the Literature
2.1 What is informality?
– Share of a country’s production of goods and services which does not comply with government regulation
– However, we should distinguish unregistered firms from underground activities in registered ones
– Common feature of developed and developing countries
5
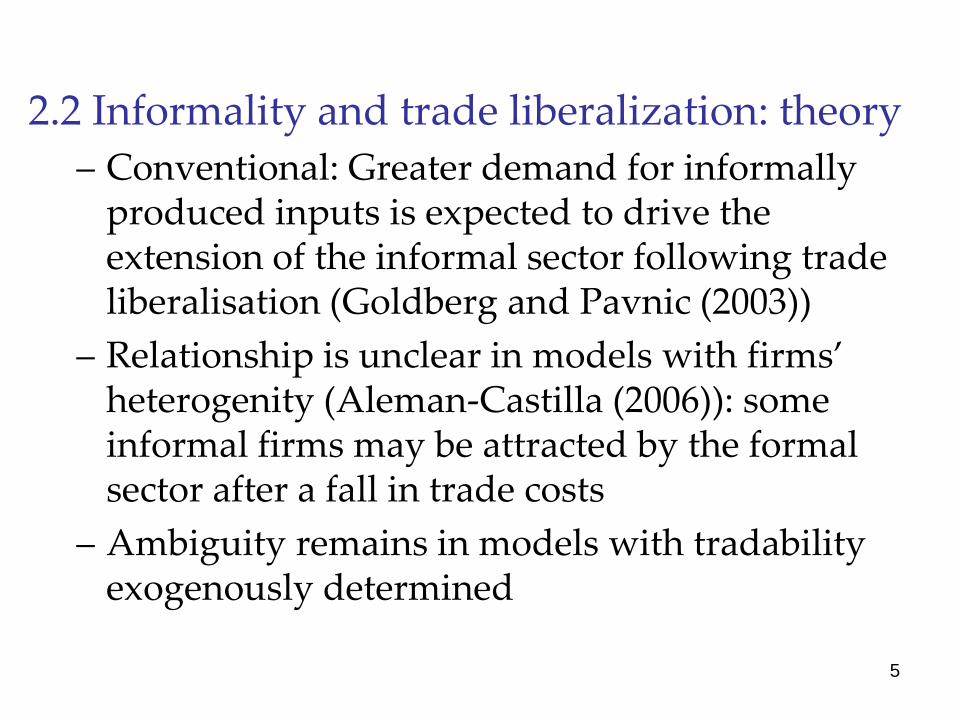
2.2 Informality and trade liberalization: theory
– Conventional: Greater demand for informally produced inputs is expected to drive the extension of the informal sector following trade liberalisation (Goldberg and Pavnic (2003))
– Relationship is unclear in models with firms’ heterogenity (Aleman-Castilla (2006)): some informal firms may be attracted by the formal sector after a fall in trade costs
– Ambiguity remains in models with tradability exogenously determined

6
2.3 Informality and trade liberalization: empirical evidence
– Empirical evidence on the relationship between trade liberalisation and informality is limited and generally country specific (micro data)
– Most of the evidence relates to Brazil, Colombia and Mexico for which rich, relevant and reliable micro datasets are available
– Empirical studies suggest that informality can respond to trade liberalisation either positively or negatively, depending on country and industry characteristics (economic and institutional)

7
3. Data and Empirical StrategyNo evidence in a multi-country sample
- 3 measures of informality
- The ILO survey-based measure: provides a directly observable measure of the share of informal employment (32 countries, 1990-2004)
- The Schneider’s (2005, 2007) -indirect- measure of informality : computed share of informal output in total (110 countries 1990-1995-2000-2004)
- The macro-eclectic approach (Kaufmann and Kaliberda, 1996) another indirect measure of informal output in total GDP (66 countries 1990-2004)

8
- 4 measures of openness to trade:
- Trade/GDP (WDI) (+)
- Effectively Applied external tariff rate (weighted and unweighted average) (TRAINS in WITS) (-)
- KOF Index of Globalization components: actual economic flows (trade, FDI and portfolio investment) and trade/capital restrictions (mean tariff rates, taxes on international trade, index of capital controls, hidden import barriers) (+)
9
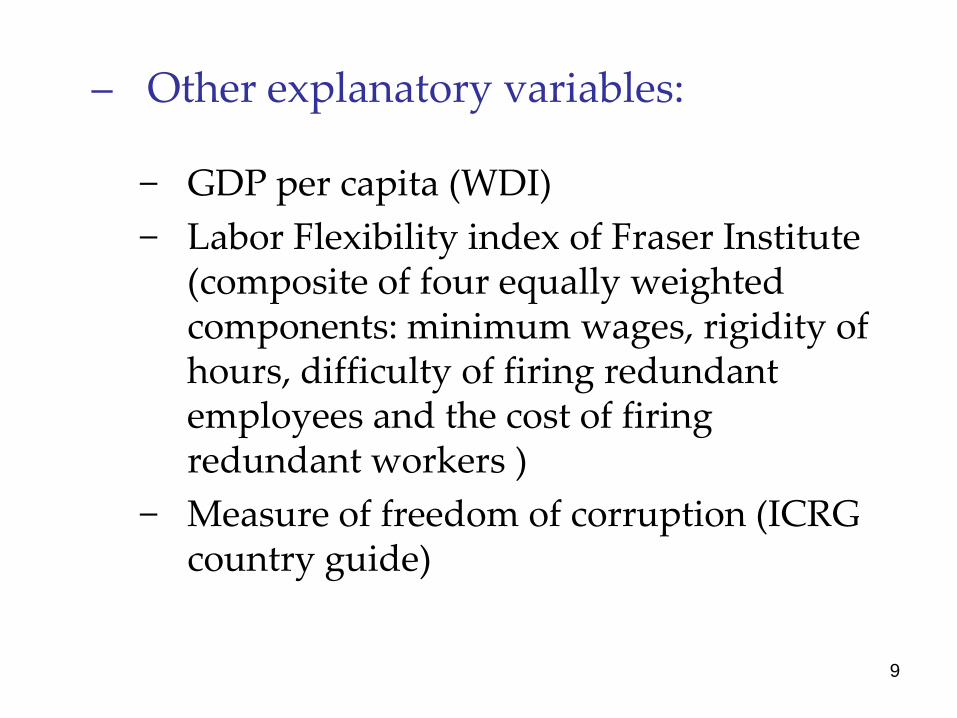
– Other explanatory variables:
− GDP per capita (WDI)
− Labor Flexibility index of Fraser Institute (composite of four equally weighted components: minimum wages, rigidity of hours, difficulty of firing redundant employees and the cost of firing redundant workers )
− Measure of freedom of corruption (ICRG country guide)

10
Algeria
Argentina
Bolivia
Brazil
Chile
Colombia
Costa Rica
Dominican RepublicEcuador
Honduras
Indonesia
Malaysia
Mexico
MoroccoPakistan
Peru
Philippines
Sri Lanka
Thailand
Hungary
Norway
SwitzerlandAustraliaCanada
JapanNew Zealand
Singapore
.1.2
.3.4
.5.6
ILO
0 10 20 30 40Tariff
Algeria
Argentina
Bolivia
Brazil
Chile
Colombia
Costa Rica
Dominican RepublicEcuador
Indonesia
Malaysia
Mexico
MoroccoPakistan
Panama
Peru
Philippines
Sri Lanka
Thailand
AustriaFinlandHungary
Norway
SwitzerlandAustraliaCanadaIsrael
JapanNew Zealand
Singapore
.1.2
.3.4
.5.6
ILO
20 40 60 80 100Trd_rstr_KOF
Algeria
Argentina
Bolivia
Brazil
Chile
Colombia
Costa Rica
Dominican RepublicEcuador
Honduras
Indonesia
Malaysia
Mexico
MoroccoPakistan
Panama
PeruPhilippines
Sri Lanka
Thailand
AustriaFinlandHungary
NorwaySweden
SwitzerlandAustraliaCanada
Israel
JapanNew Zealand
Singapore
.1.2
.3.4
.5.6
ILO
0 100 200 300Tradegdp
Algeria
Argentina
Bolivia
Brazil
Chile
Colombia
Costa Rica
Dominican RepublicEcuador
Indonesia
Malaysia
Mexico
MoroccoPakistan
Panama
PeruPhilippines
Sri Lanka
Thailand
AustriaFinlandHungary
NorwaySweden
SwitzerlandAustraliaCanadaIsrael
JapanNew Zealand
Singapore
.1.2
.3.4
.5.6
ILO
20 40 60 80 100Tradeflows_KOF
ILO Informality and Trade Openess (means)

11
Algeria
Argentina
Bangladesh
Bolivia
Brazil
ChileChina
Colombia
Costa Rica
Cote d'Ivoire
Dominican RepublicEcuadorEgypt, Arab Rep.
Ghana
Guatemala
Honduras
India
Indonesia
Kenya
Korea, Rep.Malaysia MexicoMoroccoNepal
Nicaragua
Nigeria
Pakistan
Peru
PhilippinesSenegal
South Africa
Sri LankaThailandUruguay
Zambia
Zimbabwe
HungaryNorway
SwitzerlandUnited StatesAustraliaCanadaHong Kong, China
JapanNew ZealandSingapore
0.2
.4.6
.8
macro
0 10 20 30 40Tariff
Algeria
Argentina
Bangladesh
Benin
Bolivia
BrazilCameroon
ChileChina
Colombia
Costa RicaDominican RepublicEcuador
Egypt, Arab Rep.Ghana
Guatemala
India
Indonesia
Kenya
Korea, Rep.MalaysiaMexicoMoroccoNepal
Nicaragua
Pakistan
PanamaPeru
PhilippinesSenegal
South Africa
Sri LankaThailand Uruguay
Venezuela, RB
Zambia
Zimbabwe
Austria
FinlandFrance
GreeceHungary
IrelandNetherlands
NorwayPortugalSpain
SwitzerlandUnited StatesAustraliaCanadaIsrael
Japan New ZealandSingapore
0.2
.4.6
.8
macro
20 40 60 80 100Trd_rstr_KOF
Algeria
Argentina
Bangladesh
Benin
Bolivia
BrazilCameroon
ChileChina
Colombia
Costa Rica
Cote d'Ivoire
Dominican RepublicEcuadorEgypt, Arab Rep.
Ghana
Guatemala
Honduras
India
Indonesia
Kenya
Korea, Rep. MalaysiaMexicoMoroccoNepal
Nicaragua
Nigeria
Pakistan
PanamaPeru
PhilippinesSenegal
South Africa
Sri Lanka
Syrian Arab Republic
ThailandUruguay
Venezuela, RB
Zambia
Zimbabwe
Austria
BelgiumDenmarkFinland
FranceGermany
Greece Hungary
Ireland
Italy
Netherlands
NorwayPortugalSpainSweden
SwitzerlandUnited Kingdom
United StatesAustraliaCanada Hong Kong, China
Israel
JapanNew Zealand Singapore
0.2
.4.6
.8
macro
0 100 200 300Tradegdp
Algeria
Argentina
Bangladesh
Benin
Bolivia
BrazilCameroon
ChileChina
Colombia
Costa Rica
Cote d'Ivoire
Dominican RepublicEcuadorEgypt, Arab Rep.
Ghana
Guatemala
India
Indonesia
Kenya
Korea, Rep. MalaysiaMexicoMorocco
Nicaragua
Nigeria
Pakistan
PanamaPeru
PhilippinesSenegal
South Africa
Sri LankaThailandUruguay
Venezuela, RB
Zimbabwe
Austria
BelgiumDenmarkFinland
FranceGermany
Greece Hungary
Ireland
Italy
Netherlands
NorwayPortugalSpain Sweden
SwitzerlandUnited Kingdom
United StatesAustraliaCanadaIsrael
Japan New ZealandSingapore0
.2.4
.6.8
macro
20 40 60 80 100Tradeflows_KOF
Macroeclectic Informality and Trade Openess (means)

12
Algeria
Argentina
Bangladesh
Bolivia
Brazil
ChileChina
Colombia
Costa Rica
Cote d'Ivoire
Dominican RepublicEcuador Egypt, Arab Rep.Ghana
GuatemalaHonduras
IndiaIndonesia
Kenya
Korea, Rep.Malaysia Mexico
MoroccoNepal
Nicaragua
Nigeria
Pakistan
Peru
PhilippinesSenegal
South Africa
Sri Lanka
ThailandUruguay Zambia
Zimbabwe
Hungary
Norway
SwitzerlandUnited States
AustraliaCanadaHong Kong, China
JapanNew ZealandSingapore
10
20
30
40
50
60
Schn
eid
er
0 10 20 30 40Tariff
Algeria
Argentina
Bangladesh
Benin
Bolivia
Brazil
Cameroon
ChileChina
Colombia
Costa Rica
Dominican RepublicEcuadorEgypt, Arab Rep.Ghana
Guatemala
IndiaIndonesia
Kenya
Korea, Rep.MalaysiaMexico
MoroccoNepal
Nicaragua
Pakistan
Panama
Peru
PhilippinesSenegal
South Africa
Sri Lanka
ThailandUruguay
Venezuela, RB
Zambia
Zimbabwe
Austria
FinlandFrance
GreeceHungary
IrelandNetherlands
NorwayPortugalSpain
SwitzerlandUnited States
AustraliaCanada
Israel
Japan New ZealandSingapore
10
20
30
40
50
60
Schn
eid
er
20 40 60 80 100Trd_rstr_KOF
Algeria
Argentina
Bangladesh
Benin
Bolivia
Brazil
Cameroon
ChileChina
Colombia
Costa Rica
Cote d'Ivoire
Dominican RepublicEcuadorEgypt, Arab Rep.Ghana
GuatemalaHonduras
IndiaIndonesia
Kenya
Korea, Rep.MalaysiaMexico
MoroccoNepal
Nicaragua
Nigeria
Pakistan
Panama
Peru
PhilippinesSenegal
South Africa
Sri Lanka
Syrian Arab Republic
ThailandUruguay
Venezuela, RB
Zambia
Zimbabwe
Austria
Belgium
DenmarkFinlandFranceGermany
GreeceHungary
Ireland
Italy
Netherlands
NorwayPortugalSpainSweden
SwitzerlandUnited Kingdom
United StatesAustralia
Canada Hong Kong, China
Israel
JapanNew Zealand Singapore
10
20
30
40
50
60
Schn
eid
er
0 100 200 300Tradegdp
Algeria
Argentina
Bangladesh
Benin
Bolivia
Brazil
Cameroon
ChileChina
Colombia
Costa Rica
Cote d'Ivoire
Dominican RepublicEcuadorEgypt, Arab Rep.Ghana
Guatemala
IndiaIndonesia
Kenya
Korea, Rep.MalaysiaMexico
Morocco
Nicaragua
Nigeria
Pakistan
Panama
Peru
PhilippinesSenegal
South Africa
Sri Lanka
ThailandUruguay
Venezuela, RB
Zimbabwe
Austria
Belgium
DenmarkFinlandFranceGermany
GreeceHungary
Ireland
Italy
Netherlands
NorwayPortugalSpain
Sweden
SwitzerlandUnited Kingdom
United StatesAustralia
Canada
Israel
Japan New ZealandSingapore
10
20
30
40
50
60
Schn
eid
er
20 40 60 80 100Tradeflows_KOF
Schneider (2007) Informality and Trade Openess (means)

13
• Contrasting evidence across datasets but not across indicators
• Less restricited trade is associated with a larger share of informal output
• Less restricited trade is associated with a lower share of informal labor
• Results are robust to a series of changes in specification, controls and reference sample
4. Results

14
TRD TRADE FLOWS TARIFF TRADE RESTR
-0.000
(-1.25)
0.0249***
(2.66)
-0.005***
(-3.71)
0.00298***
(4.07)
896 840 581 742
64/ 113 60/ 113 49/ 113 53/ 59
Results from dynamic panel analysis (macro eclectic informality measure)

15
Results from dynamic panel analysis (ILO informality measure)
TRD TRADE
FLOWS
TARIFF TRADE RESTR
-0.000
(-1.08)
-0.000
(-1.57)
0.0679***
(3.08)
-0.0028
(-1.95)**
335 326 270 311
32/ 58 31/ 58 30/ 58 30/ 58

16
5. Discussion
• Results may suggest that unregistered activity has fallen with trade liberalisation but underground activity in registered firms has increased
• It is unlikely that productivity has increased in the unregistered sector and the size of the underground labour force (within the boundaries of registered firms)

17
Employment Production ProductionEmployment
Unregistered
Underground
Declared
Underground
Unregistered
Declared
Trade Liberalization
II
F F
Underground
Unregistered

18
5. Discussion
• The real issue seems to be undeclared production (/employment) in registered firms
• Lower informal employment (ILO definition) may be seen as a good news if workers move to formality (higher labour productivity)
• However, the overall incidence of precarity may have remained the same or even worsened

19
• Moreover tax evasion by registered firms have increased
• We may want to see these results as an evidence of smoother adjustment with eventually some possible improvements in overall labor productivity
• But the consequent fiscal cost is likely to be high with desastrous consequences for the financing of public goods and services

20
Policy Implications
• Not straightforward
• Usual candidate: safety nets also covering informal workers (avoid desperate choices)
• ISSUE: financing + efficiency & effectiveness

21
• Alternative: focus on measures able to contain tax evasion & stimulate hiring
– e.g.: temporary tax reductions/exemptions to firms hiring new employees + controls
• Formalization