Thermoelectric performance of multiphase XNiSn (X = Ti, Zr ... · Thermoelectric performance of...
9
Heriot-Watt University Research Gateway Heriot-Watt University Thermoelectric performance of multiphase XNiSn (X = Ti, Zr, Hf) half-Heusler alloys Downie, R. A.; Maclaren, D. A.; Bos, Jan-Willem G Published in: Journal of Materials Chemistry A DOI: 10.1039/c3ta13955g Publication date: 2014 Link to publication in Heriot-Watt Research Gateway Citation for published version (APA): Downie, R. A., Maclaren, D. A., & Bos, J-W. G. (2014). Thermoelectric performance of multiphase XNiSn (X = Ti, Zr, Hf) half-Heusler alloys. Journal of Materials Chemistry A, 2(17), 6107-6114. 10.1039/c3ta13955g General rights Copyright and moral rights for the publications made accessible in the public portal are retained by the authors and/or other copyright owners and it is a condition of accessing publications that users recognise and abide by the legal requirements associated with these rights. If you believe that this document breaches copyright please contact us providing details, and we will remove access to the work immediately and investigate your claim.
Transcript of Thermoelectric performance of multiphase XNiSn (X = Ti, Zr ... · Thermoelectric performance of...

Heriot-Watt University Research Gateway
Heriot-Watt University
Thermoelectric performance of multiphase XNiSn (X = Ti, Zr, Hf) half-Heusler alloys
Downie, R. A.; Maclaren, D. A.; Bos, Jan-Willem G
Published in:Journal of Materials Chemistry A
DOI:10.1039/c3ta13955g
Publication date:2014
Link to publication in Heriot-Watt Research Gateway
Citation for published version (APA):Downie, R. A., Maclaren, D. A., & Bos, J-W. G. (2014). Thermoelectric performance of multiphase XNiSn (X =Ti, Zr, Hf) half-Heusler alloys. Journal of Materials Chemistry A, 2(17), 6107-6114. 10.1039/c3ta13955g
General rightsCopyright and moral rights for the publications made accessible in the public portal are retained by the authors and/or other copyright ownersand it is a condition of accessing publications that users recognise and abide by the legal requirements associated with these rights.
If you believe that this document breaches copyright please contact us providing details, and we will remove access to the work immediatelyand investigate your claim.

Thermoelectric performance of multiphase XNiSn(X ¼ Ti, Zr, Hf) half-Heusler alloys†
R. A. Downie,a D. A. MacLarenb and J.-W. G. Bos*a
Quantitative X-ray powder diffraction analysis demonstrates thatmixing Ti, Zr and Hf on the ionic site in the
half-Heusler structure, which is a common strategy to lower the lattice thermal conductivity in this
important class of thermoelectric materials, leads to multiphase behaviour. For example, nominal
Ti0.5Zr0.5NiSn has a distribution of Ti1�xZrxNiSn compositions between 0.24 # x # 0.70. Similar variations
are observed for Zr0.50Hf0.5NiSn and Ti0.5Hf0.5NiSn. Electron microscopy and elemental mapping
demonstrate that the main compositional variations occur over micrometre length scales. The
thermoelectric power factors of the mixed phase samples are improved compared to the single phase
end-members (e.g. S2/r ¼ 1.8 mW m�1 K�2 for Ti0.5Zr0.5NiSn, compared to S2/r ¼ 1.5 mW m�1 K�2 for
TiNiSn), demonstrating that the multiphase behaviour is not detrimental to electronic transport.
Thermal conductivity measurements for Ti0.5Zr0.5NiSn0.95 suggest that the dominant reduction comes
from Ti/Zr mass and size difference phonon scattering with the multiphase behaviour a secondary effect.
Introduction
Waste heat recovery using thermoelectric generators is widelyexpected to become an important component of a sustainableenergy future.1–7 To achieve this, mass producible, high-perfor-mance thermoelectric materials are needed. The energyconversion efficiency of a material is given by its gure of merit,ZT ¼ (S2s/k)T, where S is the Seebeck coefficient, s the electricalconductivity and k is the sum of the lattice (klat) and electronic(kel) thermal conductivity. The central challenge in thermoelec-tric research is to nd materials where S, s and k can bedecoupled so that large ZT values become possible. Materialswith the half-Heusler structure are currently attracting muchinterest as thermoelectric materials due to their naturally largeSeebeck coefficients and low electrical resistivities. Unfortu-nately, their performance is limited by a relatively large thermalconductivity (k z 4 W m�1 K�1). The crystal structure of thesematerials consists of a covalent zincblende (YZ)n� framework,which is lled with positive Xn+ cations.8,9 Semiconductingbehaviour is observed for compositions with 18 valence elec-trons, themost studied of which are based on XNiSn (n-type) andXCoSb (p-type).10–13 Mixtures of X cations (commonly Zr and Hf)
are used to introduce mass differences, which reduce thethermal conductivity through point defect scattering. Less wellunderstood is the use of mixtures of Ti and Zr/Hf, wheresignicant differences in ionic radii exist. This extra degree offreedom leads to substantial local strain, which can be exploitedto minimise the lattice thermal conductivity and was used toachieve ZT ¼ 1.5 in samples with compositionTi0.5(Zr0.5Hf0.5)0.5NiSn.14 This result has remained irreproduc-ible,15 although promising gains in ZT have been reportedrecently.16,17 The large ZT values are found for samples where k
has been reduced to 2–3 W m�1 K�1, which is linked to thepreparation method, but the microscopic cause of the reductionis not clear. There is a general dearth of information on thecorrelation between composition, structure and properties of thehalf-Heusler materials. In particular, our earlier work indicatedthat arc-melted Ti0.5Zr0.5NiSn consisted of multiple half-Heuslerphases.18 This is not widely appreciated in the literature and hasnot been quantied, but could be relevant for the low latticethermal conductivities observed in the ZT ¼ 1.5 samples.Multiphase behaviour was recently considered as a plausibleexplanation for the large ZT values reported in refs. 16 and 17.The aim of the present study was to assess the impact of themultiphase behaviour on the thermoelectric properties. Wepreviously prepared TiNiSn samples by arc-melting but foundthat this also produced TiNi2Sn, Sn and Ti5Sn3, which graduallyconverted to TiNiSn upon prolonged annealing.18–20 This wascircumvented by using standard solid state reactions to gainmaximum control over nal composition and sample homoge-neity. Our study includes a variety of n-type materials: stoichio-metric Ti1�xZrxNiSn (0 # x # 1), nominally Sn decientTi1�xZrxNiSn0.95 (0 # x # 1), Ti0.50Hf0.50NiSn, Zr0.50Hf0.50NiSn
aInstitute of Chemical Sciences and Centre for Energy Storage and Recovery, School of
Engineering and Physical Sciences, Heriot-Watt University, Edinburgh, EH14 4AS, UK.
E-mail: [email protected], School of Physics and Astronomy, University of Glasgow, Glasgow, G12 8QQ,
UK
† Electronic supplementary information (ESI) available: Laboratory X-ray powderdiffraction data for all samples. Rened phase distributions and thermoelectricproperties of the Ti1�xZrxNiSn0.95 series. Low resolution image of theTi0.5Zr0.5NiSn FIB lamella. See DOI: 10.1039/c3ta13955g
Cite this: DOI: 10.1039/c3ta13955g
Received 1st October 2013Accepted 5th November 2013
DOI: 10.1039/c3ta13955g
www.rsc.org/MaterialsA
This journal is ª The Royal Society of Chemistry 2013 J. Mater. Chem. A
Journal ofMaterials Chemistry A
PAPER
Ope
n A
cces
s A
rtic
le. P
ublis
hed
on 0
5 N
ovem
ber
2013
. Dow
nloa
ded
on 1
1/02
/201
4 15
:54:
32.
Thi
s ar
ticle
is li
cens
ed u
nder
a C
reat
ive
Com
mon
s A
ttrib
utio
n 3.
0 U
npor
ted
Lic
ence
.
View Article OnlineView Journal

and HfNiSn. All samples were characterised using X-ray powderdiffraction andmeasurement of the thermoelectric power factor.Thermal conductivity, transmission electron microscopy andenergy dispersive X-ray elemental mapping data were collectedfor a subset of the samples.
Experimental
All samples were prepared by standard solid state reactions.Powders of the elemental precursors (Ti, 150 mesh; Zr,325 mesh; Hf, 150 mesh; Ni, 120 mesh; Sn, 100 mesh) weremixed using a mortar and pestle, cold pressed and heated at900 �C in vacuum sealed quartz tubes. The purities of allstarting materials were >99.9%. All samples were initiallyheated for 1 day, homogenised using mortar and pestle, pressedinto pellets and then re-heated without further homogenisa-tion. A preliminary Sn decient Ti1�xZrxNiSn0.95 series was usedto establish optimal anneal time. To that end, 6 separatelymixed 2 gram batches with composition Ti0.5Zr0.5NiSn0.95 wereheated at 900 �C for 1 day, followed by 3 days, 1, 2, 3, 4 and 6weeks. Simultaneously, a series of Ti1�xZrxNiSn0.95 (0 # x # 1)samples were also prepared by annealing for 6 weeks (3 gramscale). This revealed that 2 weeks was sufficient as no change inthe X-ray diffraction patterns was observed aer this point. TheSn deciency was initially chosen to better understand thecompositional stability of these samples. However, subsequentwork showed that the Sn deciency does not survive in the nalproduct.18 These samples acquired a light residue, accompaniedby a discolouration of the quartz tubes, which increased withannealing time. The residue was easily removed by sanding thepellets but could be completely prevented by wrapping them inTa foil. The Ti1�xZrxNiSn1�ySby series (0 # x # 1), HfNiSn,Zr0.5Hf0.5NiSn and Ti0.5Zr0.5NiSn samples were thereforeprepared by heating for 2 weeks at 900 �C wrapped inside Ta foilwith one intermediate homogenisation at 1 day (3 gram scale).Laboratory X-ray powder diffraction patterns were collected on aBruker D8 Advance diffractometer with monochromated Cu a1radiation. Datasets of 8 hours were used for Rietveld analysis.Rietveld ts were performed using the GSAS and EXPGUI suiteof programs.21,22 The temperature dependence of the Seebeckcoefficient and electrical resistivity were measured between35 and 500 �C using a Linseis LSR-3 high temperature Seebeckand resistance probe. The thermal conductivities of two Sndecient Ti0.5Zr0.5NiSn0.95 samples were measured between50 �C and 500 �C using an Anter Flashline 3000 ash diffusioninstrument. A Pyroceram reference sample was used to estimatethe heat capacity. The sample densities were 79(1)% (3 daysannealed sample) and 82(1) % (6 weeks annealed sample).Energy dispersive X-ray (EDX) analysis and Transmission Elec-tron Microscopy (TEM) were undertaken on a JEOL ARM 200cFinstrument operated at 200 kV and equipped with a BrukerXFlash detector. Data were acquired under the SpectrumImaging protocols of Gatan's Digital Micrograph sowarepackage. A thin lamella was cut from a sintered pellet using thefocused Ga+ beam of an FEI Nova Dual Beam instrument,employing standard li-out and polishing techniques. Damageto the surface region was minimised by in situ deposition of a
thin Pt capping layer. The approximately 2.5 � 4.5 mm2 lamellawas thinned to around 100 nm thickness, slightly too thick forhigh resolution transmission electron microscopy but sufficientto avoid fragmentation of the sintered grains.
Structural resultsMultiphase behaviour in Ti1�xZrxNiSn
The X-ray powder diffraction prole for the stoichiometricTi1�xZrxNiSn series reveals the presence of sharp symmetriclines for the x ¼ 0 and 1 end-members (Fig. S1a†). The inter-mediate compositions, however, exhibit signicant broadeningof the Bragg reections. LeBail ts conrmed TiNiSn and ZrNiSnto be single phase, while the x¼ 0.25, 0.5 and 0.75 samples weremodelled using 3–4 half-Heusler phases with different latticeparameters. This is illustrated in Fig. 1a, where the diffractiondata for Ti0.5Zr0.5NiSn has been tted using 4 distinct Ti1�xZrx-NiSn phases. Similar ts were carried out for the x ¼ 0.25 and x¼ 0.75 samples. Trial Rietveld ts showed that it was notpossible to accurately rene the fractional occupancy of the X-site. Instead, lattice parameters derived from LeBail ts (Table 1)were used to calculate the composition of each of the phasespresent using Vegard's law (a ¼ Px + Q). These values were thencombined with the phase fractions to yield an average value of x(Table 1) that in all cases closely matched the nominal value of x,demonstrating that the sample composition has not changedduring synthesis. The half-Heusler phases all showed substan-tial peak broadening, which was attributed to further composi-tional variations. In all ts, renement of one Gaussian (GW)and one Lorentzian (LY) parameter was sufficient to model thepeak shape. Renement of these parameters for x ¼ 0 and 1yielded almost identical values of GW z 0.12� and LY z 0.05�.These values were taken to represent the instrumental broad-ening and any broadening inherent to these samples that is notattributable to mixing Ti4+ and Zr4+. For the mixed phasesamples, the GW parameter was kept xed, while the LYparameter, which accounts for microstrain (Dd/d), was allowedto be rened freely. Using Vegard's law it is possible to relate Dd/d to a compositional variation (Dx): Dd/d ¼ Da/az (P/Q)Dx. Theresulting values for Dxi are given in Table 1. Each tted phase istherefore characterised by an average composition (xi) and acompositional spread (Dxi). This compositional variation isschematically illustrated in the inset to Fig. 1a, which displaysthe abundance of each phase, along with its compositionalvariation. The x ¼ 0.50 sample therefore has a semi-continuousdistribution of Ti1�xZrxNiSn phases with approximate limits0.24# x# 0.70, and spans a total Dxz 0.5. The x¼ 0.25 samplehas limits 0.16 # x # 0.43 (Dx z 0.3, Table 1). The x ¼ 0.75sample does not have a semi-continuous distribution but hasapproximate boundaries of 0.08# x# 0.32, 0.68# x# 0.86 and0.94 # x # 1.0. The preliminary Sn decient Ti1�xZrxNiSn0.95
series shows analogous multiphase behaviour, albeit withsomewhat narrower compositional spreads (e.g.Dxz 0.3 for x¼0.50). The results of the structural ts to the Sn decient seriesare summarized in Table S1† and the collected X-ray powderdiffraction patterns are shown in Fig. S2 (see ESI†). In previouswork on arc-melted Ti1�xZrxNiSn0.95 we observed that interstitial
J. Mater. Chem. A This journal is ª The Royal Society of Chemistry 2013
Journal of Materials Chemistry A Paper
Ope
n A
cces
s A
rtic
le. P
ublis
hed
on 0
5 N
ovem
ber
2013
. Dow
nloa
ded
on 1
1/02
/201
4 15
:54:
32.
Thi
s ar
ticle
is li
cens
ed u
nder
a C
reat
ive
Com
mon
s A
ttrib
utio
n 3.
0 U
npor
ted
Lic
ence
.View Article Online

Ni is present18 andmanifests itself as a shoulder in X-ray powderdiffraction data. This shoulder is completely masked by themultiphase behaviour for xs 0, 1. However, a small shoulder ispresent for the Sn decient x¼ 0 sample. The lattice parameters(Table S1†) may be used to estimate the amount of excess Ni,18
which suggests that this sample contains equal ratios of TiNiSnand TiNi1.02(1)Sn.
Multiphase behaviour in Ti0.5Hf0.5NiSn and Zr0.5Hf0.5NiSn
Hf-doped samples were modelled and analysed in exactly thesame way as the Ti1�xZrxNiSn series. The Gaussian and Lor-entzian prole parameters for HfNiSn were, within error,
identical to those for TiNiSn and ZrNiSn. The collected X-raypowder diffraction data are shown in Fig. S1b.† The reectionsfor Ti0.5Hf0.5NiSn (Fig. 1b) are again broadened and can bemodelled using 4 half-Heusler phases (Fig. 1b, Table 1). Thecompositional range is again semi-continuous and spans0.32 # x # to 0.61 (Dx z 0.3), which is about 40% smaller thanfor Ti0.5Zr0.5NiSn. This reduction derives from both a narrowerspread in xi and smaller Dxi values (inset to Fig. 1b). The X-rayreections for Zr0.5Hf0.5NiSn are much sharper but closerinspection reveals similar multiphase behaviour and 3 half-Heusler phases are needed to adequately t the diffractionpattern (Fig. 1c, Table 1). The phase distribution is notcontinuous and the approximate compositional boundaries are0.25 # x # 0.31, 0.44 # x # 0.50 and 0.64 # x # 0.80 (inset toFig 1c).
EDX analysis of Ti0.5Zr0.5NiSn
A low magnication image of the FIB lamella prepared from theTi0.5Zr0.5NiSn pellet is shown in Fig S3.† The lamella clearlycomprises several particles that have started to thin unevenlyand to separate from each other during the nal stages of ionpolishing. Four distinct regions, typically of order 500 �500 nm2 in size, were analysed using EDX spectroscopy: the
Fig. 1 Observed (blue circles), calculated (red line) and difference (green line)Lebail profiles for fits to X-ray powder diffraction data for (a) Ti0.5Zr0.5NiSn, (b)Ti0.5Hf0.5NiSn and (c) Zr0.5Hf0.5NiSn. The Bragg reflection markers correspond tothe half-Heusler phases used to obtain a satisfactory fit. The insets show a close-up of the fit to the (422) reflection, demonstrating the multiphase behaviour, andgive an indication of the distribution of x-values in this sample. The latter histo-grams were obtained by combining xi, Dxi and the mole fractions for the phasesused to fit the diffraction pattern.
Table 1 Nominal composition, lattice parameter (a), Vegard composition (xi),composition spread (Dxi), molar percentage (mol%), average composition (xavg)and goodness-of-fit (c2) for the Ti1�xZrxNiSn1�ySby, Zr1�xHfxNiSn and Ti1�xHfxNiSnseries.
x,y a (A) xi Dx mol% xavg c2
Ti1�xZrxNiSn1�ySby0 5.9300(1) 0 0 100 0 1.90.25 5.9340(1) 0.02(1) 0 1.4(7) 0.27(1) 1.9
5.9724(1) 0.24(1) 0.17(1) 71.4(7)5.9923(2) 0.35(1) 0.16(1) 27.2(7)
0.5 5.9883(2) 0.33(1) 0.18(1) 17.3(2) 0.52(1) 2.36.0189(2) 0.50(1) 0.18(1) 26.7(6)6.0385(1) 0.61(1) 0.17(1) 55.4(2)6.1024(3) 0.97(1) 0 6.6(6)
0.75 5.9646(2) 0.20(1) 0.24(1) 7.9(2) 0.78(1) 2.16.0662(1) 0.77(1) 0.18(1) 60.4(2)6.1022(1) 0.97(1) 0.06(1) 31.7(2)
1.0 6.1079(1) 1 0 100 1 2.10.5, 0.01 5.9977(2) 0.38(1) 0.26(1) 31.7(4) 0.51(1) 2.6
6.0310(1) 0.57(1) 0.18(1) 67.2(4)6.1005(3) 0.98(1) 0 1.1(1)
0.5, 0.02 5.9972(1) 0.38(1) 0.16(1) 26.4(4) 0.51(1) 3.26.0247(1) 0.53(1) 0.18(1) 67.9(4)6.0998(2) 0.95(1) 0.09(1) 5.7(1)
Zr1�xHfxNiSn0.5 6.0849(1) 0.73(2) 0.15(1) 15.4(6) 0.45(1) 2.5
6.0931(1) 0.47(1) 0.05(1) 56.9(6)6.0992(1) 0.28(2) 0.05(1) 27.8(6)
1 6.0764(1) 0 0 100 0 2.4
Ti1�xHfxNiSn0.5 5.9891(2) 0.40(1) 0.16(1) 24.6(6) 0.52(1) 1.4
6.0058(1) 0.52(1) 0.04(1) 18.1(2)6.0149(1) 0.58(1) 0.05(1) 56.4(6)6.0559(5) 0.86(1) 0.04(1) 0.9(1)
This journal is ª The Royal Society of Chemistry 2013 J. Mater. Chem. A
Paper Journal of Materials Chemistry A
Ope
n A
cces
s A
rtic
le. P
ublis
hed
on 0
5 N
ovem
ber
2013
. Dow
nloa
ded
on 1
1/02
/201
4 15
:54:
32.
Thi
s ar
ticle
is li
cens
ed u
nder
a C
reat
ive
Com
mon
s A
ttrib
utio
n 3.
0 U
npor
ted
Lic
ence
.View Article Online

approximate locations are indicated in Fig. S3.† Compositionalanalysis of the four regions is presented in Fig. 2, where theimages in the le column are dark eld scanning TEM (STEM)images with contrast dominated by thickness, mass anddiffraction effects. The panels in the right column derive from a‘spectrum image’ of each region, acquired by collecting EDXspectra from 10 � 10 nm2 pixels across the area. Background-subtracted Zr–K, Sn–L, Ti–K and Ni–K EDX peaks were
integrated to generate pixel-by-pixel composition maps using(standard-less) Cliff–Lorimer analysis, a protocol that is suffi-cient to reveal relative composition variations within thelamella but can be less reliable for absolute quantication.23
The material in each of the four regions appears structurallydifferent. Fig. 2a is of a particle with a generally smoothcomposition. The STEM contrast is modulated by brighterbands that are consistent with grain boundaries within theparticle but there is no evidence of sharp features such as thespots and lines oen observed elsewhere in materials withnanoinclusions.24 Images collected at higher resolution(not shown) did not reveal any such features on shorterlengthscales. The four panels within Fig. 2b are compositionmaps of this rst region and reveal no statistically-signicantspatial variations in composition, either by direct analysis ofEDX peak intensities or principle component analysis.23 Forexample, there is no obvious compositional trend associatedwith the brighter grain boundaries of the STEM image. Indeed,histograms of pixel-by-pixel X-ray counts for the four elementsdo not show broadening beyond that expected for Poissonstatistics. The material in image Fig. 2c, and associated maps ofFig. 2d yield a similar result; in this case, the analysis regionstraddles three distinct particles and aside from a small Ti-richimpurity, the three particles are largely homogeneous, do notshow substantial compositional variations and have no clearregions of Ti or Zr enrichment across the 10 nm to 1000 nmlengthscales probed. The material analysed in Fig. 2e–g, on theother hand, appears less uniform. Both STEM images havenoticeable black-white contrast variations that suggest that thepowdered material has not fully fused and recrystallised to formuniform particles. Although the majority of features apparent inthe STEM images do not correspond to pronounced changes incomposition, there are complementary regions of Zr enhance-ment and Ti depletion in both cases, whilst narrow bandswithin the Sn maps suggest slight Sn segregation to grainboundaries. Compositional variations within these two areasare below 10 atomic% and it is notable that they span relativelylarge areas rather than discrete locations within a backgroundmatrix.
Surprisingly, the average compositions of the four analysedareas are very similar. A simple analysis yields typical atomicratios of 0.13 (Ti), 0.26 (Zr) 0.29 (Ni) and 0.32 (Sn), consistentwith the approximate composition Ti0.33Zr0.67NiSn and withinthe range indicated by X-ray diffraction. If the absolute quan-tication is correct then the apparent Ti depletion and Zrenrichment must be matched by other particles that were notsampled in this lamella but an alternate, Ti-rich, Zr-depletedcomposition.
In summary, the most signicant result from the STEM-EDX analysis is the identication of particle-by-particlemicrostructural variations that are consistent with the large-scale multiphase behaviour and continuous compositionalspread identied by XRD analysis. Some particles (such asthose of Fig. 2a and c) are homogenous and of a uniformcomposition that may deviate from that of the completepellet. Other particles show greater structural and composi-tional variations on a 100 nm length scale and are
Fig. 2 Energy dispersive X-ray analysis elemental analysis of four regions withina thin lamella cut from the sintered Ti0.5Zr0.5NiSn pellet. The images in the left-hand column (a,c,e and g) are STEM dark-field images of the four regions. Thepanels in the right-hand column (b,d,f and h) are associated elemental maps,showing the profiles of Ti, Zr, Ni and Sn within each analysis region, based on10 nm � 10 nm pixels. In the first region, maps (b) derive from the dashedrectangular area of (a) whilst subsequent maps derive from the whole STEMimage. The derived composition for the first area is Ti : Zr : Ni : Sn ¼13% : 26% : 29% : 32%, similar to that of the other 3 regions and approximatelycorresponding to the composition Ti0.33Zr0.67NiSn. All four regions are thereforerelatively rich in Zr and deficient in Ti.
J. Mater. Chem. A This journal is ª The Royal Society of Chemistry 2013
Journal of Materials Chemistry A Paper
Ope
n A
cces
s A
rtic
le. P
ublis
hed
on 0
5 N
ovem
ber
2013
. Dow
nloa
ded
on 1
1/02
/201
4 15
:54:
32.
Thi
s ar
ticle
is li
cens
ed u
nder
a C
reat
ive
Com
mon
s A
ttrib
utio
n 3.
0 U
npor
ted
Lic
ence
.View Article Online

presumably further from local thermodynamic equilibrium.In these cases there is some evidence of Sn segregation atgrain boundaries and of complementary variations in Ti andZr content. All of the particles analysed lacked the charac-teristic contrast variations in STEM images that would beconsistent with the strain elds of small inclusions on a sub-10 nm lengthscale.
Thermoelectric properties
The temperature dependence of the electrical resistivity (r ¼1/s), Seebeck coefficient (S) and power factor (S2/r) forTi1�xZrxNiSn are shown in Fig. 3. All non-Sb doped samples are
characterised by large, negative S ¼ �320–385 mV K�1 at roomtemperature (RT), decreasing to approx. �280 mV K�1 at 700 K.All samples exhibit very similar behaviour and the magnitudesof S(T) are in line with the best reported values.14 All Ti1�xZrx-NiSn samples are semiconductors, with r ¼ 10–20 mU cm at RTand 5 mU cm at 700 K. The exception is ZrNiSn which has r(T)values over 4 times higher than the rest of the samples. Thedensities of these samples fall between 65% of the theoreticaldensity for the end-members to 80% for x ¼ 0.50 (Table 2). As aresult, the r(T) values are approximately double those reportedin the literature. Nonetheless, the large S(T) means promisingS2/r z 1.75 mW m�1 K�2 are observed for x ¼ 0.25 and 0.50 at700 K, while the x ¼ 0 sample has 1.50 mW m�1 K�2 at 700 K.The electronic properties of the promising x ¼ 0.5 sample wereoptimised using Sb doping (Fig. 3). The introduction of addi-tional charge carriers causes a rapid reduction of r(T) and yieldsa metallic temperature dependence with values of around 1 mU
cm at RT, rising to 2 mU cm at 700 K for 0.5% Sb. Furtherreductions in r are found in the samples doped with 1 and 2%Sb. The effect on S(T) is a reduction over the entire measuredtemperature range but the drop is most pronounced at RT,where S decreases from �320 mV K�1 to �200 mV K�1 for 0.5%Sb. Further increases in doping result in further decreases inS(T). The thermoelectric power factor is optimised for samplesdoped with 1–2% Sb and attains a maximum value of S2/r z2.75 mWm�1 K�2 at 650 K. The nominally Sn decient samplesbehave very similarly (Fig. S4†). These samples are characterisedby slightly lower S (�200–250 mV K�1 at RT, �175–225 mV K�1 at700 K) and reduced r (4–10 mU cm at RT, 2–4 mU cm at 700 K).The lower S(T) values are compensated by the reduced r(T),resulting in similar S2/r values when compared with theirstoichiometric counterparts (Fig. S3†). The Ti0.5Hf0.5NiSnsample exhibits very similar behaviour to Ti0.5Zr0.5NiSn, withalmost identical values for S(T) (Fig. 4). A slight increase in r(T)leads to a reduced S2/r (Table 2). Zr0.5Hf0.5NiSn shows markedlydifferent behaviour, with a clear maximum at �525 K (Fig. 4).Similar behaviour is observed for HfNiSn (Fig. 4). This leads tomaximum S2/r values of 1.6 (x ¼ 0.5) and 0.8 mW m�1 K�2
(x ¼ 0) at �620 K.
Fig. 3 Temperature dependence of (a) the Seebeck coefficient (S), (b) the elec-trical resistivity (r) and (c) the power factor (S2/r) for the Ti1�xZrxNiSn andTi0.5Zr0.5NiSn1�ySby series.
Table 2 Densities, room temperature Seebeck (S) and resistivity (r) values andmaximum power factor (S2/r) for Ti1�xZrxNiSn1�ySby, Zr1�xHfxNiSn andTi1�xHfxNiSn
Composition
Density(% oftheoretical)
S(mV K�1)
r
(mU cm)
Max.S2/r(mW m�1 K�1)
TiNiSn 77 �357 20.6 1.5 (700 K)Ti0.75Zr0.25NiSn 83 �381 19.0 1.8 (700 K)Ti0.5Zr0.5NiSn 80 �324 13.6 1.8 (645 K)Ti0.25Zr0.75NiSn 81 �225 12.1 1.4 (685 K)ZrNiSn 68 �372 121.6 0.3 (605 K)Ti0.5Zr0.5NiSn0.99Sb0.01 81 �145 1.1 2.7 (625 K)Ti0.5Zr0.5NiSn0.98Sb0.02 79 �105 0.6 2.8 (650 K)HfNiSn 73 �237 19.1 0.8 (610 K)Zr0.5Hf0.5NiSn 78 �301 20.3 1.6 (625 K)Ti0.5Hf0.5NiSn 72 �314 19.1 1.4 (725 K)
This journal is ª The Royal Society of Chemistry 2013 J. Mater. Chem. A
Paper Journal of Materials Chemistry A
Ope
n A
cces
s A
rtic
le. P
ublis
hed
on 0
5 N
ovem
ber
2013
. Dow
nloa
ded
on 1
1/02
/201
4 15
:54:
32.
Thi
s ar
ticle
is li
cens
ed u
nder
a C
reat
ive
Com
mon
s A
ttrib
utio
n 3.
0 U
npor
ted
Lic
ence
.View Article Online

Discussion
Structural analysis and elemental mapping of X1�xX0xNiSn
samples (with X and X0 chosen from Ti, Zr and Hf) hasdemonstrated that these materials exhibit multiphase behav-iour for x s 0,1. In the case of Ti0.5Zr0.5NiSn and Ti0.5Hf0.5NiSnan almost continuous distribution of x-values exists, spanning alarge x-interval (Dx # 0.5 and Dx # 0.3, respectively). ForZr0.5Hf0.5NiSn, narrower distributions centred around xi valuesthat span a similar interval are observed. The absence of a solidsolution or two well-dened compositions of varying weightfractions precludes these systems from being under thermody-namic control. The end-members easily form phase purematerials (phase pure samples are obtained aer only one day)
and the multiphase behaviour must therefore be linked to themixing of X–metals. However, the degree of multiphase behav-iour does not simply scale with the size difference between Ti, Zrand Hf. This is evident from the difference in behaviour for theTi–Zr and Ti–Hf series where a similar size difference betweenthe X-cations exists. [An estimate of the size difference can beobtained from the lattice parameters; a ¼ 5.93 A (Ti); a ¼ 6.11 A(Zr) and a ¼ 6.08 A (Hf)]. It is also inconsistent with the similarspread in xi values for the Zr–Hf series despite the small sizedifference. The electron microscopy clearly demonstrates thatthe compositional variations occur on multiple length scales,from 100 nm-scaled variations within some particles, throughparticle-by-particle structural variations on the micron scaleand, indeed, with the suggestion that the scale of variationsexceeds that of the FIB lamella. The observed S(T) and r(T)values for the prepared series are in keeping with the widerliterature on thesematerials, and in particular the S(T) values forthe Ti1�xZrxNiSn series are among the highest observed.14
The time dependent study undertaken on the Ti0.5Zr0.5-NiSn0.95 composition affords important insight into the distri-bution of phases in these samples (Fig. 5). Aer one day theelemental precursors have formed a ZrNiSn phase with sharppeaks and a broader hump corresponding to the mixedTi1�xZrxNiSn phases. Upon annealing, these phases react andthe Ti1�xZrxNiSn phases increase in abundance, graduallygaining a narrower distribution. The quantitative phase anal-ysis (Fig. 5b) reveals that xi and Dxi (given as the error bars onthe xi values) do not change signicantly aer two weeks, whichcan also be seen directly from the peak shape (Fig. 5a). Thesystem therefore never reaches equilibrium, and remainsmultiphase. Note that these samples were only mechanicallyhomogenised once, aer one day of annealing, aer which itbecame impossible to cold-press pellets. The impact on thethermoelectric properties can be assessed by comparing S(T),r(T) and k(T)¼ klat(T) + kel(T) for the samples annealed for 3 days(3 d) and 6 weeks (6 wk). The r(T) and S(T) are nearly identicalfor the 3 d and 6 wk samples demonstrating that the narrowingof the phase-distribution has little impact on the electronicproperties (Fig. 5c and d). The anomaly in r(T) at 500 K coin-cides with the melting point of Sn which is present as a minorimpurity in the Sn decient samples. Interpretation of k(T) isnot straightforward as the raw data are affected by porosityeffects due to the �80% sample densities. Voids have a low k
and this can dominate the thermal response making it difficultto detect changes intrinsic to the material. The measured k(T) isidentical for the 3 d and 6 wk samples and independent oftemperature with an average k¼ 2.5 Wm�1 K�1. This is a ratherlow value compared to the literature, suggesting porosity effectsneed to be taken into account. For this reason, the k(T) ¼ klat(T)+ kel(T) data were normalized to the k(T) data for a >95% densearc-melted Ti0.5Zr0.5NiSn0.95 sample previously published.18 Thephase-distribution for this sample is given in Table S1.† The arc-melted sample has a temperature independent k(T) between 350and 700 K with an average k ¼ 4.3 W m�1 K�1. This yields ascaling factor (�1.7) that was applied to klat(T)¼ k(T)� kel(T) forthe 3 d and 6 wk samples, where kel(T) ¼ LT/r(T) was calculatedusing the r(T) data in Fig. 5c (L ¼ 2.4 � 10�8 W U K�2). The
Fig. 4 Temperature dependence of (a) the Seebeck coefficient (S), (b) the elec-trical resistivity (r) and (c) the power (S2/r) for the other studied XNiSn compo-sitions (X ¼ Hf, Ti0.5Zr0.5, Ti0.5Hf0.5 and Zr0.5Hf0.5).
J. Mater. Chem. A This journal is ª The Royal Society of Chemistry 2013
Journal of Materials Chemistry A Paper
Ope
n A
cces
s A
rtic
le. P
ublis
hed
on 0
5 N
ovem
ber
2013
. Dow
nloa
ded
on 1
1/02
/201
4 15
:54:
32.
Thi
s ar
ticle
is li
cens
ed u
nder
a C
reat
ive
Com
mon
s A
ttrib
utio
n 3.
0 U
npor
ted
Lic
ence
.View Article Online
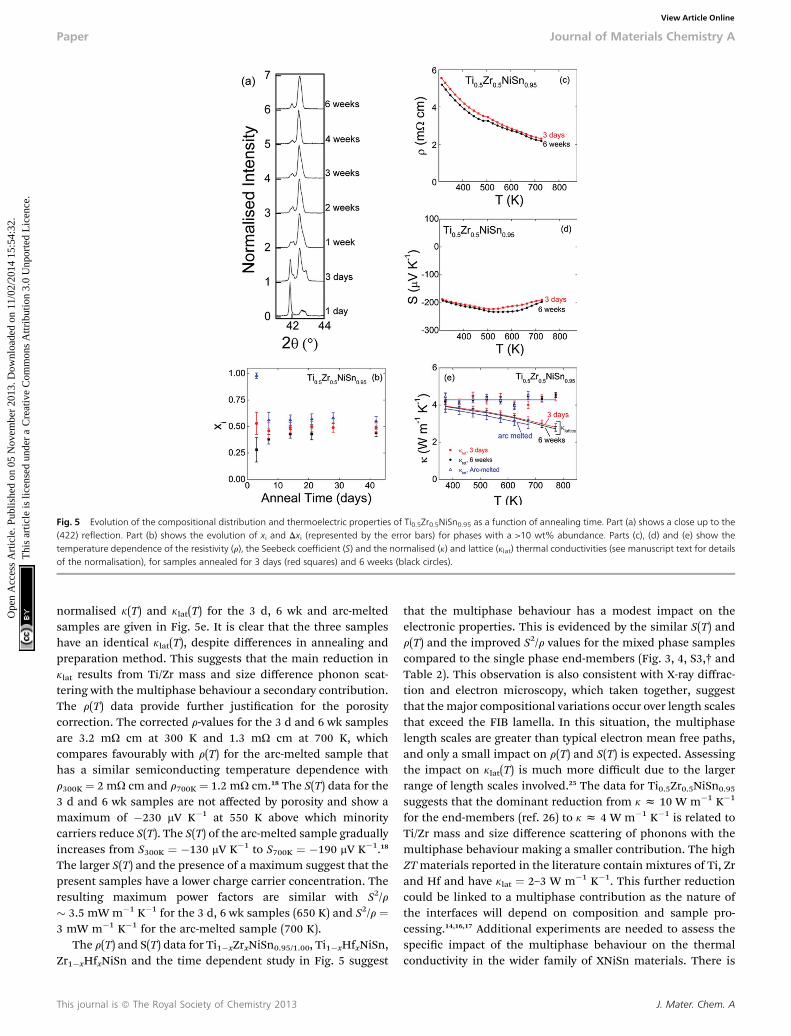
normalised k(T) and klat(T) for the 3 d, 6 wk and arc-meltedsamples are given in Fig. 5e. It is clear that the three sampleshave an identical klat(T), despite differences in annealing andpreparation method. This suggests that the main reduction inklat results from Ti/Zr mass and size difference phonon scat-tering with the multiphase behaviour a secondary contribution.The r(T) data provide further justication for the porositycorrection. The corrected r-values for the 3 d and 6 wk samplesare 3.2 mU cm at 300 K and 1.3 mU cm at 700 K, whichcompares favourably with r(T) for the arc-melted sample thathas a similar semiconducting temperature dependence withr300K ¼ 2 mU cm and r700K ¼ 1.2 mU cm.18 The S(T) data for the3 d and 6 wk samples are not affected by porosity and show amaximum of �230 mV K�1 at 550 K above which minoritycarriers reduce S(T). The S(T) of the arc-melted sample graduallyincreases from S300K ¼ �130 mV K�1 to S700K ¼ �190 mV K�1.18
The larger S(T) and the presence of a maximum suggest that thepresent samples have a lower charge carrier concentration. Theresulting maximum power factors are similar with S2/r� 3.5 mWm�1 K�1 for the 3 d, 6 wk samples (650 K) and S2/r ¼3 mW m�1 K�1 for the arc-melted sample (700 K).
The r(T) and S(T) data for Ti1�xZrxNiSn0.95/1.00, Ti1�xHfxNiSn,Zr1�xHfxNiSn and the time dependent study in Fig. 5 suggest
that the multiphase behaviour has a modest impact on theelectronic properties. This is evidenced by the similar S(T) andr(T) and the improved S2/r values for the mixed phase samplescompared to the single phase end-members (Fig. 3, 4, S3,† andTable 2). This observation is also consistent with X-ray diffrac-tion and electron microscopy, which taken together, suggestthat the major compositional variations occur over length scalesthat exceed the FIB lamella. In this situation, the multiphaselength scales are greater than typical electron mean free paths,and only a small impact on r(T) and S(T) is expected. Assessingthe impact on klat(T) is much more difficult due to the largerrange of length scales involved.25 The data for Ti0.5Zr0.5NiSn0.95
suggests that the dominant reduction from k z 10 W m�1 K�1
for the end-members (ref. 26) to k z 4 W m�1 K�1 is related toTi/Zr mass and size difference scattering of phonons with themultiphase behaviour making a smaller contribution. The highZTmaterials reported in the literature contain mixtures of Ti, Zrand Hf and have klat ¼ 2–3 W m�1 K�1. This further reductioncould be linked to a multiphase contribution as the nature ofthe interfaces will depend on composition and sample pro-cessing.14,16,17 Additional experiments are needed to assess thespecic impact of the multiphase behaviour on the thermalconductivity in the wider family of XNiSn materials. There is
Fig. 5 Evolution of the compositional distribution and thermoelectric properties of Ti0.5Zr0.5NiSn0.95 as a function of annealing time. Part (a) shows a close up to the(422) reflection. Part (b) shows the evolution of xi and Dxi (represented by the error bars) for phases with a >10 wt% abundance. Parts (c), (d) and (e) show thetemperature dependence of the resistivity (r), the Seebeck coefficient (S) and the normalised (k) and lattice (klat) thermal conductivities (see manuscript text for detailsof the normalisation), for samples annealed for 3 days (red squares) and 6 weeks (black circles).
This journal is ª The Royal Society of Chemistry 2013 J. Mater. Chem. A
Paper Journal of Materials Chemistry A
Ope
n A
cces
s A
rtic
le. P
ublis
hed
on 0
5 N
ovem
ber
2013
. Dow
nloa
ded
on 1
1/02
/201
4 15
:54:
32.
Thi
s ar
ticle
is li
cens
ed u
nder
a C
reat
ive
Com
mon
s A
ttrib
utio
n 3.
0 U
npor
ted
Lic
ence
.View Article Online

great current interest in nanostructured half-Heuslers withformula XNi1+ySn.18,24,27–32 In these materials, the excess Ni (y) ispresent as interstitials and as full-Heusler (nano) precipitates(e.g. TiNi2Sn). The electron microscopy data reported here donot show any evidence for the presence of nano-inclusions,which is as expected, in keeping with the stoichiometric startingcompositions. The diffraction data suggest the presence ofsome interstitial Ni in the Sn decient materials (e.g. TiNiSn0.95
/ TiNi1.01Sn). This may have an impact on the thermoelectricproperties, and in particular on klat, although the amount issmall compared to reports where signicant reductions of klatwere observed (y ¼ 0.05 � 0.2).18,24,28
To summarize, the key conclusion from our quantitativediffraction and microscopy study is that all XNiSn half-Heuslers(where X is a mixture of Ti, Zr and Hf) exhibit multiphasebehaviour due to kinetic limitations during the synthesis. Themain compositional variations occur over length scales greaterthan the FIB lamella (2.5 � 4.5 mm2) with smaller particle byparticle and variations within particles also evident. The similarr(T) and S(T) and improved S2/r values demonstrate that themultiphase behaviour is not detrimental to the electronictransport, while further work is needed to assess the preciseimpact on the thermal conductivity of the XNiSn compositions.
Acknowledgements
We acknowledge support from the EPSRC (EP/J000884/1) andthe Royal Society.
References
1 G. J. Snyder and E. S. Toberer, Nat. Mater., 2008, 7, 105–114.2 J. R. Sootsman, D. Y. Chung and M. G. Kanatzidis, Angew.Chem., Int. Ed., 2009, 48, 8616–8639.
3 G. S. Nolas, J. Poon and M. Kanatzidis, MRS Bull., 2006, 31,199–205.
4 A. J. Minnich, M. S. Dresselhaus, Z. F. Ren and G. Chen,Energy Environ. Sci., 2009, 2, 466–479.
5 M. G. Kanatzidis, Chem. Mater., 2010, 22, 648–659.6 C. J. Vineis, A. Shakouri, A. Majumdar and M. G. Kanatzidis,Adv. Mater., 2010, 22, 3970–3980.
7 M. Zebarjadi, K. Esfarjani, M. S. Dresselhaus, Z. F. Ren andG. Chen, Energy Environ. Sci., 2012, 5, 5147–5162.
8 H. C. Kandpal, C. Felser and R. Seshadri, J. Phys. D: Appl.Phys., 2006, 39, 776–785.
9 T. Graf, C. Felser and S. S. P. Parkin, Prog. Solid State Chem.,2011, 39, 1–50.
10 C. Uher, J. Yang, S. Hu, D. T. Morelli and G. P. Meisner, Phys.Rev. B: Condens. Matter Mater. Phys., 1999, 59, 8615–8621.
11 Y. Xia, S. Bhattacharya, V. Ponnambalam, A. L. Pope,S. J. Poon and T. M. Tritt, J. Appl. Phys., 2000, 88, 1952–1955.
12 S. Bhattacharya, A. L. Pope, R. T. Littleton, T. M. Tritt,V. Ponnambalam, Y. Xia and S. J. Poon, Appl. Phys. Lett.,2000, 77, 2476–2478.
13 Q. Shen, L. Chen, T. Goto, T. Hirai, J. Yang, G. P. Meisner andC. Uher, Appl. Phys. Lett., 2001, 79, 4165–4167.
14 S. Sakurada and N. Shutoh, Appl. Phys. Lett., 2005, 86,082105.
15 S. R. Culp, S. J. Poon, N. Hickman, T. M. Tritt and J. Blumm,Appl. Phys. Lett., 2006, 88, 042106.
16 M. Schwall and B. Balke, Phys. Chem. Chem. Phys., 2013, 15,1868–1872.
17 S. Populoh, M. H. Aguirre, O. C. Brunko, K. Galazka, Y. Luand A. Weidenkaff, Scr. Mater., 2012, 66, 1073–1076.
18 R. A. Downie, D. A. MacLaren, R. I. Smith and J. W. G. Bos,Chem. Commun., 2013, 49, 4184–4186.
19 Y. Gelbstein, N. Tal, A. Yarmek, Y. Rosenberg, M. P. Dariel,S. Ouardi, B. Balke, C. Felser and M. Kohne, J. Mater. Res.,2011, 26, 1919–1924.
20 T. Katayama, S. W. Kim, Y. Kimura and Y. Mishima,J. Electron. Mater., 2003, 32, 1160–1165.
21 A. C. Larson and R. B. Von Dreele, in General StructureAnalysis System (GSAS), 2000.
22 B. H. Toby, J. Appl. Crystallogr., 2001, 34, 210–213.23 D. B. Willams and C. B. Carter, Transmission Electron
Microscopy, Springer, New York, 1996.24 Y. W. Chai and Y. Kimura, Acta Mater., 2013, 61, 6684–
6697.25 J. Shiomi, K. Esfarjani and G. Chen, Phys. Rev. B: Condens.
Matter Mater. Phys., 2011, 84, 104302.26 H. Hohl, A. P. Ramirez, W. Kaefer, K. Fess, C. Thurner,
C. Kloc and E. Bucher, in Thermoelectric Materials – NewDirections and Approaches, eds. T. M. Tritt, M. G.Kanatzidis, H. B. Lyon and G. D. Maham, 1997, pp. 109–114.
27 C. S. Birkel, J. E. Douglas, B. R. Lettiere, G. Seward, N. Verma,Y. C. Zhang, T. M. Pollock, R. Seshadri and G. D. Stucky,Phys. Chem. Chem. Phys., 2013, 15, 6990–6997.
28 Y. W. Chai and Y. Kimura, Appl. Phys. Lett., 2012, 100,033114–033113.
29 J. E. Douglas, C. S. Birkel, M. S. Miao, C. J. Torbet,G. D. Stucky, T. M. Pollock and R. Seshadri, Appl. Phys.Lett., 2012, 101, 183902.
30 H. Hazama, M. Matsubara, R. Asahi and T. Takeuchi, J. Appl.Phys., 2011, 110, 063710–063716.
31 J. P. A. Makongo, D. K. Misra, X. Zhou, A. Pant,M. R. Shabetai, X. Su, C. Uher, K. L. Stokes andP. F. P. Poudeu, J. Am. Chem. Soc., 2011, 133, 18843–18852.
32 J. P. A. Makongo, D. K. Misra, J. R. Salvador, N. J. Takas,G. Wang, M. R. Shabetai, A. Pant, P. Paudel, C. Uher,K. L. Stokes and P. F. P. Poudeu, J. Solid State Chem., 2011,184, 2948–2960.
J. Mater. Chem. A This journal is ª The Royal Society of Chemistry 2013
Journal of Materials Chemistry A Paper
Ope
n A
cces
s A
rtic
le. P
ublis
hed
on 0
5 N
ovem
ber
2013
. Dow
nloa
ded
on 1
1/02
/201
4 15
:54:
32.
Thi
s ar
ticle
is li
cens
ed u
nder
a C
reat
ive
Com
mon
s A
ttrib
utio
n 3.
0 U
npor
ted
Lic
ence
.View Article Online