Sweet Corrosion inLargeDiameter, Inclined Multiphase Pipelines · Sweet Corrosion inLargeDiameter,...
21
Sweet Corrosion in Large Diameter, Inclined Multiphase Pipelines Madan Gopal NSF, I/UCRC, Corrosion in Multiphase Systems Center Ohio University Athens, Ohio 45701, USA (740) 593-9949 [email protected] C.Kang NSF, I/UCRC, Corrosion in Multiphase Systems Center Ohio University Athens, Ohio 45701, USA (740) 593-9949 [email protected] J. Maley NSF, I/UCRC, Corrosion in Multiphase Systems Center Ohio University Athens, Ohio 45701, USA . (740) 593-9949 W.P.Jepson NSF, I/UCRC, Corrosion in Multiphase Systems Center Ohio University Athens, Ohio 45701, USA (740) 593-9949 [email protected] ABSTRACT There is little knowledge on flow characteristics and their subsequent effect on corrosion in inclined flowlines. This information isessential fortheproper design andoperation ofsubsea andhilly terrain multiphase pipelines. Experiments have been carried out to determine the effect of multiphase flows on sweet corrosion in 10 cm diameter, inclined, oil/water/gas pipelines that can operated up to pressures of 150 bar. Carbon dioxide partial pressures up to 0.79 MPa have been studied at inclinations of 0,2, 5, and 15 degreesatatemperature of40C.Watercutsof100,80,and40%were usedwithalightcondensate typeoilhavingadensityof800kg/m 3 and viscosity of 2 cP at 40 C. The liquid and gas superficial velocities ranged from 0.2 to 3 mls and2to10 mls respectively. Anew, nonintrusive technique to determine flow regime and slug characteristics has been developed using differential pressure transducers. These detect the presence of slugs and are used to measure
Transcript of Sweet Corrosion inLargeDiameter, Inclined Multiphase Pipelines · Sweet Corrosion inLargeDiameter,...

Sweet Corrosion in Large Diameter,Inclined Multiphase Pipelines
Madan GopalNSF, I/UCRC, Corrosion in Multiphase Systems Center
Ohio UniversityAthens, Ohio 45701, USA
(740) [email protected]
C. KangNSF, I/UCRC, Corrosion in Multiphase Systems Center
Ohio UniversityAthens, Ohio 45701, USA
(740) [email protected]
J. MaleyNSF, I/UCRC, Corrosion in Multiphase Systems Center
Ohio UniversityAthens, Ohio 45701, USA
. (740) 593-9949
W. P. JepsonNSF, I/UCRC, Corrosion in Multiphase Systems Center
Ohio UniversityAthens, Ohio 45701, USA
(740) [email protected]
ABSTRACT
There is little knowledge on flow characteristics and their subsequent effect on corrosion in inclinedflowlines. This information is essential for the proper design and operation of subsea and hilly terrainmultiphase pipelines.
Experiments have been carried out to determine the effect of multiphase flows on sweet corrosionin 10 cm diameter, inclined, oil/water/gas pipelines that can operated up to pressures of 150 bar.Carbon dioxide partial pressures up to 0.79 MPa have been studied at inclinations of 0,2, 5, and 15degrees at a temperature of 40 C. Water cuts of 100, 80, and 40% were used with a light condensatetype oil having a density of 800 kg/m3 and viscosity of 2 cP at 40 C. The liquid and gas superficialvelocities ranged from 0.2 to 3 mls and 2 to 10 mls respectively.
A new, nonintrusive technique to determine flow regime and slug characteristics has been developedusing differential pressure transducers. These detect the presence of slugs and are used to measure

.•.
the slug frequency and slug velocity.
The results indicate that, in upward flow, the slug frequency increases with increase in inclinationand there is significant backflow in the film region between slugs. This leads to an increase in thefilm Froude number and consequently higher turbulence levels and higher corrosion rates. However,at the lower water cuts, increasing the inclination angle does increase the mixing of the oil and water.This leads to the oil contacting the wall at the bottom of the pipe which helps reduce the corrosionrate.
The corrosion rate increases with increase in slug frequency up to a value of approximately 40 slugsper minute. Above this, the corrosion rate does not change with further increase in slug frequency.
From the above results, a model relating the flow characteristics and chemistry to corrosion rate hasbeen compiled.
1. INTRODUCTION
Much of the work done on flow and corrosion has been based on experiments using single phasewater or two phase water/gas systems. The application of these results are limited in the area ofmultiphase flow and corrosion. Not only is there limited data on three phase flow, there is practicallyno data available on multi phase flow in high pressure inclined pipelines. This also limits theapplication of previous work due to the fact that pressure and inclination effects the flowcharacteristics in a multiphase flowline which can further enhance the corrosion process.
De Waard and Milliams2 (1975) and De Waard and Lotz3 (1993) investigated the mechanism ofcarbon dioxide corrosion on carbon steel under different conditions. They also proposed variousmodels to predict carbon dioxide corrosion of carbon steel. Different corrosion products are formedon the pipe wall depending upon the experimental conditions. According to De Waard and Milliams(1975)2, the undissociated carbonic acid molecule is directly absorbed on the metal surface and thenreduced. This is the rate determining step and the corrosion rate is directly related to theconcentration ofundissociated carbonic acid in the solution. Bockris1 et al. (1962) showed that therate controlling step depended upon the pH. De Waard and Milliams2 (1975) further showed that thesolubility of FeC03 is low and decreases with increasing temperature. They also showed thatFe(HC03)2 forms the main component of the dissolved species. Iron carbonate is usually the maincorrosion product.The iron carbonate dissolves in the solution until its solubility limit is reached.Thereafter the solution becomes supersaturated and the iron carbonate precipitates on the metal wall.Depending upon various conditions like the solution chemistry, temperature, pressure and flow rate,iron carbonate may form a protective film on the metal surface.
Lee 10 (1993) demonstrated both that the introduction of a third phase can seriously affect theapplicability of the Taitel and Dukler13 (1976) model and that it improperly predicts the annular flowtransition. Lee's experiments were low-pressure, large diameter, horizontal studies. It was observedthat the oil composition affected the slug - annular transition, making the transition occur at lowergas velocities with increasing oil composition.

Limited mapping data exists for inclined pipeline effects. G~ul~4, et al., (1974) introduced +45 and+900 flow pattern maps. Stanislav11, et al., (1986) reported mclmed flow pattern .datagascomparedwith a modified Taitel and Dukler model in small diameter pipes. Kokal and Stanlslav (1986) havecharacterized extensively the upflow and downflow patterns. However, all of these studies involvedtwo phase flow. Additionally, large diameter and high pressure flow has not been studied. They didfind that even a slight inclination results in stratified flow being eliminated and the flow regime mapbegins to be dominated by slug flow. Wilkens15 et al. (1998) have shown that slug flow dominatesthe flow regime map at an inclination of even 2°.
Jepson and Kouba9 (1989) showed that there are different kinds of slugs and that the strength of theslug is proportional to the Froude number calculated in the liquid film ahead of the slug. Sun andJepson12 (1992) carried out corrosion rate measurement in oil/water/gas slug flow. They were ableto show that within the slug there were areas of high turbulence and high shearing forces which aremore than capable of removing any films of corrosion products formed at the wall. They were alsoable to show that the shearing forces of the slug did not allow stable inhibitor films to form on thewall surface.
Jepson and Taylor (1988) studied slug flow and its transitions in air/water two phase flow in 30 cmdiameter horizontal pipelines. It was shown that the transitions differ substantially from smallerdiameter pipes and that no theoretical model accurately predicted the transitions. They alsoattempted to incorporate the effect of pipe diameter on slug frequency plotting the non-dimensionalgroup (fD) / Vs1 against the mixture velocity, Vm' The mixture velocity is defined as the sum of thesuperficial gas and liquid velocities. They showed that there was a good correlation between the non-dimensional group and the mixture velocity which is given as follows:
= 4.76 X 10.3 * Vm + 0.035 (1)
where: ===
slug frequency, S.l
pipe diameter, msuperficial liquid velocity, m/smixture velocity, m/s
Two previous papers, Jepson? et al. (1996) and Jepson6 et al. (1997) have described a predictivemodel for corrosion rate in oil/water/gas flow in horizontal pipes that incorporates the effect ofcarbon dioxide partial pressure, temperature, pressure gradient across the slug and water cut, as wellas the effect of slug frequency and crude oil type.
This paper shows the effect of inclination on corrosion rate in multiphase slug flow and correlationsfor slug flow in inclined pipes are proposed that can be added to the existing corrosion rate model.
2. EXPERIMENTAL SETUP AND PROCEDURE
The.experiments are performed in an 18-m long, 10-cm diameter, high pressure, high temperature,mchnable flow loop shown in Figure 1. The entire system is manufactured from 316 stainless steel.

A brine/oil solution is stored within a 1.4 m3 mixing tank. The liquid is moved through the systemby a 3 _ 15 kW variable speed centrifugal pump and the flow rate is adjusted from 0 -100 m
3/hr by
means of a recycle line. The recycle stream stream also serves to agitate the liquid in the mixingtank. Flow rate is metered with a GH-Flow Automation TMTR510 Frequency Analyzer coupledwith an in-line turbine meter.
A feed line at 2 MPa pressure supplies carbon dioxide gas from a 20,000 kg storage tank. Afterpassing through a pressure regulator, the gas flow rate is metered with an HEDLAND variable areaflow meter where the pressure and temperature are also measured. The gas then passes through acheck valve and into the liquid flow which then enters the test loop. The pipe inclination can be setat any angle from 0° to 90°. Both upward and downward flows are studied simultaneously.
Measurements are made in the test section illustrated in Figure 2. Temperature is determined witha type-K thermocouple wired to an OMEGA DP3200- TC electronic display. The total pressure ismeasured with a 0.1 to 2.9 MPa pressure gauge. The pressure drop across the test section ismeasured between two sets oftaps (one set 132 cm apart and the other 10 cm apart). These pressuretaps are connected to two 0 to 35 kPa OMEGA PX-750 heavy duty differential pressure transducers.A QuickBASIC program was written on a 75 MHz Pentium to import the data from both channelsat a combined rate of 12 kHz. Each output value is then an average of 100 samples for an effectivesampling rate of 60 Hz.
Upon leaving the test section, the multiphase flow then passes through a separator to preventsiphoning due to the 18 meter downward flow return and back to the mixing tank. The gas passesthrough a de-entrainment plate allowing the liquid to separate from the gas, through a separator andback pressure regulator where it is vented to the atmosphere.
The test section shown in Figure 2 is 2 m long, 10.16 cm diameter stainless steel pipe. Port A is usedfor in situ void fraction and oil/water composition measurements. These are carried out bywithdrawing an isokinetic sample of the multi phase mixture and allowing the phases to separate ina calibrated tube at the system pressure and temperature.
Tap B is the thermocouple port which contains a type K thermocouple for temperature monitoring.The two sets of taps labeled C are the ports for the pressure taps. One set of taps are 10 cm apartwith the other set oftaps being separated by 132 cm. These two sets oftaps are connected to the twopressure transducers which are used to make pressure drop measurements. A novel, nonvisualtechnique for determining flow regimes using two simultaneous differential pressure measurementshas been developed. Port D is the system pressure tapping which allows system pressuremeasurements to be made in the test section. The two larger 2 inch ports labeled E are the corrosionprobe insertion ports where the electrical resistance probes are inserted for corrosion measurements.
3. TEST MATRIX
The test matrix is shown in Table 1. A mixture of ASTM substitute seawater and a light condensatetype oil with density 800 kg/m3 and viscosity 2 cP are used in the liquid phase.

h' hest matrix for flow characteristics and corrosion at l~J pressures
Gas Carbon Dioxide
Oil Composition, % 0,20,60
Pressure, MPa 0.27,0.45,0.79
Temperature,oC 40
Superficial Gas Velocity, mls 0, 1,3,5, 7, 9
Superficial Liquid Velocity, mls 0.1,0.5, 1.0, 1.5
Inclination, degrees +20, +5°
Table 1: T
4. RESULTS AND DISCUSSION
In order to characterize flow in the system, the dual differential pressure method of Wilkens andMaley14 (1995) is utilized. This is a nonvisual technique which was made necessary by the materialof construction for the system(316 stainless steel). It was shown that using pressure transducers,which was validated using high speed video, each of the flow regimes had a characteristicdifferential pressure trace. Figure 3 is a sample for slug flow. The use of a second pressuretransducer in series allows the calculation of a velocity for the flow regimes. The technique hasbeen patented and is awaiting publication.
4.1 Slug Frequency
The slug frequency was found to increase with increasing gas velocity for liquid velocities of 0.5 mlsand greater and decrease with increasing gas velocity for the lower liquid velocity of 0.1 mls. Theslug frequency was also found to increase with increasing liquid velocity. It was also observed thatsaltwater composition and pressure had little apparent effect on the slug frequency results. Slugfrequency is seen to increase when increasing the inclination from 2° to 5°. Figure 4 is a plot of slugfrequency versus gas velocity for an inclination of 2° for all pressures and oil compositions at eachof the liquid velocities of 0.1 to 1.5 mls. It can be seen that the slug frequency increases withincreasing gas velocity increasing from values of approximately 52 to 76 slugs per minute when thegas velocity increases from 3 to 8mls at a liquid velocity of 1.5mls. Similar trends can be seen forliquid velocities of 1.0 and 5.0 mls. It is again observed that the slug frequency decreases for theliquid velocity of 0.1 mis, decreasing from 8 to 0 slugs per minute as the gas velocity increases from3 to 8 mls. Figure 5 is a similar graph for slug frequency results at an inclination of 5°. The resultsare very similar for both angles. Comparing Figures 4 and 5, it can be seen that the slug frequenciesobtained at an inclination of 5° are slightly higher than the results obtained at an inclination of 2° atsimilar conditions.
A correlation of mixture velocity and slug frequency can be made if a plot of slug frequency in slugsper second multiplied by the pipe diameter in meters divided by the superficial liquid velocity in mis,which becomes a dimensionless number, is plotted on the Y-axis with the mixture velocity plotted

on the X-axis as in Figures 6 and 7 Looking at Figure 6, which is a plot for an inclination of2° forall pressures and saltwater compositions, it can be seen that for the higher liquid velocities of 0.5 to1.5 mls that a correlation can be drawn. The liquid velocity of 0.1 mls yields interesting results dueto the fact that the low liquid volume produces a localized slug frequency. These often change withdistance along the pipe. Often slug flow is assumed not to exist in this case. However, turbulent slugsare present and do cause corrosion. Looking at Figure 7, similar conclusions can be drawn.
Performing a linear regression through the data points, with the exception of the data collected at aliquid velocity of 0.1 mis, the following correlations were made:
For an inclination of2° Log(f * D)Nsl = 3.36 x 10⁻²* Vm - lAOFor an inclination of 50 Log(f* D)Nsl = 2.37 x 10,2* Vm - 1.28
The results of the correlations are illustrated in Figures 6 and 7.
(2)(3)
Jepson and Taylor(1988) collected some data on slug frequency in horizontal, 30 cm diameter airsaltwater flow. They attempted to incorporate the effect of pipe diameter plotting the non-dimensional group f * D / V 51 versus the mixture velocity (Vm)' Figure 8 is a plot of the results foundby Jepson and Taylor (1988) with the correlations developed in this study. Jepson and Taylor'scorrelation (Equation 1) can be seen to fit the data points where the 20 and 50 correlations (Equations2 and 3) predict a higher slug frequency at the lower superficial gas velocities than what was actuallyobtained in Jepson and Taylor's study. It is also seen that all three correlations come to unity at thehigher superficial gas velocities now that the turbulence in the slug has become sufficient enoughto overcome the effects of inclination.
4.2 Film Velocity
The effect of inclination on film velocity for a superficial gas velocity of 4 mls and at 80% water cutfor upward inclinations of 2, 5, and 15 degrees is shown in Figure 9. It is observed that the filmvelocity decreases with an increase in inclination. It is seen that at a superficial liquid velocity of 1.0mis, the average film velocity decreases from 1.5 to 1.3 and then to 1mls with increase in inclinationfrom 2° to 5° and then to 15°.The effect of inclination can be clearly observed at low gas and liquidvelocities. For instance at a liquid velocity of 0.5 mis, the film velocity decreased from 1.3 to -0.7with increase in inclination from 2° to 15°at 80% water cut. The decrease in film velocity to valuesless than zero indicates back flow. This causes the film Froude number ahead of the slug to increaseand thereby cause an increase in corrosion rates.
4.3 Corrosion Rates
Effect of Slug Frequency
The effect of slug frequency on corrosion in multi phase flow pipelines can be seen in Figures 10 and11. It was found that with the increase of slug frequency at constant pressure, Froude number, oilcomposition and inclination, that the corrosion rate increased. An example of this can be seen inFigure 10. Here is a plot of corrosion rate versus slug frequency at an inclination of 2° and a
pressure of 0.27 MPa. For an oil composition of60% and a Froude number of 12, the corrosion rateincreases form 1.6 mm/yr to 5.6 mm/yr at slug frequencies of 8 to 44 slugs/min. It is observed thatabove 40 slugs/min, the corrosion rate begins to level off. This is predicted by the corrosion ratemodel proposed by Jepson et al. (1997). This same trend was evident with the increases ininclination from 2° to 5°, which can be seen in Figure 11. On this plot of corrosion rate versus slugfrequency at 5° and 0.27 MPa, we again see that the corrosion rate increases with increasing slugfrequency. At an oil composition of 60% and a Froude number of 6, the corrosion rate increasesfrom 1.3 mm/yr to 2.6 mm/yr at slug frequencies of 18 to 42 slug/min, respectfully.
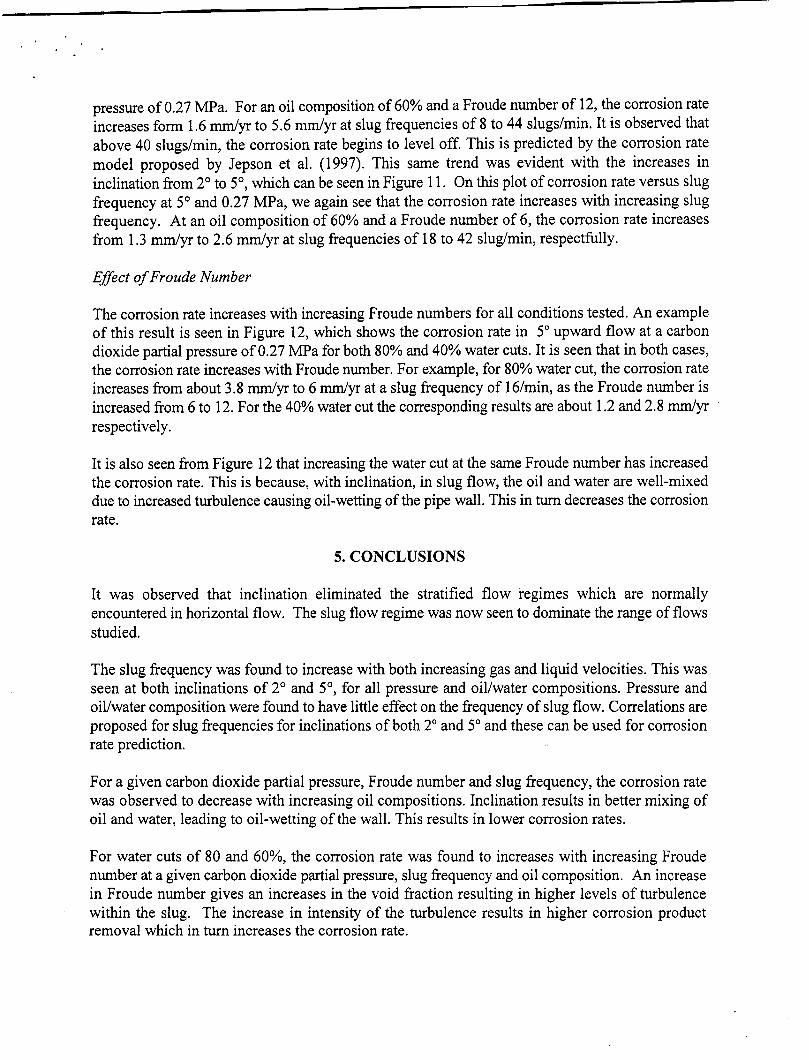
Effect of Froude Number
The corrosion rate increases with increasing Froude numbers for all conditions tested. An exampleof this result is seen in Figure 12, which shows the corrosion rate in 5° upward flow at a carbondioxide partial pressure of 0.27 MPa for both 80% and 40% water cuts. It is seen that in both cases,the corrosion rate increases with Froude number. For example, for 80% water cut, the corrosion rateincreases from about 3.8 mm/yr to 6 mm/yr at a slug frequency of 16/min, as the Froude number isincreased from 6 to 12. For the 40% water cut the corresponding results are about 1.2 and 2.8 mm/yrrespectively.
It is also seen from Figure 12 that increasing the water cut at the same Froude number has increasedthe corrosion rate. This is because, with inclination, in slug flow, the oil and water are well-mixeddue to increased turbulence causing oil-wetting of the pipe wall. This in turn decreases the corrosionrate.
5. CONCLUSIONS
It was observed that inclination eliminated the stratified flow regimes which are normallyencountered in horizontal flow. The slug flow regime was now seen to dominate the range of flowsstudied.
The slug frequency was found to increase with both increasing gas and liquid velocities. This wasseen at both inclinations of 2° and 5°, for all pressure and oil/water compositions. Pressure andoil/water composition were found to have little effect on the frequency of slug flow. Correlations areproposed for slug frequencies for inclinations of both 2° and 5° and these can be used for corrosionrate prediction.
For a given carbon dioxide partial pressure, Froude number and slug frequency, the corrosion ratewas observed to decrease with increasing oil compositions. Inclination results in better mixing ofoil and water, leading to oil-wetting of the wall. This results in lower corrosion rates.
For water cuts of 80 and 60%, the corrosion rate was found to increases with increasing Froudenumber at a given carbon dioxide partial pressure, slug frequency and oil composition. An increasein Froude number gives an increases in the void fraction resulting in higher levels of turbulencewithin the slug. The increase in intensity of the turbulence results in higher corrosion productremoval which in turn increases the corrosion rate.

The corrosion rate was found to increase with increasing slug frequency at a given ca:bon dioxidepartial pressure, Proude number and oil composition. Increasing the slug frequency mcreases thetotal amount of time that an area of the pipeline is exposed to the turbulent nature ~f a .slug.Increasing the time of exposure again results in higher corrosion product removal producmg hIghercorrosion rates.
6. REFERENCES
1. Bockris, J.O'M., Drazic, D. And Despic, A.R., "Electrochemical Act" 4, 324 and 7, 293,1962
2. De Waard C. and Milliams, D.E., "Carbonic Acid Corrosion of Steel", Corrosion, 31(5), 177 -181,1975.
3.,De Waard, C., Lotz, U. And Milliams, D.E.," Prediction of CO2 Corrosion of Carbon Steel"Corrosion/93, 50, 69/1 - 69/17, 1993.
4. Gould, T.L, Tek, M. And Katz, D.L.,"Two Phase Fglow Through Vertical, Inclined or CurvedPipes", J Petrol Tech, 26,915 - 926,1974
5. Jepson, W.P. and R.E. Taylor, "Slug Flow and Its Transition in Large Diameter Horizontal Pipes",Int. J Multiphase Flow, 19,411-420, 1988.
6. Jepson, W.P., Stitzel, R., Kang, C. and Gopal, M., "Model For Sweet Corrosion in HorizontalMultiphase Slug Flow", Corrosion 97, 602, 1997.
7. Jepson, W.P., Bhongale, S. and Gopal, M.,"Predictive Model for Sweet Corrosion in lb:i1nialMultiphase Slug Flow", Corrosion 96,19,1996.
8. Kokal, S.L. and J.F. Stanislav, "An Experimental Study of Two Phase Flow in Inclined Pipes",personal communications with W.P. Jepson, 1986.
9.~Kouba, G.E. and W.P. Jepson, "The Flow of Slugs in Horizontal, Two Phase Pipelines", PipelineEngineering Symposium, American Society of Mechanical Engineers, 1989.
10. Lee, Asi Hsin, "A Study of Flow Regime Transition for Oil-Water-Gas Mixtures in Large-Diameter Horizontal Pipelines"; M.S. Thesis, Ohio University, Athens, Ohio 1993.
11. Stanislav, J.F., S. Kokal, and M.K. Nicholson, "Intermittent Gas-Liquid Flow in Upward InclinedPipes", Int. J Multiphase Flow, 12,325-335, 1986.
12. Sun, J.Y. and Jepson, W.P., "Slug Flow Characteristics and Their Effect on Corrosion Rates inHorizontal Oil and Gas Pipelines." 67th Annual Technical Conference and Exhibition of the Societyof Petroleum Engineers, Washington D.C., October 4-7,215 - 227, SPE 24787, 1992.

I\!I!i
13. Taitel, Y., and Dukler, A. E., "A Model for Predicting Flow Regime Transitions in Horizontaland Near Horizontal Gas-Liquid Flow", AIChEJ, Vol. 22,1,47, (1976).
14. Wilkens, Robert and Maley, J., "Flow Regimes and Slug Flow Characteristics at High Pressure",NSF IlUCRC Advisory Board Report, Athens Ohio, Fall 1995.
15. Wilkens, R. W., Gopal, M., and Jepson W. P., "Flow Regimes and their Transitions in LargeDiameter High Pressure Multiphase Flows", ETCE/98, Houston, TX, Feb. 2-4,1998.

me
centrifugal pump
test section
eparator
LEGEND:
pressure gauge 0temperature gauge 0flow gauge 0check valve I<J I mixing tankgate valve I><Jball valve ~
rupture disk 8compression flange DXD
Figure 1: High-pressure, inclinable flow system process flowsheet.

~
I mE E
~
flow
E E
IO-cm differential pressure taps
132-cm differential pressure taps
LEGEND:
Figure 2: Test section diagr~m.
void fraction portthermocouple portdifferential pressure tapsystem pressure/shear stress portcorrosion probe insertion port
A
B
C
D
E
--~---------,_. ---_._--_._----~----~. "-~.. __._ ..!..~ .•.••..•....- ."._.'---..'"--- --- ,-----

2000
1500 _
. 1000 ,,~ rt...,\ ~ i~ ~" ~ ~,~l~f\r\ r~ro~,--, 500 r' " , , ,.. 1"_ I I\I~ I IQ)~ 0 , I , 111::s
I ICf) I I IICf)Q) ,I , I~ -500 , I I I II~- I I I I ,I II \"ro.- -1000~ II I I ,I II '"Q)~ ,I~ -1500 , I II II II~ ,I.- II II II II""0
-2000 II II i II I-2500 t- Il II , I
II J t t
-3000 - J I
0 15 30
time [=] sdp (10 em) --- dp (132 em)
Figure 3: Sample Differential Pressure Trace for Slug Flow

'.
100 .Vsl
• 0.1 m/s • 0.5 m/s ~ 1.0 m/s . ~ 1.5 m/s
80 t- I! IIII II
--- I) II tiL ••s::.- II ••• IIS--- II gfI)bl) 60 -. II II ~~-fI)'--' IfI . I;;>-. III ~W~t> IJ .s:: ~~r~~~~cr' 40 ~~
~~
l-<~ •bl)~ •• •-rJJ • • ., • • ••20 t- • .1. • • • ••, , •
• 1 ••• *.~•0 . __I_ • • • • +1 •0 2 4 6 8 10
Superficial Gas Velocity (mls)Figure 4: Slug frequency results @ 2° for all pressure and compositions
~.._-~--~ ---_ .. _, ..-...........-.--_--~-_ ...•.• -' ~.- ----_._----~-----_._.~._----_.-

100I
Vsl II
• 0.1 m/s • 0.5 m/s y 1.0 m/s l!!1i 1.5 m/s II II
80 t- ItII
"2 II II .-.- .- •••S II .11- LIi , •••tI.l •00 60 II •• •••::s R. ••• •••..-tI.l II II .,....-:>-. II II 1111u •••~ .,... ...Q)
II::s , .•. .•. •••0'" 40 ••• •••Q) •••~ ., ......~00 •••••• I"::s • •..-
rJ) ,... • • •• .,• • •• ••• •20 t- • ••• • • • • ••• • • • • •••• •• •••••• ••* • •••0 . I • I I • • •0 2 4 6 8 10
Superficial Gas Velocity (m1s)Figure 5: Slug frequency results @ 5° for all pressure and compositions
---------_ ..._-_. -------" -"-'- ----,,,'_.- - ----~~---~~_..--~._-._--_.

1
Vsl
• 0.1 m/s • 0.5 m/s ~ 1.0m/s El 1.5 m/s
•- Itn •;>--... ••r--.. 0.1Q •*<.+-i •'-" .Sf fit --- -
- • •• • ••••• • •
••-0.01
o 2 4 6 8 10 12
Mixture Velocity - Vm (mls)Figure 6: (f * D) I VsI vs. mixture velocity @ 1° for all pressure and compositions
~i
(,
____ . , .. ~~._~ __ T-" '-- _ --- -- ---,-- -- ---_. --- --~~~---

1
Vsl
• 0.1 m/s • 0.5 m/s • 1.0 m/s Fil 1.5 m/s
•- ..> I •••• •~ 0.1 E ~_ • •• 7•.-..•..:~ ~~BJ"''''I~'"-" - -- ..__ . _ _.. -•• •••••• •••• ••
0.01o 2 4 6 8 10 12
. Mixture Yel9fiiY - Vm.fm/s) ..Figure 7: (f * D) / Vsl vs. mixture velocity @ 50() for al pressure and compositions
-.I>~.. __ ~.~ - • ._:---.' ._

1
Jepsonffaylor _I_I. 2° correlation - 5° correlation •
-rJ)>-,,-....Q 0.1
*<+-<'--"
•••••••••••••••••••••••• ~
- _.... --.IIIII!'..~...-...-,~' .~ ...- . .
~~~~~~~~ •
•••••••••••••••
'<
0.01o 2 4 6 8 10 12
<,
Mixture Velocity - Vm (m/s)Figure 8: Jepson/Taylors(1989) results compared with the correlations deyeloped in this study
<~------~---~------....:.-,:.....-.--,--_.-~..-~--

+ +2 degree
T• +5 degree 1..Ll-
T• +15 degree •J T ..L+..LT T+ :..L
I- ..L
TA..L
.
T• I I-+-
3
2
--en-E...-~.0
10Q)>E.-u..
0
-10.5 1
Superficial Liquid Velocity (m/s)
1.8
____ .. "____ ._W~ ... ~ __ ,'~ , __ . _ • •.~ ._._............ ~ ~~

10 •~ 60% oil; Fr = 6
• 60% oil; Fr = 12T T•8 r- • -lI.l 20% oil; Fr = 6 -.L
-r--.. • 20% oil; Fr = 12 •..L~ -rTS • T II T..LS 6 : -l •-...-
-r -lQ)
II~..L=~ •l=:
..L0 • Ii.-r/) 401:: L • -r0
'YU II 'Y ..L
-r2 r- --r- 'Y• 'Y ..L
'Y
oo 10 20 30 40 50
••
'0
'..,
Slug Frequency (slugs/min)
Figure 10: Corrosion Rate vs.Slug Frequency for 2°; 0.27 MPa
.-------~~-------- ...~. -----_._~ - ~-~--

10
• 60% oil;Freq=16
T•1-TTT-L
T•-L•. 20% oil;Freq=44
.•. 20% oil;Freq=16
Iii 60% oil;Freq=44
4 .- -.-T....L.
-.- ...II •....L. -L
I2
I •r , , I , , I
00 3 6 9 12 15
Froude Number
6
8,-...
~s'-"Q)
d~t::o....•V)goU
Figure 11: Corrosion Rate vs. Froude Number for 5°,0.27 MPa; 80 & 40%) saltwaterf.o.
"-
'>"
_______ " ~ .. _._. ~- -- ------" ~~ ~ -'-._-'.~ .r '--r----_~_ •• . ••

10
I60% oil; Fr = 6T
60% oil; Fr = 12T••8 l-i-!l!1 20% oil; Fr = 6
I--- 20% oil; Fr = 12~ r · T T
8II •
8 6 • i- i-
'-'~~~c0....•
•~ 4 I0t:: •0
~•••
u
I2
I•••
oo 10 20 30 40 50
.",.
10' ( ~
l
•. f~~
',"
Slug Frequency (slugs/min)
Figure 12: Corrosion Rate vs. Slug Frequency for 5°; 0.27 MPa