The State of REDD+ Finance - Center for Global Development · The State of REDD+ Finance Marigold...
53
Working Paper 378 September 2014 Updated May 2015 The State of REDD+ Finance Abstract This paper presents a thorough synthesis of available data to illuminate the current global state of finance for reducing emissions from deforestation and forest degradation (REDD+). It adds to a growing body of work that seeks to understand the size and composition of finance for REDD+ initiatives, as well as the delivery of climate finance more generally. The analysis shows that aggregate pledges of both public and private finance are significant, at more than US $9.8 billion for the period between 2006 and December 2014, but the pace of new pledges slowed after 2010. The public sector contributes nearly 90 percent of reported REDD+ finance, with the preponderance of funding concentrated among a relatively small number of donors and recipient countries. The paper analyzes early experience with performance-based finance, although such finance represents less than two-fifths of pledges to date. New institutions in the climate finance architecture such as the Green Climate Fund have recognized the opportunity to engage on REDD+ finance, but the extent to which they succeed in creating new and effective channels of support remains to be seen. JEL Codes: F35, Q23, Q54 CGD Climate and Forest Paper Series #5 www.cgdev.org Marigold Norman and Smita Nakhooda
Transcript of The State of REDD+ Finance - Center for Global Development · The State of REDD+ Finance Marigold...

Working Paper 378September 2014Updated May 2015
The State of REDD+ Finance
Abstract
This paper presents a thorough synthesis of available data to illuminate the current global state of finance for reducing emissions from deforestation and forest degradation (REDD+). It adds to a growing body of work that seeks to understand the size and composition of finance for REDD+ initiatives, as well as the delivery of climate finance more generally. The analysis shows that aggregate pledges of both public and private finance are significant, at more than US $9.8 billion for the period between 2006 and December 2014, but the pace of new pledges slowed after 2010. The public sector contributes nearly 90 percent of reported REDD+ finance, with the preponderance of funding concentrated among a relatively small number of donors and recipient countries. The paper analyzes early experience with performance-based finance, although such finance represents less than two-fifths of pledges to date. New institutions in the climate finance architecture such as the Green Climate Fund have recognized the opportunity to engage on REDD+ finance, but the extent to which they succeed in creating new and effective channels of support remains to be seen.
JEL Codes: F35, Q23, Q54
CGD Climate and Forest Paper Series #5
www.cgdev.org
Marigold Norman and Smita Nakhooda
The State of REDD+ Finance
Marigold NormanOverseas Development Institute
Smita Nakhooda
Overseas Development Institute
This is a joint paper with ODI. ODI is a leading independent think tank on international development and humanitarian issues. Their mission is to inspire and inform policy and practice which lead to the reduction of poverty, the alleviation of suffering, and the achievement of sustainable livelihoods in developing countries.
Marigold Norman is a Senior Research Officer in the Climate and Environment Programme at ODI. Contact: [email protected]. Smita Nakhooda is a Senior Research Fellow in the Climate and Environment Programme at ODI, where she leads the International Climate Finance team. Contact: [email protected]. The authors thank Stefan Agne, Charlie Parker, and Edward Davey for comments and suggestions.
CGD is grateful for contributions from the Norwegian Agency for Development Cooperation in support of this work.
Marigold Norman and Smita Nakhooda. 2014. “The State of REDD+ Finance.” CGD Working Paper 378 . Washington, DC: Center for Global Development. http://www.cgdev.org/publication/state-redd-finance-working-paper-378
Center for Global Development2055 L Street, NW
Fifth FloorWashington, DC 20036
202.416.4000(f ) 202.416.4050
www.cgdev.org
The Center for Global Development is an independent, nonprofit policy research organization dedicated to reducing global poverty and inequality and to making globalization work for the poor. Use and dissemination of this Working Paper is encouraged; however, reproduced copies may not be used for commercial purposes. Further usage is permitted under the terms of the Creative Commons License.
The views expressed in CGD Working Papers are those of the authors and should not be attributed to the board of directors or funders of the Center for Global Development.

Contents Foreword ........................................................................................................................................... 1
Summary ............................................................................................................................................ 2
1. Introduction .......................................................................................................................... 3
2. Global REDD+ finance ..................................................................................................... 4
2.1 Scope ....................................................................................................................................... 4
2.2 REDD+ finance .................................................................................................................... 5
2.3 REDD+ in the context of Fast Start Finance ................................................................ 10
2.4 Annual Trends in REDD+ Finance ........................................................................... 11
3. REDD+ Donors ................................................................................................................ 13
3.1 Multilateral funds ................................................................................................................. 15
3.2 Disbursements of REDD+ pledges ................................................................................. 19
4. Recipients of REDD+ finance ........................................................................................ 21
5. Paying for performance: Reducing emissions from deforestation and degradation 26
5.1 Performance-based payments ........................................................................................... 26
5.2 Performance-based payments and REDD+ donors ..................................................... 27
5.3 REDD+ performance-based payments in action .......................................................... 28
5.3.1 Payment timing and focus on results ...................................................................................... 28
5.3.2 Incentive mechanisms ....................................................................................................... 30
5.3.3 Monitoring and Indicators ............................................................................................... 30
5.3.4 Other benefits ................................................................................................................. 31
6. Private sector ....................................................................................................................... 34
6.1 Overview of private finance volumes and markets ....................................................... 35
6.2 Drivers of demand and investment .................................................................................. 36
7. Conclusion .................................................................................................................................. 40
8. References ................................................................................................................................... 43
Annex: Methodology ..................................................................................................................... 47
8.1 Where does the data come from? ..................................................................................... 47
8.2 What counts as REDD+ finance? .................................................................................... 48
8.3 When is REDD+ finance counted? ................................................................................. 49

1
Foreword
This paper is one of more than 20 analyses being produced under CGD’s Initiative on
Tropical Forests for Climate and Development. The purpose of the Initiative is to help
mobilize substantial additional finance from high-income countries in support of the pay-
for-performance approach to transfers that is at the heart of the global REDD+ program.
The analyses will feed into a book entitled Why Forests? Why Now? The Science, Economics, and
Politics of Tropical Forests and Climate Change. Co-authored by senior fellow Frances Seymour
and research fellow Jonah Busch, the book will show that tropical forests are essential for
both climate stability and sustainable development, that now is the time for action on
tropical forests, and that payment-for-performance finance for reducing emissions from
deforestation and forest degradation (REDD+) represents a course of action with great
potential for success.
Commissioned background papers also support the activities of a working group convened
by CGD and co-chaired by Nancy Birdsall and Pedro Pablo Kuczynski to identify practical
ways to accelerate performance-based finance for tropical forests in the lead up to UNFCCC
COP21 in Paris in 2015.
This paper, “The State of REDD+ Finance” by Marigold Norman and Smita Nakhooda of
the Overseas Development Institute, was commissioned by CGD to provide an up-to-date
summary of the international financial resources that have so far been mobilized for
REDD+ initiatives. By providing authoritative estimates of funding totals broken down by
sources, destinations, uses, and stage of disbursement, the paper is intended to illuminate
and analyze current patterns and trends in REDD+ finance.
Frances Seymour Senior Fellow Center for Global Development
Jonah Busch Research Fellow Center for Global Development

2
Summary
How are we financing efforts to reduce emissions from deforestation and degradation? This
paper analyses over 23,000 individual projects or pledges of support for REDD+ between
2006 and 2014 to review experiences to date. Aggregate pledges and investments from both
the public and private sectors are significant, at more than US$9.8 billion for the period
between 2006 and end of 2014. More than 56% of all finance was pledged between 2006 and
2010, reflecting optimism about design of a REDD+ mechanism in the lead up to the 2009
Copenhagen Conference of Parties.
But political momentum behind REDD+ has slowed, compounded by the global economic
crisis which has reduced political appetite for international spending in developed countries.
As the difficult realities of REDD+ program delivery have become apparent, new pledges
have been smaller and slower to manifest. Since 2010, global pledges for dedicated REDD+
initiatives average US$796 million annually.
Almost 90% of REDD+ finance identified comes from the public sector. Bilateral
institutions have played a central role, and manage 51% of finance pledged since 2006
compared to around 33% of finance managed by multilateral funds. Bilateral programs
actually represent the largest sources of finance for REDD+, particularly in forest rich
countries.
While there are more than 20 REDD+ donors and 80 recipient countries, activity is
relatively concentrated. Norway, the US, Germany, Japan and the UK provide 77% of
identified funding with ten countries receiving the majority of finance. Indonesia and Brazil
collectively receive 35% of allocated funding. 20% of funding is directed to global programs
or international research and just 17% of allocated funding is supporting REDD+ activities
and programs across the remaining 75 recipient countries.
At least 58% of public funding is channeled as ex-ante grants for readiness activities which
are not directly reducing emissions. While 42% of public sector finance has been pledged as
ex-post payments on performance, these programs do not always pay for verified emissions
from reduced deforestation. It is therefore likely that a significantly higher proportion of the
finance pledged has been focusing on capacity building and other readiness activities to date.
Norway and Germany have piloted performance-based programs. Experience to date
suggests the importance of mobilizing enough finance to incentivize desired results, and
3
having clear agreements that lay out mutual expectations. It also suggests the need to
monitor program performance rather than just spend, and improve how performance-based
REDD+ programs are structured and managed to deliver verified emissions reductions.
1. Introduction
More than 1.6 billion people or 25% of the global population rely on forests for their
livelihoods and deforestation and degradation of forest land is estimated to account for
roughly 12% of global greenhouse gas emissions (IPCC WGII, 2014). To address concerns
around the management and conservation of forests, a financial mechanism known as
REDD+ (Reducing Emissions from Deforestation and forest Degradation; conservation of
forest carbon stocks; sustainable management of forests; and enhancement of forest carbon
stocks1) was developed. REDD+ seeks to recognize the value of the carbon stored in
forests, and shift incentives from deforestation and land use change to forest conservation
and sustainability (Larson and Petkova, 2011).
REDD+ officially became part of the international climate agenda in 2007 when parties to
the United Nations Framework Convention on Climate Change (UNFCCC) committed to
address climate change through the Bali Action Plan and the Bali Road Map. In 2009 at the
15th session of the conference of the parties to the UNFCCC in Copenhagen, developed
countries pledged more than US$3.5 billion in fast-track financing for REDD+ (Streck et al,
2010). Countries also agreed to a phased approach to REDD+ implementation where
finance and activities would focus initially on REDD+ strategy development, capacity
building activities, implementation of policies and measures, and move towards results-based
demonstration activities and verified emissions reductions. Financing for REDD+ could
therefore move from public sector ex-ante grants and loans to ex-post payments based on
actual results/emissions reduced, potentially funded through emerging carbon markets.
Since then, the global economic crisis (2008-2009), the landscape for REDD+ looks very
different (Peters-Stanley et al, 2013; Lowery et al, 2014). This paper explores the global state
of REDD+ finance today. It highlights the level of REDD+ finance, the dominance of
public sector financing, the main donors, and their motivations in financing REDD+.
1 UNFCCC definition set out in Working Group III contribution to the IPCC 5th Assessment Report
"Climate Change 2014: Mitigation of Climate Change" that was accepted but not approved in detail by the 12th Session of Working Group III and the 39th Session of the IPCC on 12 April 2014 in Berlin, Germany.
4
Methodology and contribution to the literature
This paper adds to a growing body of work that seeks to understand finance for initiatives
that will reduce emissions from forest degradation, and the delivery of climate finance. It
breaks new ground by presenting a thorough synthesis of available data on finance for
REDD+, by incorporating data from the ODI HBF Climate Funds Update (CFU)2 which
tracks the operations of dedicated climate finance initiatives, research on Fast Start Finance,
including building on datasets compiled by WRI, ODI, IGES, Germanwatch, Cicero and
Climate Advisors, as well as finance reported by donors to the Voluntary REDD+ Database
(VRD) of the REDD+ Partnership (http://reddplusdatabase.org/). Annex I presents the
full methodology used to reconcile differences in reporting parameters and scope.
2. Global REDD+ finance
2.1 Scope The focus of this analysis is on the international financial flows or mechanisms originating
outside a developing country that support actions aimed at reducing emissions from
deforestation and forest degradation. Determining what actually counts as REDD+ and
forest related finance is not easy and significantly impacts global estimates of how much
finance is directed toward it.
The UNFCCC decision on REDD+ refers to ‘policy approaches and positive incentives on
issues relating to reducing emissions from deforestation and forest degradation; and the role
of conservation, sustainable management of forest and enhancement of forest carbon stocks
in developing countries’ (Bali Action Plan, para 1 (b) (iii)) which will include activities that
are country-driven, promote co-benefits and biodiversity, actions that are consistent with
conservation of natural forests, involvement of indigenous peoples and local communities as
well as transparent forest governance (Sánchez, 2010). However, donor institutions often
report funding against broad categories such as “environment” or “forests”. This can
complicate efforts to determine the actual amounts or proportion that targets REDD+ and
forest related activities, which in turn can result in the same flows being counted multiple
times.
This report therefore tracks international pledges and flows of finance linked to the
UNFCCC decisions on REDD+ as well as relevant activities that support policy approaches
2 http://www.climatefundsupdate.org/
5
and positive incentives around the three phases of REDD+. These include the following
activities in the context of reducing emissions from deforestation and forest degradation,
conservation of forest carbon stocks, the sustainable management of forests, and the
enhancement of forest carbon stocks:
• The development of national strategies or action plans, policies and measures, and capacity-building;
• The implementation of national policies and measures and national strategies or action plans that could
involve further capacity-building, technology development and transfer and results-based demonstration
activities;
• Results-based actions that should be fully measured, reported and verified.
2.2 REDD+ finance More than 89% of all REDD+ and forest related funding tracked has been pledged by the
public sector through both bilateral and multilateral channels.
Twenty-one countries collectively pledged almost US$5 billion through bilateral agreements
between 2006 and 20143. In addition, developed countries and the private sector4 are
channeling finance through dedicated multilateral funds targeting REDD+ and sustainable
forest management. Finance pledged to the Forest Carbon Partnership Facility (FCPF)
Readiness Fund, Carbon Fund, the Forest Investment Program (FIP), the Amazon Fund,
the Congo Basin Forest Fund (CBFF) and the BioCarbon Fund Initiative for Sustainable
Forest Landscapes (ISFL) totaled US$3.2 billion between 2008 and the end of 2014. Donor
countries pledged US$23 million through multiple channels involving both bilateral and
multilateral programs5. Around US$463 million has been reported, though the particular
channels are not known.
While hopes were high that REDD+ would attract investment from the private sector, the
absence of a compliance market for REDD+ credits has meant that private sector
engagement and investments have been low (Diaz et al, 2011). Voluntary offset transactions
3 This figure is based on countries reporting to the REDD+ Partnership’s Voluntary REDD+ Database for
REDD+ contributions between 2006 and 2014, as well as those reporting Fast Start Finance contributions through ODI and HBF Climate Funds Update for the period 2010 to 2012. The two datasets have been compared in detail to prevent double counting of commitments over the Fast Start Financing period between 2010 and 2012. The 21 countries include: Australia, Austria, Belgium, Canada, Denmark, the European Union, Finland, France, Germany, Ireland, Italy, Japan, Luxembourg, Netherlands, Norway, Slovakia, Spain, Sweden, Switzerland, the UK and the US.
4 Private investors include British Petroleum, CDC Climat supporting the FCPF Carbon Fund and Petrobras supporting the Amazon Fund for example.
5 This figure is based on CFU data reported as of December 31, 2014 at http://www.climatefundsupdate.org/data

6
for REDD+ projects including sustainable forest management as well as afforestation and
reforestation are estimated to be worth around US$1 billion over time6 by Ecosystem
Marketplace, a leading source of information on private markets for ecosystem services
(Goldstein and Gonzalez, 2014). Forest Trends’ REDDX initiative reports just US$8.2
million in private finance and US$101 million from private foundations across ten tropical
forest countries between 2009 and 20127.
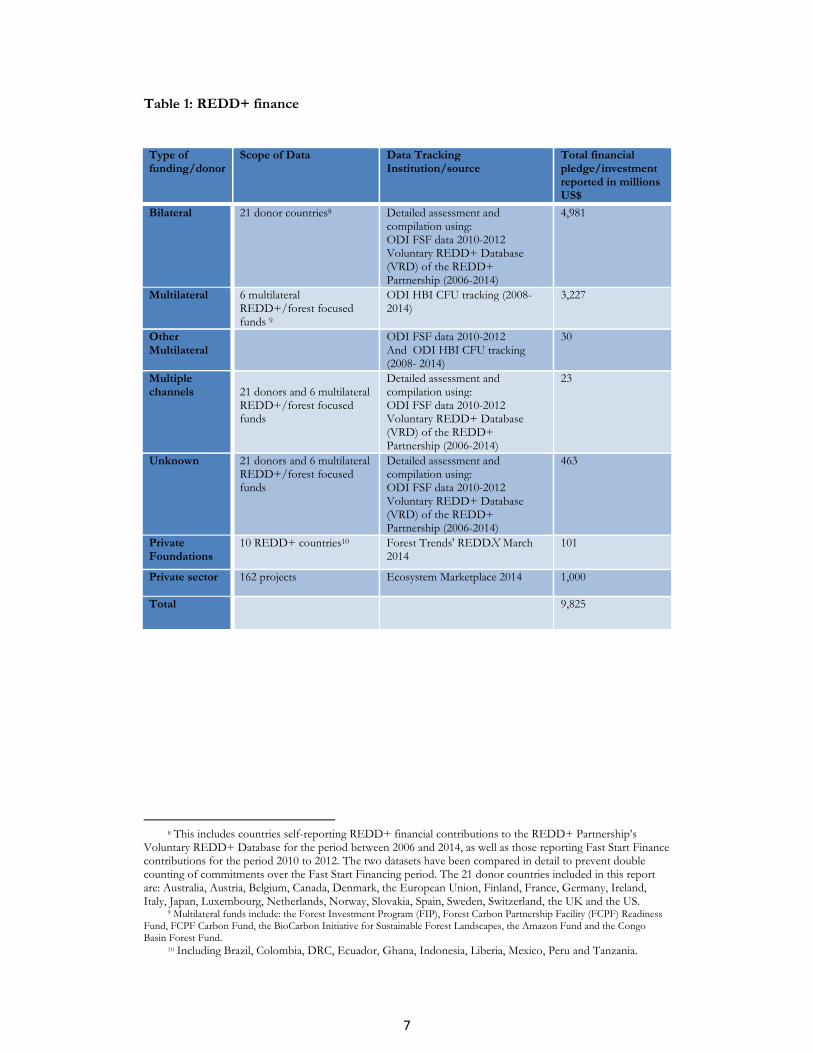
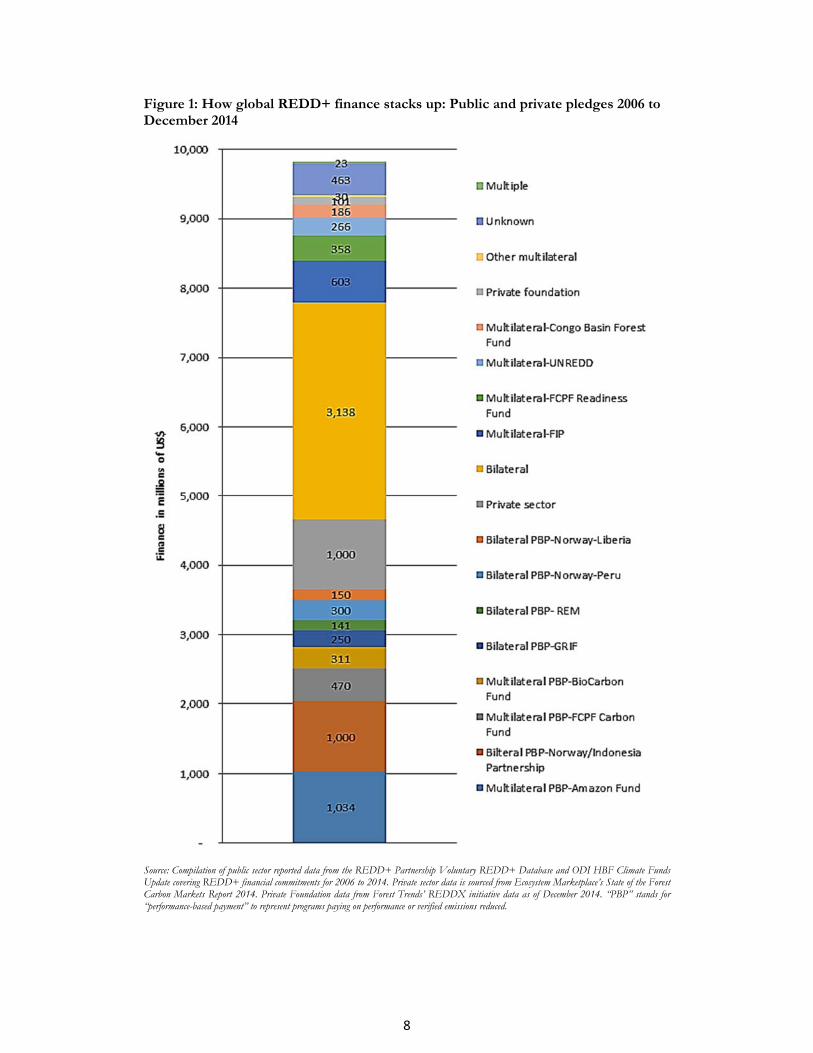
Table 1 summarizes reported REDD+ finance data by donor/funding channel. Our
conservative estimate of global financing for REDD+ is in the region of US$9.8 billion
based on tracked and verified finances analyzed and compared across a number of
complementary institutions and initiatives. This figure would likely be higher if more
complete data was available on private sector investments. Figure 1 highlights how different
sources of REDD+ finance stack up.
6 Ecosystem Marketplace track offsets reported since the 1990s through interviewing offset project
developers, brokers, and retailers, as well as carbon offset-accounting registries, and exchanges that track and facilitate offset ownership. Given the different timeframe for private sector finance, this report focuses on discussing public sector financing at the global level in the donor discussions. The report discusses some private sector investments in the context of recipient countries which have been backed up by additional data from Forest Trends’ REDDX Initiative. Private sector investments are discussed in more detail in section 4.
7 Forest Trends’ REDDX reporting REDD+ finance at the national level for the period 2008-2012 for Brazil, Colombia, DRC, Ecuador, Ghana, Indonesia, Liberia, Mexico, Peru and Tanzania. Available at http://reddx.forest-trends.org/
7
REDD+ finance
8 This includes countries self-reporting REDD+ financial contributions to the REDD+ Partnership’s
Voluntary REDD+ Database for the period between 2006 and 2014, as well as those reporting Fast Start Finance contributions for the period 2010 to 2012. The two datasets have been compared in detail to prevent double counting of commitments over the Fast Start Financing period. The 21 donor countries included in this report are: Australia, Austria, Belgium, Canada, Denmark, the European Union, Finland, France, Germany, Ireland, Italy, Japan, Luxembourg, Netherlands, Norway, Slovakia, Spain, Sweden, Switzerland, the UK and the US.
9 Multilateral funds include: the Forest Investment Program (FIP), Forest Carbon Partnership Facility (FCPF) Readiness Fund, FCPF Carbon Fund, the BioCarbon Initiative for Sustainable Forest Landscapes, the Amazon Fund and the Congo Basin Forest Fund.
10 Including Brazil, Colombia, DRC, Ecuador, Ghana, Indonesia, Liberia, Mexico, Peru and Tanzania.
Type of funding/donor
Scope of Data Data Tracking Institution/source
Total financial pledge/investment reported in millions US$
Bilateral 21 donor countries8 Detailed assessment and compilation using: ODI FSF data 2010-2012 Voluntary REDD+ Database (VRD) of the REDD+ Partnership (2006-2014)
4,981
Multilateral 6 multilateral REDD+/forest focused funds 9
ODI HBI CFU tracking (2008- 2014)
3,227
Other Multilateral
ODI FSF data 2010-2012 And ODI HBI CFU tracking (2008- 2014)
30
Multiple channels
21 donors and 6 multilateral REDD+/forest focused funds
Detailed assessment and compilation using: ODI FSF data 2010-2012 Voluntary REDD+ Database (VRD) of the REDD+ Partnership (2006-2014)
23
Unknown 21 donors and 6 multilateral REDD+/forest focused funds
Detailed assessment and compilation using: ODI FSF data 2010-2012 Voluntary REDD+ Database (VRD) of the REDD+ Partnership (2006-2014)
463
Private Foundations
10 REDD+ countries10 Forest Trends' REDDX March 2014
101
Private sector 162 projects Ecosystem Marketplace 2014 1,000
Total 9,825
8
Figure 1: How global REDD+ finance stacks up: Public and private pledges 2006 to December 2014
Source: Compilation of public sector reported data from the REDD+ Partnership Voluntary REDD+ Database and ODI HBF Climate Funds Update covering REDD+ financial commitments for 2006 to 2014. Private sector data is sourced from Ecosystem Marketplace’s State of the Forest Carbon Markets Report 2014. Private Foundation data from Forest Trends’ REDDX initiative data as of December 2014. “PBP” stands for “performance-based payment” to represent programs paying on performance or verified emissions reduced.
9
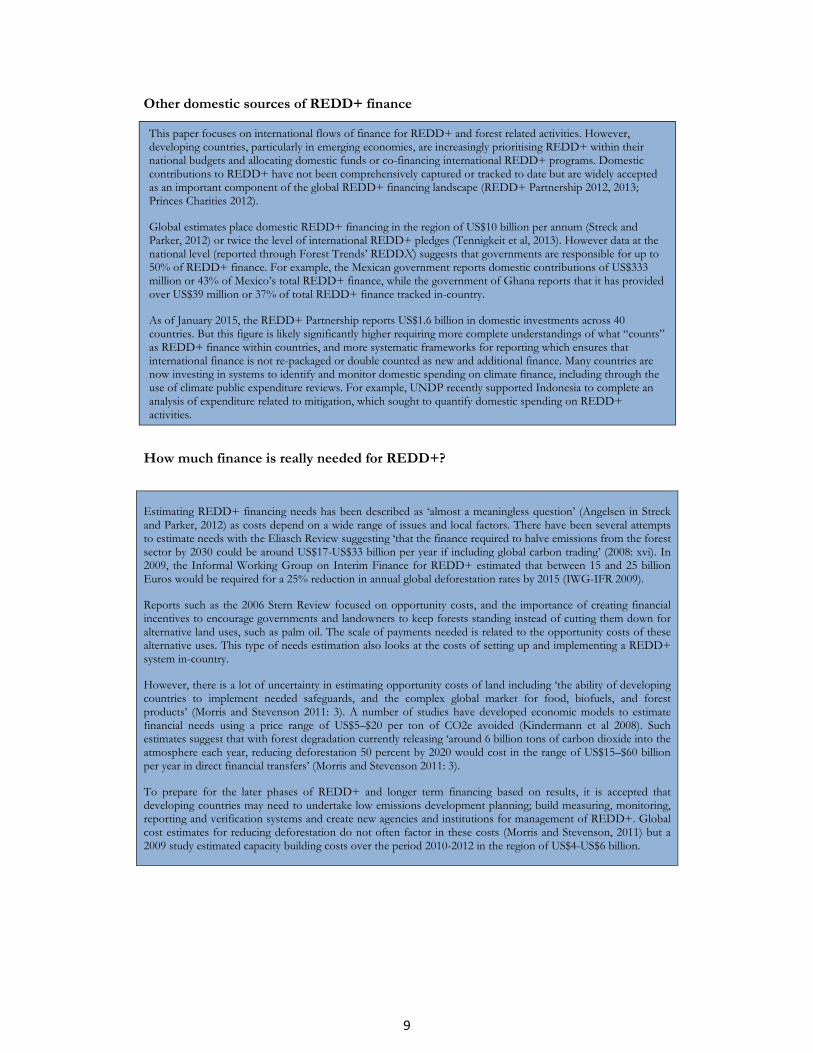
Other domestic sources of REDD+ finance
How much finance is really needed for REDD+?
Estimating REDD+ financing needs has been described as ‘almost a meaningless question’ (Angelsen in Streck and Parker, 2012) as costs depend on a wide range of issues and local factors. There have been several attempts to estimate needs with the Eliasch Review suggesting ‘that the finance required to halve emissions from the forest sector by 2030 could be around US$17-US$33 billion per year if including global carbon trading’ (2008: xvi). In 2009, the Informal Working Group on Interim Finance for REDD+ estimated that between 15 and 25 billion Euros would be required for a 25% reduction in annual global deforestation rates by 2015 (IWG-IFR 2009).
Reports such as the 2006 Stern Review focused on opportunity costs, and the importance of creating financial incentives to encourage governments and landowners to keep forests standing instead of cutting them down for alternative land uses, such as palm oil. The scale of payments needed is related to the opportunity costs of these alternative uses. This type of needs estimation also looks at the costs of setting up and implementing a REDD+ system in-country.
However, there is a lot of uncertainty in estimating opportunity costs of land including ‘the ability of developing countries to implement needed safeguards, and the complex global market for food, biofuels, and forest products’ (Morris and Stevenson 2011: 3). A number of studies have developed economic models to estimate financial needs using a price range of US$5–$20 per ton of CO2e avoided (Kindermann et al 2008). Such estimates suggest that with forest degradation currently releasing ‘around 6 billion tons of carbon dioxide into the atmosphere each year, reducing deforestation 50 percent by 2020 would cost in the range of US$15–$60 billion per year in direct financial transfers’ (Morris and Stevenson 2011: 3).
To prepare for the later phases of REDD+ and longer term financing based on results, it is accepted that developing countries may need to undertake low emissions development planning; build measuring, monitoring, reporting and verification systems and create new agencies and institutions for management of REDD+. Global cost estimates for reducing deforestation do not often factor in these costs (Morris and Stevenson, 2011) but a 2009 study estimated capacity building costs over the period 2010-2012 in the region of US$4-US$6 billion.
This paper focuses on international flows of finance for REDD+ and forest related activities. However, developing countries, particularly in emerging economies, are increasingly prioritising REDD+ within their national budgets and allocating domestic funds or co-financing international REDD+ programs. Domestic contributions to REDD+ have not been comprehensively captured or tracked to date but are widely accepted as an important component of the global REDD+ financing landscape (REDD+ Partnership 2012, 2013; Princes Charities 2012).
Global estimates place domestic REDD+ financing in the region of US$10 billion per annum (Streck and Parker, 2012) or twice the level of international REDD+ pledges (Tennigkeit et al, 2013). However data at the national level (reported through Forest Trends’ REDDX) suggests that governments are responsible for up to 50% of REDD+ finance. For example, the Mexican government reports domestic contributions of US$333 million or 43% of Mexico’s total REDD+ finance, while the government of Ghana reports that it has provided over US$39 million or 37% of total REDD+ finance tracked in-country.
As of January 2015, the REDD+ Partnership reports US$1.6 billion in domestic investments across 40 countries. But this figure is likely significantly higher requiring more complete understandings of what “counts” as REDD+ finance within countries, and more systematic frameworks for reporting which ensures that international finance is not re-packaged or double counted as new and additional finance. Many countries are now investing in systems to identify and monitor domestic spending on climate finance, including through the use of climate public expenditure reviews. For example, UNDP recently supported Indonesia to complete an analysis of expenditure related to mitigation, which sought to quantify domestic spending on REDD+ activities.

10
2.3 REDD+ in the context of Fast Start Finance The 2009 Copenhagen Accord and the 2010 Cancun Agreements encouraged developed
countries to make some initial substantial financial commitments to support developing
countries mitigate and adapt to climate change. Developed countries pledged to provide
US$30 billion in new and additional ‘Fast Start Finance’ (FSF) from 2010 to 2012. Countries
report that they exceeded these pledges, mobilizing US$35 billion for climate change
(Nakhooda et al, 2013). Figure 2 highlights donor country FSF pledges with the proportion
of funding directed towards REDD+.
Furthermore, developed countries also committed to a goal of mobilizing US$100 billion of
climate finance per year for developing countries from public, private and alternative sources
in the context of transparent and meaningful mitigation action.
Figure 2: Donor Fast Start Finance and proportion focused on REDD+11
Source: Nakhooda et al, 2013. Mobilising International Climate Finance: Lessons from the Fast Start Finance period. Conversions based on
OECD exchange rates12.
11 The EU contribution in Figure 2 comprises financial contributions from all EU Member States. 12 Total figures are based on those reported to the UNFCCC, and for EU member states, those reported in
the EU Accountability Report on Financing for Development 2013. “Other FSF” includes all aggregate finance reported at either the project or program level. Some data were provisional at time of reporting by governments.

11
REDD+ finance accounted for around 10% of FSF as a whole (Nakhooda et al, 2013). This
is a relatively small share of overall climate finance, but some countries such as Norway
dedicated 79% of their FSF contributions to REDD+ activities. Japan’s small share (just 2%
of FSF) directed to REDD+ has substantially lowered the average given it was the single
largest contributor of FSF (Watson et al, 2014).
2.4 Annual Trends in REDD+ Finance Donor pledges to REDD+ were highest prior to 2010 (see figure 3) reflecting the political
optimism around the prospects for a global REDD+ mechanism in the lead up to the
Copenhagen Conference of the Parties (Westholm et al, 2012). These included large
commitments of finance from Norway including a US$1 billion pledge to the Amazon Fund
in 2009; a US$1 billion pledge to Indonesia in 2010, and a US$250 million pledge to Guyana
in 2009 through the Guyana REDD+ Investment Fund (GRIF). As noted, REDD+ played
a significant but relatively small role in efforts to deliver FSF and new pledges recorded in
2011 and 2012 have been lower. However, important new pledges have been made in 2013
and 2014 including Norway’s US$300 million bilateral commitment to Peru and US$150
million to Liberia to support zero deforestation by 2020. In addition, the UK, US and
Norway also committed over US$310 million at the Warsaw 2013 Conference of Parties to
support a new multilateral BioCarbon Initiative for Sustainable Forest Landscapes.
The EU is presented both at the EU level and at the member state level. Japan’s leveraged private finance is excluded from the figure.
12
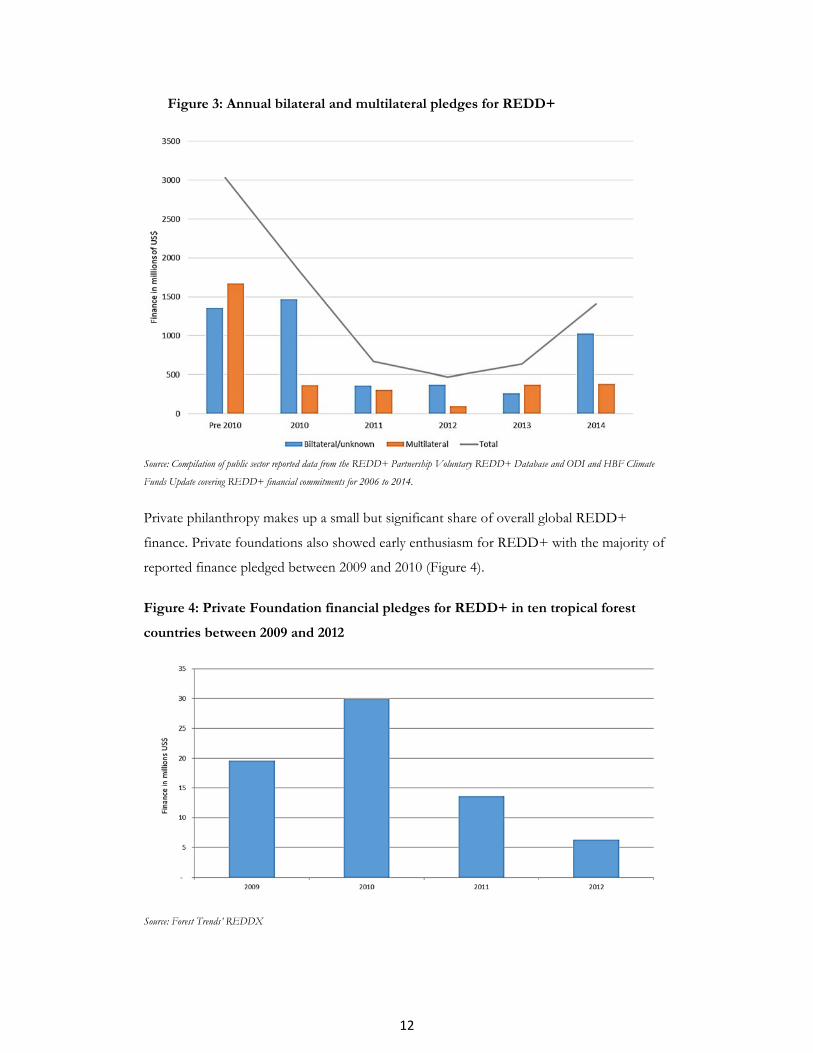
Figure 3: Annual bilateral and multilateral pledges for REDD+
Source: Compilation of public sector reported data from the REDD+ Partnership Voluntary REDD+ Database and ODI and HBF Climate
Funds Update covering REDD+ financial commitments for 2006 to 2014.
Private philanthropy makes up a small but significant share of overall global REDD+
finance. Private foundations also showed early enthusiasm for REDD+ with the majority of
reported finance pledged between 2009 and 2010 (Figure 4).
Figure 4: Private Foundation financial pledges for REDD+ in ten tropical forest
countries between 2009 and 2012
Source: Forest Trends’ REDDX

13
Recipient country experiences with accessing REDD+ finance are discussed in section 4. In
general, it is clear that the delivery of REDD+ finance has been difficult to predict, with the
timing of commitments to different developing countries largely explained by the particular
circumstances of their negotiations with donors and trajectory of access to international
funds (Canby et al, 2014).
3. REDD+ Donors
A relatively small number of donors have provided the majority of REDD+ finance to date,
with major variation in the scale and time frame of the commitments made.
Figure 5: Donor country pledges for REDD+ for the period 2006-2014
Source: Compilation of public sector reported data from the REDD+ Partnership Voluntary REDD+ Database and ODI and HBF Climate
Funds Update covering REDD+ financial commitments for 2006 to 2014.
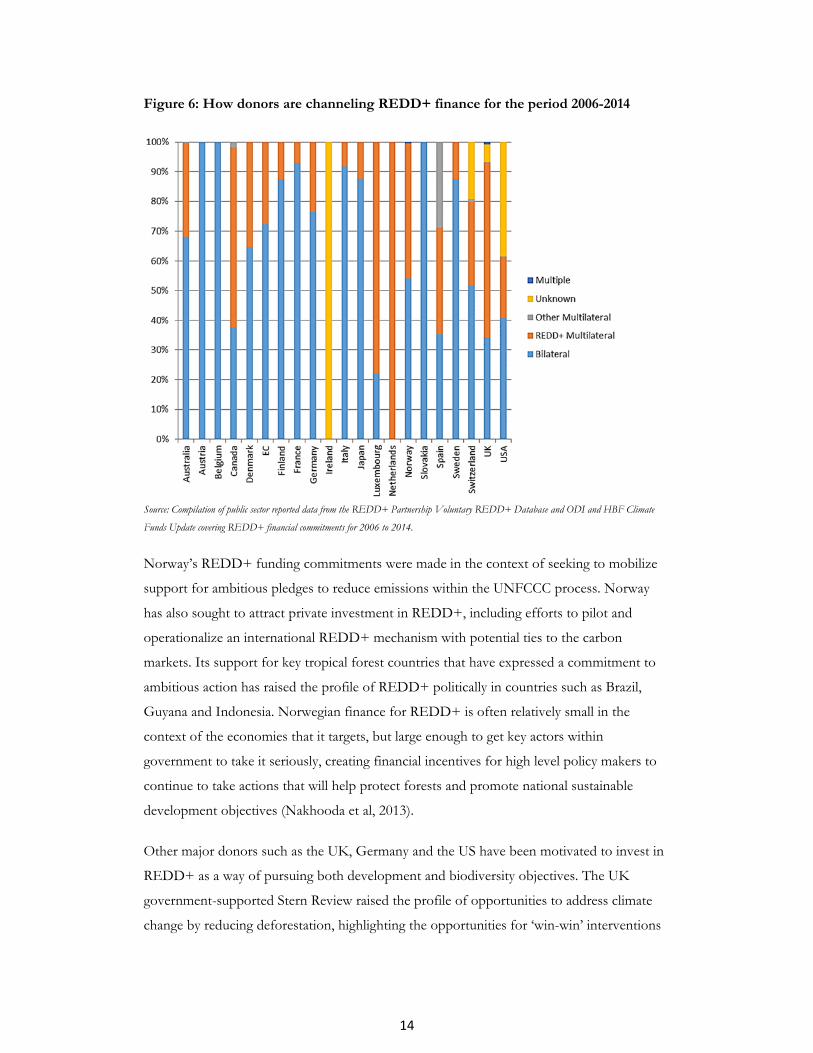
The UK, the Netherlands and Luxembourg are channeling the majority of their REDD+
finance through dedicated multilateral funds. In contrast, Japan, Finland, Germany and
France are directing the majority of pledges through bilateral arrangements.
Decisions around how to finance REDD+ often reflect perceptions of the respective
strengths of institutions in recipient countries as well as a general desire from donors to test
and learn from a number of approaches for financing REDD+ (UK Department of Energy
and Climate Change, 2014).
14
Figure 6: How donors are channeling REDD+ finance for the period 2006-2014
Source: Compilation of public sector reported data from the REDD+ Partnership Voluntary REDD+ Database and ODI and HBF Climate
Funds Update covering REDD+ financial commitments for 2006 to 2014.
Norway’s REDD+ funding commitments were made in the context of seeking to mobilize
support for ambitious pledges to reduce emissions within the UNFCCC process. Norway
has also sought to attract private investment in REDD+, including efforts to pilot and
operationalize an international REDD+ mechanism with potential ties to the carbon
markets. Its support for key tropical forest countries that have expressed a commitment to
ambitious action has raised the profile of REDD+ politically in countries such as Brazil,
Guyana and Indonesia. Norwegian finance for REDD+ is often relatively small in the
context of the economies that it targets, but large enough to get key actors within
government to take it seriously, creating financial incentives for high level policy makers to
continue to take actions that will help protect forests and promote national sustainable
development objectives (Nakhooda et al, 2013).
Other major donors such as the UK, Germany and the US have been motivated to invest in
REDD+ as a way of pursuing both development and biodiversity objectives. The UK
government-supported Stern Review raised the profile of opportunities to address climate
change by reducing deforestation, highlighting the opportunities for ‘win-win’ interventions
15
(Stern et al 2007) and support for REDD+ has been a central pillar of UK climate finance
(Watson et al, 2014). Biodiversity benefits of investments in REDD+ have also been an
important consideration for Germany in delivering continued finance. Alongside its
commitments to mobilize finance for climate change activities under the UNFCCC,
Germany has also made complementary commitments under the Convention on
Biodiversity (CBD) to scale up finance for forests and biodiversity protection (Harmeling et
al 2013). Germany’s REDD+ spend is thus aligned closely with national commitments under
both the UNFCCC and the Convention on Biological Diversity (CBD).
3.1 Multilateral funds Six main multilateral funds focus on forestry and REDD+ related programs: The UN-
REDD Programme, the Forest Carbon Partnership Facility (both the Readiness and Carbon
Funds), the Forest Investment Program, the Amazon Fund, the Congo Basin Forest Fund
and the BioCarbon Fund Initiative for Sustainable Forest Landscapes (ISFL).
Multilateral funds have a number of important core attributes which encourage investments
from donor countries. Multilateral development banks have robust governance and a ‘known
track record and safeguards, offer(ing)…taxpayers a lower risk way of investing overseas.
The investments are attractive in terms of administration costs on account of economies of
scale and the efficient use of common mechanisms and safeguards’ (UK Department of
Energy and Climate Change, 2014). The pooling of resources from a number of different
donor countries also allows implementation of programs in a wide range of countries and
contexts. In particular, shared programs are seen to encourage harmonization of donor and
recipient approaches to reducing emissions from forest degradation.
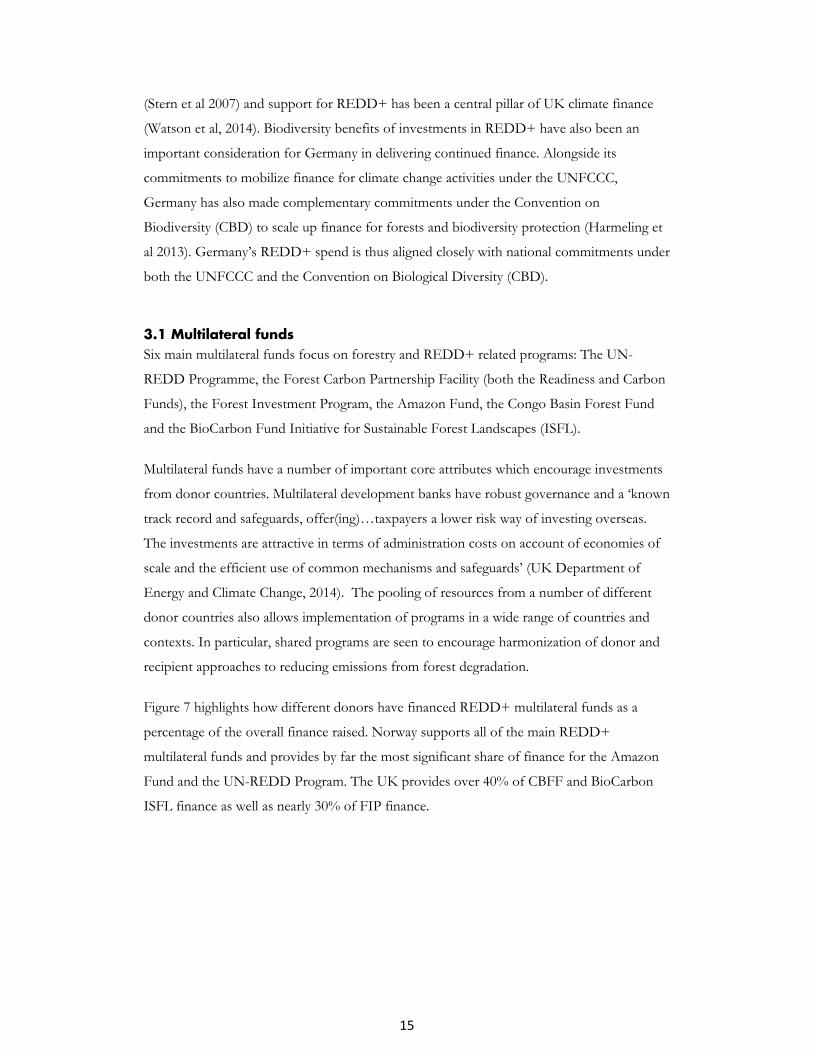
Figure 7 highlights how different donors have financed REDD+ multilateral funds as a
percentage of the overall finance raised. Norway supports all of the main REDD+
multilateral funds and provides by far the most significant share of finance for the Amazon
Fund and the UN-REDD Program. The UK provides over 40% of CBFF and BioCarbon
ISFL finance as well as nearly 30% of FIP finance.

16
Figure 7: Comparison of top ten donor pledges to the main REDD+ multilateral funds
Source: ODI HBF Climate Funds Update website. February 2015.

17
In total, the UN-REDD Programme has raised US$235 million in funds from international
donors and, like the FCPF Readiness Fund offers relatively small grants (in the region of
US$5 million) to REDD+ partner countries for capacity building and readiness activities.
The FCPF Readiness Fund raised US$358 million and has allocated initial US$200,000
grants to support 20 countries to produce a REDD+ Preparation Proposal (R-PP) with a
follow up US$3.4 million allocated for implementation of the R-PP and development of a
national REDD+ strategy. An additional US$200,000 is available to to support countries
develop national feedback and grievance redress mechanisms that are accessible, predictable,
fair, transparent and compatible with national as well as international standards. In total, the
FCPF Readiness Fund has allocated US$123.2 million with US$64.7 million disbursed as of
the end of 2014.
The FIP has raised US$603 million from international donors. Slow project approval and
financial disbursements have impacted continued resource mobilisation. For example the
UK suggested that the FIP ‘is not ready and able to accept further funding’ until allocations
and disbursals of current finance pick up (UK Department of Energy and Climate Change,
2014). At the end of 2014, the FIP has approved US$190.3 million for REDD+ activities.
Established in 2009, the Amazon Fund developed an innovative payment-for-performance
fundraising model to monitor and combat deforestation in the Amazon. The Brazilian
Economic and Social National Development Bank (BNDES) manages the fund which is
often seen as an example of how a developing country is leading and managing climate funds
in an inclusive way (Forstater et al, 2013). Under this model, donors provide financial
support to deliver the objectives of the fund equivalent to the emissions reductions already
achieved. This was estimated on the basis of the hectares of avoided deforestation achieved
below a reference level (or baseline), average carbon stocks and a fixed carbon price. Norway
pledged US$1 billion, Germany US$28.4 million and Brazilian oil company Petrobras13
US$5.6 million, to pay for a certain amount of emission reductions at an agreed price
(Forstater et al, 2013). Since 2005, Brazil has reduced its Amazon region deforestation rate
by 75% (UK Department of Energy and Climate Change, 2014) and 90% of Brazil’s
emissions reductions were not paid for by the existing pledges to the Amazon Fund. The
Amazon Fund differs from other dedicated multilateral funds for REDD+, in that it is
13 Petrobras is a publicly traded corporation where the Government of Brazil is the majority stakeholder. As
such, the finance from Petrobras does not represent an international flow but is included within this paper as a contribution to the Amazon Fund, predominantly funded by Norway and Germany.
18
predominantly funded by one donor country and at least 80% of mobilised funding is to be
spent in Brazil.
The Congo Basin Forest Fund (CBFF) managed by the African Development Bank was set
up in 2008 to support projects that reduce poverty and deforestation in the Congo Basin.
The CBFF has raised US$186 million to date (CFU, February 2015). Allocation and
disbursement of deposited funding has also been an issue, which has impacted continued
mobilisation of finance. There have also been a number of local concerns around the
longer-term sustainability of REDD+ projects and finance. A number of the NGO
beneficiaries have very little financing outside of the CBFF and it is not clear how project
activities will continue once these projects close after the three year CBFF project cycle
(African Development Bank, 2013).
The FCPF Carbon Fund and BioCarbon Fund Initiative for Sustainable Forest Landscapes
were established to help transition countries from REDD+ readiness activities to verified
emissions reductions through a performance-based payment approach. The Carbon Fund
became operational in 2011 and aims to test large-scale, jurisdictional approaches14 for
REDD+ with an emphasis on integration with policies and national REDD+ strategies
developed as part of the FCPF Readiness Fund processes. At the end of 2014, the FCPF
Carbon Fund had raised US$470.2 million from a broad array of public and some limited
private sector and NGO donors. Costa Rica was the first country to sign a Letter of Intent
with the Carbon Fund and is now eligible to access up to US$63 million for verified
emissions reductions. The DRC, Nepal, Ghana and Mexico are also approved pipeline
countries.
The BioCarbon ISFL became operational in November 2013, with the UK, Norway and US
announcing US$280 million in collective pledges at the Warsaw Conference of the Parties15.
The fund is also aimed at testing jurisdictional approaches that integrate reducing
deforestation and degradation with the climate smart agricultural practices to green supply
chains. As of February 2015, the fund is only operational in the Oromia region of Ethiopia,
14 Jurisdictional approaches refer to sub-national (provincial) REDD+ programs and their activities. This
serves as a framework from which to approach REDD+, with an emphasis on integration, both with policies and national REDD+ strategies. In this instance, jurisdictional REDD+ has not been taken to encompass the national level.
15 Since the 2013 announcement of collective pledges of US$280 million based on contributions of US$135 million from Norway, US$120 million from the UK and US$25 million from the US, the December 2014 mobilised funding reached US$311 based on US$150 million from Norway, US$135 million from the UK and US$25 million from the US. The UK has since pledged an additional £40 million to the BioCarbon ISFL in January 2015.
19
although other proposals are currently under consideration with likely recipients to include
Colombia, Zambia and Indonesia. The Amazon Fund, the FCPF Carbon Fund and the
BioCarbon Fund are discussed in more detail in section 5, which reflects on the role of
performance-based payments in financing REDD+.
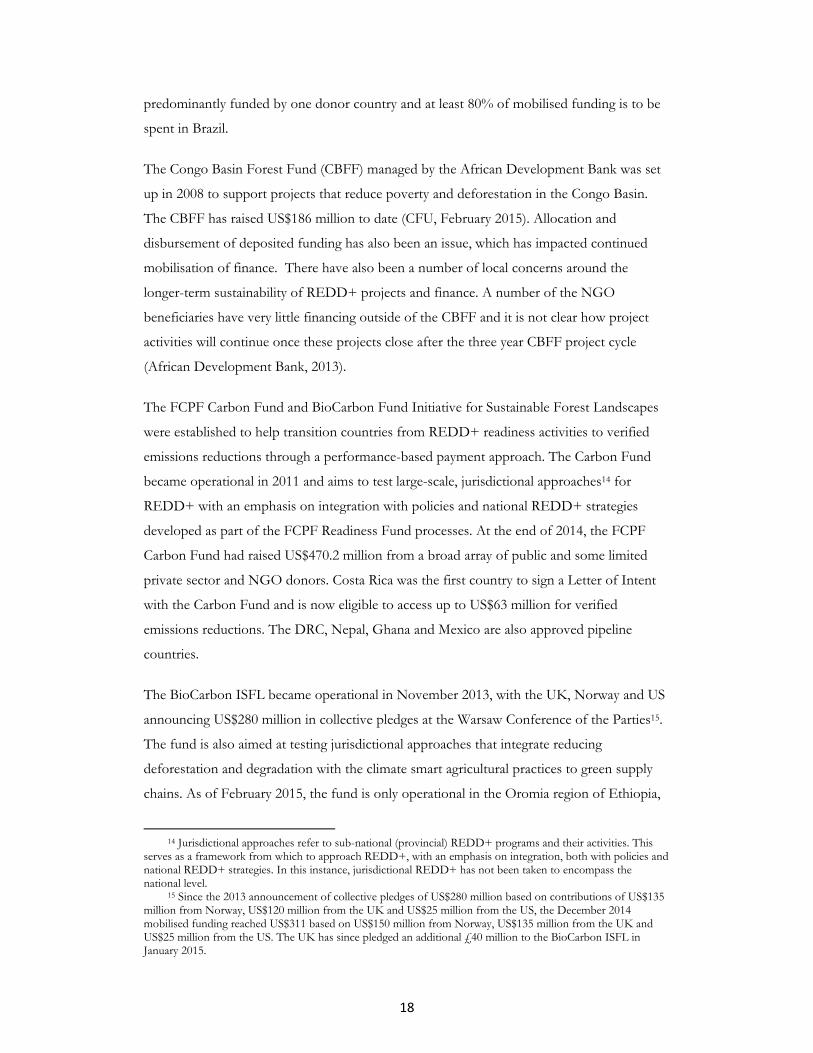
3.2 Disbursements of REDD+ pledges For all the discussion of donors and pledges of support for REDD+, finance actually
released or disbursed from donor bank accounts to recipients has been much lower. Funding
channeled through multilateral development banks highlights the protracted disbursement
timeframe (Figure 8). Donors have deposited16 around 75% (or US$2.4 billion) of the
US$3.2 billion pledged17 to multilateral development banks. Dedicated multilaterals have
themselves committed 60% (of the overall US$3.2 billion pledged) to countries or projects18,
with 32% of the total finance formally approved19 and just 12% actually disbursed20.
Figure 8: Pledges and disbursements through dedicated multilateral funds 2006-2014
Source: ODI HBF Climate Funds Update. Based on data for the Forest Investment Program, the FCPF Carbon Fund, the FCPF Readiness
Fund, the Congo Basin Forest Fund, the Amazon Fund, the BioCarbon Fund ISFL and the UNREDD Programme as of 31st December 2014.
16 “Deposits” represent the funds that have been transferred from the donor into the account(s) of the fund. 17 “Pledges” represent verbal or signed commitments from donors to provide financial support for a
particular fund. 18 “Commitments” in this context refers to funding that has been set aside or announced as being set aside
for a country but has not been formally approved for a specific project or program. This would include for example the FCPF Carbon Fund announcing a US$63 million commitment to purchase verified emissions reductions from Costa Rica.
19 “Approvals” represent funds that have been officially approved and earmarked to a specific project or program.
20 “Disbursements” represent funds that have been released to a recipient’s bank account, recording the actual transfer of finances, services or materials. In cases where in-kind or technical assistance has been provided, such as trainings, workshops, administration capacity building or provision of technology or infrastructure, disbursements are tracked when the funds have been transferred to the service provider or the recipient.

20
Slow progress in program approval and implementation as well as slow processes for
transferring finance result in relatively slow disbursement. The Amazon Fund for example
has been criticized for bureaucratic procedures in transferring funds to “grantees” which has
impacted overall efficiency (Zadek et al, 2010). Figure 9 shows how the number of Amazon
Fund project approvals has increased between 2010 and 2012. The pace of approvals has
improved: As of December 2014, the Amazon Fund has cumulatively approved US$391
million for projects and disbursed US$147 million.
Figure 9: Amazon Fund allocations over time: projects and finances
Source: ODI and HBF Climate Funds Update as of December 2014
In addition the Congo Basin Forest Fund (CBFF) has also struggled to select projects and
disburse agreed funds (PricewaterhouseCoopers et al, 2011). Figure 10 highlights CBFF
project and finance allocations over time. In 2012, the CBFF conceded that ‘disbursement
procedures are still tricky for some beneficiaries and something needs to be done in order to
solve this issue. ‘Norway and the UK have made a number of visits to the CBFF offices
to...identify bottlenecks and solutions...to improve the performance of the CBFF portfolio’
according to the fund’s performance report. To date, the CBFF has approved US$82.24 and
disbursed US$52 million21. In general, most projects disburse about 15%, the first year, 50%
the second year and at least 90% in the final, third year (African Development Bank 2013).
21 The value of CBFF approvals and disbursements (reported in Euros) has decreased over 2014 since initial
publication of this paper. This reflects significant strengthening of the US Dollar against the Euro in the second half of 2014. The CBFF portfolio of projects consists of 37 projects collectively accounting for €70.8 million. While the CBFF portfolio of projects was collectively worth US$96 million in approvals in January 2014, the same portfolio was worth US$82 million in December 2014. The CBFF disbursed more than €14 million in 2014 with on average 67% of approved funding across the 37 projects now disbursed.

21
Stakeholders have complained that slow disbursements and evaluations have led to a number
of projects being put on hold or abandoned altogether (Karsenty, 2012) and are linked to a
lack of expertise on forest and climate change issues within the African Development Bank
(African Development Bank, 2013).
Figure 10: CBFF allocations over time: projects and finances
Source: ODI and HBF Climate Funds Update as of December 2014
The adoption of performance-based payments affects disbursement rates, as a significant
proportion of committed funding will be disbursed towards the end of a project or program
of activities. Nevertheless, slow disbursement — particularly for programs focused on
capacity building or more traditional implementation — have affected fundraising efforts.
For example, the business case for the UK’s recent investments in the BioCarbon ISFL and
FCPF Carbon Fund notes that a number of existing funds such as the CBFF have a
‘considerable tranche of funds from previous donations still to disburse (which means the
funds are) not currently accepting a new round of projects and investments’ (UK
Department of Energy and Climate Change, 2014).
4. Recipients of REDD+ finance
REDD+ finance has targeted all regions around the globe although Latin America and the
Caribbean (accounting for 28% of multilateral and bilateral funding pledges), and Asia
Pacific (23%) have attracted the most significant support from donors (Figure 11). Sub-
Saharan Africa will receive 14% of pledged finance. However, there are differences across
channels. Dedicated multilaterals have tended to fund REDD+ in the Latin America and
Caribbean region, committing 74% of allocated funding to the region. In contrast, bilateral

22
programs have pledged 38% of funding for REDD+ in Asia Pacific and 18% of funding to
international research and programs with a global or multiple region focus. The largest is the
UN-REDD National and Global Program (US$72 million), which aims to benefit all UN-
REDD Program partner countries simultaneously by developing and delivering knowledge-
based services, products and expertise to assist their progress through the full REDD+
process.
Figure 11: Funding pledged to recipient regions between 2006 and 2014 (in millions
US$)
Source: Compilation of public sector reported data from the REDD+ Partnership Voluntary REDD+ Database, ODI analysis on the Fast
Start Finance period between 2010 and 2012 and ODI and HBF Climate Funds Update covering REDD+ financial commitments for
2006 to 2014.
23
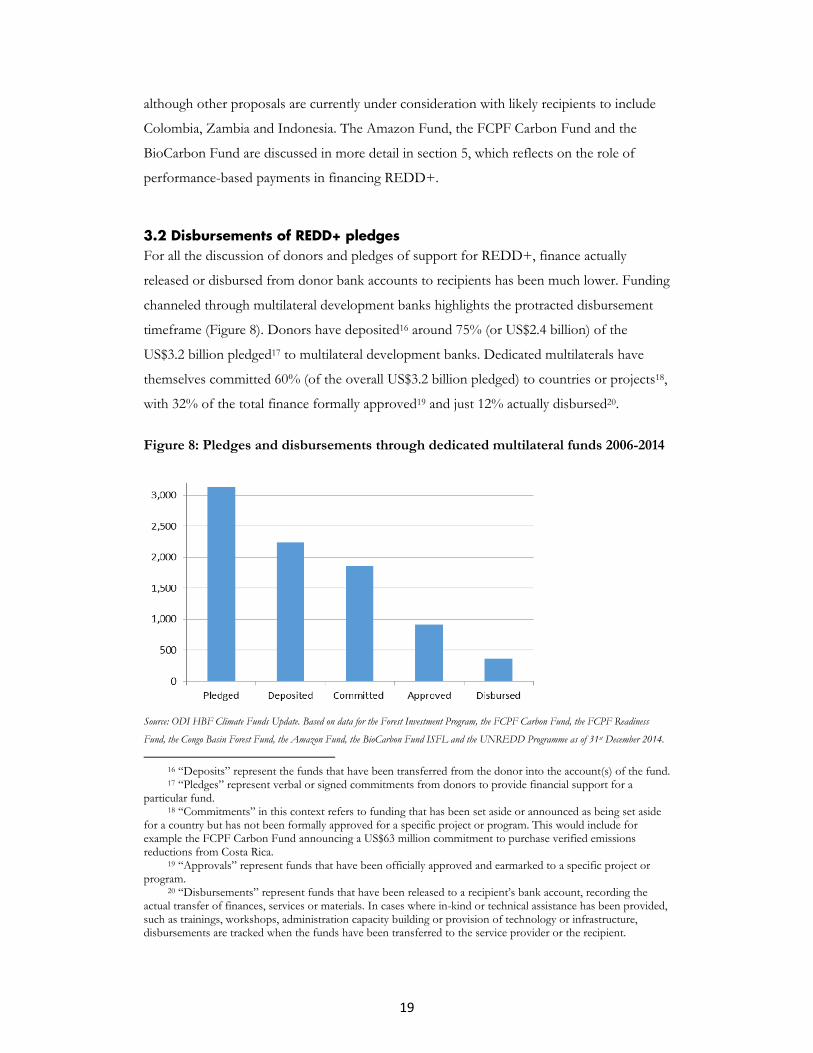
Figure 12: Funding pledged (committed and approved) by recipient country in millions US$ for 2006-2014
Source: Compilation of public sector reported data from the REDD+ Partnership Voluntary REDD+ Database, ODI analysis on the Fast
Start Finance period between 2010 and 2012 and ODI and HBF Climate Funds Update covering REDD+ financial commitments for
2006 to 2014.
Donors have financed REDD+ activities in more than 80 recipient countries since 2006,
but our review suggests 35% of finance has been directed to just two priority countries:
Indonesia (19% of total REDD+ finance pledged) and Brazil (17%). Table 2 therefore
explores the REDD+ context in these two countries. Other top recipients include Peru,
Guyana the Democratic Republic of Congo and Liberia (together, these four countries will
receive 15% of funding) followed by Tanzania, Ecuador, Vietnam and Lao PDR . With 20%
of funding directed to global programs or international research, just 17% of allocated
funding is supporting REDD+ activities and programs across the remaining 75 recipient
countries.
24
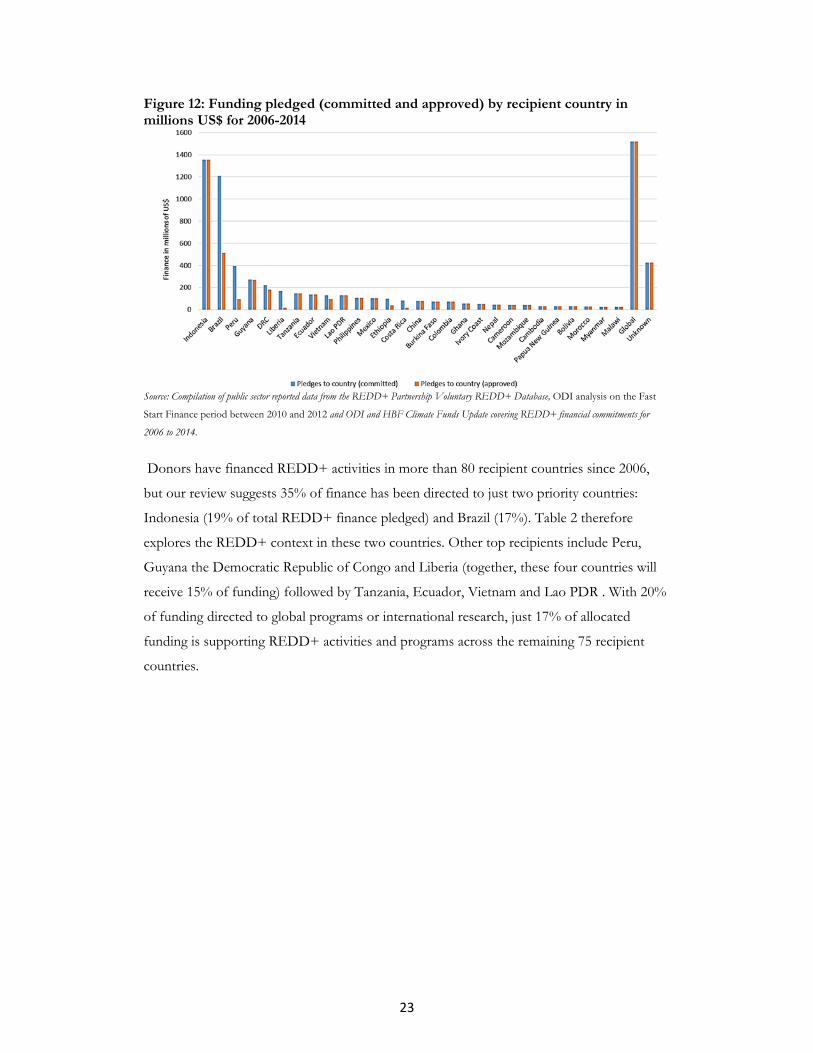
National context and REDD+ landscape for Brazil and Indonesia
Source: ODI Effectiveness of REDD+ Finance, 2014.
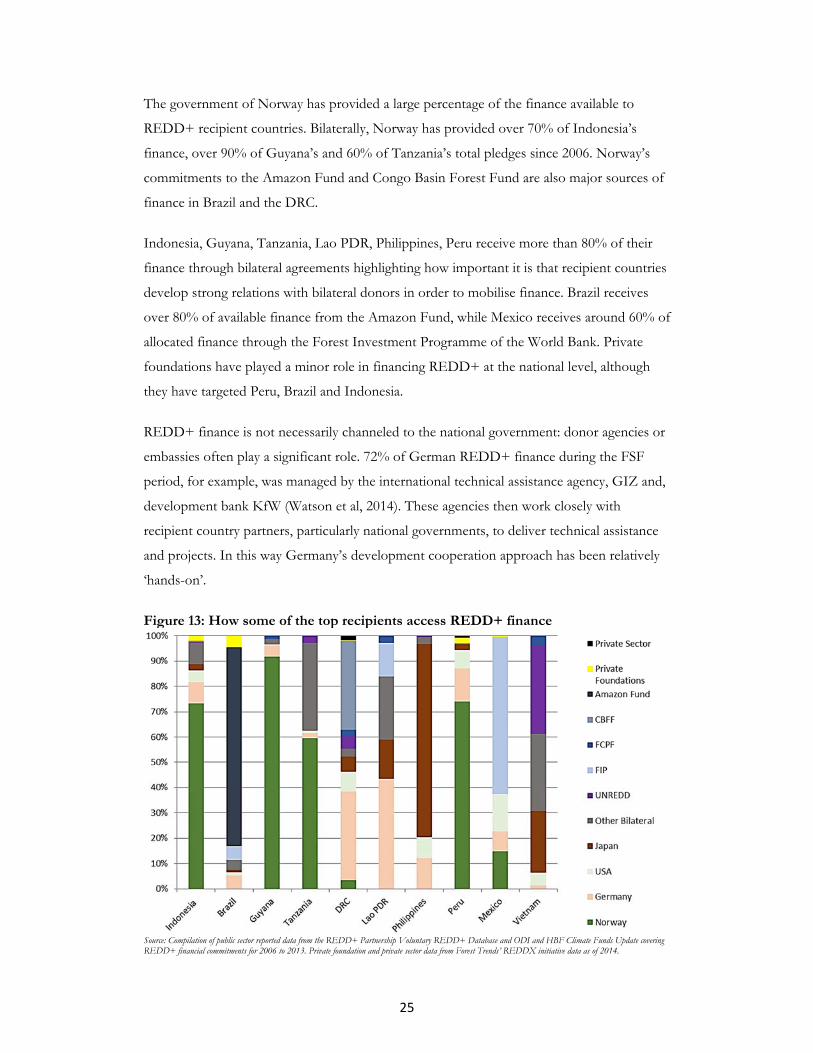
Recipient countries receive finance in very different ways from a number of donors. Figure
13 shows how some of the main recipients of REDD+ finance access funding.
Brazil Indonesia
Forest status and losses
Largest area of tropical forest in the world with rates of loss at 0.4% between 2005 and 2010, deforestation has slowed but 2013 data suggests that deforestation is increasing (INPE, 2013). An estimated 77% of Brazil’s emissions result from forest and land use change (GoB, 2012/2nd UNFCCC comms).
Third largest area of tropical forest in the world and rates of deforestation at 0.7% between 2005 and 2010 (MoE, 2009). An estimated 60% to 85% of Indonesia’s emissions arise from land use and change (GOI 2011 in FIP; National Council on Climate Change, 2010).
National REDD+ commitments
2009 voluntary GHG reduction commitment at UNFCCC – Copenhagen (between 36.1% and 38.8% by 2020 compared to business as usual emission levels). Copenhagen pledges have been internalized in the national policy framework through the National Policy on Climate Change (2009). In this context, reducing emissions from deforestation represents the lion’s share (24.7%) of total GHG emission reduction targeted. A National REDD+ Strategy is under formulation, but has yet to be agreed. Brazil submitted Reference Level data to the UNFCCC in Bonn, June 2014.
2009 voluntary GHG reduction commitment at UNFCCC – Copenhagen and G-20 in Pittsburgh: reduction between 26-41% (depending on donor assistance) of GHG emission by 2020 against business as usual emissions. 2009 international commitments embodied in the National Action Plan to reduce GHG emissions (RAN-GRK). Letter of intent between Indonesia and Norway (2010) whereby Indonesia commits to implementing a number of REDD policies and creating new REDD agencies/funds in exchange for financial support. This included the creation of: A moratorium of new forestry concession firstly enacted in 2011 for two years and extended for two additional years in 2013; REDD+ national fund (FREDDI) to channel Norway funds and other co-financing.
REDD+ finance sources
Multilateral: Amazon Fund; FIP Bilateral: Germany, Japan, Spain, Austria, France UK, and the US. Private foundations: Including ClimateWorks Foundation, Gordon and Betty Moore Foundation, David and Lucile Packard Foundation, Ford Foundation and Skoll Foundation.
Multilateral: UN-REDD Program, FCPF and FIP Bilateral: UK, Japan, South Korea, Germany, Australia, US, France, Denmark, Finland, the EU and Norway (who have pledged US$1 billion by 2015 in their 2010 Letter of Intent). Private foundations and private sector: ClimateWorks Foundation, Gordon and Betty Moore Foundation, David and Lucile Packard Foundation, Ford and Macquarie.
25
The government of Norway has provided a large percentage of the finance available to
REDD+ recipient countries. Bilaterally, Norway has provided over 70% of Indonesia’s
finance, over 90% of Guyana’s and 60% of Tanzania’s total pledges since 2006. Norway’s
commitments to the Amazon Fund and Congo Basin Forest Fund are also major sources of
finance in Brazil and the DRC.
Indonesia, Guyana, Tanzania, Lao PDR, Philippines, Peru receive more than 80% of their
finance through bilateral agreements highlighting how important it is that recipient countries
develop strong relations with bilateral donors in order to mobilise finance. Brazil receives
over 80% of available finance from the Amazon Fund, while Mexico receives around 60% of
allocated finance through the Forest Investment Programme of the World Bank. Private
foundations have played a minor role in financing REDD+ at the national level, although
they have targeted Peru, Brazil and Indonesia.
REDD+ finance is not necessarily channeled to the national government: donor agencies or
embassies often play a significant role. 72% of German REDD+ finance during the FSF
period, for example, was managed by the international technical assistance agency, GIZ and,
development bank KfW (Watson et al, 2014). These agencies then work closely with
recipient country partners, particularly national governments, to deliver technical assistance
and projects. In this way Germany’s development cooperation approach has been relatively
‘hands-on’.
Figure 13: How some of the top recipients access REDD+ finance
Source: Compilation of public sector reported data from the REDD+ Partnership Voluntary REDD+ Database and ODI and HBF Climate Funds Update covering REDD+ financial commitments for 2006 to 2013. Private foundation and private sector data from Forest Trends’ REDDX initiative data as of 2014.

26
National governments have only received a small proportion of finance directly. During the
FSF period, only 8% of REDD+ finance from the top five contributors was channeled to
recipient governments (Watson et al, 2014). The exception is Japan which has pledged 64%
of its REDD+ FSF to recipient country national governments through the Forest
Preservation Program.
NGOs have also received a significant volume of finance to implement REDD+ activities
across global programs and also in-country. During the FSF period, around 8% of finance
was directed to NGOs. Half of this finance was provided by Norway through a dedicated
program to support civil society engagement in REDD+ efforts, and to provide
accountability for the wider programs it funds.
In part, the choice of recipient institution is likely to reflect perceptions of the respective
strengths of institutions in recipient countries. The offer of results-based payments at a
sufficient scale can provide a strong incentive to change practices and access the finance held
by a third-party intermediary.
5. Paying for performance: Reducing emissions from deforestation and degradation
REDD+ finance offers an opportunity to pay for actual emissions reduced and to therefore
encourage preservation of forests and a reduction in deforestation and forest degradation.
However, to date, the vast majority of finance has been targeted towards readiness activities
such as capacity building, training workshops, strengthening in-county institutions and
developing national REDD+ policies and strategies (Angelsen, 2013). These activities are
ultimately based on preparing a country for verified emissions reductions on a payment for
performance basis.
5.1 Performance-based payments As noted, a number of donors and climate funds are exploring performance-based
approaches to REDD+. Broadly a performance-based payment approach disburses finance
to delivery agents (which might include private companies or state agencies) upon the
delivery of (predetermined) results or outputs (Müller, Fankhauser and Forstater, 2013).
Such mechanisms have been used to deliver development assistance for health and
education, with payments based on evidence of progress towards agreed outcomes such as
the number of pupils passing an educational qualification, or the number of individuals

27
vaccinated for a disease. The relative successes of such results-based approaches depend on
a wide range of variables including the scale of implementation, the type of recipient, the
complexity of indicators, and the way that the performance will be measured (Birdsall and
Savedoff (2010); Savedoff (2011) and Pearson et al (2010)).
The relatively narrow focus of REDD+ and the technical potential to measure and monitor
forest cover and associated emissions, has raised interest in the potential to use
performance-based or ex-post finance.
However, as of December 2014, 42% of total bilateral and multilateral REDD+ finance has
been pledged on a payment for performance basis. This suggests that at least 58% of finance
has been channeled ex-ante in the form of grants for readiness activities that are not
specifically tied to reducing emissions from deforestation and forest degradation.
5.2 Performance-based payments and REDD+ donors The scope of donor performance-based payments for REDD+ have been relatively limited
to date. Norway is the biggest proponent of results-based payment mechanisms stating that
‘ex post payments for verified emission reductions provide the best way to incentivize
emission reductions in any sector, including REDD+’ (Government of Norway, 2012).
The scale of Norway’s support for performance-based aid is significant as set out in Figure
14. Since 2006, Norway has pledged over US$3 billion in performance-based payments
through a number of high profile bilateral and multilateral agreements such as a partnership
with Indonesia, establishing the Amazon Fund and the Guyana REDD+ Investment Fund
(GRIF) and more recently through bilateral commitments with Peru and Liberia. Around
74% of Norway’s REDD+ pledges have piloted performance-based payment approaches to
reducing emissions.
Germany has also focused on financing results, pledging around 25% of overall REDD+
finance (or US$224 million) in payments for performance through multilateral funds and,
more recently the REDD+ Early Movers Program (REM). REM, managed by GIZ and
KfW is designed to offer bridge funding between late Phase II readiness activities and Phase
III aimed at producing verified emissions reductions at scale.
A number of countries are funding multilateral programs aimed at producing carbon offsets
and reducing emissions such as the Forest Carbon Partnership Carbon Fund and the

28
recently announced BioCarbon Fund ISFL launched in 2013. The UK, Norway and the US
are funding both dedicated multilaterals.
Figure 14: Performance-based payments as a proportion of overall REDD+ Finance
Source: Compilation of public sector reported data from the REDD+ Partnership Voluntary REDD+ Database, ODI analysis on the Fast
Start Finance period between 2010 and 2012 and ODI and HBF Climate Funds Update covering REDD+ financial commitments for
2006 to 2014.
5.3 REDD+ performance-based payments in action Donors and dedicated funds have approached REDD+ performance-based payments in
diverse ways, which has ultimately impacted the results and finance flowing. Table 3
summarizes and compares across different bilateral and multilateral performance-based
programs. The size of programs varies substantially from US$61 million for multiple
countries in the case of the German REDD+ Early Movers program (which received
additional support from Norway to extend the program to Colombia and Ecuador at the
20th session of the Conference of the Parties in Lima in December 2014), to more than
US$1 billion in the case of the Amazon Fund. And their scope varies from “jurisdictional”
to more contained at local or sub-national level as in some of the REDD+ early mover
cases. Several are in quite early stages of implementation, and much remains to be seen
about how they will work in practice.
5.3.1 Payment timing and focus on results
To date, only a relatively small number of programs or percentage of performance-based
finance is actually paid ex-post and based on results achieved. Although, a number of
29
programs claim to be paying for results but are do so at a relatively superficial level, or pay in
ex-ante (Kenny and Savedoff, 2013).
Norway’s financial support to the Amazon Fund is contingent on emissions reduced in legal
Amazon region. However, while Brazil’s overall deforestation rate is monitored by the
Brazilian Forest Service (SFB) and Brazilian National Institute of Space Research (INPE)
with independent auditing of results, the Amazon Fund does not specifically assess or
remunerate its projects based on the emissions reduced. In addition, Amazon Fund projects
are actually supporting a range of forest conservation and sustainable development
objectives and not specifically targeted towards emissions reductions as the main outcome.
Therefore there is a fundamental distinction between the way that the international donors
provide finance to the Amazon Fund (on a performance-based payment basis) and the way
the Amazon Fund manages, monitors and provides finance to projects and activities (as non-
reimbursable investments and disbursements based on project spend).
The BioCarbon Fund ISFL of the World Bank became operational in November 2013. This
new program also aims to deliver emissions reductions through performance‐based
payments. However, around 27% of the US$311 million raised has been allocated for ex-
ante technical assistance funding that will support countries such as Ethiopia (the first pilot
jurisdiction), Colombia, Zambia and Indonesia (under consideration) build public sector
capacity, engage the private sector and create integrated programs. The World Bank notes
that ‘payments that are purely based on performance (i.e., after emission reductions have
been verified) do not alleviate the upfront financing needs unless they can be advanced in
the form of pre‐payments or monetized’ (World Bank, 2014).
Both the BioCarbon Fund ISFL and the FCPF Carbon Fund are only in the very initial
stages of piloting performance-based payment mechanisms and it is therefore unclear the
extent to which ex-ante payments will be made across their portfolios. The Carbon Fund has
made an initial commitment to Costa Rica to negotiate the purchase of up to US$63 million
worth of emissions reductions and removals. This funding is to preserve 340,000 hectares of
privately owned land including Indigenous People’s territories but it remains unclear how
this mechanism will work and to what extent payments will be delivered on emissions
reduced.

30
5.3.2 Incentive mechanisms
Payment for results is intended to incentivize action and encourage change. The reference
levels for this change, however, vary widely across programs, and have implications for the
“result” that ensues. However, as of December 2014, allocation and spend has lagged
behind the pledged and available funding. The Amazon Fund contracted US$391 million in
grants and the GRIF committed around US$40 million to project activities (Amazon Fund,
2014; GRIF 2014) out of much larger available pledges. The rate at which the Amazon Fund
is allocating and then disbursing funding raises questions about the extent to which falling
deforestation can really be attributed to Amazon Fund supported activities (Zadek,
Forstater, and Polocow, 2010).
Yet at the same time, the results Brazil is delivering in terms of deforestation reductions
require much greater investment than the funding that is available through the Amazon
Fund itself. Put another way, the “performance” is much larger than the currently available
“payment”. The reference level set for the payments was initially based on historical
deforestation for the period between 1996 and 2005. Due to the rapid fall in deforestation
between 2004 and 2009, Brazil will be ‘earning’ REDD+ credits in the order of US$10
billion or 10 times the promised or available amount (Angelsen 2013). In addition, the
Amazon Fund portfolio has focused on capacity building activities; few programs to date
have targeted overarching market drivers of deforestation, or sought to encourage additional
private sector investment.
5.3.3 Monitoring and Indicators
Paying for performance is often most successful when the performance can be measured
against a clear outcome (Kenny and Savedoff, 2013). Establishing multiple, complex
indicators can muddy the focus on a core goal or outcome. It can also mean that funding is
not necessarily disbursed based on results but becomes more dependent on the political
negotiation skills of recipients, and their ability to convince a funder that progress towards
achieving outcomes is on track.
The Norway Indonesia Partnership has encouraged implementation of a phased approach to
REDD+ through a transition from readiness towards verified emissions reductions. Multiple
performance indicators cover institutional strengthening and policy criteria such as
completing a national REDD+ strategy, creating an independent MRV institution, a
moratorium on forest and peatland concessions as well as the creation of a new REDD+

31
Agency under which it was expected that REDD+ finance will be tracked and coordinated.
Finally, this agreement commits to pay for verified emissions reductions. The first
assessment of the Norway Indonesia Partnership suggests that progress is being made, and
that the Letter of Intent is already having positive impacts. It ‘has brought to the fore many
questions that must be answered if REDD+ is to be made to work, some of them now
being asked in Indonesia for the first time’ (Caldecott et al 2011).
In addition, there is a need to reflect on how performance is assessed. The Amazon Fund
monitors projects through an assessment of spend rather than impact (Forstater et al., 2013)
although efforts to develop wider performance-based metrics are underway. The initial
evaluation of the Norway-Indonesia Partnership noted that activities and finance should be
more focused on the quality of processes rather than an exclusive focus on outputs and dates
(Caldecott et al 2011).
5.3.4 Other benefits
REDD+ programs structured on a performance basis are also supporting important
processes and delivering co-benefits. Norway’s commitment to Guyana has demonstrated
successes through developing a national system for monitoring, reporting and verifying
deforestation and carbon emissions. This national MRV system ‘has identified a recent rise
in emissions from deforestation, and has been able to attribute the increase to a particular
driver—gold mining’ (Birdsall and Busch, 2014). Information on the drivers of deforestation
can help countries better adjust policies and measures to address any changes in emissions.
In addition, the GRIF has also strengthened forest governance institutions and encouraged
broad buy in for the country’s Low Carbon Development Strategy.

32
Additional options for REDD+ Finance
In light of the challenges experienced in piloting REDD+ performance-based programs, climate or green bonds issued by governments (at local, regional or national level) or companies, and impact bonds linked to projects or programs are currently receiving significant attention as a way of mobilizing upfront financing as well as incentivizing emissions reductions (Lowery et al, 2014; The Global Canopy Program et al, 2014).
Although climate or green bonds are fixed-income financial instruments (where the issuer is obliged to pay interest and/or to repay the principal), impact bonds are not a traditional bond, since repayment and return on investment are contingent upon achieving a number of desired outcomes; and if these are not achieved, investors will not receive return or repayment.
While models for climate or green bonds and impact bonds linked to REDD+ outcomes are still being developed and piloted, it is likely that these instruments will face similar challenges to broader performance-based payment programs assessed in this paper. While bonds attempt to provide early ex-ante finance for REDD+ activities, this still relies on 1) investor interest and willingness to provide up-front pre-financing for REDD+ and 2) public sector demand for emission reductions. These investments will likely continue to be impacted by the same political uncertainty which has impacted the carbon markets. Furthermore, repayment relies on long term public demand for REDD+. The likely scale or level of pre-financing remains dependent on what donors will be continuingly willing to repay for REDD+ in ten to fifteen years. As this report demonstrates, there has been cautious financial and political commitment for REDD+ to date with US$8.7 billion in total public sector commitment (out of the US$9.8 billion overall total) between 2006 and 2014. In addition, experience from the Amazon Fund illustrates how emissions reduced have vastly exceeded public financing available. All financing options require political certainty and commitment to ultimately ensure both upfront investment and security that there will sufficient funds (from both public and private sources) to pay for results delivered in ten to fifteen years.

33
Table 3: REDD+ performance based payment programs compared
Guyana REDD+ Investment Fund (GRIF)
Forest Carbon Partnership Facility’s (FCPF) Carbon Fund
Norway/Indonesia Partnership
Amazon Fund
Germany’s REDD+ Early Movers Programme (REM)
BioCarbon Initiative for Sustainable Forest Landscapes
Financial pledge
US$250 million US$470 million US$1 billion US$1.03 billion US$61 million US$311 million
Finance type funders
Public-Bilateral Funders: Norway
Public and Private- Multilateral Funders: UK, EU, Australia, Canada, Germany, Norway Switzerland, USA, BP, CDC Climat and TNC Managed by World Bank
Public- Bilateral Funders: Norway
Public and Private- Multilateral Funders: Norway, Germany and Petróleo Brasileiro S.A. – Petrobras Managed by Brazilian National Bank BNDES
Public-Bilateral Funders: Germany, Norway
Public- Bilateral Funders: Norway, UK and USA
Scale Jurisdictional National and jurisdictional
Jurisdictional Regional and project level
National and jurisdictional
Jurisdictional
Geographical Scope
Guyana Only countries already registered with the FCPF and at determined level of REDD+ readiness
Indonesia Amazon Basin. 80% of resources targeting Brazilian Amazon. Up to 20% of resources may be directed to other biomes in Brazil and other tropical countries
Global Unknown. The only jurisdiction is the state of Oromia in Ethiopia. Jurisdictions in Colombia, Indonesia and Zambia are currently under consideration.
Activity Scope
Only reduced emissions from deforestation at the start. Other REDD+ activities could be addressed in the future.
Full scope of REDD+ 80% of funds are dedicated to verified emissions reductions from deforestation, forest degradation or peatland conversion. Some institutional and capacity building activities will be supported with 20% of the finance.
REDD+, sustainable forest management, recovery of deforested areas. Other capacity building activities are funded by the Amazon Fund that do not directly create emissions reductions.
Only verified emissions reductions from deforestation
Potential activities for support include small scale plantation farming, sustainable forest management, afforestation and reforestation, regeneration, National Park designation / no-deforestation zoning, agroforestry and sustainable agricultural practices.
Reference Level
Based on Guyana’s historical deforestation rates for 2000-2009 (0.03%) plus the global average deforestation rate of 0.52% from 2005-2010. Reference level set at 0.275%. Guyana receives less compensation if deforestation rate rises above 0.056%, and none if rate rises above 0.1%
Geo-referenced and nested. Adjustments from historical average are allowed only for programs within high forest, low deforestation countries. Public consultation and peer review are required in the approval process for a reference level.
Based on either UNFCCC level or domestically according to Indonesia’s emissions reductions pledges and UNFCCC methodological guidance.
Based on a historical reference level; i.e. average deforestation, over past ten years, and updated every five years. The emission factor (lost carbon per ha) is set to 100tC/ha, with a payment of US$5/tCO2.
Based on proxy indicators, primarily the IPCC’s conservative estimates of forest carbon or country targets along with conservative assumptions on the price of CO2 for VERs
Not yet implementing. The pilot project in Ethiopia has agreed to begin with a simple MRV approach based on historic deforestation rates and then elaborate as capacity is built in implementing agencies over time and established initial performance targets.
Leakage A national land use planning system is to be developed to avoid leakage. Leakage is captured in the national accounting system.
Both international and domestic leakage potential must be assessed. In the MRV system only domestic leakage has to be counted.
Unknown Not specifically addressed. It is unclear whether BNDES requires leakage management from projects
Unknown Unknown
Funder payments
Initial payment on signing Administrative Agreement in 2009, then annually on request from the World Bank (Trustee). Annual payments based on projected 12 months of projects and admin costs. Total is determined by results and emissions avoided.
Payments made on delivery of the emission reductions which have been independently verified. Some upfront payments may be possible subject to conditions still to be established.
US$200 million to be paid as ‘contribution-for-delivery’ of initial preparation and transformative activities (Phases 1 and 2 agreed in the Letter of Intent). US$800 million to be paid as a ‘contribution-for-verified-emissions-reduction’ during the final third phase of the Partnership.
Payments on written requests from fund manager BNDES based on the financial needs of Fund and levels of emissions reductions attested by the Technical Committee
Payments solely on verified emissions reductions. Incentive payments made in support for Readiness activities.
Payments expected when programs produce a defined result. The fund could also deploy results-based finance to incentivize policy changes in emerging markets that would advance the sustainable land management agenda.
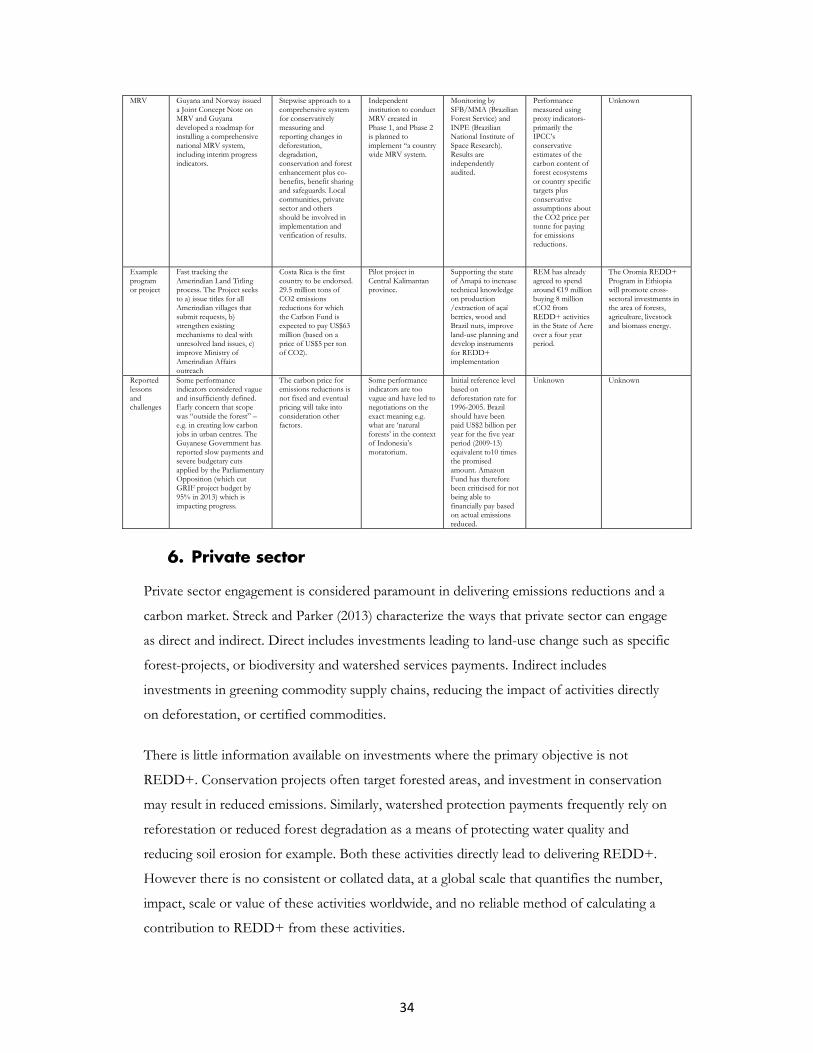
34
6. Private sector
Private sector engagement is considered paramount in delivering emissions reductions and a
carbon market. Streck and Parker (2013) characterize the ways that private sector can engage
as direct and indirect. Direct includes investments leading to land-use change such as specific
forest-projects, or biodiversity and watershed services payments. Indirect includes
investments in greening commodity supply chains, reducing the impact of activities directly
on deforestation, or certified commodities.
There is little information available on investments where the primary objective is not
REDD+. Conservation projects often target forested areas, and investment in conservation
may result in reduced emissions. Similarly, watershed protection payments frequently rely on
reforestation or reduced forest degradation as a means of protecting water quality and
reducing soil erosion for example. Both these activities directly lead to delivering REDD+.
However there is no consistent or collated data, at a global scale that quantifies the number,
impact, scale or value of these activities worldwide, and no reliable method of calculating a
contribution to REDD+ from these activities.
MRV Guyana and Norway issued a Joint Concept Note on MRV and Guyana developed a roadmap for installing a comprehensive national MRV system, including interim progress indicators.
Stepwise approach to a comprehensive system for conservatively measuring and reporting changes in deforestation, degradation, conservation and forest enhancement plus co-benefits, benefit sharing and safeguards. Local communities, private sector and others should be involved in implementation and verification of results.
Independent institution to conduct MRV created in Phase 1, and Phase 2 is planned to implement “a country wide MRV system.
Monitoring by SFB/MMA (Brazilian Forest Service) and INPE (Brazilian National Institute of Space Research). Results are independently audited.
Performance measured using proxy indicators-primarily the IPCC’s conservative estimates of the carbon content of forest ecosystems or country specific targets plus conservative assumptions about the CO2 price per tonne for paying for emissions reductions.
Unknown
Example program or project
Fast tracking the Amerindian Land Titling process. The Project seeks to a) issue titles for all Amerindian villages that submit requests, b) strengthen existing mechanisms to deal with unresolved land issues, c) improve Ministry of Amerindian Affairs outreach
Costa Rica is the first country to be endorsed. 29.5 million tons of CO2 emissions reductions for which the Carbon Fund is expected to pay US$63 million (based on a price of US$5 per ton of CO2).
Pilot project in Central Kalimantan province.
Supporting the state of Amapá to increase technical knowledge on production /extraction of açaí berries, wood and Brazil nuts, improve land-use planning and develop instruments for REDD+ implementation
REM has already agreed to spend around €19 million buying 8 million tCO2 from REDD+ activities in the State of Acre over a four year period.
The Oromia REDD+ Program in Ethiopia will promote cross-sectoral investments in the area of forests, agriculture, livestock and biomass energy.
Reported lessons and challenges
Some performance indicators considered vague and insufficiently defined. Early concern that scope was “outside the forest” –e.g. in creating low carbon jobs in urban centres. The Guyanese Government has reported slow payments and severe budgetary cuts applied by the Parliamentary Opposition (which cut GRIF project budget by 95% in 2013) which is impacting progress.
The carbon price for emissions reductions is not fixed and eventual pricing will take into consideration other factors.
Some performance indicators are too vague and have led to negotiations on the exact meaning e.g. what are ‘natural forests’ in the context of Indonesia’s moratorium.
Initial reference level based on deforestation rate for 1996-2005. Brazil should have been paid US$2 billion per year for the five year period (2009-13) equivalent to10 times the promised amount. Amazon Fund has therefore been criticised for not being able to financially pay based on actual emissions reduced.
Unknown Unknown
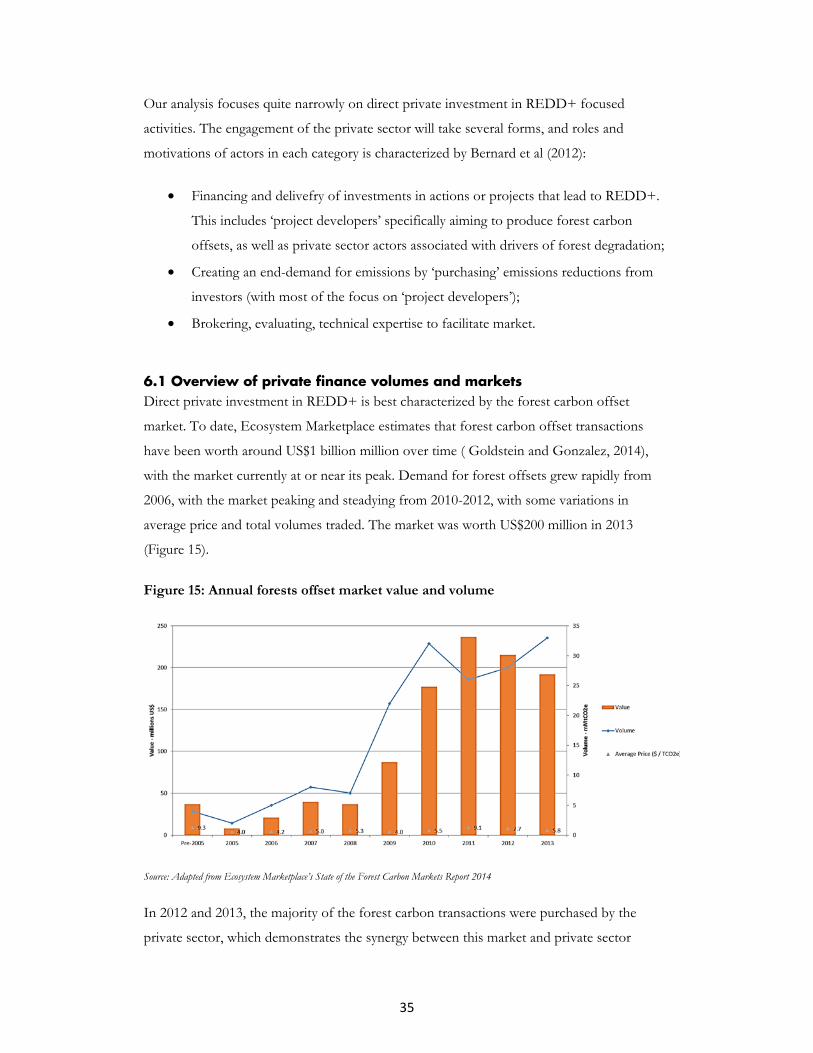
35
Our analysis focuses quite narrowly on direct private investment in REDD+ focused
activities. The engagement of the private sector will take several forms, and roles and
motivations of actors in each category is characterized by Bernard et al (2012):
• Financing and delivefry of investments in actions or projects that lead to REDD+.
This includes ‘project developers’ specifically aiming to produce forest carbon
offsets, as well as private sector actors associated with drivers of forest degradation;
• Creating an end-demand for emissions by ‘purchasing’ emissions reductions from
investors (with most of the focus on ‘project developers’);
• Brokering, evaluating, technical expertise to facilitate market.
6.1 Overview of private finance volumes and markets Direct private investment in REDD+ is best characterized by the forest carbon offset
market. To date, Ecosystem Marketplace estimates that forest carbon offset transactions
have been worth around US$1 billion million over time ( Goldstein and Gonzalez, 2014),
with the market currently at or near its peak. Demand for forest offsets grew rapidly from
2006, with the market peaking and steadying from 2010-2012, with some variations in
average price and total volumes traded. The market was worth US$200 million in 2013
(Figure 15).
Figure 15: Annual forests offset market value and volume
Source: Adapted from Ecosystem Marketplace’s State of the Forest Carbon Markets Report 2014
In 2012 and 2013, the majority of the forest carbon transactions were purchased by the
private sector, which demonstrates the synergy between this market and private sector

36
investment in REDD+. The majority of buyers (54%) were multinational companies
(Goldstein and Gonzalez, 2014; see Figure 16). The public sector was responsible for 2%,
although this dropped from 17% in 2011 as a result of the end of the Kyoto compliance
period.
Figure 16: Forest carbon offset buyer type (% share)
Source: Adapted from Ecosystem Marketplace’s State of the Forest Carbon Markets Report 2014
6.2 Drivers of demand and investment While there has been active private sector engagement in recent years as demonstrated
above, the current low price of carbon and the broader uncertainty surrounding carbon
markets has impacted the overall level of private sector investment in REDD+, which
remains well below the level of public sector investments (Peters-Stanley et al 2013) and at
around 10% of the level which investors and project developers could provide.
Low levels of investment are explained in part by the weak status of the emissions
compliance market. Furthermore, few existing compliance markets accept forest and
REDD+ emissions reductions. Forest conservation is currently excluded from the CDM,
and offset credits from forestry and land-use change are excluded from the EU ETS,
because of concerns over permanence, leakage, establishing baselines and accuracy of MRV
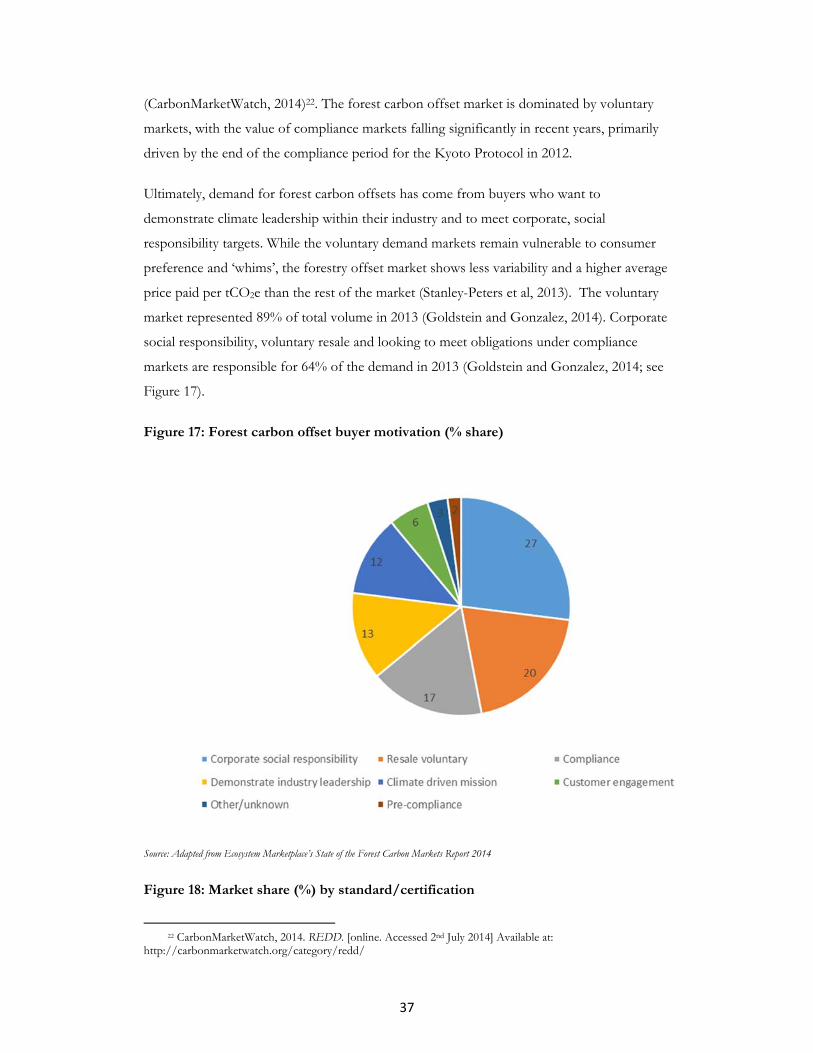
37
(CarbonMarketWatch, 2014)22. The forest carbon offset market is dominated by voluntary
markets, with the value of compliance markets falling significantly in recent years, primarily
driven by the end of the compliance period for the Kyoto Protocol in 2012.
Ultimately, demand for forest carbon offsets has come from buyers who want to
demonstrate climate leadership within their industry and to meet corporate, social
responsibility targets. While the voluntary demand markets remain vulnerable to consumer
preference and ‘whims’, the forestry offset market shows less variability and a higher average
price paid per tCO2e than the rest of the market (Stanley-Peters et al, 2013). The voluntary
market represented 89% of total volume in 2013 (Goldstein and Gonzalez, 2014). Corporate
social responsibility, voluntary resale and looking to meet obligations under compliance
markets are responsible for 64% of the demand in 2013 (Goldstein and Gonzalez, 2014; see
Figure 17).
Figure 17: Forest carbon offset buyer motivation (% share)
Source: Adapted from Ecosystem Marketplace’s State of the Forest Carbon Markets Report 2014
Figure 18: Market share (%) by standard/certification
22 CarbonMarketWatch, 2014. REDD. [online. Accessed 2nd July 2014] Available at:
http://carbonmarketwatch.org/category/redd/

38
Source: Adapted from Ecosystem Marketplace’s State of the Forest Carbon Markets Report 2014
Buyers from 23 different country locations transacted forest carbon offsets in 2013. 98%
were sold to buyers based in developed regions, with no buyers in Asia or Africa. EU-based
buyers have been predominantly the largest source of demand for forestry offsets. In 2013,
Europe based buyers purchased more than two-thirds of all offsets. North America
accounted for a fifth of the forestry offsets sold in 2013 with pre-compliance in the
Californian trading scheme a key motivation.
Available data on private investment in REDD+ is dominated by a few large-scale projects.
Using the VCS’s project-level data (VCS, 2014) it can be identified that 76% of the total
estimated annual reductions are generated by just ten projects (out of 89) over 1 million
tonnes per year. The projects are well distributed globally. Some countries have a few very
large projects (Zimbabwe, DRC, Indonesia), while others have multiple smaller ones (Peru,
Brazil, Kenya) but similar levels of total emissions reductions. The top 8 countries account
for 93% of the total activity and have an order of magnitude, if not more, greater levels of
activity than the other countries.

39
Figure 19: Estimated annual emissions reductions (VCS standards) from Agriculture,
forestry and land-use
Source: Adapted from VCS 2014.
Microsoft and Disney investing in REDD+
Over 67% of the forest carbon offsets were purchased by multinational companies in 2012. Some notable examples include:
Microsoft has been investing in offsets in Brazil, Kenya and Cambodia, as part of its overarching carbon neutral scheme. It has spent over $4 million to date on forest carbon offsets.
Walt Disney has invested in one similar project in the Peruvian Amazon, to specifically help offset emissions from its resorts and cruises. Disney bought $3.5 million worth of credits at $8 each – higher than their value on the international markets.
These examples show how corporate responsibility is helping to provide private demand for forestry offsets flowing, but even huge global companies such as Microsoft do not provide finance in the order of magnitude required for REDD+ without a greater legislative need.
Source: Dewan, 2014
Significant additional investments have also been made beyond that reflected in the forest
carbon offset market. For example, developers reported that they were unable to find a
buyer for 30 MtCO2e in 2012 – worth an additional US$236 million at the same prices. With
40
a five-year pipeline of US$10.7 billion, there is space within the industry to increase
investment and meet a ten-fold increase in market size if the demand emerges (Peters-
Stanley et al, 2013).
Challenges of data availability
Private sector engagement around REDD+ and the drivers of deforestation has been difficult to track and transparency around investments is often poor. This partly results from the fact that there is ‘huge diversity amongst private sector actors’ which makes it difficult to make generalizations and to ‘conceptualize the private sector as a whole’ (Henderson et al, 2012). At a project level, the Voluntary Carbon Standard’s database remains the best source of accessible data, and this covers of 57% of the forest carbon offset market as seen in Figure 19. The Ecosystem Marketplaces / Forest Trends methodology demonstrates many of the key issues. As the data is generated from a survey of actors involved in the market, protecting confidentiality of the responses is key (Peters-Stanley et al 2013). Therefore their reports only present aggregate data. As a result detailed price and location data is unavailable, but more importantly, as are details about each investor and buyer of offsets to greater unpick motivations and intentions.
7. Conclusion
When originally conceived, the idea of large scale finance to reward efforts to reduce
emissions from forests soared to global prominence. Part of its appeal was the potential of
REDD+ to advance progress on multiple counts including biodiversity conservation,
poverty reduction and development, as well as climate change. The potential to attract
private investment, including through links to carbon markets also increased interest. Early
enthusiasm for the concept was accompanied by substantial early pledges of finance to pilot
new approaches and to take on longstanding and difficult issues that underpin deforestation
and degradation in developing countries. These underpinning issues include economic
incentives that create pressures on forests, and institutions and governance that are often
weakly positioned to intermediate between long term sustainable development objectives
and these near term pressures. Part of the challenge for REDD+ finance is therefore to
create new political and economic incentives to enable change. The scale of REDD+ finance
is therefore an important factor in its ability to command requisite political attention. In
addition, how it is spent, and the terms on which it is made available are also crucial factors.

41
Our review of REDD+ finance highlights important investments that have been - and
continue to be made - but it raises questions about the future trajectory of public support for
such programs. To date, the implementation of REDD+ programs has been relatively slow,
raising questions about whether additional finance is needed. But the relatively modest scale
of finance, and the modalities through which it has been managed, may mean that some
programs have not harnessed the requisite political support to facilitate expedient
implementation. While REDD+ has historically been seen as an investment in mitigation,
the contribution that reduced deforestation makes to increasing the resilience of forest
ecosystems and the people who depend on them has also received growing recognition.
Important experimentation is now underway to pilot performance-based approaches to
financing REDD+. These initiatives have substantial diversity in terms of the amount of
finance that is on offer, the scale or jurisdiction at which they seek to intervene, and the
“performance” to which payment is linked. Important learning about the practical mechanics
of such programs is beginning to emerge, but the evidence on whether such approaches will
succeed in shifting incentives, and empowering constituents for change remains to be seen.
This reflects in part, a wider sense of uncertainty about future trajectories for climate finance
more generally. An overarching context of difficult financial circumstances in developed
countries, triggering policies of austerity and reduced political appetite for international
spending is a compounding factor. While overall REDD+ has played a relatively small
(though important) role in recent efforts to deliver on international climate finance
commitments, recent initiatives including Norway’s bilateral support to Peru and Liberia and
additional support to the REDD+ Early Movers Program in Colombia and Ecuador
highlights continued interest in funding demonstrated results-based reductions in
deforestation. In addition, the recently mobilised Green Climate Fund (GCF) looks set to
focus efforts at least in part on scaling up financing for forests which has been identified as
one of five potential investment priorities. The impact assessment identifies the potential for
an emphasis on results-based finance for implementation of REDD+ strategies in a few
jurisdictions showing momentum and clear potential for mitigation, alongside ecosystem
services, livelihood results and other co-benefits (GCF, 2015). A results framework to track
and incentivize investments in REDD+ that is consistent with the Warsaw decisions on a
REDD+ instrument has been established. In addition, efforts are underway to help
countries prepare to make effective use of the GCF through a readiness program that will
build on ongoing efforts to reduce emissions from deforestation and degradation.
Nevertheless, there are important questions that remain to be answered about the level of

42
public finance that developed countries will commit in the context of efforts to secure
ambitious action on climate change through a new global agreement in 2015. In this context,
the potential for investments that deliver paradigm shifting sustainable development benefits
by addressing the links between forests and climate change will need continued attention.
43
8. References
African Development Bank. Congo Basin Fund 2012 Annual Report. Tunis: African Development Bank, 2013.
Angelsen, A. ed. Moving Ahead with REDD: Issues, Options, and Implications. Bogor: CIFOR, 2008.
Angelsen, A. REDD+ as performance based aid; general lessons and bilateral agreements of Norway. Helsinki: UNU-WIDER, 2013.
Angelsen, A., Brown, S., Loisel,C., Peskett, L., Streck, C., Zarin, D. ‘Reducing emissions from deforestation and forest degradation: An options assessment report’. Prepared for the Government of Norway. Washington, DC: Meridian Institute, 2009. Available at: http://www.REDD- OAR.org.
Asare, R., Yelibora, M., Adjei, R., and Manan, H. Ghana: Mapping REDD+ financial flows 2009-2012. Nature Conservation Research Centre and Forestry Commission of Ghana. Accra: 2013
Bernard, F., McFatridge, S. and Minang, P. The private sector in the REDD+ supply chain: trends, challenges and opportunities. ASB policy brief. Geneva: IISD, 2012.
BioCarbon Fund: Initiative for Sustainable Forest Landscapes brief accessed June 23 2014 http://biocarbonfund-isfl.org/sites/biocf/files/documents/Bio%20CF%20ISFL%20Flyer%20version%208.pdf
Birdsall, N. and Busch, J. Assessing Performance-Based Payments for Forest Conservation: Six Successes, Four Worries, and Six Possibilities to Explore of the Guyana-Norway Agreement. Washington, DC: Center for Global Development, 2014.
Birdsall, N. and Busch, J. Assessing Performance-Based Payments for Forest Conservation: Six Successes, Four Worries, and Six Possibilities to Explore of the Guyana-Norway Agreement: CGD, 2014.
Birdsall, N. and Savedoff, D. Cash on Delivery: A New Approach to Foreign Aid with an Application to Primary Schooling. Washington, DC: Center for Global Development, 2010.
BMZ. REDD Early Movers (REM) – Rewarding pioneers in forest conservation, financial rewards for successful climate change mitigation. Bonn: BMZ Division for the Environment and Sustainable Use of Natural Resources, 2012.
Caldecott, J., Indrawan, M., Rinne, P. and Halonen, M. Indonesia-Norway REDD+ Partnership: first evaluation of deliverables. Helsinki: Gaia Consulting Ltd, 2011.
Canby, K,. Silva-Chavez, G., Breitfeller, J., Lanser, C., Norman, M., and Schaap, B. Tracking REDD+ Finance: 2009-2012-Finance Flows in Seven REDD+ Countries. Washington DC: Forest Trends 2014.
Dewan, A. " Microsoft, Disney invest millions in forest carbon market”, accessed June 23 2014 http://www.forestsclimatechange.org/forests-climate-change-mitigation/microsoft-disney-invest-millions-forest-carbon-market/
Diaz, D. Hamilton, K. and Johnson, E. The State of the Forest Carbon Markets. Washington DC: Ecosystem Marketplace, 2011.
Eicher, R. and Levine, R. Performance Incentives for Global Health. Potential and Pitfalls. Washington DC: Center for Global Development, 2009.
Eliasch, J. Climate Change: Financing Global Forests. London: Office of Climate Change, 2012. financing (RBF) schemes: final report. London: DFID Human Development Resource Centre,
2010. Forest Carbon Partnership Facility (FCPF) Carbon Fund Ninth Meeting (CF9). Brussels,
Belgium, April 9-11, 2014. Forest Trends REDDX accessed 24 March 2014 http://reddx.forest-trends.org/

44
Forstater, M. Nakhooda, S. and Watson, C. The effectiveness of climate finance: a review of the Amazon Fund. ODI Working Papers, 372. London: Overseas Development Institute, 2013
Forum for the Future. Forest Investment Review. Study prepared for the UK Department for International Development (DFID). London: Forum for the Future, 2009. Available at: http://www.forumforthefuture.org/project/forest-investment- review/overview
GCP, IPAM, FFI, UNEP FI and UNORCID. Stimulating interim demand for REDD+ emission reductions: the need for a strategic intervention from 2015 to 2020. Oxford: Global Canopy Programme, 2014.
Global Witness. Securing REDD+ Finance: Ensuring Transparent and Accountable Financial Flows. Oxford: Global Witness, 2012.
Goldstein, A., and Gonzales, G. Turning over a New Leaf: State of the Voluntary Carbon Markets 2014. Washington DC: Ecosystem Marketplace 2014.
Green Climate Fund. Analysis of the Expected Role and Impact of the Green Climate Fund. Songdo, Korea, March 24-26, 2015. http://www.gcfund.org/fileadmin/00_customer/documents/MOB201503-9th/06_-_Analysis_of_the_Expected_Role_and_Impact_of_the_Green_Climate_Fund_20150228_fin.pdf
Grieg-Gran, M. ‘The Cost of Avoiding Deforestation: Update of the Report Prepared for the Stern Review of the Economics of Climate Change’. London: IIED, 2008.
Grüning, C and Shuford, L. National Climate Finance Institutions Support Programme Case Study: Guyana REDD-PLUS Investment Fund (GRIF). Frankfurt: Frankfurt School UNEP Collaborating Centre for Climate and Sustainable Energy Finance, 2012.
Hamilton, K., Peters-Stanley, M. and Marcello, T. Building Bridges: State of the Voluntary Carbon Markets 2010. Washington DC: Ecosystem Marketplace & Bloomberg New Energy Finance, 2010.
Hansen, MC. et al. High-Resolution Global Maps of 21st-Century Forest Cover Change. Science 342 (2013): 850.
Henderson, I., Coello, J., Fischer, R., Mulder, I. & Christophersen, T. 2012. The role of the private sector in REDD+: the case for engagement and options for intervention. UN-REDD programme: http://www.un-redd.org/privatesectorpolicybrieflaunched/tabid/106428/default.aspx
Hoare, A., Legge, T., Nussbaum, R., and Saunders, J. Estimating the Cost of Building Capacity in Rainforest Nations To Allow Them To Participate in a Global REDD Mechanism. London: Chatham House, 2008.
Informal Working Group on Interim Finance for REDD. Report of the informal working group on interim finance for REDD+ (IWG-IFR). London: UNFCCC, 2009.
Kenny, C and Savedoff, W. Can Results-Based Payments Reduce Corruption? Working Paper 345. Washington DC: Center for Global Development, 2013.
Kindermann, G., M. Obersteiner, B. Sohngen, J. Sathaye, K. Andrasko, E. Rametsteiner, et al.. ‘Global Cost Estimates of Reducing Carbon Emissions through Avoided Deforestation’. PNAS, 105(30) (2008): 10302–307.
Kissinger, G., Herold, M. and De Sy. V. Drivers of Deforestation and Forest Degradation: A Synthesis Report for REDD+ Policymakers. Vancouver: Lexeme Consulting, 2012.
Korhonen, K., M. Brockhaus, A. E. Duchelle, S. Atmadja, and P. T. Thuy. ‘Multiple Levels and Multiple Challenges for REDD+’. In Analysing REDD+: Challenges and Choices, edited by A. Angelsen. Bogor: CIFOR, 2012.
Kuramochi, T., Shimizu, N., Nakhooda, S. and Fransen, T. The Japanese Fast- Start Finance Contribution. Working Paper. London: World Resources Institute, Washington DC, and Overseas Development Institute, 2012. Available at: http://www.wri.org/publication/ocn-jp-fast-start-finance.

45
Larson, M. and Petkova, E. An Introduction to Forest Governance, People and REDD+ in Latin America: Obstacles and Opportunities in Forests 2 (2011): 86-111.
Morris, D. and Stevenson, A. REDD+ and International Climate Finance: A Brief Primer. Issue Brief 11-13. Washington DC: Resources of the Future, 2011.
Müller, B., Fankhauser, S Forstater, M. Quantity Performance Payment by Results Operationalizing enhanced direct access for mitigation at the Green Climate Fund. Oxford: Oxford Institute for Energy Studies, 2013.
Muñoz Piña, C., and Ortega Flores, J. MÉXICO: Seguimiento del Financiamiento para REDD+ 2009-2012. Mexico City: 2013.
Nakhooda, S. Fransen, T., Kuramochi,T. Caravani, A., Prizzon, A., Shimizu, N., Tilley,H., Halimanjaya,A., and Welham, B. Mobilising International Climate Finance: Lessons from the Fast-Start Finance Period. London: Overseas Development Institute, 2013.
ODI and HBF Climate Funds Update, accessed 31 March 2014 http://www.climatefundsupdate.org/data
Pagiola, S., and Bosquet, B. Forest Carbon Partnership Facility: Estimating the Costs of REDD at the Country Level. Washington, DC: World Bank, 2009.
Pearson, M., Johnson, M., and Ellison, R. Review of major results-based aid (RBA) and results-based Peters-Stanley, M., Gonzalez, G., and Yin, D. ‘Covering New Ground: The State of the Forest
Carbon Markets. Washington DC: Ecosystem Marketplace, 2013. PricewaterhouseCoopers. Funding for Forests: UK Government support for REDD+.
London: 2011. Sánchez,M. 2010. REDD+ Progress made Monitoring and reporting aspects. Available:
http://www.conafor.gob.mx:8080/documentos/docs/7/561Maria%20Saenz%20Sanchez%20-%20MRV%20WS%20Jalisco%20Mexico%20UNFCCC.pdf
Savedoff, W. Incentive Proliferation? Making Sense of a New Wave of Development Programmes. Washington DC: Center for Global Development, 2011.
Stern, N. Stern Review on the Economics of Climate Change. Cambridge: Cambridge University Press, 2007.
Streck, C and Constenbader, J. Standards for results-based REDD+ Finance: Overview and Design Parameters. Washington DC: Climate Focus, 2012.
Streck, C., and C. Parker. Financing REDD+. Pages 111-128 in A. Angelsen, M. Brockhaus, W. D. Sunderlin, and L. V. Verchot, editors. Analysing REDD+: challenges and choices. Indonesia: Center for International Forestry Research, 2012.
Streck, C., Estrada Porrua, M., Bracer, C., Coren, M. Options for Managing Financial Flows from REDD+. Amsterdam: Climate Focus, 2010.
Tennigkeit, T., Held, C., Carodenuto, S., and Merger, E. Financing REDD+ through private forestry sector - How to attract REDD+ related private investments. Freiburg: Unique Forestry and Land use, 2013.
The Prince's Rainforests Project. (2011). Two Years On: Is interim REDD+ finance being delivered as needed? <www.pcfisu.org/wp-content/uploads/2011/11/Two-years-on_Is-interim-REDD+- Finance-being-delivered-as-needed.pdf>
The Secretariat of the Convention on Biological Diversity. REDD+ and Biodiversity. CBD Technical Series 59. Montreal: The Secretariat of the Convention on Biological Diversity, 2011.
UK Department of Energy and Climate Change. An International Climate Fund business case for DECC investment in the BioCarbon Fund and the Forest Carbon Partnership Facility-Carbon Fund. Department of Energy and Climate Change, 2014.
UN Food and Agriculture Organization. ‘Global Forest Resources Assessment’. FAO Forestry Paper 140. Rome: FAO, 2010.
UN Food and Agriculture Organization. Global Forest Resources. Rome: FAO, 2000. UNFCCC (United Nations Framework Convention on Climate Change). Investment and
Financial Flows to Address Climate Change. Bonn: UNFCCC, 2007.

46
UNFCCC. Copenhagen Accord. Advance unedited version. Bonn: UNFCCC, 2009. UNFCCC. Text of the United Nations Framework Convention to Combat Climate Change. Bonn:
UNFCCC, 1992. Verified Carbon Standard. ‘VCS project database’, accessed 28th May 2014
http://www.vcsprojectdatabase.org/. Voluntary REDD+ Database of the REDD+ Partnership. Accessed 24 March 2014
http://reddplusdatabase.org Watson, C. and Nakhooda, S. Financing Readiness: Insights from the Amazon Fund and Congo Basin
Forest Fund’s efforts to reduce emissions from deforestation and degradation. London: Overseas Development Institute, 2012.
Watson, C., McFarland, W., Nakhooda, S., and Caravani, A. Fast Start Funding for Forests: The Challenge of Maintaining Momentum. London: Overseas Development Institute, 2014.
Watson, C., Nakhooda, S. and Caravani, A. The practical challenges of monitoring climate finance: insights from Climate Funds Update. London: Overseas Development Institute, 2012.
World Bank Group. Modalities and procedures for financing results-based actions on REDD+. World Bank, 2012. Available at http://unfccc.int/resource/docs/2012/smsn/igo/71.pdf
World Bank Group. The FCPF Carbon Fund: Pioneering Performance-based payments for REDD+ Accessed http://www.forestcarbonpartnership.org/sites/forestcarbonpartnership.org/files/Documents/PDF/June2012/FCPF%20Brouchure_June%2013_2012.pdf :2012
Wolosin, M and Lee, D. “US Support for REDD+: Reflections on the Past and Future Outlook.” CGD Policy Paper 48. Washington DC: Center for Global Development. 2014. http://www.cgdev.org/publication/us-support-redd-reflections-past-and-future-outl
Zadek, S., M. Forstater, and F. Polocow. ‘The Amazon Fund: Radical Simplicity and Bold Ambition Insights for Building National Institutions for Low Carbon Development’. Avina Foundation, 2010.

47
Annex: Methodology
8.1 Where does the data come from? Transparency of REDD+ finance has improved in recent years, but information is not
readily or accurately available in one place. The majority of the data reported on REDD+
finance is captured by dedicated tracking initiatives. Following billions across the globe is no
easy task and tracking requires sustained and on-going efforts to source, validate, and present
information in a comparable way.
This study is a desk based research paper which focuses on updating and deepening analysis
of data collected by ODI and HBF’s Climate Funds Update to track bilateral finance
committed during the Fast Start Finance period between 2010 and 2012 and finance flowing
through dedicated multilateral funds.
This paper draws on the results from an analysis of over 23,000 individual projects or
pledges of support for REDD+ and relevant efforts to reduce emissions from deforestation
and forest degradation between 2006 and 2014. This includes assessing over 4,000 Fast Start
Finance projects collected through donor submissions to the UNFCCC, OECD reported
data and interviews with key donors countries as well as finance pledged and deposited to
multilaterals up until December 31st 2014. Additional data for REDD+ finance pledged
outside the FSF period was based on an assessment of over 19,000 projects/pledges
reported by developed funder countries to the Voluntary REDD+ Database (VRD) of the
REDD+ Partnership between 2006 and 2014.
In addition, we also use data collected by Forest Trends’ REDDX or REDD+ Expenditures
Tracking Initiative which follows public and private sector finance from high level donor
commitments all the way down to how and when funding is spent on the ground. REDDX
is currently tracking national levels of REDD+ finance in fourteen tropical forest countries,
collecting information on finances committed, disbursed as well as the recipients and
implementers in-country.
Some preliminary private sector investments have been collected from Ecosystem
Marketplace’s State of the Forest Carbon Market Report 2014, which assesses trends in the
supply and demand of carbon credits.

48
To avoid double counting across the various sources, this report has disaggregated data by
donor category and only counted from the source with the most comprehensive data.
8.2 What counts as REDD+ finance? The focus of this analysis is on the international financial flows or mechanisms originating
outside a developing country that support actions aimed at reducing emissions from
deforestation and forest degradation. Determining what actually counts as REDD+ and
forest related finance is not easy and significantly impacts global estimates of how much
finance is directed toward it.
The UNFCCC decision on REDD+ refers to ‘policy approaches and positive incentives on
issues relating to reducing emissions from deforestation and forest degradation; and the role
of conservation, sustainable management of forest and enhancement of forest carbon stocks
in developing countries’ (Bali Action Plan, para 1 (b) (iii)) which will include activities that
are country-driven, promote co-benefits and biodiversity, actions that are consistent with
conservation of natural forests, involvement of indigenous peoples and local communities as
well as transparent forest governance (Sánchez, 2010). However, donor institutions often
report funding against broad categories such as “environment” or “forests”. This can
complicate efforts to determine the actual amounts or proportion that targets REDD+ and
forest related activities, which in turn can result in the same flows being counted multiple
times.
This report therefore tracks international pledges and flows of finance linked to the
UNFCCC decisions on REDD+ as well as relevant activities that support policy approaches
and positive incentives around the three phases of REDD+. These include the following
activities in the context of reducing emissions from deforestation and forest degradation,
conservation of forest carbon stocks, the sustainable management of forests, and the
enhancement of forest carbon stocks:
• The development of national strategies or action plans, policies and measures, and capacity-building;
• The implementation of national policies and measures and national strategies or action plans that could
involve further capacity-building, technology development and transfer and results-based demonstration
activities;
• Results-based actions that should be fully measured, reported and verified.
49
8.3 When is REDD+ finance counted? Deciding when to count finance for REDD+ dramatically impacts the figures and
contributes to the broad array of reported numbers on climate finance.
This paper tracks donor pledges of financial support for REDD+ which represent verbal or
signed commitments from donors to provide financial support for a particular fund. All
pledges are cumulative unless the data is specifically broken down to show annual changes in
finance pledged. This study also reports on private sector investments in REDD+, focuses
quite narrowly on direct private investment in REDD+ focused activities.
Deposits represent the funds that have been transferred from the donor into the account(s)
of the fund. Also known as committed funds. All deposits are cumulative unless otherwise
specified.
Commitments where referenced in relation to dedicated multilateral funds refer to funding
that has been set aside or announced as being set aside for a country but has not been
formally approved for a specific project or program. This would include for example the
FCPF Carbon Fund announcing a US$63 million commitment to purchase verified
emissions reductions from Costa Rica.
Approvals or approved finance represents funds that have been officially approved and
earmarked to a specific project or program. All approvals on figures are cumulative.
Disbursements represent funds that have been released to a recipient’s bank account,
recording the actual transfer of finances, services or materials. In cases where in-kind or
technical assistance has been provided, such as trainings, workshops, administration capacity
building or provision of technology or infrastructure, disbursements are tracked when the
funds have been transferred to the service provider or the recipient.
The apparent progression of finance through each finance status is affected by the
availability of information from funds and initiatives. Disbursals that appear as zero or low
as compared to approvals could result from slow contributor disbursal or slow recipient
uptake, but may also reflect a paucity of information on the status of finance after approval.
This is true for some of the bilateral initiatives tracked. Slow disbursements are also a result,
in part, of a move towards performance-based payments where a significant proportion of
committed funding would be disbursed towards the end of a project or program of activities.