THE ROLE OF WINE TOURISM IN THE MARKETING OF...
283
THE ROLE OF WINE TOURISM IN THE MARKETING OF WINERIES IN THE STELLENBOSCH WINE ROUTE OF SOUTH AFRICA by ADRI KIRKMAN submitted in accordance with the requirements for the degree of MASTER OF COMMERCE in the subject of BUSINESS MANAGEMENT at the UNIVERSITY OF SOUTH AFRICA Supervisor: Prof JW Strydom Co-supervisor: Prof C van Zyl November 2010
Transcript of THE ROLE OF WINE TOURISM IN THE MARKETING OF...
i
THE ROLE OF WINE TOURISM IN THE MARKETING OF WINERIES
IN THE STELLENBOSCH WINE ROUTE OF SOUTH AFRICA
by
ADRI KIRKMAN
submitted in accordance with the requirements
for the degree of
MASTER OF COMMERCE
in the subject of
BUSINESS MANAGEMENT
at the
UNIVERSITY OF SOUTH AFRICA
Supervisor: Prof JW Strydom
Co-supervisor: Prof C van Zyl
November 2010
i
DECLARATION
I declare that The role of wine tourism in the marketing of wineries in the Stellenbosch Wine Route of South Africa is my own work and that all the sources that I
have used or quoted have been indicated and acknowledged by means of complete
references.
___________________ _____________
Mrs Adri Kirkman Date
i
ACKNOWLEDGEMENTS
All honour and glory and praise to my Lord and Saviour.
It is a pleasure to thank those who have made the completion of this dissertation possible.
I am deeply grateful for the guidance and encouragement of my two supervisors,
Prof JW Strydom and Prof C Van Zyl. Thank you for your patience and willingness to
invest your time, energy and expertise in me.
I would like to thank Mr A Morgenthal, Mr S Back, Mrs S Marx and Mr P Benade for
providing me with invaluable insight into the industry.
A heartfelt thank you to Dr Pohl for assisting me with the statistics, without you I would still
be staring at the datasheet!
Thank you to Mrs Koekemoer of the Bureau of Market Research for assisting me with the
creation of the electronic questionnaire.
Mrs Joubert, thank you for editing my dissertation.
A special thank you to my colleagues, Dorothy, Jenny, Nadine, Nicolene, Ursula and
Tracey, for listening, encouraging and advising. Your support has been amazing!
I would like to honour my parents and parents-in-law. Thank you for believing in me,
praying continuously and laughing when I become too serious about life.
To the love of my life, Duncan, thank you for your unwavering support, encouragement
and love. I love you forever.
ii
ABSTRACT
Commercial reality demands that the South African wine industry convert from its current
production orientation to a marketing orientation, by drawing on all new and existing
marketing channels in order to ensure its continued success. International research has
shown that wine tourism can add value to and benefit a winery as a direct marketing
channel. This study investigated the role that wine tourism currently plays within the
marketing strategies of wineries in the Stellenbosch Wine Route of South Africa. Findings
of the exploratory research indicated that many wineries do not comprehend the positive
influence of wine tourism and view it as a secondary marketing activity. It is concluded
that South African wine marketers could profit from utilising wine tourism as an integral
part of their marketing strategy in order to maintain and increase their share of the
alcoholic beverage market.
Key terms
wine industry; wine tourism; marketing; branding; South Africa; Stellenbosch Wine Route;
wineries

iii
LIST OF ABBREVIATIONS
BEE Black economic empowerment
BWI Biodiversity Wine Initiative
FTSA Fairtrade South Africa
GDP Gross domestic product
IPW Integrated Production of Wine Scheme
IWSR International Wine and Spirit Record
KWV Koöperatiewe Wijnbouwers Vereniging van Zuid-Afrika
MIS Marketing information system
PESTE Political, economic, social, technological and environmental (factors)
PET Plastic polyethylene terephthalate
SAWIS South African Wine Industry Information and Services
SAWIT South African Wine Industry Trust
SIT Special interest tourism
SWOT Strengths weaknesses opportunities and threats (analysis)
VFR Visiting friends and relatives
WIDA Wine Industry Development Association
WOSA Wines of South Africa
WTO World Tourism Organisation
WTTC World Travel and Tourism Council
i
TABLE OF CONTENTS
DECLARATION
ACKNOWLEDGEMENTS
ABSTRACT
LIST OF ABBREVIATIONS
CHAPTER 1: BACKGROUND AND PROBLEM STATEMENT 1
1.1 INTRODUCTION 1
1.2 BACKGROUND INFORMATION ON THE RESEARCH PROBLEM 1
1.3 PROBLEM STATEMENT 4
1.4 OBJECTIVES 7
1.4.1 PRIMARY OBJECTIVE 8
1.4.2 SECONDARY OBJECTIVES 8
1.5 RESEARCH METHODOLOGY 8
1.5.1 STAGE 1: SECONDARY RESEARCH 8
1.5.2 STAGE 2: PRIMARY RESEARCH 9
1.5.3 DATA PROCESSING AND ANALYSIS 10
1.5.3.1 Data preparation 10
1.5.3.2 Statistical analysis 10
1.5.3.3 Reliability and validity 11
1.6 LAYOUT OF THE CHAPTERS 12
ii
CHAPTER 2: WINE AND WINE TOURISM IN SOUTH AFRICA 14
2.1 INTRODUCTION 14
2.2 THE SOUTH AFRICAN WINE INDUSTRY 15
2.2.1 THE HISTORY OF THE SOUTH AFRICAN WINE INDUSTRY 16
2.2.2 SOUTH AFRICA’s WINELANDS 20
2.2.3 THE SOUTH AFRICAN WINE INDUSTRY BUSINESS ENVIRONMENT 23
2.2.3.1 The macro-environment of the South African wine industry 23
2.2.3.2 The micro-environment of the South African wine industry 31
2.2.3.3 SWOT analysis of the South African wine industry 36
2.3 THE SOUTH AFRICAN WINE TOURISM INDUSTRY 38
2.3.1 DEVELOPMENT OF THE SOUTH AFRICA WINE TOURISM INDUSTRY 38
2.3.2 WINE TOURISM IN CONTEXT 40
2.3.3 WINE TOURISM SYSTEM 45
2.3.4 PROFILE AND MOTIVATIONS OF SOUTH AFRICAN WINE TOURISTS 48
2.3.5 WINE TOURISM PRODUCT CHARACTERISTICS AND BENEFITS 52
2.4 CONCLUSION 54
CHAPTER 3: MARKETING: THE THEORETICAL UNDERPINNINGS 55
3.1 INTRODUCTION 55
3.2 THE MARKETING PROCESS 56
3.3 THE MARKETING MIX OF THE WINE INDUSTRY 58
3.3.1 PRODUCT OF THE WINE INDUSTRY 59
3.3.1.1 Branding of wines 62
3.3.1.2 Packaging of wines 68
3.3.1.3 Labelling of wines 69
iii
3.3.2 PRICING IN THE WINE INDUSTRY 70
3.3.3 PLACE IN THE WINE INDUSTRY 71
3.3.4 PROMOTION IN THE WINE INDUSTRY 75
3.3.4.1 Advertising of wine product 76
3.3.4.2 Personal selling of wine products 77
3.3.4.3 Sales promotion of wine products 77
3.3.4.4 Public relations of wineries 78
3.3.4.5 Direct marketing of wine products 78
3.4 CONCLUSION 79
CHAPTER 4: RESEARCH METHODOLOGY 80
4.1 INTRODUCTION 80
4.2 THE STUDY SITE 81
4.3.1 DEGREE TO WHICH THE RESEARCH QUESTION HAS BEEN
CRYSTALLISED 84
4.3.3 RESEARCHER CONTROL OF VARIABLES 85
4.3.4 PURPOSE OF THE STUDY 85
4.3.5 THE TIME DIMENSION 85
4.3.6 THE TOPICAL SCOPE 86
4.3.7 THE RESEARCH ENVIRONMENT 86
4.3.8 PARTICIPANTS’ PERCEPTUAL AWARENESS 86
4.4 THE SAMPLE PLAN 87
4.4.1 SURVEY POPULATION 87
4.4.2 SURVEY SAMPLE 87
4.4.3 SURVEY COLLECTION METHOD 88
iv
4.5 DESIGN OF THE RESEARCH INSTRUMENT 88
4.5.1 QUESTION GENERATION 88
4.5.2 CONSTRUCTION OF THE QUESTIONNAIRE 90
4.5.3 PILOT TESTING OF QUESTIONNAIRE 93
4.6 DATA COLLECTION 94
4.7 DATA PROCESSING 96
4.7.1 DATA CAPTURING 96
4.7.2 DATA CODING 96
4.7.3 DATA EDITING 96
4.8 DATA ANALYSIS 97
4.8.1 DESCRIPTIVE STATISTICS 97
4.8.2 INFERENTIAL STATISTICS 98
4.8.3 RELIABILITY AND VALIDITY 100
4.9 PRESENTATION OF DATA FINDINGS 101
4.10 LIMITATIONS OF THE STUDY 101
4.11 CONCLUSION 102
CHAPTER 5: DATA ANALYSIS OF WINERIES IN THE STELLENBOSCH
WINE ROUTE 103
5.1 INTRODUCTION 103
5.2 DESCRIPTIVE ANALYSES OF THE RESEARCH FINDINGS 103
5.2.1 SECTION A: The corpographic profile and products and services 104
5.2.2 SECTION B: Visitor profile 112
5.2.3 SECTION C: Advantages and disadvantages of wine tourism 118
5.2.4 SECTION D: Wine tourism and the promotion of winery products 122
v
5.2.5 SECTION E: Wine tourism and brand equity 136
5.3 HYPOTHESIS TESTING 139
5.3.1 TESTING OF HYPOTHESES 1 to 5 (BINOMIAL TEST) 139
5.3.1.1 Hypothesis 1 139
5.3.1.2 Hypothesis 2 141
5.3.1.3 Hypothesis 3 143
5.3.1.4 Hypothesis 4 144
5.3.1.5 Hypothesis 5 146
5.3.2 TESTING OF HYPOTHESES 6 to 10 (MANN-WHITNEY U TEST) 148
5.3.2.1 Hypothesis 6 148
5.3.2.2 Hypothesis 7 150
5.3.2.3 Hypothesis 8 150
5.3.2.4 Hypothesis 9 151
5.3.2.5 Hypothesis 10 152
5.3.3 TESTING OF HYPOTHESES 11 TO 15 (KRUSKAL-WALLIS TEST) 153
5.3.3.1 Hypothesis 11 153
5.3.3.2 Hypothesis 12 155
5.3.3.3 Hypothesis 13 156
5.3.3.4 Hypothesis 14 157
5.3.3.5 Hypothesis 15 158
5.7 CONCLUSION 158
vi
CHAPTER 6: CONCLUSIONS AND RECOMMENDATIONS 159
6.1 INTRODUCTION 159
6.2 OVERVIEW OF THE STUDY PROCESS 159
6.3 LIMITATIONS OF THE STUDY 160
6.4 CONCLUSIONS OF THE DATA ANALYSES 161
6.5 RECOMMENDATIONS FOR SOUTH AFRICAN WINERIES 166
6.6 AREAS FOR FUTURE RESEARCH 168
6.7. CONCLUSION 169
REFERENCES 171
ANNEXURE A 201
ANNEXURE B 203
ANNEXURE C 205
ANNEXURE D 215
vii
LIST OF FIGURES
Figure 1.1: Porter’s value chain 5
Figure 1.2: Winery value chain 6
Figure 1.3: Layout of the chapters 12
Figure 2.1: Structure of Chapter 2 15
Figure 2.2: Map of the major New World wine countries 16
Figure 2.3: Timeline of the wine industry of South Africa 17
Figure 2.4: Map of South Africa’s wine regions 22
Figure 2.5: Marketing environment of a winery 23
Figure 2.6: Porter’s five forces model 32
Figure 2.7: Distribution channels of wineries 36
Figure 2.8: Tourism management mode 41
Figure 2.9: Primary travel motivations 41
Figure 2.10: Specific travel motivations 42
Figure 2.11: Types of special interest tourism 43
Figure 2.12: The wine tourism system 46
Figure 3.1: Structure of Chapter 3 55
Figure 3.2: The marketing process 57
Figure 3.3: The marketing mix 59
Figure 3.4: Three levels of the wine product 60
Figure 3.5: Model of brand equity for the wine industry 65
Figure 3.6: Consumer distribution channels 72
Figure 3.7: Wine business supply chain 73
Figure 3.8: Promotion mix 76
viii
Figure 4.1: Structure of Chapter 4 81
Figure 4.2: The Stellenbosch Wine Route 82
Figure 4.3: Typology of research design types 83
Figure 5.1: Distribution of responses across the sub-routes (n=46) 105
Figure 5.2: Distribution of respondents’ winery size (n=46) 106
Figure 5.3: Ownership status of wineries (n=43) 107
Figure 5.4: Tasting fee types (n=46) 108
Figure 5.5: Products and services offered by wineries in South Africa (n=45) 111
Figure 5.6: Systematic visitor count (n=46) 112
Figure 5.7: Visitor age profile 115
Figure 5.8: Types of promotional activities of wineries in South Africa (n=46) 123
Figure 5.9: Marketing spend (n=40) 127
Figure 5.10: Marketing spend – domestic vs international marketing (n=43) 128
Figure 5.11: Wine sales – domestic vs international sales (n=40) 129
ix
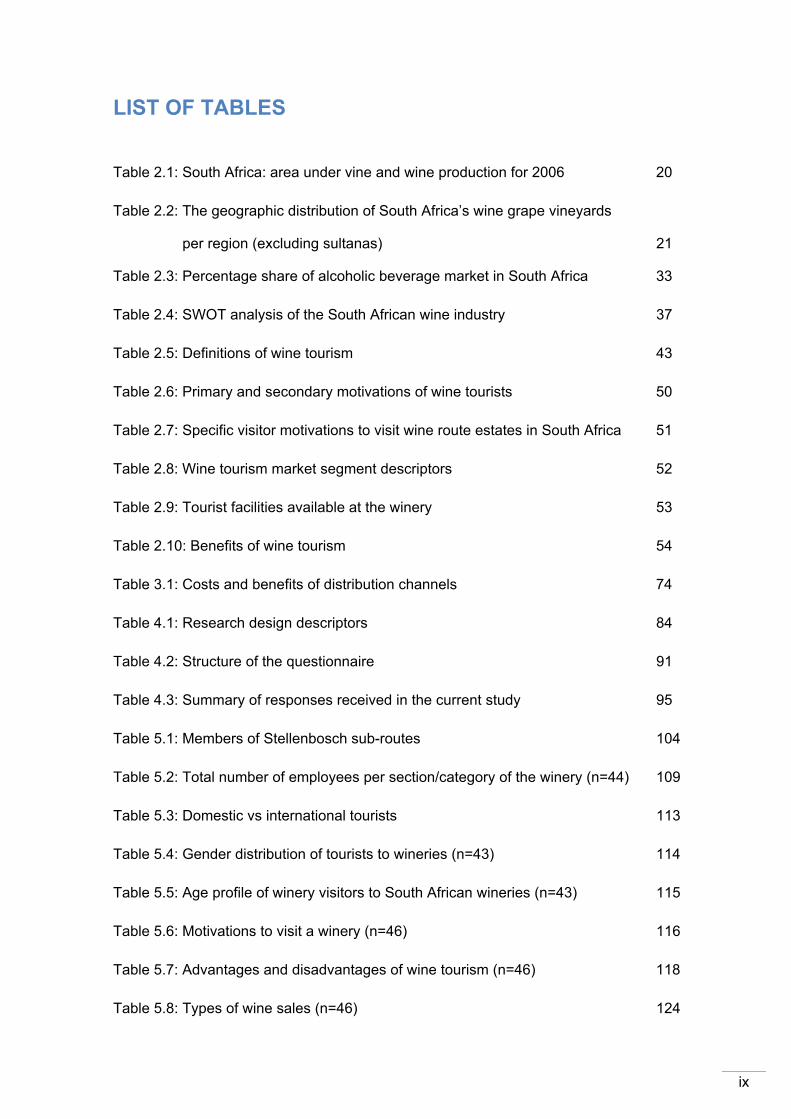
LIST OF TABLES
Table 2.1: South Africa: area under vine and wine production for 2006 20
Table 2.2: The geographic distribution of South Africa’s wine grape vineyards
per region (excluding sultanas) 21
Table 2.3: Percentage share of alcoholic beverage market in South Africa 33
Table 2.4: SWOT analysis of the South African wine industry 37
Table 2.5: Definitions of wine tourism 43
Table 2.6: Primary and secondary motivations of wine tourists 50
Table 2.7: Specific visitor motivations to visit wine route estates in South Africa 51
Table 2.8: Wine tourism market segment descriptors 52
Table 2.9: Tourist facilities available at the winery 53
Table 2.10: Benefits of wine tourism 54
Table 3.1: Costs and benefits of distribution channels 74
Table 4.1: Research design descriptors 84
Table 4.2: Structure of the questionnaire 91
Table 4.3: Summary of responses received in the current study 95
Table 5.1: Members of Stellenbosch sub-routes 104
Table 5.2: Total number of employees per section/category of the winery (n=44) 109
Table 5.3: Domestic vs international tourists 113
Table 5.4: Gender distribution of tourists to wineries (n=43) 114
Table 5.5: Age profile of winery visitors to South African wineries (n=43) 115
Table 5.6: Motivations to visit a winery (n=46) 116
Table 5.7: Advantages and disadvantages of wine tourism (n=46) 118
Table 5.8: Types of wine sales (n=46) 124
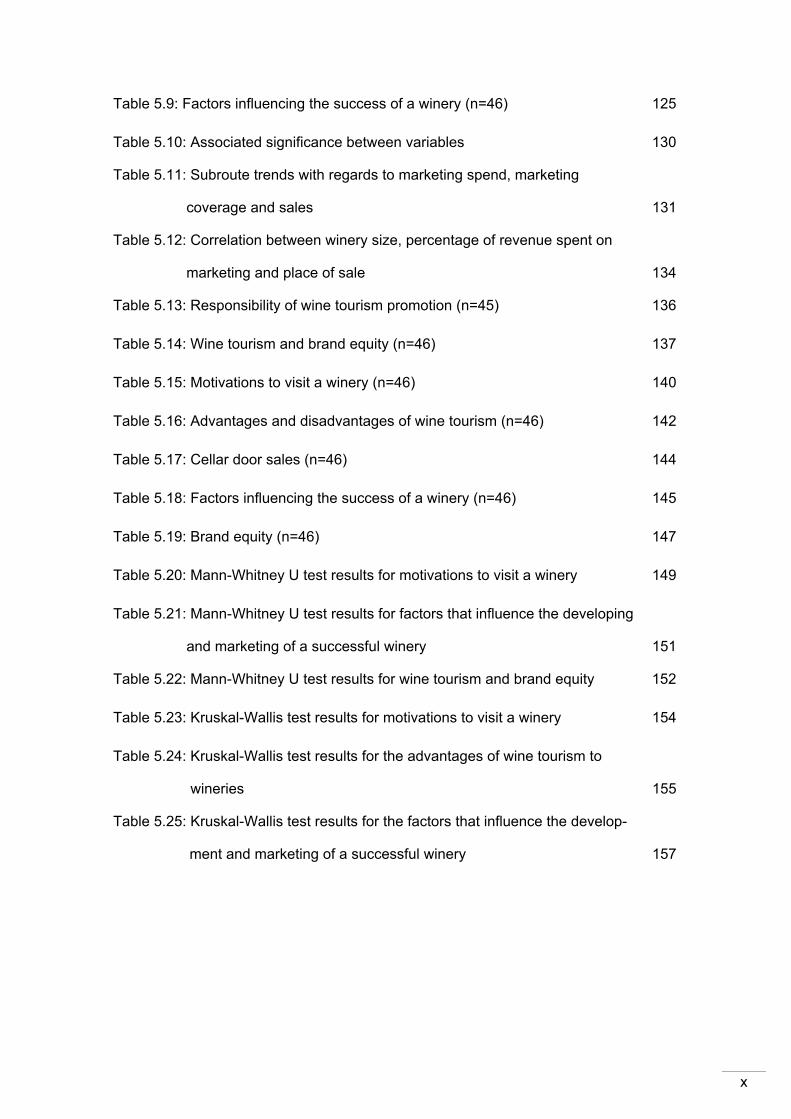
x
Table 5.9: Factors influencing the success of a winery (n=46) 125
Table 5.10: Associated significance between variables 130
Table 5.11: Subroute trends with regards to marketing spend, marketing
coverage and sales 131
Table 5.12: Correlation between winery size, percentage of revenue spent on
marketing and place of sale 134
Table 5.13: Responsibility of wine tourism promotion (n=45) 136
Table 5.14: Wine tourism and brand equity (n=46) 137
Table 5.15: Motivations to visit a winery (n=46) 140
Table 5.16: Advantages and disadvantages of wine tourism (n=46) 142
Table 5.17: Cellar door sales (n=46) 144
Table 5.18: Factors influencing the success of a winery (n=46) 145
Table 5.19: Brand equity (n=46) 147
Table 5.20: Mann-Whitney U test results for motivations to visit a winery 149
Table 5.21: Mann-Whitney U test results for factors that influence the developing
and marketing of a successful winery 151
Table 5.22: Mann-Whitney U test results for wine tourism and brand equity 152
Table 5.23: Kruskal-Wallis test results for motivations to visit a winery 154
Table 5.24: Kruskal-Wallis test results for the advantages of wine tourism to
wineries 155
Table 5.25: Kruskal-Wallis test results for the factors that influence the develop-
ment and marketing of a successful winery 157
1
1. CHAPTER 1: BACKGROUND AND PROBLEM STATEMENT
1.1 INTRODUCTION
The purpose of this chapter is to provide the reader with background to the study. The first
section of this chapter provides information pertaining to the problem that will be researched.
The research problem is then explained and the research objectives formulated. Next, a brief
overview of the research process is given. In conclusion, a synopsis is provided of the
various chapters in this dissertation.
1.2 BACKGROUND INFORMATION ON THE RESEARCH PROBLEM
The focus of this study is the wine industry and the role of tourism in the wine industry.
Before embarking on a discussion of the wine industry and the role of tourism, it is necessary
to first describe the main or key product produced by this industry, namely wine (Orth,
Lockshin & d’Hauteville, 2007:5). Wine is a beverage made from the fermented juice of
grapes and is defined by its place of production (Barreiro-Hurlé, Colombo & Cantos-Villar,
2008; Ling, 2010; Orth et al., 2007:5). There are many different wine making methods and
hundreds of different wine varieties, but the common denominator of all wine is that it is
associated with relaxation, communing with others, food consumption, learning about new
things and hospitality (Dodd in Bruwer, 2003).
The wine industry is a global industry (Bell & Giuliani, 2007; Hussain, Cholette & Castaldi,
2008). Wine is produced in almost every country in the world; fifty-two countries have wine
industries large enough to contribute to the country’s gross domestic product (GDP) (Wine
Institute, 2009c). The International Wine and Spirit Record (IWSR) states that the global
wine market was worth US$151 817 billion in 2008 and is expected to grow by a further
8.05% in value between 2009 and 2013. This represents an 8.8% growth in volume with a
19.6% increase in value between 2004 and 2013, making the global wine business more
valuable than the world's cosmetics industry (Vinexpo, 2010).
CHAPTER 1: BACKGROUND AND PROBLEM STATEMENT
2
The wine1 industry is one of the primary agricultural sectors in South Africa (SAinfo, 2010a).
The South African wine industry ranks eighth in overall wine production in the world, with
domestic sales of wine amounting to 356.1 million litres and exports reaching nearly 412
million litres in 2008. This amounted to more than R6 272 million in turnover. Imports to the
country totalled almost R237 million, equivalent to 2% of domestic sales (South African Wine
Industry Information and Systems [SAWIS], 2009a:4; SAWIS, 2009b:7; Swanepoel & Bailey,
2008).
During 2008, the wine industry contributed R26 223 million to the annual GDP and supported
the employment opportunities of nearly 300 000 people. Household income worth
R17 124 million was generated by the wine industry during the same period, of which
R2 908 million was earned by lower-income groups. A significantly large portion of this
money is spent in the Western Cape region where it was earned. By combining the annual
expenditure of farmers on production inputs and household incomes earned through the wine
industry it is easy to see that this industry forms the backbone of the economy of many
districts in the Western Cape (SAWIS, 2009a; SAWIS, 2009b; Swanepoel & Bailey, 2008).
Hence the importance of the wine industry to the people and the economy of South Africa
and specifically the Western Cape cannot be denied (Thomas, 2010a). The wine industry is
currently (2010) in its sixth year of a down cycle, the longest decline in its history (Van Wyk in
Thomas, 2010a). The industry also faces numerous challenges, both domestically and
internationally (Gaiter & Brecher, 2008; Ponte & Ewert, 2007; Williams, 2005). These
challenges include devastating weather conditions in late 2009 and early 2010 which halved
production per hectare of some farmers in the Stellenbosch area, perpetual global
oversupply, a fluctuating exchange rate and a strong rand (Business World, 2008; Le Roux,
2007; Reddy, 2006; Redford, 2008; Somogyi, Gyau, Li & Bruwer, 2010; Thiel in Thomas,
2010a; Thomas, 2010a). (These challenges are all discussed in detail in chapter 2, section
2.2.3). Joubert (in Thomas, 2010a) states that no more than 3 to 5% of wine farmers are
currently making a profit. The four most significant challenges facing the South African wine
industry include being a relatively new entrant into the world wine market, the collapse of
world financial markets, problems with the South African wine industry’s distribution chain
and the production orientation philosophy that still prevails. These four challenges will now
be discussed in more detail.
1 When referring to the South African wine industry, wine encompasses natural, fortified and sparkling wine, as well as wine for brandy, distilling wine, brandy and other spirits distilled from distilling wine. Often, wine industry statistics also include grape juice and grape juice concentrate, which are used in wine, other alcoholic products and nonalcoholic products. In this study, the term “wine” will be used to refer only to natural, fortified and sparkling wine, unless specified otherwise (SAWIS, 2009a:3).

3
(i) Relatively new entrant to the world wine market
South Africa has a centuries’ long tradition of winemaking; its first wine was pressed in 1659
(Du Plessis & Boom, 2008; Bruwer, 2003; WOSA History, n.d.). However, the industry was
isolated from international competition during the years of 1934 to 1994 and catered mostly
to the domestic market (Encyclopeadia Brittanica, n.d.). This created a situation in which the
South African wine industry only really began to compete internationally in 1995, making it
one of the newest entrants to the international wine market (SA Wine Council, 2007; Mason,
2010). Competition is tough because South Africa has to compete with better quality wines
made from more popular grape varieties, with competitors that are much larger, have better
distribution channels and are better known brand names in the wine market (Ewert, 2005;
Gaiter & Brecher, 2008).
(ii) Collapse of world financial markets
The collapse of world financial markets in 2008 had a major impact on the wine industry
(Joubert in Thomas, 2010a). At the most simplistic level, inflationary conditions coupled with
pressure on disposable income have resulted in consumers trading down (McNulty, 2010;
Nielsen Company, 2009; SAWIS, 2009a; Fridjhon, 2008). This is true of the South African
wine consumer as well as international wine consumers (Cape Business News, 2009b). This
down trading has affected the entire wine market; from the most premium to the cheapest
wines, and the fall back in prices seems to be worldwide (Smale, 2008; This is money, 2009;
Veseth, 2008). The South African wine consumer is generally regarded as more price
conscious and less likely to venture into the higher priced products (Cape Business News,
2009). This was confirmed by a wine industry survey conducted by South African Wine
Industry Information and Systems (SAWIS) in 2009 (SAWIS, 2009b). Combined with
consumers trading down, production costs have increased. The average cost of wine
production rose from R19 000 per hectare to R26 580 per hectare between 2004 and 2009.
In 2009 alone, the cost of wine production increased by 13%, more than double South
Africa’s overall inflation rate (Thomas, 2010a).
(iii) South African wine industry distribution chain
Another obstacle to the industry is the current wine distribution chain. The wine industry
distribution chain is long, characterised by complex distribution structures, and as a result
producers have largely lost direct contact with consumers of wine products (Bastian, Alant,
Bruwer & Li, 2005:80; Miller & Bruwer, 2006). The long distribution chain has also led to an
extremely low profit margin for wineries. Recent studies have shown that of the average retail
(shelf) price of R24 for a 750ml bottle of wine, the producing winery receives only 44 cents.
This is in stark contrast to the R1.07 per bottle (i.e. 4% of retail price) which is seen as a

4
reasonable remuneration and return on capital (SAWIS, 2009b; Conningarth Economists in
Thomas 2010a).
(iv) Production orientation instead of marketing orientation
The origin of the grapes used to make a wine is used by consumers to make inferences
about its quality and style, it can therefore be said that wine is defined by its place of
production (Orth, Wolf & Dodd, 2005; Orth et al., 2007). With the foundation of the wine
industry based on agriculture, it comes as no surprise that the industry has been accused of
being much more product-driven than market-oriented (Beverland & Lockshin, 2003;
Orth et al., 2007). Most wineries still focus on producing the best quality wine at a reasonable
price, believing that the product would sell itself, spending very little on marketing and
branding their product (Van Rooyen in Media Vision Consultants, 2008).
The above-mentioned challenges form the foundation upon which the research problem of
this study was formulated. The research problem is explained in the next section.
1.3 PROBLEM STATEMENT
As previously mentioned, the South African wine industry currently faces numerous
challenges (also discussed in detail in chapter 2, section 2.2.3). Van Rooyen (in Media
Vision Consultants, 2008), CEO of Wines of South Africa, states that the wine industry will
not be able to survive in the future if it continues to focus on production alone. Good quality
wine and fair prices are not enough to sustain the industry, especially not with new
competitors such as China and India entering the market (Van Rooyen in Media Vision
Consultants, 2008; Castle, 2008). According to Bruwer (2006), South Africa will only be able
to survive in the long term if it adopts a whole-of-wine-value-chain approach with a marketing
orientation to its wine business.
How can South African wineries adopt a whole-of-wine-value-chain approach with a
marketing orientation to its business? Before answering this question, it is first necessary to
clarify the concept of a value chain. The best explanation of a value chain is Porter’s value
chain model. According to Porter (in Barnes, 2001), core products are received into the
business and transformed into a final product by a series of value-adding processes. The
final product is then distributed from the business through various distribution channels and
sold to the end consumer by employing marketing and sales strategies. This process is
illustrated in figure 1.1.
5
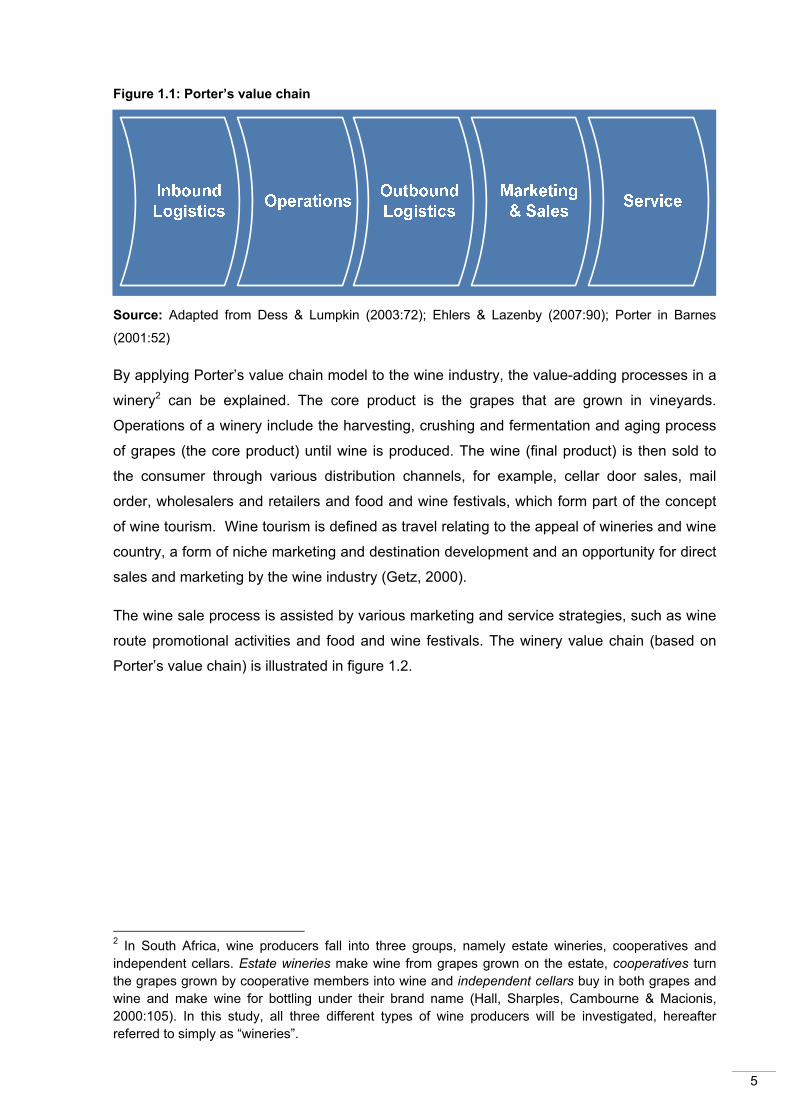
Figure 1.1: Porter’s value chain
Source: Adapted from Dess & Lumpkin (2003:72); Ehlers & Lazenby (2007:90); Porter in Barnes
(2001:52)
By applying Porter’s value chain model to the wine industry, the value-adding processes in a
winery2 can be explained. The core product is the grapes that are grown in vineyards.
Operations of a winery include the harvesting, crushing and fermentation and aging process
of grapes (the core product) until wine is produced. The wine (final product) is then sold to
the consumer through various distribution channels, for example, cellar door sales, mail
order, wholesalers and retailers and food and wine festivals, which form part of the concept
of wine tourism. Wine tourism is defined as travel relating to the appeal of wineries and wine
country, a form of niche marketing and destination development and an opportunity for direct
sales and marketing by the wine industry (Getz, 2000).
The wine sale process is assisted by various marketing and service strategies, such as wine
route promotional activities and food and wine festivals. The winery value chain (based on
Porter’s value chain) is illustrated in figure 1.2.
2 In South Africa, wine producers fall into three groups, namely estate wineries, cooperatives and independent cellars. Estate wineries make wine from grapes grown on the estate, cooperatives turn the grapes grown by cooperative members into wine and independent cellars buy in both grapes and wine and make wine for bottling under their brand name (Hall, Sharples, Cambourne & Macionis, 2000:105). In this study, all three different types of wine producers will be investigated, hereafter referred to simply as “wineries”.

6
Figure 1.2: Winery value chain
Source: Adapted from Cooperative Research Centre for Viticulture (n.d.); AusWeb08 (2008);
Chemical Engineering Tools & Information (n.d.)
By taking a closer look at figure 1.2, it is possible to ascertain the areas in which wine
tourism can add value in the value chain of a winery. Activities such as food and wine
festivals, cellar door sales, the promotional activities of a wine route, wine tasting and
educational winery tours are all functions or activities of wine tourism. It can therefore be
concluded that wine tourism can add value to the wine industry in the last three links of the
value chain, namely outbound logistics, marketing and sales and service.
Since the mid-1990s, researchers have pointed to the benefits that the wine industry could
derive from a positive, mutually beneficial relationship with the tourism industry (Dodd, 1995;
Dodd & Bigotte, 1997; Getz, 2000; Hall, Sharples, Cambourne & Macionis, 2000). These
benefits include increased wine sales, aiding cash flow, fostering brand loyalty and the
creation of higher profits from winery sales (Fuller in Hall et al., 2000:35; Getz, 2000; Roberts
& Sparks in Carlsen & Charters, 2006).
7
International research by Chaney (in Thach & Matz, 2004:118), Dodd (1995) and Howley and
Van Westering (2008) conducted in the USA, Spain and Australia has already demonstrated
that the development of wine tourism has a positive effect for growers in wine- producing
areas, confirming the financial benefits listed by Dodd (1995), Dodd and Bigotte (1997), Getz
(2000) and Hall et al. (2000). Thus it can be concluded that wine tourism can add value to
and benefit wineries in financial terms.
In the South African context, industry specialists have reiterated that if wineries do not move
away from a production orientation to a marketing orientation, they will not survive in the
future (Van Rooyen in Media Vision Consultants, 2008). As explained above, wine tourism is
a marketing channel, which can add value to and benefit wineries. The question that arises
is: Do South African wineries perceive that wine tourism adds value to or benefits their
business and do they actively employ wine tourism as a tool in their marketing strategies?
This question forms the research question of this study. The study will endeavour to
investigate the perception of wineries regarding wine tourism and the role that wine tourism
currently plays in the marketing of wineries. The study is exploratory in nature, and to the
researcher’s knowledge, no such research has recently been conducted in South Africa. The
bulk of the research that has been done in the South African context focused on the wine
tourist and wine tourism product (Bruwer, 2003; Demhardt, 2003; Preston-Whyte in Hall et
al., 2000; Tassiopoulos & Haydam in Carlsen & Charters, 2006; Tassiopoulos, Nuntsu, &
Haydam, 2003), while a few studies have focused on the supply of wine tourism (Bruwer,
2003; Loubser, 2004). This study will therefore add to the existing knowledge base of wine
tourism and its role in helping to market the wine industry.
The study site that was selected for the primary research is the Stellenbosch Wine Route
(see chapter 4, section 4.2 in this regard). Based on the research question, a primary and
several secondary objectives were formulated for this study, which are listed in the next
section.
1.4 OBJECTIVES
In the previous section, the research problem for this study was explained. The research
problem provides the foundation for the objectives of the study, which are divided into a
primary and several secondary objectives. These are listed next.
8
1.4.1 PRIMARY OBJECTIVE
To investigate the role of wine tourism in the marketing of wineries in the Stellenbosch
Wine Route of South Africa
1.4.2 SECONDARY OBJECTIVES
• To compile a corpographic profile of the wineries in the Stellenbosch Wine Route of
South Africa
• To investigate the range of wine tourism products available at wineries in the
Stellenbosch Wine Route of South Africa
• To compile a profile of the visitors to the wineries in the Stellenbosch Wine Route of
South Africa
• To determine the perceived advantages and disadvantages of wine tourism for
wineries in the Stellenbosch Wine Route of South Africa
• To investigate whether wine tourism plays an important role in the promotion strategy of
wineries in the Stellenbosch Wine Route of South Africa
• To determine the perception of wineries in the Stellenbosch Wine Route of South Africa
regarding wine tourism in branding wineries
1.5 RESEARCH METHODOLOGY
The research in this dissertation consists of two stages, namely secondary research and
primary research. The first stage is a review of relevant academic literature and the second
stage involves a survey of the respondents and the subsequent analysis and interpretation of
the data that were collected.
1.5.1 STAGE 1: SECONDARY RESEARCH
The secondary research in this study comprises an in-depth literature review of a range of
concepts relevant to the primary research in this study. The research was conducted by
consulting various scientific databases, magazines, newspapers, textbooks and other
published academic material. Information obtained through this process was synthesised
and simplified and is presented in chapters 2 and 3.
9
Chapter 2 explores the wine industry and the wine tourism industry in South Africa. This
chapter includes relevant theory of important concepts pertaining to the wine industry and the
wine tourism industry. These concepts include the history of these industries in South Africa,
an overview of the wine regions, the current market environment and the profile of South
African wine tourists. Chapter 3 provides a brief overview of the marketing process and
attention is then focused on the marketing strategy and the marketing mix. Thereafter, the
four P’s of marketing are discussed in detail as they relate to wine tourism and the wine
industry.
1.5.2 STAGE 2: PRIMARY RESEARCH
The primary research of this study was conducted in the wine-growing region of
Stellenbosch, South Africa. (Refer to figure 2.4 in chapter 2, section 2.2.2 for a map of the
region.) The population of the study consisted of all the wineries that are members of the
Stellenbosch Wine Route, since it comprises more than 85% of the vineyards located in the
Stellenbosch wine-growing region. The Stellenbosch region, in turn, made up 18% of the
total vineyard footprint in South Africa in 2009. According to Frandsen (2005), the size and
dominance of the Stellenbosch Wine Route in comparison with other wine routes provide a
reasonably accurate indication of all the wine routes and wine tourism in the Western Cape
(see Annexure A for a list of all the wineries in the population as accessed on 30/09/2009).
A census approach was used to survey the population since it consists of only 146 wineries
which could be surveyed without too many time, financial and human resource constraints
and the details of the population were easily accessible from the Stellenbosch Wine Route
website (Weiers, 2008:118).
The survey instrument was constructed by the researcher in a process that included a visit to
the study site and the 2008 Stellenbosch Wine Festival, telephonic interviews with wineries,
secondary research, in-depth interviews with industry specialists and pilot testing. This
process is discussed in detail in chapter 4, section 4.5. The majority of the questions were
derived from previous research on New Zealand wineries, conducted by Christensen, Hall
and Mitchell (2004) and South African wine routes and regions, conducted by Bruwer (2003),
Demhardt (2003) and Preston-Whyte (in Hall et al., 2000).
The primary data were collected using self-completion e-mail questionnaires. The completed
electronic questionnaires were received by the electronic data bank of the Bureau for Market
Research during the months of November and December 2009 and January 2010. Forty-six
completed questionnaires were received during the data collection process and the response
rate was calculated at 33%.

10
The data that were gathered using these questionnaires were processed and analysed. This
process is discussed in the next section.
1.5.3 DATA PROCESSING AND ANALYSIS
1.5.3.1 Data preparation
The processing of the data in this study involved capturing, coding and editing the raw data.
Since the respondents were required to complete the questionnaires online, the data were
captured electronically on the Bureau for Market Research’s database. Data were
automatically converted into a Mircrosoft Excel spreadsheet. The questionnaire had been
precoded since all the questions in the questionnaire were closed-ended and could be
assigned categories and numbers beforehand.
The data in this study were edited in order to identify and minimise errors, incompleteness
and inconsistencies, for example, the data were scrutinised in order to determine if there
were any invalid numbers, such as a 3, appearing in a column where 1 indicates male and 2
indicates female (Van Zyl, 2002:75). Furthermore, data that were received in a format
different to the “expected” format were consistently edited. The processed data were then
subjected to various statistical analyses, which are discussed next.
1.5.3.2 Statistical analysis
The data in this study were analysed using both descriptive and statistical methods.
Descriptive statistics describes or summarises the data obtained for a group of individual
units of analysis (Welman, Kruger & Mitchell, 2009:231; Weiers, 2008:842). Frequencies,
means, medians and quartiles were the descriptive statistics used in the current study since
nominal, ordinal and interval data were collected (Welman et al., 2009:229-230).
The statistical methods used to derive inferential statistics in this study comprised various
nonparametric tests. These tests include binomial tests, Mann-Whitney U tests and Kruskal-
Wallis tests. They are all described in detail in chapter 4, section 4.8.2.
The next section discusses the reliability and validity of the research instrument that was
used.
11
1.5.3.3 Reliability and validity
Babbie, Mouton, Vorster and Prozesky (2007:119), describe reliability as the ability of a
measuring instrument to obtain the same results when the same thing is measured more
than once. There are different types of reliability measurements, which include test-retest
reliability, internal consistency reliability, equivalent forms reliability and interrater reliability
(Leedy & Ormrod, 2010:93). None of the reliability tests could be conducted and the
reliability of the measuring instrument in this study could not be measured owing to the
nature of the study and the small sample size. This can be seen as a limitation of the scope
of the study (see section 6.3.).
Validity is defined as the extent to which the instrument measures what it actually intends to
measure. Validity can take on different forms, namely face validity, content validity and
criterion validity (Neuman, 2007:118). In the current study, the type of validity used to
establish the trustworthiness of the results from the survey is called content validity. A
measurement instrument has high content validity if its items or questions represent the
entire “universe of items” from which it is drawn (Salkind, 2009:118). After the questionnaire
had been designed, four industry specialists were consulted about the content formulation
and scope of the questions included in this survey instrument in order to ensure that it had an
acceptable level of content validity.
A brief overview of the research process followed in this dissertation was provided in this
section. The next section briefly outlines the content of the chapters in the dissertation.

12
1.6 LAYOUT OF THE CHAPTERS
This dissertation consists of six chapters, the structure of which is illustrated in figure 1.3.
Figure 1.3: Layout of the chapters
Chapter 1: Background and problem statement
Chapter 1 serves as a point of reference regarding the study. This chapter provides
background information regarding the research and explains the research problem.
Research objectives are listed and an overview of the research methodology used in the
study is given. It then provides a synopsis of each chapter in the dissertation.
13
Chapter 2: Wine and wine tourism in South Africa
Chapter 2 consists of a literature review of the South African wine industry and the South
African wine tourism industry. Topics that are discussed include the history of both the wine
and the wine tourism industries, South Africa’s wine regions, the current market environment
of the wine industry, wine tourism and wine tourists and the product characteristics and
benefits of wine tourism.
Chapter 3: Marketing: The theoretical underpinnings
Chapter 3 comprises of a literature review of the marketing process and the marketing mix
with a focus on the four P’s as they relate to wine tourism and the wine industry.
Chapter 4: Research methodology
Chapter four is a detailed discussion of the research methodology that was used in
conducting the primary research in this study. The research process that was followed, the
study site, the research population, the data collection process and the methods used in
analysing the data are described. The chapter is concluded with a discussion of the validity
and reliability of the measuring instrument and data.
Chapter 5: Data analysis of wineries in the Stellenbosch Wine Route
Chapter five is dedicated to a thorough discussion of the data analysis. In the first section the
descriptive statistics are presented in a systematic manner. The second section is structured
around hypotheses and the statistical tests that were conducted in order to prove or disprove
these statements.
Chapter 6: Conclusions and recommendations
Chapter six is devoted to the conclusions that can be derived from the data analysis and the
recommendations that can be made to management, based on the findings of the study.

14
2. CHAPTER 2: WINE AND WINE TOURISM IN SOUTH AFRICA
2.1 INTRODUCTION
As noted in chapter 1, the main objective of this research study was to investigate the role
that wine tourism plays in marketing wineries that are part of the Stellenbosch Wine Route.
Before primary research could be done in order to achieve this objective, it was necessary to
have a theoretical foundation upon which primary research could be conducted. The purpose
of this chapter is therefore to provide a theoretical background of the South African wine
industry as well as the wine tourism industry in South Africa.
This chapter is divided into two main sections, firstly, the South African Wine Industry is
discussed in section 2.2 and secondly the South African Wine Tourism Industry in section
2.3. The content of each section is indicated in figure 2.1.
CHAPTER 2: WINE AND WINE TOURISM IN SOUTH AFRICA

15
Figure 2.1: Structure of Chapter 2
2.2 THE SOUTH AFRICAN WINE INDUSTRY
Section 2.2 pertains to the wine industry in South Africa and the discussion begins with a
brief overview of its history. This is followed by an overview of the wine regions of South
Africa. The section concludes with an in-depth discussion of the market environment and a
SWOT analysis of the South African wine industry.

16
2.2.1 THE HISTORY OF THE SOUTH AFRICAN WINE INDUSTRY
Evidence of wine production dates back as far as 6000 BC and it is generally accepted that
wine was made for the first time in Persia (Vineyard Varieties, n.d.). The cultivation of
grapevines spread systematically from Persia to Egypt and Greece (2500 BC) and from there
to Sicily, Italy and most of North Africa (1000 BC) (Unwin in Anderson, 2004:15; Vineyard
Varieties, n.d.). Five-hundred years later, wine production spread to Spain, the South of
France and Arabia (WOSA, n.d.[b]).
During the period of the Roman Empire, wine became a vital trading commodity and the
Romans were responsible for spreading wine production into much of Western Europe,
especially the Moselle and Rhine valley sections of France and Germany and the Danube
River valley of Austria (Honeycreek Vineyards & Orchards, n.d.). France, Germany,
Hungary, Italy and many other European countries proudly boast wine histories dating back
to the Romans and Celts and are commonly known as “Old World” wine producing countries
(Professional Friends of Wine, n.d.).
Between 1450 and 1650, grape cultivation was transported from Europe to North and South
America, South Africa and Australia, following the voyages of Columbus (1492), Vasco da
Gama (1498) and other explorers (Anderson, Norman & Wittwer in Anderson, 2004:15;
Eyewitness to History, 2004; Timeline Index, n.d.). These countries are seen as newcomers
to winemaking, and are commonly known as “New World” wine producers (Professional
Friends of Wine, n.d.). The New World wine countries are indicated on the map in figure 2.2.
Figure 2.2: Map of the major New World wine countries
Source: Gastin & Schwing in Thach & Matz (2004:3)

17
South Africa, one of these New World wine producers, is one of the oldest wine producing
countries outside Europe, celebrating its 350th year of wine production in February 2009
(Bruwer, 2003:424; Blandy, 2009). The timeline of various events in the history of the South
African wine industry is illustrated in figure 2.3.
Figure 2.3: Timeline of the wine industry of South Africa
As indicated in figure 2.3, events shaping the current South African wine industry
commenced from as early as the 1600s. In 1652, the Dutch East India Company established
a refreshment station at the Cape of Good Hope to provide fresh food to the company’s
merchant fleet on their voyages to India and the surrounding areas (Vineyard Varieties, n.d.).
Jan van Riebeeck, the first governor of the Cape, planted a vineyard on South African soil in
1655 (South African History Online, n.d.). The first wine was pressed on 2 February 1659,
First grapevine planted by Jan v Riebeeck
First wine pressed on South African soil
Simon v d Stel plants the first grapevines on his farm Constantia
Wine industry struggles through the 18th century
British occupation of the Cape War between Britain and France
Phylloxera disease destroys vineyards
KWV is established
KWV becomes a private company
Pinotage is created by Prof. Perold
Wine of Origin scheme is introducedLocal wine industry regulations brought inline with those of Europe
Stellenbosch wine route is inaugurated
Integrated Production of Wine scheme is introduced
South African Wine Industry Council is introduced
Biodiversity Wine Initiative is set up
Focus on environmentally friendly wine production methods
1655
1659
1679
1700s
1800s
1886
1918
1973
1925
1971
1999
2004
2006
2008
2009Focus on Fairtrade wine production
Fairtrade South Africa is established
18
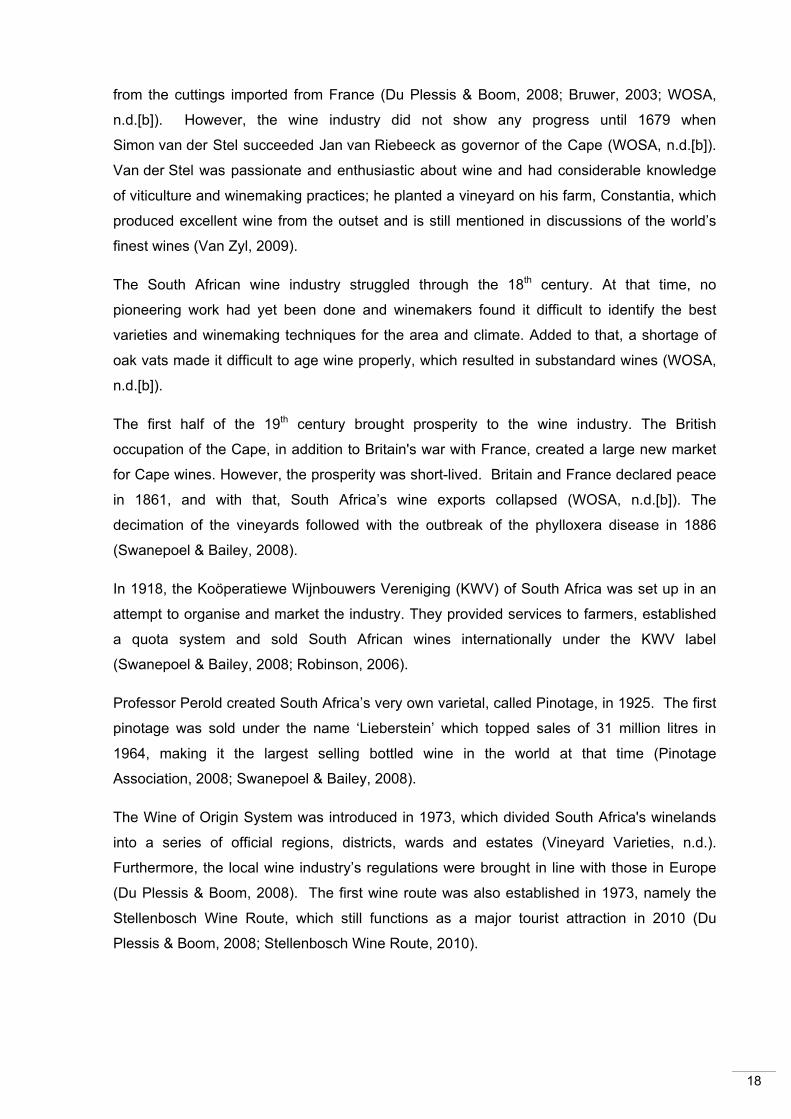
from the cuttings imported from France (Du Plessis & Boom, 2008; Bruwer, 2003; WOSA,
n.d.[b]). However, the wine industry did not show any progress until 1679 when
Simon van der Stel succeeded Jan van Riebeeck as governor of the Cape (WOSA, n.d.[b]).
Van der Stel was passionate and enthusiastic about wine and had considerable knowledge
of viticulture and winemaking practices; he planted a vineyard on his farm, Constantia, which
produced excellent wine from the outset and is still mentioned in discussions of the world’s
finest wines (Van Zyl, 2009).
The South African wine industry struggled through the 18th century. At that time, no
pioneering work had yet been done and winemakers found it difficult to identify the best
varieties and winemaking techniques for the area and climate. Added to that, a shortage of
oak vats made it difficult to age wine properly, which resulted in substandard wines (WOSA,
n.d.[b]).
The first half of the 19th century brought prosperity to the wine industry. The British
occupation of the Cape, in addition to Britain's war with France, created a large new market
for Cape wines. However, the prosperity was short-lived. Britain and France declared peace
in 1861, and with that, South Africa’s wine exports collapsed (WOSA, n.d.[b]). The
decimation of the vineyards followed with the outbreak of the phylloxera disease in 1886
(Swanepoel & Bailey, 2008).
In 1918, the Koöperatiewe Wijnbouwers Vereniging (KWV) of South Africa was set up in an
attempt to organise and market the industry. They provided services to farmers, established
a quota system and sold South African wines internationally under the KWV label
(Swanepoel & Bailey, 2008; Robinson, 2006).
Professor Perold created South Africa’s very own varietal, called Pinotage, in 1925. The first
pinotage was sold under the name ‘Lieberstein’ which topped sales of 31 million litres in
1964, making it the largest selling bottled wine in the world at that time (Pinotage
Association, 2008; Swanepoel & Bailey, 2008).
The Wine of Origin System was introduced in 1973, which divided South Africa's winelands
into a series of official regions, districts, wards and estates (Vineyard Varieties, n.d.).
Furthermore, the local wine industry’s regulations were brought in line with those in Europe
(Du Plessis & Boom, 2008). The first wine route was also established in 1973, namely the
Stellenbosch Wine Route, which still functions as a major tourist attraction in 2010 (Du
Plessis & Boom, 2008; Stellenbosch Wine Route, 2010).

19
In 1998, the Integrated Production of Wine Scheme (IPW) was introduced, aiming to give
guidelines for the processes from the vine to wine (IPW, n.d.). The purpose of the IPW
scheme is to raise winemaking standards in the South African wine industry (Swanepoel &
Bailey, 2008:22-23).
The KWV became a private company in 1999 and its industry responsibilities were taken
over by the South African Wine Industry Trust (SAWIT) (SAWIT, n.d.). SAWIT was also
entrusted with the role of developing previously disadvantaged producers in the wine industry
(Swanepoel & Bailey, 2008).
During 2004, the Biodiversity Wine Initiative (BWI) was set up. The BWI is a partnership
between conservation groups and private farms to ensure that the biodiversity of plant life is
preserved and encouraged (Swanepoel & Bailey, 2008; BWI, 2010).
At the Second Annual Fairtrade Stakeholder meeting held in May 2005, the Fairtrade South
Africa (FTSA) trust was established. Several steering committees were established, including
a wine working committee for South African producers, processors and exporters (WOSA,
n.d.[a]).
The South African Wine Industry Council was established in 2006 to represent the South
African wine industry and enhance the strategic environment for the benefit of the South
African wine industry. The council comprises four business units, Winetech, Wines of South
Africa (WOSA), South African Wine Industry Information and Services (SAWIS) and the Wine
Industry Development Association (WIDA) (economic, social and human resources
programmes) (Du Plessis & Boom, 2008).
The year 2008 was characterised by the wine industry’s move towards more environmentally
friendly methods of farming and production (Swanepoel & Bailey, 2008), while 2009 saw an
increase in focus on Fairtrade3 wines with South Africa winning the Ethical Award (SAinfo,
2010b).
This section outlined the history of the South African wine industry. The next section is
dedicated to a discussion of South Africa’s winelands.
3 Fairtrade was established in 1994 and is recognised in 20 national markets across Europe, North America, Japan and Mexico. Fairtrade is a development tool to aid disadvantaged farmers and workers in developing countries to earn more money by using the international Fairtrade Mark. Fairtrade addresses the injustices of conventional trade by requiring companies to pay sustainable prices (which must never fall lower than the market price). The Fairtrade mark represents better prices, decent working conditions, local sustainability, and fair terms of trade for farmers and workers in the developing world (Fairtrade Foundation, n.d.; WOSA, n.d.[a]).

20
2.2.2 SOUTH AFRICA’s WINELANDS
South Africa has 3 839 grape farmers who cultivate 304 461 939 vines (in 2008) (SAWIS,
2009a). The country contributes 3.6% of the total amount of wine produced worldwide with
only 1.5% of the world’s vines and in 2008 South Africa ranked eighth in overall volume
production (SAWIS, 2009a; SAWIS, 2009b). Table 2.1 shows the area under vines and the
total wine production for the top three Old World wine-producing countries, as well as the top
five New World wine-producing countries that currently compete with South Africa. South
Africa performs extremely well in terms of the percentage of world wine production in relation
to the percentage of world surface area of grapes when compared to other New World wine
countries.
Table 2.1: South Africa: area under vine and wine production for 2006
Source: Australian Global Wine Statistical Compendium 1961 to 2005 & OIV Statistics 2006, in
SAWIS (2009a:34)
Although South Africa's vineyards can be found across the entire country (Cob Creek, n.d.;
Landzicht, n.d.; Mbendi Information Services, 2009; The Stable Wine Estate, n.d.; Toureagle,
n.d.), most vineyards are situated in the Western Cape near the coast, as well as in the drier
Country
Area under vines
(Wine and table grapes) Wine production (litres)
Hectares % of total
world surface
area Rank Wine
production % of total
world production
Rank
Old
wor
ld Spain 1 174 000 15.8 1 4 010 000 000 14.1 3
France 842 000 11.3 2 5 340 000 000 18.8 1
Italy 824 600 11.1 3 4 711 700 000 16.6 2
New
wor
ld
China 483 200 6.5 5 689 600 000 2.4 11
USA 379 200 5.1 6 2 338 000 000 8.2 4
Argentina 219 000 2.9 8 1 539 600 000 5.4 5
Chile 178 000 2.4 10 845 000 000 3.0 9
Australia 158 200 2.1 11 1 429 800 000 5.0 6
South Africa 112 700 1.5 14 1 013 000 000 3.6 7

21
Northern and Eastern Cape regions, namely the Little Karoo, the Olifants River Valley and
the lower Orange River (Vineyard Varieties, n.d.).
The Western Cape is one of the prime vine-growing regions in the southern hemisphere
since it has a mainly Mediterranean climate with warm, dry summers and wet winters
(WOSA, n.d.[b]). The mountain slopes and valleys form the ideal habitat for the wine grape
Vitis vinifer (WOSA, n.d.[b]; Swanepoel & Bailey, 2008).
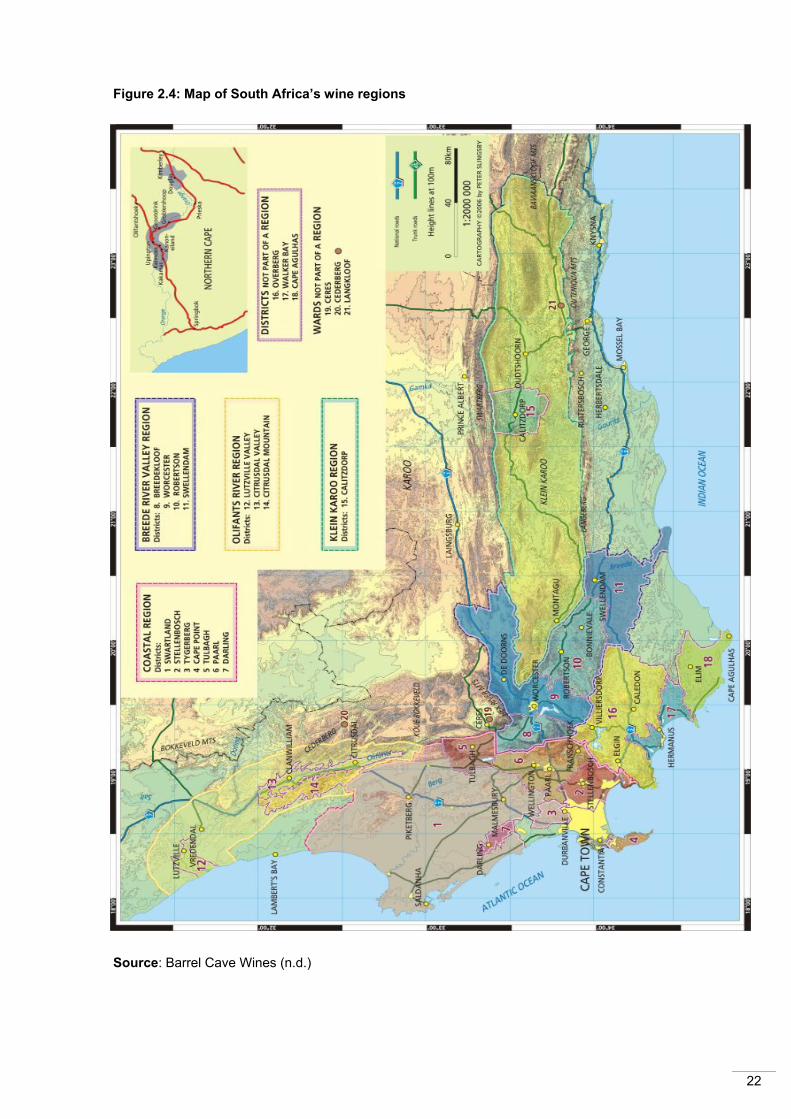
There are four main areas of grape production, namely Breede River Valley, Coastal, Little
Karoo and Olifants River, which encompass 21 diverse districts and some 61 smaller wards
(Swanepoel & Bailey, 2008). These areas are indicated on the map in figure 2.4, while table
2.2 summarises the geographic distribution of South Africa’s wine grape vineyards per
region, from the largest to the smallest.
Table 2.2: The geographic distribution of South Africa’s wine grape vineyards per region (excluding sultanas)
Wine region Number of vines % of total vines of SA Area (hectares) % of total
hectares
Stellenbosch 52 508 434 17.25 17 137 16.91
Paarl 51 918 553 17.05 16 891 16.67
Malmesbury 36 903 012 12.12 14 567 14.38
Robertson 47 559 486 15.62 13 989 13.72
Breedekloof 40 764 205 13.39 12 361 12.20
Olifants River 27 640 470 9.08 9 996 9.87
Worcester 27 425 627 9.01 8 490 8.38
Orange River 10 612 596 3.49 5 029 4.96
Little Karoo 9 129 556 3.00 2 956 2.92
Total 304 461 939 100.00 101 325 100.00
Source: SAWIS (2009a:8)
Regions that produce the most wine grapes (Worcester, Olifants River and Robertson,
respectively) also produce the highest yields per hectare, while farms in regions such as
Paarl, Stellenbosch and Malmesbury produce lower yields4 (Vink, Williams & Kirsten in
Anderson, 2004: 240).
4 Generally, grape yield per hectare of vineyard can vary as much as between 3 and 40 tons (Gawel, n.d.). The amount of grapes harvested from a particular vineyard is influenced by the type and age of vine, its terroir, the climate, viticultural techniques and plantation density (Ross, n.d.). Overall, South Africa has a high grape yield per hectare due to the excellent terroir and climate enjoyed by most wineries, as well as scientifically advanced viticultural techniques.
22
Figure 2.4: Map of South Africa’s wine regions
Source: Barrel Cave Wines (n.d.)

23
2.2.3 THE SOUTH AFRICAN WINE INDUSTRY BUSINESS ENVIRONMENT
All industries, including the wine industry, function or operate in the marketing environment
(Bennett & Strydom, 2001:24). A winery’s marketing environment consists of everything
inside and outside the winery and can be defined as all the factors that influence the
marketing activities of the winery, either directly or indirectly (Bennett & Strydom, 2001:24).
The market environment of the wine industry is composed of the micro-environment and the
macro-environment (Kotler & Armstrong, 2006:65). Within each component of the marketing
environment are several variables that influence the winery, such as competitors,
intermediaries and the political environment. This is illustrated in figure 2.5.
Figure 2.5: Marketing environment of a winery
For a winery to be successful, it must be aware of the influence of these variables and must
be proactive in leading the business in the right direction. The wine industry’s marketing
environment will now be discussed in more detail, starting with the macro environment.
2.2.3.1 The macro-environment of the South African wine industry
The macro-environment is composed of all the dimensions in broader society that influence
an industry and the organisations within it (Ehlers & Lazenby, 2007:103). Generally,
organisations cannot directly control the external (macro) environment’s segments and
elements, but these elements and changes in the external environment have a major
influence on organisations (Nieuwenhuizen & Rossouw, 2008:21). The elements in the
external (macro-) environment are popularly referred to as PESTE factors. PESTE is an

24
acronym for political, economic, social, technological and environmental (Ehlers & Lazenby,
2007:104). These macro-environmental factors influence individual organisations, in this
case, wineries, at four levels, namely, local, regional, national and global (George, 2007:44).
Each of the five factors in the macro-environment will now be discussed as it relates to the
South African wine industry.
(i) Political environment of the South African wine industry
The political environment is defined as “the parameters within which organisations and
interest groups compete for attention, resources and a voice in overseeing the body of laws
and regulations that guide the interactions between the organisation and the environment”
(Ehlers & Lazenby, 2007:107). The South African wine industry has been influenced both
favourably and unfavourably by various elements within its political environment. The most
notable aspects, namely the previous regulation of the wine industry, black economic
empowerment requirements, minimum wage legislation and taxes and excise duties will now
be discussed briefly.
- Regulation of the wine industry between 1918 and 1995
The South African wine industry was regulated between 1918 and 1995 by the KWV (Ewert,
2005). The KWV regulated planting quotas, minimum prices and guaranteed a minimum
price for surplus grapes; it was also the only exporter of South African wine (Ewert, 2003).
Grape farmers therefore focused on producing the required tons per hectare and not quality
grapes or wines. Another result of regulation by the KWV was that wine makers were not
required to have or develop any marketing skills (Ewert, 2005).
When the wine industry was deregulated in 1995, wine makers suddenly had to compete not
only with each other, since domestic pricing regulations were done away with, but also
internationally. Furthermore, imports from other countries quickly flooded the domestic
market (Vink, Williams & Kirsten in Anderson, 2004).
- Black economic empowerment legislation
With the democratisation of the South African government in 1994, legislation was put in
place for the empowerment of previously disadvantaged people. The process of
empowerment, popularly called BEE or black economic empowerment, has taken many
more years to implement than planned (Howe, 2008). Research conducted by the Wine
Industry Development Association (WIDA) into the BEE status of the wine industry found that

25
38% of wine operations have empowerment initiatives, 4.4% of wine operations have some
degree of black ownership and only 2.3% are black owned (Planting, 2010).
There are various reasons for the slow change in ownership of the wine industry, the most
important of which are as follows:
• Wine businesses are not traditionally profitable and most wine makers are in the
industry because of a love and passion for wine, not to make a profit (Birch in
Planting, 2010).
• Wine was not traditionally consumed by black Africans and never pursued as a
career, although this is starting to change with the new emerging middle class
(Planting, 2010).
- Minimum wage legislation
Minimum wage legislation came into effect after the democratisation of South Africa (Van
Wyk, 2010). This had a negative impact on the cash flow and profitability of wine farms and
farmers have therefore resorted to contracting or outsourcing manual labour (SA Wine
Council, 2007:15).
- The proposed new liquor law (to be implemented in January 2011)
New legislation can also radically influence the wine industry. The implementation of the
proposed new liquor law will affect the wine industry in several ways including trading hours,
selling on or off premises and marketing wines (Lordan, 2009). The new trading hours for
alcohol in the Western Cape can potentially harm the wine industry since the opportunity to
sell wines to consumers is now restricted to even fewer trading hours (Cape Business News,
2009a; WineNews Editorial Team, 2009). The South African transport department has also
proposed that all advertising of alcoholic products that is visible from any public road be
banned. This will have a major impact on how wines are currently advertised (Bizcommunity,
2008).
- Taxes and excise duties
Taxes and excise duties have a direct effect on the profitability and sustainability of wineries.
In South Africa, taxes and excise duties have increased progressively since 1994. In 2005,
the government’s annual income out of excise duty and VAT on wine was more than the
annual income received by primary wine producers from the sale of wine (Botha, 2010).
According to Botha (2010), the continuous increase in excise duties, as well as other
financial and economic pressures, will force many wine producers to stop farming or to
switch to more lucrative branches of the industry.

26
(ii) Economic environment of the South African wine industry
The second factor in the macro-environment of wineries is the economic environment. The
economic environment is defined as the totality of economic factors, including employment,
income, inflation and interest rates that influence consumer behaviour and the organisation’s
decisions (Business dictionary, 2010a).
The South African wine industry operates in an unstable economic environment and the
economic factors that have had the greatest impact during the last five years (2006 to 2010)
include the collapse of the world’s financial markets in 2008 and the consequent recession,
the high unemployment rate and the level of disposable income. These economic factors
impact the South African wine industry and will now be discussed.
- Collapse of the world financial markets
As discussed in chapter 1 (section 1.2), the collapse of the world’s financial markets in 2008
had a major impact on the wine industry. Consumers are trading down because of a
decrease in their disposable income (Fridjhon, 2008; McNulty, 2010; Nielsen Company,
2009; SAWIS, 2009a). This affects all wine products from the very expensive to the
cheapest; the price consciousness of consumers has also increased worldwide and not only
in South Africa (Smale, 2008; This is money, 2009; Veseth, 2008; Cape Business News,
2009b). Furthermore, the recession has not only caused consumers to buy less and cheaper
wine, but the cost of making wine has also increased (SAWIS, 2009a; Thomas, 2010a).
- Fluctuating exchange rate
The value of the rand fell steadily after the democratisation of South Africa in 1994 and
reached an all-time low of R13.26 to one US dollar in December 2001 (Afrol, 2002). The rand
subsequently recovered to R7.22 in August 2010 (News24, 2010). There are various reasons
for the currency’s fall, which include high petroleum prices, inflation, political unrest and
fewer than expected tourists visiting the country (South Africa Travel Net, 2009). This directly
impacts the sales and profitability margins of wineries in South Africa, especially wineries
with large export percentages.
- Unemployment rate
South Africa has a high unemployment rate with nearly 24% of the working population
unemployed during the first six months of 2010 (Indexmundi, 2010). This has a direct impact
on the level of disposable income available on the domestic market, which in turn affects the
profit margins of wineries.
27
(iii) Socio-cultural environment of the South African wine industry
The third element in the macro-environment is called the socio-cultural environment. The
socio-cultural environment is defined as “all the elements within the social and cultural
environment that includes demographical changes and social trends which influences the
organisation and its decisions” (Du Toit, Erasmus & Strydom, 2008:108). There are several
socio-cultural trends that the South African wine industry should take note of, the most
important of which include the shift towards healthier food products, the increasing
significance of fair trade and ethically sourced products and the growing concern for the
environment, that is, carbon footprints and food miles (Thach & Matz, 2004:10).
- A healthier lifestyle
Across the world people are moving towards a healthier lifestyle and making better, healthier
food choices. People are starting to prefer organic products5 over chemically engineered and
genetically modified foods. These trends affect the wine industry as health conscious
consumers are starting to look out for wines that are organically made, meaning that no
pesticides were used on the grapes and no chemicals were added to the fermented juice.
South Africa is one of the leading organic wine-producing countries in the world (Howe,
2008).
- Environmental consciousness
Another socio-cultural trend that wineries should keep in mind for the future is consumers’
concern for the environment and companies’ carbon footprint. Consumers want to buy
products that are environmentally friendly6, have low food miles7 and do not leave “heavy”
carbon footprints8. In other words, consumers want products that do not use pesticides and
chemicals that could harm the environment and products that are produced and transported
5 Organic wines – wine that is made from grapes that have been grown without the use of chemical fertilisers, pesticides, fungicides and herbicides. The wine is produced using methods that work in harmony with, and not against, nature. The aim is to eradicate the use of harmful chemicals by making effective use of nature's natural resources. All organic products are also free of genetically modified organisms (organisms that have had their basic gene structure modified by the addition of external organism genes) (Go-organic, n.d.). 6 Environmentally friendly – (also eco-friendly or nature friendly) refers to goods and services considered to inflict minimal or no harm on the environment (Kipfer, 2005). 7 Food miles – a term which refers to the distance food is transported from the time of its production until it reaches the consumer. It is one dimension used in assessing the environmental impact of food (Deneen, n.d.). 8 Carbon footprint - The total amount of greenhouse gases produced to directly and indirectly support human activities, usually expressed in equivalent tons of carbon dioxide (CO2) (Time-for-change, n.d.).
28
using as little as possible of the world’s natural energy sources, emitting as little as possible
carbon dioxide gas into the environment.
In terms of the South African wine industry, its location on the globe dictates that most of its
export markets are long-haul destinations. However, it should be kept in mind that distance
travelled is not the only factor contributing to the carbon footprint and food miles of a product.
For example, wine that is transported from South Africa via ship to New York in the United
States of America (USA) accumulates less food miles than wine that is transported by truck
from California (USA) to New York (USA), even though there is a huge difference in the
distance travelled. South Africa is a world leader in producing both organic and
environmentally friendly wines and a forerunner in terms of sound environmental legislation
(Manuel, 2007).
South Africa is also the first country to bottle wine in a plastic polyethylene terephthalate
(PET) bottle which is fully recyclable and has a much lower carbon footprint than glass. The
PET bottles also weigh 50g instead of 400g which incurs huge savings in local and export
transport costs (Chance, 2010).
- Fairtrade
Fairtrade and ethically sourced products have become a topic of consumer concern (Rose,
2009). As consumers become increasingly aware of the trading practices of wineries,
especially in New World wine countries, the demand for fairtrade has dramatically increased
(Wine Intelligence, 2009).
Consumers are willing to pay more for a wine that has been certified as Fairtrade knowing
that workers are paid fair wages for their labour. With more than 22 Fairtrade certified
wineries, constituting more than 50% of the global Fairtrade certified wine grape producers,
South Africa has the largest number of Fairtrade certified wineries in the world (WOSA,
n.d.[a]; Lordan, 2010).
(iv) Technological environment of the South African wine industry
The fourth factor in the macro-environment is the technological environment. The
technological environment consists of those forces that affect technology used in a business
and which can create new products, new markets, and new marketing opportunities (All
Business, 2010). Some aspects of the technological environment that influence the wine
industry of South Africa include UV-treated wines, the move towards screw caps, social
media and internet marketing.
29
- Ultra violet light energy
The South African government has legalised the use of ultra violet (UV) light energy for liquid
purification developed by SurePure (SurePure, 2010). The SurePure ultraviolet light machine
is a new technological development that uses ultra violet rays to kill unwanted microbes and
yeasts in fermenting wine juice which reduces the amount of sulphites that need to be added
to wines (Miller, 2009). South Africa is on the forefront of this new technological development
with the first UV-treated wine released in 2009 from L'Ormarins wine estate in Franschhoek
(Evans, 2009) which underpins the South African wine industry’s claim of “organic” wines
(SurePure, 2010).
- Screw caps
There is a global move towards the use of screw caps instead of corks for closing wine
bottles (Robinson, 2004; Slinkard, n.d.). The use of screw caps in South Africa is still limited,
but increasingly more wineries are starting to switch to this new method. Although the
industry is hesitant to move to a new form of closing because of the consumer perception
that corks are used for expensive wine and screw caps for cheap wine (Stormhoek, 2008),
the increasing number of problems encountered with traditional corks is encouraging the
change to screw caps (Morrison, 2007). Also, by switching from natural cork to synthetic
corks or screw caps, it is possible to save as much as R1 per bottle on costs (Brian in
Thomas, 2010a).
- Social media and internet advertising
The use of social media, including Facebook, Twitter, Blogging, FourSquare, Twideo,
YouTube, Google Maps Latitude and Nice to Meet You, by leading social media wine
marketers such as Ratcliffe (in Von Ulmenstein, 2010), is revolutionising the way wine
products are marketed with the use of print marketing rapidly declining (Pendock, 2010).
Hobbs (in Von Ulmenstein, 2010) states that the short lead times in publishing reviews
compared to traditional media has given a whole new dimension to word-of-mouth
advertising. According to Marston (2010), viral media such as Twitter is a “non-negotiable”
for wineries since it is a free service and does not need to be accommodated in a marketing
budget.
- Research and development budgets
Wineries and wine industries across the world have varying research and development
budgets. South Africa’s research facilities and university resources compare well with those
of other new world wine countries such as Chile, Argentina and India (Manuel, 2007).
30
(v) Natural environment of the South African wine industry
The last aspect of the macro-environment is the natural environment. This environment is
defined as all the aspects within the natural environment such as weather patterns and
natural resources that influence the decision making ability of an organisation (Business
dictionary, 2010c). The South African wine industry is directly affected by many factors in its
natural environment, which includes its terroir, the effects of global warming, natural
disasters and vineyard viruses. These natural environmental impacts will be discussed as
they relate to the South African wine industry.
- Unique terroir
South Africa has a unique natural environment with terroir that is envied by wine producers
across the world. The many different soils and micro-climates ensure that South Africa is
able to produce a host of unique wines. In addition to the many different terroirs available to
South African wine grape growers, there is no regulatory framework that prescribes which
varieties may be planted where, such as is the case in Old World wine countries. South
African wine farmers may plant any variety of grapes, wherever they want to (Howe, 2008).
- Global warming
South Africa’s position on the globe is more favourable than most countries with regard to
global warming. On average, a 2°C increase in temperature over the growing season is
expected for quality wine regions, the lowest increase being in South Africa at 0.88°C
(Emmas, 2010). However, wine farmers have been cautioned to be prepared for changes in
water supply due to global warming (Dodd in Hall, 2009).
- Natural disasters
Natural disasters like droughts, floods, fires and earthquakes all affect the wine industry.
Examples of this include the bush fires in Australia, which destroyed many vineyards during
2009 (Max, 2009) and the ash clouds that descended on European vineyards after the
eruption of Eyjafjallajökull volcano in Iceland in 2010 (New York Times, 2010). In South
Africa, drought and fire are the most common threats to vineyards (Gibb, 2009), but the most
serious threat is vineyard viruses (Hall, 2009).
31
2.2.3.2 The micro-environment of the South African wine industry
The micro-environment of a winery can be defined as all the factors or elements in the
winery’s immediate area of operations that affect its performance and decision making
freedom, and which the business has some control over (Nieuwenhuizen, 2007; Business
dictionary, n.d.[b]). These factors or elements include the winery’s competitors, suppliers,
customers and intermediaries (Kotler & Armstrong, 2006:65). Each of the four elements in
the South African wine industry’s micro-environment will now be discussed.
(i) Wine industry competitors in the South African wine industry
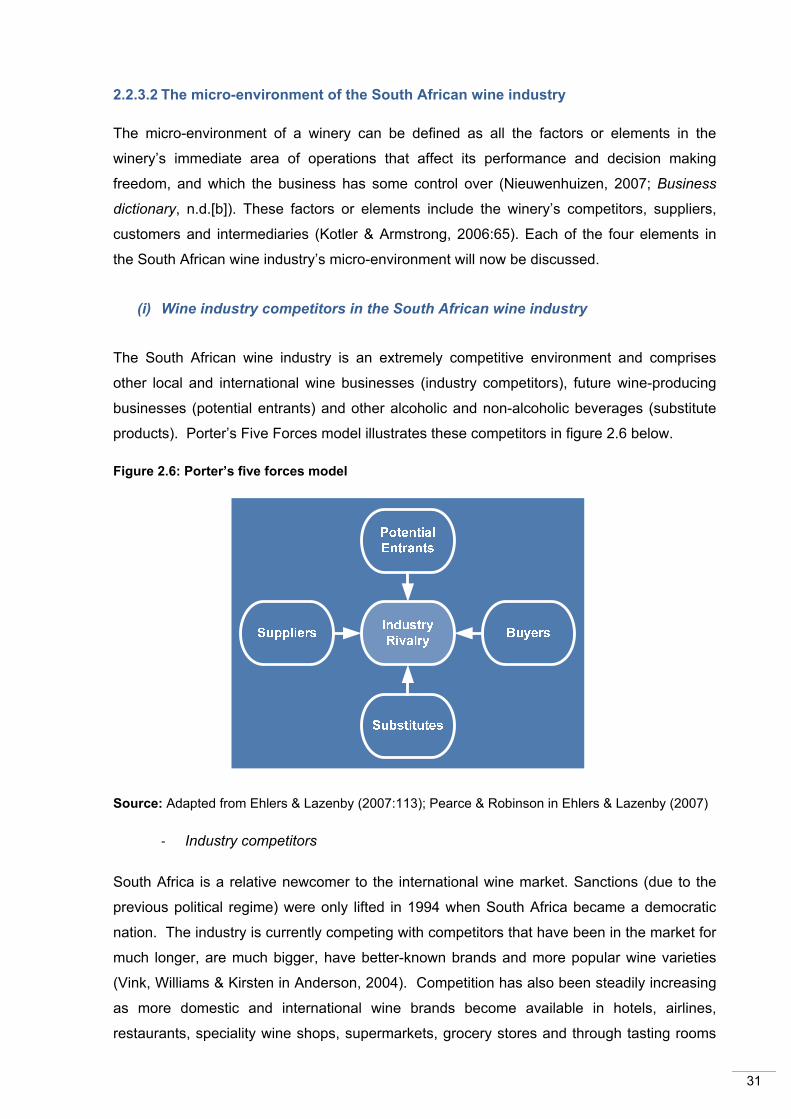
The South African wine industry is an extremely competitive environment and comprises
other local and international wine businesses (industry competitors), future wine-producing
businesses (potential entrants) and other alcoholic and non-alcoholic beverages (substitute
products). Porter’s Five Forces model illustrates these competitors in figure 2.6 below.
Figure 2.6: Porter’s five forces model
Source: Adapted from Ehlers & Lazenby (2007:113); Pearce & Robinson in Ehlers & Lazenby (2007)
- Industry competitors
South Africa is a relative newcomer to the international wine market. Sanctions (due to the
previous political regime) were only lifted in 1994 when South Africa became a democratic
nation. The industry is currently competing with competitors that have been in the market for
much longer, are much bigger, have better-known brands and more popular wine varieties
(Vink, Williams & Kirsten in Anderson, 2004). Competition has also been steadily increasing
as more domestic and international wine brands become available in hotels, airlines,
restaurants, speciality wine shops, supermarkets, grocery stores and through tasting rooms

32
and the internet, while the cost of switching brands for trade intermediaries and consumers
remains low (Thach & Matz, 2004). On the domestic front, competition is even more intense
than internationally with 3 999 primary wine producers and 560 wine cellars that crush
grapes (SAWIS, 2009a:6), all competing for a share of the South African wine market.
- Potential competitors
Wine production is becoming a global phenomenon (Scherotter, 2010). Competition in the
already highly competitive wine market is intensified by the numerous new vineyards that are
being planted across the world. For example, since the 1990s, over 100 major vineyards
have opened in China (Evans, 2010). Bulgaria, traditionally classified as an “Old World”
country, has also started expanding its vineyards, adding 7 000 hectares and producing
170 million litres of wine (in 2007) (SeeNews, 2008; United Bulgarian Bank, 2008; Velianova,
2008). South Africa should be aware of not only its current competitors, such as Australia
and New Zealand, but also new competitors entering the wine market.
- Substitute products
Numerous substitute products compete with wine; direct substitutes include alcoholic
beverages such as beers and spirits while non-alcoholic beverages include sparkling drinks,
water, juices, teas and coffees (Thach & Matz, 2004:15-17). Table 2.3 below shows the
percentage share of the alcoholic beverage market in South Africa for the years 1998 to
2008. From this table it can be seen that the market share of wine has decreased for six
consecutive years while the market share for fortified and sparkling wines has remained
relatively stable.
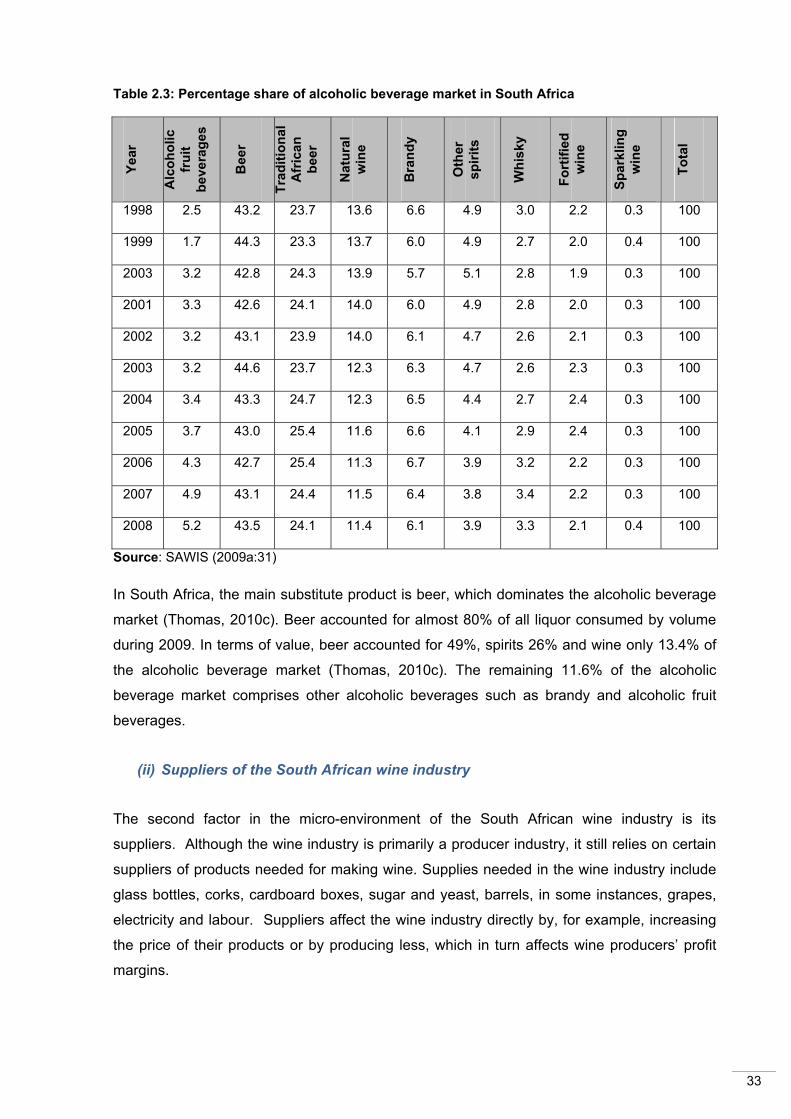
33
Table 2.3: Percentage share of alcoholic beverage market in South Africa
Source: SAWIS (2009a:31)
In South Africa, the main substitute product is beer, which dominates the alcoholic beverage
market (Thomas, 2010c). Beer accounted for almost 80% of all liquor consumed by volume
during 2009. In terms of value, beer accounted for 49%, spirits 26% and wine only 13.4% of
the alcoholic beverage market (Thomas, 2010c). The remaining 11.6% of the alcoholic
beverage market comprises other alcoholic beverages such as brandy and alcoholic fruit
beverages.
(ii) Suppliers of the South African wine industry
The second factor in the micro-environment of the South African wine industry is its
suppliers. Although the wine industry is primarily a producer industry, it still relies on certain
suppliers of products needed for making wine. Supplies needed in the wine industry include
glass bottles, corks, cardboard boxes, sugar and yeast, barrels, in some instances, grapes,
electricity and labour. Suppliers affect the wine industry directly by, for example, increasing
the price of their products or by producing less, which in turn affects wine producers’ profit
margins.
Year
Alc
ohol
ic
frui
t be
vera
ges
Bee
r
Trad
ition
al
Afr
ican
be
er
Nat
ural
w
ine
Bra
ndy
Oth
er
spiri
ts
Whi
sky
Fort
ified
w
ine
Spar
klin
g w
ine
Tota
l
1998 2.5 43.2 23.7 13.6 6.6 4.9 3.0 2.2 0.3 100
1999 1.7 44.3 23.3 13.7 6.0 4.9 2.7 2.0 0.4 100
2003 3.2 42.8 24.3 13.9 5.7 5.1 2.8 1.9 0.3 100
2001 3.3 42.6 24.1 14.0 6.0 4.9 2.8 2.0 0.3 100
2002 3.2 43.1 23.9 14.0 6.1 4.7 2.6 2.1 0.3 100
2003 3.2 44.6 23.7 12.3 6.3 4.7 2.6 2.3 0.3 100
2004 3.4 43.3 24.7 12.3 6.5 4.4 2.7 2.4 0.3 100
2005 3.7 43.0 25.4 11.6 6.6 4.1 2.9 2.4 0.3 100
2006 4.3 42.7 25.4 11.3 6.7 3.9 3.2 2.2 0.3 100
2007 4.9 43.1 24.4 11.5 6.4 3.8 3.4 2.2 0.3 100
2008 5.2 43.5 24.1 11.4 6.1 3.9 3.3 2.1 0.4 100
34
For example, oak wine casks, which are used to mature red wine, are imported from France.
Each cask costs about R7 000 and is used no more than three times. The cost of the casks
represents around R10 per bottle of wine (Brain in Thomas, 2010a). Any increase in the price
of these casks directly impacts the profit margin of the wine aged in them.
The supply of electricity will be the South African wine industry’s primary concern in years to
come as the price of electricity is set to increase by as much as 300% between 2009 and
2012 (Human Sciences Research Council, 2008; Thomas, 2010a). Electricity costs
significantly increase the cost of production and therefore the profit margins of wine.
(iii) Consumers in the South African wine industry
The third aspect in the micro-environment of the South African wine industry is the
consumer. Two factors that the South African wine industry should take note of regarding
consumers are their current consumption patterns and the emerging black middle class.
- Current consumption patterns of South African wine consumers
South Africa wine producers sell 52% of their wines locally and 48% of their wines
internationally (SAWIS, 2009a). This means that the South African wine industry is extremely
dependent on local consumers. However, only 11% of South African adults are regular wine
consumers (SA Advertising Research Foundation in Thomas, 2010c).
According to SA Wine Industry Information and Systems, France consumed the most wine
per inhabitant at 54 litres per annum, with other top 20 consuming countries averaging 31
litres per inhabitant. However, South African consumers bought only 297 million litres of wine
during 2009, averaging to 6.3 litres per inhabitant, placing South Africa 32nd in the world
(Thomas, 2010). Research by the SA Advertising Research Foundation found that wine
consumption fell by just above 2% annually between 2000 and 2009 (Thomas, 2010c).
According to Thomas (2010c), there are a number of reasons for wine’s declining popularity.
The two most important reasons are as follows:
(i) SABMiller’s strategy of keeping beer price increases below the inflation rate. South
Africans are mainly beer consumers and will not easily substitute beer for wine if it is
marginally more expensive (SAARF, 2007; Foxcroft, 2009).
(ii) The number of young whites that emigrated between 2000 and 2009. Pendock, (in
Thomas, 2010c) states that the massive emigration numbers have reduced South
Africa’s core premium-price wine-buying market.
35
- The emerging black middle class
Research conducted by the UCT Unilever Institute of Strategic Marketing (2007) shows that
2.6 million South Africans (7% of the black population) fall within the category of black,
middle class, salaried, well-educated people, otherwise known as Black Diamonds. Foxcroft
(2009) identifies the following three main reasons why the black middle class is attractive to
the wine industry:
• The segment is growing rapidly.
• There is an increasing interest in wine.
• Rising affluence in this segment means buying power that increasingly
accommodates luxuries.
Research conducted by Du Toit (in Foxcroft, 2009) in Soweto indicates that consumers in the
township are most receptive to wine, with tavern owners reporting a keen demand for wines
priced from R25 to R40 per bottle.
(iv) Intermediaries in the South African wine industry
The last aspect of the micro-environment of the South African wine industry is its
intermediaries. The wine industry has several intermediaries in addition to its own direct
sales to wine consumers. Intermediaries include wholesalers, retailers, restaurants, speciality
wine shops and wine agents (for wine exports). There are thus many different types and
combinations of distribution channels for wine. The most common channels are illustrated in
figure 2.7.
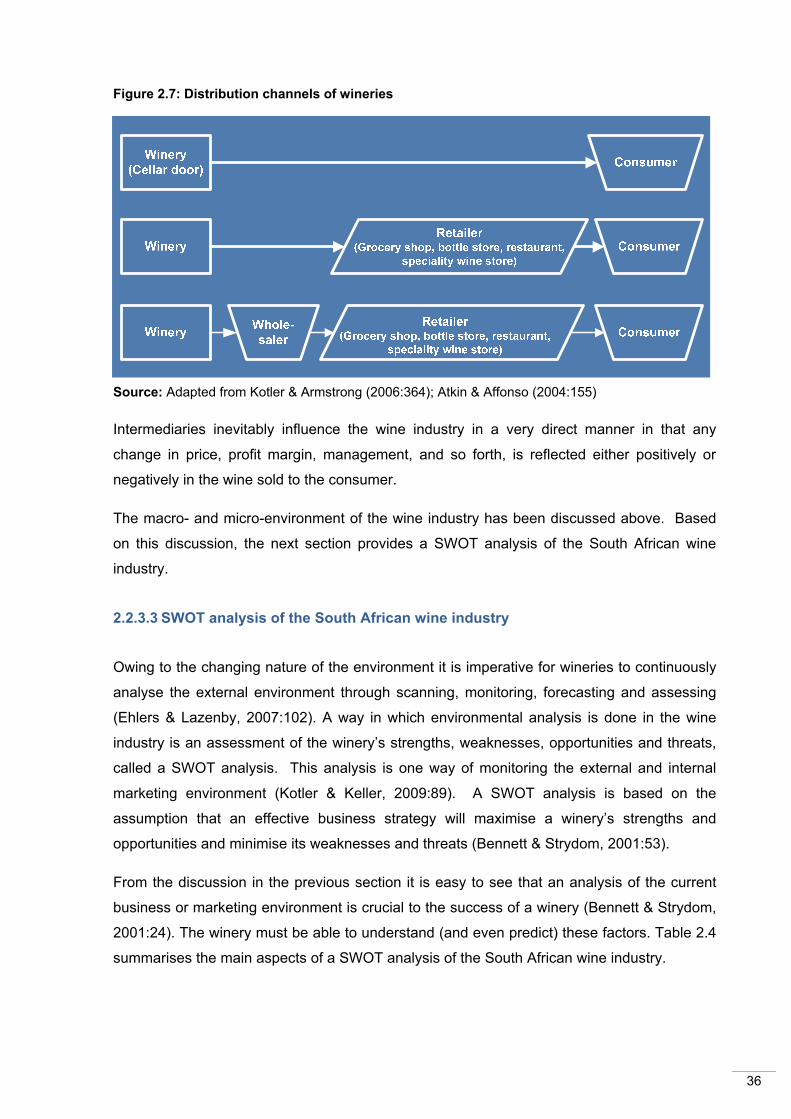
36
Figure 2.7: Distribution channels of wineries
Source: Adapted from Kotler & Armstrong (2006:364); Atkin & Affonso (2004:155)
Intermediaries inevitably influence the wine industry in a very direct manner in that any
change in price, profit margin, management, and so forth, is reflected either positively or
negatively in the wine sold to the consumer.
The macro- and micro-environment of the wine industry has been discussed above. Based
on this discussion, the next section provides a SWOT analysis of the South African wine
industry.
2.2.3.3 SWOT analysis of the South African wine industry
Owing to the changing nature of the environment it is imperative for wineries to continuously
analyse the external environment through scanning, monitoring, forecasting and assessing
(Ehlers & Lazenby, 2007:102). A way in which environmental analysis is done in the wine
industry is an assessment of the winery’s strengths, weaknesses, opportunities and threats,
called a SWOT analysis. This analysis is one way of monitoring the external and internal
marketing environment (Kotler & Keller, 2009:89). A SWOT analysis is based on the
assumption that an effective business strategy will maximise a winery’s strengths and
opportunities and minimise its weaknesses and threats (Bennett & Strydom, 2001:53).
From the discussion in the previous section it is easy to see that an analysis of the current
business or marketing environment is crucial to the success of a winery (Bennett & Strydom,
2001:24). The winery must be able to understand (and even predict) these factors. Table 2.4
summarises the main aspects of a SWOT analysis of the South African wine industry.
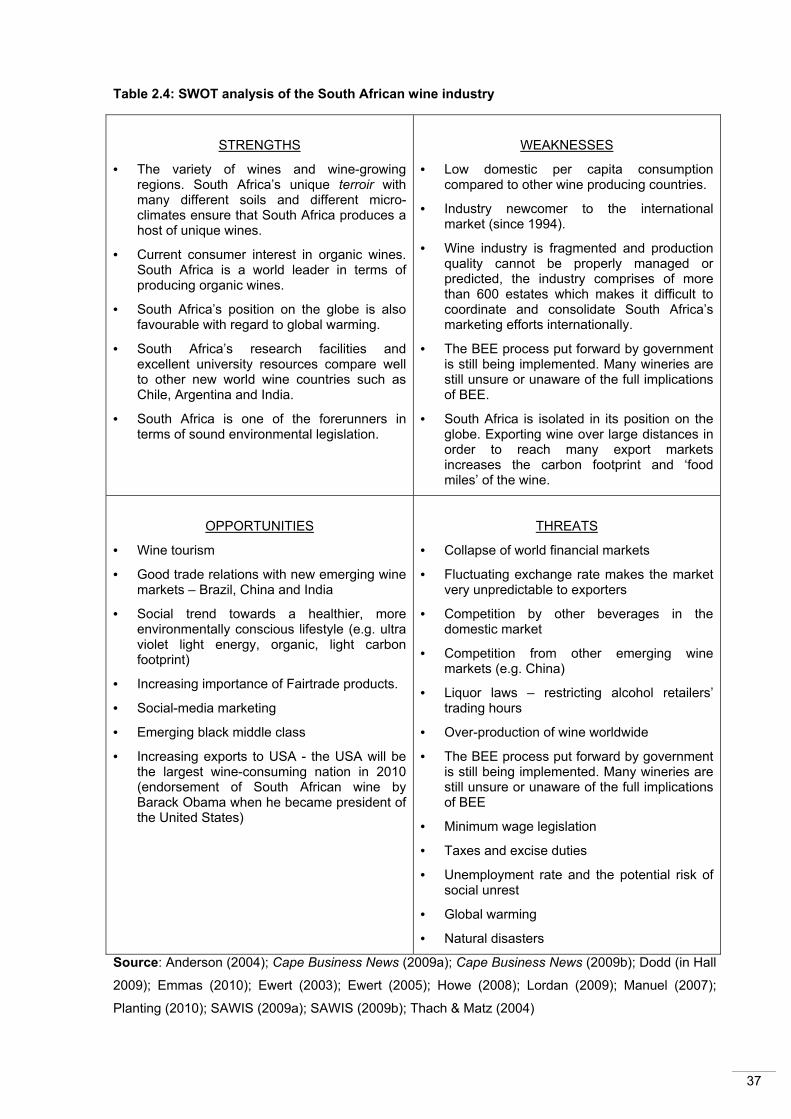
37
Table 2.4: SWOT analysis of the South African wine industry
STRENGTHS
• The variety of wines and wine-growing regions. South Africa’s unique terroir with many different soils and different micro-climates ensure that South Africa produces a host of unique wines.
• Current consumer interest in organic wines. South Africa is a world leader in terms of producing organic wines.
• South Africa’s position on the globe is also favourable with regard to global warming.
• South Africa’s research facilities and excellent university resources compare well to other new world wine countries such as Chile, Argentina and India.
• South Africa is one of the forerunners in terms of sound environmental legislation.
WEAKNESSES
• Low domestic per capita consumption compared to other wine producing countries.
• Industry newcomer to the international market (since 1994).
• Wine industry is fragmented and production quality cannot be properly managed or predicted, the industry comprises of more than 600 estates which makes it difficult to coordinate and consolidate South Africa’s marketing efforts internationally.
• The BEE process put forward by government is still being implemented. Many wineries are still unsure or unaware of the full implications of BEE.
• South Africa is isolated in its position on the globe. Exporting wine over large distances in order to reach many export markets increases the carbon footprint and ‘food miles’ of the wine.
OPPORTUNITIES
• Wine tourism
• Good trade relations with new emerging wine markets – Brazil, China and India
• Social trend towards a healthier, more environmentally conscious lifestyle (e.g. ultra violet light energy, organic, light carbon footprint)
• Increasing importance of Fairtrade products.
• Social-media marketing
• Emerging black middle class
• Increasing exports to USA - the USA will be the largest wine-consuming nation in 2010 (endorsement of South African wine by Barack Obama when he became president of the United States)
THREATS
• Collapse of world financial markets
• Fluctuating exchange rate makes the market very unpredictable to exporters
• Competition by other beverages in the domestic market
• Competition from other emerging wine markets (e.g. China)
• Liquor laws – restricting alcohol retailers’ trading hours
• Over-production of wine worldwide
• The BEE process put forward by government is still being implemented. Many wineries are still unsure or unaware of the full implications of BEE
• Minimum wage legislation
• Taxes and excise duties
• Unemployment rate and the potential risk of social unrest
• Global warming
• Natural disasters
Source: Anderson (2004); Cape Business News (2009a); Cape Business News (2009b); Dodd (in Hall
2009); Emmas (2010); Ewert (2003); Ewert (2005); Howe (2008); Lordan (2009); Manuel (2007);
Planting (2010); SAWIS (2009a); SAWIS (2009b); Thach & Matz (2004)
38
From table 2.4 it is clear that the South African wine industry faces many obstacles and
challenges, but that it also has many strengths and opportunities that count in its favour. As
discussed in chapter 1, this study focuses on the role of wine tourism in marketing wine, and
creating opportunities and possible benefits for wineries. The next section therefore gives a
theoretical overview of wine tourism.
2.3 THE SOUTH AFRICAN WINE TOURISM INDUSTRY
This section focuses on the wine tourism industry and starts with an overview of the
development of wine tourism in South Africa. Thereafter, wine tourism is placed into context
within the wider tourism industry and follows with an explanation of the wine tourism system.
This is followed by a brief description of the wine tourism product and its characteristics.
Finally, the profile of South African wine tourists is discussed.
2.3.1 DEVELOPMENT OF THE SOUTH AFRICAN WINE TOURISM INDUSTRY
The first official visits to vineyards were part of organised travel since the time of the Grand
Tour, and likely even since the times of ancient Greece and Rome (Willey, 2006; Hall et al.,
2000:2). However, wine only became a specific travel interest during the mid-nineteenth
century (Hall, Johnson, Cambourne, Macionis, Mitchell, & Sharples, 2000 in Hall, et al.,
2000). The reason for this is threefold. First, the transport revolution took place. The
transport revolution was created by the development of the railways, which promoted greater
accessibility to destinations that had previously been out of reach for most people (Bagwell,
1999). Second, the social revolution took place. A social revolution occurred in terms of the
growth of a new middle class that began to seek quality wine along with the aristocracy
(Bagwell, 1999). Finally, The 1855 Classification of the Wine of the Gironde was published.
This publication officially gave wine and wine-growing regions a destination identity
(Matthews, n.d.).
Wine trails have been part of the German tourism industry since the 1920s (Hall et al. in Hall
et al., 2000). The oldest wine route in the world, the Deutsche Weinstrasse, opened on 19
October 1935 (German Wine Route, n.d.). Today, the Old World or Europe (which includes
countries such as Spain, Italy, France and Germany) (Wine Geeks, n.d.) has a large number
of wine trails that are organised by various profit and non-profit organisations, for example,
Route des Vins d’Alsace in France (Vins d’Alsace, n.d.) and the Ribeiro Wine Route
Association in Spain, (Ruta do viňo do Ribeiro, 2010).
39
In the New World, wine tourism has also become more significant in the last two decades
(1990–2010). California’s Napa Valley is a major draw card for tourists who spend more
than $1 billion annually (Napa Valley Destination Council, 2008). Other countries like
Australia, New Zealand and Chile have also been quick to recognise the importance of the
wine tourism market with well-thought-out offers such as exquisite restaurants, modern and
romantic wine cellars, cable cars to spectacular viewpoints and luxury country hotels (South
Australia Tourism, 2004-2008; Hall & Mitchell, 2002; Hall et al., 2000; TrekkingChile, 2005;
Tripadvisor, 2008).
South Africa’s first wine route was established in 1973 in Stellenbosch (Avenue Vine, 2006).
The initial idea of establishing a wine route was conceived by Frans Malan of the Simonsig
Estate during a tour of the Route de Vins at Morey St Denis in Burgundy (Preston-Whyte in
Hall et al., 2000). Malan, together with Neil Joubert of the Spier Estate and Spatz Sperling of
Delheim Estate, fought for changes in the liquor law to facilitate the tasting of wines on
estates in order to establish a wine route (Avenue Vine, 2006; Preston-Whyte in Hall et al.,
2000). Their courage and foresight led to the birth of the wine tourism industry in South
Africa. The pioneer Stellenbosch Wine Route was officially launched by the then Minister of
Agriculture in April of 1973 (Stellenbosch Wine Route, 2008). The success of this venture,
coupled with the importance of projecting a marketing image, prompted the development of
other routes (Preston-Whyte in Hall et al., 2000). South Africa’s wine route system enjoys the
reputation of having one of the best wine route infrastructure systems and winescapes in the
world (Bruwer, 2003:425-426; Bruwer in Meyer, 2004).
There are 16 wine routes in the Western and Northern Cape, most within 100 km of
Cape Town (Wines of South Africa, n.d.[e]). These routes include Breedekloof, Constantia
Wine Route, Paarl Vintners, Tulbagh Wine Route and Wellington Wine Route (Wines of
South Africa, n.d.[e]). By far the most popular wine route in the Western Cape is the
Stellenbosch Wine Route, followed by the Paarl and Franschhoek Wine Routes (Frandsen,
2005:3).
Studies undertaken by Cape Metropolitan Tourism during the summer of 2008 and 2009
indicate that the visitation of the wine routes by international and domestic tourists was
ranked as the fourth most popular tourist attraction in South Africa (Boekstein, 2009). Wine
tourism contributed R4.3 billion towards the GDP of South Africa during 2008 (SAinfo,
2010a).
Now that the development of the wine tourism industry has been discussed, the next section
will focus on the place of wine tourism within the tourism industry as a whole. Important
concepts and terms regarding the wine tourism industry will be defined.
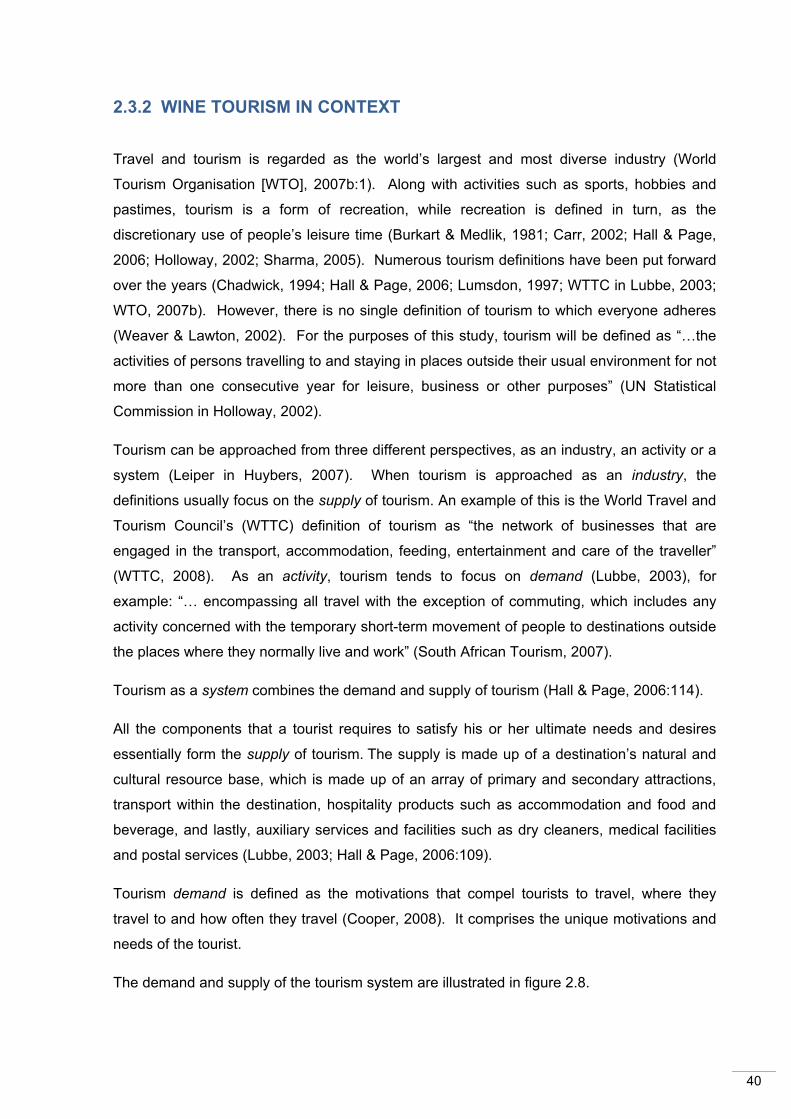
40
2.3.2 WINE TOURISM IN CONTEXT
Travel and tourism is regarded as the world’s largest and most diverse industry (World
Tourism Organisation [WTO], 2007b:1). Along with activities such as sports, hobbies and
pastimes, tourism is a form of recreation, while recreation is defined in turn, as the
discretionary use of people’s leisure time (Burkart & Medlik, 1981; Carr, 2002; Hall & Page,
2006; Holloway, 2002; Sharma, 2005). Numerous tourism definitions have been put forward
over the years (Chadwick, 1994; Hall & Page, 2006; Lumsdon, 1997; WTTC in Lubbe, 2003;
WTO, 2007b). However, there is no single definition of tourism to which everyone adheres
(Weaver & Lawton, 2002). For the purposes of this study, tourism will be defined as “…the
activities of persons travelling to and staying in places outside their usual environment for not
more than one consecutive year for leisure, business or other purposes” (UN Statistical
Commission in Holloway, 2002).
Tourism can be approached from three different perspectives, as an industry, an activity or a
system (Leiper in Huybers, 2007). When tourism is approached as an industry, the
definitions usually focus on the supply of tourism. An example of this is the World Travel and
Tourism Council’s (WTTC) definition of tourism as “the network of businesses that are
engaged in the transport, accommodation, feeding, entertainment and care of the traveller”
(WTTC, 2008). As an activity, tourism tends to focus on demand (Lubbe, 2003), for
example: “… encompassing all travel with the exception of commuting, which includes any
activity concerned with the temporary short-term movement of people to destinations outside
the places where they normally live and work” (South African Tourism, 2007).
Tourism as a system combines the demand and supply of tourism (Hall & Page, 2006:114).
All the components that a tourist requires to satisfy his or her ultimate needs and desires
essentially form the supply of tourism. The supply is made up of a destination’s natural and
cultural resource base, which is made up of an array of primary and secondary attractions,
transport within the destination, hospitality products such as accommodation and food and
beverage, and lastly, auxiliary services and facilities such as dry cleaners, medical facilities
and postal services (Lubbe, 2003; Hall & Page, 2006:109).
Tourism demand is defined as the motivations that compel tourists to travel, where they
travel to and how often they travel (Cooper, 2008). It comprises the unique motivations and
needs of the tourist.
The demand and supply of the tourism system are illustrated in figure 2.8.
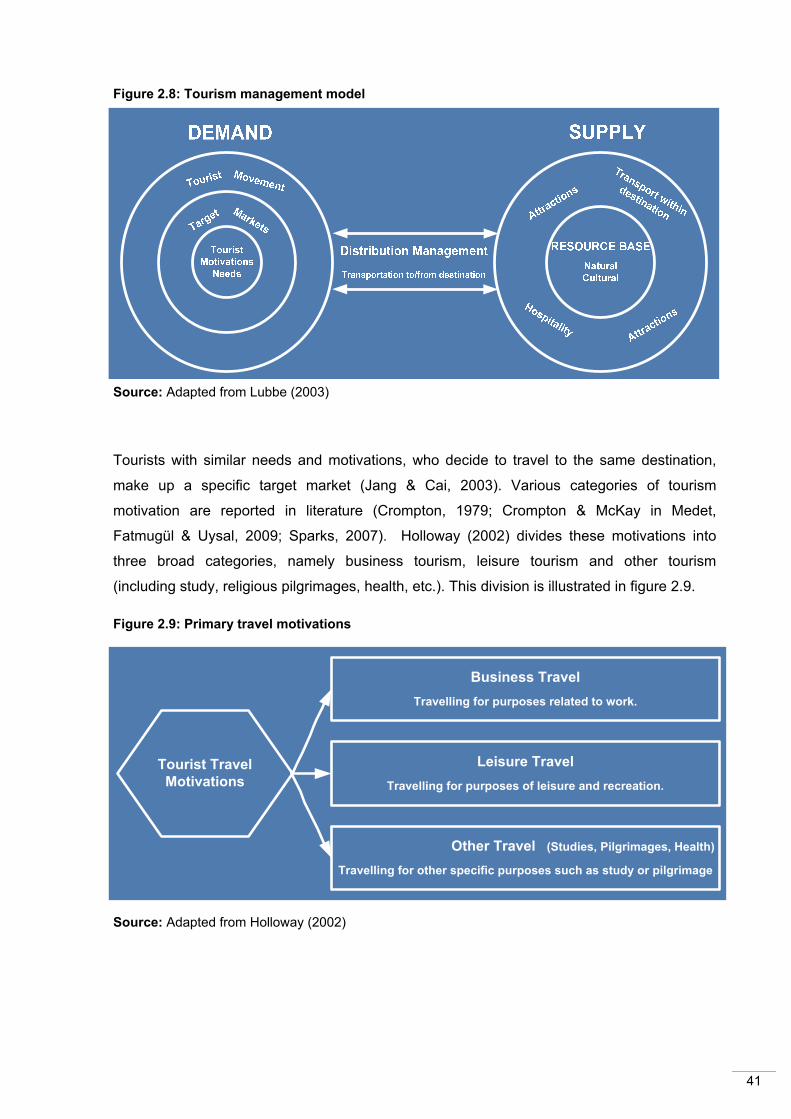
41
Figure 2.8: Tourism management model
Source: Adapted from Lubbe (2003)
Tourists with similar needs and motivations, who decide to travel to the same destination,
make up a specific target market (Jang & Cai, 2003). Various categories of tourism
motivation are reported in literature (Crompton, 1979; Crompton & McKay in Medet,
Fatmugül & Uysal, 2009; Sparks, 2007). Holloway (2002) divides these motivations into
three broad categories, namely business tourism, leisure tourism and other tourism
(including study, religious pilgrimages, health, etc.). This division is illustrated in figure 2.9.
Figure 2.9: Primary travel motivations
Source: Adapted from Holloway (2002)
Tourist Travel Motivations
Business TravelTravelling for purposes related to work.
Leisure TravelTravelling for purposes of leisure and recreation.
Other Travel (Studies, Pilgrimages, Health)
Travelling for other specific purposes such as study or pilgrimage
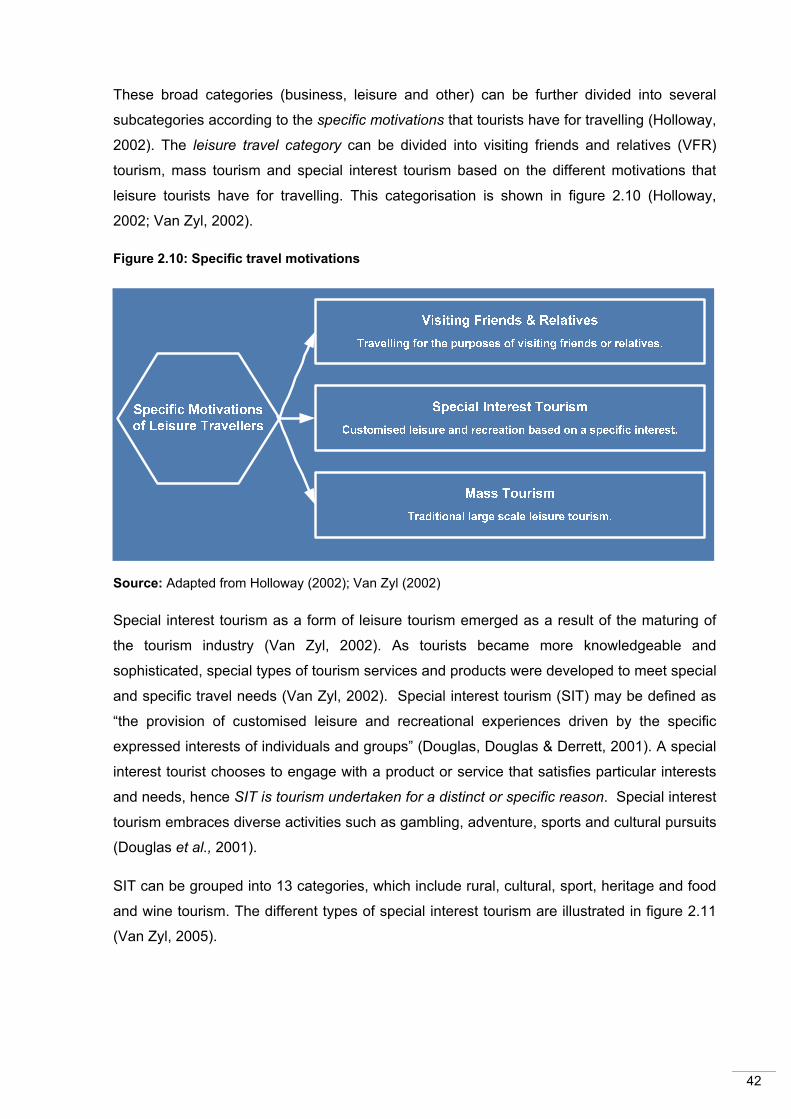
42
These broad categories (business, leisure and other) can be further divided into several
subcategories according to the specific motivations that tourists have for travelling (Holloway,
2002). The leisure travel category can be divided into visiting friends and relatives (VFR)
tourism, mass tourism and special interest tourism based on the different motivations that
leisure tourists have for travelling. This categorisation is shown in figure 2.10 (Holloway,
2002; Van Zyl, 2002).
Figure 2.10: Specific travel motivations
Source: Adapted from Holloway (2002); Van Zyl (2002)
Special interest tourism as a form of leisure tourism emerged as a result of the maturing of
the tourism industry (Van Zyl, 2002). As tourists became more knowledgeable and
sophisticated, special types of tourism services and products were developed to meet special
and specific travel needs (Van Zyl, 2002). Special interest tourism (SIT) may be defined as
“the provision of customised leisure and recreational experiences driven by the specific
expressed interests of individuals and groups” (Douglas, Douglas & Derrett, 2001). A special
interest tourist chooses to engage with a product or service that satisfies particular interests
and needs, hence SIT is tourism undertaken for a distinct or specific reason. Special interest
tourism embraces diverse activities such as gambling, adventure, sports and cultural pursuits
(Douglas et al., 2001).
SIT can be grouped into 13 categories, which include rural, cultural, sport, heritage and food
and wine tourism. The different types of special interest tourism are illustrated in figure 2.11
(Van Zyl, 2005).
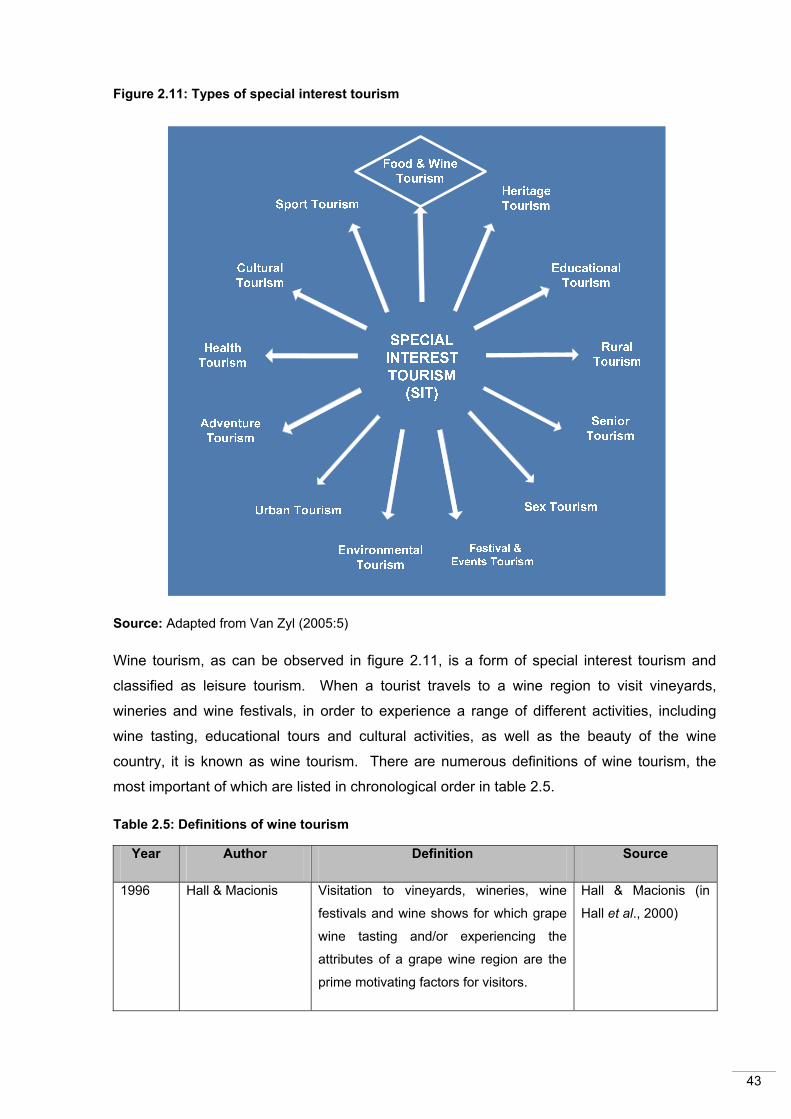
43
Figure 2.11: Types of special interest tourism
Source: Adapted from Van Zyl (2005:5)
Wine tourism, as can be observed in figure 2.11, is a form of special interest tourism and
classified as leisure tourism. When a tourist travels to a wine region to visit vineyards,
wineries and wine festivals, in order to experience a range of different activities, including
wine tasting, educational tours and cultural activities, as well as the beauty of the wine
country, it is known as wine tourism. There are numerous definitions of wine tourism, the
most important of which are listed in chronological order in table 2.5.
Table 2.5: Definitions of wine tourism
Year Author Definition Source
1996 Hall & Macionis Visitation to vineyards, wineries, wine
festivals and wine shows for which grape
wine tasting and/or experiencing the
attributes of a grape wine region are the
prime motivating factors for visitors.
Hall & Macionis (in
Hall et al., 2000)
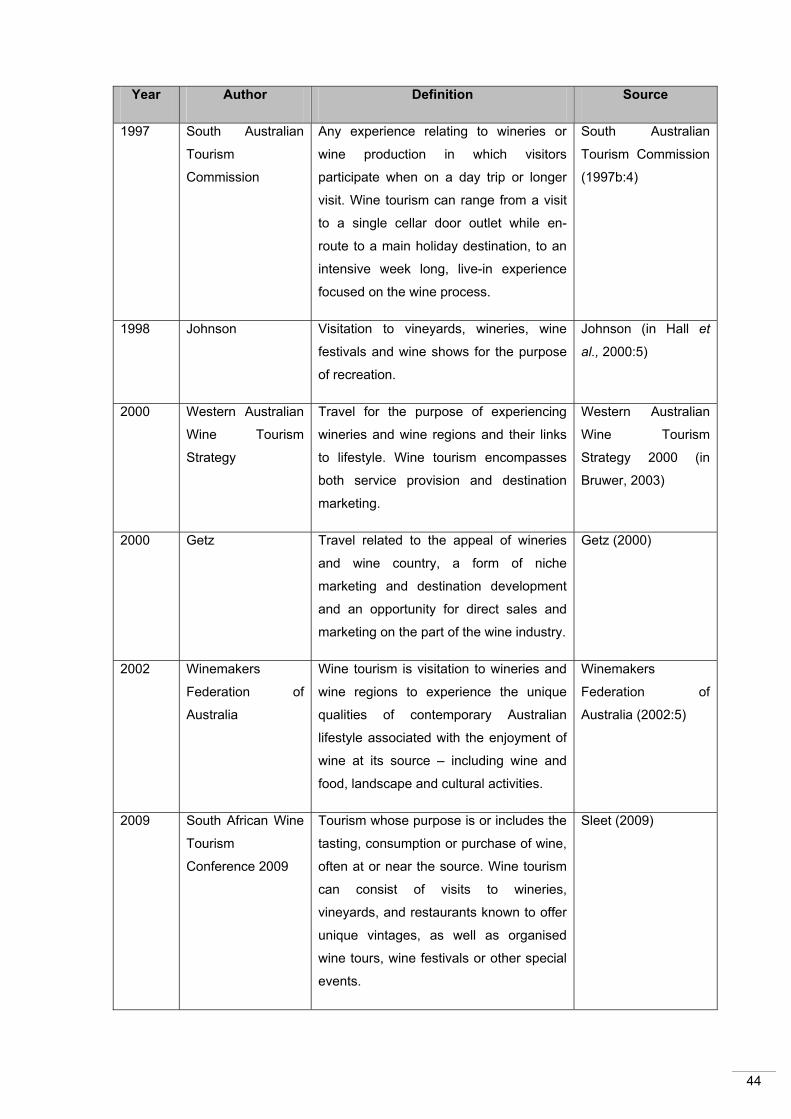
44
Year Author Definition Source
1997 South Australian
Tourism
Commission
Any experience relating to wineries or
wine production in which visitors
participate when on a day trip or longer
visit. Wine tourism can range from a visit
to a single cellar door outlet while en-
route to a main holiday destination, to an
intensive week long, live-in experience
focused on the wine process.
South Australian
Tourism Commission
(1997b:4)
1998 Johnson Visitation to vineyards, wineries, wine
festivals and wine shows for the purpose
of recreation.
Johnson (in Hall et
al., 2000:5)
2000 Western Australian
Wine Tourism
Strategy
Travel for the purpose of experiencing
wineries and wine regions and their links
to lifestyle. Wine tourism encompasses
both service provision and destination
marketing.
Western Australian
Wine Tourism
Strategy 2000 (in
Bruwer, 2003)
2000 Getz Travel related to the appeal of wineries
and wine country, a form of niche
marketing and destination development
and an opportunity for direct sales and
marketing on the part of the wine industry.
Getz (2000)
2002 Winemakers
Federation of
Australia
Wine tourism is visitation to wineries and
wine regions to experience the unique
qualities of contemporary Australian
lifestyle associated with the enjoyment of
wine at its source – including wine and
food, landscape and cultural activities.
Winemakers
Federation of
Australia (2002:5)
2009 South African Wine
Tourism
Conference 2009
Tourism whose purpose is or includes the
tasting, consumption or purchase of wine,
often at or near the source. Wine tourism
can consist of visits to wineries,
vineyards, and restaurants known to offer
unique vintages, as well as organised
wine tours, wine festivals or other special
events.
Sleet (2009)

45
From the definitions listed in table 2.5 it is evident that there are at least three major
perspectives from which wine tourism can be approached, namely the consumer, the wine
producer and the tourism agent (Getz, 2000).
In this study, the following definition of wine tourism will be used as defined by Getz (2000):
“Wine tourism is travel related to the appeal of wineries and wine country, a form of niche
marketing and destination development and an opportunity for direct sales and marketing on
the part of the wine industry.”
According to Getz (2000), wine tourism is simultaneously:
• a form of consumer behaviour;
• a strategy by which destinations develop and market wine-related attractions and
imagery; and
• a marketing opportunity for wineries to educate, and to sell their products directly to
consumers.
This definition is deemed as the most relevant to this specific study and its aim, since the
study will be approached from the perspective of the wine producer by researching the role
of wine tourism as an opportunity for direct sales and marketing for wineries.
By looking at the definition of wine tourism postulated by Getz (2000, it is clear that wine
tourism is a multifaceted concept. In an attempt to explain the complex nature of wine
tourism, Hall et al. (2000) propose a framework known as the Wine Tourism System. This
system is discussed in the next section.
2.3.3 WINE TOURISM SYSTEM
The Wine Tourism System is a framework proposed by Hall et al. (2000) which attempts to
explain the complex nature of wine tourism in a simple diagram, illustrated in figure 2.12. The
model integrates the consumer demand for wine tourism and the industry supply of the wine
tourism product to produce the wine tourism experience. The focal point of the model is the
wine tourism experience, that is, the experience that the consumer or wine tourist has while
he or she comes into contact with the elements that comprise the wine tourism product such
as wineries, vineyards, festivals, winescapes, and wine.
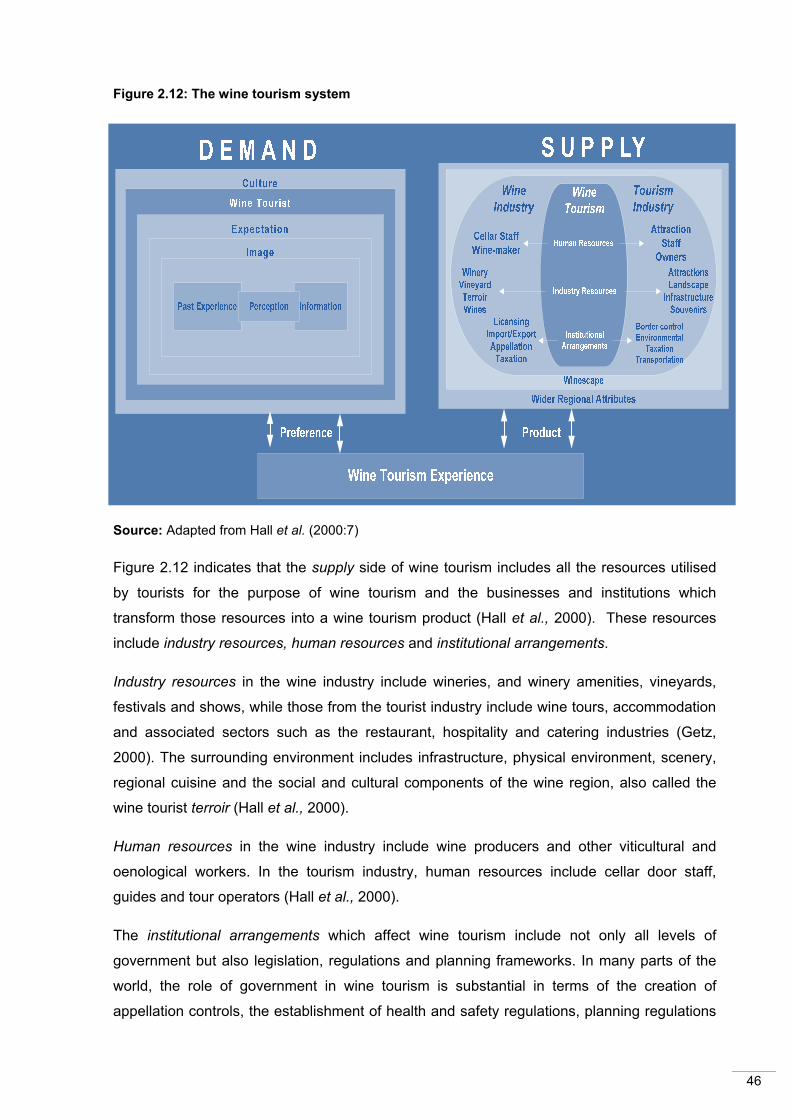
46
Figure 2.12: The wine tourism system
Source: Adapted from Hall et al. (2000:7)
Figure 2.12 indicates that the supply side of wine tourism includes all the resources utilised
by tourists for the purpose of wine tourism and the businesses and institutions which
transform those resources into a wine tourism product (Hall et al., 2000). These resources
include industry resources, human resources and institutional arrangements.
Industry resources in the wine industry include wineries, and winery amenities, vineyards,
festivals and shows, while those from the tourist industry include wine tours, accommodation
and associated sectors such as the restaurant, hospitality and catering industries (Getz,
2000). The surrounding environment includes infrastructure, physical environment, scenery,
regional cuisine and the social and cultural components of the wine region, also called the
wine tourist terroir (Hall et al., 2000).
Human resources in the wine industry include wine producers and other viticultural and
oenological workers. In the tourism industry, human resources include cellar door staff,
guides and tour operators (Hall et al., 2000).
The institutional arrangements which affect wine tourism include not only all levels of
government but also legislation, regulations and planning frameworks. In many parts of the
world, the role of government in wine tourism is substantial in terms of the creation of
appellation controls, the establishment of health and safety regulations, planning regulations
47
which affect what can be built and/or grown in certain locations, and the assistance which
government may provide to support wine tourism infrastructure and networks (Hall et al.,
2000).
Figure 2.12 shows that demand comprises the perceptions, motivations and expectations of
the wine tourist.9 The World Tourism Organisation (WTO) defines tourists as people who
“travel to and stay in places outside their usual environment for not more than one
consecutive year for leisure, business and other purposes not related to the exercise of an
activity remunerated from within the place visited” (WTO, 2007b). However, this definition is
extremely broad and does not give an adequate description of the wine tourist. In 1998,
Johnson (in Hall et al., 2000:15) put forward a definition of wine tourists as “visitors to
vineyards, wineries, wine festivals and wine shows for the purpose of recreation”. This
definition is based on the generally accepted definition of wine tourism formulated by Hall
and Macionis (in Hall et al., 2000).
The expectation and image of a certain wine region or winery that a tourist has is comprised
of three different elements, these being, past experiences, preferences and information. The
choice of destinations and visits to attractions will be affected by previous experiences and
their relative enjoyment. For example, if a visitor to a winery has had a poor experience
because of poor service, then not only may he not return to that winery, he may also not
purchase that winery’s wine at other locations (Charters & O’Neill, 2001; O’Neill, Palmer &
Charters, 2002).
Preferences refer to individual priorities, often reflecting the individual’s personality, in the
search for the satisfaction of particular desires or needs (Murphy in Hall et al., 2000).
Information on the various wineries and their attractions comes from a variety of sources,
some of the most obvious being the food, wine and travel pages in newspapers and
magazines, visitor information centres and travel brochures. However, information can also
come from various sources such as novels, guidebooks, the internet and friends, family and
work associates.
Finally, the demand that a tourist has for wine tourism is influenced by culture and social
groups (Pizam & Mansfeld, 1999; Seddighi, Nuttall & Theocharous, 2001; Terrien &
Steichen, 2008:269). For example, research by Terrien and Steichen (2008:269) has shown
9 It is important to note that in recent years, the same-day visitor or excursionist (low involved tourism) has been included in tourism statistics (Van Zyl, 2005). Furthermore, visitors to wineries may also include people from the host community who frequent the winery as a retail outlet for wine and do not consume any tourism-related products. However, for the purposes of this study, the terms wine tourist and visitor will be used interchangeably and are defined as: “People who visit vineyards, wineries, wine festivals and wine shows for the purpose of recreation”.

48
that in an upper middle-class group of Americans, white Americans prefer wine while the
Afro-American community favour Cognac.
The wine tourism system has been explained in order to describe the supply and demand of
wine tourism. The next section focuses on the profile of the South African wine tourist.
2.3.4 PROFILE AND MOTIVATIONS OF SOUTH AFRICAN WINE TOURISTS
Consumers, wine tourists in this case, are commonly described or “profiled” based on
specific geographic, demographic, psychographic and behavioural characteristics (Bruwer,
2004; Charters & Ali-Knight, 2002; Dodd & Bigotte, 1997; Getz, 2000; Kotler & Armstrong,
2006; Kotler & Keller, 2009; South Australian Tourism Commission, 1997b; Tassiopoulos,
Nuntsu & Haydam, 2004; Williams & Young, 1999). In South Africa, the Cellar Door
Research Report on the Stellenbosch Wine Route,10 profiles the socio-demographic and
behavioural characteristics of wine tourists to this area.11
The socio-demographic characteristics of wine tourists to the wine route can be summarised
as:
• The largest visitor group is between the ages of 18 and 34 years (47%).
• Visitors are highly educated (76% have a post-high school qualification).
• Visitors are from high-income categories (83% earn more than R100 000 per annum,
71% more than R150 000 per annum, while 29% earn more than R400 000 per
annum).
• Foreign visitors constitute a significant percentage (28%) of all cellar door visitors and
are drawn primarily from South African’s main wine export markets, which include the
UK, Germany and the USA. Sweden, the Netherlands and Denmark, which are
emerging export markets, also feature prominently.
• Domestic wine tourists are mainly from the Western Cape (38%) and Gauteng (24% -
in season / 19% - out of season) (Frandsen, 2005:12).
10 Although the information pertains only to the Stellenbosch Wine Route, the size and dominance of this wine route in comparison with the other wine routes provide a reasonably accurate indication of the all the wine routes and wine tourism in the Western Cape (Frandsen, 2005:12). 11 See Annexure B for all the socio-demographic results of this survey mentioned above.
49
The behavioural characteristics of wine tourists to the wine route can be summarised as
follows:
• The majority (72%) of all visitors have previously visited the region (average 6 visits).
• Almost half (48%) of all visitors were on their first visit to a specific winery cellar door
(average 1.5 visits).
• A quarter (25%) of all visitors were on a multi-day trip spending an average of 6.2
days in the Stellenbosch region and only 15% stayed overnight.
• Wine tourists decision to visit the region was made a relatively short time before
embarking on a trip with 30% deciding within 24 hours to visit the region or while
driving in the vicinity, and 59% within one week of visiting.
• Word-of-mouth was the most important source of information about the Stellenbosch
Wine Route (41%). The second most important source of information relates to
previous visits to the Stellenbosch Wine Route (36%), with previous exposure to the
individual winery’s label the third most important source of information (16%). The
Stellenbosch Visitor Information Bureau was the fourth largest source of information
at 15%.
• More than a third (36%) of all visitors state that wine tourism is the main purpose of
their visit to the area.
• Nearly 40% of visitors indicated that they visited while on holiday.
• Tasting wine and buying wine are the main motivating factors for visiting cellar doors.
• Only 4% of cellar door visitors were alone (Frandsen, 2005:12).
Aside from socio-demographic and behavioural descriptors, wine tourists’ motivation for
visiting wineries must also be discussed. There are a number of motivations for wine
tourism, these include tasting, buying and enjoying different wines, relaxing and socialising
with a partner, friends or family and learning more about a winery’s products or wine in
general (Alant & Bruwer, 2004; Bruwer, 2002; Hall et al., 2000:127).
Motivations will not always be the same for an individual throughout his entire life but will
vary according to past life experiences and stages in life (Crompton, 1979; Snepenger, King,
Marshall & Uysal, 2006). Knowing the motivations of wine tourists is necessary to
understanding their needs and expectations while they are visiting a wine cellar or region
(Bruwer, 2002; Charters & Ali-Knight in Alant & Bruwer, 2004:28; Hall et al., 2000). Hall et al.
(2000:86) and Bruwer (2002) identify the primary or main motivation of wine tourists as
sampling and buying wine, while secondary motivations include socialising, learning about
wine, entertainment, and so forth (Hall et al., 2000; Bruwer in Alant & Bruwer, 2004:28).
These primary and secondary motivations are listed in table 2.6.
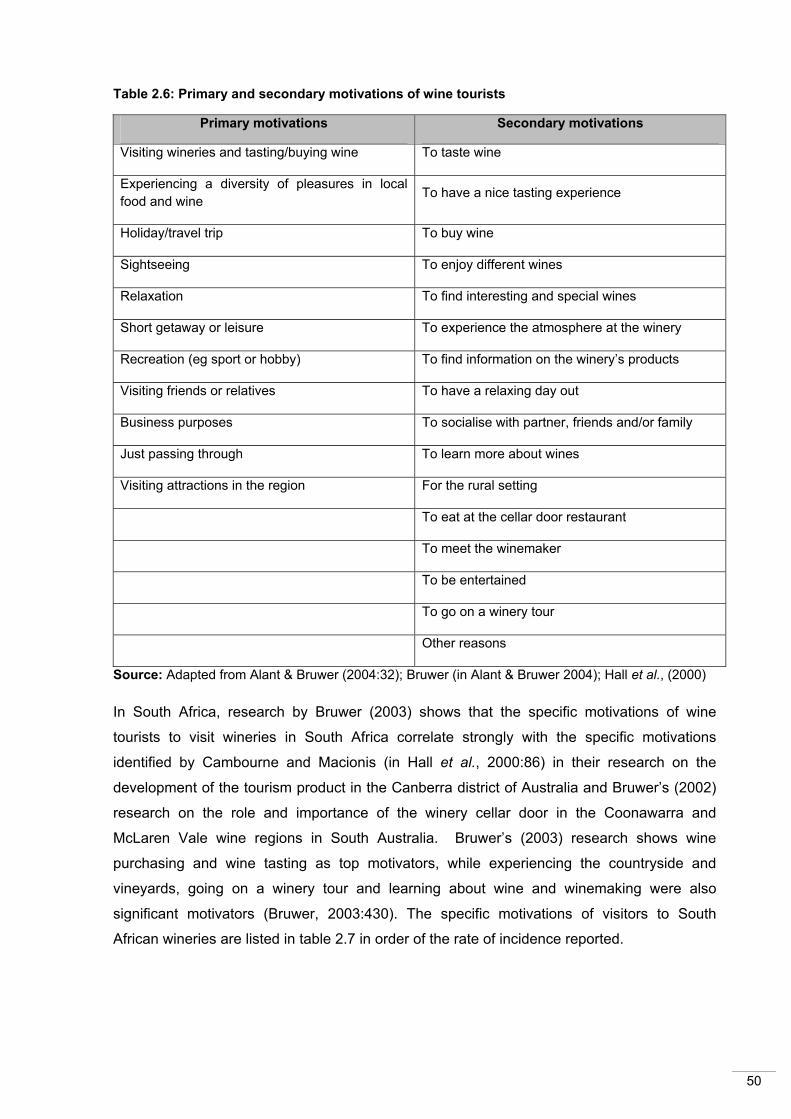
50
Table 2.6: Primary and secondary motivations of wine tourists
Primary motivations Secondary motivations
Visiting wineries and tasting/buying wine To taste wine
Experiencing a diversity of pleasures in local food and wine To have a nice tasting experience
Holiday/travel trip To buy wine
Sightseeing To enjoy different wines
Relaxation To find interesting and special wines
Short getaway or leisure To experience the atmosphere at the winery
Recreation (eg sport or hobby) To find information on the winery’s products
Visiting friends or relatives To have a relaxing day out
Business purposes To socialise with partner, friends and/or family
Just passing through To learn more about wines
Visiting attractions in the region For the rural setting
To eat at the cellar door restaurant
To meet the winemaker
To be entertained
To go on a winery tour
Other reasons
Source: Adapted from Alant & Bruwer (2004:32); Bruwer (in Alant & Bruwer 2004); Hall et al., (2000)
In South Africa, research by Bruwer (2003) shows that the specific motivations of wine
tourists to visit wineries in South Africa correlate strongly with the specific motivations
identified by Cambourne and Macionis (in Hall et al., 2000:86) in their research on the
development of the tourism product in the Canberra district of Australia and Bruwer’s (2002)
research on the role and importance of the winery cellar door in the Coonawarra and
McLaren Vale wine regions in South Australia. Bruwer’s (2003) research shows wine
purchasing and wine tasting as top motivators, while experiencing the countryside and
vineyards, going on a winery tour and learning about wine and winemaking were also
significant motivators (Bruwer, 2003:430). The specific motivations of visitors to South
African wineries are listed in table 2.7 in order of the rate of incidence reported.
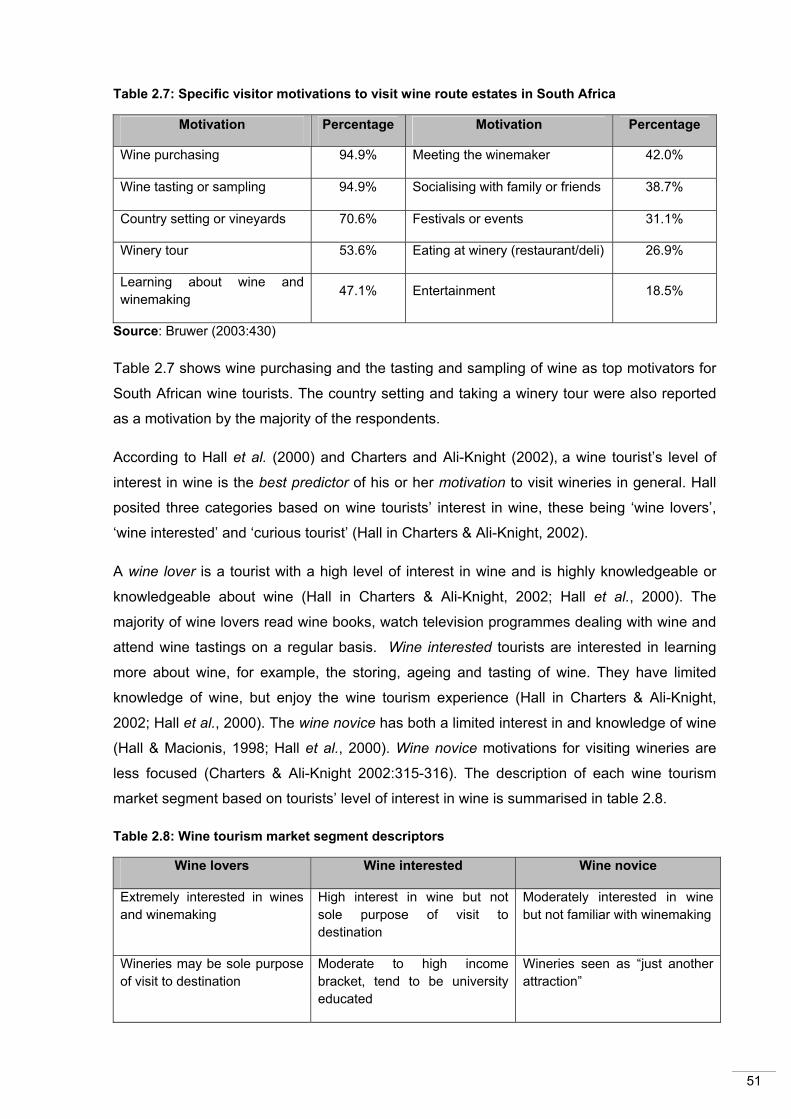
51
Table 2.7: Specific visitor motivations to visit wine route estates in South Africa
Motivation Percentage Motivation Percentage
Wine purchasing 94.9% Meeting the winemaker 42.0%
Wine tasting or sampling 94.9% Socialising with family or friends 38.7%
Country setting or vineyards 70.6% Festivals or events 31.1%
Winery tour 53.6% Eating at winery (restaurant/deli) 26.9%
Learning about wine and winemaking 47.1% Entertainment 18.5%
Source: Bruwer (2003:430)
Table 2.7 shows wine purchasing and the tasting and sampling of wine as top motivators for
South African wine tourists. The country setting and taking a winery tour were also reported
as a motivation by the majority of the respondents.
According to Hall et al. (2000) and Charters and Ali-Knight (2002), a wine tourist’s level of
interest in wine is the best predictor of his or her motivation to visit wineries in general. Hall
posited three categories based on wine tourists’ interest in wine, these being ‘wine lovers’,
‘wine interested’ and ‘curious tourist’ (Hall in Charters & Ali-Knight, 2002).
A wine lover is a tourist with a high level of interest in wine and is highly knowledgeable or
knowledgeable about wine (Hall in Charters & Ali-Knight, 2002; Hall et al., 2000). The
majority of wine lovers read wine books, watch television programmes dealing with wine and
attend wine tastings on a regular basis. Wine interested tourists are interested in learning
more about wine, for example, the storing, ageing and tasting of wine. They have limited
knowledge of wine, but enjoy the wine tourism experience (Hall in Charters & Ali-Knight,
2002; Hall et al., 2000). The wine novice has both a limited interest in and knowledge of wine
(Hall & Macionis, 1998; Hall et al., 2000). Wine novice motivations for visiting wineries are
less focused (Charters & Ali-Knight 2002:315-316). The description of each wine tourism
market segment based on tourists’ level of interest in wine is summarised in table 2.8.
Table 2.8: Wine tourism market segment descriptors
Wine lovers Wine interested Wine novice
Extremely interested in wines and winemaking
High interest in wine but not sole purpose of visit to destination
Moderately interested in wine but not familiar with winemaking
Wineries may be sole purpose of visit to destination
Moderate to high income bracket, tend to be university educated
Wineries seen as “just another attraction”

52
Wine lovers Wine interested Wine novice
May be employed in wine and food industry
Occasional purchaser of wine and food magazines. Regular purchaser of lifestyle magazines
Moderate income and education
Likely to be mature with high income and high education levels
Word-of-mouth and wine columns in newspapers may be important for creating interest in region
Winery tour a by-product of visit to region as visiting was for unrelated purposes
Likely to be a regular purchaser of wine and food magazines
Likely to have visited other wine regions
May have visited other wine regions
Will have visited other wine regions
Familiar with winemaking procedures
Curiosity aroused by drinking or seeing winery product or general tourism promotion or pamphlets
Highly likely to purchase at winery and add name to any mailing list
Likely to purchase at winery and add name to any mailing list
Opportunity for social interaction with friends or family
Potential for repeat purchase of wine through having visited winery
May purchase at winery but will not join mailing list
Source: Hall & Macionis (1998:217)
In 2003, Bruwer conducted research on wine tourists to South African wine routes. Bruwer
used Hall’s wine tourist market segmentation and showed that more than 70% of wine
tourists to South Africa were extremely or highly interested in wine with 53.3% categorised as
wine lovers, 27.8% as wine interested and 15.9% as curious tourists (Bruwer, 2003:431).
The profile of the South African wine tourist and his or her motivations were described in this
section. The next section focuses on the different characteristics and benefits of the wine
tourism product.
2.3.5 WINE TOURISM PRODUCT CHARACTERISTICS AND BENEFITS
Wine tourism is characterised as a lifestyle experience that can be part of a broader tourism
experience. It enhances the economic, social and cultural value of a wine region and is
linked to the local lifestyle, that is, food, accommodation, arts and crafts and the environment
(Dowling & Carlsen, 1999). The wine tourism product can consist of a whole host of different
facilities and services to cater to the winery tourist. These include wine tasting facilities,
cellar door sales and self-guided and guided winery tours. Wineries may also sell fresh
produce, host wine or other festivals, run a restaurant and have overnight accommodation on
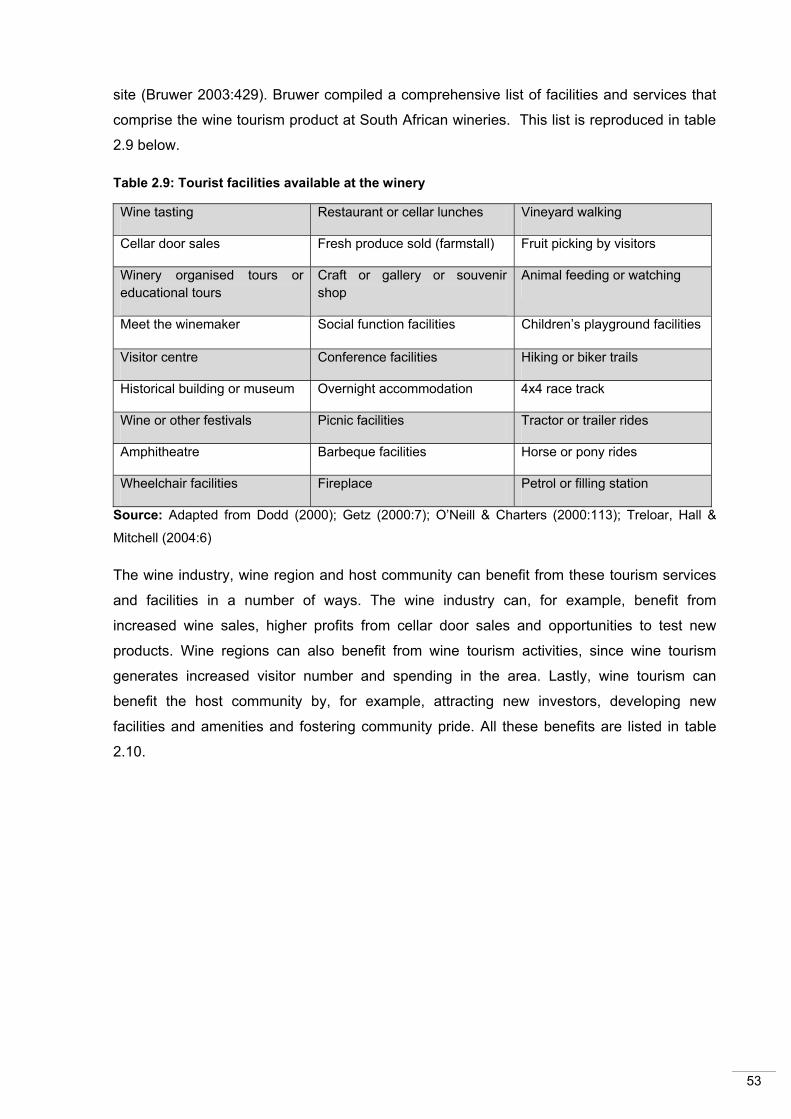
53
site (Bruwer 2003:429). Bruwer compiled a comprehensive list of facilities and services that
comprise the wine tourism product at South African wineries. This list is reproduced in table
2.9 below.
Table 2.9: Tourist facilities available at the winery
Wine tasting Restaurant or cellar lunches Vineyard walking
Cellar door sales Fresh produce sold (farmstall) Fruit picking by visitors
Winery organised tours or educational tours
Craft or gallery or souvenir shop
Animal feeding or watching
Meet the winemaker Social function facilities Children’s playground facilities
Visitor centre Conference facilities Hiking or biker trails
Historical building or museum Overnight accommodation 4x4 race track
Wine or other festivals Picnic facilities Tractor or trailer rides
Amphitheatre Barbeque facilities Horse or pony rides
Wheelchair facilities Fireplace Petrol or filling station
Source: Adapted from Dodd (2000); Getz (2000:7); O’Neill & Charters (2000:113); Treloar, Hall &
Mitchell (2004:6)
The wine industry, wine region and host community can benefit from these tourism services
and facilities in a number of ways. The wine industry can, for example, benefit from
increased wine sales, higher profits from cellar door sales and opportunities to test new
products. Wine regions can also benefit from wine tourism activities, since wine tourism
generates increased visitor number and spending in the area. Lastly, wine tourism can
benefit the host community by, for example, attracting new investors, developing new
facilities and amenities and fostering community pride. All these benefits are listed in table
2.10.

54
Table 2.10: Benefits of wine tourism
Benefits to the wine industry Benefits to the wine regions Benefits to host communities
• Increased wine sales
• Educates visitors and foster brand loyalty
• Attracts new market segments
• Higher profits from winery sales
• Improved links with the wine trade
• New partnerships
• Tests new products
• Opportunity for relationship marketing
• Generates increased visitor numbers and spending
• Attracts new and repeat visitors
• Develops a unique positive destination image
• Overcomes slow demand periods
• Earns foreign exchange
• Attracts new investment
• Develops new facilities and amenities
• Fosters community pride
• Creates successful events for residents and visitors
• Creates part-time and full-time jobs
• Generates secondary economic activity (multiplier effect)
Source: Adapted from Getz (2000:7-8); Treloar et al. (in Hall & Mitchell, 2004:6); Dodd (2000); O’Neill
& Charters (2000:113)
Table 2.10 shows that wine tourism can significantly benefit the wine industry, the wine
region and the host community in more ways than one.
2.4 CONCLUSION
This first section in this chapter was dedicated to the wine industry in South Africa and the
second section to the wine tourism industry in South Africa. The purpose of this chapter was
to provide a foundation of knowledge regarding these industries in South Africa. The next
chapter is concerned with the theory and principles of marketing, the marketing process, the
marketing mix and its tools and the four P's.
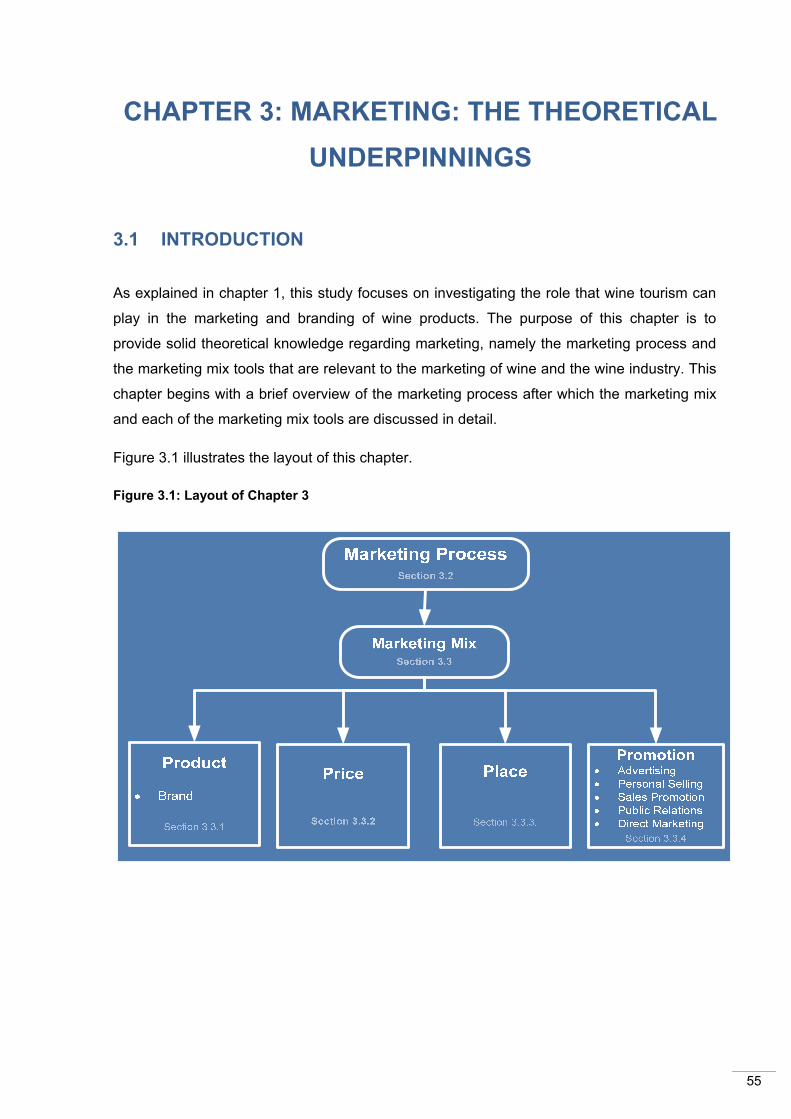
55
3. CHAPTER 3: MARKETING: THE THEORETICAL UNDERPINNINGS
3.1 INTRODUCTION
As explained in chapter 1, this study focuses on investigating the role that wine tourism can
play in the marketing and branding of wine products. The purpose of this chapter is to
provide solid theoretical knowledge regarding marketing, namely the marketing process and
the marketing mix tools that are relevant to the marketing of wine and the wine industry. This
chapter begins with a brief overview of the marketing process after which the marketing mix
and each of the marketing mix tools are discussed in detail.
Figure 3.1 illustrates the layout of this chapter.
Figure 3.1: Layout of Chapter 3
CHAPTER 3: MARKETING: THE THEORETICAL UNDERPINNINGS

56
3.2 THE MARKETING PROCESS
According to Cant, Jooste, Strydom and Du Plessis (2007:3), the fundamental objectives of
all business for profit industries are survival, profitability and growth. In order to obtain these
objectives, businesses (in this case wineries) must build profitable and valuable exchange
relationships with customers12 (Kotler & Armstrong, 2006). Marketing management is
essential to building profitable and valuable exchange relationships. This is apparent from
the explanation by Kotler and Armstrong (2006) of marketing management as the process by
which companies create value and build strong relationships with and for customers in order
to capture value from them in return. Various definitions of marketing are proposed in the
literature (Sheth & Uslay, 2007).
Marketing is formally defined by the American Marketing Association as: “The process of
planning and executing the conception, pricing, marketing communication and distribution of
ideas, products and services to create exchanges that satisfy individual and organisational
goals” (own italics added) (Cant et al., 2007:3). The South African Institute of Marketing
Management (IMM) defines marketing as: “The management process responsible for
identifying, anticipating, and satisfying customer requirements profitably, to meet
organisational objectives” (own italics added) (George, 2007:4). Marketing in South Africa
can therefore be seen as a process. The process of marketing is illustrated schematically in
figure 3.2 (Kotler & Armstrong, 2006:5). In the first four steps, organisations work towards
creating value for consumers and building strong customer relationships. In the final step,
organisations reap the rewards of creating superior customer value in the form of sales,
profits and long-term customer equity (Kotler & Armstrong, 2006:5).
12 The term customer is defined as a person who purchases a product or service. The term consumer is defined as a person who consumes (uses) a product or service. Although a person who purchases wine may not necessarily be a consumer of wine, and vice versa, for the purposes of this study, the terms customer and consumer are used interchangeably.

57
Figure 3.2: The marketing process
Source: Adapted from Kotler & Armstrong (2006:5)
The marketing process can be applied to any organisation and thus also to any winery. In the
first step of the marketing process, the winery must focus on understanding the marketplace
by researching consumer needs and wants (Kotler & Armstrong, 2006:6). The winery must
then design a customer-driven marketing strategy (step 2) based on two fundamental
questions, namely (Kotler & Armstrong, 2006:8; Winer, 2007):
(i) Which customers will be served? (market segmentation and targeting)
(ii) How can the targeted customers best be served? (differentiation and positioning)
A marketing strategy therefore entails deciding which segment of the market the winery
wants to target and then differentiating the winery and positioning its products in such a way
that it will cater to the specific market segment that it has decided to target. After the
marketing strategy has been decided, the winery must construct a marketing programme
(step 3) that consists of the four marketing mix elements, or the four P’s, which transform the
marketing strategy into real value for customers (Kotler & Armstrong 2006:8,12; Kotler &
Keller 2009; Kotler et al., 2010:358).
The marketing programme commences with the development of product offers and brand
identities by the winery (product). The winery then prices the wine products on offer to create
real customer value (price) and distributes the offers to make them available to target
consumers (place). Finally, the winery designs promotion programmes that communicate the
value proposition to target consumers and persuade them to act on the marketing offer
(promotion) (Kotler et al., 2010:358; Kotler & Armstrong, 2006:13).
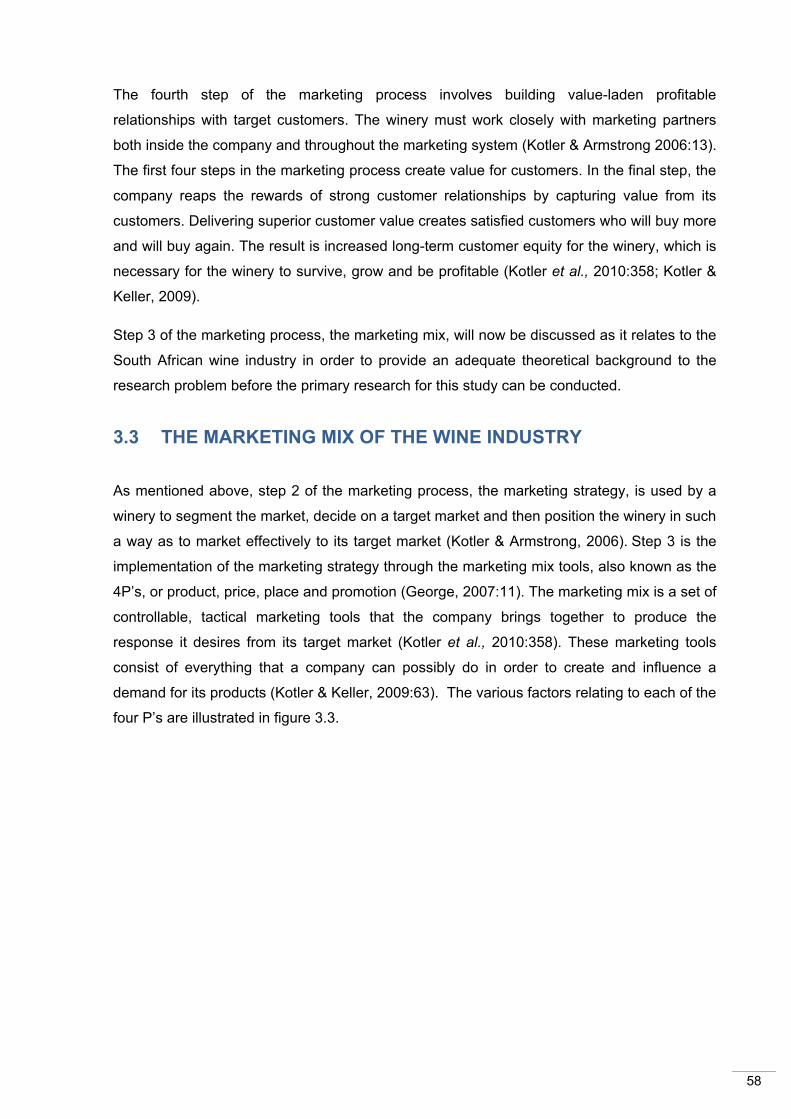
58
The fourth step of the marketing process involves building value-laden profitable
relationships with target customers. The winery must work closely with marketing partners
both inside the company and throughout the marketing system (Kotler & Armstrong 2006:13).
The first four steps in the marketing process create value for customers. In the final step, the
company reaps the rewards of strong customer relationships by capturing value from its
customers. Delivering superior customer value creates satisfied customers who will buy more
and will buy again. The result is increased long-term customer equity for the winery, which is
necessary for the winery to survive, grow and be profitable (Kotler et al., 2010:358; Kotler &
Keller, 2009).
Step 3 of the marketing process, the marketing mix, will now be discussed as it relates to the
South African wine industry in order to provide an adequate theoretical background to the
research problem before the primary research for this study can be conducted.
3.3 THE MARKETING MIX OF THE WINE INDUSTRY
As mentioned above, step 2 of the marketing process, the marketing strategy, is used by a
winery to segment the market, decide on a target market and then position the winery in such
a way as to market effectively to its target market (Kotler & Armstrong, 2006). Step 3 is the
implementation of the marketing strategy through the marketing mix tools, also known as the
4P’s, or product, price, place and promotion (George, 2007:11). The marketing mix is a set of
controllable, tactical marketing tools that the company brings together to produce the
response it desires from its target market (Kotler et al., 2010:358). These marketing tools
consist of everything that a company can possibly do in order to create and influence a
demand for its products (Kotler & Keller, 2009:63). The various factors relating to each of the
four P’s are illustrated in figure 3.3.
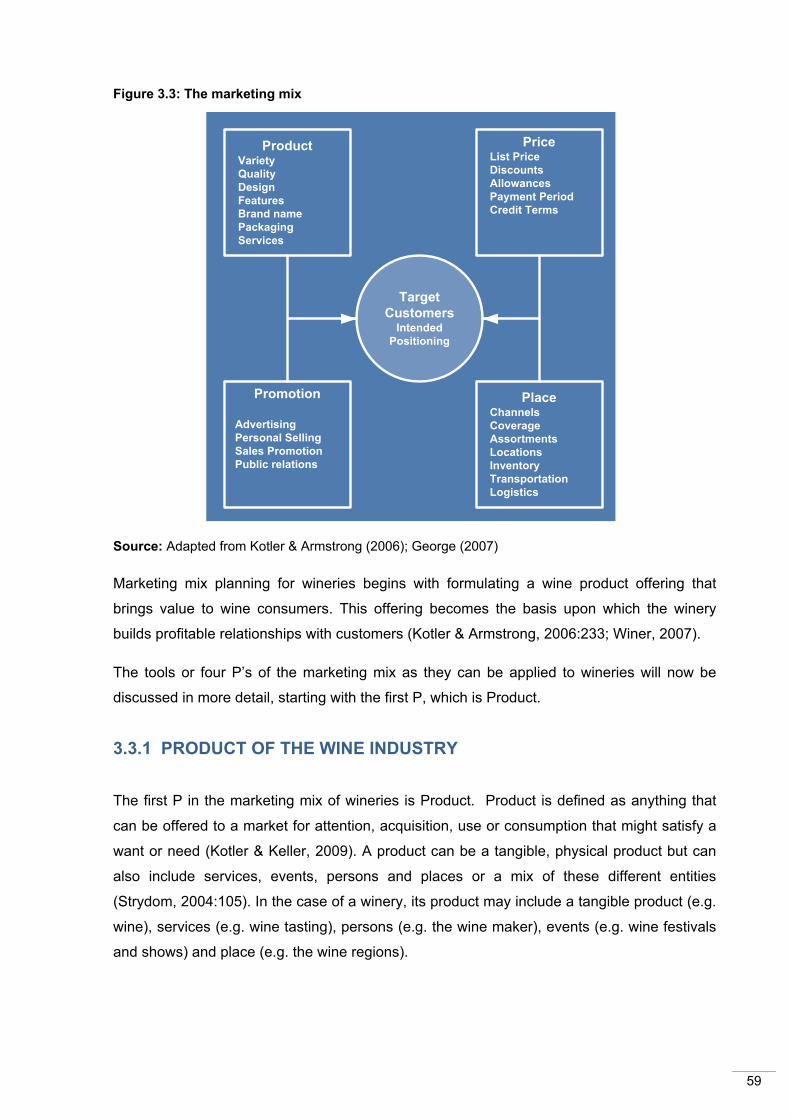
59
Figure 3.3: The marketing mix
Source: Adapted from Kotler & Armstrong (2006); George (2007)
Marketing mix planning for wineries begins with formulating a wine product offering that
brings value to wine consumers. This offering becomes the basis upon which the winery
builds profitable relationships with customers (Kotler & Armstrong, 2006:233; Winer, 2007).
The tools or four P’s of the marketing mix as they can be applied to wineries will now be
discussed in more detail, starting with the first P, which is Product.
3.3.1 PRODUCT OF THE WINE INDUSTRY
The first P in the marketing mix of wineries is Product. Product is defined as anything that
can be offered to a market for attention, acquisition, use or consumption that might satisfy a
want or need (Kotler & Keller, 2009). A product can be a tangible, physical product but can
also include services, events, persons and places or a mix of these different entities
(Strydom, 2004:105). In the case of a winery, its product may include a tangible product (e.g.
wine), services (e.g. wine tasting), persons (e.g. the wine maker), events (e.g. wine festivals
and shows) and place (e.g. the wine regions).
ProductVarietyQualityDesignFeaturesBrand namePackagingServices
PriceList PriceDiscountsAllowancesPayment PeriodCredit Terms
Promotion
AdvertisingPersonal SellingSales PromotionPublic relations
PlaceChannelsCoverageAssortmentsLocationsInventoryTransportationLogistics
Target Customers
Intended Positioning
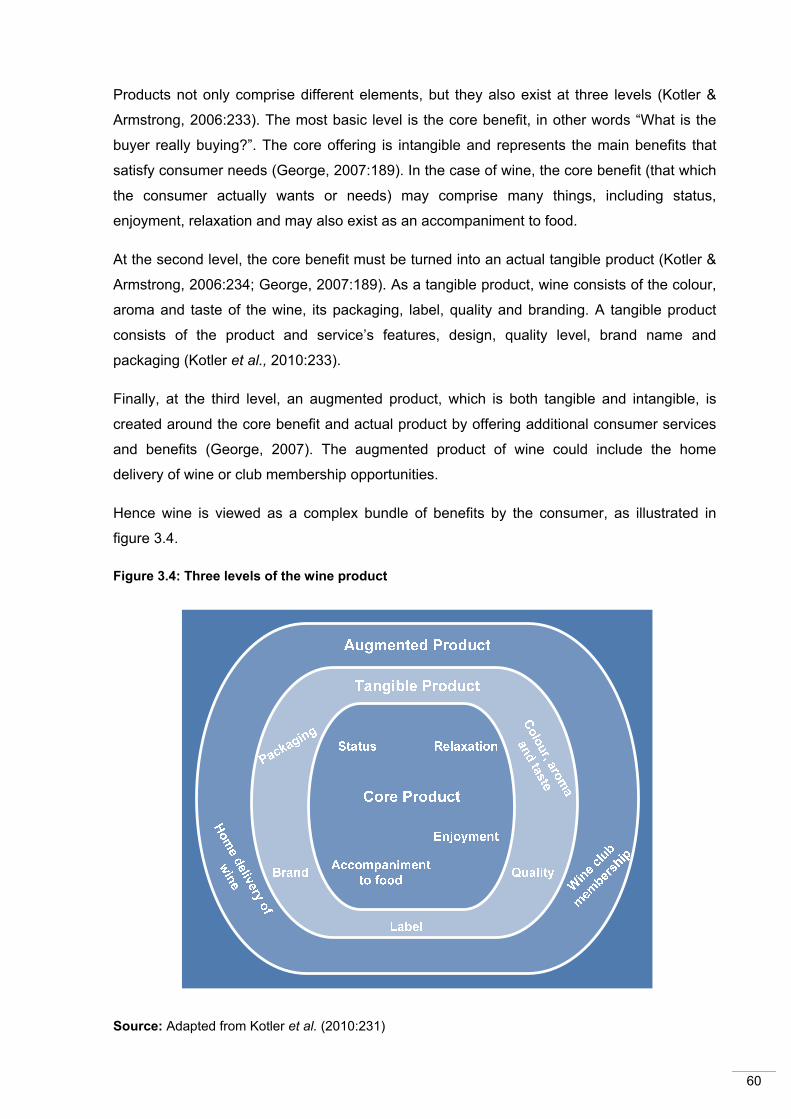
60
Products not only comprise different elements, but they also exist at three levels (Kotler &
Armstrong, 2006:233). The most basic level is the core benefit, in other words “What is the
buyer really buying?”. The core offering is intangible and represents the main benefits that
satisfy consumer needs (George, 2007:189). In the case of wine, the core benefit (that which
the consumer actually wants or needs) may comprise many things, including status,
enjoyment, relaxation and may also exist as an accompaniment to food.
At the second level, the core benefit must be turned into an actual tangible product (Kotler &
Armstrong, 2006:234; George, 2007:189). As a tangible product, wine consists of the colour,
aroma and taste of the wine, its packaging, label, quality and branding. A tangible product
consists of the product and service’s features, design, quality level, brand name and
packaging (Kotler et al., 2010:233).
Finally, at the third level, an augmented product, which is both tangible and intangible, is
created around the core benefit and actual product by offering additional consumer services
and benefits (George, 2007). The augmented product of wine could include the home
delivery of wine or club membership opportunities.
Hence wine is viewed as a complex bundle of benefits by the consumer, as illustrated in
figure 3.4.
Figure 3.4: Three levels of the wine product
Source: Adapted from Kotler et al. (2010:231)
61
Wine can be further described as a consumer product, that is, a product bought by final
consumers for their personal or family consumption (Cant, Strydom, Jooste & Du Plessis,
2007:201). Consumer products are further classified according to the amount of time, money
and risk involved in making the purchase decision (Kotler in Cant et al., 2007:201). This
classification scheme includes convenience products, shopping products, speciality products
and unsought products (Kotler & Keller, 2009:360). Wine can be classified as either a
convenience product, shopping product or speciality product, depending on the purchase
motivation of the customer.
Wine is seen as a convenience product when it is purchased frequently, immediately and
with a minimum of comparison or buying effort (Kotler & Armstrong, 2006:234). For
example, a favourite, relatively inexpensive wine that is bought on a regular basis along with
other monthly grocery items is a convenience product. Shopping products are less
frequently purchased consumer products that the customer is likely to spend more time on
comparing suitability, quality, price and style (Cant et al., 2007:204). When wine is carefully
selected by the consumer who spends time comparing different brands and prices, it is seen
as a shopping product.
A consumer product is regarded as a speciality product when it has unique characteristics
and brand identification for which consumers are willing to make a special effort during
purchase (Kotler & Keller, 2009:360). Certain exceptional wines are seen as speciality
products on account of their cost, unique characteristics and brand. An example of a
speciality wine is Bollinger 1996 champagne from Champagne Valley in France, purchased
at a fine wine auction in France (Bollinger, n.d.).
As a product category, wine is one of the most complex (Orth et al., 2007). A large product
category such as cereal is typically represented by as many as 80 different products in a
large retail store while other product categories have much fewer products. In contrast, there
are often more than 350 different wine products available in a retail store while some
speciality stores have up to 3 500 different products. The massive variety available is due to
the range of attributes defining a wine as well as the number of levels within each attribute
(Orth et al., 2007).
Wine can be red, white or pink, still or sparkling, with different levels of residual sugar,
alcohol, tannin and acid levels. There are also a wide variety of packaging types, sizes and
shapes (e.g. bottle, box, can) available. Each wine also has its own name, grape variety or
blend, vintage year, country, region of origin and winemaker. This array of different variables
results in a complex product category which means a lot of confusion in the marketplace and
uncertainty and risk experienced by consumers (Orth et al., 2007).
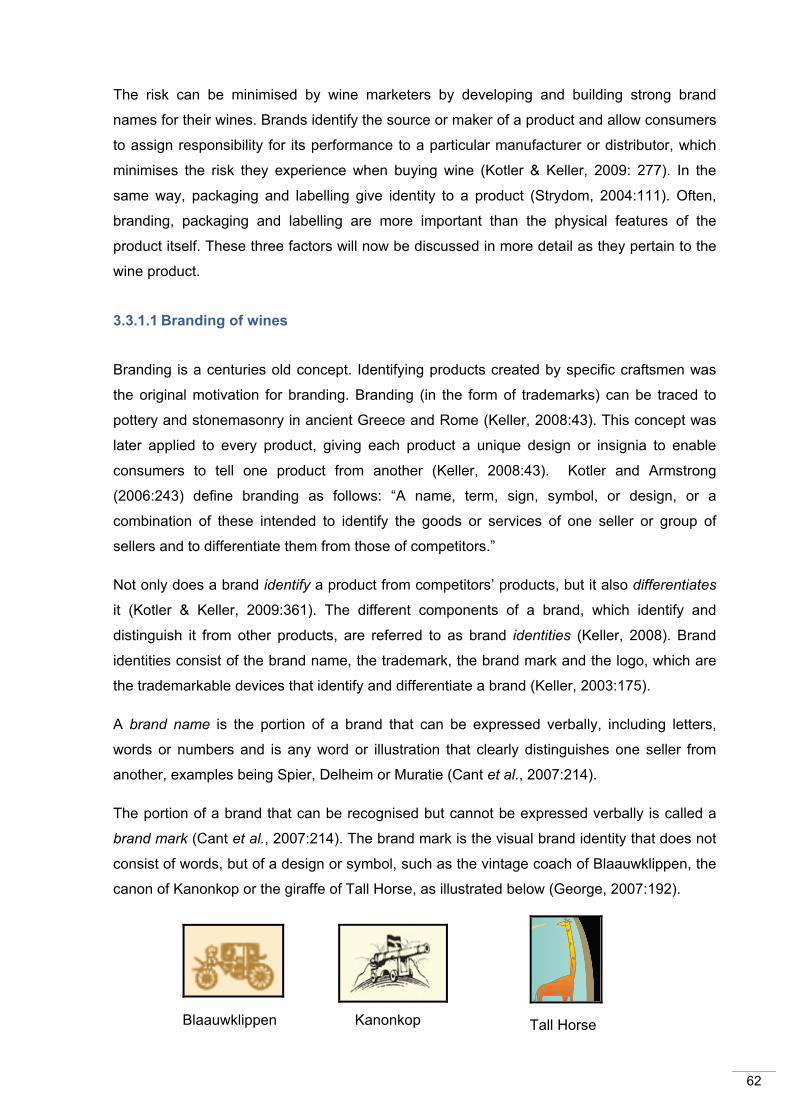
62
The risk can be minimised by wine marketers by developing and building strong brand
names for their wines. Brands identify the source or maker of a product and allow consumers
to assign responsibility for its performance to a particular manufacturer or distributor, which
minimises the risk they experience when buying wine (Kotler & Keller, 2009: 277). In the
same way, packaging and labelling give identity to a product (Strydom, 2004:111). Often,
branding, packaging and labelling are more important than the physical features of the
product itself. These three factors will now be discussed in more detail as they pertain to the
wine product.
3.3.1.1 Branding of wines
Branding is a centuries old concept. Identifying products created by specific craftsmen was
the original motivation for branding. Branding (in the form of trademarks) can be traced to
pottery and stonemasonry in ancient Greece and Rome (Keller, 2008:43). This concept was
later applied to every product, giving each product a unique design or insignia to enable
consumers to tell one product from another (Keller, 2008:43). Kotler and Armstrong
(2006:243) define branding as follows: “A name, term, sign, symbol, or design, or a
combination of these intended to identify the goods or services of one seller or group of
sellers and to differentiate them from those of competitors.”
Not only does a brand identify a product from competitors’ products, but it also differentiates
it (Kotler & Keller, 2009:361). The different components of a brand, which identify and
distinguish it from other products, are referred to as brand identities (Keller, 2008). Brand
identities consist of the brand name, the trademark, the brand mark and the logo, which are
the trademarkable devices that identify and differentiate a brand (Keller, 2003:175).
A brand name is the portion of a brand that can be expressed verbally, including letters,
words or numbers and is any word or illustration that clearly distinguishes one seller from
another, examples being Spier, Delheim or Muratie (Cant et al., 2007:214).
The portion of a brand that can be recognised but cannot be expressed verbally is called a
brand mark (Cant et al., 2007:214). The brand mark is the visual brand identity that does not
consist of words, but of a design or symbol, such as the vintage coach of Blaauwklippen, the
canon of Kanonkop or the giraffe of Tall Horse, as illustrated below (George, 2007:192).
Tall Horse Blaauwklippen Kanonkop

63
A unique symbol or a brand name written in a distinctive type style that represents a specific
company, called the logo, is the third brand identity, for example, Simonsig, Wellington and
Graceland, illustrated below (George, 2007:194; Danesi, 2008).
Finally, a name, symbol, motto or emblem that identifies a product, service or firm and that
has been legally registered as the property of the firm is called a trademark (Small business
dictionary, 2008; George, 2007:191). Trademarks grant the owner the right to prevent
competitors from using similar marks in selling or advertising. Once a brand has been
established, the brand name and trademark serve to remind and reinforce the beliefs that
have been formed (Hoffman, 2003:261).
According to Kotler (2003:240), a brand is essentially an organisation’s promise to deliver a
specific set of features, benefits and services consistently to the consumer. The messages
that the brand communicates to consumers form the foundation upon which consumers form
their opinions, beliefs and perceptions about the product’s attributes and image.
Branding benefits both wine consumers and wineries. Brands simplify buying decisions for
consumers by identifying specific wine products with attributes that they do and do not like.
This reduces the different kinds of risk (e.g. social risk, financial risk) normally experienced
by consumers when buying a wine. This, in turn, facilitates the purchase of wines that satisfy
these consumers’ needs and reduces the time required to make the purchase decision.
Without brands, consumers would also have no assurance that they are purchasing a wine
they prefer (Brodie, Whittome & Brush, 2009; Nowak, Thach & Olsen, 2006).
Wineries also benefit from branding since each brand identifies a specific wine, which makes
repeat purchasing easier for consumers. However, branding may also affect wines
negatively in that consumers may become confused by too many alternatives, with
imperceptible differences (Walsh, Hennig-Thurau & Mitchell, 2007). A good brand should
therefore attract attention, be memorable, help communicate the positioning of the product
and distinguish the product from competing brands (Hoffman, 2003:261).
Building a strong brand therefore involves emphasising its key benefits and attributes for
consumers. In order for organisations to be able to build a strong brand, they must recognise
that a brand consists of a bundle of tangible, functional attributes, as well as intangible,
emotional attributes (Aufreiter, Elzinga & Gordon, 2003:33).

64
The combination of its tangible attributes, intangible attributes and its brand identity becomes
the basis for an organisation’s differentiation strategy in competing with competitors
(Aufreiter, Elzinga & Gordon, 2003:33). For many organisations brands have become the
primary drivers of growth and are seen as valuable commodities (Clifton & Simmons,
2003:27). Coca-Cola, for example, was the world’s most valuable brand in 2009, valued at
$68.764 billion, with IBM in the number two position at $60.211 billion. In the wine industry,
Moët & Chandon topped the industry as the most valuable brand at $3.754 billion during
2009 (Interbrand, 2010).
Brand equity is the value of a brand related to the brand’s ability to attract future customers
reliably (Solomon & Stuart, 1997:348). In other words, it is the marketing and financial value
associated with a brand’s strength in the market (Pride & Ferrell, 2003:299). Aaker (in
Kapferer, 2008) defines brand equity as a set of five categories of brand assets (and
liabilities) linked to a brand that adds to or subtracts from the value provided by a product or
service to an organisation, its customers, or both. These categories of brand assets are (1)
brand loyalty, (2) brand awareness, (3) perceived quality, (4) brand associations, and (5)
other proprietary assets (e.g. patents, trademarks and channel relationships.) As a
measurable asset, brand equity has the ability to increase cash flow to the winery and create
a competitive advantage (Kapferer, 2008). The equity of each wine brand is reflected in the
price premiums that customers are willing to pay for a particular wine brand as well as the
loyalty or commitment that consumers have towards a brand.
The concept of brand equity has filtered into the wine industry from its base in fast-moving
consumer goods (FMCG) (Spawton in Lockshin & Spawton, 2001:72). In figure 3.5 below,
brand equity and its set of five categories are illustrated as they apply to the wine industry
(Lockshin & Spawton, 2001) based on one of the most commonly utilised brand equity
models derived from Aaker (in Jooste, Strydom, Berndt & Du Plessis, 2009:369). Each wine
brand equity category will now be discussed.
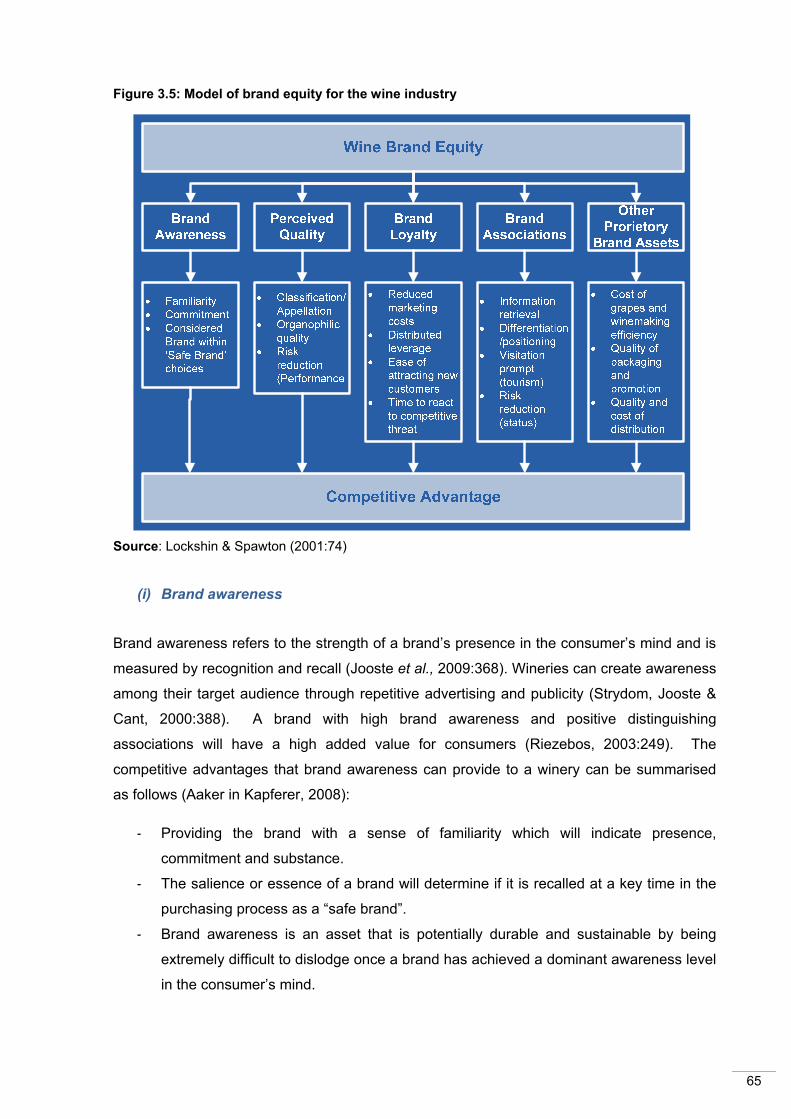
65
Figure 3.5: Model of brand equity for the wine industry
Source: Lockshin & Spawton (2001:74)
(i) Brand awareness
Brand awareness refers to the strength of a brand’s presence in the consumer’s mind and is
measured by recognition and recall (Jooste et al., 2009:368). Wineries can create awareness
among their target audience through repetitive advertising and publicity (Strydom, Jooste &
Cant, 2000:388). A brand with high brand awareness and positive distinguishing
associations will have a high added value for consumers (Riezebos, 2003:249). The
competitive advantages that brand awareness can provide to a winery can be summarised
as follows (Aaker in Kapferer, 2008):
- Providing the brand with a sense of familiarity which will indicate presence,
commitment and substance.
- The salience or essence of a brand will determine if it is recalled at a key time in the
purchasing process as a “safe brand”.
- Brand awareness is an asset that is potentially durable and sustainable by being
extremely difficult to dislodge once a brand has achieved a dominant awareness level
in the consumer’s mind.

66
Wineries can create brand awareness by, firstly, having a broad sales base, and secondly,
becoming skilled at operating outside the normal media channels. The challenge therefore
facing the marketers of a winery is to build awareness and presence both economically and
efficiently (Kapferer, 2008; Vukasovic, 2009).
(ii) Brand loyalty
The second asset category, brand loyalty, refers to the level of commitment that customers
have towards a given brand, represented by their continuing purchase thereof (Vukasovic,
2009). Brand loyalty is a form of repeat purchasing behaviour, which is based on a conscious
decision by the consumer to continue buying a product with a particular brand or trademark
(Russell-Bennett, McColl-Kennedy & Coote, 2007). In other words, brand loyalty involves a
consumer repeatedly seeking out and buying one brand instead of another (Gerber-Nel,
2006). Brand loyal customers provide a sustainable competitive advantage for wineries
which include the following (Aaker in Gerber-Nel, 2006): - Existing customers are usually relatively easy to hold, and they reduce the marketing
costs of doing business.
- The loyalty of existing customers represents a substantial entry barrier to competitors.
- A relatively large satisfied customer base provides an image of a brand as an
accepted, successful and enduring product.
- Brand loyalty provides the time to respond to competitive moves.
Building brand loyalty involves continuing to serve a customer in a satisfactory way (Ismail &
Melewar, 2008). Managing brand loyalty is thus a key to achieving strategic success as well
as brand equity. Wineries that manage brand loyalty well are likely to do the following (Aaker
in Gerber-Nel, 2006):
- Place a value on the future purchases expected from customers so that existing
customers receive appropriate resources.
- Measure the loyalty of existing customers.
- Make customers feel that they are “part” of the winery (wine clubs).
- Have continuing communication with customers.
- Conduct exit interviews with those who leave the brand to locate points of
vulnerability.
- Have a customer culture, whereby people throughout the winery are empowered and
motivated to keep the customer happy.
- Reward loyal customers with frequent-buyer programmes or special unexpected
benefits or premiums.
67
Product attributes and customer benefits are the associations that have obvious relevance,
because they provide a reason to buy a product and thus a basis for brand loyalty. Customer
loyalty is key to generating long-term financial performance (Strydom et al., 2000:239).
(iii) Perceived quality
The third asset category of brand equity is perceived quality. Keller describes this as
customers’ perception of the overall quality or superiority of a product or service compared to
alternatives and with respect to intended purpose (Keller, 2008:195). Consumers’ beliefs or
perceptions about products’ characteristics such as performance, features, reliability, style
and design often define quality, and in turn, influence attitudes and behaviour toward a brand
(Keller, 2008:195). If consumers perceive a winery’s products as quality (value for money), it
will drive financial performance and influence other aspects of how a brand is perceived.
Part of a consumer’s image of a brand is based on actual facts and experiences, while
another part of that image is based on perceptions formed from a product’s reputation, media
coverage and other indirect sources of information (Bovée, Houston & Thill in Gerber-Nel,
2006). Wine marketers can create perceived quality for a product by understanding what
quality means to the consumer, by having a supportive culture and having a quality
improvement process that will enable the winery to deliver ever-increasing quality of product
(Gerber-Nel, 2006).
(iv) Brand associations
A powerful brand not only enjoys a high level of consumer brand loyalty and perceived
quality, but also has positive associations in consumers’ minds (Kotler & Armstrong,
2001:302). Brand associations are perceptions and images that people link with particular
brands (Kapferer, 2008) and fall into the fourth brand equity asset category. A positive brand
image is created by marketing programmes that link strong, favourable, unique and
admirable associations to the brand in the consumer’s memory (Keller, 2003:70). The
associations attached to a winery and its brands can therefore be key enduring business
assets.
As can be seen from the above discussion, the sources of brand equity lead to a number of
competitive advantages for the winery.
68
Some of the competitive advantages provided by high brand equity are as follows (Kotler,
2003:406):
- A winery will enjoy reduced marketing costs because of consumer brand awareness
and loyalty.
- A winery will have more trade leverage in bargaining with distributors and retailers
because consumers expect them to carry the brand.
- A winery can charge a higher price than its competitors because the brand is
perceived as being of higher quality.
- A winery can more easily launch extensions, because the brand name carries high
credibility.
- The brand offers the company some defense against price competition.
Now that branding has been discussed, the next aspect of Product, namely packaging, will
be discussed.
3.3.1.2 Packaging of wines
After branding, the second important product consideration pertains to its packaging. Van der
Walt, Strydom, Marx and Jooste (in Cant et al., 2007) define packaging as “... activities in the
product decision which pertain to the design, manufacturing and filling of the container or
wrapper with the product item, in such a way that the product item can be protected, stored,
handled, transported and identified effectively and marketed successfully”. Packaging
includes a product’s primary container, in the wine industry this is usually a glass bottle, box
or can that contains the wine. The bottle may include a secondary package, for example, a
cardboard box, which is thrown away when the product is about to be used. Finally, it can
include a shipping package necessary to store, identify and ship the product. Wine bottles
are usually stored in cases made of either cardboard or plastic.
Although the primary function of packaging is to protect the product, often its secondary
function as a tool in the promotion strategy to identify a product, is far more important (Cant
et al., 2007:221). Packaging has several functions. In the wine industry, the first function of
packaging is the enclosure and protection of the wine. Wine cannot be handled, stored or
transported without some form of container, usually a glass bottle or cardboard box. The
second function of packaging wine is distribution. The needs of wholesalers, retailers and
consumers must be satisfied by packaging - for example, wine must be stackable to enable
optimum use of truck and storage facility space. In the wine industry, glass bottles are
packed into cardboard or plastic crates of 6 or 12 bottles, which can be easily stacked.

69
The third, and often most important, function of packaging wine is communication and
differentiation. Packaging communicates a specific product image through its design, label,
colour and brand name which differentiates it from other wines. Wine bottles come in a vast
variety of shapes and sizes, each with its own label and brand name. This is also true of wine
packaged in cans, glasses and boxes. The last function of packaging is consumer oriented,
namely reusability. Wine is normally sold in quantities of 750 millilitres, two litres or five litres.
The packaging should be designed in such a way that the wine can be stored for a short
period of time after opening, since it often happens that consumers do not want to consume
the entire contents all at once (Cant et al., 2007:223).
The last factor that should be considered regarding a product is labelling, which is discussed
next.
3.3.1.3 Labelling of wines
The third factor relating to product, is labelling. The label is the printed material that appears
on a product package. Labels have a strong functional dimension in that they include
warnings and instructions, as well as information required by law or best industry practices
(Cant et al., 2007:223).
In South Africa, the Label Committee has to approve all labels before they may be used on
certified wines. The particular requirements of each label are prescribed by the Wine of
Origin Scheme’s regulations. All the compulsory particulars, which include the class name,
alcohol content, name and address or code number of the responsible seller and the origin
appellation (geographical area) must appear in the same visual field on each bottle of wine
(Wosa, n.d.).
The following information is compulsory for certified South African wines (Wosa, n.d.[c]):
- name of the area which is defined as a wine ward, district, region or geographical
unit;
- name of the grape cultivar(s);
- vintage;
- the words “estate”, “vineyard”, “origin” and “vintage”; and
- the term “Wine of Origin”.
Now that the three aspects of product (branding, packaging and labelling) have been
discussed, the discussion will move to the second P in the marketing mix, namely price.
70
3.3.2 PRICING IN THE WINE INDUSTRY
Price is the second P in the marketing mix. Price is the amount of money that a consumer
must pay for the benefits of having or using a product or service (Clarke & Chen, 2007:155).
In the wine industry, price is the amount of money that consumers pay for a glass, bottle, box
or case of wine. The price of wine is affected by factors internal to the winery as well as
external environmental factors (Kotler & Armstrong, 2006:309).
Internal factors include the winery’s marketing objectives and the marketing mix strategy that
the winery wants to use (Kotler, Bowen & Makens, 2010:291). Before the winery can set a
price, it must decide on a strategy for each wine that it produces (Kotler & Armstrong,
2006:309). Next, price decisions must be coordinated with product design, distribution and
promotion decisions in order to create a consistent and effective marketing programme
(Kotler, Bowen & Makens, 2010:294). Cost is also an internal factor that demands careful
consideration since costs set the floor price that the winery can charge for its wine (Cant et
al., 2007:335). Ideally, a winery must charge a price that covers both all its costs for
producing, distributing and selling wine, while it delivers a fair rate of return for effort and risk
(Kotler & Armstrong, 2006:312). Finally, organisational considerations must be taken into
account when setting the price (Kotler, Bowen & Makens, 2010:295). The winery should
decide who sets the prices. Small wineries’ prices are most often set by the owner, whereas
larger wineries that sell their produce to companies like Distell make use of their marketing
and sales department to set the price (Benade, 2009).
The external factors that affect pricing decisions include the nature of the market and
demand, competition and other environmental elements (Kotler et al., 2010:295). Whereas
costs incurred in producing a wine set the lower limit of prices, the nature of the market and
demand for the specific wine sets the upper limit of the price. The perception of the
consumer regarding price and value will determine whether the product is priced right or not.
Pricing decisions, like other marketing mix decisions, must be buyer orientated (Kotler &
Armstrong, 2006:9). Effective, buyer-oriented pricing involves understanding how much value
consumers place on the benefits they receive from the product and setting a price that fits
the value (Kotler et al., 2010:296). Each price that the winery might charge for its wine will
lead to a different level of demand. For example, with Tassenberg wine, a blended wine, the
lower the price, the higher the demand, since it is perceived as a low-quality, low-priced
wine. Whereas with Moët en Chandon, a champagne (sparkling wine) from France, the
higher the price, the higher the demand since it is seen as a prestige or status item (Kotler &
Armstrong, 2006:317; Interbrand, 2010).

71
The second external factor that influences pricing is competition. When a winery sets its
prices, it must consider competitor’s costs and prices as well as possible competitor
reactions to a change in the winery’s prices. Other external factors that influence the pricing
decision include economic conditions, political stability, social concerns and technological
advancements (Kotler & Armstrong, 2006:319; Kotler et al,. 2010).
When setting prices, the winery must also consider a number of other factors in its external
environment (Kotler & Armstrong 2006:319). Economic conditions greatly influence a
winery’s pricing strategy. Economic factors such as recession, inflation, foreign exchange
rates and interest rates affect pricing decisions because they affect both the costs of
producing wine as well as consumer perceptions of the wine’s price and value (Strydom,
2004:168).
The winery must also consider what impact its prices will have on other parties in its
environment. The winery should set prices that give resellers a fair profit, encourage their
support, and help them to sell the product effectively (Kotler & Armstrong, 2006:319).
Another important external influence is the government, for example, the new by-law in the
Western Cape which limits the trading hours of alcohol retailers has a direct impact on
wineries (Kotler & Armstrong, 2006:319; Lordan, 2009). Finally, wineries must also consider
the community and the impact that their prices will have (Kotler & Armstrong, 2006:319).
Price is the only element in the marketing mix that generates income while all the other
elements represent costs (Strydom, 2004:165). Since prices can be changed relatively
quickly, they are also one of the most flexible elements of the marketing mix (Kotler et al.,
2010). For this reason, price plays a vital role in marketing the wine product. If the winery has
selected its target market and positioning carefully, the pricing decision is fairly
straightforward.
The next P in the marketing mix is Place, which is discussed below.
3.3.3 PLACE IN THE WINE INDUSTRY
The third P in the marketing mix is Place. In order for customers to be able to buy wine, they
must have access to it - in other words, wine must be available in places where customers
can buy it (Winer, 2007:328). The distribution channel is the marketing instrument that
delivers the product or service through a group of individuals or organisations to the final
consumer (Strydom, 2004:122). Different distribution channels make products and services
available to customers in different ways (Cant et al., 2007:407). The more intermediaries
involved in a distribution channel, the longer the channel length will be (Kotler & Armstrong,
2006:364).

72
The terms “distribution channel” and “supply chain” are interchangeable, depending on the
direction. Smith and Xiao (2008:291) describe the concepts in terms of a river, looking
upstream at suppliers refers to a supply chain while looking downstream at consumers refers
to a distribution channel.
There are three generic consumer distribution channels, which are illustrated in figure 3.6.
Figure 3.6: Consumer distribution channels
Source: Adapted from Kotler & Armstrong (2006:364); Kotler et al. (2010:331)
All wineries use some form of distribution, whether they sell directly to end customers using
wine cellar sales staff (a wine tourism activity) or use a multilevel system made up of several
different companies (Winer, 2007:328). A generic South African winery supply or distribution
chain consists of three components (Smith & Xiao, 2008:292):
(i) Suppliers of inputs such as grapes, barrels, corks and bottles.
(ii) Wine business processes consisting of supply procurement, vinification, and the
delivery of the final product.
(iii) Customers who include distributors, retailers and consumers.
This generic supply or distribution chain is illustrated in figure 3.7.
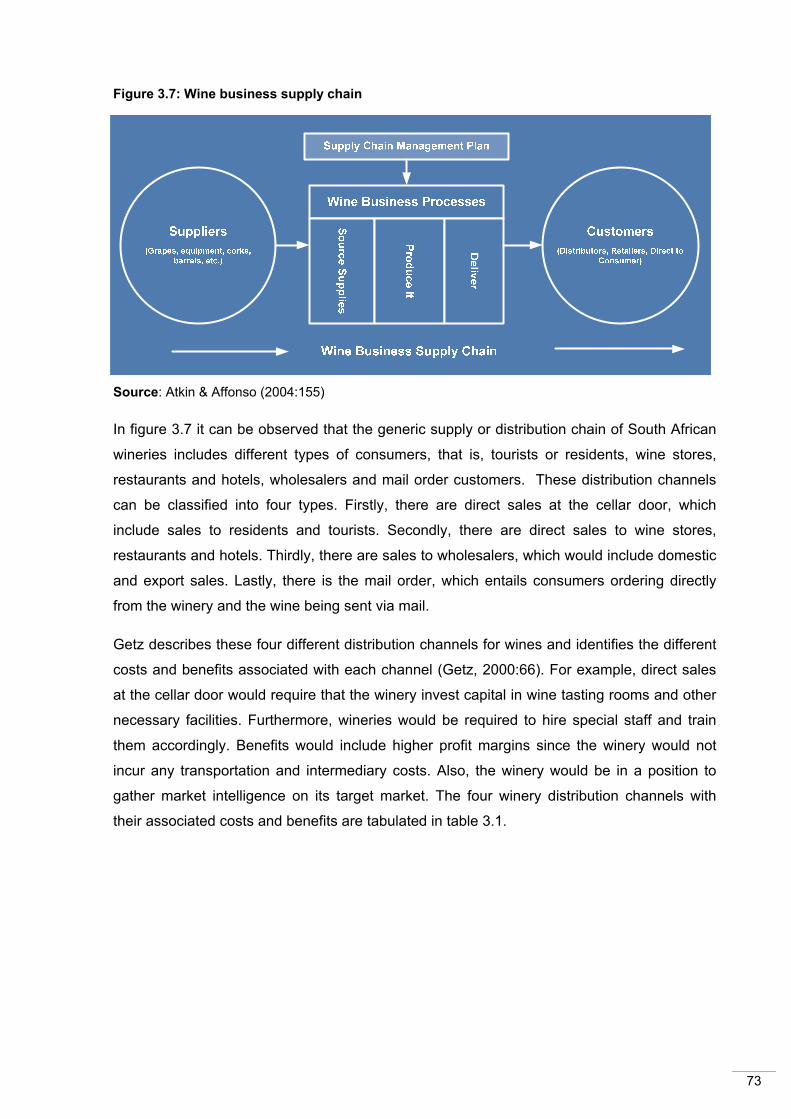
73
Figure 3.7: Wine business supply chain
Source: Atkin & Affonso (2004:155)
In figure 3.7 it can be observed that the generic supply or distribution chain of South African
wineries includes different types of consumers, that is, tourists or residents, wine stores,
restaurants and hotels, wholesalers and mail order customers. These distribution channels
can be classified into four types. Firstly, there are direct sales at the cellar door, which
include sales to residents and tourists. Secondly, there are direct sales to wine stores,
restaurants and hotels. Thirdly, there are sales to wholesalers, which would include domestic
and export sales. Lastly, there is the mail order, which entails consumers ordering directly
from the winery and the wine being sent via mail.
Getz describes these four different distribution channels for wines and identifies the different
costs and benefits associated with each channel (Getz, 2000:66). For example, direct sales
at the cellar door would require that the winery invest capital in wine tasting rooms and other
necessary facilities. Furthermore, wineries would be required to hire special staff and train
them accordingly. Benefits would include higher profit margins since the winery would not
incur any transportation and intermediary costs. Also, the winery would be in a position to
gather market intelligence on its target market. The four winery distribution channels with
their associated costs and benefits are tabulated in table 3.1.

74
Table 3.1: Costs and benefits of distribution channels
Distribution channels
Costs to the winery Benefits to the winery
Direct sales at the cellar door (residents & tourists)
- Capital for facilities
- Special staffing and training
- Participation in events and other promotions to market the winery and the destination
- Possible interference with vineyard and winery operations
- Higher profit margins
- Creation of brand loyalty
- Allows database development for mail-order sales
- Market intelligence
- Enable consumer education
- Savings on advertising and sales visit costs
Direct sales to wine stores, restaurants and hotels
- Sales visits (might require special sales staff)
- Might require incentives to gain acceptance
- Price discounting often required for volume sales
- Higher volume sales
- Wider distribution and awareness of products
Wholesale (domestic & export)
- Requires reliability in production volumes (potential penalties for non-delivery)
- Must ensure consistent high quality in products
- Might require domestic and foreign sales trips
- More sophisticated business management (professional staff)
- Risk of dependence on specific markets or wholesalers
- Highest possible sales potential
- Widest exposure to product leading to brand development and extensions
Mail order - Maintain computer database
- Regular mail-outs
- Shipping costs
- Discounts or reward programmes to loyal customers
- Can quickly expand from local to national and international sales
- Higher volume of sales
- Larger purchases (usually by the case)
- Fosters brand loyalty through relationship marketing
Source: Getz (2000:66)
Place is a crucial element of the marketing mix. The winery’s channel decisions directly affect
every other marketing decision (Kotler at al., 2010). For example, a wine’s price depends
largely on how it is distributed. The price of wines distributed through large retailers such as
Pick ‘n Pay and Checkers would differ from wines distributed through high-quality specialty
75
restaurants. Distribution channels also involve long-term commitments to other businesses
(Kotler & Armstrong, 2006:364). Hence wineries must design their channels with today and
the future’s market environment in mind. Promotion of wines is also affected by the
distribution channel chosen since marketing of wines directly from the cellar door differs from
the marketing of wines to restaurant chains.
Promotion is the last P in the marketing mix and is discussed in the next section.
3.3.4 PROMOTION IN THE WINE INDUSTRY
The final P in the marketing mix is Promotion. Promotion is essentially communicating with
current and potential customers about a specific product (Kotler & Armstrong, 2006:427). A
winery cannot simply expect to sell wine by producing a good wine, pricing it attractively and
making it available to target consumers. Wineries need to communicate with their consumers
about their wines. According to Kotler and Armstrong (2006:427), all communication efforts
must be combined into a consistent and coordinated communications programme or
promotion mix. Boyd (in Strydom, 2004) defines a promotion mix as “... an integrated
programme of promotion mix elements designed to present an organisation and its products
to prospective customers; to communicate need-satisfying attributes of products; to facilitate
sales; and thus contribute to long-term profit performance”.
Each winery’s promotion mix consists of the specific blend of advertising, sales promotion,
public relations, personal selling and direct-marketing tools that are each classified as “below
the line”, “above the line” or “through the line” advertising (Kotler & Armstrong 2006:327;
Smith & Taylor 2004:23). Above the line refers to advertising that is paid for. Below the line
advertising refers communication that is not paid for, such as sales promotions and public
relations (Smith & Taylor, 2004:23). Personal selling and other direct marketing tools used by
the sales force of a winery is known as through the line advertising (Smith & Taylor,
2004:23).
The winery uses the promotion mix to pursue its advertising and marketing objectives (Kotler
et al., 2010). These promotion mix elements are illustrated in figure 3.8 and will now be
discussed in more detail.

76
Figure 3.8: Promotion mix
Source: Adapted from Kotler et al. (2010); Kotler & Armstrong (2006)
3.3.4.1 Advertising of wine products
The first element in the promotion mix is advertising. It has been said that advertising is
perhaps the most powerful component of the promotional mix (George, 2007:244). The
difference between advertising and the other promotional tools is that advertising is paid for,
allowing the company to control the advertising message. Advertising is defined as a paid
form of non-personal presentation and promotion of ideas, goods or services by an identified
sponsor (the marketer) (Kotler et al., 2010; Schoell & Guiltinan in Strydom, 2004:142). The
advertising message is transmitted through a variety of media, namely television, radio,
newspapers, magazines, the Internet, public transport and outside displays (Cant et al.,
2007:444).
Wineries in South Africa make use of different media in order to communicate their
advertising message. Some of the most popular ways include the following:
• magazine advertising (e.g. Wine or Decanter)
• direct mail advertising (e.g. e-mails to wine club members)
• radio advertising (e.g. Talk Radio 702)
• out-of-home advertising (e.g. airport passages)

77
3.3.4.2 Personal selling of wine products
Personal selling is the most effective tool at certain stages of the buying process, particularly
in building up buyers’ preferences, convictions and actions (Kotler et al., 2010:375).
Defined as: “... personal, face-to-face presentation of a product or idea by the firm’s sales
force to the potential consumer for the purpose of making sales and building customer
relationships” (Kotler & Armstrong, 2006:442; Koekemoer in Strydom, 2004:150), personal
selling involves personal interaction between two or more people, to enable each person to
observe the other’s needs and characteristics and make quick adjustments (Kotler &
Armstrong, 2006:443; Kotler et al., 2010:375).
Personal selling is a vital part of most South African wineries’ sales promotion strategies.
Almost all wineries have wine cellar staff that act as a personal sales force.
3.3.4.3 Sales promotion of wine products
The next promotion mix element is called sales promotion. Sales promotion consists of a set
of short-term incentive tools to stimulate or encourage the purchase or sale of a product or
service (Kotler & Armstrong, 2006:443; Cant et al., 2007:462). Various incentive tools can be
used to encourage sales, all of which have unique qualities, and include coupons, free-trials,
tie-in promotions, contests, cents-off deals and premiums (Kotler et al., 2010:376; Cant et al.,
2007:462). Sales promotions are about “buying the product now,” the effect is often short-
lived and not as effective as advertising or personal selling in building long-term customer
brand loyalty (Kotler & Armstrong, 2006:443).
South African wineries make use of different sales promotion incentive tools in order to
market their wines. Some of the most popular tools include the following:
• discounts (e.g. reduced prices at retailers);
• tie-in promotions (e.g. enjoy free dessert at a restaurant if a certain bottle of wine is
purchased);
• patronage awards (e.g. wine club members can buy wines at reduced rates).
78
3.3.4.4 Public relations of wineries
Public relations is another promotion mix element, defined as building good relations with the
company’s various publics by obtaining favourable publicity, building up a good corporate
image, and handling or heading off unfavourable rumours, stories and events (Kotler et al.,
2010:376; Cant et al., 2007:462). News stories, features, sponsorships and events are all
forms of public relations communications and tend to be more believable to consumers than
advertisements (Kotler & Armstrong, 2006:476).
In South Africa, wineries often make use of public relations through press releases, editorials
(e.g. in the Wine magazine) and staged events such as concerts or festivals at the wine
cellar.
3.3.4.5 Direct marketing of wine products
Another promotion mix element is direct marketing. Direct marketing is the direct contact
between carefully targeted individual consumers and the company to obtain an immediate
response and build long-term relationships by using catalogues, direct mail, telemarketing,
mail order, direct-response advertising and e-communications (Kotler et al., 2010:375). The
use of advertising methods as direct marketing represents all or some percentage of the
selling process that is generally handled by personal selling (face-to-face contact) (Miles in
Strydom, 2004:156).
There are many forms of direct marketing, for example, catalogues, telemarketing and direct-
response advertising, but they all share four distinctive characteristics, namely that (Kotler &
Armstrong, 2006:443):
• They are non-public.
• They are directed at a specific person.
• They are immediate and customised, that is, messages can be prepared quickly and
tailored individually.
• They are interactive in that they allow for dialogue between marketer and consumer.
Wineries in South Africa can make use of direct marketing in various ways. Some of the
direct marketing tools that wineries are currently using include the following:
• direct mail (e.g. Warwick sends newsletters to all its wine club members);
• catalogues (e.g. wine guides are included in wine and food-related magazines).
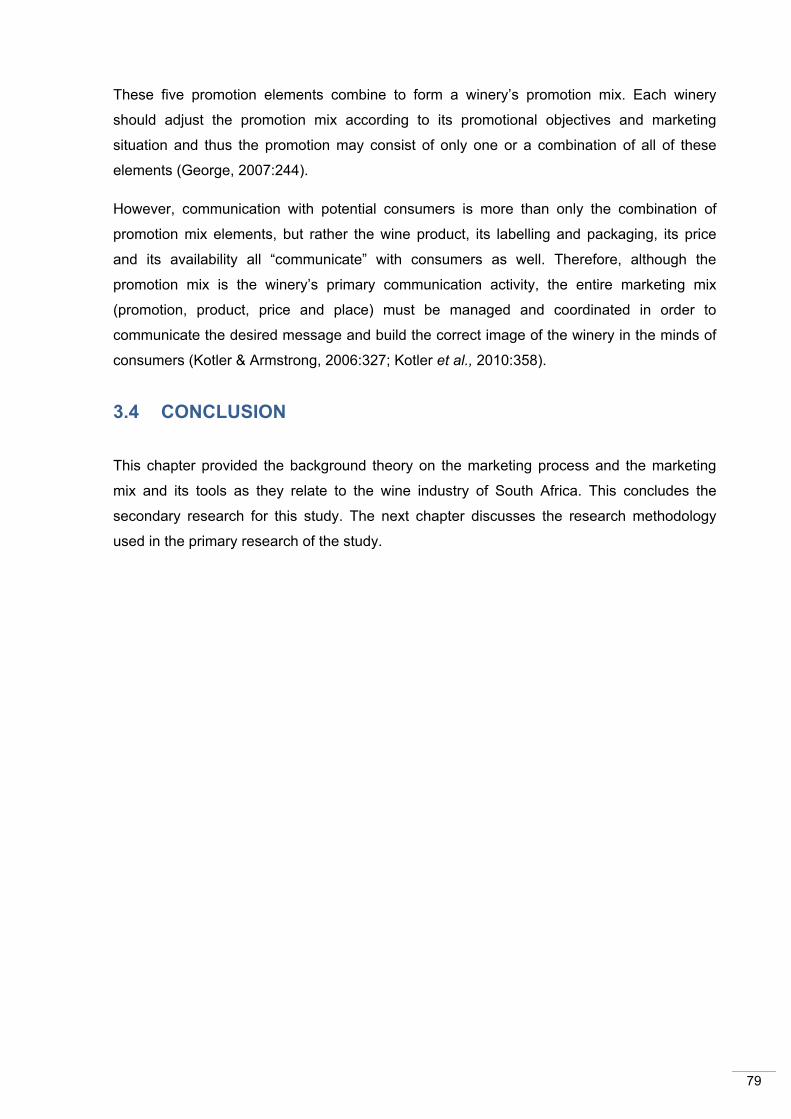
79
These five promotion elements combine to form a winery’s promotion mix. Each winery
should adjust the promotion mix according to its promotional objectives and marketing
situation and thus the promotion may consist of only one or a combination of all of these
elements (George, 2007:244).
However, communication with potential consumers is more than only the combination of
promotion mix elements, but rather the wine product, its labelling and packaging, its price
and its availability all “communicate” with consumers as well. Therefore, although the
promotion mix is the winery’s primary communication activity, the entire marketing mix
(promotion, product, price and place) must be managed and coordinated in order to
communicate the desired message and build the correct image of the winery in the minds of
consumers (Kotler & Armstrong, 2006:327; Kotler et al., 2010:358).
3.4 CONCLUSION
This chapter provided the background theory on the marketing process and the marketing
mix and its tools as they relate to the wine industry of South Africa. This concludes the
secondary research for this study. The next chapter discusses the research methodology
used in the primary research of the study.

80
4. CHAPTER 4: RESEARCH METHODOLOGY
4.1 INTRODUCTION
Chapters 2 and 3 comprised the secondary research for this study. These chapters provided
the theoretical foundation on which the primary research is based. Key concepts such as the
wine industry, the wine tourism industry and the marketing mix tools were reviewed. The
focus of this chapter turns to the primary research conducted on the wineries that make up
the Stellenbosch Wine Route in South Africa.
The primary research objective of this study is to investigate the current role that wine
tourism plays in the marketing of wineries in the Stellenbosch Wine Route. This objective is
underpinned by several secondary research objectives. The first secondary objective is to
compile a corpographic profile of the wineries in this route. This is followed by the second
secondary objective, which is to determine the current wine tourism offering by the
Stellenbosch Wine Route. The third secondary objective pertains to the perceived
advantages and disadvantages of wine tourism experienced by the wineries in the
Stellenbosch Wine Route. The role that wine tourism plays in the promotion strategies of
these wineries makes up secondary objective 4. The final secondary objective relates to the
importance that the wineries of the Stellenbosch Wine Route attaches to wine tourism in the
building of their brand equity.
This chapter begins with a description of the study site for the primary research, which is
followed by a description of the research design of the study. The remainder of the chapter
is devoted to the various steps of the research process as postulated by Tustin, Ligthelm,
Martins and Van Wyk in 2005 and Cooper and Schindler in 2008. Consequently, this chapter
is divided into eight sections as illustrated in figure 4.1.
CHAPTER 4: RESEARCH METHODOLOGY
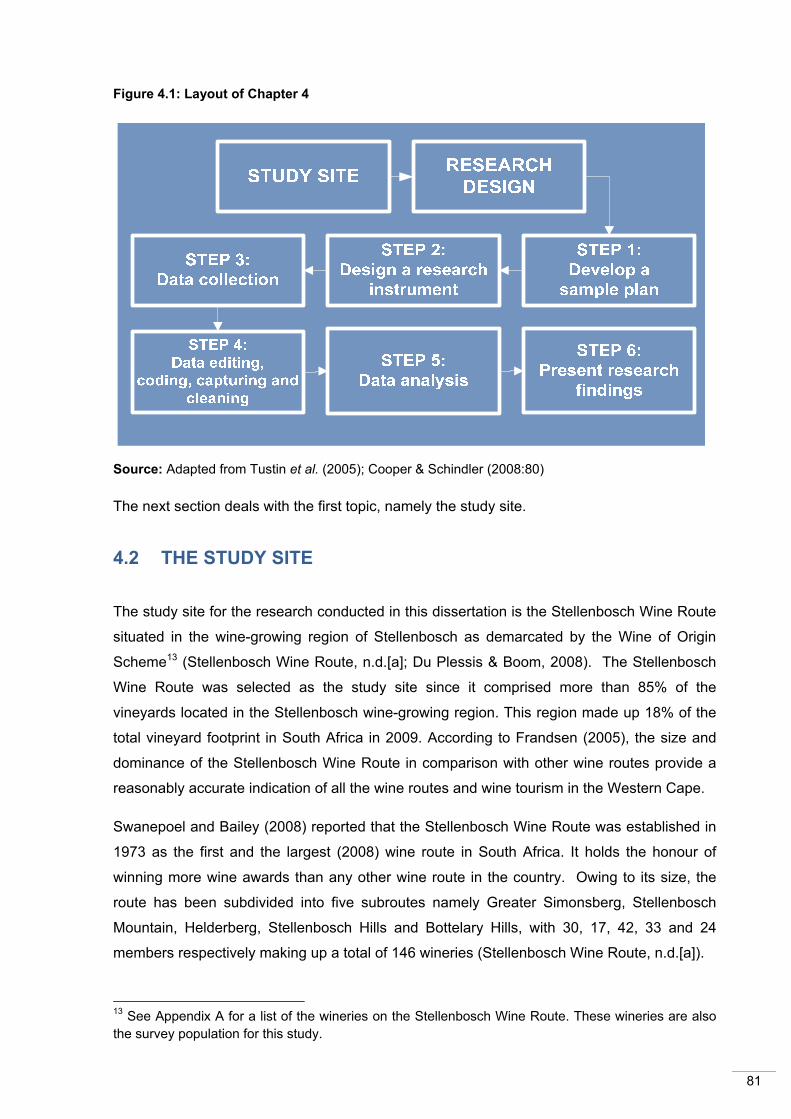
81
Figure 4.1: Layout of Chapter 4
Source: Adapted from Tustin et al. (2005); Cooper & Schindler (2008:80)
The next section deals with the first topic, namely the study site.
4.2 THE STUDY SITE
The study site for the research conducted in this dissertation is the Stellenbosch Wine Route
situated in the wine-growing region of Stellenbosch as demarcated by the Wine of Origin
Scheme13 (Stellenbosch Wine Route, n.d.[a]; Du Plessis & Boom, 2008). The Stellenbosch
Wine Route was selected as the study site since it comprised more than 85% of the
vineyards located in the Stellenbosch wine-growing region. This region made up 18% of the
total vineyard footprint in South Africa in 2009. According to Frandsen (2005), the size and
dominance of the Stellenbosch Wine Route in comparison with other wine routes provide a
reasonably accurate indication of all the wine routes and wine tourism in the Western Cape.
Swanepoel and Bailey (2008) reported that the Stellenbosch Wine Route was established in
1973 as the first and the largest (2008) wine route in South Africa. It holds the honour of
winning more wine awards than any other wine route in the country. Owing to its size, the
route has been subdivided into five subroutes namely Greater Simonsberg, Stellenbosch
Mountain, Helderberg, Stellenbosch Hills and Bottelary Hills, with 30, 17, 42, 33 and 24
members respectively making up a total of 146 wineries (Stellenbosch Wine Route, n.d.[a]).
13 See Appendix A for a list of the wineries on the Stellenbosch Wine Route. These wineries are also the survey population for this study.
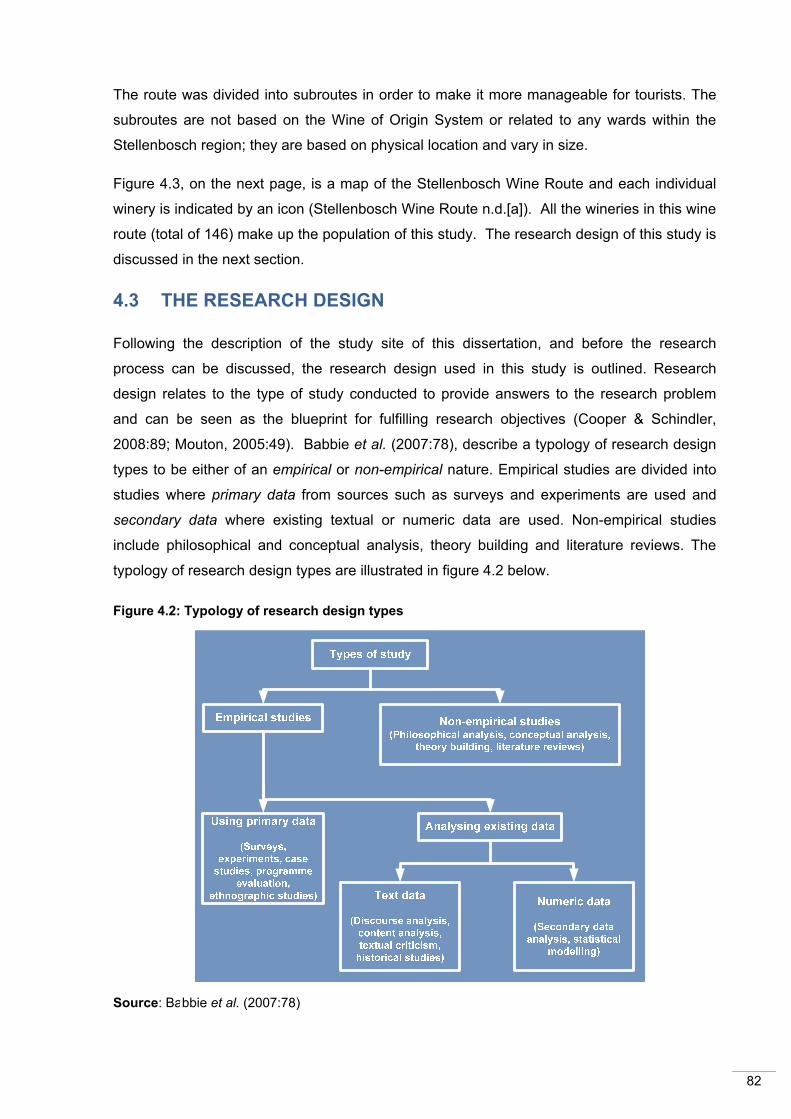
82
The route was divided into subroutes in order to make it more manageable for tourists. The
subroutes are not based on the Wine of Origin System or related to any wards within the
Stellenbosch region; they are based on physical location and vary in size.
Figure 4.3, on the next page, is a map of the Stellenbosch Wine Route and each individual
winery is indicated by an icon (Stellenbosch Wine Route n.d.[a]). All the wineries in this wine
route (total of 146) make up the population of this study. The research design of this study is
discussed in the next section.
4.3 THE RESEARCH DESIGN
Following the description of the study site of this dissertation, and before the research
process can be discussed, the research design used in this study is outlined. Research
design relates to the type of study conducted to provide answers to the research problem
and can be seen as the blueprint for fulfilling research objectives (Cooper & Schindler,
2008:89; Mouton, 2005:49). Babbie et al. (2007:78), describe a typology of research design
types to be either of an empirical or non-empirical nature. Empirical studies are divided into
studies where primary data from sources such as surveys and experiments are used and
secondary data where existing textual or numeric data are used. Non-empirical studies
include philosophical and conceptual analysis, theory building and literature reviews. The
typology of research design types are illustrated in figure 4.2 below.
Figure 4.2: Typology of research design types
Source: Babbie et al. (2007:78)

83
Figure 4.3: The Stellenbosch Wine Route
Source: Stellenbosch Wine Route (n.d.[c])
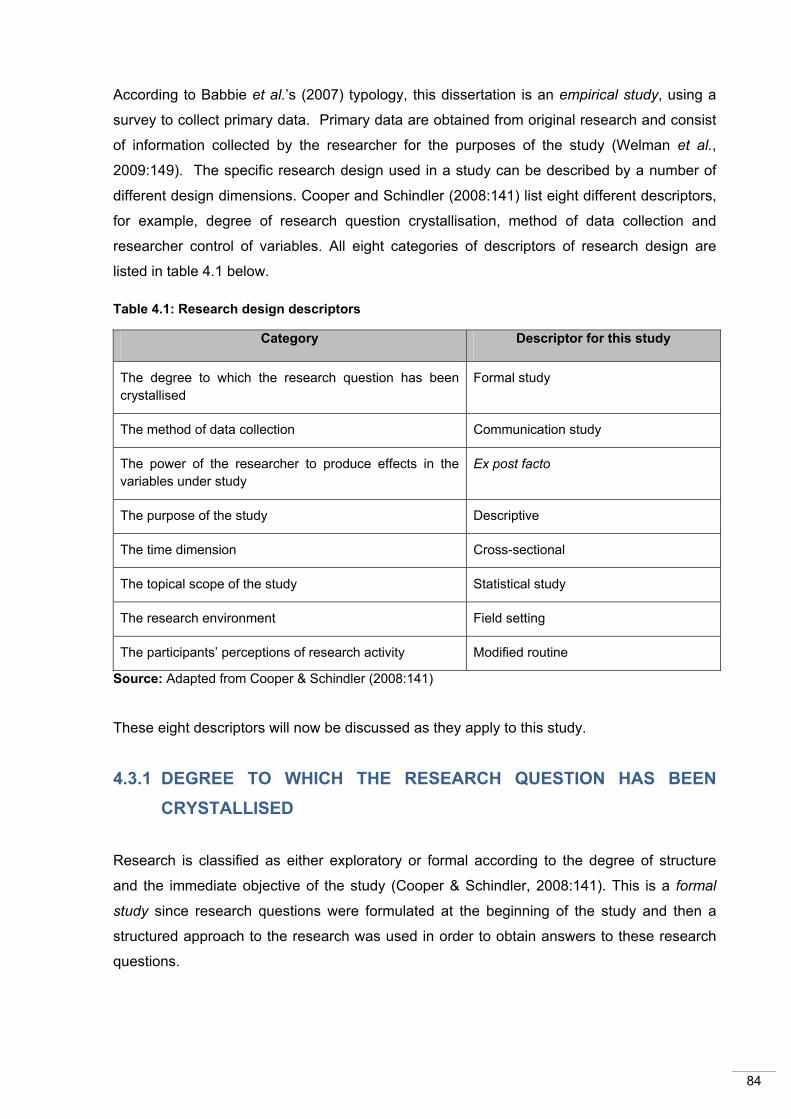
84
According to Babbie et al.’s (2007) typology, this dissertation is an empirical study, using a
survey to collect primary data. Primary data are obtained from original research and consist
of information collected by the researcher for the purposes of the study (Welman et al.,
2009:149). The specific research design used in a study can be described by a number of
different design dimensions. Cooper and Schindler (2008:141) list eight different descriptors,
for example, degree of research question crystallisation, method of data collection and
researcher control of variables. All eight categories of descriptors of research design are
listed in table 4.1 below.
Table 4.1: Research design descriptors
Category Descriptor for this study
The degree to which the research question has been crystallised
Formal study
The method of data collection Communication study
The power of the researcher to produce effects in the variables under study
Ex post facto
The purpose of the study Descriptive
The time dimension Cross-sectional
The topical scope of the study Statistical study
The research environment Field setting
The participants’ perceptions of research activity Modified routine
Source: Adapted from Cooper & Schindler (2008:141)
These eight descriptors will now be discussed as they apply to this study.
4.3.1 DEGREE TO WHICH THE RESEARCH QUESTION HAS BEEN CRYSTALLISED
Research is classified as either exploratory or formal according to the degree of structure
and the immediate objective of the study (Cooper & Schindler, 2008:141). This is a formal
study since research questions were formulated at the beginning of the study and then a
structured approach to the research was used in order to obtain answers to these research
questions.
85
4.3.2 METHOD OF DATA COLLECTION
The method of data collection can be classified as either a monitoring or a communication
process (Blumberg, Cooper & Schindler, 2005:128). Monitoring includes inspection by the
researcher of the activities of a subject or the nature of some material without receiving any
responses (Cooper & Schindler, 2008:143). In a communication study, respondents are
questioned and responses are collected by either personal or impersonal means
(Blumberg et al., 2005:128). This study is therefore a communication study where data was
collected by means of a self-administered survey sent to respondents electronically.
4.3.3 RESEARCHER CONTROL OF VARIABLES
Studies are either experimental or ex post facto, depending on the researcher’s ability to
manipulate variables during the data collection process (Salkind, 2009:13; Cooper &
Schindler, 2008:143). When a researcher attempts to control or manipulate variables, it is
called an experiment (Welman et al., 2009:79; Cooper & Schindler, 2008:143). In an ex post
facto study, the researcher has no control over the variables in the sense of being able to
manipulate any of them (Welman et al., 2009:88). The researcher had no control over
variables in this study and can only report what happened. The study is therefore classified
as ex post facto.
4.3.4 PURPOSE OF THE STUDY
The purpose of a study can be described as either reporting, descriptive, causal-explanatory
or causal-predictive (McDaniel & Gates, 2001:28-29; Cooper & Schindler, 2008:143-144).
The difference between these descriptors lies in their objectives. This study is descriptive in
nature since it focuses on the “who, what, when, where and how” of a topic and provides a
picture of the specific details of a situation (Neuman, 2007:16).
4.3.5 THE TIME DIMENSION
The time dimension of a study indicates whether it is conducted once (cross-sectional) or will
be repeated over an extended period of time (longitudinal) (Leedy & Ormrod, 2010:186). In
this study, data were collected over a nine-week period, which provides a snapshot of a
single point in time and was only carried out once - hence this study can be described as a
cross-sectional study (Neuman, 2007:17).
86
4.3.6 THE TOPICAL SCOPE
The topical scope of a study refers to either a statistical study or a case study (Leedy &
Ormrod, 2010:108; Blumberg et al., 2005:131). A case study places more emphasis on a full
contextual analysis of fewer events and their interrelationship, while statistical studies
attempt to capture a population’s characteristics by making inferences from a sample’s
characteristics (Cooper & Schindler, 2008:144). Statistical analysis will be done on the data
collected in this study in an attempt to describe some of the characteristics of the whole
population and make inferences about certain aspects of the population (Weiers,
2008:5,102). The topical scope of this study is therefore statistical.
4.3.7 THE RESEARCH ENVIRONMENT
The research environment describes the conditions under which the data are collected
(McDaniel & Gates, 2001:214). Primary research data can be collected under actual
environmental conditions or under staged or manipulated conditions (Cooper & Schindler,
2008:145). Respondents were required to complete the survey on their own computer at the
winery, and the data were therefore collected under actual environmental or field conditions.
4.3.8 PARTICIPANTS’ PERCEPTUAL AWARENESS
Participants’ perceptual awareness is described as the subtle or major changes that occur in
their responses when they perceive that a research study is being conducted (Cooper &
Schindler, 2008:708). There are three levels of perception, as highlighted below (Blumberg et
al., 2005:131):
(i) Participants perceive no deviations from everyday routines.
(ii) Participants perceive deviations, but as being unrelated to the researcher.
(iii) Participants perceive deviations as researcher induced.
In this study, participants are aware of the research being conducted. Each participant was
contacted telephonically, the reason for the research was explained, and the participant was
then asked to participate in the study. The level of awareness for this study is therefore level
3: Participants perceive deviations as researcher induced.
Now that the research design that was used in this study has been described using Cooper
and Schindler’s (2008) eight descriptors, the first step in the research process, namely the
sample plan, will be discussed.

87
4.4 THE SAMPLE PLAN
The first step in the research process entails developing a sample plan. In this section the
sample plan that was used for this study will be discussed under the following headings:
survey population, survey sample and survey collection method.
4.4.1 SURVEY POPULATION
Welman et al. (2009:52), define a population as “… the total collection of all units of analysis
about which the researcher wishes to make specific conclusions”. In other words, a
population consists of all the elements (e.g. all the visitors to South African wineries during
2008, or all the wine produced by Meerlust during the 2009 harvest) that relate to a specific
research problem about which certain conclusions are drawn. The survey population for this
study consists of all the wineries that form part of the Stellenbosch Wine Route of South
Africa, a total of 146 wineries. See Annexure A for a list of all these wineries as listed by the
Stellenbosch Wine Route (accessed 03/04/2009).
4.4.2 SURVEY SAMPLE
When conducting a survey, researchers may undertake either a census or sampling in order
to be able to draw conclusions about the behaviour or characteristics of the entire population
(Cooper & Schindler, 2008:374). Weiers (2008:840, 850) defines a census as “the actual
measurement or observation of all possible elements from the population, this can be viewed
as a ‘sample’ that includes the entire population,” whereas a sample is defined as “a smaller
number, or subset, of the people or objects that exist within the population”.
A census is favoured above a sample only when the population size is small enough to
survey each element and when the data regarding the population is easily accessible
(Weiers, 2008:118). Thus the population of this study complies with these requirements and
can be classified as a census due to the following reasons:
(i) The population consists of 146 wineries in the Stellenbosch Wine Route, which is
small enough to be subjected to a census without too many time, financial and human
resource constraints.
(ii) The details regarding the population are easily accessible in that they are recorded by
the Stellenbosch Wine Route and can be easily obtained from the website (accessed
03/04/2009).

88
4.4.3 SURVEY COLLECTION METHOD
There are several ways in which data can be collected from respondents, for example,
observations, interviews, focus groups and surveys (Kumar, 2005:118). Each data collection
method is also used to obtain certain types of information. Information such as biographical
details, typical behaviour, opinions, beliefs and attitudes, consistent with the type of
information that the researcher wanted to acquire, can be obtained through the use of survey
questionnaires (Welman et al., 2009:152). Cooper and Schindler (2008:711) define a self-
administered survey as follows: “An instrument delivered to the participant via personal
(intercept) or non-personal (computer-delivered, mail-delivered) means that is completed by
the participant without additional contact with an interviewer”. In this study, the data collection
instrument was a self-administered email questionnaire.
The population, sample and survey collection method were briefly discussed in this section.
In the next section, the process of designing the research instrument will be discussed.
4.5 DESIGN OF THE RESEARCH INSTRUMENT
Designing a research instrument is step 2 in the research process illustrated in figure 4.4.
This section provides an overview of the activities involved in designing the self-administered
email questionnaire for this study. Topics that will be covered include question generation,
construction of the questionnaire and pilot testing of the questionnaire.
4.5.1 QUESTION GENERATION
As mentioned in the previous section, the data collection instrument for this study was a self-
completion email questionnaire. In order to design and pretest the questionnaire, the
researcher went through the following process:
(i) Visit to the 2008 Stellenbosch Wine Festival and the study site. The researcher visited
the Stellenbosch Wine Festival in 2008. At the festival, the researcher observed the
various wineries on show and participated in the festival by visiting each stall, tasting
various wines, watching a fashion and food show and attending a food and wine tutorial
hosted by Mr Beyers Truter. The researcher then visited various wineries (including
Delheim, Muratie, Blaauwklippen, Kanonkop, Bergkelder and Guardian Peak) to
observe their facilities and the products on offer. The researcher also used the visit to
establish industry contacts, who were subsequently interviewed as part of the study.

89
(ii) Telephonic interviews with three wineries in the Stellenbosch wine region. The
researcher conducted an informal telephonic interview with managers at three wineries
that form part of the study population. The wineries were questioned on the marketing
of their winery, their attitude towards wine tourism and whether research into wine
tourism as a promotion and branding tool would be valuable to them.
The results of the interviews can be summarised as follows:
Winery A: The manager at Winery A indicated that they had no official marketing department
and that no one employed by the winery had any formal marketing education. Their
marketing is done by the owner and is based primarily on past experience and what wineries
in the surrounding area (competitors) were doing to market their wines. The winery stated a
need for any relevant information on marketing and branding and was also open to using
wine tourism as a marketing and branding tool even though they did not currently have any
facilities or offer any products to wine tourists.
Winery B: Winery B has a large marketing department with three full-time staff devoted to
branding and promoting their wines. The manager stated that the winery staff are
enthusiastic about wine tourism and have regular winery tours, a tasting room and a
restaurant and that they facilitate a harvest festival specifically aimed at attracting tourists to
the winery premises. She stated that they were planning on spending R400 000 in 2009 on
developing the premises in anticipation of tourists visiting the area in 2010. The manager
also indicated that the winery would consider any information on wine consumers, wine
tourists, marketing techniques and branding methods as valuable. She specifically wanted to
know whether personal contact with consumers (such as a winery tour, meeting the wine
maker and wine festivals) were creating more brand loyalty than other less personal
marketing methods (e.g. magazine or radio advertisements).
Winery C: Winery C outsources their marketing. The manager of the winery also indicated
that the winery has no interest in wine tourism. The manager stated that the winery was
paying the South African Wine Route Association to develop wine tourism for them and that
they were not willing to do anything more in this regard. The manager said that although
people are excited about tourism, he feels that it is mere hype and does not have any
substance. This winery believes that wine tourism is a waste of money and that other
marketing methods are more efficient.

90
(iii) Secondary research. Based on the visit to the 2008 Stellenbosch Wine Festival, visiting
wineries in the Stellenbosch region and the telephonic interviews conducted with three
wineries, extensive secondary research was conducted. The New Zealand Winery
Survey conducted by Christensen, Hall and Mitchell (2004) was instrumental in the
development of the questionnaire, as many of the questions were derived from the
research it contains.
Also significant in developing the questionnaire was South African research on wine
routes conducted by Bruwer (2003). The rest of the questions in the questionnaire were
derived from previous research done both inside and outside South Africa (Demhardt
2003; Preston-Whyte in Hall et al., 2000; Getz, 1999; Getz, 2000) that relates to wine
tourism, marketing and branding.
(iv) Interviews with industry specialists. After the questionnaire had been designed, four
industry specialists were consulted regarding the content formulation and scope of the
questions included in this instrument. Their input was invaluable in ensuring that the
questionnaire was relevant to the South African wine industry.
All these inputs were used in the construction of the questionnaire, which is discussed next.
4.5.2 CONSTRUCTION OF THE QUESTIONNAIRE
The self-administered email questionnaire of this study comprised an introductory paragraph
and five sections, from A to E. A copy of the questionnaire is included in Appendix C. The
introductory paragraph briefly explains the purpose of the study to respondents, gives an
indication of the amount of time that it would take to complete the questionnaire, as well as
assuring them of the confidentiality of their answers.
The five sections of the questionnaire are as follows:
Section A - Corpographic profile and tourism products and services
Section B - Visitor profile
Section C - Advantages and disadvantages of wine tourism to wineries
Section D - Wine tourism and promotion of the winery product
Section E - Wine tourism and brand equity
According to Kumar (2005:138), the underlying principle of constructing the questionnaire is
to ensure that each question relates to a research objective, and that each research
objective is adequately covered in the questionnaire. Table 4.2 below indicates which
questions in the survey answer the various research objectives that were stated in chapter 1.

Tabl
e 4.
2: S
truc
ture
of t
he q
uest
ionn
aire
Res
earc
h ob
ject
ive
Cor
resp
ondi
ng s
ectio
n of
que
stio
nnai
re
Type
So
urce
s us
ed in
qu
estio
n ge
nera
tion
Sect
ion
Num
ber
Que
stio
n C
lass
ifica
tion
To
com
pile
a
corp
ogra
phic
pr
ofile
of
w
iner
ies
in
the
Ste
llenb
osch
W
ine
Rou
te
of
Sou
th A
frica
A
1 S
ubro
ute
Nom
inal
Mul
tiple
-cho
ice
ques
tions
re
quiri
ng a
sin
gle
or m
ultip
le-
choi
ce re
spon
se
• S
telle
nbos
ch W
ine
Rou
te (2
009a
) •
Ben
ade
(200
9)
• B
ruw
er (2
003)
•
Hal
l, C
hris
tens
en
& M
itche
ll (2
004)
•
Thom
as (2
009)
2 S
ize
of w
iner
y O
rdin
al
3 O
wne
rshi
p st
atus
N
omin
al
5 N
umbe
r of e
mpl
oyee
s In
terv
al
6 C
ella
r doo
r ope
ning
tim
es
Nom
inal
To
inve
stig
ate
the
rang
e of
w
ine
tour
ism
pr
oduc
ts
avai
labl
e in
the
Ste
llenb
osch
W
ine
Rou
te o
f Sou
th A
frica
A 4
Tast
ing
fee
stru
ctur
e N
omin
al
Mul
tiple
-cho
ice
ques
tions
re
quiri
ng a
sin
gle
or m
ultip
le-
choi
ce re
spon
se.
• B
enad
e (2
009)
•
Bru
wer
(200
3)
• H
all,
Chr
iste
nsen
&
Mitc
hell
(200
4)
7 P
rodu
cts
and
serv
ices
of
fere
d N
omin
al
To c
ompi
le a
pro
file
of t
he
visi
tors
to
the
win
erie
s in
the
S
telle
nbos
ch
Win
e R
oute
of
S
outh
Afri
ca
B
8 V
isito
r cou
nt –
yes
or n
o N
omin
al
Q8:
Mul
tiple
-cho
ice
ques
tions
re
quiri
ng a
sin
gle
or m
ultip
le-
choi
ce re
spon
se.
Q9
to
11:
Sin
gle
resp
onse
qu
estio
ns
requ
iring
a
perc
enta
ge
valu
e to
be
at
tribu
ted
to e
ach
varia
ble.
Q12
: A fi
ve-p
oint
Lik
ert s
cale
qu
estio
n m
easu
ring
agre
emen
t, ra
ngin
g fro
m
stro
ngly
di
sagr
ee
(1)
to
stro
ngly
agr
ee (5
).
• Ba
ck (2
009)
•
Ben
ade
(200
9)
• C
hris
tens
en,
Hal
l &
Mitc
hell
(200
4)
• G
etz1
(999
) •
Mar
x (2
009)
9 P
rofil
e of
do
mes
tic
vs
inte
rnat
iona
l tou
rists
In
terv
al
10
Gen
der p
rofil
e of
vis
itors
In
terv
al
11
Age
pro
file
of v
isito
rs
Inte
rval
12
Tour
ist m
otiv
atio
ns to
vis
it w
iner
y O
rdin
al
____
__
91
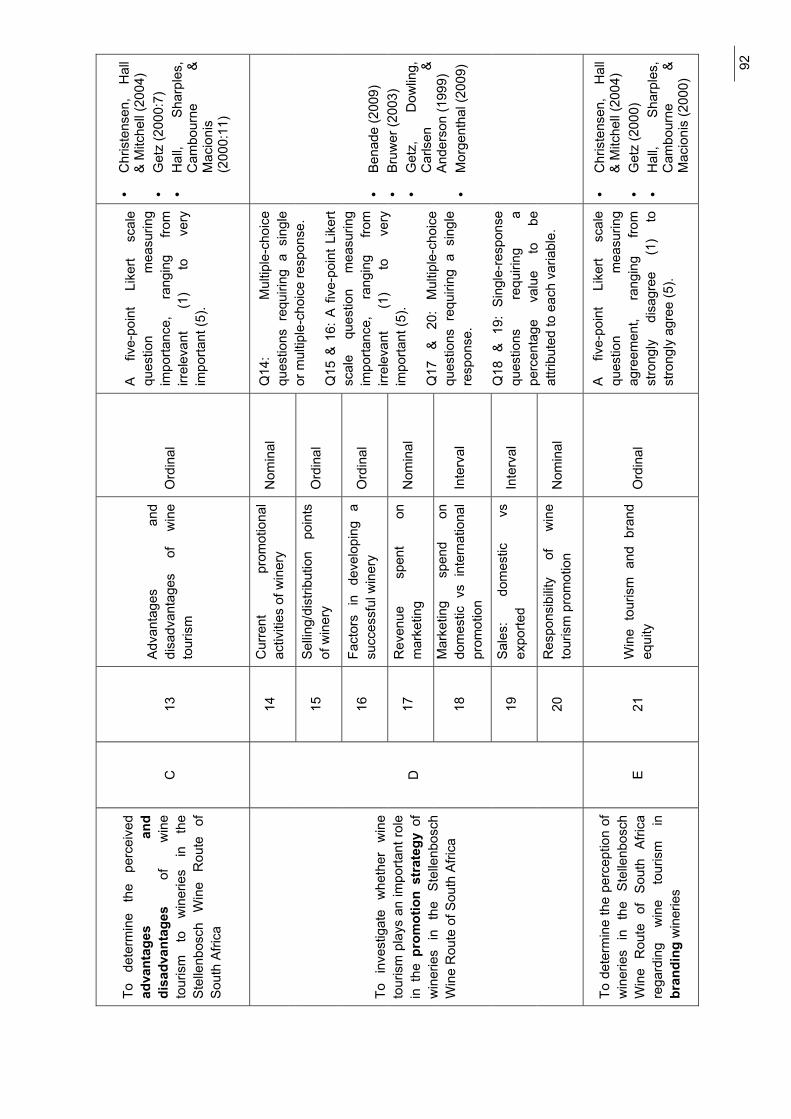
To
dete
rmin
e th
e pe
rcei
ved
adva
ntag
es
and
disa
dvan
tage
s of
w
ine
tour
ism
to
w
iner
ies
in
the
Ste
llenb
osch
W
ine
Rou
te
of
Sou
th A
frica
C
13
Adv
anta
ges
and
disa
dvan
tage
s of
w
ine
tour
ism
O
rdin
al
A
five-
poin
t Li
kert
scal
e qu
estio
n m
easu
ring
impo
rtanc
e,
rang
ing
from
irr
elev
ant
(1)
to
very
im
porta
nt (5
).
• C
hris
tens
en,
Hal
l &
Mitc
hell
(200
4)
• G
etz
(200
0:7)
•
Hal
l, Sh
arpl
es,
Cam
bour
ne
&
Mac
ioni
s (2
000:
11)
To
inve
stig
ate
whe
ther
w
ine
tour
ism
pla
ys a
n im
porta
nt ro
le
in t
he p
rom
otio
n st
rate
gy o
f w
iner
ies
in
the
Ste
llenb
osch
W
ine
Rou
te o
f Sou
th A
frica
D
14
Cur
rent
pr
omot
iona
l ac
tiviti
es o
f win
ery
Nom
inal
Q
14:
Mul
tiple
-cho
ice
ques
tions
req
uirin
g a
sing
le
or m
ultip
le-c
hoic
e re
spon
se.
Q15
& 1
6: A
fiv
e-po
int
Like
rt sc
ale
ques
tion
mea
surin
g im
porta
nce,
ra
ngin
g fro
m
irrel
evan
t (1
) to
ve
ry
impo
rtant
(5).
Q17
&
20
: M
ultip
le-c
hoic
e qu
estio
ns r
equi
ring
a si
ngle
re
spon
se.
Q18
& 1
9: S
ingl
e-re
spon
se
ques
tions
re
quiri
ng
a pe
rcen
tage
va
lue
to
be
attri
bute
d to
eac
h va
riabl
e.
• B
enad
e (2
009)
•
Bru
wer
(200
3)
• G
etz,
D
owlin
g,
Car
lsen
&
And
erso
n (1
999)
•
Mor
gent
hal (
2009
)
15
Sel
ling/
dist
ribut
ion
poin
ts
of w
iner
y O
rdin
al
16
Fact
ors
in
deve
lopi
ng
a su
cces
sful
win
ery
Ord
inal
17
Rev
enue
sp
ent
on
mar
ketin
g N
omin
al
18
Mar
ketin
g sp
end
on
dom
estic
vs
inte
rnat
iona
l pr
omot
ion
Inte
rval
19
Sale
s:
dom
estic
vs
ex
porte
d In
terv
al
20
Res
pons
ibilit
y of
w
ine
tour
ism
pro
mot
ion
Nom
inal
To d
eter
min
e th
e pe
rcep
tion
of
win
erie
s in
th
e S
telle
nbos
ch
Win
e R
oute
of
S
outh
A
frica
re
gard
ing
win
e to
uris
m
in
bran
ding
win
erie
s
E 21
W
ine
tour
ism
and
bra
nd
equi
ty
Ord
inal
A
five-
poin
t Li
kert
scal
e qu
estio
n m
easu
ring
agre
emen
t, ra
ngin
g fro
m
stro
ngly
di
sagr
ee
(1)
to
stro
ngly
agr
ee (5
).
• C
hris
tens
en,
Hal
l &
Mitc
hell
(200
4)
• G
etz
(200
0)
• H
all,
Shar
ples
, C
ambo
urne
&
M
acio
nis
(200
0) __
____
92

93
Once a new survey instrument has been designed, it should be tested before it is sent to
the survey population of the study. Pretesting of the questionnaire is discussed next.
4.5.3 PILOT TESTING OF QUESTIONNAIRE
When a new survey is developed, it is useful to test it before it is distributed to the entire
study sample. In this study, before the questionnaire was sent to the entire survey
population, a pilot or pretest was conducted. A pilot or pretest is a field test of the data
collection instrument on a small group of individuals who are representative of the
population for which the instrument is intended. A pilot test is designed to discover
questions that will cause the respondent problems or discomfort, that are unclear and
need to be reworded, that have flawed measurement procedures and questions that need
to be dropped, added or repositioned (Blumberg et al., 2005:68; Welman et al.,
2009:148).
The survey instrument in this study was pretested in the following way:
(i) The questionnaire was completed by seven colleagues to test for
(a) the general layout of questions;
(b) the fact that the questions were clear and easily understood;
(c) the time that it would take to complete it.
(ii) In four in-depth interviews, the questionnaire was discussed at length with four
industry specialists for their opinion and input.
(iii) The questionnaire was then analysed by a statistician to ensure that the
information gained from this instrument would be sufficient in answering all the
objectives formulated in chapter 1.
After each step in the pretest, minor adjustments were made to the questions, items and
layout of the questionnaire.
The process involved in designing the research instrument was discussed in this section.
Section 4.6 looks at the next step in the research process, namely data collection.

94
4.6 DATA COLLECTION
Data collection is the third step in the research process and is often referred to as the
‘fieldwork’ (Tustin et al., 2005:99). In this study, primary data were collected in the
following way:
(i) The final questionnaire was converted into an electronic format by the Bureau for
Market Research at Unisa.
(ii) The researcher contacted each respondent telephonically.
- The purpose of the research was explained and any questions that the
respondent might have, were answered. Their assistance in completing the
survey was requested.
(iii) An email was sent to each respondent who had agreed to complete the survey.
- Each email consisted of a brief cover letter again stating the purpose of the
study as well as an electronic link to the questionnaire (see Appendix C for a
copy of the cover letter).
(iv) After a period of two weeks, another email was sent to each respondent to remind
them of the survey and again request their assistance.
The completed electronic questionnaires were received by the electronic data bank of the
Bureau for Market Research during the months of November and December 2009 and
January 2010.
The original population for this study consisted of all the wineries in the Stellenbosch
Wine Route, that is, 146 wineries in total. Of these wineries, seven were removed from
the population because they did not constitute an individual wine farm, but formed part of
other wineries. The population for this study thus decreased from 146 to 139 wineries.
In the sample population of 139 wineries, 138 were contacted telephonically; one winery
could not be reached telephonically and was only contacted via email. A total of 92
wineries agreed to complete the questionnaire, six refused and 41 did not commit to
completing the questionnaire. Of the 92 wineries that agreed to complete the
questionnaire, 82 respondents attempted to fill in the questionnaire, but only 46
respondents completed the entire questionnaire. Based on these numbers, the response
rate was calculated at 33%.
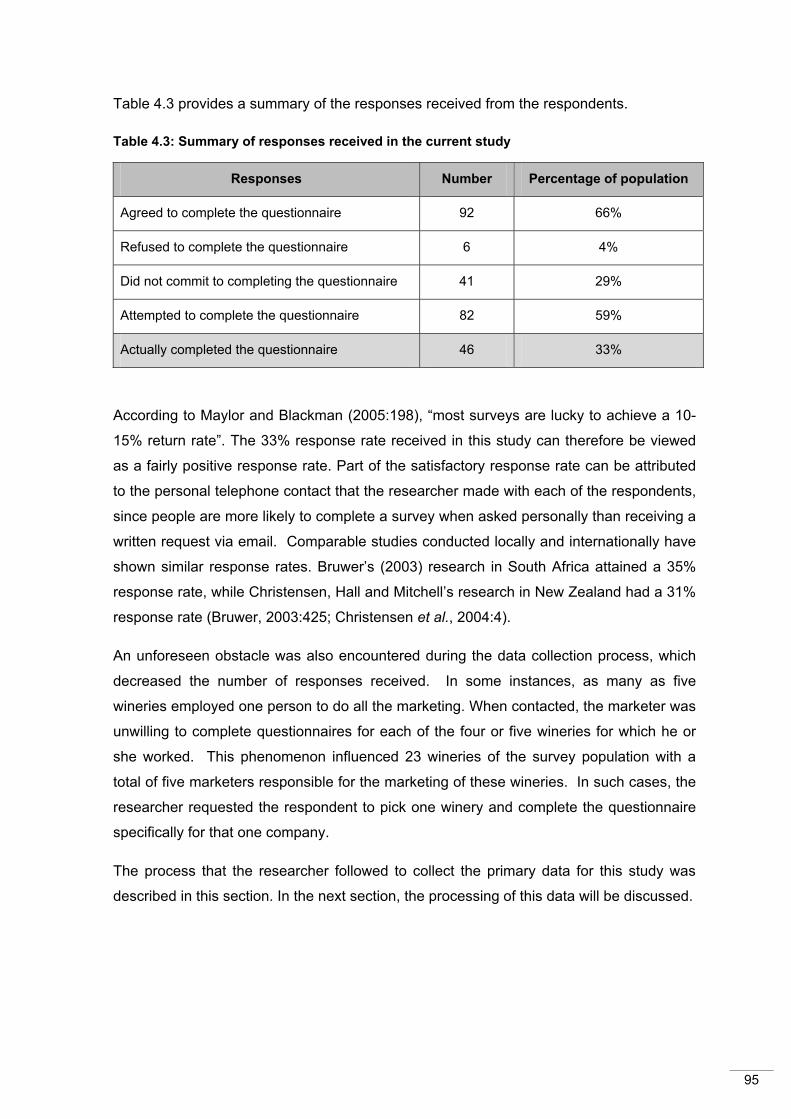
95
Table 4.3 provides a summary of the responses received from the respondents.
Table 4.3: Summary of responses received in the current study
Responses Number Percentage of population
Agreed to complete the questionnaire 92 66%
Refused to complete the questionnaire 6 4%
Did not commit to completing the questionnaire 41 29%
Attempted to complete the questionnaire 82 59%
Actually completed the questionnaire 46 33%
According to Maylor and Blackman (2005:198), “most surveys are lucky to achieve a 10-
15% return rate”. The 33% response rate received in this study can therefore be viewed
as a fairly positive response rate. Part of the satisfactory response rate can be attributed
to the personal telephone contact that the researcher made with each of the respondents,
since people are more likely to complete a survey when asked personally than receiving a
written request via email. Comparable studies conducted locally and internationally have
shown similar response rates. Bruwer’s (2003) research in South Africa attained a 35%
response rate, while Christensen, Hall and Mitchell’s research in New Zealand had a 31%
response rate (Bruwer, 2003:425; Christensen et al., 2004:4).
An unforeseen obstacle was also encountered during the data collection process, which
decreased the number of responses received. In some instances, as many as five
wineries employed one person to do all the marketing. When contacted, the marketer was
unwilling to complete questionnaires for each of the four or five wineries for which he or
she worked. This phenomenon influenced 23 wineries of the survey population with a
total of five marketers responsible for the marketing of these wineries. In such cases, the
researcher requested the respondent to pick one winery and complete the questionnaire
specifically for that one company.
The process that the researcher followed to collect the primary data for this study was
described in this section. In the next section, the processing of this data will be discussed.

96
4.7 DATA PROCESSING
In the research process, step 4 is referred to as data processing. The processing of data
involves capturing, coding and editing of the raw data. Each of these steps will be
discussed in more detail in this section.
4.7.1 DATA CAPTURING
The data were captured electronically on the Bureau for Market Research’s database as
soon as the respondents had completed their questionnaires online. Data were then
automatically converted into a Microsoft Excel spreadsheet, which was updated on a
continuous basis throughout the nine-week data collection period.
4.7.2 DATA CODING
McDaniel and Gates (2001:393) define coding as the process of grouping and assigning
numeric numbers or codes to various responses in a particular question. All the
questions in the questionnaire were closed-ended and assigned categories and numbers
were built into the design of the questionnaire, thus precoded.
4.7.3 DATA EDITING
Editing involves a thorough and critical examination of each questionnaire to ensure that it
is acceptable for use and to prepare it for coding and capturing. In order for data to be
deemed usable, it must comply with certain criteria such as adhering to sample
requirements, being relevant to the question, the completeness of the questionnaire and
the consistency of answers (Tustin et al., 2005:455).
The data in this study were edited in order to identify and minimise errors, incompleteness
and inconsistencies - for example, the data were scrutinised in order to determine
whether there are any invalid numbers, such as a 3, appearing in a column where 1
indicates male and 2 indicates female (Van Zyl, 2002:75). Furthermore, data that were
received in a format different to the “expected” format were edited in a consistent manner.
A case in point is where respondents were required to indicate the number of employees
employed in the different sections of the winery (Question 5). A whole number, such as 5
or 6 was expected, but, in some instances, answers such as “10-20” or “10 in October”
were received. In cases where respondents gave a range, such as “10-20”, the rounded-

97
up average was taken (15) and in cases like “10 in October”, the data were omitted
entirely.
This section explained the data processing involved in the study. Data analysis, the next
step in the research process, will now be discussed.
4.8 DATA ANALYSIS
Step 5 in the research process is analysing the data that was collected and processed.
Data analysis is a key step since data that have been collected are of little use to the
researcher until it has been organised and represented in a form that makes the
information understandable and meaningful (Tustin et al., 2005:451). By organising data,
it is easier to identify trends, patterns and other characteristics that would not be apparent
during a simple shuffle through a pile of questionnaires or other forms of data collection
(Weiers, 2008:16).
The data in this study were analysed using both descriptive and statistical methods.
These methods, as well as the reliability and validity of the data that were collected, will
be discussed in this section.
4.8.1 DESCRIPTIVE STATISTICS
Descriptive statistics describes or summarises the data obtained for a group of individual
units of analysis. Frequencies, means, medians and quartiles are the descriptive statistics
used in the current study since nominal, ordinal and interval data were collected (Weiers,
2008:842; Welman et al., 2009:229-231).
Frequencies refer to the number of times a certain response was given (Wordnet, n.d.). A
mean is the sum of the values for all observations divided by the number of observations
(McDaniel & Gates, 2001:363,410). The median is the midpoint or numerical centre of a
set of data, with exactly as many observations above it as below it, dividing the data into
two (Leedy & Ormrod, 2010:265). Just as the median divides the data into two groups of
equal size, quartiles divide data into four groups of equal size (Weiers, 2008:70). Each
quartile comprises 25% of the observations (the median is also the second quartile).
Graphs and tables are used to present the statistics in a succinct manner.
98
4.8.2 INFERENTIAL STATISTICS
In this section, inferential techniques used to derive inferential statistics will be discussed.
However, it is necessary to first discuss a concept of great importance in all inferential
statistics namely statistical significance. This concept is explained below.
Statistical significance
When the whole population is not tested, it may happen that the differences, which
appear to exist between groups, do not exist in reality (in the real population). The p-value
is calculated to indicate the probability that the difference is due to chance.
There are guidelines, which determine which differences are large enough to be
considered real and which may be due to chance (Van Zyl, 2002). The most common
practice is to state the level of significance that the probability value should attain. A
significance level is a statement of the probability that an observed difference is due to
chance. The most frequently used levels of statistical significance are 0.10, 0.05 and 0.01
(Tustin et al., 2005:590). For the purpose of this study, the level of 0.05 (except where
indicated otherwise) was used as the level of statistical significance indicated as a two-
tailed p-value which means that if the p-value is smaller than 0.05, it can be accepted that
the observed difference is real and not due to chance.
The term two-tailed (non-directional) p-value means that the hypothesis (H1) did not
predict in which probability distribution the significance would be, that is it did not specify a
direction (Tustin et al., 2005:588). Since the current study was only exploratory and no
expected results were predicted, the two-tailed p-value was used.
Non-parametric tests
Parametric tests make use of assumptions about the distribution and variances of
populations (Welman et al., 2009:230). Tests that do not value such stringent
assumptions are known as non-parametric tests (Tustin et al., 2005:591).
In this study, non-parametric tests were used because:
• They are free of assumptions that are made when using parametric tests.
• The data used is ordinal.
• The realised sample size was quite small.

99
The first non-parametric test that was conducted is called a binomial test.
Binomial test
A binomial test is a statistical procedure used to examine the distribution of a single
dichotomous variable in the case of small samples (Blumberg et al., 2005:666-667). The
test has two versions, depending on the size of the sample (n) and the population
proportions ( and 1- ) (Tustin et al., 2005:617).
When n or n(1- ) is less than 5, the test uses the binomial distribution and provides an
exact probability value (small sample case). When n and n(1- ) are both greater than 5,
the test uses the normal approximation to the binomial to calculate a probability value
(large sample case) (Tustin et al., 2005:617).
In this study, the binomial test was used to examine the difference between a sample
proportion and a given proportion (0.5 in this case). The normal (z) approximation was
used since n , n(1- ) was larger than 5.
The second non-parametric test conducted is called the Mann-Whitney U test.
Mann-Whitney U test
The Mann-Whitney U test is the non-parametric counterpart of the t-test for independent
groups without the t-test’s limiting assumptions (Welman et al., 2009:230). The U-test is
used with two independent samples given that the data are at least ordinal (Blumberg et
al., 2005:580).
In calculating the U-test, all the observations were combined and ranked algebraically
from the smallest to the largest. The largest negative score received the lowest rank and
where ties occurred, the average rank was assigned like in other tests (Blumberg et al.,
2005:580).
The null hypothesis test by the Mann-Whitney U-test is that there is no difference between
the two groups in terms of location, focusing on the median as a measure of central
tendency (Tustin et al., 2005:624).
The last non-parametric test used in this study is called the Kruskal-Wallis test.

100
Kruskal-Wallis test
The Kruskal-Wallis test is regarded as the non-parametric alternative to the regular one-
way analysis of variance and is used to compare the medians of three or more
independent samples (Welman et al., 2009:230; Weiers, 2008:519, 845). The test is a
generalised version of the Mann-Whitney U test and does not assume that the samples
have been drawn from normally distributed populations with equal variances (Weiers,
2008:519).
All the scores in the entire pool of observations are ranked from the smallest to the
largest. The rank sum of each sample is then calculated, with ties being distributed
(Blumberg et al., 2005:582).
The non-parametric tests conducted in this study have now been explained. Next, the
reliability and validity of the questionnaire will be discussed.
4.8.3 RELIABILITY AND VALIDITY
According to Salkind (2001:105), “Reliability and validity are the hallmarks of good
measurement.” The reliability and validity of a measurement instrument should be
calculated in order to determine whether the instrument has actually measured the
intended concepts, as well as verify the consistency with which the concepts were
measured (Leedy & Ormrod, 2010:28-29).
Babbie et al. (2007:119), describes reliability as the ability of a measuring instrument to
obtain the same results when the same thing is measured more than once. There are
different types of reliability measurements, which include test-retest reliability, internal
consistency reliability, equivalent forms reliability and interrater reliability (Leedy &
Ormrod, 2010:93).
Owing to the nature of the study, the only form of reliability that could be considered is
internal consistency reliability. The most widely used measure of internal consistency is
the Cronbach alpha, which requires a sample size of at least 300 to be considered an
unbiased estimator of internal consistency.
New research by Yurdugül (2008) has indicated that the Cronbach alpha value will be
unbiased for small sample sizes provided certain assumptions are met. Since the number
of respondents in this study was only 46, and some of the required assumptions as stated
in Yurdugül were not met, no calculations were made. Thus, the reliability of the
measuring instrument was not measured.
101
The other important aspect to discuss is validity, which is the extent to which the
instrument measures what it is actually intended to measure. Validity can take on different
forms, namely face validity, content validity and criterion validity (Neuman, 2007:118).
In the current study, the type of validity used to establish the trustworthiness of the results
from the survey is called content validity. A measurement instrument has high content
validity if its items or questions represent the entire “universe of items” from which it is
drawn (Salkind, 2009:118). After the questionnaire design had been completed, four
industry specialists were consulted about the content formulation and scope of the
questions included in this survey instrument to ensure that it had an acceptable level of
content validity.
4.9 PRESENTATION OF DATA FINDINGS
The last step in the research process is the presentation of data findings. Findings must
be presented in such a way that it is clear and easily understood, making use of data-
display techniques where necessary (Kumar 2005:248). The next chapter deals with the
detailed presentation of the research findings in this study.
4.10 LIMITATIONS OF THE STUDY
No researcher ever encounters a perfect research environment where perfect data can be
collected (Van Zyl, 2002). Results obtained through research should always be
interpreted and used in light of the limitations of the data collected and statistical tests
conducted in the study.
This study is no exception and the researcher did encounter limitations, which should be
kept in mind when reading through the results of the study in chapter 5.
Firstly, the response rate can be seen as a limitation to the research study in that 44% of
respondents that started the questionnaire failed to complete it and only 33% of the entire
population completed the survey. Reasons for this might include that it was too long or too
difficult. In the questionnaire pilot phase, it was made clear that the questionnaire could
not be completed in less than 15 minutes.
The targeted respondents are people involved with the running of the winery and they are
pressed for time. Fifteen minutes may have been too long to commit to completing a
questionnaire. Furthermore, there is also the general problem of too many people
distracting them and the general inertia or dislike of people to fill in forms.
102
Secondly, bias was introduced as the result of the subroutes not being proportionally
representative. In other words, the subroutes had varying response rates, which could
have skewed the research results.
However, it should be noted that the responses received are representative in terms of
winery size in the South African wine industry. The fact that the sample is representative
of winery size of the entire South African wine industry contributes to the validity of this
study. This is discussed in chapter 5, section 5.2.1, under heading A2.
4.11 CONCLUSION
This chapter addressed the research methodology used in the study. The first part of the
chapter gave a brief overview of the study site where the research was conducted and
then a detailed explanation of the research design that was used. The remainder of the
chapter was dedicated to the application of the research process to this study.
A sample plan was developed and the research instrument and a self-administered email
questionnaire designed. Thereafter primary data were collected which were subsequently
edited, captured, coded and cleaned. The data were then analysed using various
statistical analysis tools. The outcome of the data analysis as well as the research
findings will be discussed in detail in the next chapter. The chapter concluded with a brief
discussion of the reliability and validity of the research instrument as well as the
limitations of the data collected in the research process.
103
5. CHAPTER 5: DATA ANALYSIS OF WINERIES IN THE STELLENBOSCH WINE
5.1 INTRODUCTION
In the previous chapter, the research methodology that was used in this study was
explained by describing the research design and primary research process that was
followed. Primary data were collected and statistical analyses conducted to address the
primary and secondary research objectives of the study. The purpose of this chapter is to
present the analysis of the data in an orderly manner.
This chapter is divided into two sections; section 5.2 focuses on the descriptive analyses
of the research findings, while section 5.3 explains the testing of the hypothesis by using
different statistical tests and analysing the inferential statistics. The discussion of the data
analyses is presented in the same order in which the data were collected in the
questionnaire.
The descriptive and inferential statistics in this study, which include charts and tables,
were constructed with the use of statistical software packages, namely SPSS 17.0 for
Windows and Excel for Windows 2007.
5.2 DESCRIPTIVE ANALYSES OF THE RESEARCH FINDINGS
The descriptive analysis of the research findings describes the corpographic profile of
wineries in the Stellenbosch Wine Route as well as the products and services currently
offered by these wineries. The next section analyses the visitor profile to the wineries.
This is followed by a discussion of the analyses of responses regarding the advantages
and disadvantages of wine tourism to wineries and its role in the promotion of winery
products. Lastly, the findings on the influence of wine tourism on brand equity are
highlighted. The descriptive analyses of the corpographic profile of wineries and their
products and services will now be discussed.
CHAPTER 5: DATA ANALYSIS OF WINERIES IN THE STELLENBOSCH WINE ROUTE
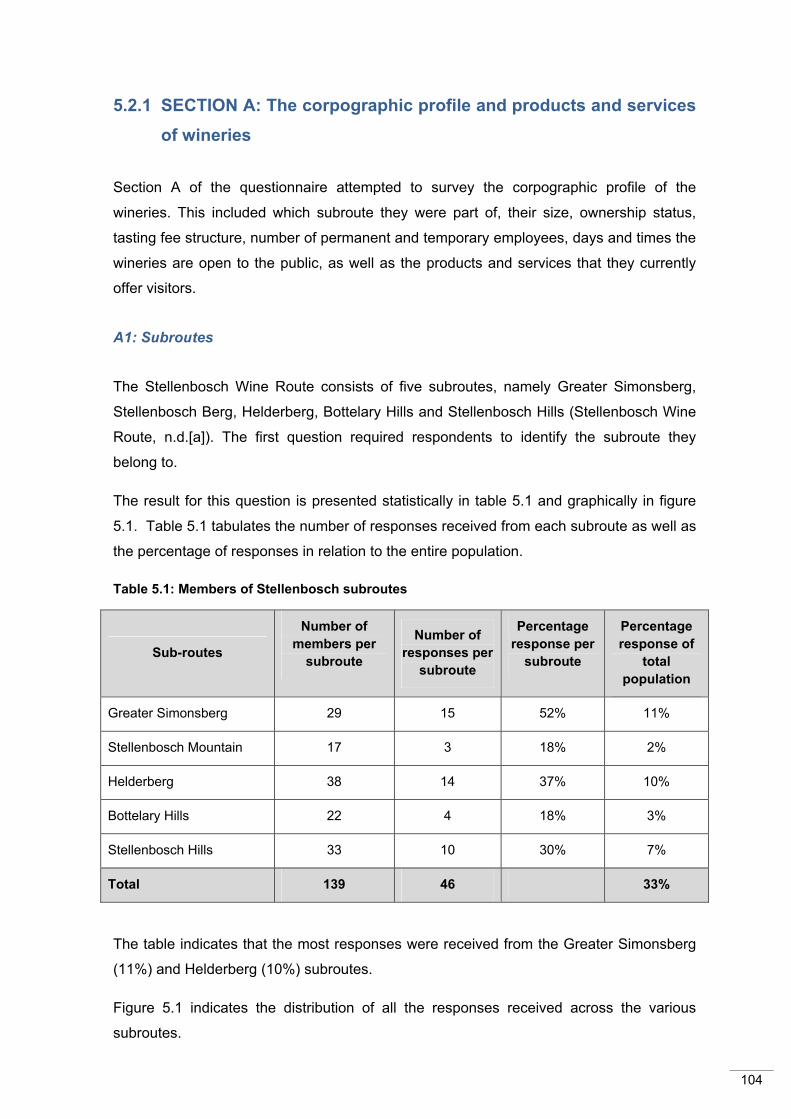
104
5.2.1 SECTION A: The corpographic profile and products and services of wineries
Section A of the questionnaire attempted to survey the corpographic profile of the
wineries. This included which subroute they were part of, their size, ownership status,
tasting fee structure, number of permanent and temporary employees, days and times the
wineries are open to the public, as well as the products and services that they currently
offer visitors.
A1: Subroutes
The Stellenbosch Wine Route consists of five subroutes, namely Greater Simonsberg,
Stellenbosch Berg, Helderberg, Bottelary Hills and Stellenbosch Hills (Stellenbosch Wine
Route, n.d.[a]). The first question required respondents to identify the subroute they
belong to.
The result for this question is presented statistically in table 5.1 and graphically in figure
5.1. Table 5.1 tabulates the number of responses received from each subroute as well as
the percentage of responses in relation to the entire population.
Table 5.1: Members of Stellenbosch subroutes
Sub-routes
Number of members per
subroute
Number of responses per
subroute
Percentage response per
subroute
Percentage response of
total population
Greater Simonsberg 29 15 52% 11%
Stellenbosch Mountain 17 3 18% 2%
Helderberg 38 14 37% 10%
Bottelary Hills 22 4 18% 3%
Stellenbosch Hills 33 10 30% 7%
Total 139 46 33%
The table indicates that the most responses were received from the Greater Simonsberg
(11%) and Helderberg (10%) subroutes.
Figure 5.1 indicates the distribution of all the responses received across the various
subroutes.
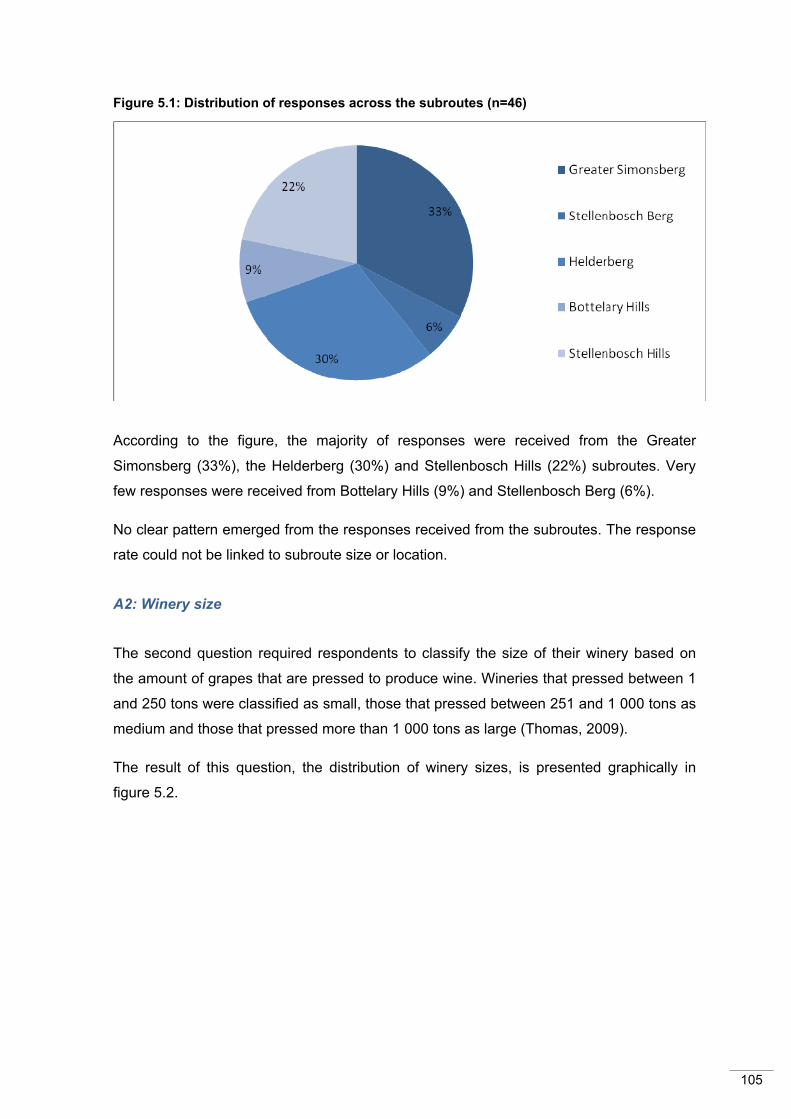
105
Figure 5.1: Distribution of responses across the subroutes (n=46)
According to the figure, the majority of responses were received from the Greater
Simonsberg (33%), the Helderberg (30%) and Stellenbosch Hills (22%) subroutes. Very
few responses were received from Bottelary Hills (9%) and Stellenbosch Berg (6%).
No clear pattern emerged from the responses received from the subroutes. The response
rate could not be linked to subroute size or location.
A2: Winery size
The second question required respondents to classify the size of their winery based on
the amount of grapes that are pressed to produce wine. Wineries that pressed between 1
and 250 tons were classified as small, those that pressed between 251 and 1 000 tons as
medium and those that pressed more than 1 000 tons as large (Thomas, 2009).
The result of this question, the distribution of winery sizes, is presented graphically in
figure 5.2.

106
Figure 5.2: Distribution of respondents’ winery size (n=46)
Figure 5.2 indicates that a little more than half of the respondents (51%) are classified as
small, while medium wineries account for 38% of respondents. The minority (11%) of
wineries are classified as large.
The distribution of winery size in the study is similar to the structure of the entire South
African wine industry. Statistics show that 90% of all wineries in South Africa are
classified as small to medium (1 to 1 000 tons), with 10% of producers classified as large
(1 001 tons and more) (SAWIS 2009a:6). In this study, 89% of respondents are small to
medium wineries, while only 11% are classified as large.
A3: Ownership status of the winery
Question 3 required respondents to classify the ownership status of their winery as either
a private company, public company, sole trader, cooperative, closed corporation, trust,
nonprofit company, partnership or BEE partnership (Bruwer, 2003:426).
The result of this question is presented graphically in figure 5.3, which illustrates the
distribution of the different types of ownership status of wineries in the study.
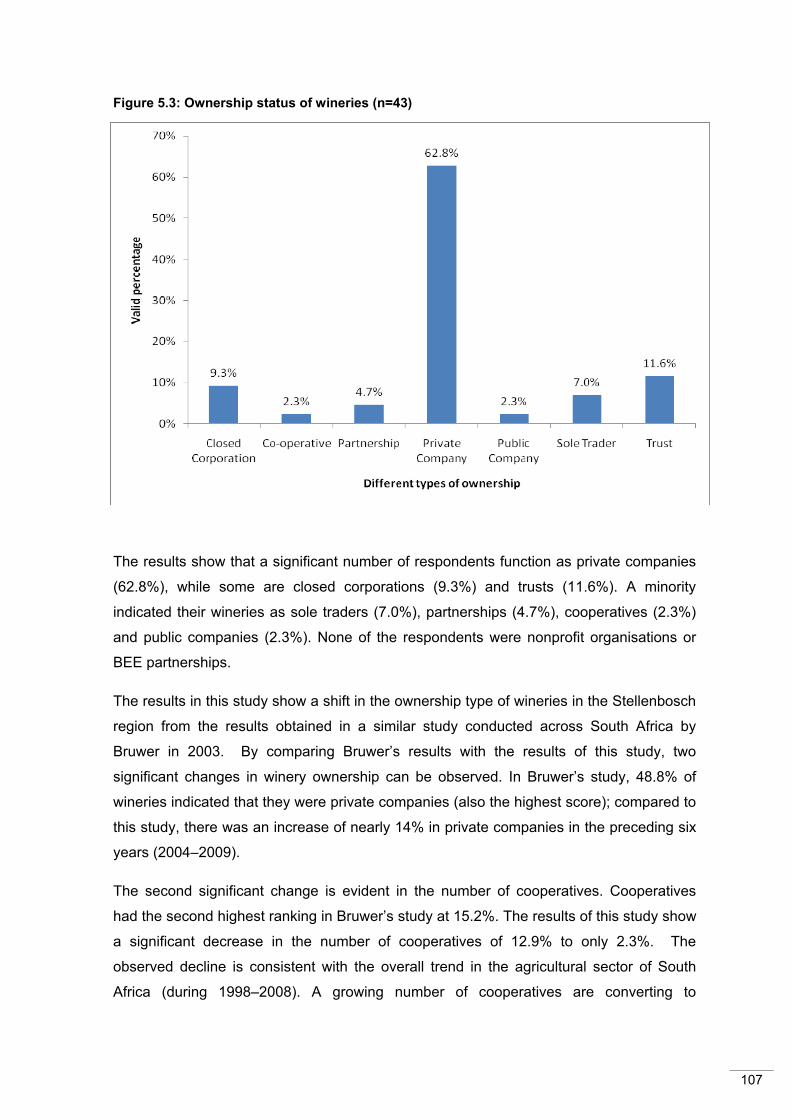
107
Figure 5.3: Ownership status of wineries (n=43)
The results show that a significant number of respondents function as private companies
(62.8%), while some are closed corporations (9.3%) and trusts (11.6%). A minority
indicated their wineries as sole traders (7.0%), partnerships (4.7%), cooperatives (2.3%)
and public companies (2.3%). None of the respondents were nonprofit organisations or
BEE partnerships.
The results in this study show a shift in the ownership type of wineries in the Stellenbosch
region from the results obtained in a similar study conducted across South Africa by
Bruwer in 2003. By comparing Bruwer’s results with the results of this study, two
significant changes in winery ownership can be observed. In Bruwer’s study, 48.8% of
wineries indicated that they were private companies (also the highest score); compared to
this study, there was an increase of nearly 14% in private companies in the preceding six
years (2004–2009).
The second significant change is evident in the number of cooperatives. Cooperatives
had the second highest ranking in Bruwer’s study at 15.2%. The results of this study show
a significant decrease in the number of cooperatives of 12.9% to only 2.3%. The
observed decline is consistent with the overall trend in the agricultural sector of South
Africa (during 1998–2008). A growing number of cooperatives are converting to

108
companies and listing on the Johannesburg Stock Exchange because of a need for
capital formation as well as to release cooperative member’s funds (Van Huyssteen, n.d.).
A4: Tasting fees
The fourth question required respondents to indicate all the different types of tasting fees
that apply to the winery, for example, whether tasting is free of charge or charged per
sample or per set of samples (Christensen et al., 2004).
The result of this question is presented graphically in figure 5.4, which illustrates the
distribution of the different types of tasting fees of wineries.
Figure 5.4: Tasting fee types (n=46)
The results show that the most popular type of tasting fee used by wineries is charging a
tasting fee but then discounting the price if a bottle of wine is purchased from the winery
(47.8%). The second most popular type of tasting fee used is charging a fee for a set of
samples (26.1%). Very few respondents indicated the use of other methods which
included the following: tasting that is free of charge (8.7%), fee per sample (4.3%), fee

109
which includes a glass (6.5%) and giving a discounted rate if case of wine is purchased
after tasting (2.2%).
Bruwer’s (2003) research showed that 59% of wineries charged no fee at all, while 41%
charged some form of tasting fee. The results in this study indicated that only 28% of
wineries provide tasting free of charge, with 72% charge some form of tasting fee. This
indicates a noticeably large increase of 31% in wineries that charge tasting fees in the
Stellenbosch region from 2003 to 2009.
However, the results of this question are consistent with other New World wine-growing
regions where it is common practice to charge a tasting fee and apply the fee towards any
bottle purchased by the customer (Kelley, 2006; Kolyesnikova, 2006).
A5: Number of employees
Question 5 asked respondents to indicate how many people the winery employed for
each section of the wine estate, divided into full-time, part-time and outsourced positions.
Table 5.2 shows the total number of employees per section (n) as well as the total
number of employees per employment category (Total n). The mean indicates the
average number of people working either full time, part time or on contract per
employment category of the winery.
Table 5.2: Total number of employees per section/category of the winery (n=44)
Employment category Full time Part time Outsourced Total n
N Mean n Mean n Mean
Wine production or wine making 145 3.3 105 2.4 83 1.9 333
Wine tourism or tourism related 121 2.8 88 2.0 7 0.2 216
Restaurant or food related 175 4.0 129 2.9 1 n.a. 305
Rest of the wine estate activities (e.g. vineyard/farm related)
398 9.0 368 8.4 108 2.5 874
Total 839 19.1 690 15.7 199 4.5
Table 5.2 indicates that the area of the winery that requires the most labour is the
vineyard itself. The results confirm that the agricultural section of a winery is extremely
labour intensive (Thach, 2007; SA Wine Council, 2007).
110
Furthermore, the results of the question presented in table 5.2 show that the employment
structure of wineries has remained largely unchanged compared to Bruwer’s (2003)
research results. Wine production or wine making and the rest of the wine estate
activities still comprise the largest number of people in both the full-time and part-
time/outsourced employee categories, while a smaller number of employees are still
employed in the wine tourism and restaurant or food-related sections of the winery.
A6: Operating hours of the winery
Question 6 required respondents to indicate when the winery is open to the public. The
question was twofold. The first part of the question asked respondents when the winery
was open during the year and respondents could choose more than one option as it
applied to their winery. The second part of the question required respondents to indicate
the specific operating hours of the winery.
The results of the first part of the question showed that most cellars are open the entire
year and that hardly any distinction is made between summer and winter. Nearly 20% of
wineries are only open by appointment and only 2.2% are only open during festival times.
The results of the second part of the question showed that the vast majority (92.7%) of
wineries are open the whole day, from Mondays to Fridays. A large percentage of
wineries are also open most of the day on Saturdays (68.3%), Sundays (51.2%) and most
public holidays (51.2%).
A7: Products and services offered by wineries
The last question in section A related to the products and services that wineries offer.
These products and services include, for example, cellar door sales, self-guided winery
tours, overnight accommodation and picnic facilities at the winery.
The results of this question are depicted graphically in figure 5.5, which presents the
results of the different products and services offered at wineries.
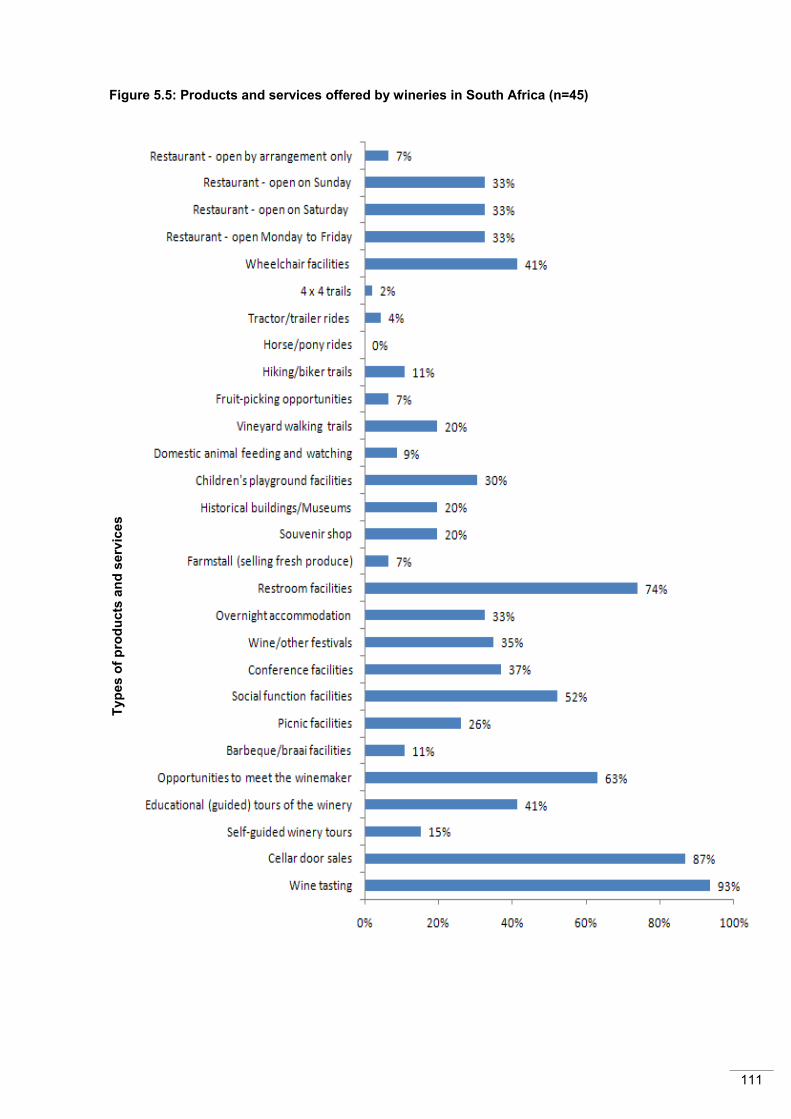
111
Wine tourism around the world: development, management and markets.
Figure 5.5: Products and services offered by wineries in South Africa (n=45)
Type
s of
pro
duct
s an
d se
rvic
es

112
The results show that the products and services offered by the majority of wineries
include wine tasting (93.4%), cellar door sales (87.0%) and restroom facilities for the
public (73.9%). More than 50% of respondents indicated that there are opportunities to
meet the winemaker (63.0%) and social function facilities (52.2%). Less than 50% of
respondents indicated that they offered educational winery tours (41.3%), have
conference facilities (37%), overnight accommodation (32.6%), children’s playground
facilities (30.4%), wheelchair facilities (41.3%), host wine and other festivals (34.0%) and
have restaurants that are open Monday to Sunday (32.6%). The minority of wineries
offered the remaining products and services on the list, which include a self-guided winery
tour (15.2%), tractor rides (4.3%) and having a restaurant that is only open by
arrangement (6.5%).
The results obtained by Bruwer in 2003 also listed wine tasting and cellar door sales as
the services most offered by wineries in South Africa with 92.8% and 88.0% respectively.
Regarding the rest of the products and services, there seemed to be a general increase in
the frequency with which these products and services are offered. This is consistent with
the overall growth of wine tourism and its popularity in South Africa between 2003 to 2008
(SAinfo, 2010b).
5.2.2 SECTION B: Visitor profile
B8: Visitor count
Question 8 required respondents to indicate whether they counted the number of visitors
to the winery on a systematic basis. The results of this question are presented graphically
in figure 5.6, which shows the percentage of wineries that do and do not count the
number of visitors.
Figure 5.6: Systematic visitor count (n=46)
The results show that nearly three-quarters of wineries (73.9%) do not count the number
of visitors to their premises. This confirms the findings of Loubser (in Tassiopoulos &
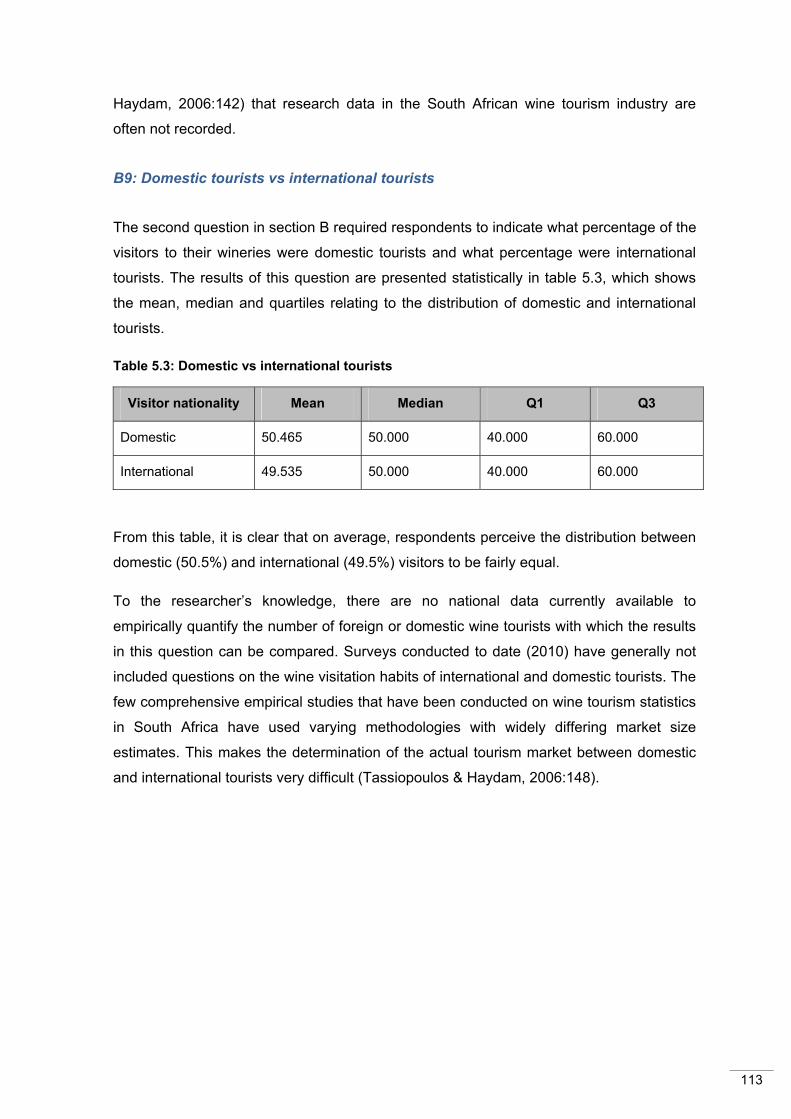
113
Haydam, 2006:142) that research data in the South African wine tourism industry are
often not recorded.
B9: Domestic tourists vs international tourists
The second question in section B required respondents to indicate what percentage of the
visitors to their wineries were domestic tourists and what percentage were international
tourists. The results of this question are presented statistically in table 5.3, which shows
the mean, median and quartiles relating to the distribution of domestic and international
tourists.
Table 5.3: Domestic vs international tourists
Visitor nationality Mean Median Q1 Q3
Domestic 50.465 50.000 40.000 60.000
International 49.535 50.000 40.000 60.000
From this table, it is clear that on average, respondents perceive the distribution between
domestic (50.5%) and international (49.5%) visitors to be fairly equal.
To the researcher’s knowledge, there are no national data currently available to
empirically quantify the number of foreign or domestic wine tourists with which the results
in this question can be compared. Surveys conducted to date (2010) have generally not
included questions on the wine visitation habits of international and domestic tourists. The
few comprehensive empirical studies that have been conducted on wine tourism statistics
in South Africa have used varying methodologies with widely differing market size
estimates. This makes the determination of the actual tourism market between domestic
and international tourists very difficult (Tassiopoulos & Haydam, 2006:148).

114
B10: Gender profile of visitors to the winery
Question 10 required respondents to indicate the profile of the gender of visitors to their
wineries. The results of this question are presented statistically in table 5.4, which shows
the mean, median and quartiles relating to the distribution of the gender of visitors to the
wineries.
Table 5.4: Gender distribution of tourists to wineries (n=43)
Gender Mean Median Q1 Q3
Male 50.465 50.000 40.000 60.000
Female 49.535 50.000 40.000 60.000
The results show that on average, respondents perceived there to be slightly fewer
female visitors (46.6%) than male visitors (53.4%).
The result of the gender profile is confirmed by research on the gender distribution of wine
tourists internationally conducted by Hall, Longo, Mitchell and Johnson (in Hall et al.,
2000), Mitchell and Hall (2001), Mitchell and Hall (2004) and Ignatov and Smith (2006) in
other New World wine countries such as New Zealand, Australia and Canada as well as
by local research conducted by Frandsen (2005) and Bruwer (2003). The small variation
between male and female visitors shows that wine tourism is not gender specific, but an
activity enjoyed by all.
B11: Age profile of visitors
In question 11, respondents were required to indicate the age profile of visitors to the
winery. Visitor age was divided into four categories namely, 0 to 17 years, 18 to 30 years,
31 to 55 years and 56 years and older.
The results of this question are presented statistically in table 5.5 and depicted graphically
in figure 5.7.

115
Table 5.5: Age profile of winery visitors to South African wineries (n=43)
Age Mean Median Q1 Q3
0 to 17 years 6.378 5.000 0.000 10.000
18 to 30 years 26.070 25.000 20.000 40.000
31 to 55 years 44.953 40.000 35.000 55.000
56 years and older 23.833 22.500 17.250 30.000
Figure 5.7: Visitor age profile
The results indicate that on average, the largest age group of visitors is between 31 and
55 years (45%). The age groups 18 to 30 and 56 and older have similar average
distributions with 26% and 24% respectively. The smallest group of visitors is from the
youngest age group, 17 or younger, with an average of only 5%, the reason being that the
legal drinking age in South Africa is 18 years or older.
% o
f V
isit
ors
0
5
10
15
20
25
30
35
40
45
50
0 to 17 years 18 to 30 years 31 to 55 years 56 years and older
%
vis
i
t
o
r
s
g p
Mean
Median
Age groups
% V
isit
ors
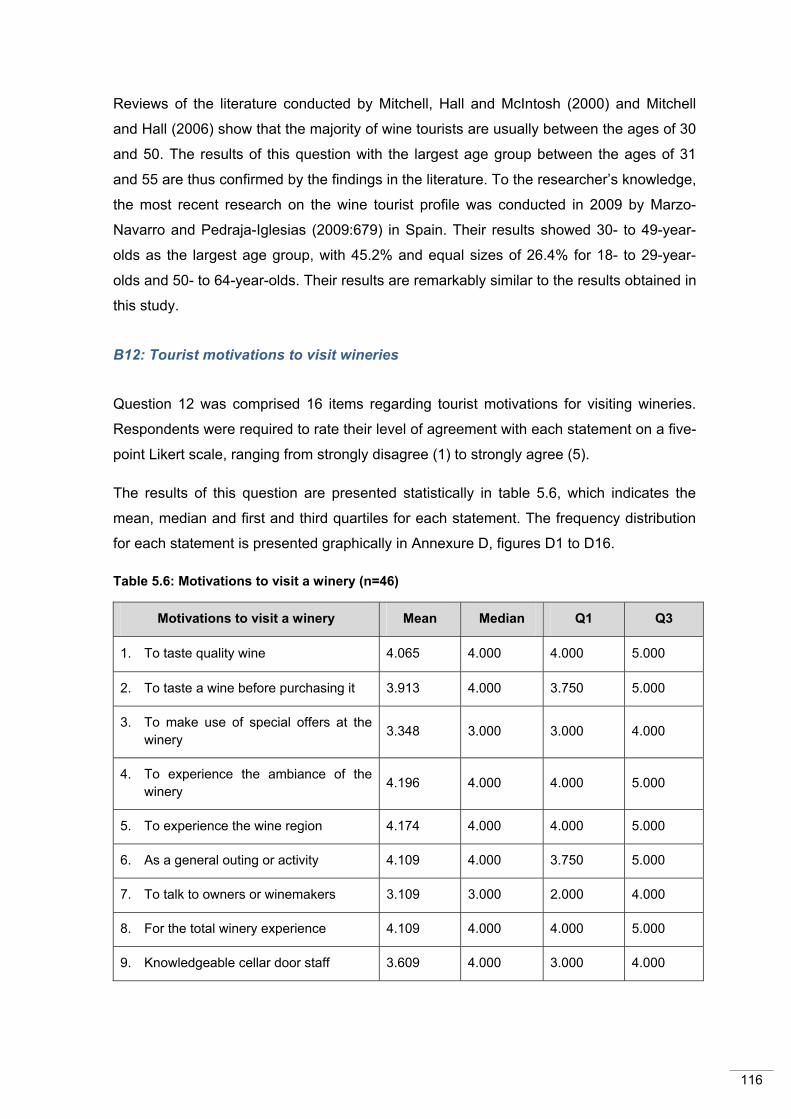
116
Reviews of the literature conducted by Mitchell, Hall and McIntosh (2000) and Mitchell
and Hall (2006) show that the majority of wine tourists are usually between the ages of 30
and 50. The results of this question with the largest age group between the ages of 31
and 55 are thus confirmed by the findings in the literature. To the researcher’s knowledge,
the most recent research on the wine tourist profile was conducted in 2009 by Marzo-
Navarro and Pedraja-Iglesias (2009:679) in Spain. Their results showed 30- to 49-year-
olds as the largest age group, with 45.2% and equal sizes of 26.4% for 18- to 29-year-
olds and 50- to 64-year-olds. Their results are remarkably similar to the results obtained in
this study.
B12: Tourist motivations to visit wineries
Question 12 was comprised 16 items regarding tourist motivations for visiting wineries.
Respondents were required to rate their level of agreement with each statement on a five-
point Likert scale, ranging from strongly disagree (1) to strongly agree (5).
The results of this question are presented statistically in table 5.6, which indicates the
mean, median and first and third quartiles for each statement. The frequency distribution
for each statement is presented graphically in Annexure D, figures D1 to D16.
Table 5.6: Motivations to visit a winery (n=46)
Motivations to visit a winery Mean Median Q1 Q3
1. To taste quality wine 4.065 4.000 4.000 5.000
2. To taste a wine before purchasing it 3.913 4.000 3.750 5.000
3. To make use of special offers at the winery 3.348 3.000 3.000 4.000
4. To experience the ambiance of the winery 4.196 4.000 4.000 5.000
5. To experience the wine region 4.174 4.000 4.000 5.000
6. As a general outing or activity 4.109 4.000 3.750 5.000
7. To talk to owners or winemakers 3.109 3.000 2.000 4.000
8. For the total winery experience 4.109 4.000 4.000 5.000
9. Knowledgeable cellar door staff 3.609 4.000 3.000 4.000

117
Motivations to visit a winery Mean Median Q1 Q3
10. To learn more about wine 4.087 4.000 3.000 5.000
11. Friendly reception from cellar staff 3.870 4.000 3.000 5.000
12. To experience a winery tour 3.3670 3.000 2.000 5.000
13. Reputation (brand) of wine 4.109 4.000 4.000 5.000
14. Medal winning wines 3.522 3.000 3.000 5.000
15. John Platter’s Wine Guide 3.826 4.000 3.000 5.000
16. Knowledge of the Great Wine Capitals of the World 3.196 3.000 2.000 4.000
Of the 16 motivation statements, seven were strongly confirmed with the majority of
respondents either agreeing or strongly agreeing with these statements (listed in
descending order):
• To experience the ambiance of the winery (84.8%).
• For the total winery experience (82.7%).
• To taste quality wine (82.6%).
• To experience the wine region (80.5%).
• Reputation (brand) of the wine (78.2%).
• As a general outing or activity (76.1%).
• To learn more about wine (69.6%).
This study therefore confirms, inter alia, some of the motivations for tourists to visit
wineries, as postulated by Hall et al. (2000:127), Bruwer (in Alant & Bruwer, 2004) and
Macionis (in Getz, 2000:59) such as experiencing the ambiance of the winery and wine
region, tasting and learning about wine and the wine brand. Tourist motivations were
discussed in chapter 2, section 2.3.4.

118
5.2.3 SECTION C: Advantages and disadvantages of wine tourism
Section C had only one question and comprised 30 statements regarding the advantages
and disadvantages of wine tourism. Respondents were required to rate their level of
agreement with each statement on a five-point Likert scale ranging from strongly disagree
(1) to strongly agree (5).
The results of this question are presented statistically in table 5.7, which indicates the
mean, median and first and third quartiles for each statement. The frequency distribution
for each statement is presented graphically in Annexure D, D18 to D47.
Table 5.7: Advantages and disadvantages of wine tourism (n=46)
Advantages and disadvantages Mean Median Q1 Q3
1. Wine tourism contributes to increased wine sales
3.957 4.000 4.000 5.000
2. Wine tourism creates brand awareness
3.978 4.000 4.000 5.000
3. Wine tourism fosters brand loyalty
3.652 4.000 3.000 5.000
4. Sales from the cellar door are an important contributor to overall sales volumes
3.870 4.000 3.000 5.000
5. Wine tourism opens the door for new partnerships with tourism organisations
3.674 4.000 3.000 4.000
6. Wine tourism leads to an increase in visitor numbers
4.000 4.000 4.000 5.000
7. Wine tourism leads to an increase in spending at my winery
3.674 4.000 3.000 4.000
8. Wine tourism assists my winery in overcoming slow demand periods
3.848 4.000 3.000 4.000
9. Wine tourism is an opportunity to educate customers
3.848 4.000 3.000 4.000
10. Wine tourism enables me to increase my profit margin on wines
3.630 4.000 3.000 4.000
11. Wine tourism attracts new domestic market segments to my winery’s products
3.565 4.000 3.000 4.000

119
Advantages and disadvantages Mean Median Q1 Q3
12. Wine tourism attracts new international market segments to my winery’s products
3.696 4.000 3.000 4.000
13. Wine tourism has improved links with the wine trade
3.500 3.500 3.000 4.000
14. Wine tourism is an opportunity to test new products on customers
3.239 3.000 3.000 4.000
15. Wine tourism contributes to developing a unique positive destination image
3.826 4.000 3.750 4.000
16. Wine tourism is a way to acquire market intelligence on customers
3.500 4.000 3.000 4.000
17. Wine tourism leads to increased costs and management time at my winery
3.348 3.500 2.000 4.000
18. Wine tourism requires a large capital investment
3.174 3.500 2.000 4.000
19. Wine tourism does not substantially increase sales of wine
2.696 2.000 2.000 3.250
20. Wine tourism helps to develop mail order sales
3.326 4.000 2.750 4.000
21. Wine tourism differentiates my wine from others
3.087 3.000 2.000 4.000
22. Cellar door visitors do not buy a lot of wine
3.087 3.000 2.000 4.000
23. Tourists are valuable to my winery
3.848 4.000 3.000 5.000
24. Wine tourism attracts a wide range of customers to my winery
3.674 4.000 3.000 4.000
25. Wine tourism offers important marketing opportunities
3.696 4.000 3.000 4.000
26. Wine tourism positively impacts the sales of my wine offshore
3.174 3.000 2.000 4.000
27. Time spent with visitors to my winery is valuable
3.978 4.000 4.000 5.000
28. Wine tourism contributes greatly to my business success
3.370 3.500 3.000 4.000
29. The overall benefits of wine tourism outweigh the negative impacts
3.717 4.000 3.750 4.000
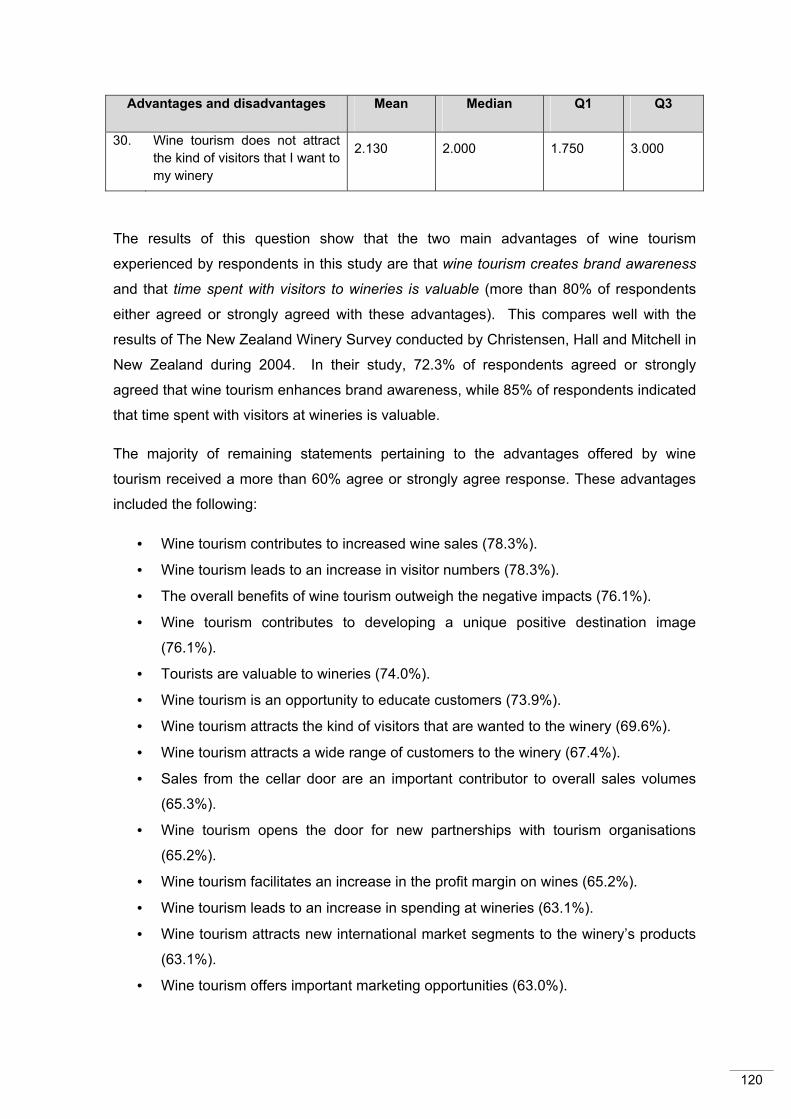
120
Advantages and disadvantages Mean Median Q1 Q3
30. Wine tourism does not attract the kind of visitors that I want to my winery
2.130 2.000 1.750 3.000
The results of this question show that the two main advantages of wine tourism
experienced by respondents in this study are that wine tourism creates brand awareness
and that time spent with visitors to wineries is valuable (more than 80% of respondents
either agreed or strongly agreed with these advantages). This compares well with the
results of The New Zealand Winery Survey conducted by Christensen, Hall and Mitchell in
New Zealand during 2004. In their study, 72.3% of respondents agreed or strongly
agreed that wine tourism enhances brand awareness, while 85% of respondents indicated
that time spent with visitors at wineries is valuable.
The majority of remaining statements pertaining to the advantages offered by wine
tourism received a more than 60% agree or strongly agree response. These advantages
included the following:
• Wine tourism contributes to increased wine sales (78.3%).
• Wine tourism leads to an increase in visitor numbers (78.3%).
• The overall benefits of wine tourism outweigh the negative impacts (76.1%).
• Wine tourism contributes to developing a unique positive destination image
(76.1%).
• Tourists are valuable to wineries (74.0%).
• Wine tourism is an opportunity to educate customers (73.9%).
• Wine tourism attracts the kind of visitors that are wanted to the winery (69.6%).
• Wine tourism attracts a wide range of customers to the winery (67.4%).
• Sales from the cellar door are an important contributor to overall sales volumes
(65.3%).
• Wine tourism opens the door for new partnerships with tourism organisations
(65.2%).
• Wine tourism facilitates an increase in the profit margin on wines (65.2%).
• Wine tourism leads to an increase in spending at wineries (63.1%).
• Wine tourism attracts new international market segments to the winery’s products
(63.1%).
• Wine tourism offers important marketing opportunities (63.0%).
121
This confirms the advantages or benefits of wine tourism postulated by Dodd and Bigotte
(in Hall et al., 2000:11), Day (in Hall et al., 2000:11), Dodd (in Getz, 2000:64) and Getz
(2000:7) in the various studies conducted by them.
In many respects, these results are also similar to the results obtained by Christensen et
al. (2004), in their New Zealand study. For example, the statement “Benefits of wine
tourism outweigh the negative impacts” received an agree or strongly agree response
from 77.1% of respondents in New Zealand compared to 76.1% in this study.
The majority of respondents disagreed with or were neutral towards the following wine
tourism attributes:
• Cellar door visitors buy a lot of wine (60.9% disagreed or were neutral).
• Wine tourism is an opportunity to test new products on customers (60.9%).
• Wine tourism positively impacts the sales of my wine offshore (58.7%).
• Wine tourism differentiates my wine from others (58.7%).
• Wine tourism assists my winery in overcoming slow demand periods (52.1%).
The results show that the majority of respondents (60.9%) do not use the opportunity
offered by wine tourism to test new products on consumers. This confirms the conclusion
by Loubser (2004) that although wine tourism is said to be one of the main strategic
approaches of wineries, in reality, it is still treated as a secondary activity. The results
clearly show that the majority of wineries are still not utilising wine tourism to its fullest by
not using the cellar door to do market research.
The results of the statement “Cellar door visitors buy a lot of wine” show that respondents
do not believe that wine tourism actually contributes to their bottom line. The 58.7%
disagreement with the statement “Wine tourism positively impacts sales of wine offshore”
show that respondents do not view wine tourism as an effective marketing tool in the
international market. This once again confirms Loubser’s (2004) view that wine tourism is
only considered a secondary activity by wineries.
Of great significance in these results is the statement: “Wine tourism differentiates my
wine from others”. It is interesting to note that although a large percentage (58.7%) of
respondents indicated that wine tourism does not have the ability to differentiate their
wine, the majority (80.4%) do perceive wine tourism to enhance or create brand
awareness. The results are remarkably similar to those of Christensen et al. (2004) in
New Zealand, where 73.2% of respondents agreed or strongly agreed that wine tourism
enhances product brand awareness, yet 55.2% of respondents indicated that wine
tourism is not of any value as a differentiation strategy.
122
5.2.4 SECTION D: Wine tourism and the promotion of winery products
D14: Promotional activities
Question 14 listed 28 different promotional activities that wineries could use to promote
their wines. Respondents were required to indicate which methods form part of their
promotion strategies. The results of this question are presented graphically in figure 5.8,
which shows the frequency with which each different form of promotion is used by
wineries.
Figure 5.8 shows that the greater majority (>80%) of wineries have their own wine-tasting
rooms and internet sites and that they rely heavily on word-of-mouth advertising. Other
forms of promotion that are used by the majority (>50%) of wineries include the following:
• Organised wine tastings and special offers or discounts
• Attending wine festivals and trade shows
• Wine route promotional activities
• Wine sales representatives
• Newsletters and direct mail-order lists
• Newspaper and magazine editorials
• Other Internet sites
• Restaurants
Of significance in the results in this study is the increase in frequency with which own
internet sites are used. In 2003, Bruwer’s study showed that 50% of wineries in South
Africa had their own internet sites. This study shows that in 2009, 84% of wineries in the
sample had their own internet sites, a 44% increase from 2003. Also, 57% of wineries
used other internet sites to advertise. This is consistent with the overall growth of the
internet and its importance over the past ten years (2000-2009). In Africa alone, internet
usage grew by a staggering 1809.8% nternet World Stats 2009) between 2000 and 2009.
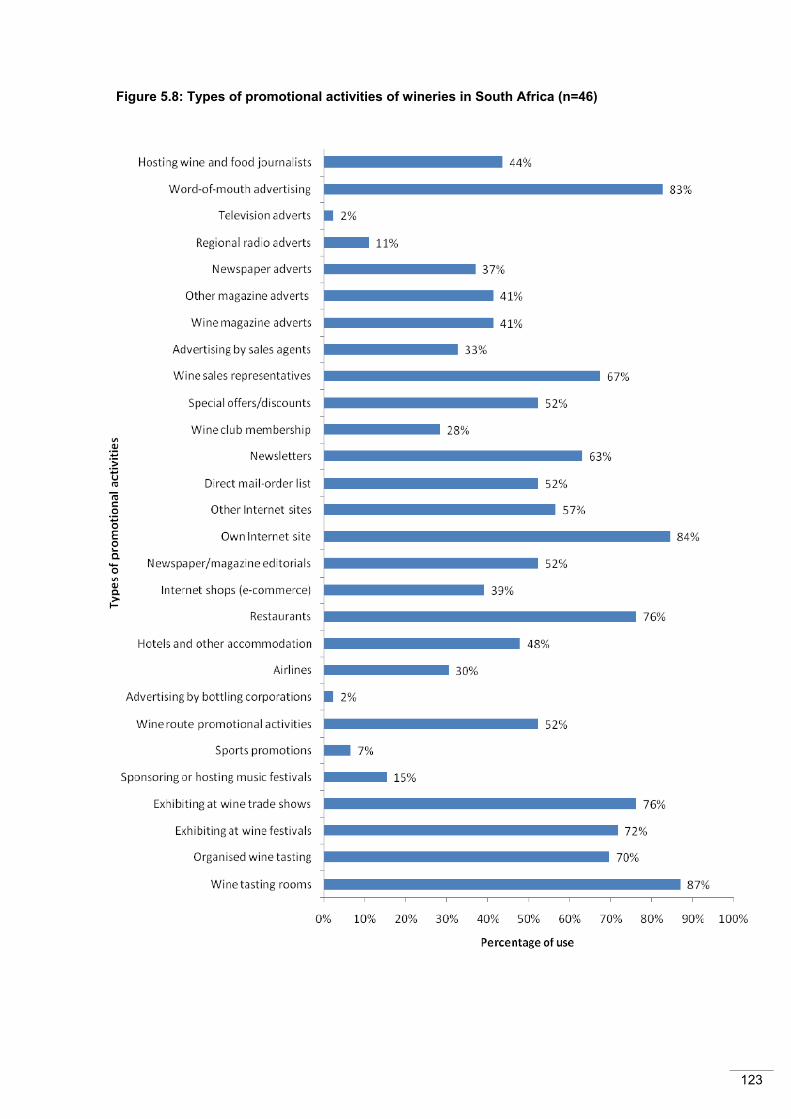
123
Figure 5.8: Types of promotional activities of wineries in South Africa (n=46)

124
D15: Wine distribution points
Question 15 required respondents to rate the importance of the different points of sale to
their winery. The question comprised ten different points of sale that could be rated on a
five-point Likert scale, ranging from irrelevant (1) to very important (5).
The results of this question are presented statistically in table 5.8, which indicates the
mean, median and first and third quartiles for each statement. The frequency distribution
for each statement is presented graphically in Annexure D, D48 to D57.
Table 5.8: Types of wine sales (n=46)
Type of sale Mean Median Q1 Q3
1. Cellar door sales 4.239 4.500 4.000 5.000
2. Wholesale 4.022 4.000 3.750 5.000
3. Retail 4.478 5.000 4.000 5.000
4. Exporting 4.457 5.000 4.000 5.000
5. Own restaurant 3.174 3.500 1.000 5.000
6. Other restaurants 4.283 4.000 4.000 5.000
7. Mail order 3.587 4.000 3.000 4.000
8. Hotels and other accommodation establishments
3.935 4.000 3.000 5.000
9. Embassies 2.717 3.000 2.000 3.000
10. Wine clubs 3.652 4.000 3.000 4.250
The results show that the majority of respondents rated cellar door sales, wholesale,
retail, exporting and other restaurants as important and very important points of sale.
Wine sales to embassies received the lowest level of agreement from respondents, with
mostly neutral or disagree responses. The results in this question could not be compared
to any previous research, although it should be noted that the two types of sale identified
as the most important to wineries namely, retail and exporting, also have the highest
volume of sales in South Africa (SAWIS, 2009a).

125
D16: Factors influencing the success of a winery
Factors influencing the success of a winery were measured in question 16. The question
required respondents to rate the importance of 15 different factors to the success of their
winery on a five-point Likert scale, ranging from irrelevant (1) to very important (5).
The results of this question are presented statistically in table 5.9, which indicates the
mean, median and first and third quartiles for each statement. The frequency distribution
for each statement is presented graphically in Annexure B, D58 to D71.
Table 5.9: Factors influencing the success of a winery (n=46)
Factors influencing the success of a winery Mean Median Q1 Q3
1. Having a restaurant or café 3.739 4.000 3.000 4.250
2. Employing staff who are knowledgeable about wines
4.565 5.000 4.000 5.000
3. Providing education and interpretation for visitors
4.065 4.000 4.000 5.000
4. Providing winery tours for visitors 3.761 4.000 3.000 4.250
5. Accommodating large tour groups 3.043 3.000 2.000 4.000
6. Having the correct accreditation
- (i.e.cellar door standards)
3.717 4.000 3.000 5.000
7. Producing and selling organic wines 2.587 3.000 2.000 3.000
8. Retailing both wine and other products 3.261 3.000 3.000 4.000
9. Providing wine appreciation opportunities 3.804 4.000 3.000 4.000
10. Hosting special events and functions 3.739 4.000 3.000 4.000
11. Having overnight accommodation on site 3.087 3.000 2.750 4.000
12. Having an attractive, well-designed winery 3.761 4.000 3.000 4.250
13. Good sign posting 4.348 4.000 4.000 5.000
14. Friendly, service oriented staff 4.739 5.000 5.000 5.000
Four factors were rated as being either important or very important to the success of a
winery, which is apparent from table 5.9 with a mean ranking of 4.00 or more. These
factors are as follows:

126
• Employing staff who are knowledgeable about wines (mean ranking 4.56)
• Friendly, service-oriented staff (mean ranking 4.73)
• Good sign posting (mean ranking 4.34)
• Providing education and interpretation for visitors (mean ranking 4.06)
Research conducted by Getz, Dowling, Carlsen and Anderson (1999) on wineries in
Washington, USA and Australia, ten years prior to this study (1999), shows remarkably
similar results. These four factors were also considered to be the four most important
factors in a winery’s success by respondents in both the USA and Australia.
Factors that were rated as important in this study (mean ranking of 3.70 to 4.00) include
the following:
• Providing wine appreciation opportunities (mean ranking 3.80)
• Providing winery tours for visitors (mean ranking 3.76)
• Having an attractive, well-designed winery (mean ranking 3.76)
• Hosting special events and functions (mean ranking 3.73)
• Having a restaurant or café (mean ranking 3.73)
• Having the correct accreditation (mean ranking 3.71)
These results again correspond very closely to the results received by Getz et al. (1999).
The factor, which was attributed to being the least important, that is producing and selling
organic wines, was also given the least importance by respondents in both Australia and
Washington.
It is interesting to note that even though the research was conducted a decade before this
study, respondents’ opinion of factors important to the success of a winery has changed
little, if at all. Also of significance here is the fact that even though respondents are
geographically distributed across three continents, they still rate each factor in a similar
fashion.
D17: Revenue spent on marketing
Question 17 required respondents to indicate the approximate percentage of their total
revenue that is spent on marketing. The question comprised seven categories ranging
from 0 to 100%.
The results of this question are presented graphically in figure 5.9, which illustrates the
distribution of the marketing spend of the various wineries.

127
Figure 5.9: Marketing spend (n=40)
From the results it can be seen that the majority (64.5%) of wineries spend between 0 and
10% of their revenue on marketing activities.
It should be noted that one respondent indicated that between 71 and 100% of the
winery’s total revenue is spent on marketing. Based on the rest of the responses received
(64.5% between 0 and 10% and 34.5% between 11 and 50%), it is possible to assume
that this respondent misinterpreted this question. This response was regarded as an
outlier and therefore omitted from the statistical analysis, since it would provide a skewed
statistical result.
D18: Marketing spend: international marketing vs domestic marketing of wine
In question 18, respondents were required to indicate the approximate percentage of their
marketing that was spent on international marketing versus the amount spent on domestic
marketing of wine.
The results of this question are depicted graphically in figure 5.10.

128
Figure 5.10: Marketing spend – domestic vs international marketing (n=43)
The results show that the majority (80%) of wineries spend more money on international
marketing than on domestic marketing. A reason for this could be that it is much more
expensive to advertise internationally than locally since the rand is a weak currency
against most of South Africa’s major export markets.
D19: Local wines sales vs exported
Question 19 asked respondents to indicate the percentage of their wines that is sold
locally as opposed to the percentage of wine that is exported.
The results of the question are presented graphically in figure 5.11.
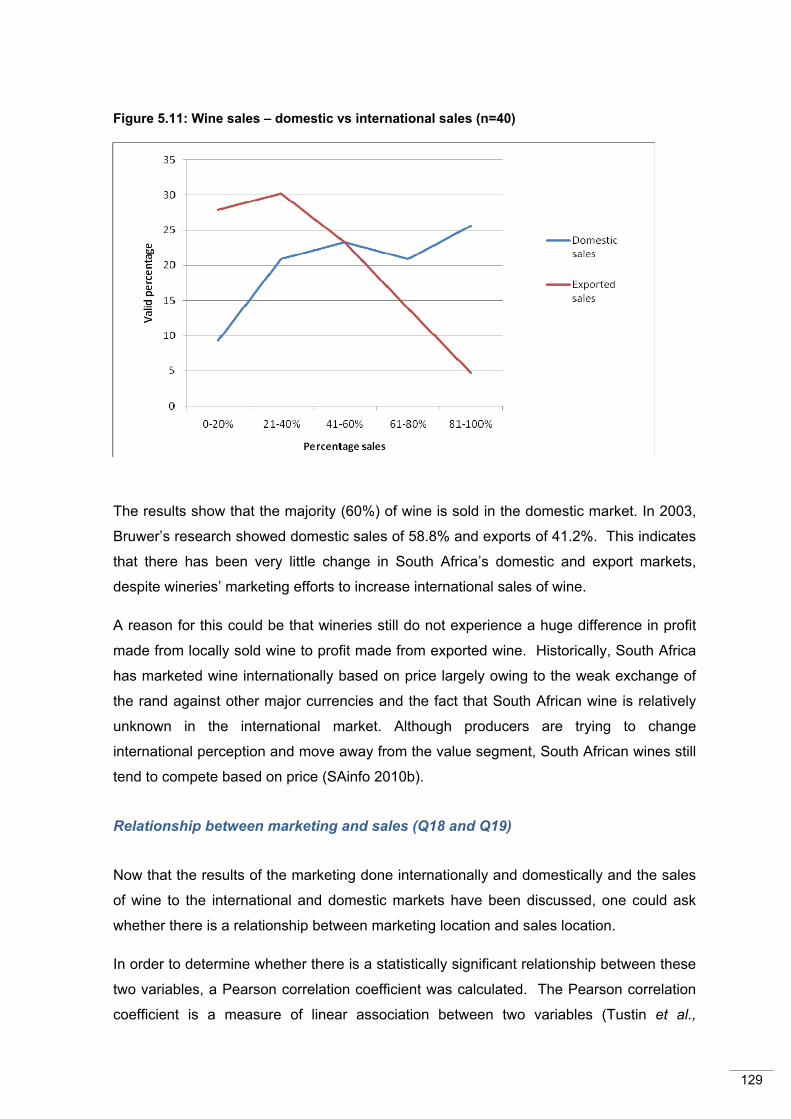
129
Figure 5.11: Wine sales – domestic vs international sales (n=40)
The results show that the majority (60%) of wine is sold in the domestic market. In 2003,
Bruwer’s research showed domestic sales of 58.8% and exports of 41.2%. This indicates
that there has been very little change in South Africa’s domestic and export markets,
despite wineries’ marketing efforts to increase international sales of wine.
A reason for this could be that wineries still do not experience a huge difference in profit
made from locally sold wine to profit made from exported wine. Historically, South Africa
has marketed wine internationally based on price largely owing to the weak exchange of
the rand against other major currencies and the fact that South African wine is relatively
unknown in the international market. Although producers are trying to change
international perception and move away from the value segment, South African wines still
tend to compete based on price (SAinfo 2010b).
Relationship between marketing and sales (Q18 and Q19)
Now that the results of the marketing done internationally and domestically and the sales
of wine to the international and domestic markets have been discussed, one could ask
whether there is a relationship between marketing location and sales location.
In order to determine whether there is a statistically significant relationship between these
two variables, a Pearson correlation coefficient was calculated. The Pearson correlation
coefficient is a measure of linear association between two variables (Tustin et al.,
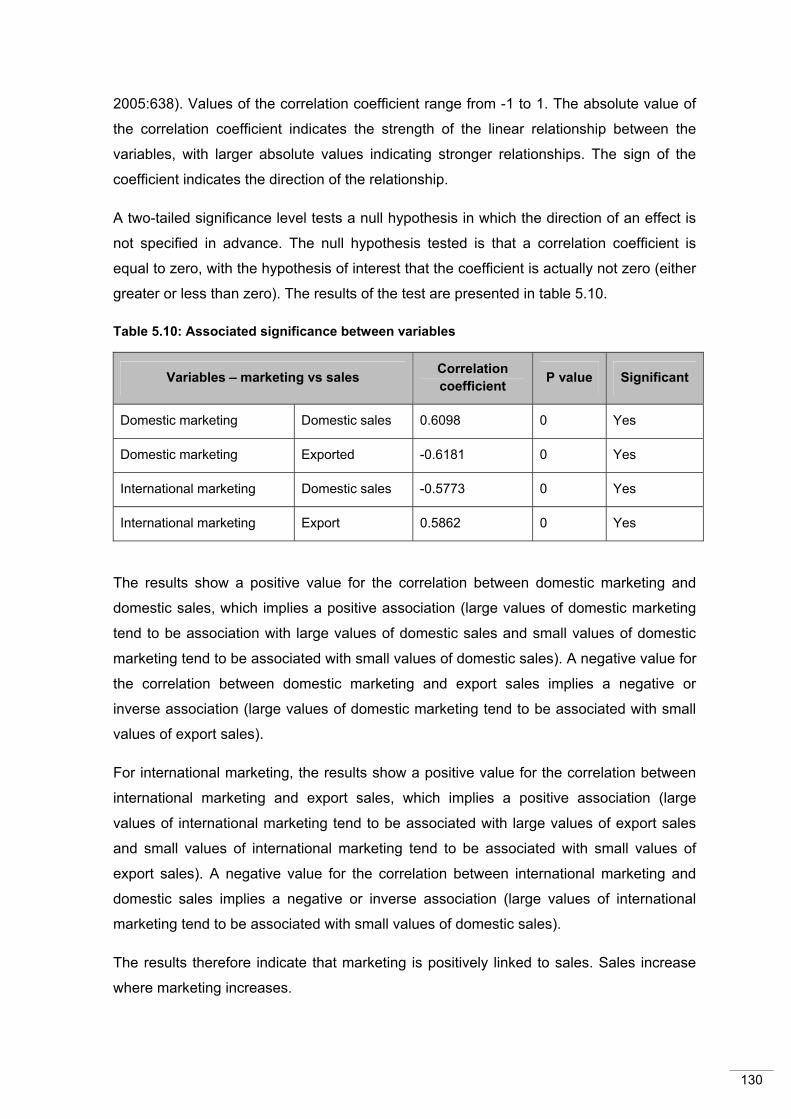
130
2005:638). Values of the correlation coefficient range from -1 to 1. The absolute value of
the correlation coefficient indicates the strength of the linear relationship between the
variables, with larger absolute values indicating stronger relationships. The sign of the
coefficient indicates the direction of the relationship.
A two-tailed significance level tests a null hypothesis in which the direction of an effect is
not specified in advance. The null hypothesis tested is that a correlation coefficient is
equal to zero, with the hypothesis of interest that the coefficient is actually not zero (either
greater or less than zero). The results of the test are presented in table 5.10.
Table 5.10: Associated significance between variables
Variables – marketing vs sales Correlation coefficient P value Significant
Domestic marketing Domestic sales 0.6098 0 Yes
Domestic marketing Exported -0.6181 0 Yes
International marketing Domestic sales -0.5773 0 Yes
International marketing Export 0.5862 0 Yes
The results show a positive value for the correlation between domestic marketing and
domestic sales, which implies a positive association (large values of domestic marketing
tend to be association with large values of domestic sales and small values of domestic
marketing tend to be associated with small values of domestic sales). A negative value for
the correlation between domestic marketing and export sales implies a negative or
inverse association (large values of domestic marketing tend to be associated with small
values of export sales).
For international marketing, the results show a positive value for the correlation between
international marketing and export sales, which implies a positive association (large
values of international marketing tend to be associated with large values of export sales
and small values of international marketing tend to be associated with small values of
export sales). A negative value for the correlation between international marketing and
domestic sales implies a negative or inverse association (large values of international
marketing tend to be associated with small values of domestic sales).
The results therefore indicate that marketing is positively linked to sales. Sales increase
where marketing increases.

131
Sub-route trends with regard to marketing spend, marketing coverage and sales
(Q1, Q17, Q18 and Q19)
The differences between the various subroutes with regard to their marketing spend,
domestic and international marketing as well as exported and domestic sale of wines are
shown in table 5.11 below. The table shows each subroute’s percentage of revenue spent
on marketing, the division between international and domestic marketing (mean value)
and the average percentage of sales domestically and internationally.
Table 5.11: Sub-route trends with regard to marketing spend, marketing coverage and sales
Stellenbosch subroutes
Percentage of revenue spent on
marketing
International marketing
Domestic marketing
Domestic sales
Exported sales
Greater Simonsberg 0-5% Mean 27.500 72.500 63.250 35.500
N 4 4 4 4
6-10% Mean 30.000 70.000 49.286 50.714
N 7 7 7 7
11-15% Mean 50.000 50.000 50.000 50.000
N 1 1 1 1
16-30% Mean 30.000 70.000 20.000 80.000
N 1 1 1 1
31-50% Mean 30.000 70.000 20.000 80.000
N 1 1 1 1
Total Mean 32.000 68.000 49.200 50.467
N 15 15 15 15
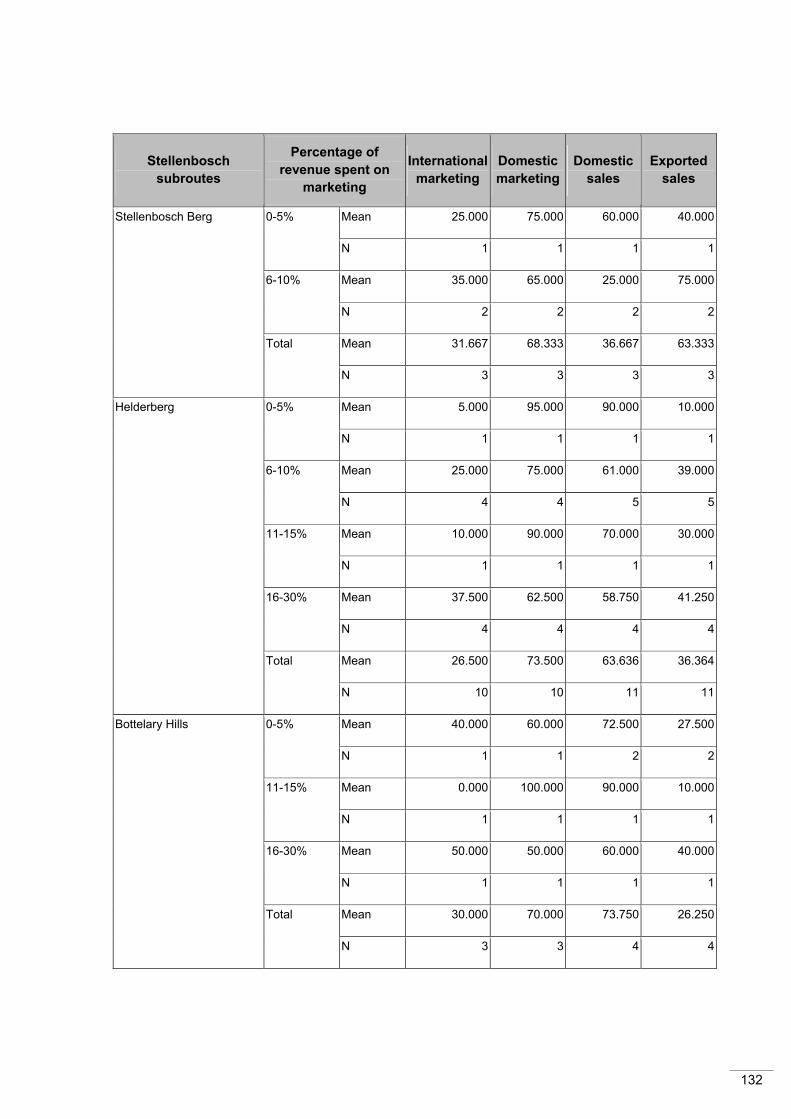
132
Stellenbosch subroutes
Percentage of revenue spent on
marketing
International marketing
Domestic marketing
Domestic sales
Exported sales
Stellenbosch Berg 0-5% Mean 25.000 75.000 60.000 40.000
N 1 1 1 1
6-10% Mean 35.000 65.000 25.000 75.000
N 2 2 2 2
Total Mean 31.667 68.333 36.667 63.333
N 3 3 3 3
Helderberg 0-5% Mean 5.000 95.000 90.000 10.000
N 1 1 1 1
6-10% Mean 25.000 75.000 61.000 39.000
N 4 4 5 5
11-15% Mean 10.000 90.000 70.000 30.000
N 1 1 1 1
16-30% Mean 37.500 62.500 58.750 41.250
N 4 4 4 4
Total Mean 26.500 73.500 63.636 36.364
N 10 10 11 11
Bottelary Hills 0-5% Mean 40.000 60.000 72.500 27.500
N 1 1 2 2
11-15% Mean 0.000 100.000 90.000 10.000
N 1 1 1 1
16-30% Mean 50.000 50.000 60.000 40.000
N 1 1 1 1
Total Mean 30.000 70.000 73.750 26.250
N 3 3 4 4
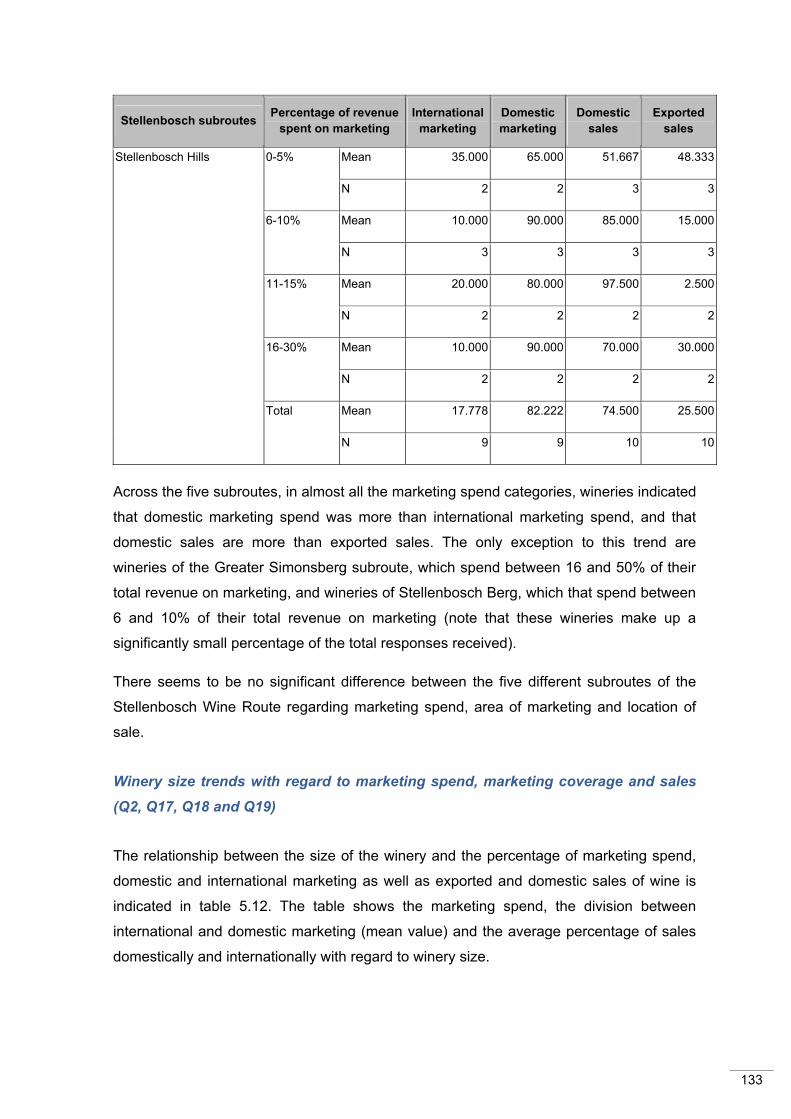
133
Stellenbosch subroutes Percentage of revenue spent on marketing
International marketing
Domestic marketing
Domestic sales
Exported sales
Stellenbosch Hills 0-5% Mean 35.000 65.000 51.667 48.333
N 2 2 3 3
6-10% Mean 10.000 90.000 85.000 15.000
N 3 3 3 3
11-15% Mean 20.000 80.000 97.500 2.500
N 2 2 2 2
16-30% Mean 10.000 90.000 70.000 30.000
N 2 2 2 2
Total Mean 17.778 82.222 74.500 25.500
N 9 9 10 10
Across the five subroutes, in almost all the marketing spend categories, wineries indicated
that domestic marketing spend was more than international marketing spend, and that
domestic sales are more than exported sales. The only exception to this trend are
wineries of the Greater Simonsberg subroute, which spend between 16 and 50% of their
total revenue on marketing, and wineries of Stellenbosch Berg, which that spend between
6 and 10% of their total revenue on marketing (note that these wineries make up a
significantly small percentage of the total responses received).
There seems to be no significant difference between the five different subroutes of the
Stellenbosch Wine Route regarding marketing spend, area of marketing and location of
sale.
Winery size trends with regard to marketing spend, marketing coverage and sales
(Q2, Q17, Q18 and Q19)
The relationship between the size of the winery and the percentage of marketing spend,
domestic and international marketing as well as exported and domestic sales of wine is
indicated in table 5.12. The table shows the marketing spend, the division between
international and domestic marketing (mean value) and the average percentage of sales
domestically and internationally with regard to winery size.
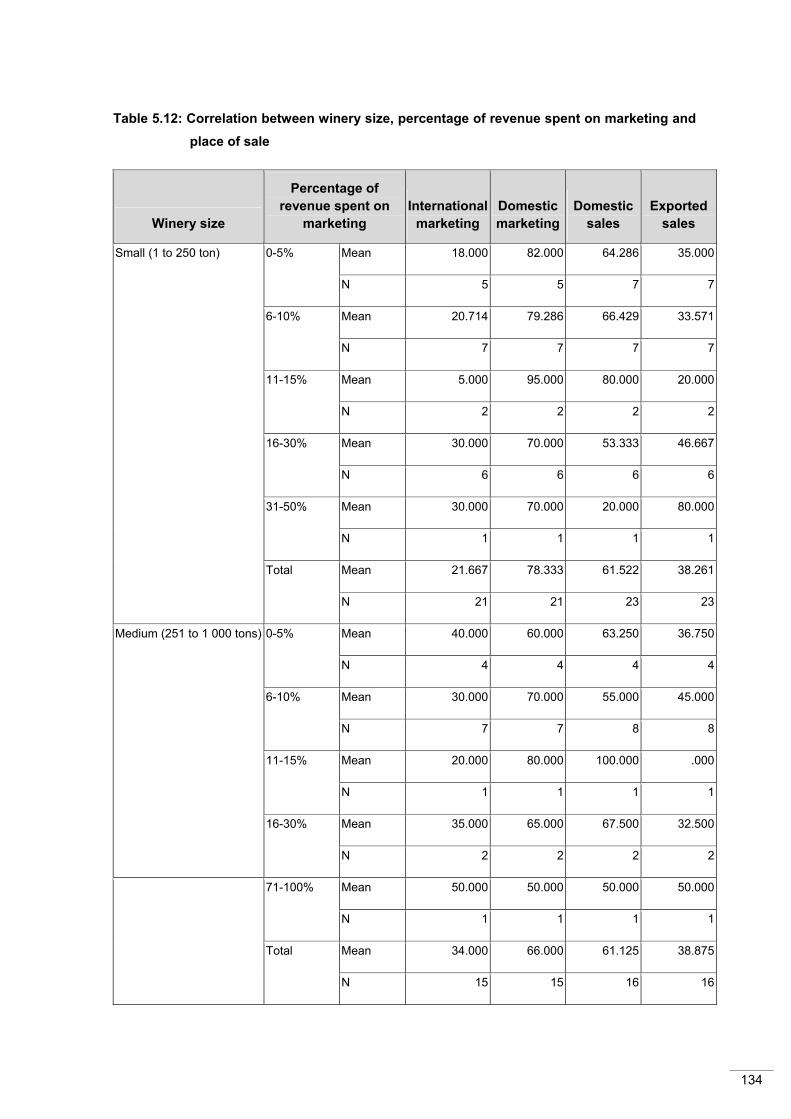
134
Table 5.12: Correlation between winery size, percentage of revenue spent on marketing and place of sale
Winery size
Percentage of revenue spent on
marketing International
marketing Domestic marketing
Domestic sales
Exported sales
Small (1 to 250 ton) 0-5% Mean 18.000 82.000 64.286 35.000
N 5 5 7 7
6-10% Mean 20.714 79.286 66.429 33.571
N 7 7 7 7
11-15% Mean 5.000 95.000 80.000 20.000
N 2 2 2 2
16-30% Mean 30.000 70.000 53.333 46.667
N 6 6 6 6
31-50% Mean 30.000 70.000 20.000 80.000
N 1 1 1 1
Total Mean 21.667 78.333 61.522 38.261
N 21 21 23 23
Medium (251 to 1 000 tons) 0-5% Mean 40.000 60.000 63.250 36.750
N 4 4 4 4
6-10% Mean 30.000 70.000 55.000 45.000
N 7 7 8 8
11-15% Mean 20.000 80.000 100.000 .000
N 1 1 1 1
16-30% Mean 35.000 65.000 67.500 32.500
N 2 2 2 2
71-100% Mean 50.000 50.000 50.000 50.000
N 1 1 1 1
Total Mean 34.000 66.000 61.125 38.875
N 15 15 16 16
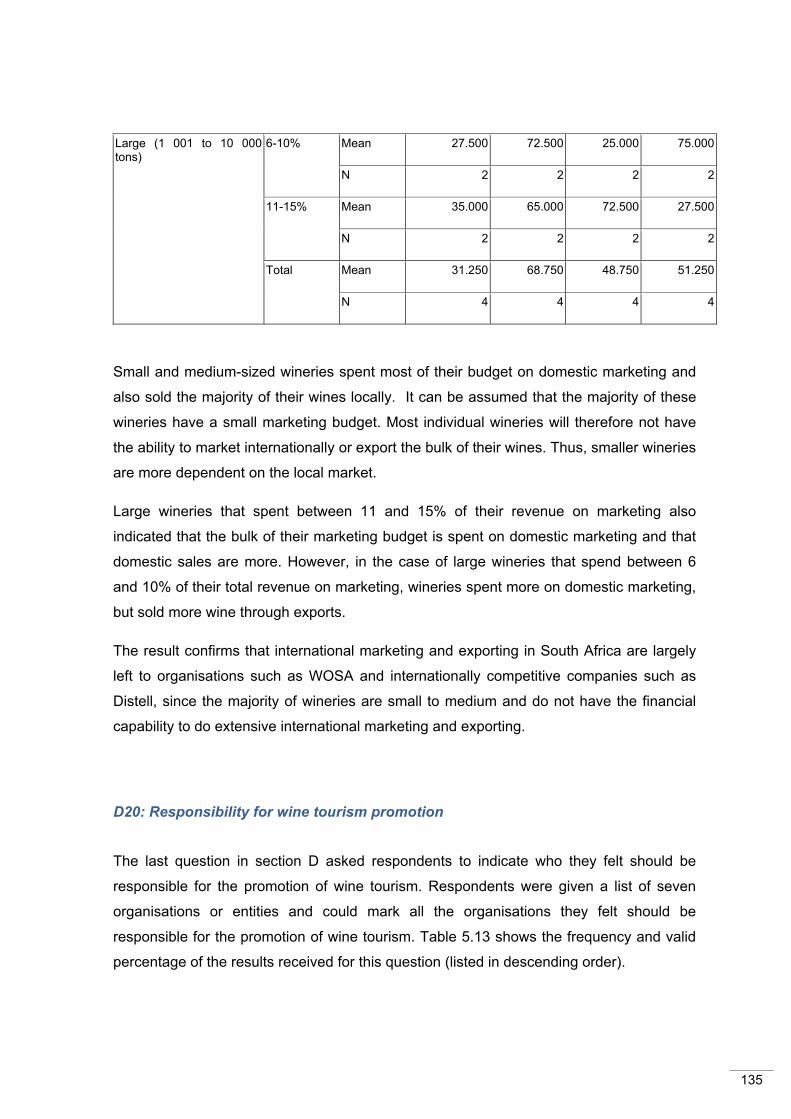
135
Large (1 001 to 10 000 tons)
6-10% Mean 27.500 72.500 25.000 75.000
N 2 2 2 2
11-15% Mean 35.000 65.000 72.500 27.500
N 2 2 2 2
Total Mean 31.250 68.750 48.750 51.250
N 4 4 4 4
Small and medium-sized wineries spent most of their budget on domestic marketing and
also sold the majority of their wines locally. It can be assumed that the majority of these
wineries have a small marketing budget. Most individual wineries will therefore not have
the ability to market internationally or export the bulk of their wines. Thus, smaller wineries
are more dependent on the local market.
Large wineries that spent between 11 and 15% of their revenue on marketing also
indicated that the bulk of their marketing budget is spent on domestic marketing and that
domestic sales are more. However, in the case of large wineries that spend between 6
and 10% of their total revenue on marketing, wineries spent more on domestic marketing,
but sold more wine through exports.
The result confirms that international marketing and exporting in South Africa are largely
left to organisations such as WOSA and internationally competitive companies such as
Distell, since the majority of wineries are small to medium and do not have the financial
capability to do extensive international marketing and exporting.
D20: Responsibility for wine tourism promotion
The last question in section D asked respondents to indicate who they felt should be
responsible for the promotion of wine tourism. Respondents were given a list of seven
organisations or entities and could mark all the organisations they felt should be
responsible for the promotion of wine tourism. Table 5.13 shows the frequency and valid
percentage of the results received for this question (listed in descending order).
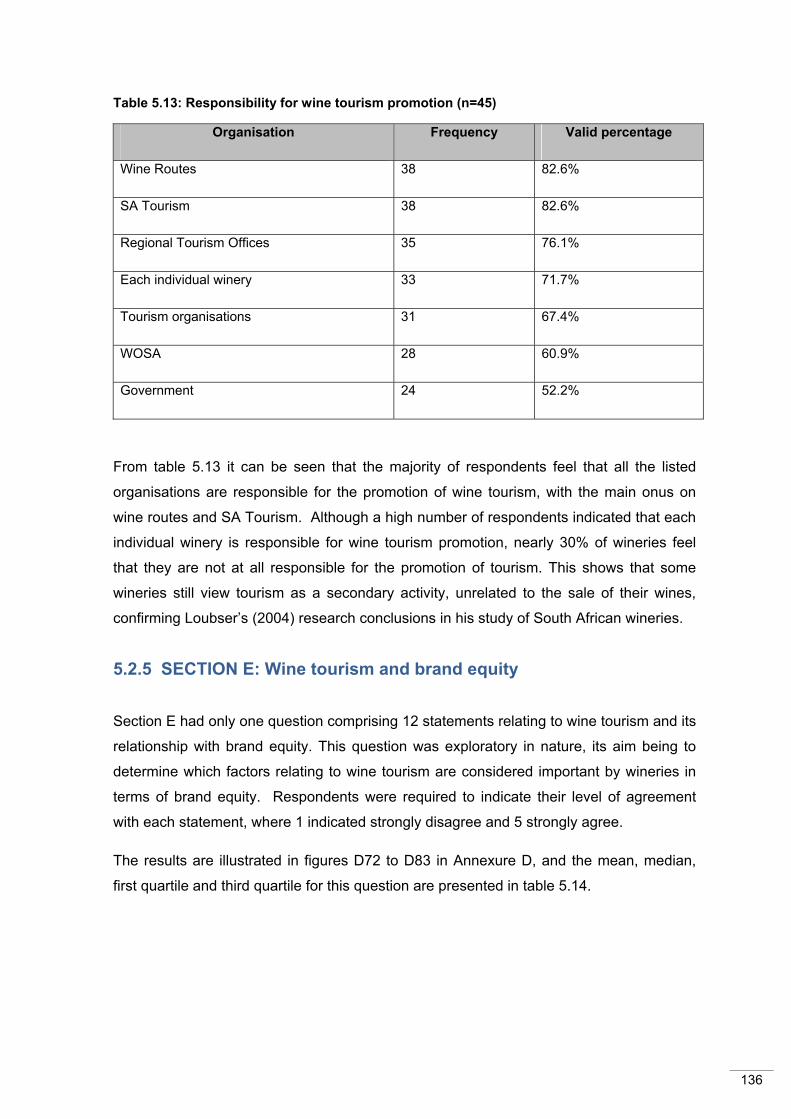
136
Table 5.13: Responsibility for wine tourism promotion (n=45)
Organisation Frequency Valid percentage
Wine Routes 38 82.6%
SA Tourism 38 82.6%
Regional Tourism Offices 35 76.1%
Each individual winery 33 71.7%
Tourism organisations 31 67.4%
WOSA 28 60.9%
Government 24 52.2%
From table 5.13 it can be seen that the majority of respondents feel that all the listed
organisations are responsible for the promotion of wine tourism, with the main onus on
wine routes and SA Tourism. Although a high number of respondents indicated that each
individual winery is responsible for wine tourism promotion, nearly 30% of wineries feel
that they are not at all responsible for the promotion of tourism. This shows that some
wineries still view tourism as a secondary activity, unrelated to the sale of their wines,
confirming Loubser’s (2004) research conclusions in his study of South African wineries.
5.2.5 SECTION E: Wine tourism and brand equity
Section E had only one question comprising 12 statements relating to wine tourism and its
relationship with brand equity. This question was exploratory in nature, its aim being to
determine which factors relating to wine tourism are considered important by wineries in
terms of brand equity. Respondents were required to indicate their level of agreement
with each statement, where 1 indicated strongly disagree and 5 strongly agree.
The results are illustrated in figures D72 to D83 in Annexure D, and the mean, median,
first quartile and third quartile for this question are presented in table 5.14.

137
Table 5.14: Wine tourism and brand equity (n=46)
Mean Median Q1 Q3
1. I can increase loyalty to my wine by exhibiting at a wine festival
3.370 4.000 3.000 4.000
2. I can increase perceived quality of my wine by having an up-market tasting room
3.457 4.000 3.000 4.000
3. Consumers will make positive brand associations with my wine if I host a wine festival
3.043 3.000 2.000 4.000
4. Sponsoring a music event helps create awareness of my brand
3.022 3.000 2.000 3.000
5. Hosting a book club in my wine cellar helps create a positive association with my brand
3.043 3.000 2.000 4.000
6. Being graded by the Wine Route Association increases the perceived quality of my wine
3.348 3.000 3.000 4.000
7. A souvenir shop with several branded souvenirs (e.g. caps, hats, T-shirts) increases brand awareness of my winery
3.261 3.000 3.000 4.000
8. Winery tasting fosters brand loyalty for my winery
3.935 4.000 4.000 4.000
9. Celebrity endorsements increase the perceived quality of my wine
3.478 4.000 3.000 4.000
10. Wine festivals increase positive brand associations with my wine
3.304 3.000 3.000 4.000
11. Cinema and photography festivals increase positive brand associations with my wine
3.109 3.000 2.750 4.000
12. Festivals help create brand awareness of my winery
3.739 1.000 3.000 4.000
Only two statements, pertaining to brand loyalty and brand awareness, received a
majority agree or strongly agree response from respondents (considered significant where
the mean was above 3.7):
• Wine tourism fosters brand loyalty for my winery (80.5% agreement).
• Festivals help create brand awareness (71.7% agreement).
The following three statements received agree or strongly agree responses from between
50 and 60% of respondents:

138
• I can increase perceived quality of my wine by having an upmarket tasting room
(56.6% agreement).
• I can increase loyalty to my wine by exhibiting at a wine festival (56.5%
agreement).
• Celebrity endorsements increase the perceived quality of my wine (52.2%
agreement).
The remainder of the statements received a majority disagree or strongly disagree
response from respondents. The results show that wineries do not perceive certain wine
tourism activities to be contributors to their brand equity. These include the following:
• Cinema and photography festivals and hosting wine festivals (69.6%
disagreement)
• Hosting a book club (65.2% disagreement)
• Sponsoring music events (60.8% disagreement)
• Grading by the Wine Route Association (54.3% disagreement)
• Having branded souvenirs on sale (52.1% disagreement)
Since this question was exploratory, it cannot be directly compared to previous research
findings. However, what can be seen from the results is that festivals, a core element of
wine tourism, are perceived to create brand awareness. This agrees with research by
Christensen et al. (2004), which shows that 73.2% of respondents agreed or strongly
agreed that wine tourism enhances or increases brand awareness.
Also interesting with regard to the results is that just a little over 50% of respondents
perceived celebrity endorsements to increase the perceived quality of wine. The use of
celebrities to endorse products has become a major phenomenon within the last 20 years
(1990-2010). However, Halstead (in Justdrinks.com, 2007) warns that celebrity
endorsements could be a “two-edged sword” for wineries. Halstead states the following:
“A proliferation of celebrity wines would rather defeat the point-of-difference argument and
undermine any momentum in the market.”
In South Africa, the latest celebrity wine news is the breakup of a long-standing business
partnership between Ernie Els (PGA golfer) and Jean Engelbrecht (son of Jannie
Engelbrecht, former Springbok rugby player) (Huisman, 2010). Els will have a smaller
range of wines and will need to work extremely hard to market them as quality wines
without the famous Engelbrecht name (Bisseker, 2010).
139
Regarding the statements that respondents disagreed with, it is interesting to note that
more than half of the respondents (54.3%) do not perceive grading by a wine route
association as something that will contribute to their brand equity. The perception is
incorrect since star grading increases consumers’ confidence as the organisation is then
seen as legitimate and credible (Tourism Grading Council of South Africa, n.d.).
This concludes the descriptive statistic section; the next section is dedicated to testing the
hypotheses.
5.3 HYPOTHESIS TESTING
Based on the data collected during the primary research phase, several hypotheses were
postulated. In order to test the hypotheses, a number of statistical tests were conducted
on the data collected in the survey process. The rationale for accepting or rejecting the
null hypothesis will now be discussed.
5.3.1 TESTING OF HYPOTHESES 1 to 5 (BINOMIAL TEST)
5.3.1.1 Hypothesis 1
H0: Wineries do not perceive wine tourism as a motivation to visit a winery.
H1: Wineries perceive wine tourism as a motivation to visit a winery.
Respondents were required to indicate their level of agreement with 16 statements
relating to the motivations that visitors have to visit a winery.
In order to test hypothesis 1, a binomial test was conducted to determine whether
wineries perceive wine tourism as a motivation to visit a winery. A significance level of 5%
(α = 0.05) was used.
For the purposes of the binomial test, responses, which are considered “negative” include
“strongly disagree”, “disagree” and “neutral” (coded as 1, 2 and 3) and were grouped
together (labelled “Group 1”). Responses that could be considered “positive”, meaning
“agree” and “strongly agree” (coded as 4 and 5 respectively), were grouped together
(labelled “Group 2”).
The results of the binomial test for each of the statements regarding visitor motivations
are presented in table D9 in Annexure D. The null hypothesis could not be rejected for 11
of the 16 statements. Only five motivations relating to wine tourism are statistically

140
significant (p<0.05 in this case) and are presented in table 5.15. The table shows the
frequency, observed proportions, test proportions and the two-tailed P value.
Table 5.15: Motivations to visit a winery (n=46)
Motivation Variable N Observed prop. Test prop. Asymp. sig.
(2-tailed)
Statistical significance
(P < 0.05) To experience the ambiance of the winery
Group 1 7 .15 .50 .000a Significant
Group 2 39 .85
Total 46 1.00
To experience the wine region
Group 1 9 .20 .50 .000a Significant
Group 2 37 .80
Total 46 1.00
As a general outing or activity
Group 1 11 .24 .50 .001a Significant
Group 2 35 .76
Total 46 1.00
For the total winery experience
Group 1 8 .17 .50 .000a Significant
Group 2 38 .83
Total 46 1.00
To learn more about wine
Group 1 14 .30 .50 .011a Significant
Group 2 32 .70
Total 46 1.00
The binomial test showed that the proportion of the respondents in the two groups differs
significantly from 0.5 for the five wine tourism-related motivations (listed in table 5.15).
The majority of respondents agree or strongly agree that these aspects are motivations
for visiting the winery.
The items listed in table 5.15 above are all related to wine tourism in one-way or another.
The deduction can be made that wineries perceive wine tourism to be part of the
motivation of visitors to visit the winery. Based on previous research (Bruwer in Alant and
Bruwer, 2004; Hall et al., 2000:127; Macionis in Getz, 2000:59) regarding the motivations
of tourists to visit wineries, it can be concluded that the perception that wineries have
regarding visitor motivations are correct.

141
5.3.1.2 Hypothesis 2
H0: Wineries do not perceive wine tourism as an advantage to the winery.
H1: Wineries perceive wine tourism as an advantage to the winery.
Respondents were required to indicate their level of agreement with 30 statements
relating to the advantages of wine tourism to a winery.
In order to test hypothesis 2, a binomial test was conducted to determine whether
wineries perceive wine tourism as being advantageous to a winery. A significance level of
5% (α = 0.05) was used.
For the purposes of the binomial test, responses, which are considered “negative”
included “strongly disagree”, “disagree” and “neutral” (coded as 1, 2 and 3) were grouped
together (labelled “Group 1”). Responses that could be considered “positive”, meaning
“agree” and “strongly agree” (coded as 4 and 5 respectively), were grouped together
(labelled “Group 2”).
The results of the binomial test for each of the statements regarding the advantages of
wine tourism are presented in table D10 in Annexure D. The null hypothesis could not be
rejected for 19 of the 30 statements. Eleven statements were deemed to be statistically
significant (p<0.05 in this case) and are presented in table 5.16. The table shows the
frequency, observed proportions, test proportions and the two-tailed P value.
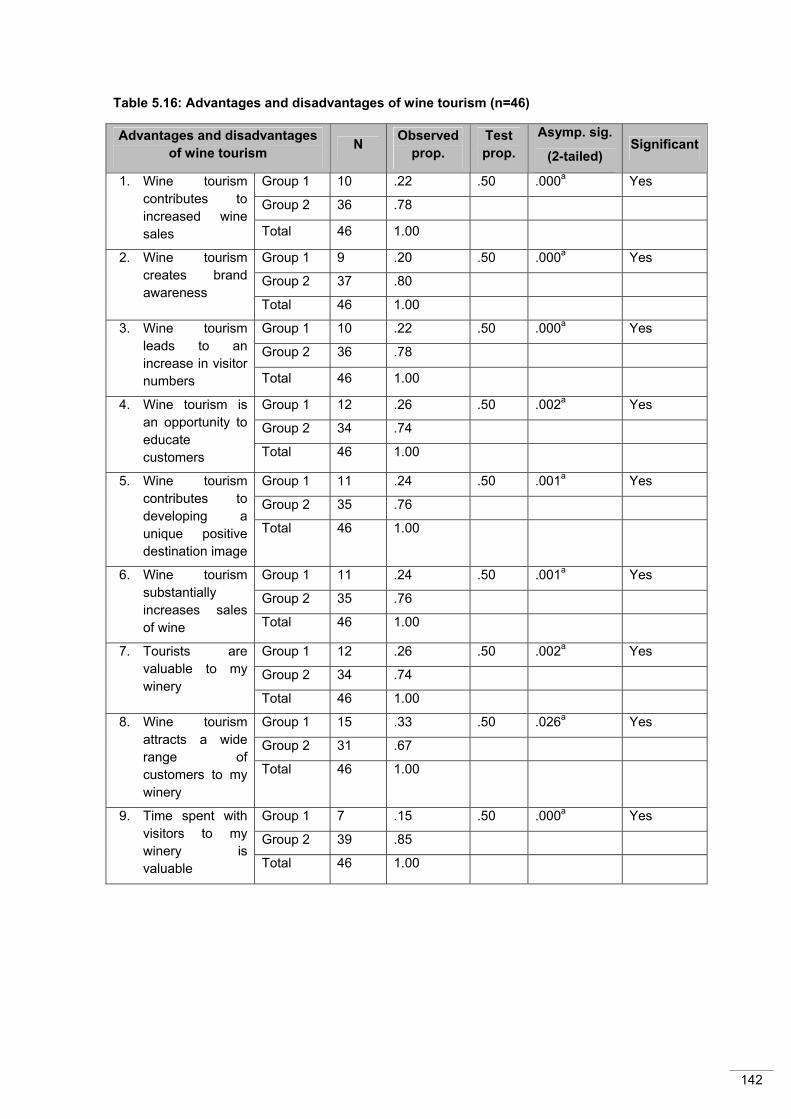
142
Table 5.16: Advantages and disadvantages of wine tourism (n=46)
Advantages and disadvantages of wine tourism N Observed
prop. Test prop.
Asymp. sig.
(2-tailed) Significant
1. Wine tourism contributes to increased wine sales
Group 1 10 .22 .50 .000a Yes
Group 2 36 .78
Total 46 1.00
2. Wine tourism creates brand awareness
Group 1 9 .20 .50 .000a Yes
Group 2 37 .80
Total 46 1.00
3. Wine tourism leads to an increase in visitor numbers
Group 1 10 .22 .50 .000a Yes
Group 2 36 .78
Total 46 1.00
4. Wine tourism is an opportunity to educate customers
Group 1 12 .26 .50 .002a Yes
Group 2 34 .74
Total 46 1.00
5. Wine tourism contributes to developing a unique positive destination image
Group 1 11 .24 .50 .001a Yes
Group 2 35 .76
Total 46 1.00
6. Wine tourism substantially increases sales of wine
Group 1 11 .24 .50 .001a Yes
Group 2 35 .76
Total 46 1.00
7. Tourists are valuable to my winery
Group 1 12 .26 .50 .002a Yes
Group 2 34 .74
Total 46 1.00
8. Wine tourism attracts a wide range of customers to my winery
Group 1 15 .33 .50 .026a Yes
Group 2 31 .67
Total 46 1.00
9. Time spent with visitors to my winery is valuable
Group 1 7 .15 .50 .000a Yes
Group 2 39 .85
Total 46 1.00
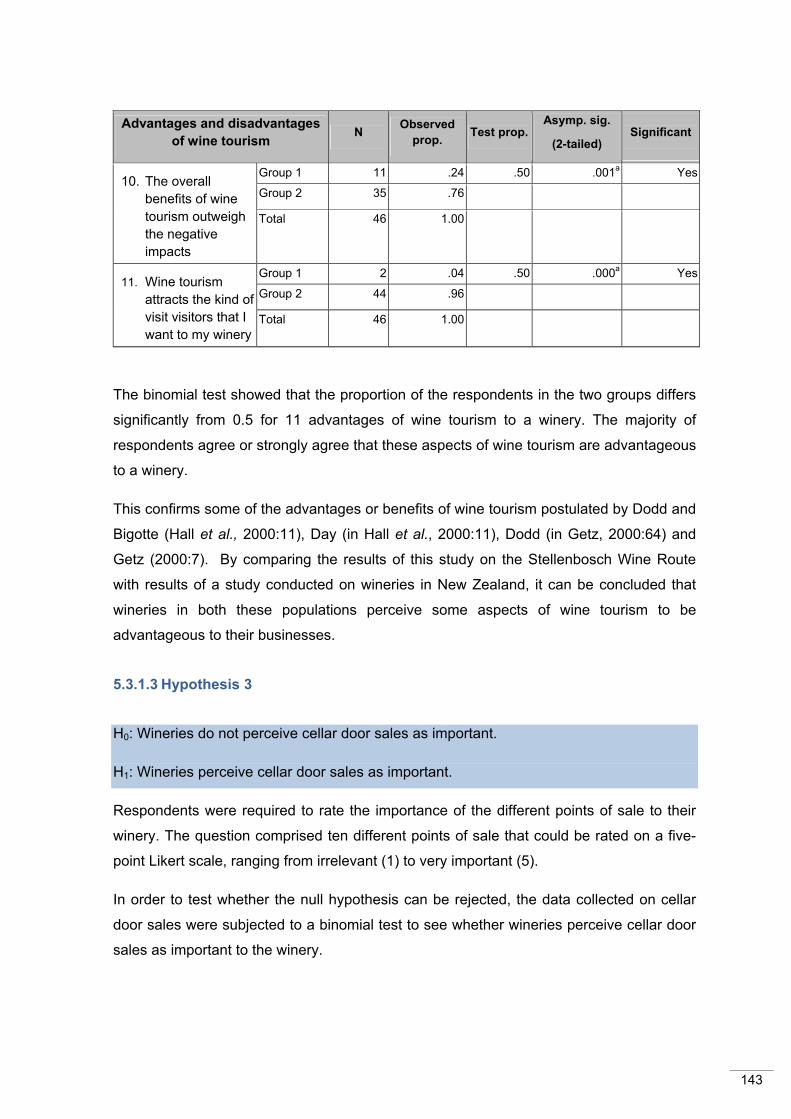
143
Advantages and disadvantages of wine tourism N Observed
prop. Test prop.Asymp. sig.
(2-tailed) Significant
10. The overall benefits of wine tourism outweigh the negative impacts
Group 1 11 .24 .50 .001a Yes
Group 2 35 .76 Total 46 1.00
11. Wine tourism attracts the kind of visit visitors that I want to my winery
Group 1 2 .04 .50 .000a Yes
Group 2 44 .96 Total 46 1.00
The binomial test showed that the proportion of the respondents in the two groups differs
significantly from 0.5 for 11 advantages of wine tourism to a winery. The majority of
respondents agree or strongly agree that these aspects of wine tourism are advantageous
to a winery.
This confirms some of the advantages or benefits of wine tourism postulated by Dodd and
Bigotte (Hall et al., 2000:11), Day (in Hall et al., 2000:11), Dodd (in Getz, 2000:64) and
Getz (2000:7). By comparing the results of this study on the Stellenbosch Wine Route
with results of a study conducted on wineries in New Zealand, it can be concluded that
wineries in both these populations perceive some aspects of wine tourism to be
advantageous to their businesses.
5.3.1.3 Hypothesis 3
H0: Wineries do not perceive cellar door sales as important.
H1: Wineries perceive cellar door sales as important.
Respondents were required to rate the importance of the different points of sale to their
winery. The question comprised ten different points of sale that could be rated on a five-
point Likert scale, ranging from irrelevant (1) to very important (5).
In order to test whether the null hypothesis can be rejected, the data collected on cellar
door sales were subjected to a binomial test to see whether wineries perceive cellar door
sales as important to the winery.
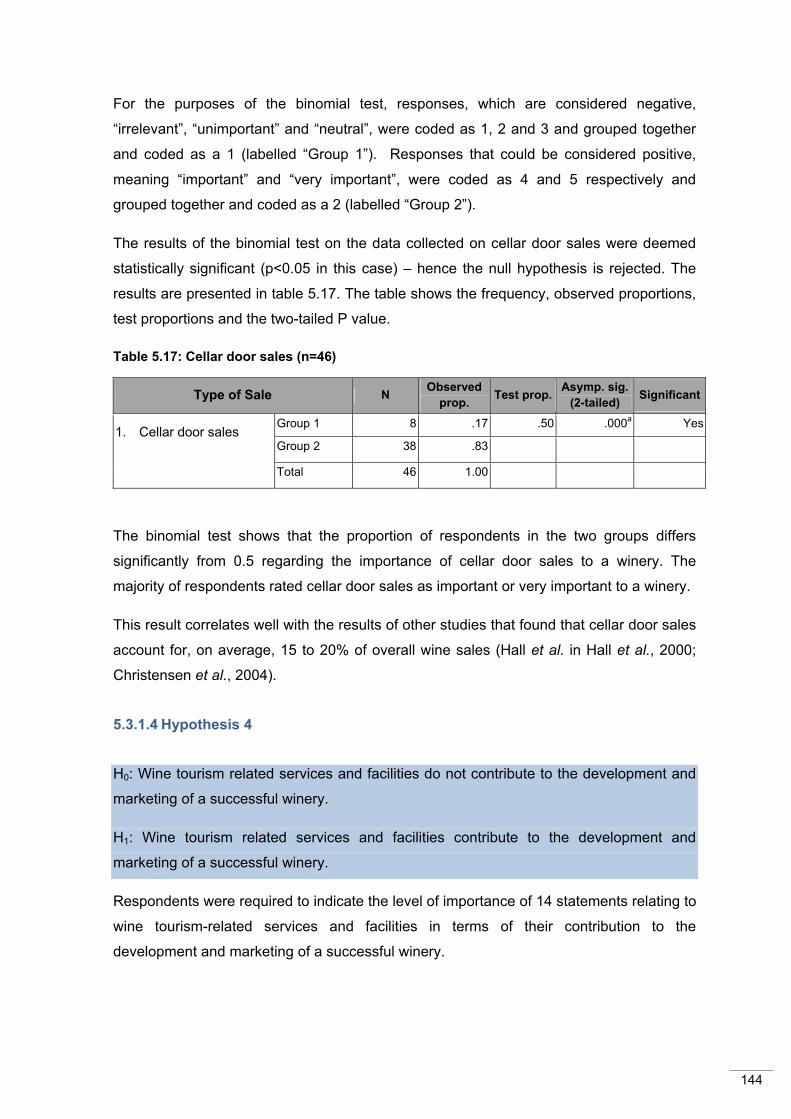
144
For the purposes of the binomial test, responses, which are considered negative,
“irrelevant”, “unimportant” and “neutral”, were coded as 1, 2 and 3 and grouped together
and coded as a 1 (labelled “Group 1”). Responses that could be considered positive,
meaning “important” and “very important”, were coded as 4 and 5 respectively and
grouped together and coded as a 2 (labelled “Group 2”).
The results of the binomial test on the data collected on cellar door sales were deemed
statistically significant (p<0.05 in this case) – hence the null hypothesis is rejected. The
results are presented in table 5.17. The table shows the frequency, observed proportions,
test proportions and the two-tailed P value.
Table 5.17: Cellar door sales (n=46)
Type of Sale N Observed prop. Test prop. Asymp. sig.
(2-tailed) Significant
1. Cellar door sales Group 1 8 .17 .50 .000a Yes
Group 2 38 .83 Total 46 1.00
The binomial test shows that the proportion of respondents in the two groups differs
significantly from 0.5 regarding the importance of cellar door sales to a winery. The
majority of respondents rated cellar door sales as important or very important to a winery.
This result correlates well with the results of other studies that found that cellar door sales
account for, on average, 15 to 20% of overall wine sales (Hall et al. in Hall et al., 2000;
Christensen et al., 2004).
5.3.1.4 Hypothesis 4
H0: Wine tourism related services and facilities do not contribute to the development and
marketing of a successful winery.
H1: Wine tourism related services and facilities contribute to the development and
marketing of a successful winery.
Respondents were required to indicate the level of importance of 14 statements relating to
wine tourism-related services and facilities in terms of their contribution to the
development and marketing of a successful winery.

145
In order to test hypothesis 4, a binomial test was conducted to determine whether
wineries perceive wine tourism related services and facilities to be important to the
development and marketing of a successful winery. A significance level of 5% (α = 0.05)
was used.
For the purposes of the binomial test, responses, which are considered “negative”,
included “irrelevant”, “unimportant” and “neutral”, (coded as 1, 2 and 3) were grouped
together (labelled “Group 1”). Responses that could be considered “positive”, meaning
“important” and “very important”, (coded as 4 and 5 respectively) were grouped together
(labelled “Group 2”).
The results of the binomial test for each of the statements on the factors that influence the
development and marketing of a successful winery are presented in table D12 in
Annexure D. The null hypothesis could not be rejected for two of the ten statements. Eight
statements were deemed statistically significant (p<0.05) and are presented in table 5.18.
The table shows the frequency, observed proportions, test proportions and the two-tailed
P value.
Table 5.18: Factors influencing the success of a winery (n=46)
Factors influencing the success of a winery N Observed
prop. Test prop.Asymp. sig. (2-tailed)
Statisticallysignificant ( p<0.05)
1. Having a restaurant or café
Group 1 12 .26 .50 .002a Yes
Group 2 34 .74 Total 46 1.00
2. Employing staff who are knowledgeable about wines
Group 1 3 .07 .50 .000a Yes
Group 2 43 .93 Total 46 1.00
3. Providing education and interpretation for visitors
Group 1 8 .17 .50 .000a Yes
Group 2 38 .83 Total 46 1.00
4. Providing wine appreciation opportunities
Group 1 12 .26 .50 .002a Yes
Group 2 34 .74 Total 46 1.00
5. Hosting special events and functions
Group 1 14 .30 .50 .011a Yes
Group 2 32 .70 Total 46 1.00

146
6. Having an attractive, well-designed winery
Group 1 13 .28 .50 .005a Yes
Group 2 33 .72 Total 46 1.00
7. Good sign posting Group 1 3 .07 .50 .000a Yes
Group 2 43 .93 Total 46 1.00
8. Friendly, service-oriented staff
Group 1 1 .02 .50 .000a Yes
Group 2 45 .98 Total 46 1.00
The binomial test showed that the proportion of the respondents in the two groups differs
significantly from 0.5 for the eight statements listed in table 5.18. The majority of
respondents indicated that these services or facilities of wine tourism are important or
very important to the successful development and marketing of the winery.
It can therefore be concluded that elements of wine tourism are vital in order to develop
and market a winery successfully. This confirms some of the elements listed by Getz,
Dowling, Carlsen and Anderson (1999) as important for the marketing and development
of a successful winery.
5.3.1.5 Hypothesis 5
H0: Wineries do not perceive wine tourism as contributing to their brand equity.
H1: Wineries perceive wine tourism as contributing to their brand equity.
Respondents were required to indicate their level of agreement with 12 statements
relating to wine tourism and its relationship or contribution to a winery’s brand equity.
In order to test hypothesis 5, a binomial test was conducted to determine whether
wineries perceive wine tourism as contributing to brand equity. A significance level of 5%
(α = 0.05) was used.
For the purposes of the binomial test, responses, which are considered “negative”,
included “strongly disagree”, “disagree” and “neutral” (coded as 1, 2 and 3) were grouped
together (labelled “Group 1”). Responses, which are considered “positive”, meaning
“agree” and “strongly agree” (coded as 4 and 5 respectively) were grouped together
(labelled “Group 2”).

147
The results of the binomial test for each of the statements on brand equity are presented
in table D13 in Annexure D. The null hypothesis could not be rejected for ten of the 12
statements. Only two statements are statistically significant (p<0.05) and are presented in
table 5.19. The table shows the frequency, observed proportions, test proportions and the
two-tailed P value.
Table 5.19: Brand equity (n=46)
Wine tourism influence on brand equity N
Observed prop. Test prop.
Asymp. sig. (2-tailed)
Statisticallysignificant ( p<0.05)
1. Winery tasting fosters, brand loyalty for my winery
Group 1 9 .20 .50 .000a Significant
Group 2 37 .80 Total 46 1.00
2. Festivals help create brand awareness of my winery
Group 1 13 .28 .50 .005a Significant
Group 2 33 .72 Total 46 1.00
The binomial test showed that the proportion of the respondents in the two groups differs
significantly from 0.5 for the two statements “Wine tasting fosters brand loyalty” and
“Festivals help create brand awareness”. The majority of respondents agreed or strongly
agreed that these areas of wine tourism contribute to their brand equity.
The first statement that tested statistically significant, “Wine tasting fosters brand loyalty”,
verifies the research conducted by Christensen et al. (2003), Getz (2000) and Hall,
Sharples, Cambourne and Macionis (2000) that concludes that wine tasting could be used
as a tool to create brand loyalty to a wine. Research conducted by Vrontis and
Papasolomou (2007) showed that wine tasting is perceived as the most influential
promotional tool used by the wine industry. The reasoning is that wine tasting affords
consumers the opportunity to experience the wine’s flavour, aroma and colour. Vrontis
and Papasolomou state that this experience (tasting the wine) has the potential to create
strong preferences towards a certain wine brand, that is, brand loyalty.
“Festivals help create brand awareness”, the second statement that tested statistically
significant, shows that South African wineries perceive wine festivals as a tool that can be
used to create brand awareness for their wines. Yuan and Jang (2008) and Brown and
Getz (2005) conducted research among wine festival visitors and found that festival goers
are likely to visit a winery on the basis of their awareness of what the winery has to offer.
It can therefore be concluded that wineries are correct in their perception that festivals
help to create brand awareness for their wines.

148
5.3.2 TESTING OF HYPOTHESES 6 to 10 (MANN-WHITNEY U TEST)
The Mann-Whitney U test was used to test hypotheses 6 to 10. This test is the
nonparametric counterpart of the t-test for independent groups without the t-test’s limiting
assumptions (Welman et al. 2009:230; Blumberg et al. 2005:580).
In this case, the two independent groups consist of wineries that are classified as either
small or medium (Question 2 required respondents to classify their winery as small,
medium or large. The majority of respondents (91%) indicated that they were either small
or medium. The results for “large” were not tested because there were too few
responses).
The Mann-Whitney U test was conducted to see whether there was a significant
difference between the answers given to questions 12, 13, 15, 16 and 21 based on
whether the winery was classified as small or medium.
5.3.2.1 Hypothesis 6
H0: There is no difference in the perception of visitor motivations between small and
medium-sized wineries.
H1: There is a difference in the perception of visitor motivations between small and
medium- sized wineries.
Respondents were required to indicate their level of agreement with 16 statements
relating to the motivations that visitors have to visit a winery.
The results of the Mann-Whitney U test for each of the statements regarding visitor
motivations are presented in table D14 in Annexure D. The null hypothesis could not be
rejected for 13 of the 16 statements. Only three statements were statistically significant
(p<0.10 in this case) and are presented here in table 5.20. The table shows the two-tailed
P value.
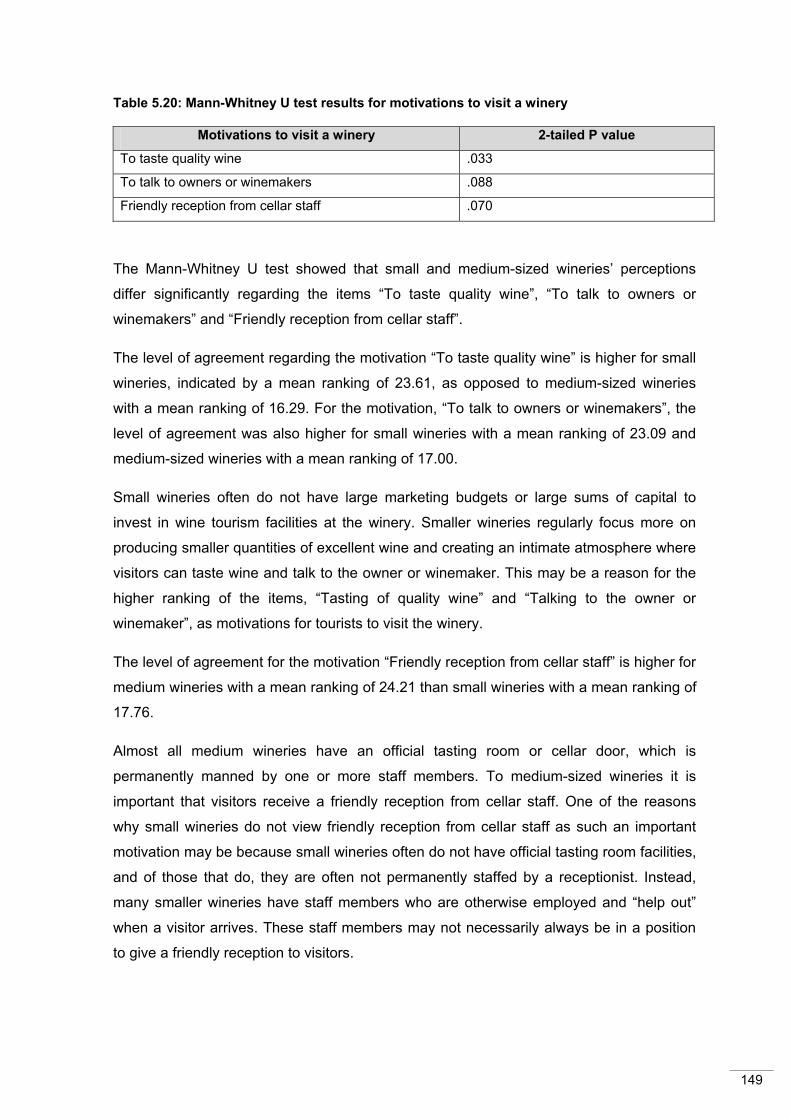
149
Table 5.20: Mann-Whitney U test results for motivations to visit a winery
The Mann-Whitney U test showed that small and medium-sized wineries’ perceptions
differ significantly regarding the items “To taste quality wine”, “To talk to owners or
winemakers” and “Friendly reception from cellar staff”.
The level of agreement regarding the motivation “To taste quality wine” is higher for small
wineries, indicated by a mean ranking of 23.61, as opposed to medium-sized wineries
with a mean ranking of 16.29. For the motivation, “To talk to owners or winemakers”, the
level of agreement was also higher for small wineries with a mean ranking of 23.09 and
medium-sized wineries with a mean ranking of 17.00.
Small wineries often do not have large marketing budgets or large sums of capital to
invest in wine tourism facilities at the winery. Smaller wineries regularly focus more on
producing smaller quantities of excellent wine and creating an intimate atmosphere where
visitors can taste wine and talk to the owner or winemaker. This may be a reason for the
higher ranking of the items, “Tasting of quality wine” and “Talking to the owner or
winemaker”, as motivations for tourists to visit the winery.
The level of agreement for the motivation “Friendly reception from cellar staff” is higher for
medium wineries with a mean ranking of 24.21 than small wineries with a mean ranking of
17.76.
Almost all medium wineries have an official tasting room or cellar door, which is
permanently manned by one or more staff members. To medium-sized wineries it is
important that visitors receive a friendly reception from cellar staff. One of the reasons
why small wineries do not view friendly reception from cellar staff as such an important
motivation may be because small wineries often do not have official tasting room facilities,
and of those that do, they are often not permanently staffed by a receptionist. Instead,
many smaller wineries have staff members who are otherwise employed and “help out”
when a visitor arrives. These staff members may not necessarily always be in a position
to give a friendly reception to visitors.
Motivations to visit a winery 2-tailed P value
To taste quality wine .033
To talk to owners or winemakers .088
Friendly reception from cellar staff .070

150
5.3.2.2 Hypothesis 7
H0: There is no difference in the perception of the advantages and disadvantages of wine
tourism to wineries between small and medium-sized wineries.
H1: There is a difference in the perception of the advantages and disadvantages of wine
tourism to wineries between small and medium-sized wineries.
Respondents were required to indicate their level of agreement with 30 statements
relating to the advantages and disadvantages of wine tourism to wineries.
The results of the Mann-Whitney U test for each of the statements regarding the
advantages and disadvantages of wine tourism to wineries are presented in table D15 in
Annexure D. The null hypothesis could not be rejected for any of the 30 statements and
none of the statements were statistically significant (p<0.10 in this case).
It can therefore be deduced that there is no difference in the way that small and medium-
sized wineries perceive the advantages and disadvantages of wine tourism.
5.3.2.3 Hypothesis 8
H0: There is no difference in perception of the importance of wine distribution points to
wineries between small and medium-sized wineries.
H1: There is a difference in the perception of the importance of wine distribution points to
wineries between small and medium-sized wineries.
Respondents were required to indicate the level of importance of ten different points of
distribution to the sales of a winery.
The results of the Mann-Whitney U test for each of the ten different distribution points are
presented in table D16 in Annexure D. The null hypothesis could not be rejected for any
of the items and none of the distribution points was statistically significant (p<0.10 in this
case).
Based on the results, it can be deduced that there is no difference in the way that small
and medium-sized wineries perceive the importance of the different distribution channels
of wine. Usually, cellar door sales comprise a larger amount of sales early in the
development of a winery and are particularly important for the smaller wineries, where
there are examples where more than 75% of revenue is gained through the cellar door
(Christensen et al., 2004; McDonnell & Hall 2008; Mitchell & Hall 2006).
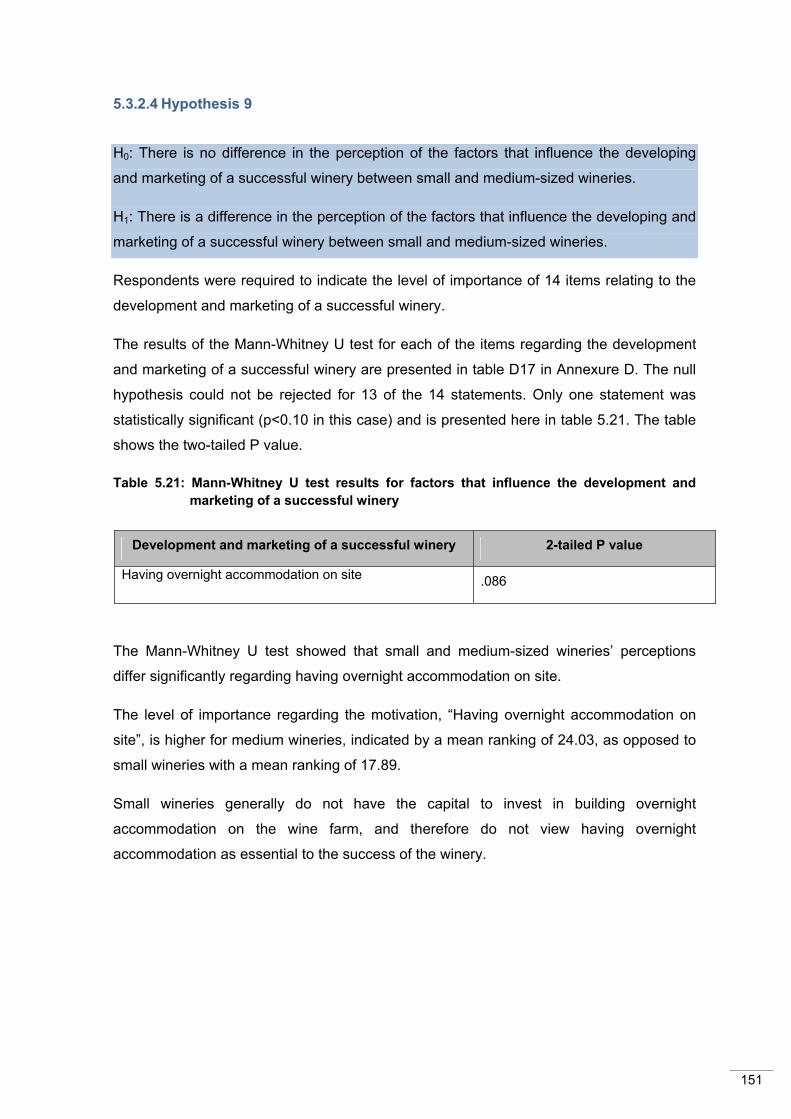
151
5.3.2.4 Hypothesis 9
H0: There is no difference in the perception of the factors that influence the developing
and marketing of a successful winery between small and medium-sized wineries.
H1: There is a difference in the perception of the factors that influence the developing and
marketing of a successful winery between small and medium-sized wineries.
Respondents were required to indicate the level of importance of 14 items relating to the
development and marketing of a successful winery.
The results of the Mann-Whitney U test for each of the items regarding the development
and marketing of a successful winery are presented in table D17 in Annexure D. The null
hypothesis could not be rejected for 13 of the 14 statements. Only one statement was
statistically significant (p<0.10 in this case) and is presented here in table 5.21. The table
shows the two-tailed P value.
Table 5.21: Mann-Whitney U test results for factors that influence the development and marketing of a successful winery
The Mann-Whitney U test showed that small and medium-sized wineries’ perceptions
differ significantly regarding having overnight accommodation on site.
The level of importance regarding the motivation, “Having overnight accommodation on
site”, is higher for medium wineries, indicated by a mean ranking of 24.03, as opposed to
small wineries with a mean ranking of 17.89.
Small wineries generally do not have the capital to invest in building overnight
accommodation on the wine farm, and therefore do not view having overnight
accommodation as essential to the success of the winery.
Development and marketing of a successful winery 2-tailed P value
Having overnight accommodation on site .086

152
5.3.2.5 Hypothesis 10
H0: There is no difference in the perception of the contribution of wine tourism to brand
equity between small and medium-sized wineries.
H1: There is a difference in the perception of the contribution of wine tourism to brand
equity between small and medium-sized wineries.
Respondents were required to indicate their level of agreement with 12 statements
relating to the development or growth of the brand equity of a winery through wine
tourism.
The results of the Mann-Whitney U test for each of the items relating to the development
or growth of the brand equity of a winery are presented in table D18 in Annexure D. The
null hypothesis could not be rejected for eight of the 12 statements. Four statements were
statistically significant (p<0.10 in this case) and are presented here in table 5.22. The
table shows the two-tailed P value.
Table 5.22: Mann-Whitney U test results for wine tourism and brand equity
The Mann-Whitney U test showed that small and medium-sized wineries’ perception
differs regarding the items, “Increasing loyalty by exhibiting at a wine festival”, “Positive
brand association results from hosting a wine festival”, “Hosting a book club creates
positive brand association” and “Grading by the Wine Route Association increases the
perceived quality of wine”.
Wine tourism and brand equity 2-tailed P
value Mean ranking
I can increase loyalty to my wine by exhibiting at a wine
festival .040
Small 23.57
Medium 16.35
Consumers will make positive brand associations with my
wine if I host a wine festival .096
Small 23.57
Medium 16.35
Hosting a book club in my wine cellar helps create a
positive association with my brand .046
Small 23.57
Medium 16.35
Being graded by the Wine Route Association increases
the perceived quality of my wine .022
Small 23.98
Medium 15.79

153
As can be seen from table 5.22, the level of agreement for each of the four items relating
to wine tourism and brand equity is higher for small wineries than medium-sized wineries.
Small wineries often do not have the same marketing budget as medium-sized wineries.
Small wineries have to rely more heavily on certain types of marketing activities, such as
exhibiting at or hosting a wine festival, which may be less important to medium-sized
wineries. The exposure given by exhibiting at or hosting a wine festival may be more
valuable to a small winery than a medium-sized winery since the cost to exhibit at a wine
festival would be the same for both small and medium-sized wineries.
Small wineries also need to market their wines in ways that do not cost a lot of money
(such as hosting a book club or being graded by the Wine Route Association) more than
medium-sized wineries, which may be able to afford other types of marketing activities.
5.3.3 TESTING OF HYPOTHESES 11 TO 15 (KRUSKAL-WALLIS TEST)
In order to test hypotheses 11 to 15, the Kruskal-Wallis test was used. The Kruskal-Wallis
test is regarded as the nonparametric alternative to the regular one-way analysis of
variance (Anova) and is used to compare the medians of three or more independent
samples (Welman et al., 2009:230; Weiers, 2008:519, 845).
In this case, the three independent groups consist of three subroutes of the Stellenbosch
wine route, namely Greater Simonsberg, Helderberg and Stellenbosch Hills (the other two
subroutes, Stellenbosch Berg and Bottelary Hills, had too few responses to be tested).
The Kruskal-Wallis one-way Anova test was conducted to see whether there was a
significant difference between the answers given to questions 12, 13, 15, 16 and 21
based on which subroute the winery was part of.
5.3.3.1 Hypothesis 11
H0: There is no difference in the perception of visitor motivations between wineries of the
Greater Simonsberg, Helderberg and Stellenbosch Hills subroutes.
H1: There is a difference in the perception of visitor motivations between wineries of the
Greater Simonsberg, Helderberg and Stellenbosch Hills subroutes.
Respondents were required to indicate their level of agreement with 16 statements
relating to the motivations that visitors have to visit a winery.

154
The results of the Kruskal-Wallis test for each of the statements on visitor motivations are
presented in table D19 in Annexure D. The null hypothesis could not be rejected for 14 of
the 16 statements. Only two statements were statistically significant (p<0.10 in this case)
and are presented here in table 5.23. The table shows the two-tailed P value and mean
ranking of each subroute.
Table 5.23: Kruskal-Wallis test results for motivations to visit a winery
The Kruskal-Wallis test showed that wineries in the Greater Simonsberg, Helderberg and
Stellenbosch Hills subroutes differ significantly in respect of the item, “Friendly reception
from cellar staff”. Wineries in the Greater Simonsberg and Helderberg subroutes indicated
a higher mean ranking (22.70 and 23.07 respectively) than wineries in the Stellenbosch
Hills subroute (11.65).
Another item that tested statistically significant using the Kruskal-Wallis test is
“Knowledge of the Great Wine Capitals of the World”. Wineries from the Greater
Simonsberg and Helderberg subroutes indicated a higher mean ranking (19.87 and 24.57
respectively) than wineries from the Stellenbosch Hills subroute (13.80).
Based on the results of this test, no meaningful deductions could be made about the
differences in perception between the subroutes.
Motivations to visit a winery 2-tailed P value Mean ranking
Friendly reception from cellar staff .019
Greater Simonsberg 22.70
Helderberg 23.07
Stellenbosch Hills 11.65
Knowledge of the Great Wine
Capitals of the World .061
Greater Simonsberg 19.87
Helderberg 24.57
Stellenbosch Hills 13.80

155
5.3.3.2 Hypothesis 12
H0: There is no difference in the perception of the advantages of wine tourism between
wineries of the Greater Simonsberg, Helderberg and Stellenbosch Hills subroutes.
H1: There is a difference in the perception of the advantages of wine tourism between
wineries of the Greater Simonsberg, Helderberg and Stellenbosch Hills subroutes.
Respondents were required to indicate their level of agreement with 30 statements
relating to the advantages and disadvantages of wine tourism to a winery.
The results of the Kruskal-Wallis test for each of the statements on the advantages of
wine tourism are presented in table D20 in Annexure D. The null hypothesis could not be
rejected for 27 of the 30 statements. Only three statements were statistically significant
(p<0.10 in this case) and are presented here in table 5.24. The table shows the two-tailed
P value and mean ranking of each subroute.
Table 5.24: Kruskal-Wallis test results for the advantages of wine tourism to wineries
The Kruskal-Wallis test shows that wineries in the Helderberg, Stellenbosch Hills and
Greater Simonsberg subroutes differ significantly in respect of the item “Wine tourism has
improved links with the wine trade”. Wineries in the Helderberg and Stellenbosch Hills
subroutes indicated a lower mean ranking (17.43 and 16.20 respectively) than wineries
from the Greater Simonsberg subroute (24.93).
Advantages of wine tourism 2-tailed P value Mean ranking
Wine tourism has improved links
with the wine trade .061
Greater Simonsberg 24.93
Helderberg 17.43
Stellenbosch Hills 16.20
Wine tourism helps to develop
mail order sales .060
Greater Simonsberg 24.63
Helderberg 15.39
Stellenbosch Hills 19.50
Wine tourism attracts a wide
range of customers to my winery .079
Greater Simonsberg 18.20
Helderberg 25.00
Stellenbosch Hills 15.70
156
The results also show that wineries in the Helderberg, Stellenbosch Hills and Greater
Simonsberg subroutes differ significantly regarding the item “Wine tourism helps to
develop mail order sales”. Wineries in the Helderberg and Stellenbosch Hills subroutes
indicated a lower mean ranking (15.39 and 19.50 respectively) than wineries in the
Greater Simonsberg subroute (24.63).
Lastly, the results show that wineries in the Greater Simonsberg, Stellenbosch Hills and
Helderberg subroutes differ significantly in respect of the item “Wine tourism attracts a
wide range of customers to my winery”. The wineries in the Greater Simonsberg and
Stellenbosch Hills subroutes indicated a lower mean ranking (18.20 and 15.70
respectively) than wineries in the Helderberg subroute (25.00).
Although the test indicates significant differences in perception between subroutes
regarding three advantages of wine tourism, no meaningful deductions could be made to
explain these differences. This could also be ascribed to the limited number of responses.
5.3.3.3 Hypothesis 13
H0: There is no difference in the perception of the importance of the different distribution
points of wine between wineries of the Greater Simonsberg, Helderberg and Stellenbosch
Hills subroutes.
H1: There is a difference in the perception of the importance of the different distribution
points of wine between wineries of the Greater Simonsberg, Helderberg and Stellenbosch
Hills subroutes.
Respondents were required to indicate the level of importance of ten points of distribution
to the sales of a winery.
The results of the Kruskal-Wallis test for each of the statements relating to the different
points of distribution are presented in table D21 in Annexure D. The null hypothesis could
not be rejected for any of the items and none of the distribution points was statistically
significant (p<0.10 in this case).
Based on the results, there is no significant difference between the subroutes’ perception
of the different points of distribution.
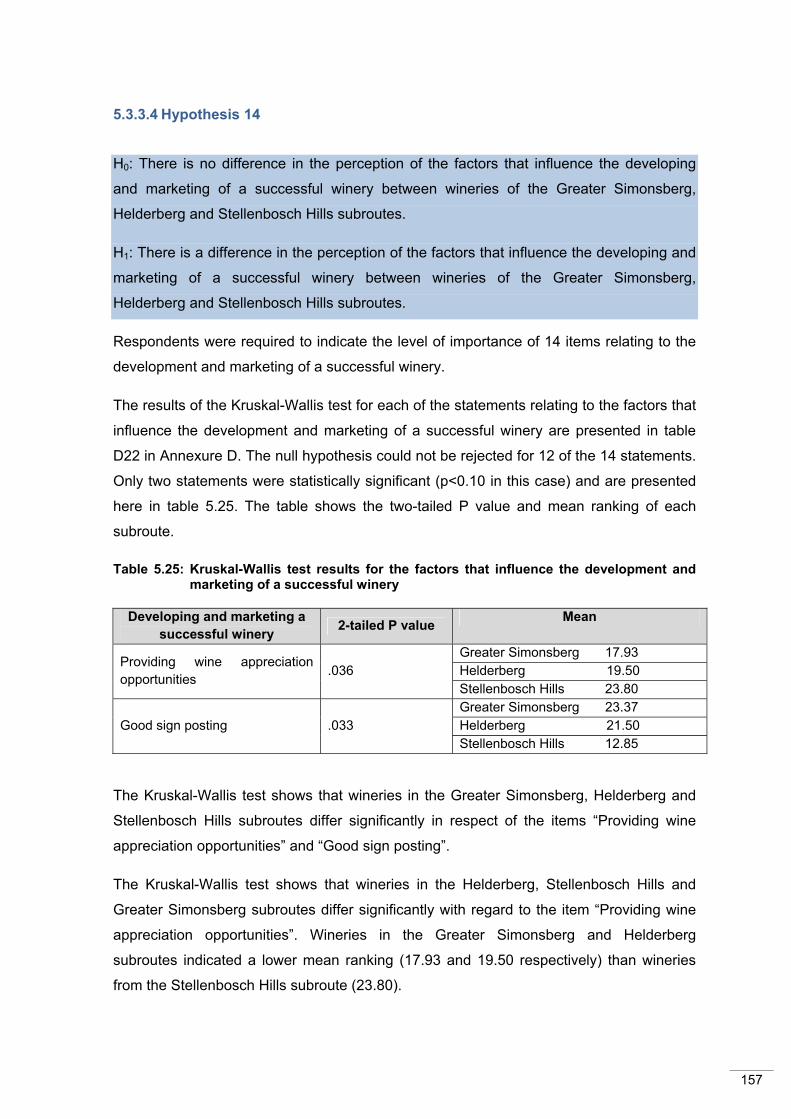
157
5.3.3.4 Hypothesis 14
H0: There is no difference in the perception of the factors that influence the developing
and marketing of a successful winery between wineries of the Greater Simonsberg,
Helderberg and Stellenbosch Hills subroutes.
H1: There is a difference in the perception of the factors that influence the developing and
marketing of a successful winery between wineries of the Greater Simonsberg,
Helderberg and Stellenbosch Hills subroutes.
Respondents were required to indicate the level of importance of 14 items relating to the
development and marketing of a successful winery.
The results of the Kruskal-Wallis test for each of the statements relating to the factors that
influence the development and marketing of a successful winery are presented in table
D22 in Annexure D. The null hypothesis could not be rejected for 12 of the 14 statements.
Only two statements were statistically significant (p<0.10 in this case) and are presented
here in table 5.25. The table shows the two-tailed P value and mean ranking of each
subroute.
Table 5.25: Kruskal-Wallis test results for the factors that influence the development and marketing of a successful winery
The Kruskal-Wallis test shows that wineries in the Greater Simonsberg, Helderberg and
Stellenbosch Hills subroutes differ significantly in respect of the items “Providing wine
appreciation opportunities” and “Good sign posting”.
The Kruskal-Wallis test shows that wineries in the Helderberg, Stellenbosch Hills and
Greater Simonsberg subroutes differ significantly with regard to the item “Providing wine
appreciation opportunities”. Wineries in the Greater Simonsberg and Helderberg
subroutes indicated a lower mean ranking (17.93 and 19.50 respectively) than wineries
from the Stellenbosch Hills subroute (23.80).
Developing and marketing a successful winery 2-tailed P value Mean
Providing wine appreciation opportunities .036
Greater Simonsberg 17.93 Helderberg 19.50 Stellenbosch Hills 23.80
Good sign posting .033 Greater Simonsberg 23.37 Helderberg 21.50 Stellenbosch Hills 12.85
158
The results also showed that wineries in the Helderberg, Stellenbosch Hills and Greater
Simonsberg subroutes differ significantly in respect of the item “Good sign posting”.
Wineries in the Greater Simonsberg and Helderberg subroutes indicated a higher mean
ranking (23.37 and 21.50 respectively) than wineries in the Stellenbosch Hills subroute
(12.85).
The test results indicate significant differences in perception between subroutes in respect
of two factors that may influence the development and marketing of a winery. No
meaningful deductions could be made to explain these differences.
5.3.3.5 Hypothesis 15
H0: There is no difference in the perception of the contribution of wine tourism to brand
equity between wineries of the Greater Simonsberg, Helderberg and Stellenbosch Hills
subroutes.
H1: There is a difference in the perception of the contribution of wine tourism to brand
equity between wineries of the Greater Simonsberg, Helderberg and Stellenbosch Hills
subroutes.
Respondents were required to indicate their level of agreement with 12 statements
relating to the development or growth of the brand equity of a winery through wine
tourism.
The results of the Kruskal-Wallis test for each of the statements relating to wine tourism
and its contribution to brand equity are presented in table D23 in Annexure D. The null
hypothesis could not be rejected for any of the items and none of the distribution points
was statistically significant (p<0.10 in this case).
On other words, there is no significant difference between the subroutes’ perception of the
contribution of wine tourism to brand equity.
5.7 CONCLUSION
This chapter presented the results of the data analysis conducted on the data gathered in
this research study. The first section of the chapter focused on the descriptive analyses
of the data and the second section presented the inferential data analysis results.
The chapter that follows is the last chapter of this dissertation and discusses the
recommendations and conclusions that can be drawn from the research.
159
6. CHAPTER 6: CONCLUSIONS AND RECOMMENDATIONS
6.1 INTRODUCTION
The purpose of this chapter is to summarise the conclusions that were made in the
previous chapter and to provide recommendations based on the research results. This
chapter comprises five sections, starting with an overview of the study process in section
6.2. The limitations of this study are highlighted in section 6.3. The conclusions and
recommendations for management are discussed in sections 6.4 and 6.5. Lastly,
recommendations for future research are set out in section 6.6.
6.2 OVERVIEW OF THE STUDY PROCESS
The South African wine industry is currently operating within an extremely volatile and
challenging business environment, both domestically and internationally. Chapter 1 notes
that unless the South African wine industry shifts from its current production orientation to
a marketing orientation, it will ultimately drift into oblivion in the long term.
International research has shown that one way towards developing a marketing
orientation that has proven highly successful and profitable for wineries globally is that of
wine tourism (Dodd, 1995; Dodd & Bigotte, 1997; Christensen, Hall & Mitchell, 2003;
Getz, 2000; Hall, Sharples, Cambourne & Macionis, 2000; Roberts & Sparks, 2006:47 in
Carlsen & Charters, 2006). The following question was postulated: Do South African
wineries make use of wine tourism when marketing their wines? This study investigated
the role that wine tourism currently plays in the marketing strategies of wineries in the
Stellenbosch Wine Route in South Africa.
First, secondary research was conducted and topics such as South Africa’s wine regions,
wine tourism and the marketing process were discussed in chapters 2 and 3. Primary
research was conducted among all the wineries included in the Stellenbosch Wine Route
using a self-administered email questionnaire in an effort to achieve the primary and
secondary objectives formulated in chapter 1.
The questionnaire was used to obtain information on the following:
CHAPTER 6: CONCLUSIONS AND RECOMMENDATIONS

160
• the corpography of wineries in the Stellenbosch Wine Route
• the range of wine tourism products and services currently available at wineries
• the perceived profile of visitors to the wine route
• the perceived advantages and disadvantages of wine tourism to the wineries
• the importance of wine tourism within the promotion strategy of the winery
• the perception of wine tourism’s contribution to the brand equity of a winery
The methodology used in conducting the primary research was explained in chapter 4.
The data gathered by the survey instrument were analysed and the findings derived from
the analysis of the data were discussed in chapter 5. The conclusions and
recommendations that can be derived from the analysis are discussed in sections 6.4 and
6.5 of this chapter.
Management of wineries in the Stellenbosch Wine Route, as well as the rest of the
Western Cape, could implement the recommendations in order to optimise their marketing
strategies. By understanding the current role that wine tourism plays within its own
marketing strategies as well as those of competitors, management could probably
improve their current position within the wine market vis-á-vis competitors.
6.3 LIMITATIONS OF THE STUDY
As with almost all research, the perfect research environment is seldom encountered
where perfect data can be collected (Van Zyl 2002). This research study is no exception
and is subject to certain limitations, as highlighted below.
• The primary research was conducted over a nine-week period from November
2009 to January 2010. The Soccer World Cup held during June of 2010 may have
influenced some respondents’ perceptions of tourism. Large numbers of tourists
were expected during 2010 and the overall attitude towards tourism may have
been more positive than usual.
• The initial population size was small (146 wineries). Although a 33% response rate
was achieved, which can be regarded as fairly positive (Maylor & Blackman,
2005), the small population size translates a 33% response rate into a small
number of actual respondents. Owing to the response rate, only nonparametric
tests could be conducted on the data because there are constraints regarding
parametric statistical tests. This can be regarded as a limitation to the study.
• Response bias may have influenced the data in that respondents might have
completed the questionnaire in a hurry and questions could have been interpreted

161
differently to the researcher’s intended meaning, despite pilot testing and industry
consultation done beforehand.
• A large number of questionnaires were submitted partially completed and could
not be used in the study. Owing to the complete anonymity of the respondents of
the questionnaire, the researcher was unable to contact these respondents in an
attempt to complete the questionnaire. This limited the amount of usable data.
• The data pertain to wineries in the study population and in some cases cannot be
reliably generalised beyond the Stellenbosch Wine Route.
6.4 CONCLUSIONS OF THE DATA ANALYSES
The following conclusions can be drawn on the basis of the analysis of the data collected
during the primary research phase.
Corpographical information of wineries in the Stellenbosch Wine Route
The Stellenbosch Wine Route comprises mostly small and medium-sized wineries (89%),
with only a small percentage of wineries classified as large (11%). The distribution of
winery size in the wine route is similar to the distribution of winery size throughout the
entire South African wine industry. Statistics show that 90% of all wineries in South Africa
are classified as small to medium (1 to 1 000 tons), with 10% of producers classified as
large (1 001 tons and more) (SAWIS 2009a:6). According to Frandsen (2005), the size
and dominance of the Stellenbosch Wine Route provide a reasonably accurate indication
of all the wine routes and wine tourism in the Western Cape. It can be concluded that the
Stellenbosch Wine Route is a sound representation of the entire South African wine
industry and its wine routes and therefore is a reasonably good study sample.
In the Stellenbosch Wine Route, the majority of wineries are private companies (63%),
although a small percentage are trusts (9%) and closed corporations (11%). Few wineries
are sole traders (7.0%), partnerships (4.7%), cooperatives (2.3%) and public companies
(2.3%). Compared to Bruwer’s (2003) research, a significant increase in the number of
private companies and a decline in the number of cooperatives can be observed. This
confirms Van Huyssteen’s (n.d.) statement that some cooperatives are converting to
companies because of the need for capital formation.
Among the Stellenbosch Wine Route wineries, the most popular form of tasting fee is
charging for a set of samples but discounting the price if a bottle of wine is purchased.
This form of tasting fee is consistent with that used by other New World wine-growing
162
regions (Kelly, 2006; Kolyesnikova, 2006). The practice of charging a tasting fee and
applying it to a purchase is therefore on a par with what can be expected in other New
World wine countries.
Wine production or wine making and the resultant primary activities involved still comprise
the largest number of people in both the full-time and part-time or outsourced employee
categories. Employment in the wine tourism and restaurant or food-related sections of the
winery still attracts smaller numbers of employees. Although physical wine farm activities
require far more labour than tourism activities, the comparatively small numbers in the
wine tourism-related sections of wineries may indicate that wine tourism is still regarded
as a secondary activity – hence as an afterthought.
Nearly all the wineries are open the entire year, from Monday to Friday, with more than
half of the wineries also opening on Saturday, Sunday and most public holidays. It can be
concluded that the majority of wineries in the Stellenbosch Wine Route are mostly
accessible to wine tourists.
Wine tourism products and services available in the Stellenbosch Wine Route
A host of wine tourism-related services and facilities are offered by wineries within the
Stellenbosch Wine Route. The most widely offered services and facilities include wine
tasting (93.4%), cellar door sales (87.0%), restroom facilities for the public (73.9%),
opportunities to meet the winemaker (63%) and social function facilities (52.2%). There
has been a general increase in the number of wine tourism products and services offered
compared to similar research conducted by Bruwer in 2003. This increase is consistent
with the overall growth of wine tourism and its popularity in South Africa between 2003
and 2008 (SA.info 2010b).
Perceived profile of tourists to the wine route
The majority (74%) of wineries on the Stellenbosch Wine Route do not count visitors to
their premises. Hence the statistics are based primarily on the respondent’s perception
and not on recorded research data.
Wineries perceive that an almost equal amount of domestic (50.5%) and international
(49.5%) visitors frequent their wineries. No accredited published data are currently
available with which to verify their perception and no substantial conclusion can be drawn.
The perception among respondents was that there is little difference between the number
of male (53.4%) and female (46.6%) visitors. The small variation in gender may indicate

163
that wine consumption and visiting a winery is not gender specific, but an activity that is
enjoyed equally by both men and women.
The largest age group of visitors is the category 31 to 55 (45%), while 18 to 30 and 56
and older comprise 26 and 24% respectively. The smallest group of visitors are from the
youngest age group, 17 or younger, with an average of only 5% – the reason being that
the legal drinking age in South Africa is 18 years or older. These age group distributions
are similar to those found in other New World wine countries (Mitchell & Hall, 2006).
Wineries in the Stellenbosch Wine Route perceive the following seven motivations of
visitors as the most significant:
• To experience the ambiance of the winery
• For the total winery experience
• To taste quality wine
• To experience the wine region
• Reputation (brand) of the wine
• As a general outing or activity
• To learn more about wine
Based on this, the deduction can be made that elements of wine tourism are perceived as
important motivations for visitors to visit a cellar door.
Advantages and disadvantages of wine tourism for the wineries
The various advantages and disadvantages of wine tourism identified in the literature
were tested in this study. Overall, wineries in the Stellenbosch Wine Route perceive some
aspects of wine tourism as advantageous to their business. Wine tourism’s ability to
create brand awareness (80.4%) and the time spent with visitors (84.8%) are perceived
as the principal advantages of wine tourism. The majority (76%) of respondents indicated
that the advantages of wine tourism outweigh the disadvantages.
Using wine tourism to promote the winery
The greater majority (>80%) of respondents in the Stellenbosch Wine Route indicate that
they have their own wine tasting rooms and internet sites and that they rely heavily on
word-of-mouth advertising.

164
Other forms of wine tourism-related promotion that are used by most (>50%) wineries
include the following:
• Organised wine tastings and special offers or discounts
• Attending wine festivals and trade shows
• Wine route promotional activities
• Other internet sites
• Restaurants
Cellar door sales, primarily related to wine tourism, were rated as important or very
important to the overall sales of 83% of respondents. Studies have shown that cellar door
sales could account for as much as 75% of overall wine sales in small and medium-sized
wineries (Hall et al. in Hall et al,. 2000; Christensen et al., 2004). Since most of the
wineries in the Stellenbosch Wine Route are small or medium-sized, and 83% of
respondents rated cellar door sales as important, it can be concluded that many wineries
are in some way dependent on attracting visitors through wine tourism to the cellar door.
Regarding the marketing and development of a winery, four factors were rated as being
either important or very important to a winery. These factors are as follows:
• Employing staff who are knowledgeable about wines
• Providing education and interpretation for visitors
• Good sign posting
• Friendly, service-oriented staff
All of these factors relate to wine tourism in some way. It can therefore be concluded that
wine tourism is regarded as essential to the marketing and development of a successful
winery.
The majority of wineries in the sample population spend between 0 and 10% of their
revenue on marketing. Domestic marketing spend is positively correlated with domestic
sales and negatively correlated with export sales. International marketing spend is
positively correlated with export sales and negatively correlated with domestic sales.
Thus, when marketing spend increases, sales increase, in both the domestic and
international markets. More of the marketing budget is spent on international marketing
than domestic marketing. A possible reason is that the rand is a weak currency against
most of South Africa’s major export markets. It stands to reason that it would be more
expensive to advertise in these countries than locally.
165
Marketing of wine tourism itself is done by wine route associations, SA Tourism, regional
tourism offices, WOSA, the government, other tourism organisations and individual
wineries. The majority of respondents stated that all these organisations are responsible
for the promotion of wine tourism, with the main onus on wine route associations and SA
Tourism. Although more than 70% of respondents indicated some responsibility for
promoting wine tourism, nearly 30% of wineries still feel that they have no responsibility
for the promotion of tourism. From this, it can be deduced that some wineries still view
tourism as a secondary activity, unrelated to the sale of their wines.
Using wine tourism to build brand equity
According to the majority of respondents (>70%), wine tourism can assist in building
brand equity in that it has the ability to foster brand loyalty and create brand awareness.
Fewer respondents (50–60%) indicated that wine tourism can increase brand loyalty and
perceived quality. It can therefore be concluded that wineries do in fact perceive wine
tourism to assist in building brand equity of wine products.
6.5 RECOMMENDATIONS FOR SOUTH AFRICAN WINERIES
Each winery, be it large, medium or small in size, has different business goals and
marketing needs. While the use of tourism as a marketing tool may not fit into every
winery’s marketing strategy, it is in the best interest of wineries to consider the following
recommendations regarding the use of wine tourism as a strategic marketing tool:
- Develop a marketing information system (MIS) database
It is recommended that a MIS database be developed per winery in order to record as
much data as possible on visitors to the cellar door. This will provide valuable information
on wine tourists and their needs and expectations. The database can then be used to
develop specific wine tourism products and improve the marketing strategy as well as
develop a one-on-one marketing strategy for each individual customer.
- Actively pursue wine tourism as an avenue for market research, product
testing and building the brand equity of the winery and its brands
Wine tourism afford each winery a unique opportunity to gather research data, test new
wine products and build or improve its branding. Management, especially that of wineries
that already have an existing wine tourism product, should make use of the opportunity
166
offered by wine tourism. Conducting market research would not require much investment
and testing new products would be virtually free to the winery. The positive spin-off of
building the winery brand can also not be ignored. Internationally, wineries are
continuously increasing the use of wine tourism as a sound source of market information
and testing new products on visitors to the winery. Wineries not utilising this source of
information will lose their competitive edge. It should be reiterated that wine tourism could
be one of the single most important ways to build brand equity, especially for smaller
wineries in South Africa.
- Consider the practice of charging a tasting fee
The results indicate that the most popular form of tasting fee is charging for a set of
samples but discounting the price if a bottle of wine is purchased. Although this practice is
in line with what other New World wine countries are doing, recent research has shown
that charging a tasting fee could be detrimental to wine sales (Kolyesnikova & Dodd,
2009). Kolyesnikova and Dodd (2009) found that visitors who receive complimentary wine
tasting spend significantly more money at wineries than visitors who pay a fee for tasting.
Visitors who do not pay to taste wine were also more appreciative of cellar door personnel
and report feeling a higher level of obligation to make a purchase than visitors who pay for
tasting. Winery management could benefit from carefully considering their current tasting
fee structure and testing the effects of free tasting on cellar sales.
- Segmenting the markets and products of the winery
Wineries could benefit from streamlining their marketing and wine tourism products and
facilities to target specific age and education groups. The largest group of visitors is
between 31 and 55 years of age and this is also the primary consumer group (Barber,
Dodd & Ghiselli, 2008). However, younger consumers, 18- to 30-year-olds, should not be
ignored. Not only is wine consumption of younger consumers increasing, but within a few
years, they will be the largest consumer group. Research also shows that there is a
strong link between wine consumers and their level of education. The majority of wine
consumers and visitors to wineries are well educated. Wineries could benefit from building
brand loyalty in younger, well-educated consumers. It is therefore recommended that
wineries target tertiary learning institutions, where potential younger, educated consumers
can be found.

167
- Star grading by the Wine Route Associations
The majority of respondents indicated that star grading of the winery by the Wine Route
Association does not contribute to the brand equity of the winery. This perception is not
only incorrect, but could be potentially costly to wineries that disregard the influence that
star grading has on consumer perceptions of a brand. Wineries could benefit from a star
grading by the Wine Route Association and could increase their bottom line by
leveraging this grading to build brand equity.
- Compliance regarding black economic empowerment (BEE) legislation
The results indicated that none of the wineries in the sample had any form of BEE
partnership running. Although the majority of wineries are small and many private, family
owned businesses, it is necessary to keep the legal requirements in mind as the business
expands. BEE compliance could be a massive problem for the wine industry in the future
since the lack of equity in this sector is already being discussed in government circles.
6.6 AREAS FOR FUTURE RESEARCH
Considering the results of this study in light of its limitations, the following areas may be
researched in the future:
- Specific tourism products and services at South African wineries
Wine tourism is very broad in scope and includes many different types of products,
services and facilities. An investigation into the specific products and services that are
most enjoyed by South African wine tourists could be done. This would enable the
industry to streamline its current wine tourism product and offer tourists what they most
desire.
- Increasing cellar sales to wine tourists at South African wineries
This study notes that wineries’ perception of wine tourists is that they do not substantially
contribute to cellar door sales – in other words, that they do not buy a lot of wine.
Research into the reasons for low levels of wine purchasing by wine tourists could be
beneficial to the wine industry by identifying possible obstacles and making
recommendations in this regard.

168
- Gender-specific activities at wineries in South Africa
This study, along with other South African based studies (Bruwer, 2003; Frandsen, 2005),
indicates that the number of men and women who visit wineries is perceived to be similar.
Future research into which individual activities and facilities are important to men and
women would enable wineries to improve their wine tourism products and marketing
strategies.
- Influence of social media on wine tourism
A relatively new phenomenon is social media and its impact as a marketing tool.
Research into the influence of social media on the wine tourism product and its impact on
wine tourism as a marketing channel would provide valuable insight into the future of wine
marketing.
- Wine tourism as a differentiation strategy
This study, as well as research by Christensen et al. (2004), notes that wineries perceive
wine tourism as a tool that can create brand awareness, but not brand differentiation.
Research could be done to establish whether this perception is correct. Further research
into the ways in which wine tourism can be used to differentiate a wine would also provide
wineries with valuable insight into their differentiation strategies.
- Winery visitors’ point of origin
Wineries in the Stellenbosch Wine Route perceive there to be an almost equal amount of
domestic (50.5%) and international (49.5%) visitors that frequent their cellar doors. To the
researcher’s knowledge, there are no national data currently available to empirically
quantify the number of foreign or domestic wine tourists or visitors with which this
perception can be compared or validated. Research into the actual market will enable
wineries to improve their domestic and international marketing strategies.
- Research into developing a MIS database
As previously discussed, there is a need for a market information system at wineries.
Research into the best way in which to operate and collect data for the database would be
valuable to wineries to ensure the sustainability thereof.
169
6.7. CONCLUSION
This chapter provided an overview of the study process and listed the limitations of the
study. Conclusions derived from the data analysis were discussed and a number of
recommendations made for management. The researcher also listed a number of areas
in which future research could be conducted that would be beneficial to the South African
wine industry.
This chapter concludes the study, which investigated the perception of wineries in the
Stellenbosch Wine Route regarding wine tourism and the current role that wine tourism
plays in their marketing strategies. The research was primarily based on a New Zealand
winery survey conducted by Christensen, Hall and Mitchell (2004) and research on South
African wine routes conducted by Bruwer (2003). The findings of the exploratory research
showed noticeable similarities when compared with the results of these studies with
almost no perceptible differences. The research confirms that although wineries are
aware of the possible benefits of wine tourism, many still view it as a secondary marketing
activity. Only when South African wineries fully value the positive influence of wine
tourism as an integral part of their marketing strategies, will they be able to maintain and
grow their share of the alcoholic beverage market.

171
REFERENCES
Afrol News. 2002. Currency crisis hits hard Southern Africa. Afrol News, 28 January. [Online]
Available from: http://www.afrol.com/Categories/Economy_Develop/econ012_rand_crisis.htm
[Accessed: 2010-08-05].
Alant, K. & Bruwer, J. 2004. Wine tourism behaviour in the context of a motivational
framework for wine regions and cellar doors. Journal of Wine Research, 15(1):27-37.
All Business. 2010. Definition: Technological environment. Business glossary. [Online]
Available from: http://www.allbusiness.com/glossaries/technological-environment/4961457-
1.html [Accessed: 2010-08-06].
Anderson, K. 2004. The world’s wine markets: globalization at work. Cheltenham, UK:
Edward Elgar.
Anderson, K., Norman, D. & Wittwer, G. 2004. The global picture, in The world’s wine
markets: globalization at work, edited by K. Anderson. Cheltenham, UK: Edward Elgar.
Anon. 2004. Black economic empowerment in the wine industry: a general guideline for the
wine cellars. 4 October. Distributed by Cliffe Dekker Attorneys. [Online] Available from:
http://bee.sabinet.co.za/charters/NCD_Cellar.pdf [Downloaded: 2009-02-25].
Avenue Vine. 2006. South Africa wine tourism a hit with international wine routes. Avenue
Vine, March 16. [Online] Available from: http://www.avenuevine.com/archives/000958.html
[Accessed: 2008-08-20].
Aufreiter, N.A., Elzinga, D. & Gordon, J.W. 2003. Better branding. The Marketing Quarterly,
(4).
AusWeb 08. 2008. The fourteenth Australasian world wide web conference. AusWeb.
[Online] Available from: http://ausweb.scu.edu.au/aw03/papers/sellitto/figure1.gif [Accessed:
2008-08-03].
Atkin, T. & Affonso, J. 2004. Wine supply chain management, in Wine: a global business,
edited by L. Thach & T. Matz, T. New York: Miranda Press.
Babbie, E., Mouton, J., Vorster, P. & Prozesky, B. 2007. The practice of social research.
South African edition. Cape Town: Oxford University Press.
172
Back, S. 2009. Verbal communication with the author on 22 July. Cape Town. (Notes in
possession of author.) [Marketing manager at Backsberg winery, Stellenbosch.]
Bagwell, P.S. 1999. The transport revolution. London, UK: Routledge.
Barber, N., Dodd, T.H. & Ghiselli, R. 2008. Capturing the younger wine consumer. Journal of
Wine Research, 19(2):123–144.
Barreiro-Hurlé, J., Colombo, S. & Cantos-Villar, E. 2008. Is there a market for functional
wines? Consumer preferences and willingness to pay for resveratrol-enriched red wine. Food
Quality and Preference, 19(4):360–371.
Barrel Cave Wines. n.d. Map of South Africa’s wine regions. [Online] Available from:
http://www.barrelcave.com [Accessed: 2010-09-28].
Bastian, S., Alant, K., Bruwer, J. & Li, E. 2005. Wine consumers and makers: are they
speaking the same language? The Australian and New Zealand Grapegrower and
Winemaker, (5):80–84.
Benade, P. 2009. Verbal communication with the author on 24 July. Stellenbosch. (Notes in
possession of author.) [Cape Wine Master, previously owner and winemaker at Lievland in
Stellenbosch.]
Bell, M. & Giuliani, E. 2007. Catching up in the global wine industry: innovation systems,
cluster knowledge networks and firm-level capabilities in Italy and Chile. International Journal
of Technology and Globalisation, 3(2/3):197–223.
Bennett, J.A. & Strydom, J.W. (eds.) 2001. Introduction to travel and tourism marketing.
Lansdowne, Cape Town: Juta.
Beverland, M. & Lockshin, L. 2003. A longitudinal study of customers’ desired value change
in business-to-business markets. Industrial Marketing Management, 32:653-666.
Biodiversity Wine Initiative (BWI). 2010. What is the biodiversity and wine initiative (BWI)?
BWI. [Online] Available from: http://www.bwi.co.za/ [Accessed: 2010-06-30].
Bisseker, C. 2010. No rest till its best. Financial Mail, 22 July. [Online] Available from:
http://www.fm.co.za/Article.aspx?id=115589 [Accessed: 2010-08-26].

173
Bizcommunity. 2008. ACA on proposed alcohol advertising ban. Bizcommunity, 12
December. [Online] Available from: http://www.bizcommunity.com/Article/196/12/31249.html
[Accessed: 2010-08-05].
Blandy, F. 2009. South African wine industry ages well. Mail & Guardian Online, 01
February. [Online] Available from: http://www.mg.co.za/article/2009-02-01-south-african-
wine-industry-ages-well [Accessed: 2009-02-24].
Blumberg, B., Cooper, D.R. & Schindler, P.S. 2005. Business research methods. New York,
NY: McGraw-Hill Education.
Boekstein, M. 2009. Visitor tracking survey, 2008–2009. Cape Metropolitan Tourism.
[Online] Available from:
http://www.tourismcapetown.co.za/ctru/action/media/downloadFile?media_fileid=12555
[Accessed: 2010-06-30].
Bollinger. n.d. The essence of Bollinger. [Online] Available from: http://www.champagne-
bollinger.com/uk/#/auction/ [Accessed: 2009-09-03].
Botha, P. 2010. Increased excise duty on wine threatens industry jobs. Business Report, 20
May. [Online] Available from:
http://www.busrep.co.za/index.php?fSectionId=561&fArticleId=5477423 [Accessed: 2010-08-
05].
Brodie, R.J., Whittome, J.R.M. & Brush, G.J. 2009. Investigating the service brand: a
customer value perspective. Journal of Business Research, 62:345–355.
Brown, G. & Getz, D. 2005. Linking wine preferences to the choice of wine tourism
destination. Journal of Travel Research, 23:266–267.
Bruwer, J. 2002. The important and role of the winery cellar door in the Australian wine
industry: some perspectives. The Australian and New Zealand Grape Grower and
Winemaker, 8(463):96–99.
Bruwer, J. 2003. South African wine routes: some perspectives on the wine tourism
industry’s structural dimensions and wine tourism product. Tourism Management, 24:424–
435.
Bruwer, J. 2004. The love affair of generation X consumers with the winery cellar door. The
Australian and New Zealand Grapegrower and Winemaker, 12:19–24.

174
Bruwer, J. 2006. Snapshot: wine marketing knowledge base. Unpublished course notes. The
University of Adelaide, Australia, 1-9.
Bruwer, J., Li, E. & Reid, M. 2002. Segmentation of the Australian wine market using a wine-
related lifestyle approach. Journal of Wine Research, 13(3):217–242.
Burkart, A. & Medlik, R. 1981. Tourism, past, present and future. 2nd edition. London:
Heinemann.
Business dictionary. n.d.[a]. Economic environment. [Online] Available from:
http://www.businessdictionary.com/search.php?search=technological+environment
[Accessed: 2010-05-25].
Business dictionary. n.d.[b]. Micro environment. [Online] Available from:
http://www.businessdictionary.com/definition/microenvironment.html [Accessed: 2010-05-25].
Business dictionary. n.d.[c]. Natural environment. [Online] Available from:
www.businessdictionary.com/definition/natural-environment.html [Accessed: 2010-05-25].
Business World. 2008. Bordeaux wine makers rethink sales in the face of global
overproduction. Business World, 06 November. 22(74). [Online] Available from:
http://www.bworldonline.com/BW110608/content.php?id=123 [Accessed: 2009-09-09].
Cant, M.C., Strydom, J.W., Jooste, C.J. & Du Plessis, P.J. 2007. Marketing management. 5th
edition. Cape Town, South Africa: Juta.
Cape Business News. 2009a. City meets liquor industry. Cape Business News, 23 February.
[Online] Available from: http://www.cbn.co.za/dailynews/3524.html [Accessed: 2009-04-29].
Cape Business News. 2009b. The swing is to red wines. Cape Business News, 17 February.
[Online] Available from: http://www.cbn.co.za/index.php?Page=daily&daily_id=4403
[Accessed: 2010-06-30].
Carlsen, J. & Charters, S. (eds.) 2006. Global wine tourism: research, management and
marketing. Oxon, UK: CAB International.
Carr, N. 2002. The tourism-leisure behavioural continuum. Annals of Tourism Research,
29(4):972-986.
175
Castle, G. 2008. SA wine industry needs collaborative strategic marketing. Bizcommunity, 5
December. [Online] Available from: http://www.bizcommunity.com/Article/196/423/31040.html
[Accessed: 2010-08-05].
Chadwick, R. 1994. Concepts, definitions and measurement used in travel and tourism
research, in Travel, tourism and hospitality research: a handbook for managers and
researchers, edited by J.R.B. Ritchie & C. Goeldner. 2nd edition. New York, NY: Wiley.
Charters, S. & Ali-Knight, J. 2002. Who is the wine tourist? Tourism Management, 23:311–
319.
Charters, S. & O’Neill, M. 2001. Service quality at the cellar door: a comparison between
regions. International Journal of Wine Marketing, 13(3):7–17.
Chance, K. 2010. “Plastic” bottles for wine are “not inferior”. Wine.co.za, 15 July. [Online]
Available from: http://www.wine.co.za/news/news.aspx?NEWSID=16035&Source=News
[Accessed: 2010-08-03].
Chemical Engineering Tools and Information. n.d. Wine production diagram. Chemical
Engineering Tools and Information. [Online] Available from:
http://www.cheresources.com/wine2.gif [Accessed: 2008-04-03].
Christensen, T. 2008. The big debate at Cape Wine 2008. Wines of South Africa, 29
September. [Online] Available from:
http://www.wine.co.za/news/news.aspx?NEWSID=12575&Source=Newsfeed [Accessed:
2009-06-22].
Christensen, D., Hall, C.M. & Mitchell, R. 2004. The 2003 New Zealand wineries survey.
Working paper. CAUTHE Conference, Brisbane, Queensland. Clarke, A. & Chen, W. 2007. International hospitality management: concepts and cases.
Oxford, UK: Butterworth-Heinemann.
Clifton, R. & Simmons, J. 2003. Brands and branding. London: The Economist.
Cob Creek. n.d. Cob Creek wine estate. [Online] Available from:
http://www.wine.cobcreek.com/ [Accessed: 2010-08-30].
Cooper, C. 2008. Tourism: principles and practice. Oxford, UK: Prentice Hall.
176
Cooper, D.R. & Schindler, P.S. 2008. Business research methods. 10th edition. Singapore:
McGraw-Hill Education.
Cooperative Research Centre for Viticulture. n.d. Research programs. Chemical Engineering
Tools and Information. [Online] Available from:
http://www.crcv.com.au/research/programs/one/bramley1.pdf [Accessed: 2008-04-02].
Crompton, J. 1979. Motivations for pleasure vacation. Annals of Tourism Research, 6:404–
424.
Danesi, M. 2008. Why it sells: decoding the meanings of brand names, logos, ads, and other
marketing and advertising ploys. Lanham, M.D.: Rowman & Littlefield.
Demhardt, I.J. 2003. Wine and tourism at the “Fairest Cape”: post-apartheid trends in the
Western Cape province and Stellenbosch (South Africa). Journal of Travel and Tourism
Marketing, 14(3/4):113–130.
Deneen, S. n.d. Food miles. thedailygreen.com. [Online] Available from:
http://www.thedailygreen.com/living-green/definitions/Food-Miles [Accessed: 2010-09-29].
Dess, G.G. & Lumpkin, G.T. 2003. Strategic management: creating competitive advantages.
New York: McGraw-Hill.
Dodd, T. 1995. Opportunities and pitfalls of tourism in a developing wine industry.
International Journal of Wine Marketing, 7(1):5-16.
Dodd, T. 2000. Influences on cellar door sales and determinants of wine tourism success:
results from Texas wineries, in Wine tourism around the world: development, management
and markets, edited by C.M. Hall, L. Sharples, B. Cambourne & N. Macionis. Oxford, UK:
Elsevier Science.
Dodd, T. & Bigotte, V. 1997. Perceptual differences among visitor groups to wineries.
Journal of Travel Research, 46–51.
Douglas, N., Douglas, N. & Derrett, R. 2001. Special interest tourism. Brisbane, Australia:
Wiley.
Dowling, R.K. & Carlsen, J. (eds.) 1999. Wine tourism: perfect partners. Proceedings of the
First Australian Wine Tourism Conference, 7-9 May 1998. Margaret River, Western Australia:
Canberra Bureau of Tourism Research.
177
Du Plessis, C. & Boom, R. (eds.) 2008. South African wine industry directory, 2008. 9th
edition. Suider-Paarl, South Africa: Wineland Publications.
Du Plessis, P.J., Jooste, C.J. & Strydom, J.W. 2001. Applied strategic marketing. Sandown:
Heinemann.
Du Toit, G.S., Erasmus, B.J. & Strydom, J.W. (eds.) 2008. Introduction to business
management. 7th edition. Cape Town, South Africa: Oxford Press.
Ehlers, T. & Lazenby, K. 2007. Strategic management: Southern African concepts and
cases. 2nd edition. Pretoria: Van Schaik.
Ellwood, I. 2002. The essential brand book: over 100 techniques to increase brand value. 2nd
edition. London: Kogan Page.
Emmas, C. 2010. Global warming and its impact on wine. WineAnorak.com. [Online]
Available from: http://www.wineanorak.com/global%20warming.htm [Accessed: 2010-08-05].
Encyclopedia Britannica. n.d. Apartheid years. Encyclopedia Britannica. [Online] Available
from: http://www.britannica.com/EBchecked/topic/555568/South-Africa/259494/The-
apartheid-years [Accessed: 2009-02-29].
Evans, I. 2009. The first UV treated wine to be available this year. Decanter, 29 January.
[Online] Available from: http://www.decanter.com/news/275962.html [Accessed: 2009-04-28].
Evans, L. 2010. Chinese wine production soars. FoodEditorials,com. [Online] Available from:
http://www.streetdirectory.com/food_editorials/beverages/wine/chinese_wine_production_so
ars.html [Accessed: 2010-09-02].
Ewert, J. 2003. Co-operatives to companies: the South African wine industry in the face of
globalisation, in Globalisation, localisation and sustainable livelihoods, edited by R. Almas &
G. Lawrence. Aldershot, Ashgate: Not known.
Ewert, J. 2005. How competitive is South Africa? Advances and challenges in the
transformation of the Cape wine industry. Les Cahiers d’Outre-Mer, July–October. [Online]
Available from: http://com.revues.org/index305.html [Accessed: 2010-06-29].
EyeWitness to History. 2004. Christopher Columbus Discovers America, 1492. EyeWitness
to History. [Online] Available from: www.eyewitnesstohistory.com [Accessed: 2010-04-18].
178
Fairtrade Foundation. n.d. What is Fairtrade? Fairtrade Foundation. [Online] Available from:
http://www.fairtrade.org.uk/what_is_fairtrade/default.aspx [Accessed: 2010-08-25].
Foxcroft, M. 2009. Growing the consumption of wine amongst emerging market consumers
in South Africa. Cape Wine Academy. [Online] Available from:
http://www.capewineacademy.co.za/seminars/CWM_Foxcroft_20090322.pdf [Downloaded:
2010-08-05].
Frandsen, D. 2005. Wine tourism marketing strategy for Cape Town and the Western Cape.
Cape Town Routes Unlimited Wine Tourism Forum, 3–6 December.
Fridjhon, M. 2008. Wine. Business Day, 06 November. [Online] Available from:
http://www.businessday.co.za/articles/leisure.aspx?ID=BD4A877895 [Accessed: 2009-03-
03].
Gaiter, D. & Brecher, J. 2008. White wines from an overlooked country offer focus, weight
and value. The Wall Street Journal, 25 April. [Online] Available from:
http://online.wsj.com/article/SB120908197436643427.html?mod=pj_main_hs_coll [Accessed:
2010-06-06].
Gastin, D. & Schwing, M. 2004. The landscape of new world wine, in Wine: a global
business, edited by L. Thach & T. Matz. New York, NY: Miranda Press.
Gawel, R. n.d. Every vintage better than the last! [Online] Available from:
http://www.aromadictionary.com/articles/grapeyield_article.html [Accessed: 2010-09-30].
German Wine Route. n.d. The German wine road. [Online] Available from:
http://www.germanwineroute.com/index.html [Accessed: 2010-10-01].
George, R. (ed.) 2007. Marketing South African tourism. 2nd edition. Cape Town, South
Africa: Oxford University Press.
Gerber-Nel, C. 2006. Determination of brand equity of the provincial, regional and national
rugby teams of South Africa. D.Com thesis, University of South Africa, Pretoria.
Getz, D. 2000. Explore wine tourism: management, development and destinations. New
York, NY: Cognizant Communication.
Getz, D., Dowling, R., Carlsen, J. & Anderson, D. 1999. Critical success factors for wine
tourism. International Journal of Wine Marketing, 11(3):20.

179
Getz, D. & Brown, G. 2006. Critical success factors for wine tourism regions: a demand
analysis. Tourism Management, 27(1):146–158.
Gibb, R. 2009. South African wineries fight fires. Decanter, 23 February. [Online] Available
from: http://www.decanter.com/news/277558.html [Accessed: 2009-04-29].
Go-organic. n.d. Organic wines. Go-organic. [Online] Available from: http://www.go-
organic.co.za/info.asp#1 [Accessed: 2009-09-09].
Hall, C.M., Longo, A.M., Mitchell, R. & Johnson, G. 2000. Wine tourism in New Zealand, in
Wine tourism around the world: development, management and markets, edited by C.M.
Hall, E. Sharples, B. Cambourne. & N. Macionis. Oxford, UK: Butterworth-Heinemann.
Hall, C.M. & Macionis, N. 1998. Wine tourism in Australia and New Zealand, in Tourism and
recreation in rural areas, edited by R.W. Butler, C.M. Hall & J.M. Jenkins. Oxford, England:
Wiley.
Hall, C.M. & Mitchell, M. 2000. Wine tourism in the Mediterranean: a tool for restructuring
and development. International Business Review, 42(4):445–465.
Hall, C.M. & Mitchell, M. 2002. The changing nature of the relationship between cuisine and
tourism in Australia and New Zealand: from fusion cuisine to food networks, in Tourism and
gastronomy, edited by A. Hjalager & G. Richards. London: Routledge.
Hall, C.M., Johnson, G., Cambourne, B., Macionis, N., Mitchell, R. & Sharples, L. 2000. Wine
tourism: an introduction, in Wine tourism around the world: development, management and
markets C.M. Hall, L. Sharples, B. Cambourne, & N. Macionis. Oxford: Butterworth-
Heinemann.
Hall, C.M. & Page, S. 2006. The geography of tourism and recreation: environment, place
and space. 3rd edition. Oxford, UK: Routledge.
Hall, C.M., Sharples, L., Cambourne, B. & Macionis, N. 2000. Wine tourism around the world:
development, management and markets. Oxford, UK: Butterworth-Heinemann.
Hall, L.S. 2009. Cape wine report – part 2. Wine Business.com, 30 April. [Online] Available
from: http://www.winebusiness.com/news/?go=getArticle&dataid=64094 [Accessed: 2009-
04-30].
Hoffman, K.D. (ed.) 2003. Marketing: best practices. 2nd edition. Mason, Ohio: Thomson
South-Western.

180
Holloway, J.C. 2002. The business of tourism. Essex, UK: Pearson Education.
Holt, D.B. 2002. Brand and branding. Boston, Mass: Harvard Business School Publishing.
Honeycreek Vineyards and Orchards. n.d. A brief history of wine. Honeycreek Vineyards and
Orchards. [Online] Available from: http://www.honeycreek.us/history.php [Accessed: 2008-
07-17].
Howe, G. 2008. The big debate at Cape Wine 2008. Wines of South Africa, 29 September.
[Online] Available from: http://www.wosa.co.za/wosa_news_article.php?wine_id=12575
[Accessed: 2009-02-25].
Howley, M. & Van Westering, J. 2008. Developing wine tourism: a case study of the attitude
of English wine producers to wine tourism. Journal of Vacation Marketing, 14(1):87–95.
Huisman, B. 2010. Engelbrecht, Els split doesn’t bode well for SA wines. Times, 6 June.
[Online] Available from:
http://www.timeslive.co.za/sundaytimes/article489492.ece/Engelbrecht-Els-split-doesnt-
bode-well-for-SA-wines [Accessed: 2010-08-26].
Human Sciences Research Council (HSRC). 2008. The impact of electricity price increases
and rationing on the South African Economy – Final report to the National Electricity
Response Team (NERT) Economic impact task team. Human Sciences Research Council.
[Online] Available from:
http://www.hsrc.ac.za/research/output/outputDocuments/5687_Altman_Theimpactofelectricit
ypriceincreases.pdf [Downloaded: 2010-08-05].
Hussain, M., Cholette, S. & Castaldi, R.M. 2008. An analysis of globalization forces in the
wine industry: implications and recommendations for wineries. Journal of Global Marketing,
21(1):33–47.
Huybers, T. (ed.) 2007. Tourism in developing countries. Northampton, MA: Edward Elgar.
Indexmundi. 2010. South Africa unemployment rate. [Online] Available from:
http://www.indexmundi.com/south_africa/unemployment_rate.html [Accessed: 2010-08-05].
Ignatov E. & Smith, S. 2006. Segmenting Canadian culinary tourists. Current Issues in
Tourism, 9(3):235–255.
Integrated Production of Wine Scheme (IPW). n.d. Functions of the Scheme for Integrated
Wine Production. [Online] Available from: http://www.ipw.co.za/ [Accessed: 2010-06-30].
181
Interbrand. 2010. Best global brands – 2009 rankings. [Online] Available from:
http://www.interbrand.com/best_global_brands.aspx [Accessed: 2010-08-05].
Internet World Statistics. 2009. Internet usage statistics for Africa. [Online] Available from:
http://www.internetworldstats.com/stats1.htm [Accessed: 2010-05-03].
Ismail, A.R. & Melewar, T.C. 2008. The role of customer experience in building brand loyalty
within the service context. Proceedings of the 13th International Conference on Corporate
and Marekting Communications. Ljubljana, Slovenia, 24–26 April.
Israel-Palestine Info. 2010. An online guide to middle-east conflict. Israel-Palestine Info, 19
August. [Online] Available from: http://www.israel-palestina.info/english_section.html
[Accessed: 2010-08-25].
Jaffe, E. & Pasternak, H. 2004. Developing wine trails as a tourist attraction in Israel. The
International Journal of Tourism Research, 6(4):237.
Jang, S. & Cai, L.A. 2003. Travel motivations and destination choice: a study of British
outbound market. Journal of Travel and Tourism Marketing, 13(3):111–133.
Jooste, C.J., Strydom, J.W., Berndt, A. & Du Plessis, P.J. (eds.) 2009. Applied strategic
marketing, 3rd edition. Sandton: Heinemann.
Justdrinks.com. 2007. Spotlight – celebrity endorsement a two-edged sword for wineries.
Just-drinks, 20 November. [Online] Available from: http://www.just-
drinks.com/analysis/spotlight-celebrity-endorsement-a-two-edged-sword-for-
wineries_id92269.aspx [Accessed: 2010-07-26].
Kapferer, J. 2008. The new strategic brand management: creating and sustaining brand
equity long term. London: Kogan Page.
Kipfer, B.A. (ed.) 2005. Environmentally friendly. Webster's New Millennium dictionary of
English, Preview Edition. Long Beach, CA: Lexico.
Keller, K.L. 2003. Strategic brand management: building, measuring and managing brand
equity. 2nd edition. Upper Saddle River, NJ: Prentice-Hall.
Keller, K.L. 2008. Strategic brand management: building measuring and managing brand
equity. 3rd edition. Upper Saddle River, NJ: Prentice-Hall.
182
Kelley, K.M. 2006. Winery tasting room essentials: value-added marketing. College of
Agricultural Sciences: Cooperative extension. Department of Agricultural Economics and
Rural Sociology: Penn State.
Kolyesnikova, N. 2006. Gratuity purchasing at wineries: the role of gratitude and obligation in
purchases by winery visitors. PhD. thesis, Texas Tech University, Texas.
Kolyesnikova, N. & Dodd, T. 2009. There is no such thing as a free wine tasting: the effect of
a tasting fee on obligation to buy. Journal of Travel and Tourism Marketing, 26:806–819.
Kotler, P. 2000. Marketing management, the millennium edition. Upper Saddle River, NJ:
Prentice Hall.
Kotler, P. 2003. Marketing management. 11th edition. Upper-Saddle River, NJ: Prentice-Hall.
Kotler, P. & Armstrong, G. 2001. Principles of marketing. 9th edition. Upper Saddle River, NJ:
Prentice-Hall.
Kotler, P. & Armstrong, G. 2006. Principles of marketing. 11th edition. Upper Saddle River,
NJ: Prentice-Hall.
Kotler, P., Bowen J.T. & Makens, J.C. 2010. Marketing for hospitality and tourism. 5th edition.
Upper Saddle River, NJ: Prentice Hall.
Kotler, P. & Keller, K.L. 2009. Marketing management. 13th edition. Upper Saddle River, NJ:
Prentice-Hall.
Kumar, R. 2005. Research methodology: a step-by-step guide for beginners. 2nd edition.
London: Sage.
Lamb, C.W., Hair, J.F., McDaniel, C., Boshoff, C. & Terblanché, N.S. 2002. Marketing. Cape
Town: Oxford.
Landzicht. n.d. Landzicht cellar. [Online] Available from:
http://www.landzicht.co.za/pg/ourcell.php [Accessed: 20101-08-30].
Leedy, P.D. & Ormrod, J.E. 2010. Practical research: planning and design. 9th edition.
Boston: Pearson Education International.
Le Roux, M. 2007. Has the wine industry bubble burst? Business News, 19 March. [Online]
Available from: http://lifestyle.iafrica.com/wine/news/700887.htm [Accessed: 05-05-2007].
183
Ling, G. 2010. How wine is made. How products are made. [Online] Available from:
www.madehow.com/Volume-1/Wine.html [Accessed: 2010-07-08].
Lockshin, L. & Spawton, T. 2001. Using involvement and brand equity to develop a wine
tourism strategy. International Journal of Wine Marketing, 13(1):72–81.
Lordan, N. 2009. New liquor act puts strain on wine industry. Wine.co.za, 12 August. [Online]
Available from: http://www.wine.co.za/News/news.aspx?NEWSID=14360&Source=News
[Accessed: 2010-08-05].
Lordan, N. 2010. Is Fairtrade fair? Wine.co.za, 16 March. [Online] Available from:
http://www.wine.co.za/News/news.aspx?NEWSID=15451&Source=News [Accessed: 2010-
06-23].
Loubser, S.S. 2004. The role of wine tourism in establishing a successful South African wine
industry. Paper presented at the International Wine Tourism Conference, Margaret River,
Western Australia, 2–5 May.
Lubbe, B. (ed.) 2003. Tourism management in Southern Africa. Cape Town: Pearson
Education.
Lumsdon, L. 1997. Tourism marketing. London: Thomson Learning.
Manuel, T.A. 2007. The South African wine industry: challenges and opportunities. Freedom
Day Lecture – South African Wine Council, 3 May. Groot Constantia, Cape Town. [Online]
Available from: http://www.sawit.co.za/news/news_articles_09.asp [Accessed: 2009-02-28].
Marston, C. 2010. Twitter sippers: a small encouragement for any winery not in the tweet-
zone. Wine.co.za, 14 July. [Online] Available from:
http://www.wine.co.za/News/news.aspx?NEWSID=16023&Source=News [Accessed: 2010-
08-02].
Marx, S. 2009 Verbal communication with the author on 23 July. Cape Town. (Notes in
possession of author.) [Marketing manager of Golden Kaan Wines.]
Marzo-Navarro, M. & Pedraja-Iglesias, M. 2009. Profile of a wine tourist and the
correspondence between destination and preferred wine: A study in Aragon, Spain.
Department of Economics and Business Management, Faculty of Economic and Business
Sciences at the University of Zaragoza, 50005-Zaragoza, Spain. 10 November. [Online]
Available from:
184
http://www.informaworld.com/smpp/content~content=a916730876~db=all~jumptype=rss
[Accessed: 2010-04-07].
Mason, J. 2010. South Africa overtakes France in UK wine market. Wines of South Africa, 23
February. [Online] Available from:
http://www.wine.co.za/news/news.aspx?NEWSID=15349&Source=News [Accessed: 2010-
06-22].
Matthews, T. n.d. The official 1855 classification. ABC’s of Wine. [Online] Available from:
http://www.winespectator.com/Wine/Wine_Basics/Wine_Basics_Template/0,,144,00.html
[Accessed: 2008-08-20].
Maylor, H. & Blackman, K. 2005. Researching business and management. Houndmills,
Basingstoke, Hampshire: Palgrave MacMillan.
Max, A. 2009. Australian bushfires: eyewitness reports from Punt Road, Oakridge,
Wedgetail. Decanter.com, 09 February. [Online] Available from:
http://www.decanter.com/news/276634.html [Accessed: 29-04-2009].
Mbendi Information Services. 2009. Rottcher (Orange) Wineries. [Online] Available from:
http://www.mbendi.com/travel/attr/49/f641.htm [Accessed: 2010-08-30].
McDaniel, C. & Gates, R. 2001. Marketing research essentials. 3rd edition. Mason, Ohio:
South-Western College Publishing.
McDonnell, A. & Hall, C.M. 2008. A framework for the evaluation of winery servicescapes: a
New Zealand case. PASOS. Revista de Furismory Patrimonia Cultural, Special issue 6(2):
231–247. [Online] Available from:
http://www.pasosonline.org/Publicados/6208special/PASOS14.pdf#page=104 [Accessed:
2010-08-19].
McNulty, A. 2010. Enough to lift its spirits? Financial Mail, 26 February. [Online] Available
from: http://free.financialmail.co.za/10/0226/moneyinvest/bmoney.htm [Accessed: 2010-06-
30].
Medet, Y., Fatmagül, Ç. & Uysal, M. 2009. An examination of festival motivation and
perceived benefits relationship: Eskişehir International Festival. Journal of Convention and
Event Tourism, (4):276–291.
185
Media Vision Consultants. 2008. Foreign investment underscores potential of South African
wine industry. 05 February. [Online] Available from:
http://www.wine.co.za/news/news.aspx?NEWSID=11275&Source=Newsfeed [Accessed: 06-
06-2008].
Meyer, D. 2004. Tourism routes and gateways: key issues for the development of tourism
routes and gateways and their potential for pro-poor tourism. Overseas Development
Institute. [Online] Available from:
http://docs.google.com/viewer?a=v&q=cache:15uaUIERVW4J:195.130.87.21:8080/dspace/bi
tstream/123456789/519/1/Tourism%2520routes%2520and%2520getaways%2520%2520Ke
y%2520issues%2520for%2520the%2520development%2520of%2520tourism%2520routes%
2520and%2520gateways%2520and....pdf+South+African+wine+route+system+enjoys+the+r
eputation+of+being+a+wine+country+with+one+of+the+best+wine+route+infrastructure+syst
ems+and+winescapes+in+the+world&hl=en&gl=za&pid=bl&srcid=ADGEESh4GrpnFFib4AM
PGaAAf4EN_JaL07M5ue7T-
XO7jdIz8zxFKjsoIiFly6C0oDQoWBaX_BOm5EzY4l9aYeC2W32QLfppCboWH3FVE9Ml7Apr
ZM0ixeKvDpj73RCeRGYb-pOe7uZQ&sig=AHIEtbShcVVNrIDaCf92zSeacSmFpSMC6g
[Accessed: 2010-07-09].
Miller, S. 2009. South Africa set to revolutionise wine world. Wines of South Africa, 26
August. [Online] Available from:
http://www.wine.co.za/news/news.aspx?NEWSID=14443&Source=Newsfeed [Accessed:
2010-06-22].
Miller, B. & Bruwer, J. 2006. Exploring gender differences in sensory preferences in wine.
The Australian and New Zealand Grapegrower and Winemaker, December:66–69.
Mitchell, R., Hall, C. M., & McIntosh, A. 2000. Wine tourism and consumer behavior, in Wine
tourism around the world: development, management and markets, edited by C.M. Hall, L.
Sharples, B. Cambourne & N. Macionis. Oxford, UK: Butterworth-Heinemann.
Mitchell, R. & Hall, C.M. 2001. Lifestyle behaviours of New Zealand winery visitors: wine club
activities, wine cellars and place of purchase. International Journal of Wine Marketing,
13(3):82–93.
Mitchell, R. & Hall, CM. 2004. The post-visit consumer behaviour of New Zealand winery
visitors. Journal of Wine Research, 15(1):39–49.

186
Mitchell, R. & Hall, C.M. 2006. Wine tourism research: the state of play. Tourism Review
International, 9(4):307-332.
Morgenthal, A. 2009. Verbal communication with the author on 23 July. Cape Town. (Notes
in possession of author.) [Marketing manager of WOSA.]
Morrison, F. 2007. Screwcaps. Number wine. [Online] Available from:
http://www.numberwine.eu/screw-caps.html [Accessed: 2010-08-05].
Mouton, J. 2005. How to succeed in your master’s and doctoral studies: a South African
guide and resource book. Paarl, South Africa: Van Schaik.
Napa Valley Destination Council. 2008. The NVDC and the importance of tourism in Napa
County. The Napa Valley. [Online] Available from:
http://204.17.36.204/docs/cats/1%20The%20NVDC%20and%20the%20Importance%20of%2
0Tourism.pdf [Downloaded: 2010-09-29].
Neuman, W.L. 2007. Basics of social research: qualitative and quantitative approaches. 2nd
edition. Boston, MA: Pearson Education.
News24. 2010. Exchange rate. News24, 05 August. [Online] Available from:
http://www.news24.com/ [Accessed: 2010-08-05].
Nielsen Company. 2009. “Recession-Resilient” alcoholic beverage industry shows signs of
strain in tough economic times. [Online] Available from: http://en-
us.nielsen.com/content/nielsen/en_us/news/news_releases/2009/may/nielsen_recession_res
ilient.html [Accessed: 29-06-2010].
Nieuwenhuizen, C. 2007. Business management for entrepreneurs. Cape Town, South
Africa: Juta.
Nieuwenhuizen, C. & Rossouw, D. 2008. Business management: a contemporary approach.
Cape Town, South Africa: Juta.
Nowak, L., Thach, L. & Olsen, J.E. 2006. Wowing the millennials: creating brand equity in the
wine industry. Journal of Product and Brand Management, 15(5):316–323.
O’Neill, M. & Charters, S. 2000. Service quality at the cellar door: implications for Western
Australia’s developing wine tourism industry. Managing Service Quality, 10(2):112–122.

187
O’Neill, M.A. & Palmer, A. 2004. Wine production and tourism: adding service to a perfect
partnership. Cornell Hotel and Restaurant Administration Quarterly, August:269–284.
O’Neill, M., Palmer, A. & Charters, S. 2002. Wine production as a service experience: the
effects of service quality on wine sales. Journal of Services Marketing, 16(4):342-362.
Orth, U.R., Lockshin, L. & d’Hauteville, F. 2007. The global wine business as a research
field. International Journal of Wine Business Research, 19(1):5–13.
Orth, U.R., Wolf, M.M. & Dodd, T. 2005. Dimensions of wine region equity and their impact
on consumer preferences. Journal of Brand Management, 14(2):88–97.
Pendock, N. 2010. Can the iPad save Stellenbosch? Wine.co.za, 21 July. [Online] Available
from: http://www.wine.co.za/News/news.aspx?NEWSID=16061&Source=News [Accessed:
2010-08-02].
Pinotage Association. 2008 Absa top ten pinotage. [Online] Available from:
http://www.pinotage.co.za/index.php?page=27&PHPSESSID=1e16af71d553c7885553ed86b
978d8b6 [Accessed: 2009-01-07].
Pizam, A. & Mansfield, Y. (eds.) 1999. Consumer behaviour in travel and tourism. New York:
Haworth Press.
Planting, S. 2010. A slow blend. Financial Mail, 24 June. [Online] Available from:
http://www.fm.co.za/Article.aspx?id=112790 [Accessed: 2010-07-06].
Preston-Whyte, R. 2000. Wine route in South Africa, in Wine tourism around the world:
development, management and markets, edited by C.M. Hall, L. Sharples, B. Cambourne &
N. Macionis. Oxford: Butterworth-Heinemann.
Pricewaterhouse Coopers. 2008. The South African wine industry benchmarking of producer
cellars – 2008 harvest. [Online] Available from: http://www.pwc.com/za/en/publications/wine-
benchmarking-survey-2009.jhtml [Accessed: 2010-06-08].
Pride, W.M. & Ferrell, O.C. 2003. Marketing: concepts and strategies. 12th edition. Boston,
Mass: Houghton Mifflin.
Professional Friends of Wine. n.d. Wine 101: wine history. [Online] Available from:
http://www.winepros.org/wine101/history.htm [Accessed: 17-07-2008].
188
Ponte, S. & Ewert, J. 2007. South African wine: an industry in ferment. Working paper no. 8.
Danish Institute for International Studies and Department of Sociology and Social
Anthropology, University of Stellenbosch, October.
Porter, M. 2001. The value chain and competitive advantage, in Understanding business
process, edited by D.W. Barnes London, UK: Routledge.
Reddy, C. 2006. Wine body stresses exports, tourism. Engineering News, 17 November.
[Online] Available from:
http://www.engineeringnews.co.za/searchadvanced.php?searchString=wine+tourism
[Accessed: 03-12-2007].
Redford, S. 2008. The effect of exchange rate volatility on the volume of South African
exports. South African Reserve Bank. [Online] Available from:
http://www.tips.org.za/publication/effect-exchange-rate-volatility-volume-south-african-
exports [Accessed: 2010-08-25].
Ruta do viňo do Ribeiro. 2010. Menu principal. [Online] Available from:
http://www.rutadelvinoribeiro.com/ [Accessed: 2010-10-01].
Riezebos, R. 2003. Brand management: a theoretical and practical approach. London:
Prentice-Hall.
Roberts, L. & Sparks, B. 2006. Enhancing the wine tourism experience: the customers’
viewpoint, in Global wine tourism: research, management & marketing, edited by J. Carlsen,
& S. Charters. London, UK: CAB International.
Robinson, J. 2004. Will our grandchildren need a corkscrew? JancisRobinson.com, 11 June.
[Online] Available from:
http://www.jancisrobinson.com/articles/winenews0612?searchterm=corkscrew [Accessed:
2010-09-01].
Robinson, J. (ed.) 2006. The Oxford companion to wine. 3rd edition. Oxford, UK: Oxford
University Press.
Rose, A. 2009. The Fairtrade logo alone is not enough: the wines have to stack up against
similarly priced bottles on merit. The Independent, 21 February. [Online] Available from:
http://www.independent.co.uk/life-style/food-and-drink/features/anthony-rose-the-fairtrade-
logo-alone-is-not-enough-ndash-the-wines-have-to-stack-up-against-similarly-priced-bottles-
on-merit-1625740.html [Accessed: 29-04-2009].
189
Rosnow, R. & Rosenthal, R. 1999. Beginning behaviour research: a conceptual primer.
Upper Saddle River, NJ: Prentice-Hall.
Ross, J. n.d. Yield versus quality. Enology International. [Online] Available from:
http://www.enologyinternational.com/yield/yieldvsq.html [Accessed: 2010-09-30].
Russell-Bennett, R., McColl-Kennedy, J.R. & Coote, L.V. 2007. Involvement, satisfaction,
and brand loyalty in a small business services setting. Journal of Business Research,
60(12):1253–1260.
SA Wine Council. 2007. The wine industry transformation charter. September. [Online]
Available from: http://www.sawit.co.za/downloads/TransformationCharter.pdf [Downloaded:
08-06-2010].
SAinfo. 2010a. Ethical practice awards for SA wines. SAinfo, 08 January. [Online] Available
from: http://www.southafrica.info/business/economy/development/wine-080110.htm
[Accessed: 2010-06-30].
SAinfo. 2010b. SA wine industry driving jobs, GDP. SAinfo, 16 February. [Online] Available
from: http://www.southafrica.info/business/economy/wine-160210.htm [Accessed: 08-06-
2010].
SAinfo. 2010c. South African wines hit in the UK. SAinfo, 02 February. [Online] Available
from: http://www.southafrica.info/business/trade/export/ukwine-020210.htm [Accessed: 2010-
05-11].
Salkind, N.J. 2000. Exploring research. 4th edition. Cape Town: Prentice-Hall.
Salkind, N.J. 2009. Exploring research. 5th edition. Cape Town: Prentice-Hall.
SAWIS (South African Wine Industry Information and Systems). 2009a. South African wine
industry statistics. 09 December. Paarl: SAWIS.
SAWIS (South African Wine Industry Information and Systems). 2009b. Macro-economic
impact of the wine industry on the South African economy (also with reference to the impacts
on the Western Cape). 09 December. Pretoria, South Africa: Conningarth Economists.
[Online] Available: www.sawis.co.za/info/download/Macro_study_2009.pdf [Downloaded:
2010-06-30].
190
Scherotter, N. 2010. Chinese wineries to rival Australia and California. Cork’d, 26 July.
[Online] Available from: http://content.corkd.com/2010/07/26/chinese-wineries-to-rival-
australia-and-california/ [Accessed: 2010-08-25].
Seddighi, H.R., Nuttall, M.W. & Theocharous, A.L. 2001. Does cultural background of tourists
influence the destination choice? An empirical study with special reference to political
instability. Tourism Management, 22:181-191.
SeeNews. 2008. UBB: trends in the wine sector development. 13 February. [Online]
Available from: http://www.seenews.com/news/latestnews/ubb-
trendsinthewinesectordevelopment-feb2008-094608/ [Accessed: 2010-09-01].
Sharma, K.K. 2005. Tourism and development. New Delhi, India: Sarup.
Sheth, J.N. & Uslay, C. 2007. Implications of the revised definition of marketing: from
exchange to value creation. Journal of Public and Policy Marketing, 26(2):302–307.
Sleet, R. 2009. From ordinary to extraordinary: a route to a coordinated wine tourism
strategy. Paper presented at the South African Wine Tourism Conference, 22–23 July,
Vineyard Hotel and Spa, Cape Town.
Slinkard, S. n.d. Screw cap closures on the rise. About.com: Wine. [Online] Available from:
http://wine.about.com/od/storingwines/a/Screwcaps.htm [Accessed: 2010-08-05].
Smale, W. 2008. Wine prices go into the red. BBC News, 17 November. [Online] Available
from: http://news.bbc.co.uk/2/hi/business/7725589.stm [Accessed: 2008-12-12].
Small business dictionary. 2008. Trademark. [Online] Available from:
http://www.smbtn.com/smallbusinessdictionary/#t [Accessed: 12-06-2008].
Smith, P.R. & Taylor, J. 2004. Marketing communications: an integrated approach. 4th
edition. London, UK: Kogan Page.
Smith, S.L.J. & Xiao, H. 2008. Culinary tourism supply chains: a preliminary examination.
Journal of Travel Research, 46:289–299.
Snepenger, D., King, J., Marshall, E. & Uysal, M. 2006. Modeling Iso-Ahola’s motivation
theory in the tourism context. Journal of Travel Research, 45:140.
Solomon, M.R. & Stuart, E.W. 1997. Marketing: real people, real choices. Upper Saddle
River, NJ: Prentice-Hall.
191
Somogyi, S., Gyau, A., Li, E.L. & Bruwer, J. 2010. Enhancing long-term grape grower/winery
relationships in the Australian wine industry. International Journal of Wine Business
Research, 22(1).
South African Advertising and Research Foundation (SAARF). 2007. SAARF trends 2001–
2007. December. Johannesburg: South African Advertising Research Foundation.
South African History Online. n.d. Jan van Riebeeck biography. [Online] Available from:
http://www.sahistory.org.za/pages/people/bios/vanRiebeek,j.htm [Accessed: 2010-08-19].
South Africa Travel Net. 2009. South Africa’s currency and finance. [Online] Available from:
http://www.southafrica-travel.net/economy/e_rand.htm [Accessed: 2010-08-05].
South Africa Tourism. 2007. Gearing up to be globally competitive: tourism growth strategy
2008–2010. 3rd edition. [Online] Available from:
http://www.southafrica.net/satourism/research/research.cfm [Accessed: 2008-01-15].
South African Wine Industry Trust (SAWIT). n.d. About SAWIT. [Online] Available from:
http://www.sawit.co.za/ [Accessed: 2010-08-30].
South Australia Tourism. 2008. South Australia Wine Tourism Strategy, 2004–2008. [Online]
Available from: http://www.tourism.sa.gov.au/tourism/plan/Wine_Tourism_Strategy.pdf
[Downloaded: 2008-08-20].
South Australian Tourism Commission (SATC). 1997a. Wine and tourism: a background
research report. Adelaide: SATC.
South Australian Tourism Commission (SATC). 1997b. SATC corporate plan 1998–2003.
Adelaide: SATC.
Sparks, B. 2007. Planning a wine tourism vacation? Factors that help to predict tourist
behavioural intentions, Tourism Management 28(5):1180–1192.
Stellenbosch Wine Route. n.d.[a] Subroutes. [Online] Available from:
http://www.wineroute.co.za/subroutes.asp [Accessed: 2008-11-06].
Stellenbosch Wine Route. n.d.[b] Welcome. [Online] Available from:
http://www.wineroute.co.za/welcome.aspx [Accessed: 2008-12-06].
Stellenbosch Wine Route. n.d.[c] Wine route map. [Online] Available from:
http://www.wineroute.co.za/images/maps/map_stellenbosch.jpg [Accessed: 2008-11-06].
192
Stellenbosch Wine Route. 2008. Stellenbosch wine routes: still leading the way. 6 November.
[Online] Available from:
http://www.wine.co.za/news/news.aspx?NEWSID=12791&Source=Newsfeed [Accessed:
2008-11-06].
Stormhoek. 2008. Cork vs screwcap debate. 31 January. [Online] Available from:
http://www.stormhoek.com/blog/index.php/2008/01/31/cork-vs-screw-cap-debate/ [Accessed:
2010-08-05].
Strydom, J.W. 2004. Introduction to marketing. Cape Town, South Africa: Juta.
Strydom, J.W., Jooste, C.J. & Cant, M.C. 2000. Marketing management. 4th edition. Kenwyn:
Juta.
SurePure. 2010. New legislation opens up sustainable opportunities for winemakers.
Wine.co.za, 22 July. [Online] Available from:
http://www.wine.co.za/news/news.aspx?NEWSID=16063&Source=News [Accessed: 2010-
08-02].
Swanepoel, S. & Bailey, L. (eds.) 2008. Wine tourism handbook: South Africa’s ultimate
guide to the Cape winelands. Cape Town: The World’s Favourite Publications.
Tassiopoulos, D. & Haydam, N. 2006. Wine tourists in South Africa: a demand side study, in
Global wine tourism: research management and marketing, edited by J. Carlsen & S.
Charters. London, UK: CAB International.
Tassiopoulos, D., Nuntsu, N. & Haydam, N. 2003. Wine tourist in South Africa. Report for the
Tourism Department. Potsdam, South Africa: Border Technikon.
Tassiopoulos, D., Nuntsu, N. & Haydam, N. 2004. Wine tourism in South Africa: a
demographic and psychographic study. Journal of Wine Research, 15(1):51–64.
Telfer, D.J. 2001. Strategic alliances along the Niagara wine route. Tourism Management,
22:21-30.
Terrien, C. & Steichen, D. 2008. Accounting for social taste: application to the demand for
wine. International Journal of Wine Business Research, 20(3):260–275.
Thach, L. 2007. Trends in wine tourism. Wine Business Monthly, 15 August. [Online]
Available from: http://www.winebusiness.com/wbm/?go=getArticle&dataId=50125 [Accessed:
2010-08-16].

193
Thach, L. & Matz, T. (eds.) 2004. Wine: a global business. New York, NY: Miranda Press.
The New York Times. 2010. Iceland volcano eruption of 2010 (Eyhafjallajokull volcano). The
New York Times, 20 April. [Online] Available from:
http://topics.nytimes.com/top/news/international/countriesandterritories/iceland/eyjafjallajokull
/index.html [Accessed: 2010-08-05].
The Stables Wine Estate. n.d. KZN wine history. [Online] Available from:
http://www.stableswine.co.za/kznhistory.html [Accessed: 2010-08-30].
This is money. 2009. Downtrading: top brands to cheap brands. 7 May. Thisismoney.co.uk.
[Online] Available from: http://www.thisismoney.co.uk/30-second-
guides/article.html?in_article_id=484056&in_page_id=53611 [Accessed: 2010-06-30].
Thomas, R. 2009. Verbal communication with the author on 24 June. Cape Town. (Notes in
possession of author.) [Information manager: SAWIS.]
Thomas, S. 2010a. Down to a drop. Financial Mail, 24 June. [Online] Available from:
http://www.fm.co.za/Article.aspx?id=112787 [Accessed: 2010-07-06].
Thomas, S. 2010b. What SA’s wine industry contributes. Financial Mail, 24 June. [Online]
Available from: http://www.fm.co.za/Article.aspx?id=112789 [Accessed: 2010-07-06].
Thomas, S. 2010c. Lots to whine about. Financial Mail, 24 June. [Online] Available from:
http://www.fm.co.za/Article.aspx?id=112791 [Accessed: 2010-07-06].
Time for change. n.d. What is a carbon footprint: definition. [Online] Available from:
http://timeforchange.org/what-is-a-carbon-footprint-definition [Accessed: 2010-08-05].
Timeline Index. 2005. Vasco Da Gama, sails to India – 1498. [Online] Available from:
http://www.timelineindex.com/content/view/511 [Accessed 2010/04/18].
Toureagle. n.d. Francolin Creek. [Online] Available from:
http://www.toureagle.com/Activities/za/heilbron/vineyards [Accessed: 2010-08-30].
Tourism Grading Council of South Africa (TGCSA). n.d. The benefits of being star graded.
[Online] Available from:
http://www.tourismgrading.co.za/default.aspx?pid=41&stepid=1&oid=80 [Accessed: 2010-09-
30].
194
TrekkingChile. 2005. Discovering Chile and its wine and wineries. [Online] Available from:
http://www.trekkingchile.com/EN/wineries/index.php [Accessed: 2009-01-27].
Treloar, P., Hall, C.M. & Mitchell, R. 2004. Wine tourism and the generation Y market: any
possibilities? Refereed research paper. [Online] Available from:
http://eprints.otago.ac.nz/158/1/Treloar%20et%20al.%20CAUTHE%20full.pdf [Downloaded:
2009-01-07].
Tripadvisor. 2008. Chile overview. [Online] Available from: www.tripadvisor.com/Tourism-
g294291-Chile-Vacations.html [Accessed: 2008-11-06].
Tustin, D.H., Ligthelm, A.A., Martins, J.H. & Van Wyk, H.J. 2005. Marketing research in
practice. Pretoria, South Africa: Unisa Press.
UCT Unilever Institute of Strategic Marketing. 2007. Black diamond presentation. UCT
Unilever Institute of Strategic Marketing. [Online] Available from:
http://www.unileverinstitute.co.za/index.php?Itemid=34&id=72&option=com_content&task=vi
ew [Accessed: 2010-08-25].
United Bulgarian Bank. 2008. Trends in the wine sector development. Business analyses.
United Bulgarian Bank. [Online] Available from:
http://reports.aiidatapro.com/BBB/UBB/Wine_Sector_Development_Feb08.pdf [Downloaded:
2010-09-01].
Van Huyssteen, A. n.d. Making hay while the sun shines. Financial Mail. [Online] Available
from: http://secure.financialmail.co.za/topcomp/topagri.html [Accessed: 2010-05-04].
Van Wyk, M. 2010. Picking the fruits of our labour: equity-sharing schemes on wine farms in
South Africa. 14 July. Consultancy Africa Intelligence. [Online] Available from:
http://www.consultancyafrica.com/index.php?option=com_content&view=article&id=470:picki
ng-the-fruits-of-our-labour-equity-sharing-schemes-on-wine-farms-in-south-
africa&catid=90:optimistic-africa&Itemid=295 [Accessed: 2010-08-04].
Van Zyl, C. 2002. The participation of the host community in the Aardklop National Arts
Festival. M.Com dissertation, University of Pretoria, Pretoria.
Van Zyl, C. 2005. Optimum market-positioning models for South African arts festival
scenarios. D.Com thesis, University of South Africa, Pretoria.
195
Van Zyl, J. 2009. Groot Constantia: the great grandmother of wine production.
Winemagazine, 5 June. [Online] Available from: http://www.winemag.co.za/article/groot-
constantia-2009-06-05 [Accessed: 2010-06-30].
Velianova, E. 2008. A new wine industry emerges in Bulgaria. Meininger’s Wine Business
International, 28 February. [Online] Available from: http://www.wine-business-
international.com/156-bWVtb2lyX2lkPTI4NiZtZW51ZV9jYXRfaWQ9--en-magazine-
magazine_detail.html# [Accessed: 2010-08-25].
Veseth, M. 2008. Trading down: wine and recession. The Wine Economist, October, 25.
[Online] Available from: http://wineeconomist.com/2008/10/25/trading-down/ [Accessed:
2010-06-08].
Vinexpo. 2010. The world wine and spirits market with forecasts to 2013 from the Vinexpo/
The IWSR 2010 Study. Vinexpo Asia-Pacific, Hong Kong, 25–27 May. [Online] Available
from: http://www.vinexpo.com/dyn/press/synthese-monde-2010---anglais.pdf [Downloaded:
2010-07-08].
Vineyard Varieties. n.d. Wine beginnings. [Online] Available from:
http://www.vineyardvarieties.com/history.php#beginning [Accessed: 2008-07-17].
Vink, N., Williams, G. & Kirsten, J. 2004. South Africa, in The world’s wine markets:
globalization at work, edited by K. Anderson. Cheltenham, UK: Edward Elgar.
Vins d’Alsace. n.d. [Online] Available from: http://www.vinsalsace.com/en/#SlideFrame_1
[Accessed: 2010-10-01].
Von Ulmenstein, C. 2010. Blogging is "vanity publishing", food & wine bloggers told.
Wine.co.za, 03 August. [Online] Available from:
http://www.wine.co.za/News/news.aspx?NEWSID=16133&Source=News [Accessed: 2010-
08-03].
Vrontis, D. & Papasolomou, I. 2007. Brand and product building: the case of the Cyprus wine
industry. Journal of Product and Brand Management, 16(3):159–167.
Vukasovic, T. 2009. Searching for competitive advantage with the aid of the brand potential
index. Journal of Product and Brand Management, 18(3):165–176.

196
Walsh, G., Hennig-Thurau, T. & Mitchell, V. 2007. Consumer confusion proneness: scale
development, validation and application. Journal of Marketing Management 23 (7&8):697–
721.
Weaver, D. & Lawton, L. 2002. Tourism management. Milton, Australia: Wiley.
Weiers, R. M. 2008. Introduction to business statistics. 6th edition. Mason, Ohio: Thomson
Higher Education.
Welman, J.C., Kruger, S.J. & Mitchell, B.M. 2009. Research methodology. 3rd edition. Cape
Town, South Africa: Oxford University Press.
Willey, J. 2006. Italian wine provides a taste of ancient Rome. Amore Travel Guides. [Online]
Available from: http://www.amoretravelguides.com/blog/italian-wine-provides-a-taste-of-
ancient-rome.php [Accessed: 2009-01-06].
Williams, G. 2005. Black economic empowerment in the South African wine industry. Journal
of Agrarian Change, 5(4):476–504.
Williams, A. & Young, I. 1999. Wine tourists: white wine casks or bottled reds? Paper
presented at the Second Australian Wine Tourism Conference, August, Rutherglen,
Australia.
Wine Geeks. n.d. Wine regulations: old world countries. [Online] Available from:
http://winegeeks.com/resources/106 [Accessed: 2009-01-06].
Wine Institute. 2009a. Per capita wine consumption of countries. 23 July. [Online] Available
from: http://www.wineinstitute.org/files/PerCapitaWineConsumptionCountries.pdf
[Downloaded: 2010-06-25].
Wine Institute. 2009b. World wine consumption by volume. 23 July. [Online] Available from:
http://www.wineinstitute.org/files/WorldWine%20ConsumptionbyVolume.pdf [Downloaded:
2010-06-25].
Wine Institute. 2009c. World wine production by country. 23 July. [Online] Available from:
http://www.wineinstitute.org/files/WorldWine%20ConsumptionbyVolume.pdf [Downloaded:
2010-06-25].
Wine Intelligence. 2009 Awareness of Fair Trade wines continues to grow. Wine.co.za, 23
February. [Online] Available from:
197
http://www.wine.co.za/news/news.aspx?NEWSID=13278&Source=Newsfeed [Accessed:
2009-04-28].
WineNews Editorial Team. 2009. Western Cape: the proposed liquor bylaw. Wine.co.za, 11
February. [Online] Available from:
http://www.wine.co.za/news/news.aspx?NEWSID=13213&Source=Newsfeed [Accessed:
2009-04-29].
Winemakers Federation of Australia. 2002. Wine tourism strategic business plan 2002–2005.
Embrace the challenge. Winemakers Federation of Australia, November. [Online] Available
from: http://www.wfa.org.au/PDF/NWTS%20Strategic%20Plan.pdf [Downloaded: 2009-01-
06].
Winer, R.S. 2007. Marketing management. 3rd edition. Upper Saddle River, NJ: Prentice-Hall.
Wines of South Africa (WOSA). n.d.[a] Fairtrade. [Online] Available from:
http://www.wosa.co.za/sa/news_article.php?id=800 [Accessed: 31-11-2009].
Wines of South Africa (WOSA). n.d.[b] History. [Online] Available from:
http://www.wosa.co.za/sa/history_3centuries.php [Accessed: 2008-07-31].
Wines of South Africa (WOSA). n.d.[c] Labelling. [Online] Available from:
http://www.wosa.co.za/sa/origin_label.php [Accessed: 2009-09-04].
Wines of South Africa. (WOSA). n.d.[d] Unpacking fair-trade part 2. [Online] Available from:
http://www.wosa.co.za/sa/news_article.php?id=800 [Accessed: 2008-08-20].
Wines of South Africa (WOSA). n.d.[e] Wine routes. [Online] Available from:
http://www.wosa.co.za/sa/tourism_routes.php [Accessed: 2008-08-20].
Wines of South Africa (WOSA). 2007. Update on the South African wine industry. [Online]
Available from: http://www.wosa.co.za/download/WOSA%20Press%20release%20final.pdf
[Accessed: 2008-11-05].
WordNet. n.d. Frequency. Princeton Education. [Online] Available from:
http://wordnetweb.princeton.edu/perl/webwn?s=frequency [Accessed: 2010-04-03].
World Travel and Tourism Council. 2008. Progress and priorities 2007/2008. [Online]
Available from: http://www.wttc.travel/bin/pdf/temp/finpp_2007.html [Accessed: 2008-01-17].
198
World Tourism Organisation. 2007a. Promoting climate friendly travel. United Nations joint
press kit for Bali climate change conference. [Online] Available from:
http://www.un.org/climatechange/pdfs/bali/wto-bali07-14.pdf [Downloaded: 2007-12-17].
World Tourism Organisation. 2007b. World Tourism Barometer. [Online] Available from:
http://unwto.org/facts/eng/pdf/barometer/unwto_barom07_2_en.pdf [Downloaded: 2008-11-
11].
World Travel and Tourism Council (WTTC). 2002. South Africa: the impact of travel and
tourism on jobs and the economy. [Online] Available from:
http://www.wttc.org/eng/Tourism_News/Press_Releases/Press_Releases_2002/South_Afric
a_Tourism/ [Accessed: 2010-08-25].
Yuan, J., Cai, L.A., Morrison, A.M. & Linton, S. 2005. An analysis of wine festival attendees'
motivations: a synergy of wine, travel and special events? Journal of Vacation Marketing,
11(1):41.
Yuan, J. & Jang, S. 2008. The effects of quality and satisfaction on awareness and
behavioural intentions: exploring the role of a wine festival. Journal of Travel Research,
46:279. [Online] Available from: http://jtr.sagepub.com/cgi/content/abstract/46/3/279
[Accessed: 2010-07-09].
Yurdugül, H. 2008. Minimum sample size for Cronbach’s coefficient alpha: a Monte Carlo
study. H.U. Journal of Education, 35:397–405.
199
ANNEXURE A
Survey Population

200
SURVEY POPULATION
Alluvia Boutique Winery Guardian Peak Morgenster Wine Estate
Alto Hartenberg Estate Mostersdrift Noble Wines
Amani HaskellVineyards Mount Rozier
Amarava Wines Hazendal Mulderbosch
Annandale Wines Heron Ridge Muratie Wine Estate
Anwilka Hidden Valley Wines Neethlingshof
Asara Wine Estate Hoopenburg Wines Neil Ellis Wines
Audacia wines House of JC le Roux Nietvoorbij
Baarsma SA Idiom Wines Onderkloof
Bartinney Cellars Ingwe Oude Libertas
Beau Joubert Vineyards JJ Wines Overgaauw Wine Estate
Bein Wine Cellar JP Bredell Wines Post House
Bellevue Estate Jacobsdal Quoin Rock
Bergkelder Jordan Rainbows End Estate
Beyerskloof Kaapzicht Estate/Steytdal Remhoogte Wine Estate
Bilton Wines Kanonkop Estate Ridgemor Wines
Blaauwklippen Wine Estate Kanu Wines Romond Wines
Bonfoi Wine Estate Ken Forrester Wines Rust en Vrede Wine Estate
Boschkloof Wines Klawervlei Rustenberg
Bouwland Klein DasBosch Saxenburg Wine Farm
Camberley Klein Gustrouw Simonsig Family Vineyards
Cape Hutton Wines Kleine Zalze Wines Skilpadvlei
Clos Malverne Kleinood Somerbosch Wines
Clovelly Wines Knorhoek Wines Spier
Cordoba Winery Koelenhof Wine Cellar Stellenrust
Croydon Vineyards Koopmanskloof Wingerde Stellekaya
Dalla Cia Wines Laibach Vineyards Stellenbosch Hills
De Meye Wines Lanzerac Wines Stellendrift
De Toren L’Auberge du Paysan Stellenzicht
De Trafford Wines L’Avenir Wine Estate Sterhuis

201
ANNEXURE B
Profile of the South African Wine Tourist
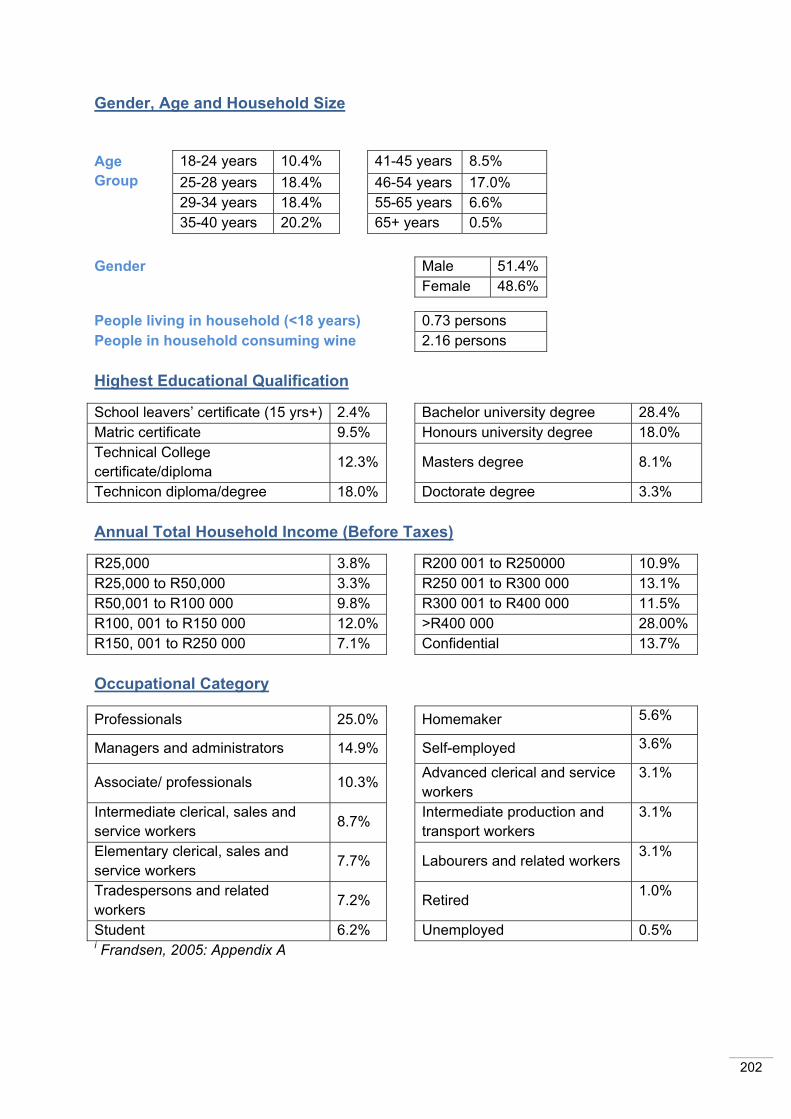
202
Gender, Age and Household Size
Age Group
18-24 years 10.4% 41-45 years 8.5% 25-28 years 18.4% 46-54 years 17.0%
29-34 years 18.4% 55-65 years 6.6% 35-40 years 20.2% 65+ years 0.5%
People living in household (<18 years) 0.73 persons People in household consuming wine 2.16 persons Highest Educational Qualification
School leavers’ certificate (15 yrs+) 2.4% Bachelor university degree 28.4% Matric certificate 9.5% Honours university degree 18.0% Technical College certificate/diploma 12.3% Masters degree 8.1%
Technicon diploma/degree 18.0% Doctorate degree 3.3% Annual Total Household Income (Before Taxes)
R25,000 3.8% R200 001 to R250000 10.9% R25,000 to R50,000 3.3% R250 001 to R300 000 13.1% R50,001 to R100 000 9.8% R300 001 to R400 000 11.5% R100, 001 to R150 000 12.0% >R400 000 28.00% R150, 001 to R250 000 7.1% Confidential 13.7% Occupational Category
Professionals 25.0% Homemaker 5.6%
Managers and administrators 14.9% Self-employed 3.6%
Associate/ professionals 10.3% Advanced clerical and service workers
3.1%
Intermediate clerical, sales and service workers 8.7% Intermediate production and
transport workers 3.1%
Elementary clerical, sales and service workers
7.7% Labourers and related workers 3.1%
Tradespersons and related workers 7.2% Retired
1.0%
Student 6.2% Unemployed 0.5% i Frandsen, 2005: Appendix A
Gender Male 51.4% Female 48.6%

203
ANNEXURE C
Cover Letter
Questionnaire
204
Dear ____________ I am currently gathering research data for my masters degree in marketing at Unisa. My research focuses on the role of wine tourism in promoting and branding wineries in South Africa. It will be greatly appreciated if you could complete an online survey for __________ which should not take more than 15 minutes of your time. Please click on the link and then complete and submit the survey. If you would like to receive a summary of the results, please click on the link to send an automatic response. The survey is completely anonymous and therefore I am unable to automatically send results to respondents. Kind regards, Adri Kirkman
Lecturer: Diploma in Tourism Management BCom Tourism Management
Department of Transport Economics, Logistics and Tourism
Tel: 012 429 2549 Email: [email protected]
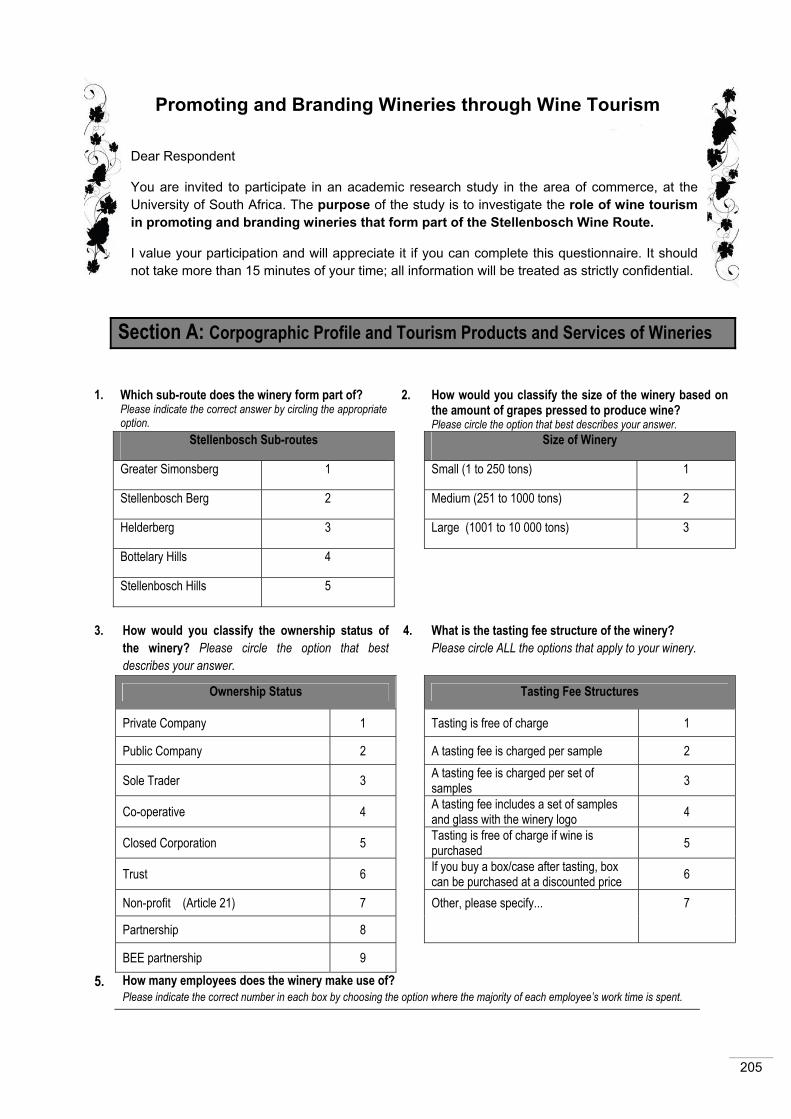
205
Promoting and Branding Wineries through Wine Tourism
5. How many employees does the winery make use of? Please indicate the correct number in each box by choosing the option where the majority of each employee’s work time is spent.
3. How would you classify the ownership status of the winery? Please circle the option that best describes your answer.
4. What is the tasting fee structure of the winery? Please circle ALL the options that apply to your winery.
Ownership Status Tasting Fee Structures
Private Company 1 Tasting is free of charge 1
Public Company 2 A tasting fee is charged per sample 2
Sole Trader 3 A tasting fee is charged per set of samples 3
Co-operative 4 A tasting fee includes a set of samples and glass with the winery logo 4
Closed Corporation 5 Tasting is free of charge if wine is purchased 5
Trust 6 If you buy a box/case after tasting, box can be purchased at a discounted price 6
Non-profit (Article 21) 7 Other, please specify... 7
Partnership 8
BEE partnership 9
Section A: Corpographic Profile and Tourism Products and Services of Wineries
1. Which sub-route does the winery form part of? Please indicate the correct answer by circling the appropriate option.
2. How would you classify the size of the winery based on the amount of grapes pressed to produce wine? Please circle the option that best describes your answer.
Stellenbosch Sub-routes Size of Winery
Greater Simonsberg 1 Small (1 to 250 tons) 1
Stellenbosch Berg 2 Medium (251 to 1000 tons) 2
Helderberg 3 Large (1001 to 10 000 tons) 3
Bottelary Hills 4
Stellenbosch Hills 5
Dear Respondent
You are invited to participate in an academic research study in the area of commerce, at the University of South Africa. The purpose of the study is to investigate the role of wine tourism in promoting and branding wineries that form part of the Stellenbosch Wine Route.
I value your participation and will appreciate it if you can complete this questionnaire. It should not take more than 15 minutes of your time; all information will be treated as strictly confidential.
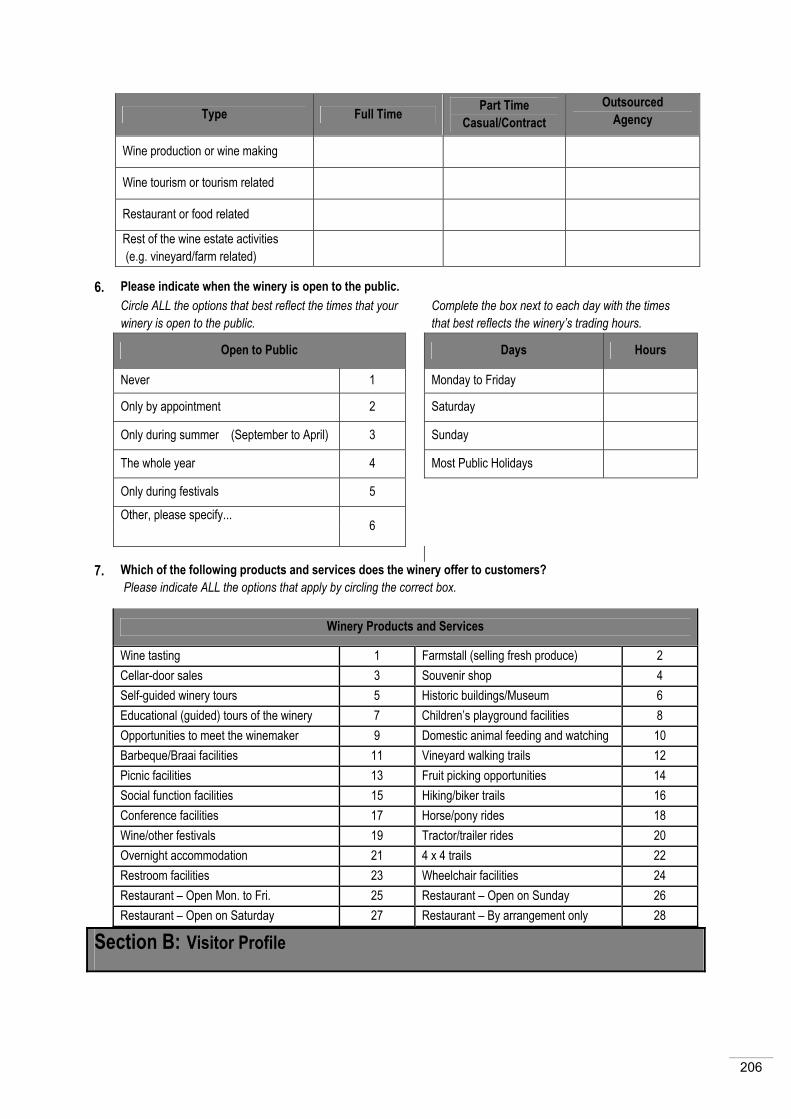
206
Type Full Time Part Time
Casual/Contract Outsourced
Agency
Wine production or wine making
Wine tourism or tourism related
Restaurant or food related
Rest of the wine estate activities (e.g. vineyard/farm related)
Section B: Visitor Profile
6. Please indicate when the winery is open to the public. Circle ALL the options that best reflect the times that your
winery is open to the public. Complete the box next to each day with the times
that best reflects the winery’s trading hours. Open to Public Days Hours
Never 1 Monday to Friday
Only by appointment 2 Saturday
Only during summer (September to April) 3 Sunday
The whole year 4 Most Public Holidays
Only during festivals 5
Other, please specify... 6
7. Which of the following products and services does the winery offer to customers?
Please indicate ALL the options that apply by circling the correct box.
Winery Products and Services
Wine tasting 1 Farmstall (selling fresh produce) 2 Cellar-door sales 3 Souvenir shop 4 Self-guided winery tours 5 Historic buildings/Museum 6 Educational (guided) tours of the winery 7 Children’s playground facilities 8 Opportunities to meet the winemaker 9 Domestic animal feeding and watching 10 Barbeque/Braai facilities 11 Vineyard walking trails 12 Picnic facilities 13 Fruit picking opportunities 14 Social function facilities 15 Hiking/biker trails 16 Conference facilities 17 Horse/pony rides 18 Wine/other festivals 19 Tractor/trailer rides 20 Overnight accommodation 21 4 x 4 trails 22 Restroom facilities 23 Wheelchair facilities 24 Restaurant – Open Mon. to Fri. 25 Restaurant – Open on Sunday 26 Restaurant – Open on Saturday 27 Restaurant – By arrangement only 28
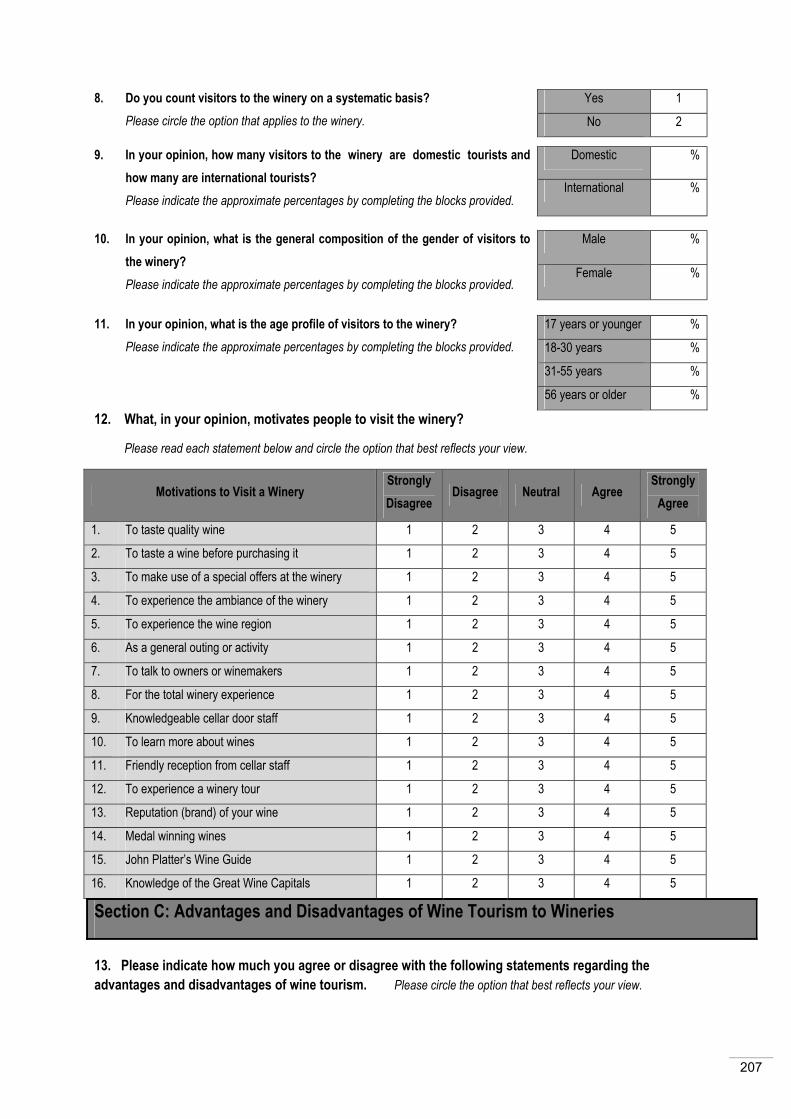
207
12. What, in your opinion, motivates people to visit the winery?
Please read each statement below and circle the option that best reflects your view.
Motivations to Visit a Winery Strongly Disagree
Disagree Neutral Agree Strongly
Agree
1. To taste quality wine 1 2 3 4 5
2. To taste a wine before purchasing it 1 2 3 4 5
3. To make use of a special offers at the winery 1 2 3 4 5
4. To experience the ambiance of the winery 1 2 3 4 5
5. To experience the wine region 1 2 3 4 5
6. As a general outing or activity 1 2 3 4 5
7. To talk to owners or winemakers 1 2 3 4 5
8. For the total winery experience 1 2 3 4 5
9. Knowledgeable cellar door staff 1 2 3 4 5
10. To learn more about wines 1 2 3 4 5
11. Friendly reception from cellar staff 1 2 3 4 5
12. To experience a winery tour 1 2 3 4 5
13. Reputation (brand) of your wine 1 2 3 4 5
14. Medal winning wines 1 2 3 4 5
15. John Platter’s Wine Guide 1 2 3 4 5
16. Knowledge of the Great Wine Capitals 1 2 3 4 5
Section C: Advantages and Disadvantages of Wine Tourism to Wineries
13. Please indicate how much you agree or disagree with the following statements regarding the advantages and disadvantages of wine tourism. Please circle the option that best reflects your view.
8. Do you count visitors to the winery on a systematic basis? Please circle the option that applies to the winery.
Yes 1
No 2
9. In your opinion, how many visitors to the winery are domestic tourists and how many are international tourists? Please indicate the approximate percentages by completing the blocks provided.
Domestic %
International %
10. In your opinion, what is the general composition of the gender of visitors to the winery? Please indicate the approximate percentages by completing the blocks provided.
Male %
Female %
11. In your opinion, what is the age profile of visitors to the winery? Please indicate the approximate percentages by completing the blocks provided.
17 years or younger %
18-30 years %
31-55 years %
56 years or older %
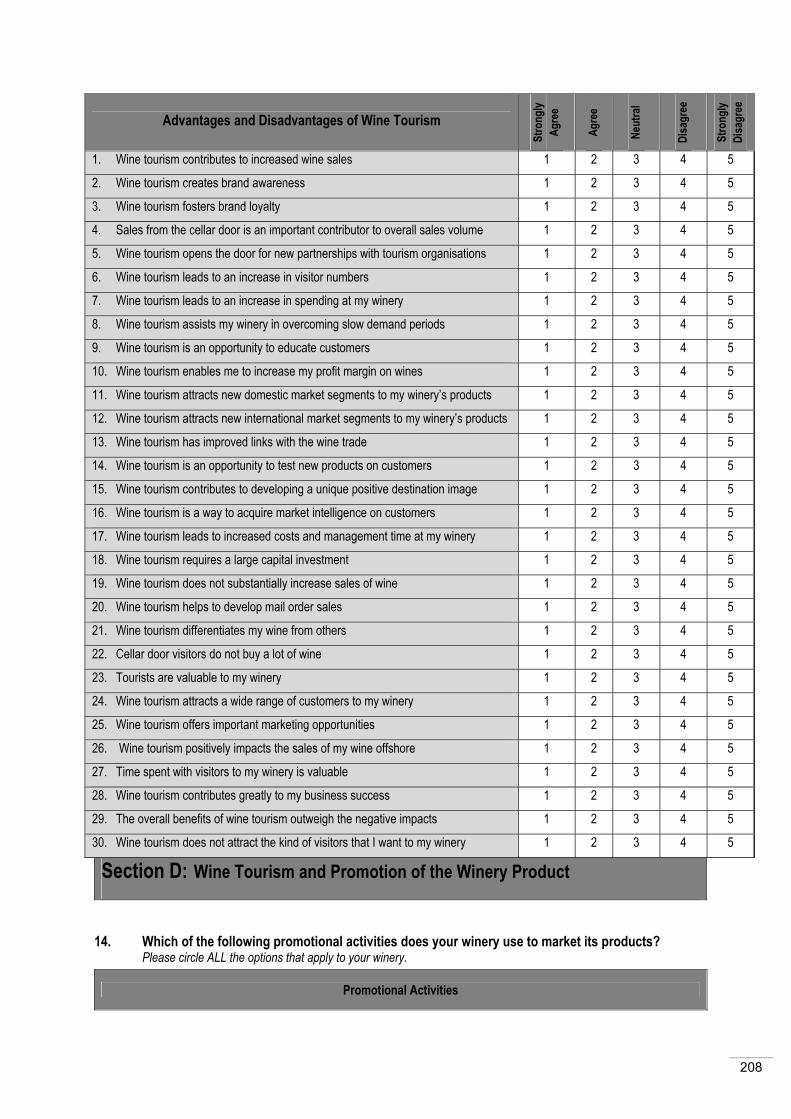
208
Advantages and Disadvantages of Wine Tourism
Stro
ngly
Agre
e
Agre
e
Neut
ral
Disa
gree
Stro
ngly
Disa
gree
1. Wine tourism contributes to increased wine sales 1 2 3 4 5
2. Wine tourism creates brand awareness 1 2 3 4 5
3. Wine tourism fosters brand loyalty 1 2 3 4 5
4. Sales from the cellar door is an important contributor to overall sales volume 1 2 3 4 5
5. Wine tourism opens the door for new partnerships with tourism organisations 1 2 3 4 5
6. Wine tourism leads to an increase in visitor numbers 1 2 3 4 5
7. Wine tourism leads to an increase in spending at my winery 1 2 3 4 5
8. Wine tourism assists my winery in overcoming slow demand periods 1 2 3 4 5
9. Wine tourism is an opportunity to educate customers 1 2 3 4 5
10. Wine tourism enables me to increase my profit margin on wines 1 2 3 4 5
11. Wine tourism attracts new domestic market segments to my winery’s products 1 2 3 4 5
12. Wine tourism attracts new international market segments to my winery’s products 1 2 3 4 5
13. Wine tourism has improved links with the wine trade 1 2 3 4 5
14. Wine tourism is an opportunity to test new products on customers 1 2 3 4 5
15. Wine tourism contributes to developing a unique positive destination image 1 2 3 4 5
16. Wine tourism is a way to acquire market intelligence on customers 1 2 3 4 5
17. Wine tourism leads to increased costs and management time at my winery 1 2 3 4 5
18. Wine tourism requires a large capital investment 1 2 3 4 5
19. Wine tourism does not substantially increase sales of wine 1 2 3 4 5
20. Wine tourism helps to develop mail order sales 1 2 3 4 5
21. Wine tourism differentiates my wine from others 1 2 3 4 5
22. Cellar door visitors do not buy a lot of wine 1 2 3 4 5
23. Tourists are valuable to my winery 1 2 3 4 5
24. Wine tourism attracts a wide range of customers to my winery 1 2 3 4 5
25. Wine tourism offers important marketing opportunities 1 2 3 4 5
26. Wine tourism positively impacts the sales of my wine offshore 1 2 3 4 5
27. Time spent with visitors to my winery is valuable 1 2 3 4 5
28. Wine tourism contributes greatly to my business success 1 2 3 4 5
29. The overall benefits of wine tourism outweigh the negative impacts 1 2 3 4 5
30. Wine tourism does not attract the kind of visitors that I want to my winery 1 2 3 4 5
Section D: Wine Tourism and Promotion of the Winery Product
14. Which of the following promotional activities does your winery use to market its products? Please circle ALL the options that apply to your winery.
Promotional Activities

209
Wine tasting rooms 1 Direct mail-order list 16 Organised wine tastings 2 Newsletters 17 Attending wine festivals 3 Wine club membership 18 Attending wine trade shows 4 Special offers/discounts 19
Sponsoring or hosting music festivals 5 Wine sales representatives 20
Sports promotions 6 Advertising by sales agents 21
Wine route promotional activities 7 Wine magazine adverts 22
Advertising by bottling corporations 8 Other magazine adverts 23
Airlines 9 Newspaper adverts 24
Hotels and other accommodation 10 Regional radio adverts 25
Restaurants 11 Television adverts 26
Internet shops (e-commerce) 12 Word-of-mouth advertising 27
Newspaper/Magazine editorials 13 Hosting wine and food journalists 28
Own internet site 14 Other, please specify... 29
Other internet sites 15 15. Please rate the importance of the following elements with regards to selling the winery’s wine.
Please circle the options that apply to your winery.
16. How important do you think each of the following factors are in developing and marketing a successful winery? Please indicate the option that best reflects your opinion by circling the appropriate number.
Developing and Marketing a Successful Winery
Irrele
vant
Unim
porta
nt
Neut
ral
Impo
rtant
Very
Im
porta
nt
Having a restaurant or café 1 2 3 4 5
Type of Sale Irrelevant Unimportant Neutral Important Very Important 1. Cellar door sales 1 2 3 4 5
2. Wholesale 1 2 3 4 5
3. Retail 1 2 3 4 5
4. Exporting 1 2 3 4 5
5. Own restaurant 1 2 3 4 5
6. Other restaurants 1 2 3 4 5
7. Mail order 1 2 3 4 5
8. Hotels and other accommodation establishments
1 2 3 4 5
9. Embassies 1 2 3 4 5
10. Wine clubs 1 2 3 4 5
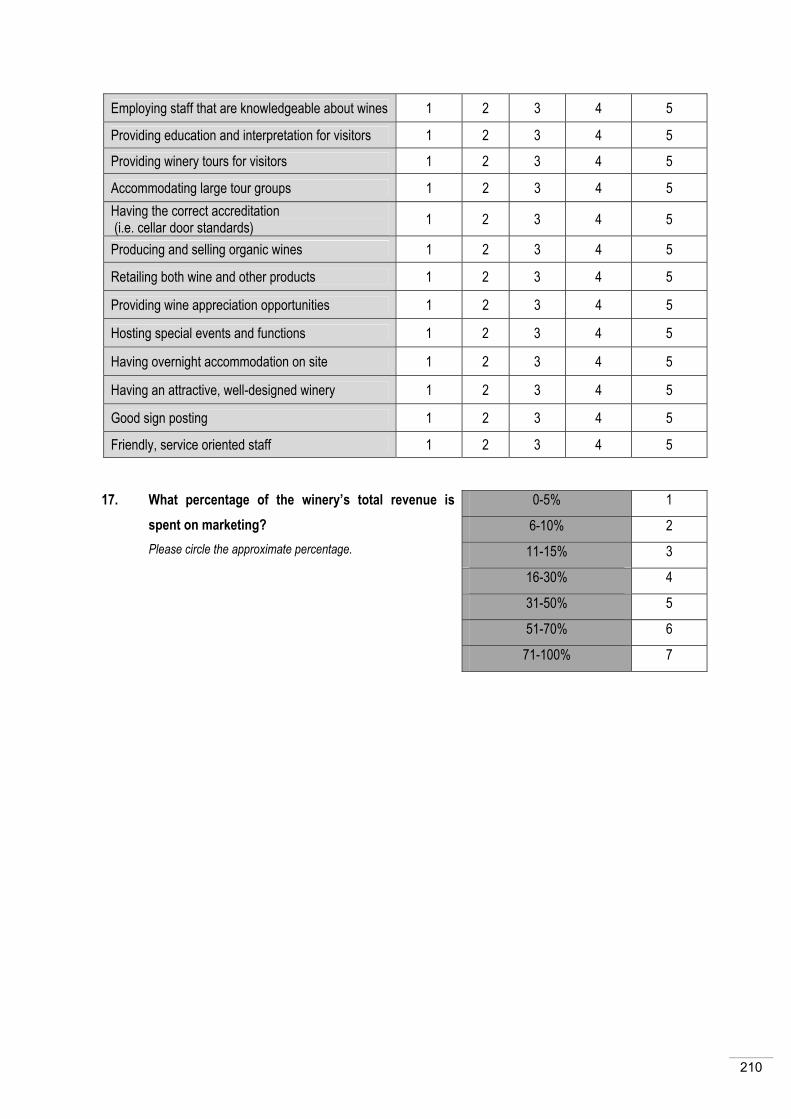
210
Employing staff that are knowledgeable about wines 1 2 3 4 5
Providing education and interpretation for visitors 1 2 3 4 5
Providing winery tours for visitors 1 2 3 4 5
Accommodating large tour groups 1 2 3 4 5 Having the correct accreditation (i.e. cellar door standards) 1 2 3 4 5
Producing and selling organic wines 1 2 3 4 5
Retailing both wine and other products 1 2 3 4 5
Providing wine appreciation opportunities 1 2 3 4 5
Hosting special events and functions 1 2 3 4 5
Having overnight accommodation on site 1 2 3 4 5
Having an attractive, well-designed winery 1 2 3 4 5
Good sign posting 1 2 3 4 5
Friendly, service oriented staff 1 2 3 4 5
17. What percentage of the winery’s total revenue is spent on marketing? Please circle the approximate percentage.
0-5% 1
6-10% 2
11-15% 3
16-30% 4
31-50% 5
51-70% 6
71-100% 7
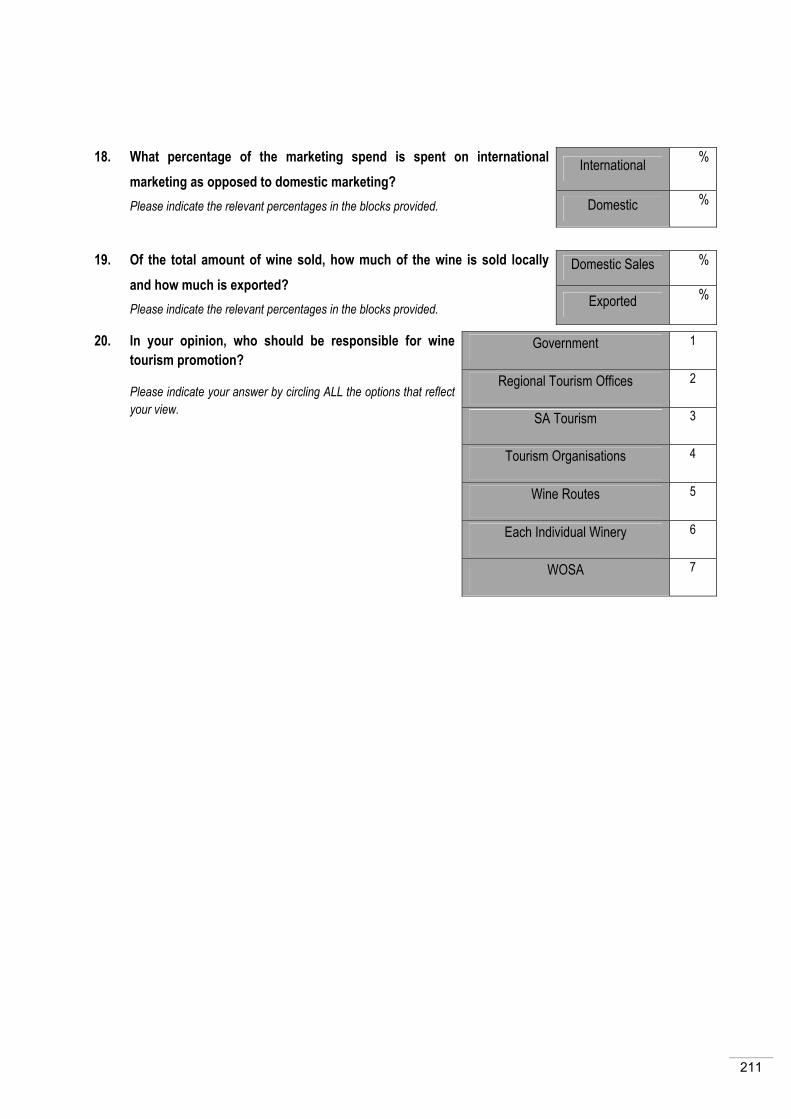
211
18. What percentage of the marketing spend is spent on international marketing as opposed to domestic marketing? Please indicate the relevant percentages in the blocks provided.
International %
Domestic %
19. Of the total amount of wine sold, how much of the wine is sold locally and how much is exported? Please indicate the relevant percentages in the blocks provided.
Domestic Sales %
Exported %
20. In your opinion, who should be responsible for wine tourism promotion?
Please indicate your answer by circling ALL the options that reflect your view.
Government 1
Regional Tourism Offices 2
SA Tourism 3
Tourism Organisations 4
Wine Routes 5
Each Individual Winery 6
WOSA 7

212
SECTION E: Wine Tourism and Brand Equity
21. Please indicate how much you agree or disagree with the following statements by circling the relevant option.
Brand Equity
Stro
ngly
Disa
gree
Disa
gree
Neut
ral
Agre
e
Stro
ngly
Agre
e
1. I can increase loyalty to my wine by exhibiting at a wine festival 1 2 3 4 5
2. I can increase perceived quality of my wine by having an upmarket tasting room
1 2 3 4 5
3. Consumers will make positive brand associations with my wine if I host a wine festival
1 2 3 4 5
4. Sponsoring a music event helps create awareness of my brand 1 2 3 4 5
5. Hosting a book club in my wine cellar helps create a positive association with my brand
1 2 3 4 5
6. Being graded by the Wine Route Association increases the perceived quality of my wine
1 2 3 4 5
A souvenir shop with several branded souvenirs (eg caps, hats, T-shirts) increases brand awareness of my winery
1 2 3 4 5
7. Winery tasting fosters brand loyalty for my winery 1 2 3 4 5
8. Celebrity endorsements increases the perceived quality of my wine
1 2 3 4 5
9. Wine festivals increases positive brand associations with my wine
1 2 3 4
10. Cinema and photography festivals increases positive brand associations with my wine
1 2 3 4 5
11. Festivals help create brand awareness of my winery 1 2 3 4 5
Thank you very much for your participation.
The results of the study will be used for academic purposes only and may be published in an academic journal. I will provide you with a summary of findings on request.

213
ANNEXURE D
Statistical Tables and Graphs
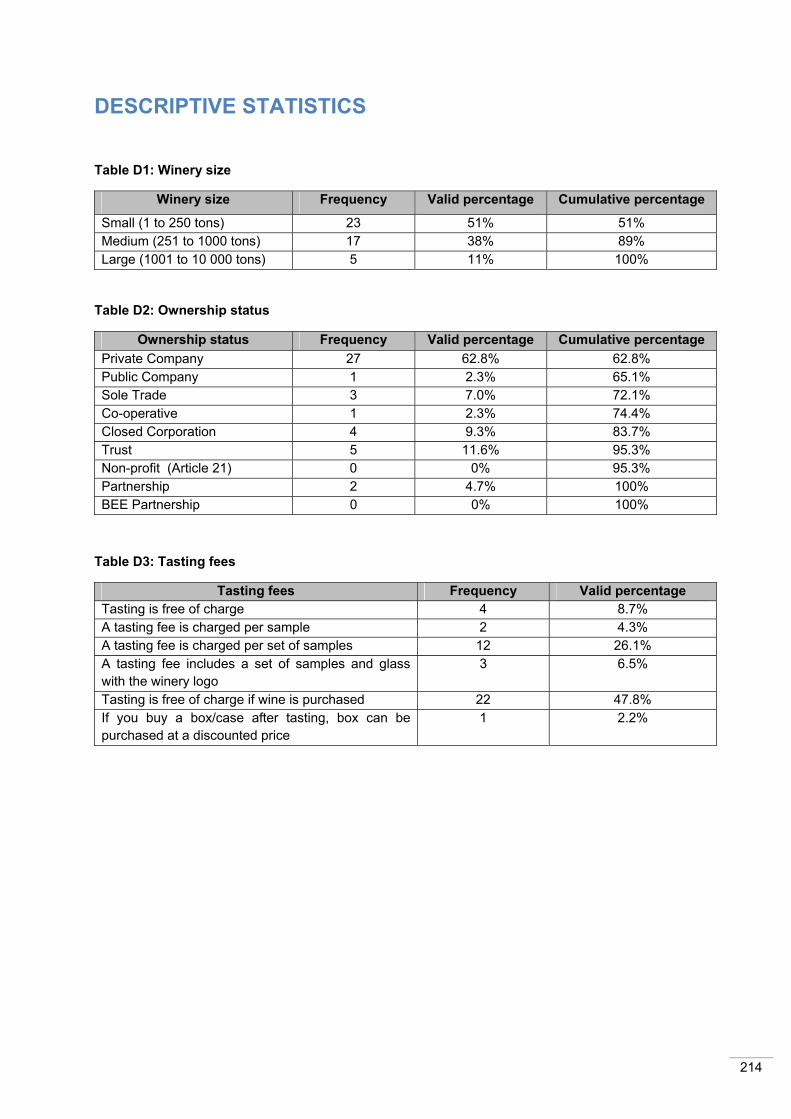
214
DESCRIPTIVE STATISTICS
Table D1: Winery size
Winery size Frequency Valid percentage Cumulative percentage
Small (1 to 250 tons) 23 51% 51% Medium (251 to 1000 tons) 17 38% 89% Large (1001 to 10 000 tons) 5 11% 100%
Table D2: Ownership status
Ownership status Frequency Valid percentage Cumulative percentage Private Company 27 62.8% 62.8% Public Company 1 2.3% 65.1% Sole Trade 3 7.0% 72.1% Co-operative 1 2.3% 74.4% Closed Corporation 4 9.3% 83.7% Trust 5 11.6% 95.3% Non-profit (Article 21) 0 0% 95.3% Partnership 2 4.7% 100% BEE Partnership 0 0% 100%
Table D3: Tasting fees
Tasting fees Frequency Valid percentage Tasting is free of charge 4 8.7% A tasting fee is charged per sample 2 4.3% A tasting fee is charged per set of samples 12 26.1% A tasting fee includes a set of samples and glass with the winery logo
3 6.5%
Tasting is free of charge if wine is purchased 22 47.8% If you buy a box/case after tasting, box can be purchased at a discounted price
1 2.2%
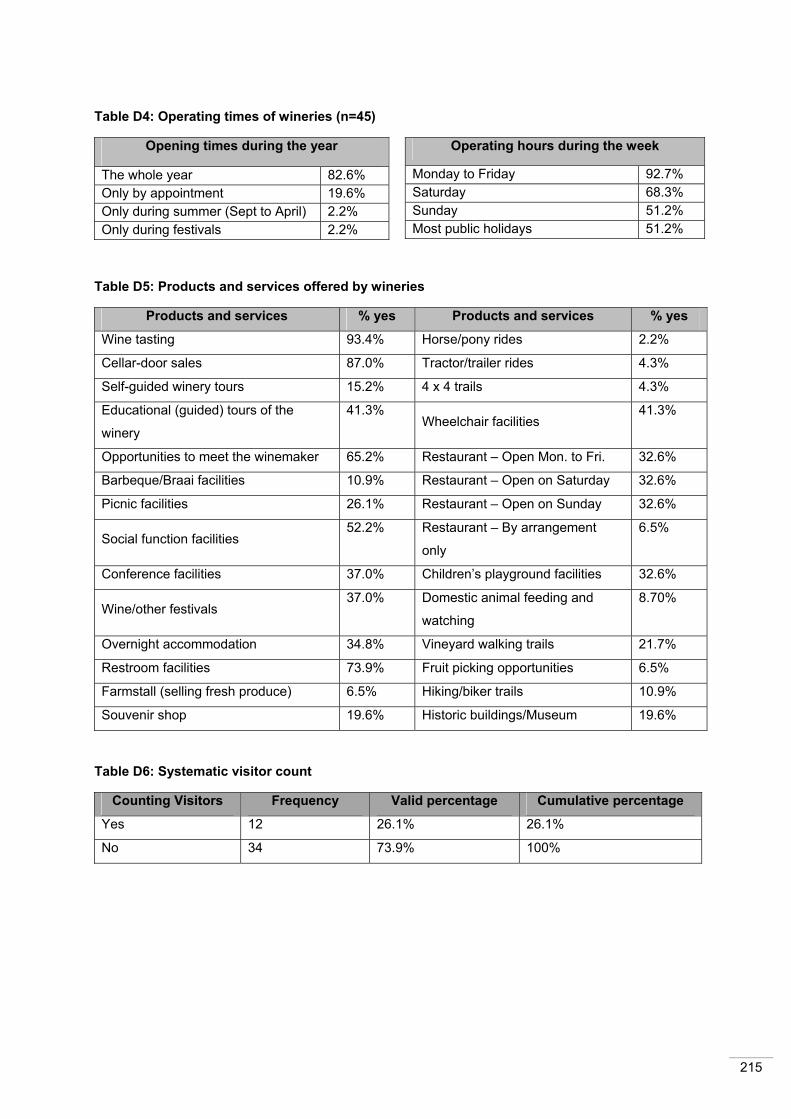
215
Table D4: Operating times of wineries (n=45)
Opening times during the year
The whole year 82.6% Only by appointment 19.6% Only during summer (Sept to April) 2.2% Only during festivals 2.2%
Table D5: Products and services offered by wineries
Products and services % yes Products and services % yes
Wine tasting 93.4% Horse/pony rides 2.2%
Cellar-door sales 87.0% Tractor/trailer rides 4.3%
Self-guided winery tours 15.2% 4 x 4 trails 4.3%
Educational (guided) tours of the
winery
41.3% Wheelchair facilities
41.3%
Opportunities to meet the winemaker 65.2% Restaurant – Open Mon. to Fri. 32.6%
Barbeque/Braai facilities 10.9% Restaurant – Open on Saturday 32.6%
Picnic facilities 26.1% Restaurant – Open on Sunday 32.6%
Social function facilities 52.2% Restaurant – By arrangement
only
6.5%
Conference facilities 37.0% Children’s playground facilities 32.6%
Wine/other festivals 37.0% Domestic animal feeding and
watching
8.70%
Overnight accommodation 34.8% Vineyard walking trails 21.7%
Restroom facilities 73.9% Fruit picking opportunities 6.5%
Farmstall (selling fresh produce) 6.5% Hiking/biker trails 10.9%
Souvenir shop 19.6% Historic buildings/Museum 19.6%
Table D6: Systematic visitor count
Counting Visitors Frequency Valid percentage Cumulative percentage
Yes 12 26.1% 26.1%
No 34 73.9% 100%
Operating hours during the week
Monday to Friday 92.7% Saturday 68.3% Sunday 51.2% Most public holidays 51.2%
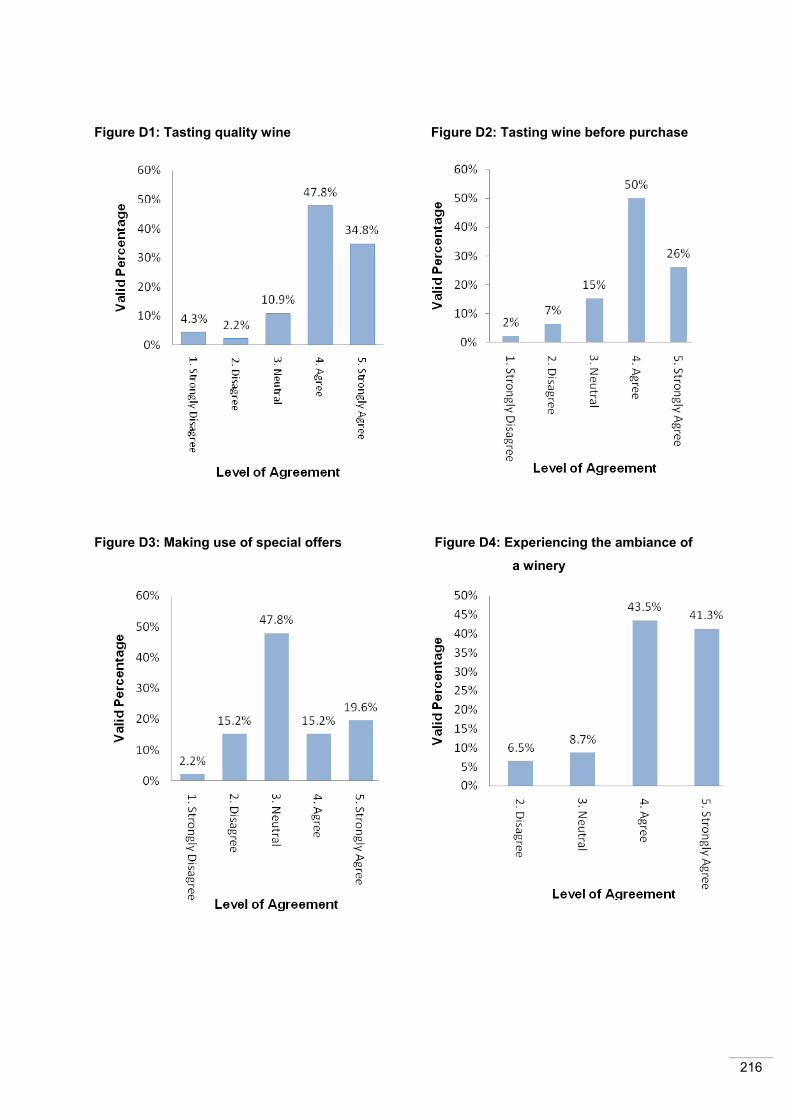
216
Figure D1: Tasting quality wine
Figure D2: Tasting wine before purchase
Figure D3: Making use of special offers Figure D4: Experiencing the ambiance of
a winery
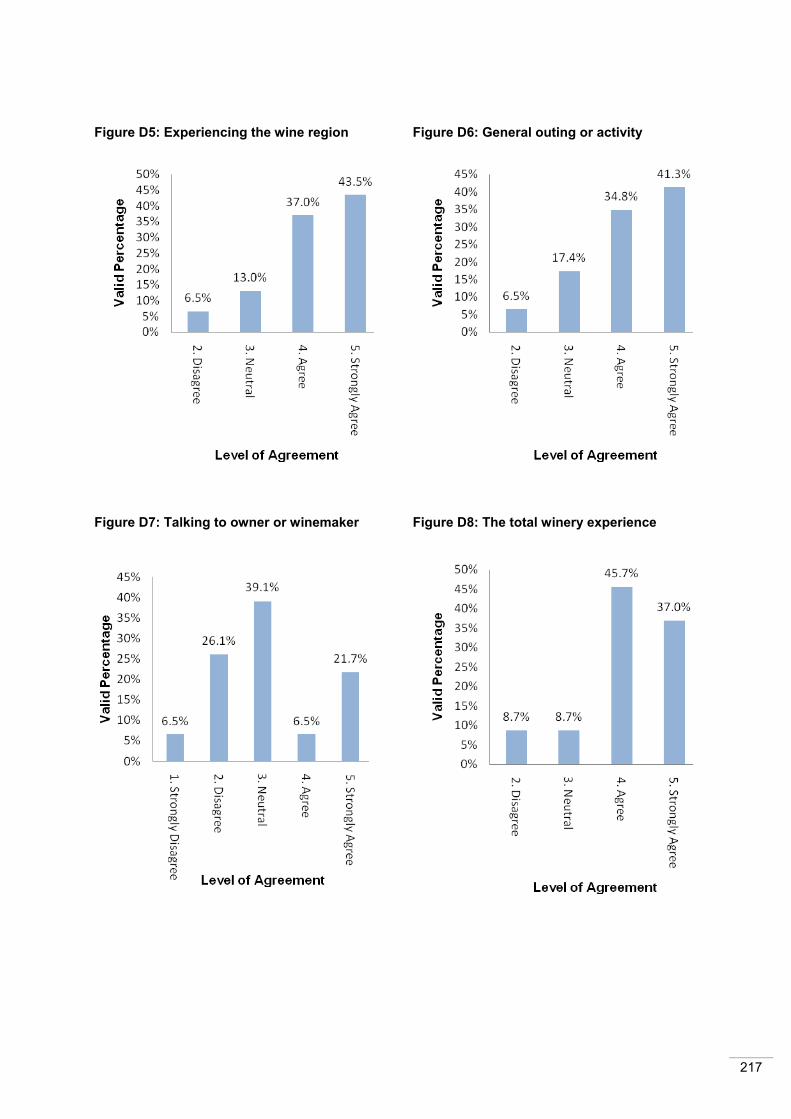
217
Figure D5: Experiencing the wine region Figure D6: General outing or activity
Figure D7: Talking to owner or winemaker Figure D8: The total winery experience

218
Figure D9: Knowledgeable cellar door staff Figure 10: Wine education
Figure D11: Friendly reception from cellar staff
Figure D12: Winery tours
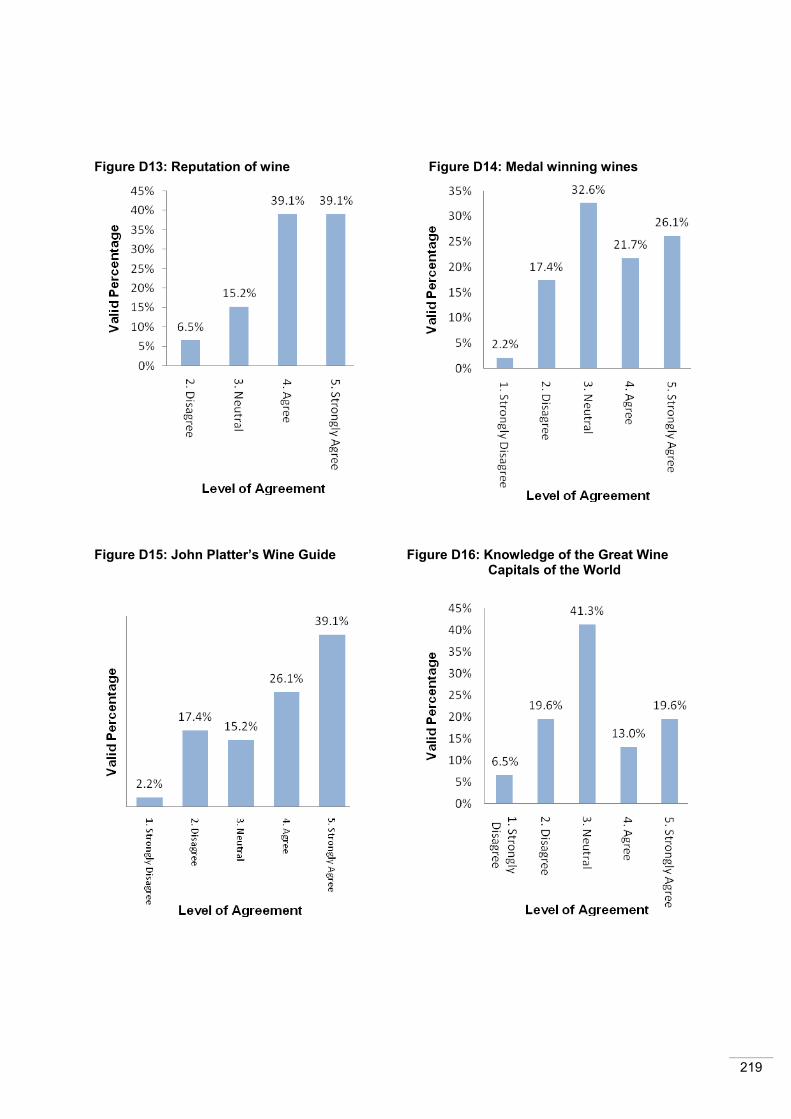
219
Figure D13: Reputation of wine Figure D14: Medal winning wines
Figure D15: John Platter’s Wine Guide Figure D16: Knowledge of the Great Wine Capitals of the World
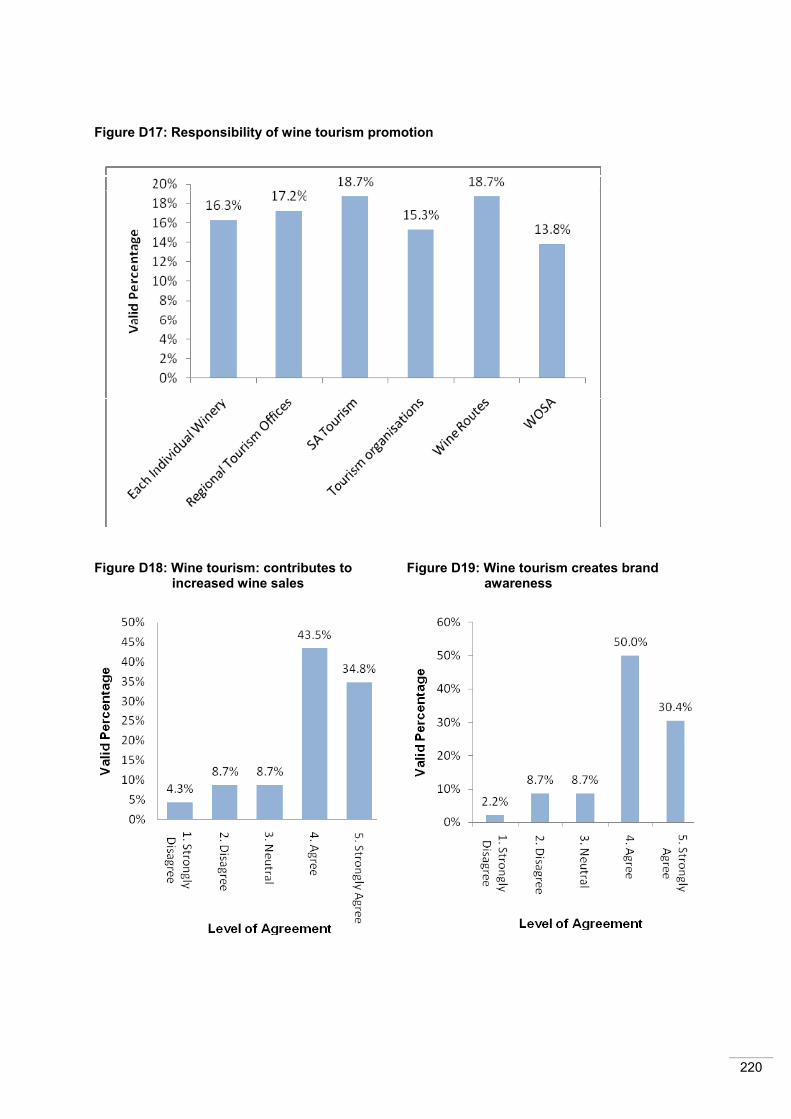
220
Figure D17: Responsibility of wine tourism promotion
Figure D18: Wine tourism: contributes to increased wine sales
Figure D19: Wine tourism creates brand awareness
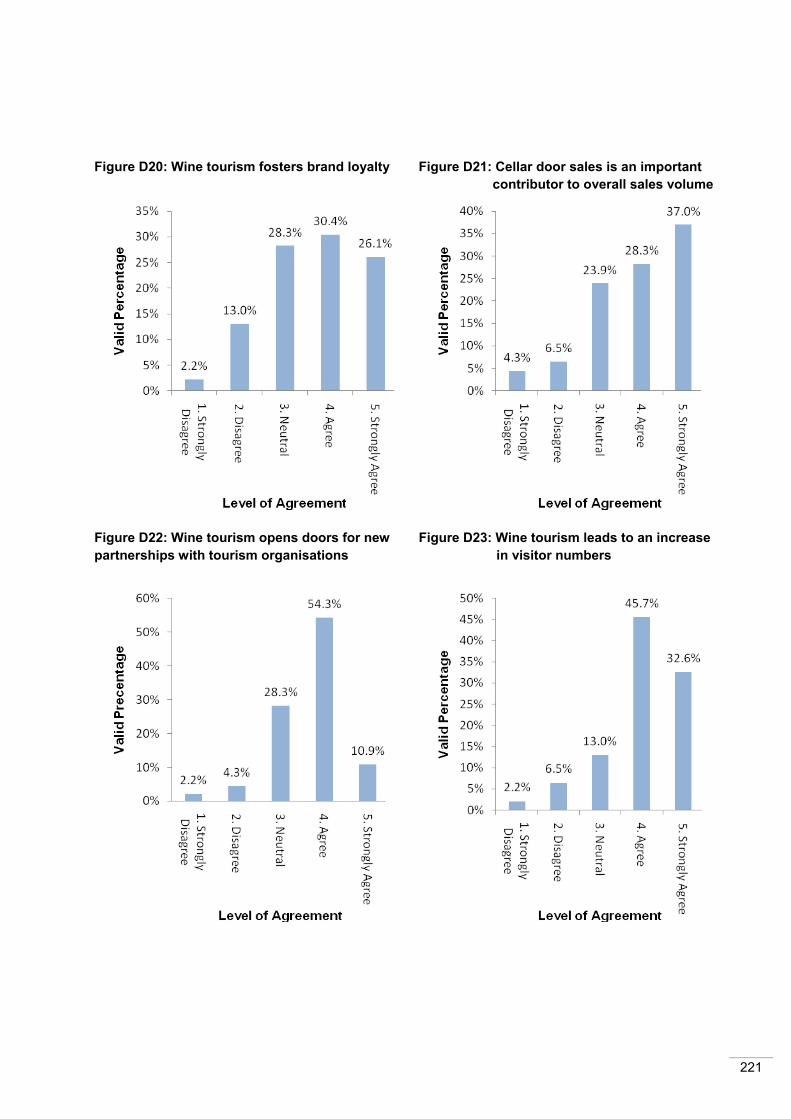
221
Figure D20: Wine tourism fosters brand loyalty Figure D21: Cellar door sales is an important contributor to overall sales volume
Figure D22: Wine tourism opens doors for new partnerships with tourism organisations
Figure D23: Wine tourism leads to an increase in visitor numbers
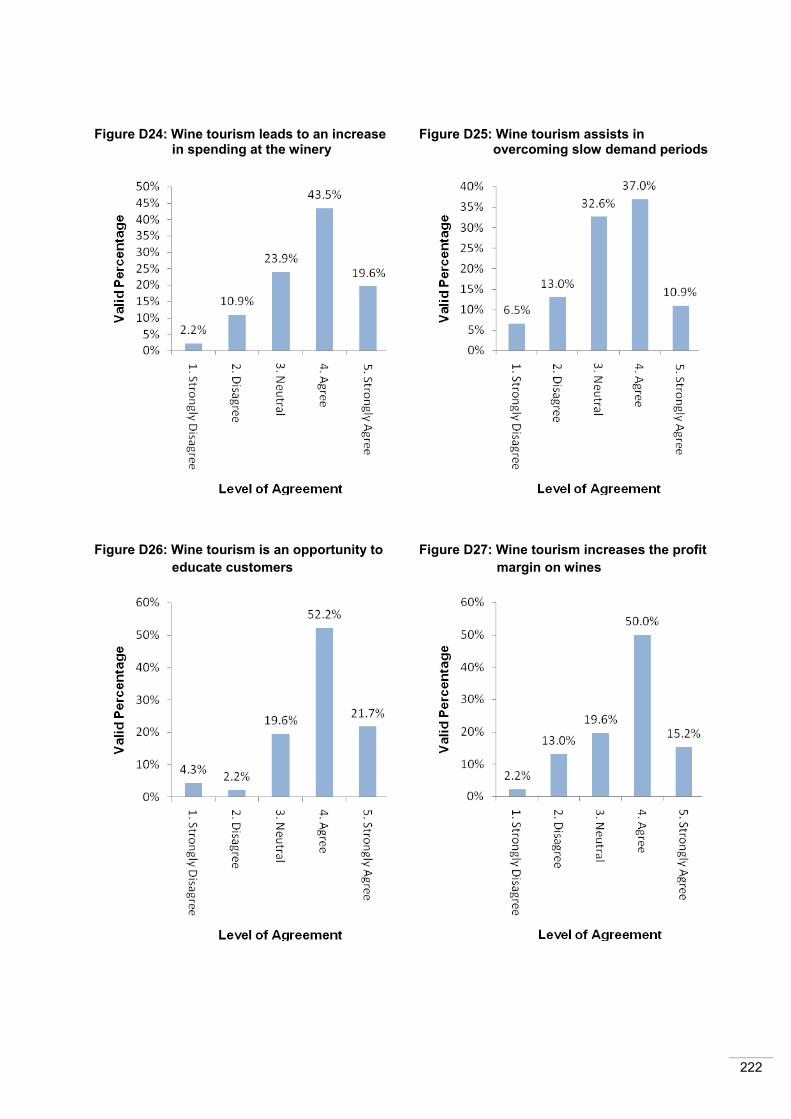
222
Figure D24: Wine tourism leads to an increase in spending at the winery
Figure D25: Wine tourism assists in overcoming slow demand periods
Figure D26: Wine tourism is an opportunity to educate customers
Figure D27: Wine tourism increases the profit margin on wines
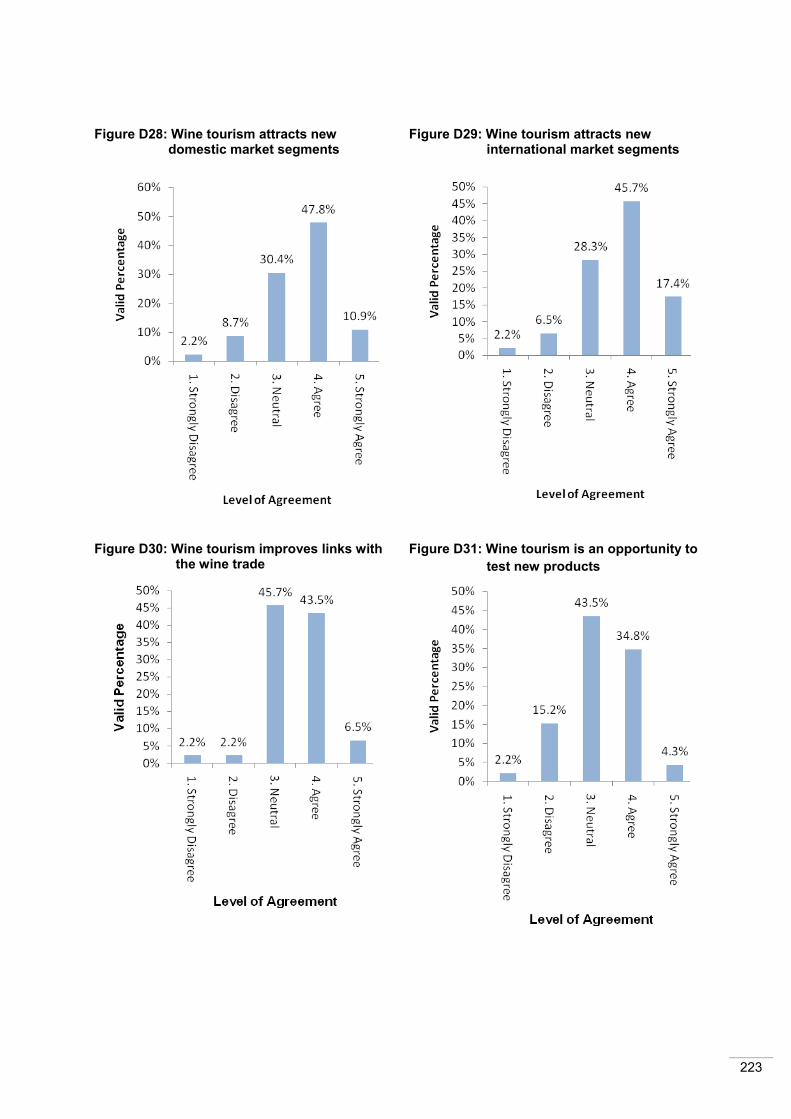
223
Figure D28: Wine tourism attracts new domestic market segments
Figure D29: Wine tourism attracts new international market segments
Figure D30: Wine tourism improves links with the wine trade
Figure D31: Wine tourism is an opportunity to test new products
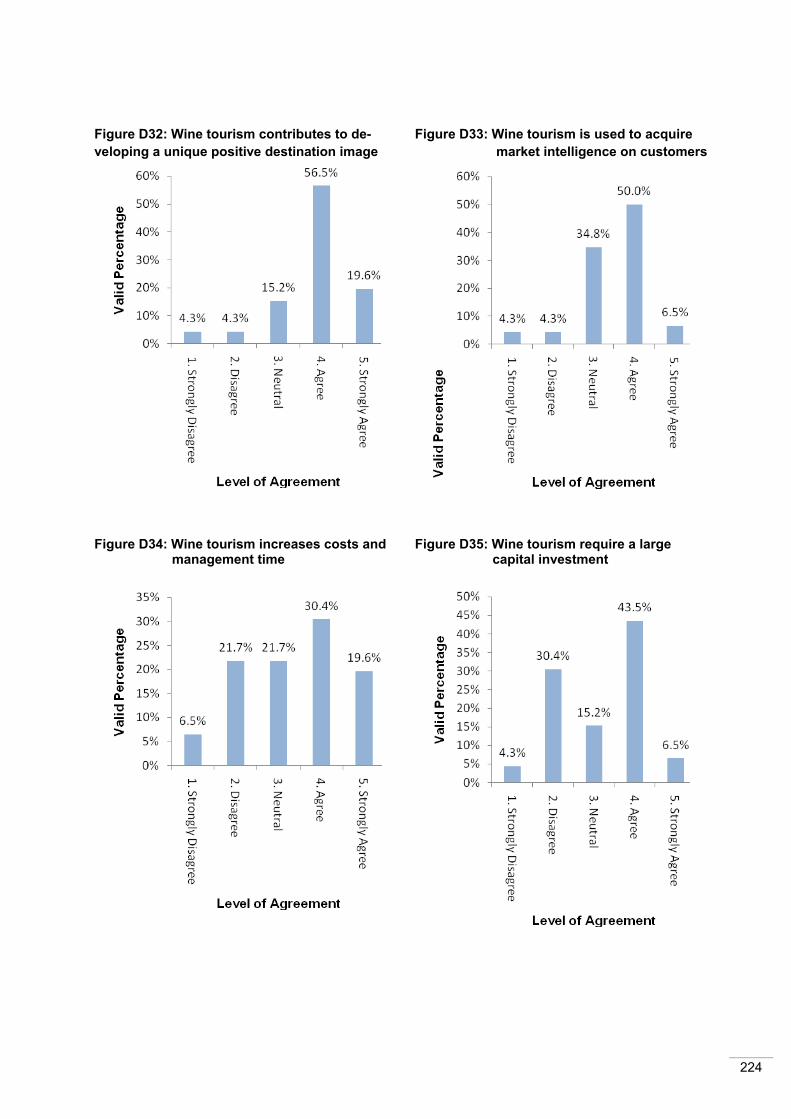
224
Figure D32: Wine tourism contributes to de- veloping a unique positive destination image
Figure D33: Wine tourism is used to acquire market intelligence on customers
Figure D34: Wine tourism increases costs and management time
Figure D35: Wine tourism require a large capital investment
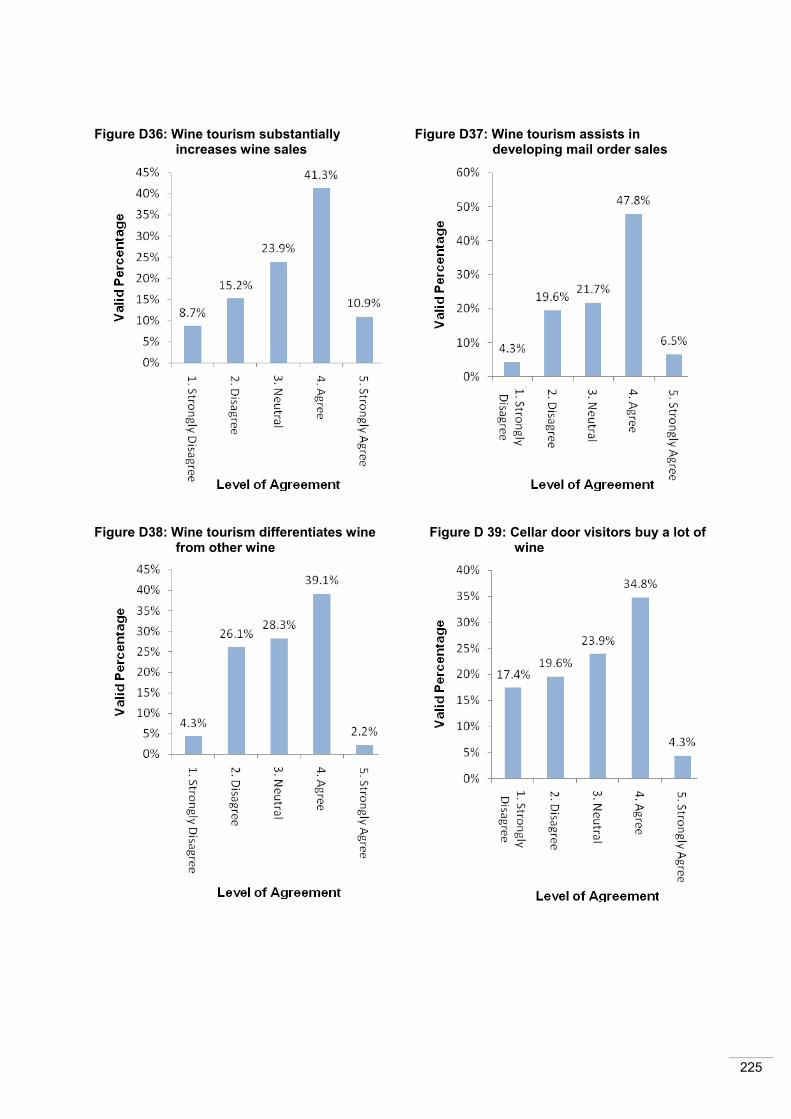
225
Figure D36: Wine tourism substantially increases wine sales
Figure D37: Wine tourism assists in developing mail order sales
Figure D38: Wine tourism differentiates wine from other wine
Figure D 39: Cellar door visitors buy a lot of wine
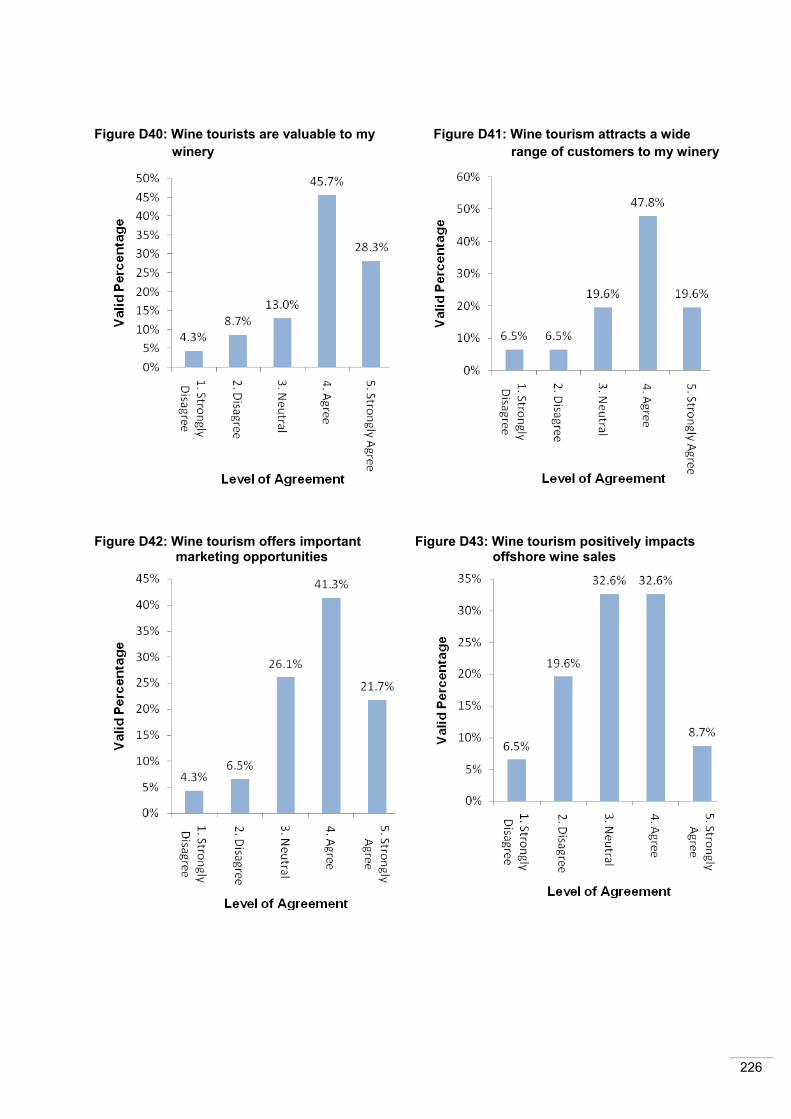
226
Figure D40: Wine tourists are valuable to my winery
Figure D41: Wine tourism attracts a wide range of customers to my winery
Figure D42: Wine tourism offers important marketing opportunities
Figure D43: Wine tourism positively impacts offshore wine sales

227
Figure D44: Time spent with visitors is valuable
Figure D45: wine tourism contributes greatly to wine business success
Figure D46: Wine tourism benefits outweigh the negative impacts
Figure D47: Wine tourism attracts the kind of visitors that is wanted to the winery
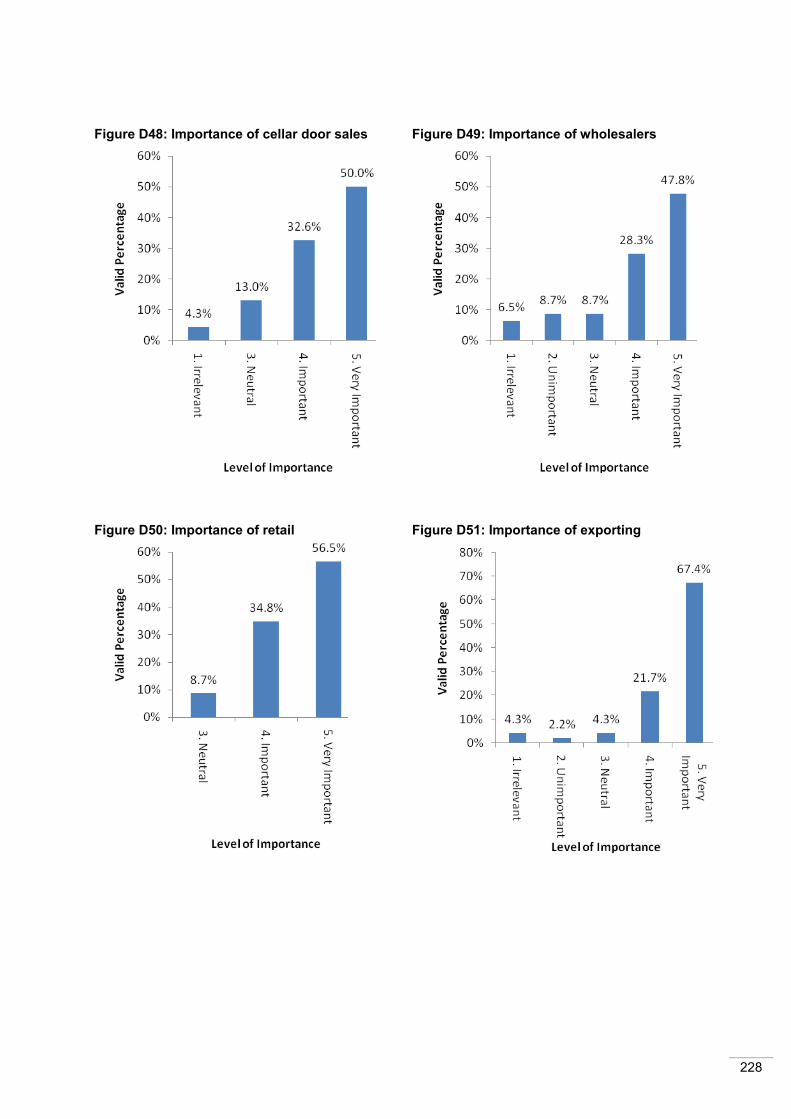
228
Figure D48: Importance of cellar door sales Figure D49: Importance of wholesalers
Figure D50: Importance of retail
Figure D51: Importance of exporting
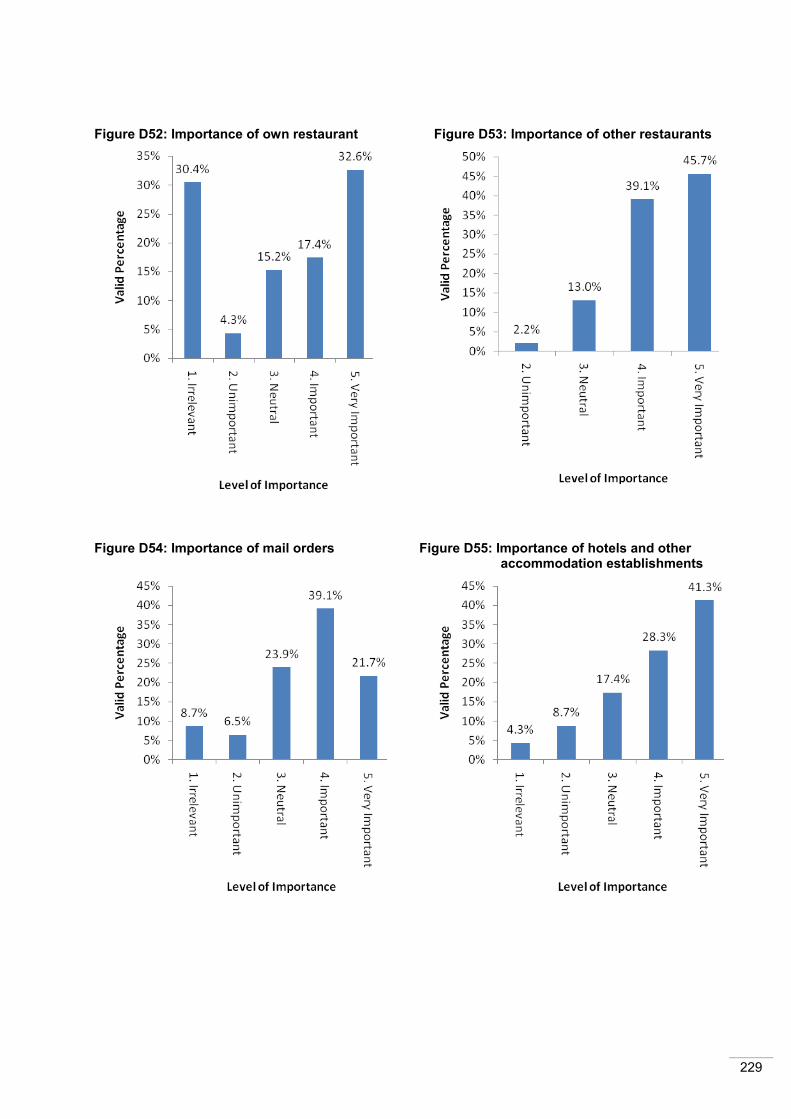
229
Figure D52: Importance of own restaurant Figure D53: Importance of other restaurants
Figure D54: Importance of mail orders
Figure D55: Importance of hotels and other accommodation establishments
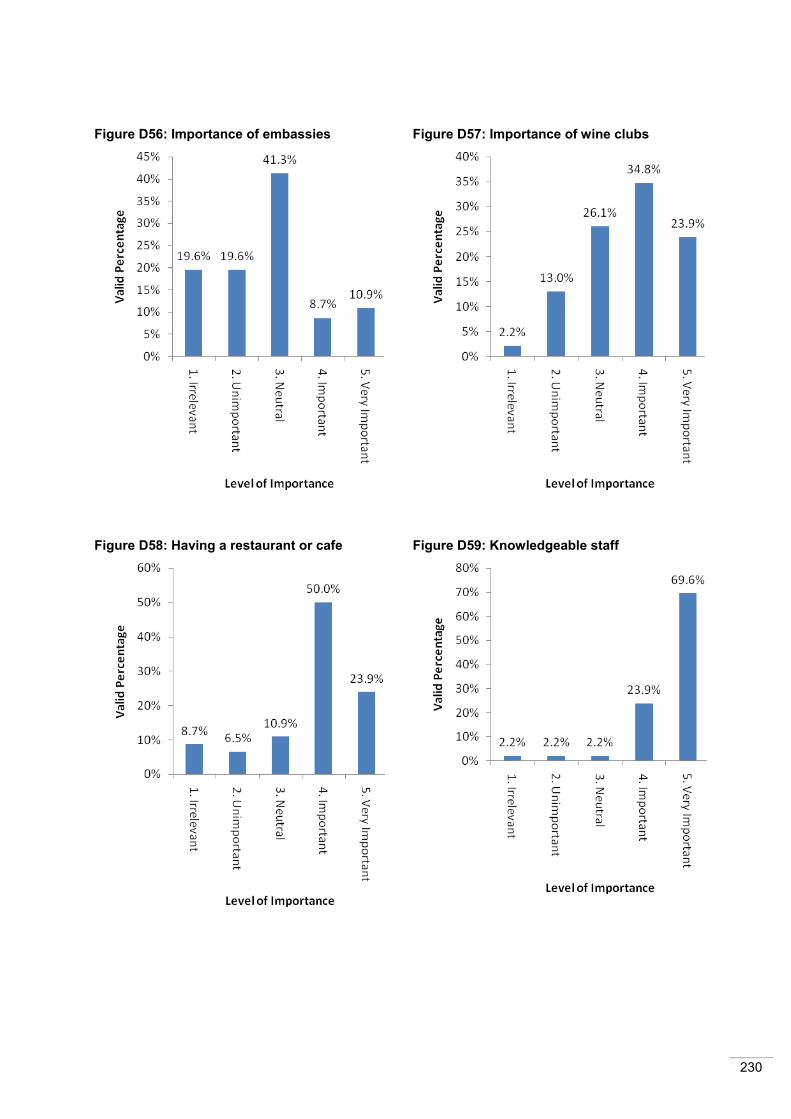
230
Figure D56: Importance of embassies Figure D57: Importance of wine clubs
Figure D58: Having a restaurant or cafe
Figure D59: Knowledgeable staff
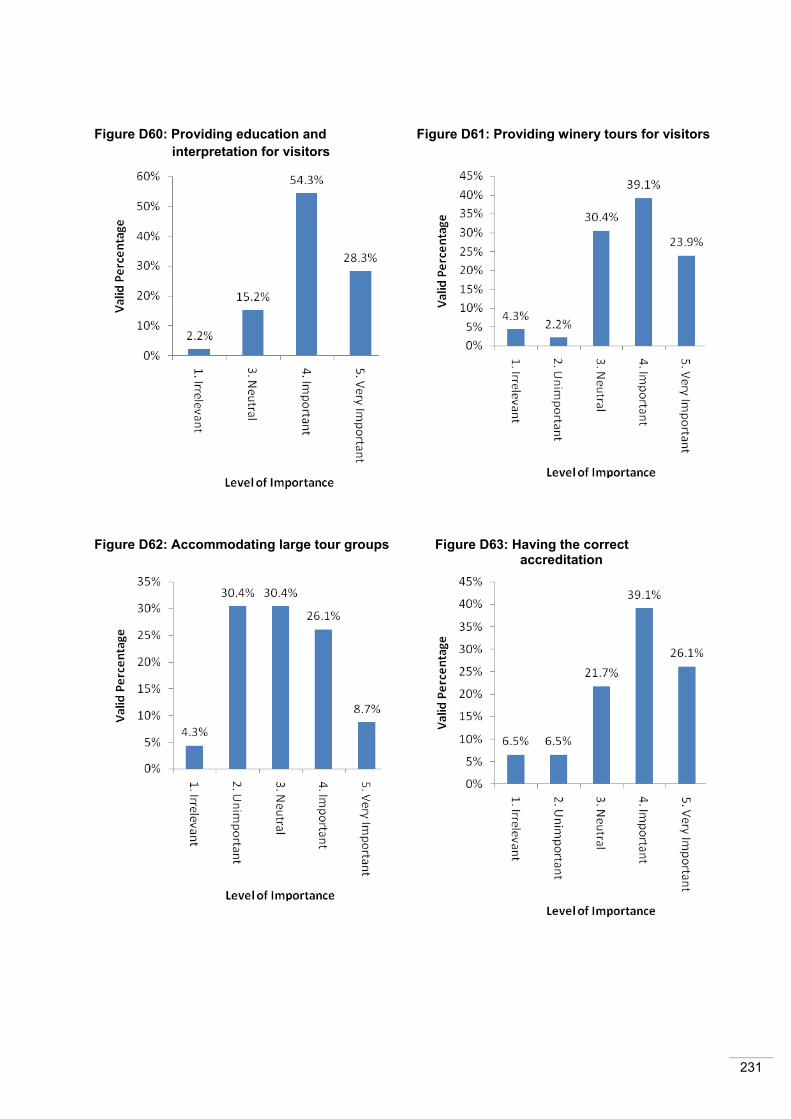
231
Figure D60: Providing education and interpretation for visitors
Figure D61: Providing winery tours for visitors
Figure D62: Accommodating large tour groups
Figure D63: Having the correct accreditation
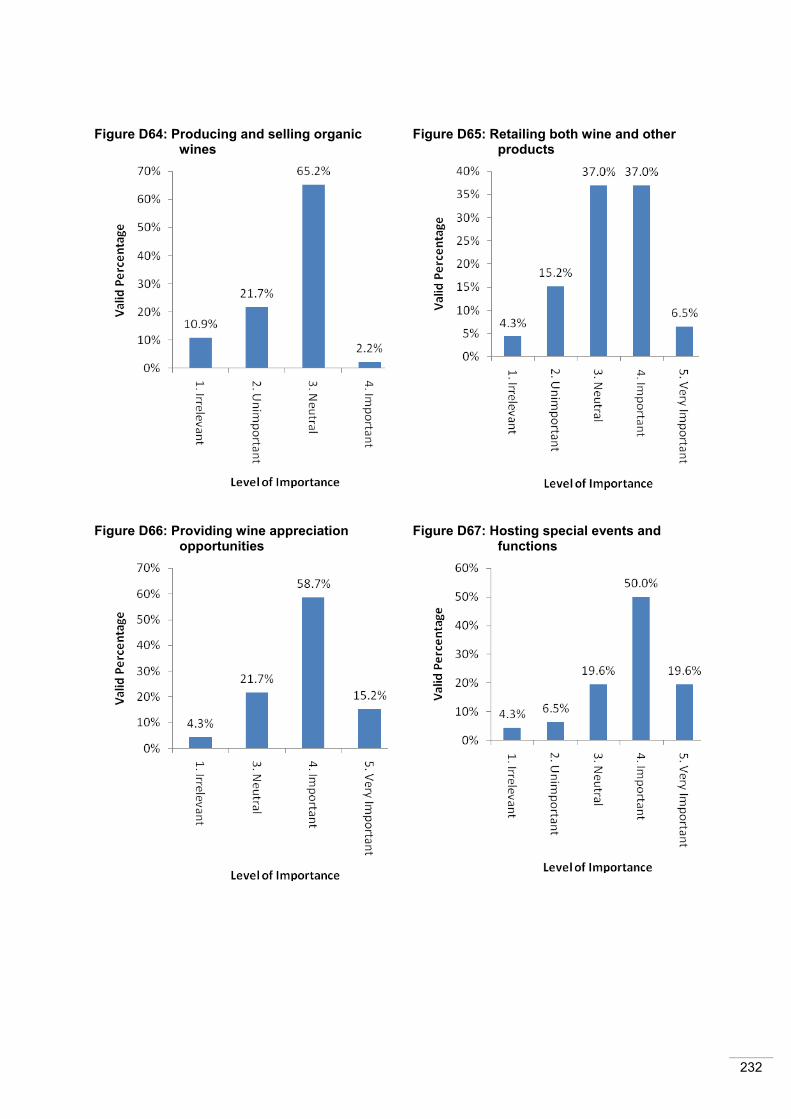
232
Figure D64: Producing and selling organic wines
Figure D65: Retailing both wine and other products
Figure D66: Providing wine appreciation opportunities
Figure D67: Hosting special events and functions
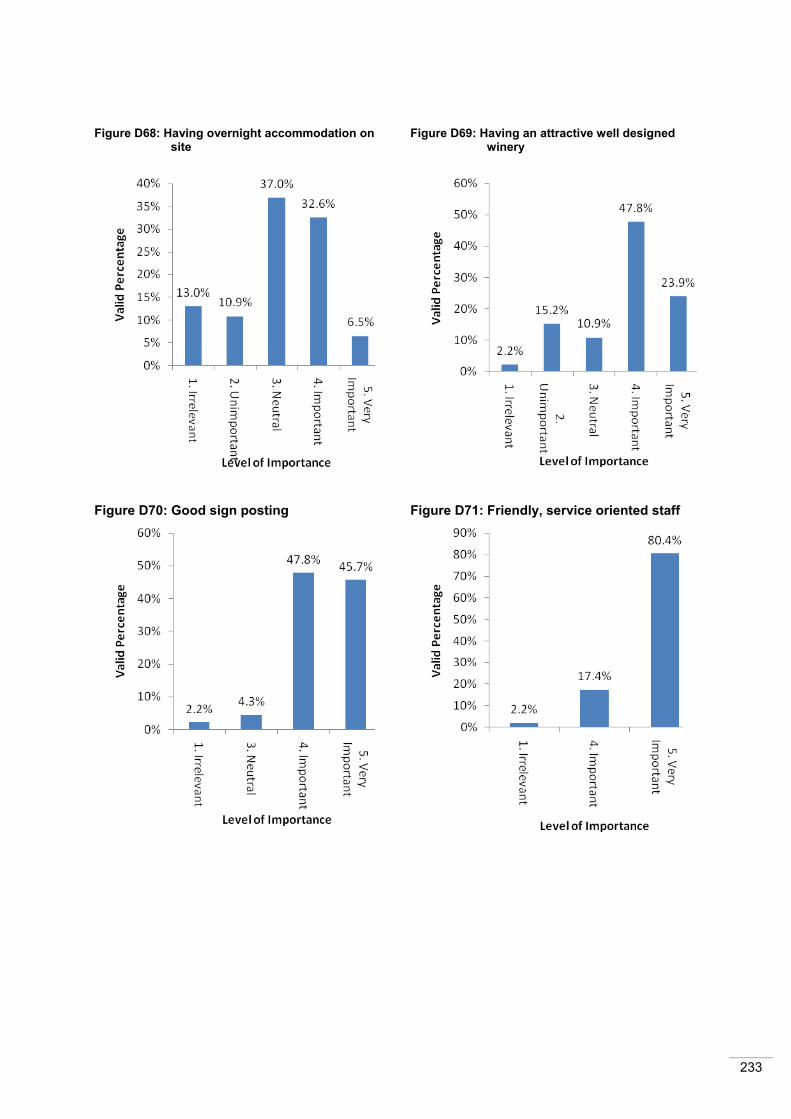
233
Figure D68: Having overnight accommodation on site
Figure D69: Having an attractive well designed winery
Figure D70: Good sign posting
Figure D71: Friendly, service oriented staff

234
Figure D72: Exhibiting at a wine festival increases loyalty
Figure D73: An upmarket tasting room increases the perceived quality of the wine
Figure D74: Wine festivals increases positive brand associations
Figure D75: Sponsoring a music event helps create brand awareness
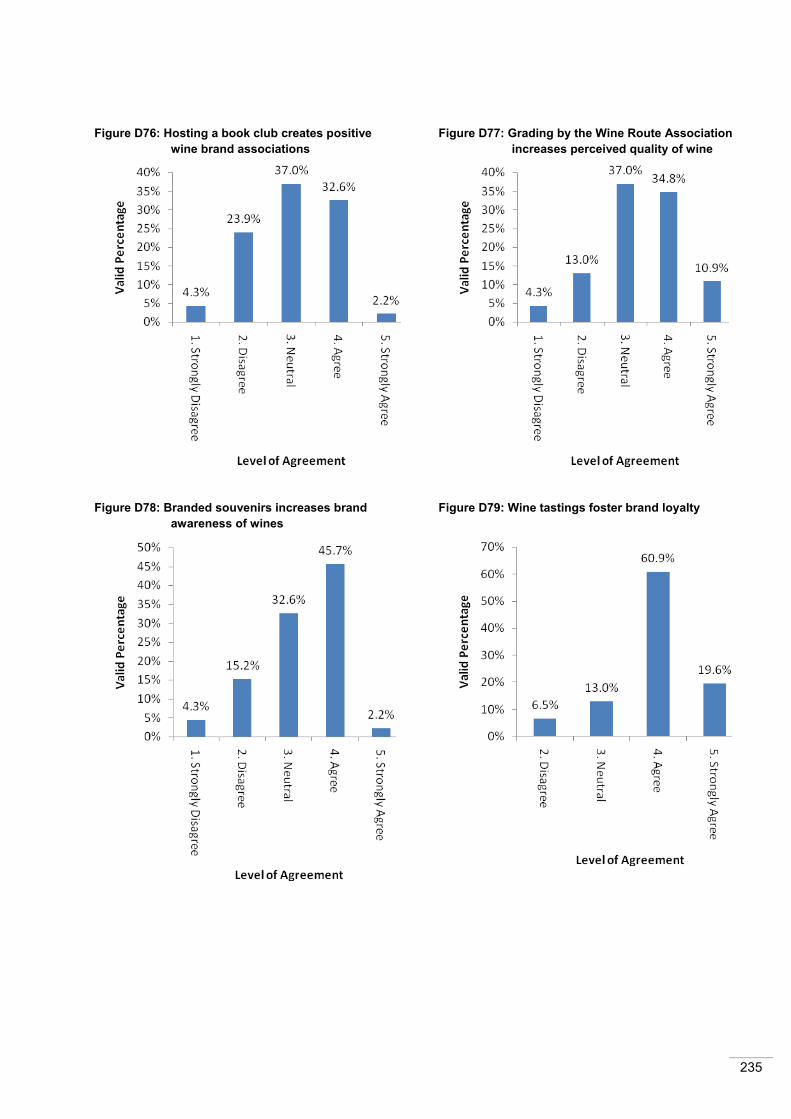
235
Figure D76: Hosting a book club creates positive wine brand associations
Figure D77: Grading by the Wine Route Association increases perceived quality of wine
Figure D78: Branded souvenirs increases brand awareness of wines
Figure D79: Wine tastings foster brand loyalty

236
Figure D80: Celebrity endorsements increases positive brand associations
Figure D81: wine festivals increases positive brand associations
Figure D82: Cinema and photography festivals increases positive brand associations
Figure D83: Festivals help create brand awareness
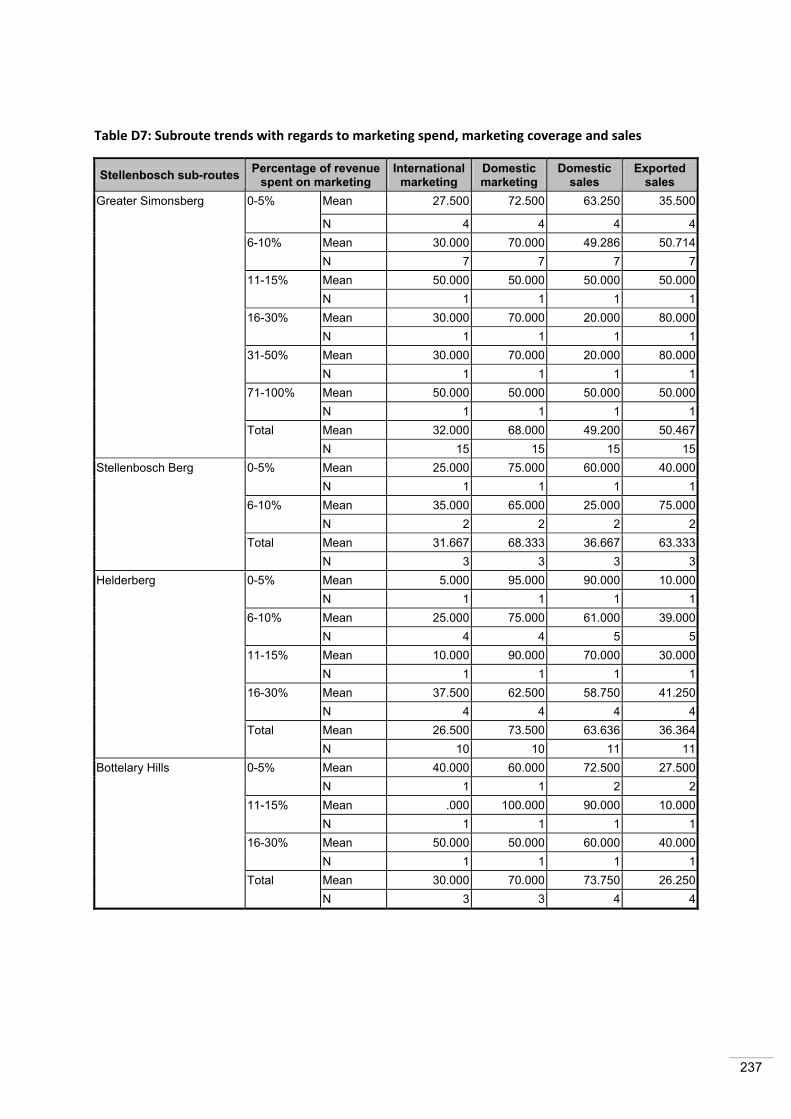
237
Table D7: Subroute trends with regards to marketing spend, marketing coverage and sales
Stellenbosch sub-routes Percentage of revenue spent on marketing
International marketing
Domestic marketing
Domestic sales
Exported sales
Greater Simonsberg 0-5% Mean 27.500 72.500 63.250 35.500
N 4 4 4 46-10% Mean 30.000 70.000 49.286 50.714
N 7 7 7 711-15% Mean 50.000 50.000 50.000 50.000
N 1 1 1 116-30% Mean 30.000 70.000 20.000 80.000
N 1 1 1 131-50% Mean 30.000 70.000 20.000 80.000
N 1 1 1 171-100% Mean 50.000 50.000 50.000 50.000
N 1 1 1 1Total Mean 32.000 68.000 49.200 50.467
N 15 15 15 15Stellenbosch Berg 0-5% Mean 25.000 75.000 60.000 40.000
N 1 1 1 16-10% Mean 35.000 65.000 25.000 75.000
N 2 2 2 2Total Mean 31.667 68.333 36.667 63.333
N 3 3 3 3Helderberg 0-5% Mean 5.000 95.000 90.000 10.000
N 1 1 1 16-10% Mean 25.000 75.000 61.000 39.000
N 4 4 5 511-15% Mean 10.000 90.000 70.000 30.000
N 1 1 1 116-30% Mean 37.500 62.500 58.750 41.250
N 4 4 4 4Total Mean 26.500 73.500 63.636 36.364
N 10 10 11 11Bottelary Hills 0-5% Mean 40.000 60.000 72.500 27.500
N 1 1 2 211-15% Mean .000 100.000 90.000 10.000
N 1 1 1 116-30% Mean 50.000 50.000 60.000 40.000
N 1 1 1 1Total Mean 30.000 70.000 73.750 26.250
N 3 3 4 4

238
Stellenbosch Hills 0-5% Mean 35.000 65.000 51.667 48.333N 2 2 3 3
6-10% Mean 10.000 90.000 85.000 15.000N 3 3 3 3
11-15% Mean 20.000 80.000 97.500 2.500N 2 2 2 2
16-30% Mean 10.000 90.000 70.000 30.000N 2 2 2 2
Total Mean 17.778 82.222 74.500 25.500N 9 9 10 10
Total 0-5% Mean 27.778 72.222 63.909 35.636N 9 9 11 11
6-10% Mean 25.625 74.375 56.176 43.824N 16 16 17 17
11-15% Mean 20.000 80.000 81.000 19.000N 5 5 5 5
16-30% Mean 31.250 68.750 56.875 43.125N 8 8 8 8
31-50% Mean 30.000 70.000 20.000 80.000N 1 1 1 1
Total Mean 27.250 72.750 60.186 39.698N 40 40 43 43

239
Table D8: Correlation between winery size, percentage of revenue spent on marketing, marketing coverage and sales
Winery Size Percentage of revenue spent on marketing
International marketing
Domestic marketing
Domestic sales
Exported sales
Small (1 to 250 ton) 0-5% Mean 18.000 82.000 64.286 35.000N 5 5 7 7
6-10% Mean 20.714 79.286 66.429 33.571N 7 7 7 7
11-15% Mean 5.000 95.000 80.000 20.000N 2 2 2 2
16-30% Mean 30.000 70.000 53.333 46.667N 6 6 6 6
31-50% Mean 30.000 70.000 20.000 80.000N 1 1 1 1
Medium (251 to 1000 tons) 0-5% Mean 40.000 60.000 63.250 36.750N 4 4 4 4
6-10% Mean 30.000 70.000 55.000 45.000N 7 7 8 8
11-15% Mean 20.000 80.000 100.000 .000N 1 1 1 1
16-30% Mean 35.000 65.000 67.500 32.500N 2 2 2 2
71-100% Mean 50.000 50.000 50.000 50.000N 1 1 1 1
Large (1001 to 10 000 tons)
6-10% Mean 27.500 72.500 25.000 75.000N 2 2 2 2
11-15% Mean 35.000 65.000 72.500 27.500N 2 2 2 2
Total Mean 31.250 68.750 48.750 51.250N 4 4 4 4
Total 0-5% Mean 27.778 72.222 63.909 35.636N 9 9 11 11
6-10% Mean 25.625 74.375 56.176 43.824N 16 16 17 17
11-15% Mean 20.000 80.000 81.000 19.000N 5 5 5 5
16-30% Mean 31.250 68.750 56.875 43.125N 8 8 8 8
31-50% Mean 30.000 70.000 20.000 80.000N 1 1 1 1
71-100% Mean 50.000 50.000 50.000 50.000N 1 1 1 1

240
STATISTICAL TEST STATISTICS
Binomial Test
Table D9: Binomial test results for motivations to visit a winery (n=46)
Question 12 Variable N Observed Prop. Test Prop. Asymp. Sig.
(2-tailed) Significant
To taste quality wine Group 1 8 .17 .50 .000a SignificantGroup 2 38 .83 Total 46 1.00
To taste a wine before purchasing it
Group 1 11 .24 .50 .001a SignificantGroup 2 35 .76 Total 46 1.00
To make use of a special offers at the winery
Group 1 30 .65 .50 .054a NoGroup 2 16 .35 Total 46 1.00
To experience the ambiance of the winery
Group 1 7 .15 .50 .000a SignificantGroup 2 39 .85 Total 46 1.00
To experience the wine region
Group 1 9 .20 .50 .000a SignificantGroup 2 37 .80 Total 46 1.00
As a general outing or activity
Group 1 11 .24 .50 .001a SignificantGroup 2 35 .76 Total 46 1.00
To talk to owners or winemakers
Group 1 33 .72 .50 .005a SignificantGroup 2 13 .28 Total 46 1.00
For the total winery experience
Group 1 8 .17 .50 .000a SignificantGroup 2 38 .83 Total 46 1.00
Knowledgeable cellar door staff
Group 1 21 .46 .50 .659a NoGroup 2 25 .54 Total 46 1.00
To learn more about wine
Group 1 14 .30 .50 .011a SignificantGroup 2 32 .70 Total 46 1.00

241
Friendly reception from cellar staff
Group 1 17 .37 .50 .104a NoGroup 2 29 .63 Total 46 1.00
To experience a winery tour
Group 1 28 .61 .50 .184a NoGroup 2 18 .39 Total 46 1.00
Reputation (brand) of your wine
Group 1 10 .22 .50 .000a SignificantGroup 2 36 .78 Total 46 1.00
Medal winning wines Group 1 24 .52 .50 .883a NoGroup 2 22 .48 Total 46 1.00
John Platter’s Wine Guide
Group 1 16 .35 .50 .054a NoGroup 2 30 .65 Total 46 1.00
Knowledge of the Great Wine Capitals of the World
Group 1 31 .67 .50 .026a SignificantGroup 2 15 .33 Total 46 1.00
Table D10: Binomial test results for the advantages and disadvantages of wine tourism to wineries (n=46)
Advantages and disadvantages of wine tourism N
Observed Prop. Test Prop.
Asymp. Sig. (2-tailed)
Significant
Wine tourism contributes to increased wine sales
Group 1 10 .22 .50 .000a Group 2 36 .78 Total 46 1.00
Wine tourism creates brand awareness
Group 1 9 .20 .50 .000a Group 2 37 .80 Total 46 1.00
Wine tourism fosters brand loyalty
Group 1 20 .43 .50 .461a Group 2 26 .57 Total 46 1.00
Sales from the cellar door is an important contributor to overall sales volume
Group 1 16 .35 .50 .054a Group 2 30 .65 Total 46 1.00

242
Wine tourism opens the door for new partnerships with tourism organisations
Group 1 16 .35 .50 .054a Group 2 30 .65 Total 46 1.00
Wine tourism leads to an increase in visitor numbers
Group 1 10 .22 .50 .000a Group 2 36 .78 Total 46 1.00
Wine tourism leads to an increase in spending at my winery
Group 1 17 .37 .50 .104a Group 2 29 .63 Total 46 1.00
Wine tourism assists my winery in overcoming slow demand periods
Group 1 24 .52 .50 .883a Group 2 22 .48 Total 46 1.00
Wine tourism is an opportunity to educate customers
Group 1 12 .26 .50 .002a Group 2 34 .74 Total 46 1.00
Wine tourism enables me to increase my profit margin on wines
Group 1 16 .35 .50 .054a Group 2 30 .65 Total 46 1.00
Wine tourism attracts new domestic market segments to my winery’s products
Group 1 19 .41 .50 .302a Group 2 27 .59 Total 46 1.00
Wine tourism attracts new international market segments to my winery’s products
Group 1 17 .37 .50 .104a Group 2 29 .63 Total 46 1.00
Wine tourism has improved links with the wine trade
Group 1 23 .50 .50 1.000a Group 2 23 .50 Total 46 1.00
Wine tourism is an opportunity to test new products on customers
Group 1 28 .61 .50 .184a Group 2 18 .39 Total 46 1.00
Wine tourism contributes to developing a unique positive destination image
Group 1 11 .24 .50 .001a Group 2 35 .76 Total 46 1.00
Wine tourism is a way to acquire market intelligence on customers
Group 1 20 .43 .50 .461a Group 2 26 .57 Total 46 1.00
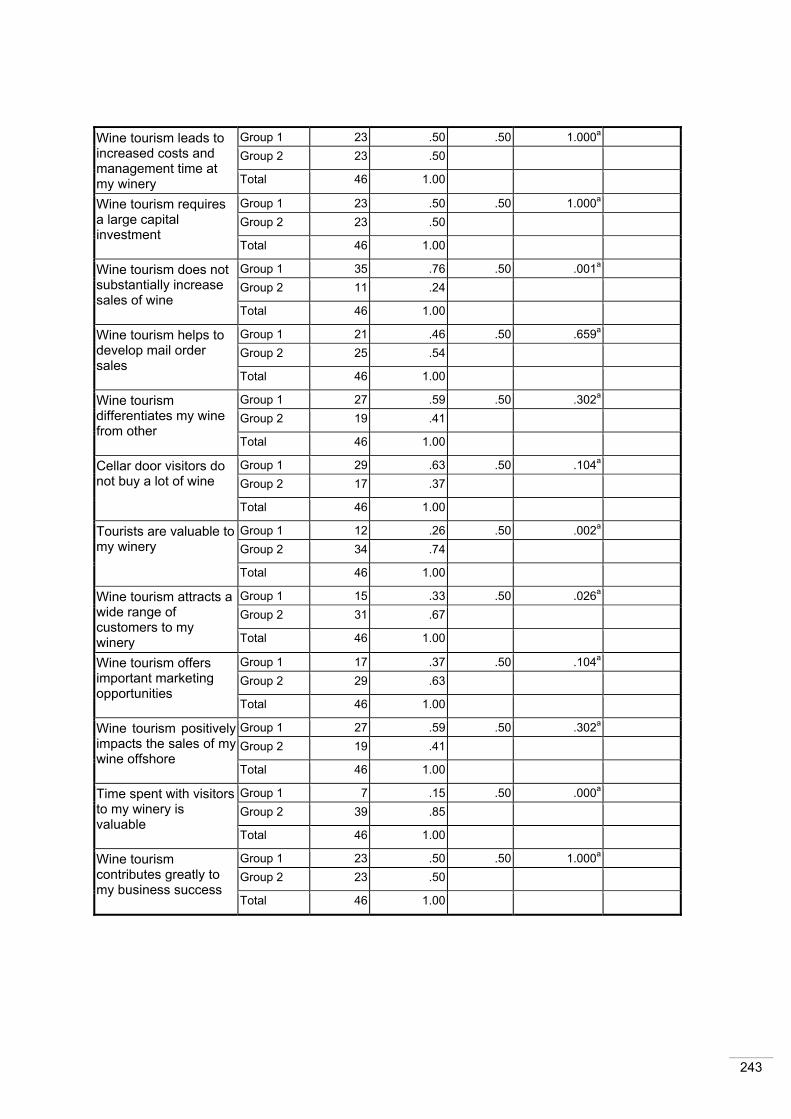
243
Wine tourism leads to increased costs and management time at my winery
Group 1 23 .50 .50 1.000a Group 2 23 .50 Total 46 1.00
Wine tourism requires a large capital investment
Group 1 23 .50 .50 1.000a Group 2 23 .50 Total 46 1.00
Wine tourism does not substantially increase sales of wine
Group 1 35 .76 .50 .001a Group 2 11 .24 Total 46 1.00
Wine tourism helps to develop mail order sales
Group 1 21 .46 .50 .659a Group 2 25 .54 Total 46 1.00
Wine tourism differentiates my wine from other
Group 1 27 .59 .50 .302a Group 2 19 .41 Total 46 1.00
Cellar door visitors do not buy a lot of wine
Group 1 29 .63 .50 .104a Group 2 17 .37 Total 46 1.00
Tourists are valuable to my winery
Group 1 12 .26 .50 .002a Group 2 34 .74 Total 46 1.00
Wine tourism attracts a wide range of customers to my winery
Group 1 15 .33 .50 .026a Group 2 31 .67 Total 46 1.00
Wine tourism offers important marketing opportunities
Group 1 17 .37 .50 .104a Group 2 29 .63 Total 46 1.00
Wine tourism positively impacts the sales of my wine offshore
Group 1 27 .59 .50 .302a Group 2 19 .41 Total 46 1.00
Time spent with visitors to my winery is valuable
Group 1 7 .15 .50 .000a Group 2 39 .85 Total 46 1.00
Wine tourism contributes greatly to my business success
Group 1 23 .50 .50 1.000a Group 2 23 .50 Total 46 1.00
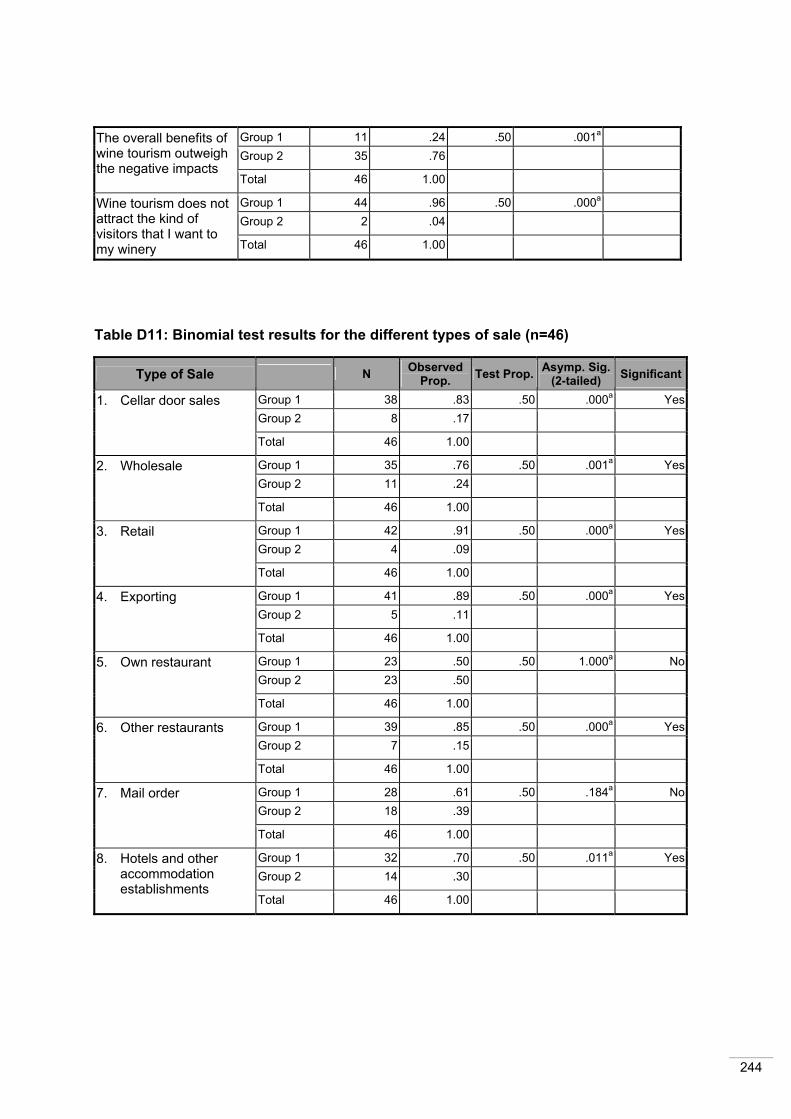
244
The overall benefits of wine tourism outweigh the negative impacts
Group 1 11 .24 .50 .001a Group 2 35 .76 Total 46 1.00
Wine tourism does not attract the kind of visitors that I want to my winery
Group 1 44 .96 .50 .000a Group 2 2 .04 Total 46 1.00
Table D11: Binomial test results for the different types of sale (n=46)
Type of Sale N Observed Prop. Test Prop. Asymp. Sig.
(2-tailed) Significant
1. Cellar door sales Group 1 38 .83 .50 .000a YesGroup 2 8 .17 Total 46 1.00
2. Wholesale Group 1 35 .76 .50 .001a YesGroup 2 11 .24 Total 46 1.00
3. Retail Group 1 42 .91 .50 .000a YesGroup 2 4 .09 Total 46 1.00
4. Exporting Group 1 41 .89 .50 .000a YesGroup 2 5 .11 Total 46 1.00
5. Own restaurant Group 1 23 .50 .50 1.000a NoGroup 2 23 .50 Total 46 1.00
6. Other restaurants Group 1 39 .85 .50 .000a YesGroup 2 7 .15 Total 46 1.00
7. Mail order Group 1 28 .61 .50 .184a NoGroup 2 18 .39 Total 46 1.00
8. Hotels and other accommodation establishments
Group 1 32 .70 .50 .011a YesGroup 2 14 .30 Total 46 1.00
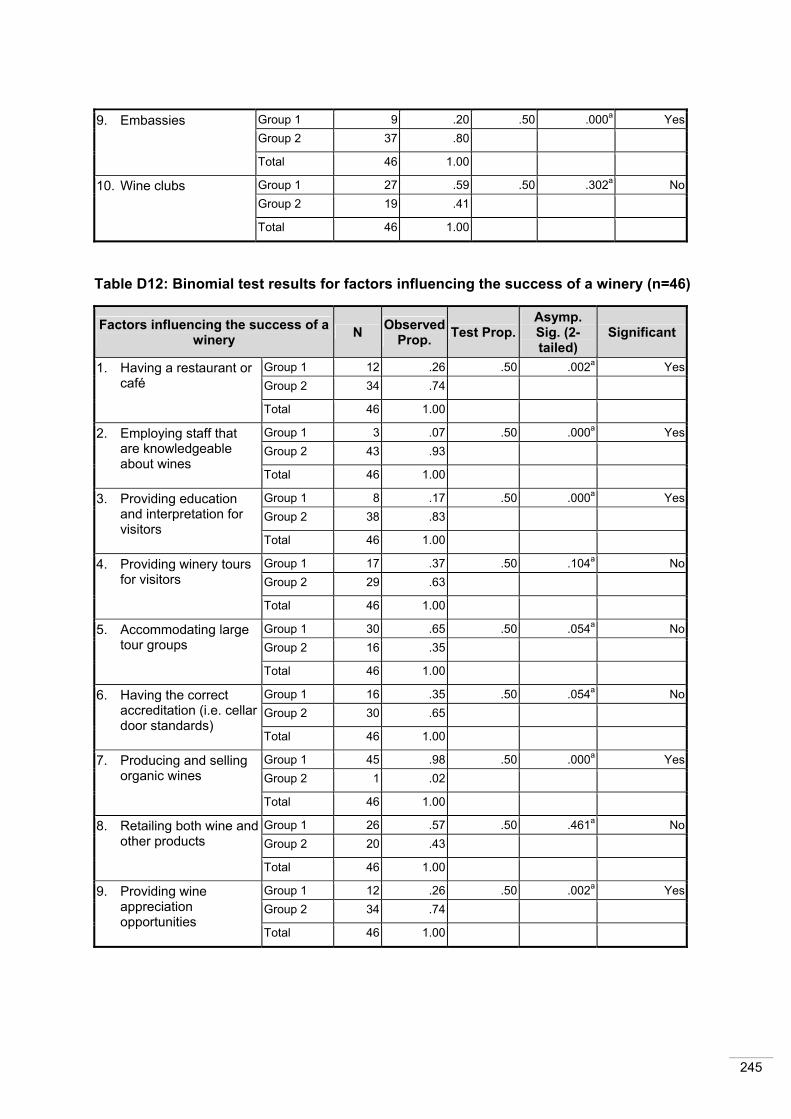
245
9. Embassies Group 1 9 .20 .50 .000a YesGroup 2 37 .80 Total 46 1.00
10. Wine clubs Group 1 27 .59 .50 .302a NoGroup 2 19 .41 Total 46 1.00
Table D12: Binomial test results for factors influencing the success of a winery (n=46)
Factors influencing the success of a winery N Observed
Prop. Test Prop.Asymp. Sig. (2-tailed)
Significant
1. Having a restaurant or café
Group 1 12 .26 .50 .002a YesGroup 2 34 .74 Total 46 1.00
2. Employing staff that are knowledgeable about wines
Group 1 3 .07 .50 .000a YesGroup 2 43 .93 Total 46 1.00
3. Providing education and interpretation for visitors
Group 1 8 .17 .50 .000a YesGroup 2 38 .83 Total 46 1.00
4. Providing winery tours for visitors
Group 1 17 .37 .50 .104a NoGroup 2 29 .63 Total 46 1.00
5. Accommodating large tour groups
Group 1 30 .65 .50 .054a NoGroup 2 16 .35 Total 46 1.00
6. Having the correct accreditation (i.e. cellar door standards)
Group 1 16 .35 .50 .054a NoGroup 2 30 .65 Total 46 1.00
7. Producing and selling organic wines
Group 1 45 .98 .50 .000a YesGroup 2 1 .02 Total 46 1.00
8. Retailing both wine and other products
Group 1 26 .57 .50 .461a NoGroup 2 20 .43 Total 46 1.00
9. Providing wine appreciation opportunities
Group 1 12 .26 .50 .002a YesGroup 2 34 .74 Total 46 1.00
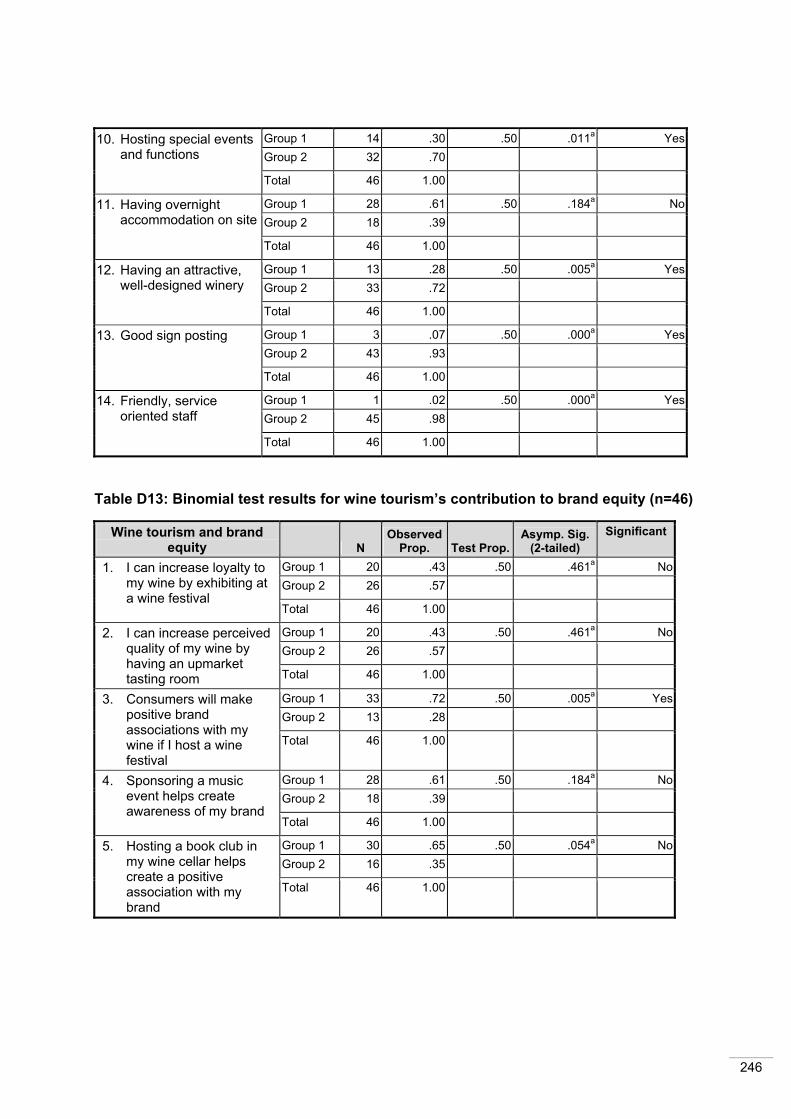
246
10. Hosting special events and functions
Group 1 14 .30 .50 .011a YesGroup 2 32 .70 Total 46 1.00
11. Having overnight accommodation on site
Group 1 28 .61 .50 .184a NoGroup 2 18 .39 Total 46 1.00
12. Having an attractive, well-designed winery
Group 1 13 .28 .50 .005a YesGroup 2 33 .72 Total 46 1.00
13. Good sign posting Group 1 3 .07 .50 .000a YesGroup 2 43 .93 Total 46 1.00
14. Friendly, service oriented staff
Group 1 1 .02 .50 .000a YesGroup 2 45 .98 Total 46 1.00
Table D13: Binomial test results for wine tourism’s contribution to brand equity (n=46)
Wine tourism and brand equity
N
Observed Prop. Test Prop.
Asymp. Sig. (2-tailed)
Significant
1. I can increase loyalty to my wine by exhibiting at a wine festival
Group 1 20 .43 .50 .461a NoGroup 2 26 .57 Total 46 1.00
2. I can increase perceived quality of my wine by having an upmarket tasting room
Group 1 20 .43 .50 .461a NoGroup 2 26 .57 Total 46 1.00
3. Consumers will make positive brand associations with my wine if I host a wine festival
Group 1 33 .72 .50 .005a YesGroup 2 13 .28 Total 46 1.00
4. Sponsoring a music event helps create awareness of my brand
Group 1 28 .61 .50 .184a NoGroup 2 18 .39 Total 46 1.00
5. Hosting a book club in my wine cellar helps create a positive association with my brand
Group 1 30 .65 .50 .054a NoGroup 2 16 .35 Total 46 1.00

247
6. Being graded by the Wine Route Association increases the perceived quality of my wine
Group 1 25 .54 .50 .659a NoGroup 2 21 .46 Total 46 1.00
7. A souvenir shop with several branded souvenirs (e.g. caps, hats, T-shirts) increases brand awareness of my winery
Group 1 24 .52 .50 .883a NoGroup 2 22 .48 Total 46 1.00
8. Winery tasting fosters brand loyalty for my winery
Group 1 9 .20 .50 .000a YesGroup 2 37 .80 Total 46 1.00
9. Celebrity endorsements increases the perceived quality of my wine
Group 1 22 .48 .50 .883a NoGroup 2 24 .52 Total 46 1.00
10. Wine festivals increases positive brand associations with my wine
Group 1 24 .52 .50 .883a NoGroup 2 22 .48 Total 46 1.00
11. Cinema and photography festivals increases positive brand associations with my wine
Group 1 32 .70 .50 .011a YesGroup 2 14 .30 Total 46 1.00
12. Festivals help create brand awareness of my winery
Group 1 13 .28 .50 .005a YesGroup 2 33 .72 Total 46 1.00

248
Mann-Whitney Test Results
Table D14: Mann-Whitney test results for motivations to visit a winery Motivations to visit a winery Size of Winery N Mean Rank Sum of Ranks
To taste quality wine Small (1 to 250 tons) 23 23.61 543.00Medium (251 to 1000 tons) 17 16.29 277.00Total 40
To taste a wine before purchasing it Small (1 to 250 tons) 23 22.37 514.50Medium (251 to 1000 tons) 17 17.97 305.50Total 40
To make use of a special offers at the winery
Small (1 to 250 tons) 23 19.93 458.50Medium (251 to 1000 tons) 17 21.26 361.50Total 40
To experience the ambiance of the winery
Small (1 to 250 tons) 23 20.63 474.50Medium (251 to 1000 tons) 17 20.32 345.50Total 40
To experience the wine region Small (1 to 250 tons) 23 22.37 514.50Medium (251 to 1000 tons) 17 17.97 305.50Total 40
As a general outing or activity Small (1 to 250 tons) 23 21.89 503.50Medium (251 to 1000 tons) 17 18.62 316.50Total 40
To talk to owners or winemakers Small (1 to 250 tons) 23 23.09 531.00Medium (251 to 1000 tons) 17 17.00 289.00Total 40
For the total winery experience Small (1 to 250 tons) 23 20.63 474.50Medium (251 to 1000 tons) 17 20.32 345.50Total 40
Knowledgeable cellar door staff Small (1 to 250 tons) 23 20.37 468.50Medium (251 to 1000 tons) 17 20.68 351.50Total 40
To learn more about wines Small (1 to 250 tons) 23 20.74 477.00Medium (251 to 1000 tons) 17 20.18 343.00Total 40
Friendly reception from cellar staff Small (1 to 250 tons) 23 17.76 408.50Medium (251 to 1000 tons) 17 24.21 411.50Total 40
To experience a winery tour Small (1 to 250 tons) 23 18.70 430.00Medium (251 to 1000 tons) 17 22.94 390.00Total 40

249
Reputation (brand) of your wine Small (1 to 250 tons) 23 21.41 492.50Medium (251 to 1000 tons) 17 19.26 327.50Total 40
Medal winning wines Small (1 to 250 tons) 23 21.30 490.00Medium (251 to 1000 tons) 17 19.41 330.00Total 40
John Platter’s Wine Guide Small (1 to 250 tons) 23 19.41 446.50Medium (251 to 1000 tons) 17 21.97 373.50Total 40
Knowledge of the Great Wine Capitals of the World
Small (1 to 250 tons) 23 20.93 481.50Medium (251 to 1000 tons) 17 19.91 338.50Total 40
B12_1 B12_2 B12_3 B12_4 B12_5 B12_6
Mann-Whitney U 124.000 152.500 182.500 192.500 152.500 163.500Wilcoxon W 277.000 305.500 458.500 345.500 305.500 316.500Z -2.130 -1.277 -.387 -.090 -1.266 -.930Asymp. Sig. (2-tailed) .033 .202 .699 .928 .205 .352Exact Sig. [2*(1-tailed Sig.)] .051a .242a .725a .935a .242a .386a
B12_7 B12_8 B12_9 B12_10 B12_11 B12_12
Mann-Whitney U 136.000 192.500 192.500 190.000 132.500 154.000Wilcoxon W 289.000 345.500 468.500 343.000 408.500 430.000Z -1.704 -.090 -.087 -.160 -1.810 -1.182Asymp. Sig. (2-tailed) .088 .929 .931 .873 .070 .237Exact Sig. [2*(1-tailed Sig.)] .107a .935a .935a .892a .085a .265a
B12_13 B12_14 B12_15 B12_16
Mann-Whitney U 174.500 177.000 170.500 185.500Wilcoxon W 327.500 330.000 446.500 338.500Z -.616 -.527 -.716 -.289Asymp. Sig. (2-tailed) .538 .598 .474 .773Exact Sig. [2*(1-tailed Sig.)] .570a .626a .498a .787a

250
Table D15: Mann-Whitney U test results for advantages and disadvantages of wine tourism to wineries
Advantages of wine tourism Size of Winery N Mean Rank Sum of Ranks Wine tourism contributes to increased wine sales
Small (1 to 250 tons) 23 20.98 482.50Medium (251 to 1000 tons) 17 19.85 337.50Total 40
Wine tourism creates brand awareness
Small (1 to 250 tons) 23 18.74 431.00Medium (251 to 1000 tons) 17 22.88 389.00Total 40
Wine tourism fosters brand loyalty Small (1 to 250 tons) 23 19.13 440.00Medium (251 to 1000 tons) 17 22.35 380.00Total 40
Sales from the cellar door is an important contributor to overall sales volume
Small (1 to 250 tons) 23 18.93 435.50Medium (251 to 1000 tons) 17 22.62 384.50Total 40
Wine tourism opens the door for new partnerships with tourism organisations
Small (1 to 250 tons) 23 20.96 482.00Medium (251 to 1000 tons) 17 19.88 338.00Total 40
Wine tourism leads to an increase in visitor numbers
Small (1 to 250 tons) 23 20.09 462.00Medium (251 to 1000 tons) 17 21.06 358.00Total 40
Wine tourism leads to an increase in spending at my winery
Small (1 to 250 tons) 23 20.91 481.00Medium (251 to 1000 tons) 17 19.94 339.00Total 40
Wine tourism assists my winery in overcoming slow demand periods
Small (1 to 250 tons) 23 20.39 469.00Medium (251 to 1000 tons) 17 20.65 351.00Total 40
Wine tourism is an opportunity to educate customers
Small (1 to 250 tons) 23 19.15 440.50Medium (251 to 1000 tons) 17 22.32 379.50Total 40
Wine tourism enables me to increase my profit margin on wines
Small (1 to 250 tons) 23 20.74 477.00Medium (251 to 1000 tons) 17 20.18 343.00Total 40
Wine tourism attracts new domestic market segments to my winery’s products
Small (1 to 250 tons) 23 19.93 458.50Medium (251 to 1000 tons) 17 21.26 361.50Total 40
Wine tourism attracts new international market segments to my winery’s products
Small (1 to 250 tons) 23 19.93 458.50Medium (251 to 1000 tons) 17 21.26 361.50Total 40
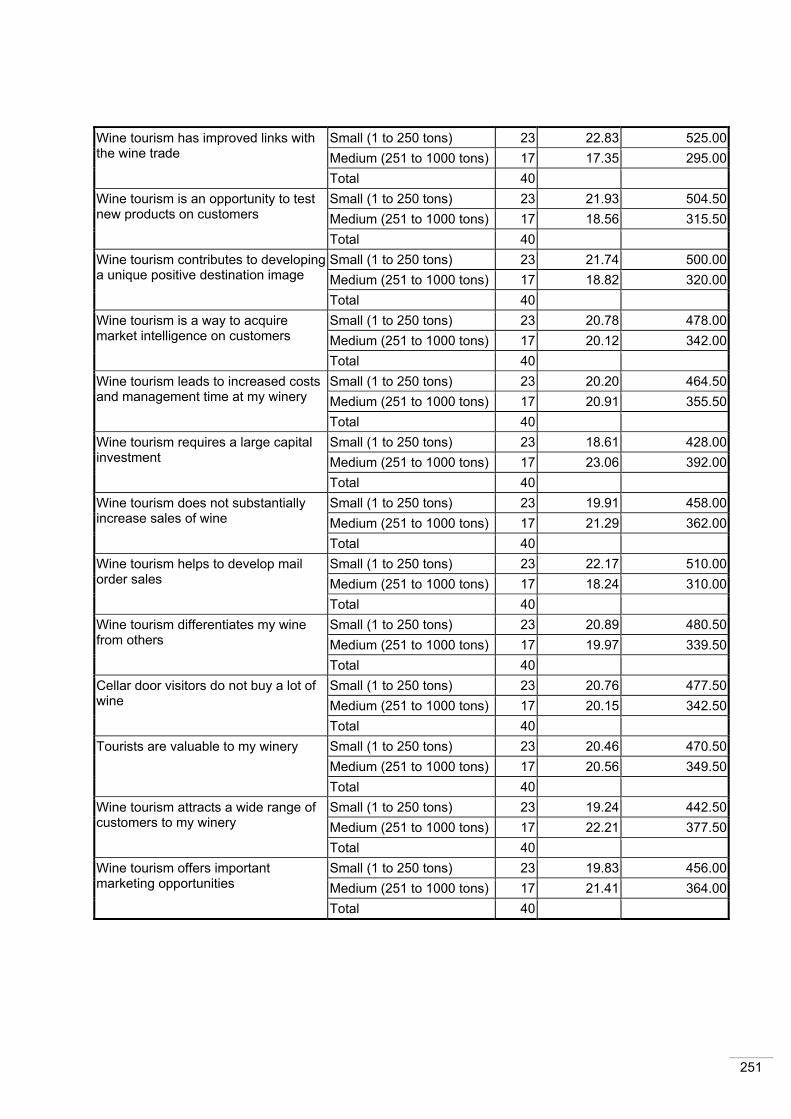
251
Wine tourism has improved links with the wine trade
Small (1 to 250 tons) 23 22.83 525.00Medium (251 to 1000 tons) 17 17.35 295.00Total 40
Wine tourism is an opportunity to test new products on customers
Small (1 to 250 tons) 23 21.93 504.50Medium (251 to 1000 tons) 17 18.56 315.50Total 40
Wine tourism contributes to developing a unique positive destination image
Small (1 to 250 tons) 23 21.74 500.00Medium (251 to 1000 tons) 17 18.82 320.00Total 40
Wine tourism is a way to acquire market intelligence on customers
Small (1 to 250 tons) 23 20.78 478.00Medium (251 to 1000 tons) 17 20.12 342.00Total 40
Wine tourism leads to increased costs and management time at my winery
Small (1 to 250 tons) 23 20.20 464.50Medium (251 to 1000 tons) 17 20.91 355.50Total 40
Wine tourism requires a large capital investment
Small (1 to 250 tons) 23 18.61 428.00Medium (251 to 1000 tons) 17 23.06 392.00Total 40
Wine tourism does not substantially increase sales of wine
Small (1 to 250 tons) 23 19.91 458.00Medium (251 to 1000 tons) 17 21.29 362.00Total 40
Wine tourism helps to develop mail order sales
Small (1 to 250 tons) 23 22.17 510.00Medium (251 to 1000 tons) 17 18.24 310.00Total 40
Wine tourism differentiates my wine from others
Small (1 to 250 tons) 23 20.89 480.50Medium (251 to 1000 tons) 17 19.97 339.50Total 40
Cellar door visitors do not buy a lot of wine
Small (1 to 250 tons) 23 20.76 477.50Medium (251 to 1000 tons) 17 20.15 342.50Total 40
Tourists are valuable to my winery Small (1 to 250 tons) 23 20.46 470.50Medium (251 to 1000 tons) 17 20.56 349.50Total 40
Wine tourism attracts a wide range of customers to my winery
Small (1 to 250 tons) 23 19.24 442.50Medium (251 to 1000 tons) 17 22.21 377.50Total 40
Wine tourism offers important marketing opportunities
Small (1 to 250 tons) 23 19.83 456.00Medium (251 to 1000 tons) 17 21.41 364.00Total 40
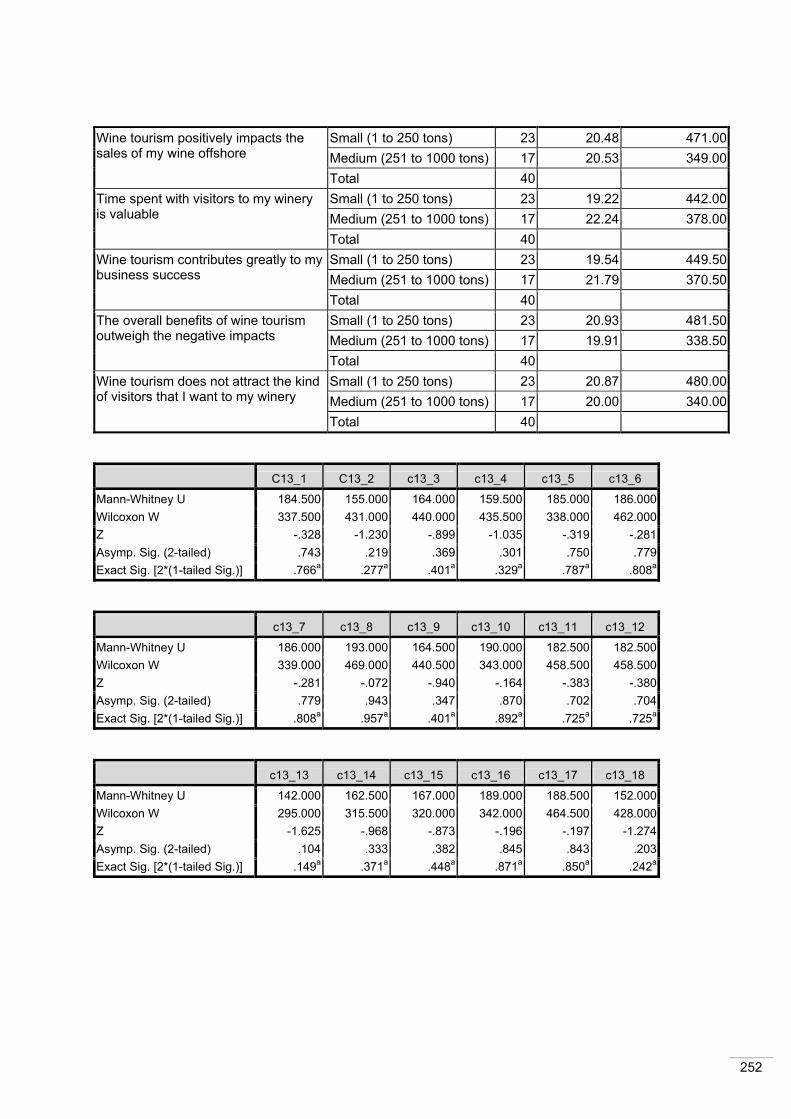
252
Wine tourism positively impacts the sales of my wine offshore
Small (1 to 250 tons) 23 20.48 471.00Medium (251 to 1000 tons) 17 20.53 349.00Total 40
Time spent with visitors to my winery is valuable
Small (1 to 250 tons) 23 19.22 442.00Medium (251 to 1000 tons) 17 22.24 378.00Total 40
Wine tourism contributes greatly to my business success
Small (1 to 250 tons) 23 19.54 449.50Medium (251 to 1000 tons) 17 21.79 370.50Total 40
The overall benefits of wine tourism outweigh the negative impacts
Small (1 to 250 tons) 23 20.93 481.50Medium (251 to 1000 tons) 17 19.91 338.50Total 40
Wine tourism does not attract the kind of visitors that I want to my winery
Small (1 to 250 tons) 23 20.87 480.00Medium (251 to 1000 tons) 17 20.00 340.00Total 40
C13_1 C13_2 c13_3 c13_4 c13_5 c13_6
Mann-Whitney U 184.500 155.000 164.000 159.500 185.000 186.000Wilcoxon W 337.500 431.000 440.000 435.500 338.000 462.000Z -.328 -1.230 -.899 -1.035 -.319 -.281Asymp. Sig. (2-tailed) .743 .219 .369 .301 .750 .779Exact Sig. [2*(1-tailed Sig.)] .766a .277a .401a .329a .787a .808a
c13_7 c13_8 c13_9 c13_10 c13_11 c13_12
Mann-Whitney U 186.000 193.000 164.500 190.000 182.500 182.500Wilcoxon W 339.000 469.000 440.500 343.000 458.500 458.500Z -.281 -.072 -.940 -.164 -.383 -.380Asymp. Sig. (2-tailed) .779 .943 .347 .870 .702 .704Exact Sig. [2*(1-tailed Sig.)] .808a .957a .401a .892a .725a .725a
c13_13 c13_14 c13_15 c13_16 c13_17 c13_18
Mann-Whitney U 142.000 162.500 167.000 189.000 188.500 152.000Wilcoxon W 295.000 315.500 320.000 342.000 464.500 428.000Z -1.625 -.968 -.873 -.196 -.197 -1.274Asymp. Sig. (2-tailed) .104 .333 .382 .845 .843 .203Exact Sig. [2*(1-tailed Sig.)] .149a .371a .448a .871a .850a .242a
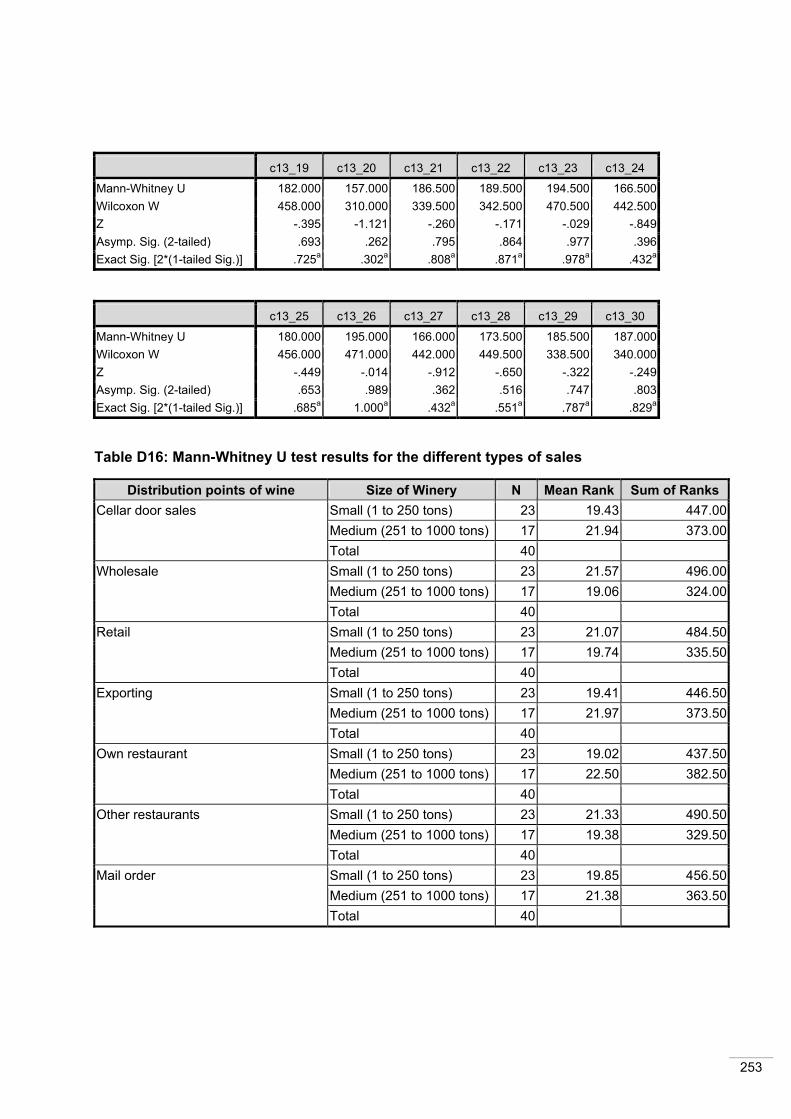
253
c13_19 c13_20 c13_21 c13_22 c13_23 c13_24
Mann-Whitney U 182.000 157.000 186.500 189.500 194.500 166.500Wilcoxon W 458.000 310.000 339.500 342.500 470.500 442.500Z -.395 -1.121 -.260 -.171 -.029 -.849Asymp. Sig. (2-tailed) .693 .262 .795 .864 .977 .396Exact Sig. [2*(1-tailed Sig.)] .725a .302a .808a .871a .978a .432a
c13_25 c13_26 c13_27 c13_28 c13_29 c13_30
Mann-Whitney U 180.000 195.000 166.000 173.500 185.500 187.000Wilcoxon W 456.000 471.000 442.000 449.500 338.500 340.000Z -.449 -.014 -.912 -.650 -.322 -.249Asymp. Sig. (2-tailed) .653 .989 .362 .516 .747 .803Exact Sig. [2*(1-tailed Sig.)] .685a 1.000a .432a .551a .787a .829a
Table D16: Mann-Whitney U test results for the different types of sales
Distribution points of wine Size of Winery N Mean Rank Sum of Ranks Cellar door sales Small (1 to 250 tons) 23 19.43 447.00
Medium (251 to 1000 tons) 17 21.94 373.00Total 40
Wholesale Small (1 to 250 tons) 23 21.57 496.00Medium (251 to 1000 tons) 17 19.06 324.00Total 40
Retail Small (1 to 250 tons) 23 21.07 484.50Medium (251 to 1000 tons) 17 19.74 335.50Total 40
Exporting Small (1 to 250 tons) 23 19.41 446.50Medium (251 to 1000 tons) 17 21.97 373.50Total 40
Own restaurant Small (1 to 250 tons) 23 19.02 437.50Medium (251 to 1000 tons) 17 22.50 382.50Total 40
Other restaurants Small (1 to 250 tons) 23 21.33 490.50Medium (251 to 1000 tons) 17 19.38 329.50Total 40
Mail order Small (1 to 250 tons) 23 19.85 456.50Medium (251 to 1000 tons) 17 21.38 363.50Total 40
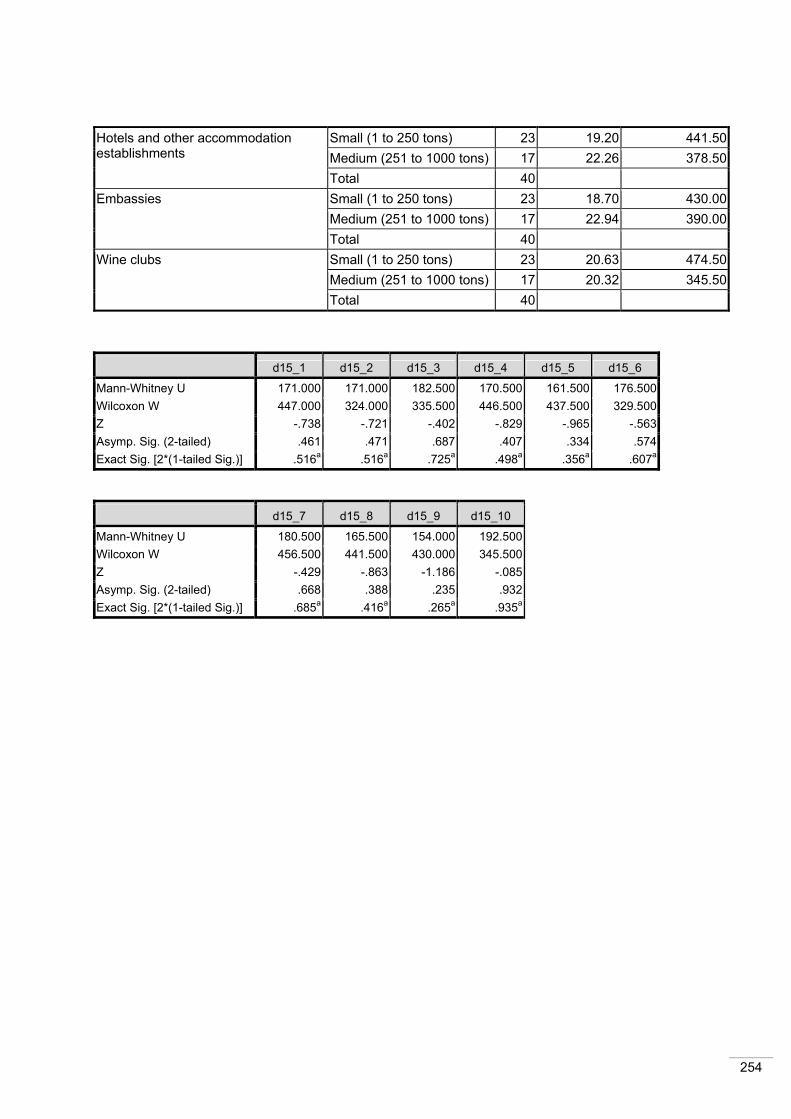
254
Hotels and other accommodation establishments
Small (1 to 250 tons) 23 19.20 441.50Medium (251 to 1000 tons) 17 22.26 378.50Total 40
Embassies Small (1 to 250 tons) 23 18.70 430.00Medium (251 to 1000 tons) 17 22.94 390.00Total 40
Wine clubs Small (1 to 250 tons) 23 20.63 474.50Medium (251 to 1000 tons) 17 20.32 345.50Total 40
d15_1 d15_2 d15_3 d15_4 d15_5 d15_6
Mann-Whitney U 171.000 171.000 182.500 170.500 161.500 176.500Wilcoxon W 447.000 324.000 335.500 446.500 437.500 329.500Z -.738 -.721 -.402 -.829 -.965 -.563Asymp. Sig. (2-tailed) .461 .471 .687 .407 .334 .574Exact Sig. [2*(1-tailed Sig.)] .516a .516a .725a .498a .356a .607a
d15_7 d15_8 d15_9 d15_10
Mann-Whitney U 180.500 165.500 154.000 192.500Wilcoxon W 456.500 441.500 430.000 345.500Z -.429 -.863 -1.186 -.085Asymp. Sig. (2-tailed) .668 .388 .235 .932Exact Sig. [2*(1-tailed Sig.)] .685a .416a .265a .935a

255
Table D17: Mann-Whitney U test results for the critical success factors in marketing a successful winery
Critical success factors Size of Winery N Mean Rank Sum of Ranks Having a restaurant or café Small (1 to 250 tons) 23 20.98 482.50
Medium (251 to 1000 tons) 17 19.85 337.50Total 40
Employing staff that are knowledgeable about wines
Small (1 to 250 tons) 23 19.72 453.50Medium (251 to 1000 tons) 17 21.56 366.50Total 40
Providing education and interpretation for visitors
Small (1 to 250 tons) 23 20.33 467.50Medium (251 to 1000 tons) 17 20.74 352.50Total 40
Providing winery tours for visitors Small (1 to 250 tons) 23 19.85 456.50Medium (251 to 1000 tons) 17 21.38 363.50Total 40
Accommodating large tour groups Small (1 to 250 tons) 23 21.15 486.50Medium (251 to 1000 tons) 17 19.62 333.50Total 40
Having the correct accreditation (i.e. cellar door standards)
Small (1 to 250 tons) 23 18.67 429.50Medium (251 to 1000 tons) 17 22.97 390.50Total 40
Producing and selling organic wines Small (1 to 250 tons) 23 19.78 455.00Medium (251 to 1000 tons) 17 21.47 365.00Total 40
Retailing both wine and other products Small (1 to 250 tons) 23 22.00 506.00Medium (251 to 1000 tons) 17 18.47 314.00Total 40
Providing wine appreciation opportunities
Small (1 to 250 tons) 23 22.00 506.00Medium (251 to 1000 tons) 17 18.47 314.00Total 40
Hosting special events and functions Small (1 to 250 tons) 23 21.50 494.50Medium (251 to 1000 tons) 17 19.15 325.50Total 40
Having overnight accommodation on site
Small (1 to 250 tons) 23 17.89 411.50Medium (251 to 1000 tons) 17 24.03 408.50Total 40
Having an attractive, well-designed winery
Small (1 to 250 tons) 23 21.09 485.00Medium (251 to 1000 tons) 17 19.71 335.00Total 40
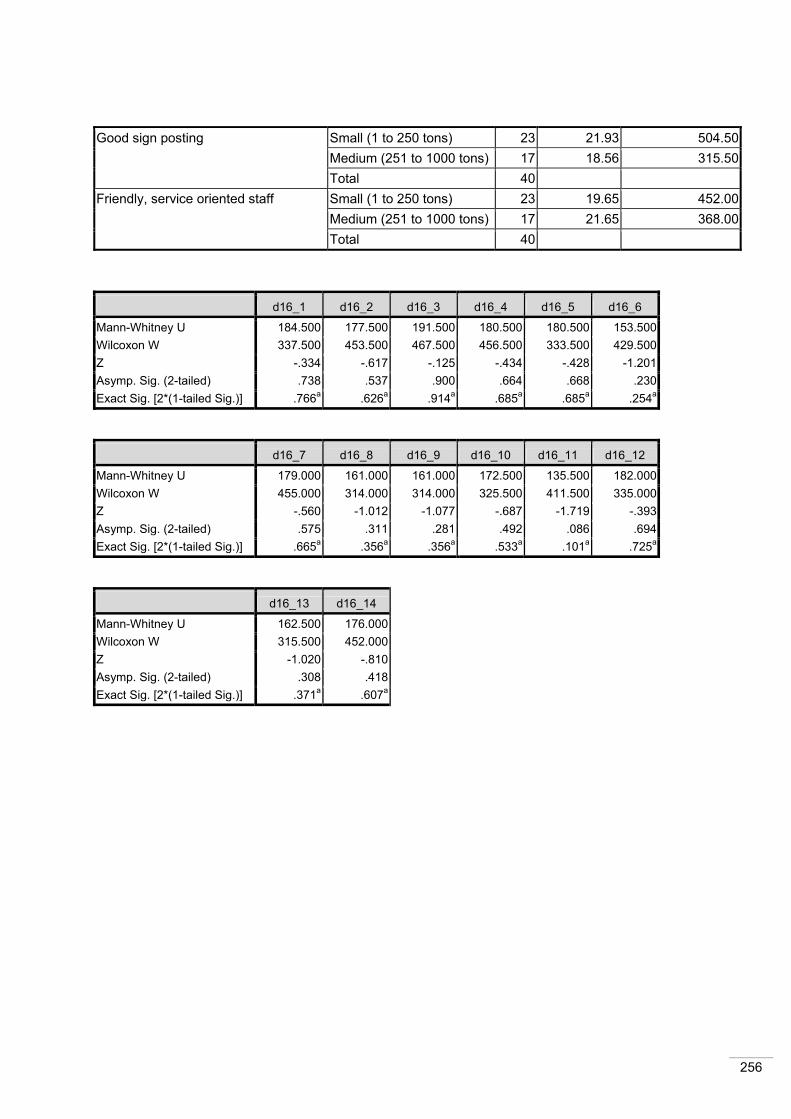
256
Good sign posting Small (1 to 250 tons) 23 21.93 504.50Medium (251 to 1000 tons) 17 18.56 315.50Total 40
Friendly, service oriented staff Small (1 to 250 tons) 23 19.65 452.00Medium (251 to 1000 tons) 17 21.65 368.00Total 40
d16_1 d16_2 d16_3 d16_4 d16_5 d16_6
Mann-Whitney U 184.500 177.500 191.500 180.500 180.500 153.500Wilcoxon W 337.500 453.500 467.500 456.500 333.500 429.500Z -.334 -.617 -.125 -.434 -.428 -1.201Asymp. Sig. (2-tailed) .738 .537 .900 .664 .668 .230Exact Sig. [2*(1-tailed Sig.)] .766a .626a .914a .685a .685a .254a
d16_7 d16_8 d16_9 d16_10 d16_11 d16_12
Mann-Whitney U 179.000 161.000 161.000 172.500 135.500 182.000Wilcoxon W 455.000 314.000 314.000 325.500 411.500 335.000Z -.560 -1.012 -1.077 -.687 -1.719 -.393Asymp. Sig. (2-tailed) .575 .311 .281 .492 .086 .694Exact Sig. [2*(1-tailed Sig.)] .665a .356a .356a .533a .101a .725a
d16_13 d16_14
Mann-Whitney U 162.500 176.000Wilcoxon W 315.500 452.000Z -1.020 -.810Asymp. Sig. (2-tailed) .308 .418Exact Sig. [2*(1-tailed Sig.)] .371a .607a
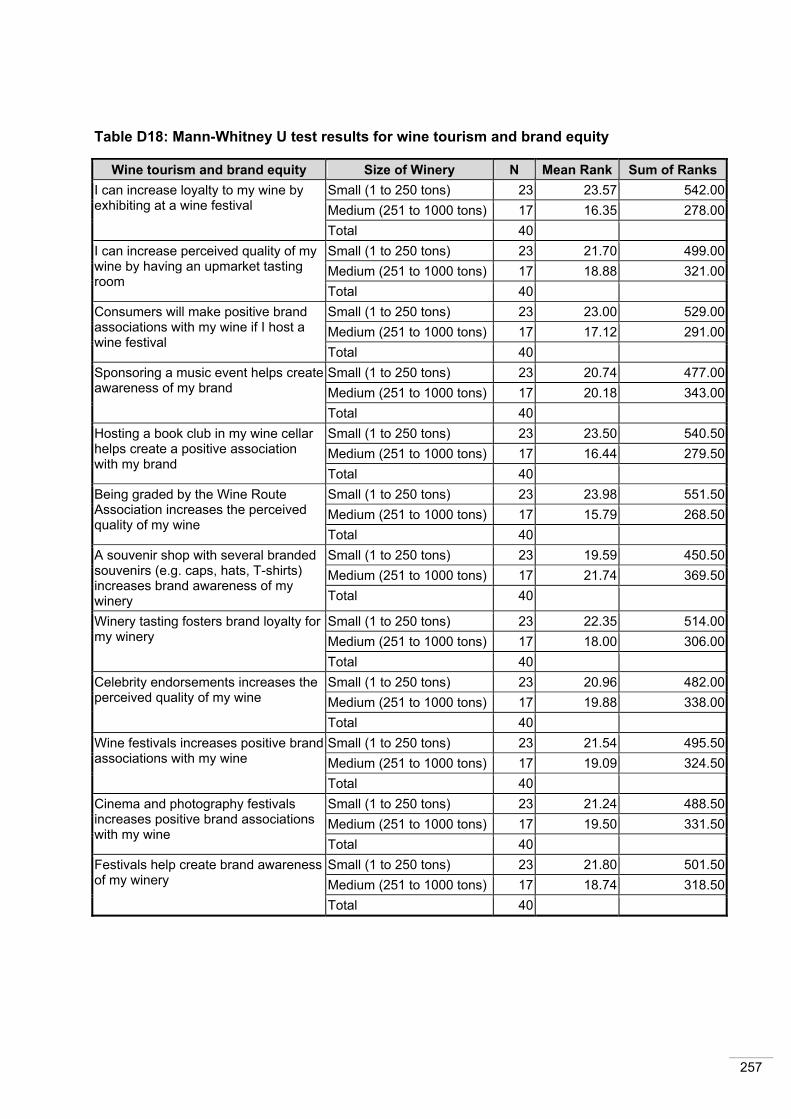
257
Table D18: Mann-Whitney U test results for wine tourism and brand equity
Wine tourism and brand equity Size of Winery N Mean Rank Sum of Ranks I can increase loyalty to my wine by exhibiting at a wine festival
Small (1 to 250 tons) 23 23.57 542.00Medium (251 to 1000 tons) 17 16.35 278.00Total 40
I can increase perceived quality of my wine by having an upmarket tasting room
Small (1 to 250 tons) 23 21.70 499.00Medium (251 to 1000 tons) 17 18.88 321.00Total 40
Consumers will make positive brand associations with my wine if I host a wine festival
Small (1 to 250 tons) 23 23.00 529.00Medium (251 to 1000 tons) 17 17.12 291.00Total 40
Sponsoring a music event helps create awareness of my brand
Small (1 to 250 tons) 23 20.74 477.00Medium (251 to 1000 tons) 17 20.18 343.00Total 40
Hosting a book club in my wine cellar helps create a positive association with my brand
Small (1 to 250 tons) 23 23.50 540.50Medium (251 to 1000 tons) 17 16.44 279.50Total 40
Being graded by the Wine Route Association increases the perceived quality of my wine
Small (1 to 250 tons) 23 23.98 551.50Medium (251 to 1000 tons) 17 15.79 268.50Total 40
A souvenir shop with several branded souvenirs (e.g. caps, hats, T-shirts) increases brand awareness of my winery
Small (1 to 250 tons) 23 19.59 450.50Medium (251 to 1000 tons) 17 21.74 369.50Total 40
Winery tasting fosters brand loyalty for my winery
Small (1 to 250 tons) 23 22.35 514.00Medium (251 to 1000 tons) 17 18.00 306.00Total 40
Celebrity endorsements increases the perceived quality of my wine
Small (1 to 250 tons) 23 20.96 482.00Medium (251 to 1000 tons) 17 19.88 338.00Total 40
Wine festivals increases positive brand associations with my wine
Small (1 to 250 tons) 23 21.54 495.50Medium (251 to 1000 tons) 17 19.09 324.50Total 40
Cinema and photography festivals increases positive brand associations with my wine
Small (1 to 250 tons) 23 21.24 488.50Medium (251 to 1000 tons) 17 19.50 331.50Total 40
Festivals help create brand awareness of my winery
Small (1 to 250 tons) 23 21.80 501.50Medium (251 to 1000 tons) 17 18.74 318.50Total 40
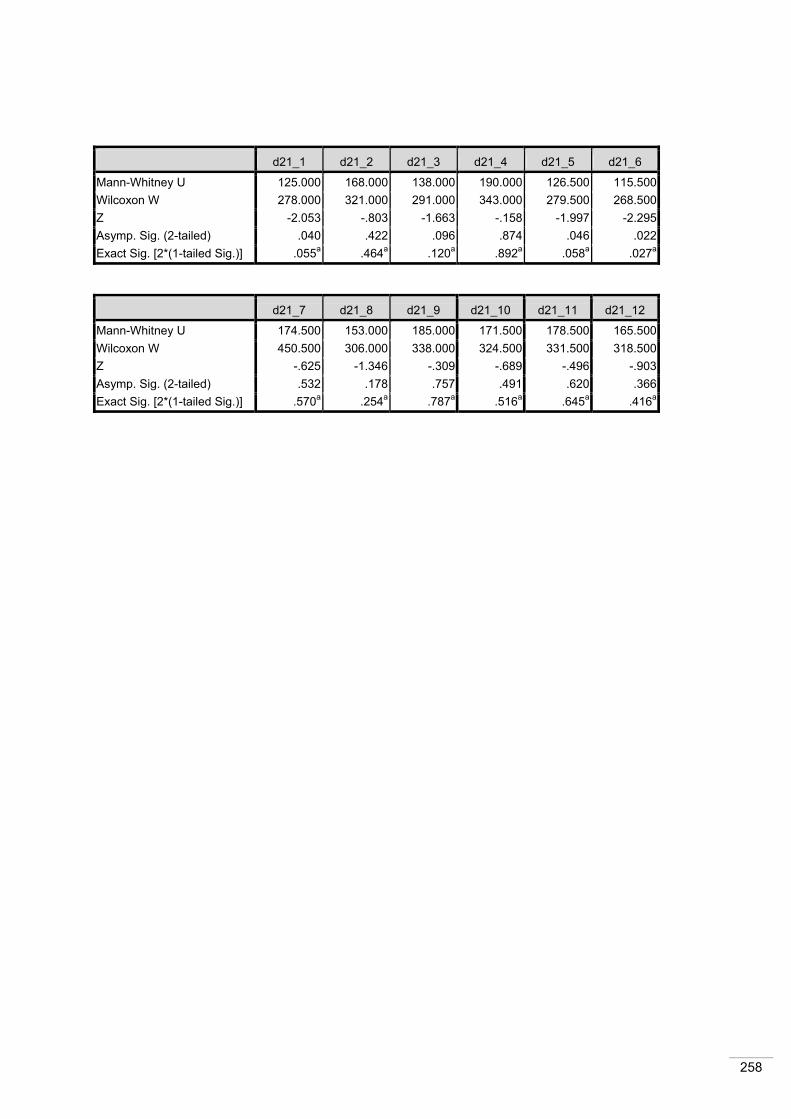
258
d21_1 d21_2 d21_3 d21_4 d21_5 d21_6
Mann-Whitney U 125.000 168.000 138.000 190.000 126.500 115.500Wilcoxon W 278.000 321.000 291.000 343.000 279.500 268.500Z -2.053 -.803 -1.663 -.158 -1.997 -2.295Asymp. Sig. (2-tailed) .040 .422 .096 .874 .046 .022Exact Sig. [2*(1-tailed Sig.)] .055a .464a .120a .892a .058a .027a
d21_7 d21_8 d21_9 d21_10 d21_11 d21_12
Mann-Whitney U 174.500 153.000 185.000 171.500 178.500 165.500Wilcoxon W 450.500 306.000 338.000 324.500 331.500 318.500Z -.625 -1.346 -.309 -.689 -.496 -.903Asymp. Sig. (2-tailed) .532 .178 .757 .491 .620 .366Exact Sig. [2*(1-tailed Sig.)] .570a .254a .787a .516a .645a .416a
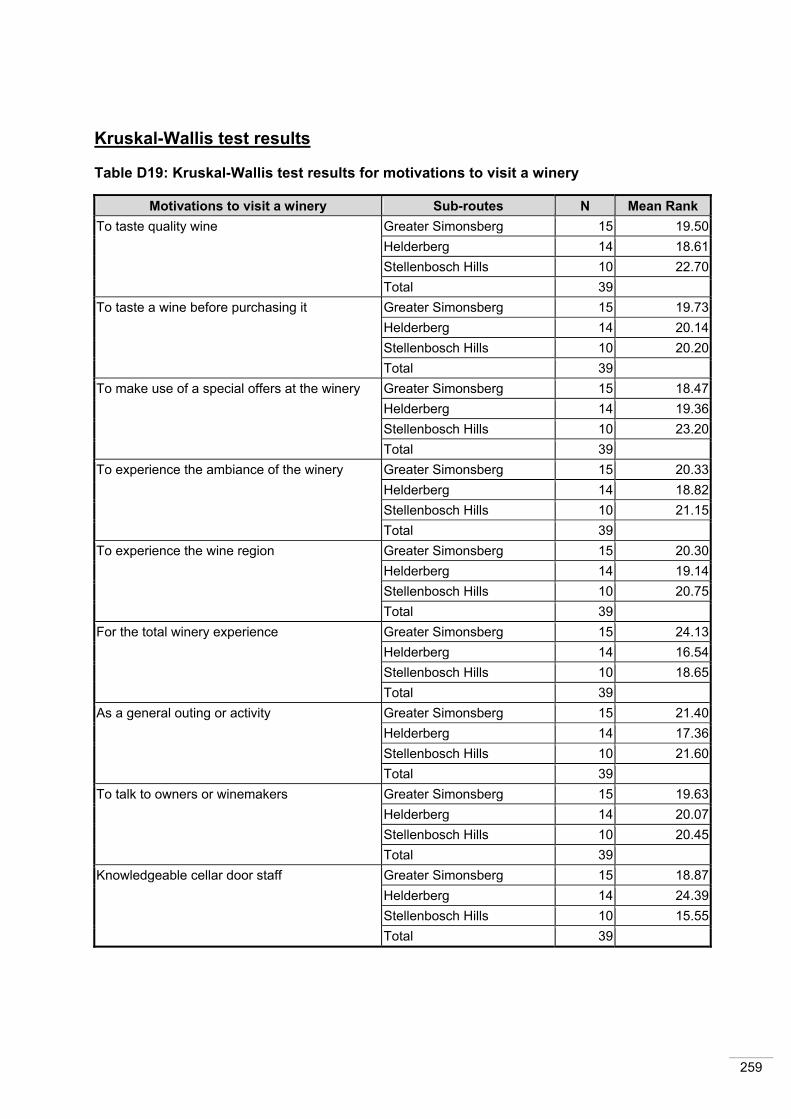
259
Kruskal-Wallis test results
Table D19: Kruskal-Wallis test results for motivations to visit a winery Motivations to visit a winery Sub-routes N Mean Rank
To taste quality wine
Greater Simonsberg 15 19.50Helderberg 14 18.61Stellenbosch Hills 10 22.70Total 39
To taste a wine before purchasing it
Greater Simonsberg 15 19.73Helderberg 14 20.14Stellenbosch Hills 10 20.20Total 39
To make use of a special offers at the winery
Greater Simonsberg 15 18.47Helderberg 14 19.36Stellenbosch Hills 10 23.20Total 39
To experience the ambiance of the winery
Greater Simonsberg 15 20.33Helderberg 14 18.82Stellenbosch Hills 10 21.15Total 39
To experience the wine region
Greater Simonsberg 15 20.30Helderberg 14 19.14Stellenbosch Hills 10 20.75Total 39
For the total winery experience Greater Simonsberg 15 24.13Helderberg 14 16.54Stellenbosch Hills 10 18.65Total 39
As a general outing or activity
Greater Simonsberg 15 21.40Helderberg 14 17.36Stellenbosch Hills 10 21.60Total 39
To talk to owners or winemakers
Greater Simonsberg 15 19.63Helderberg 14 20.07Stellenbosch Hills 10 20.45Total 39
Knowledgeable cellar door staff
Greater Simonsberg 15 18.87Helderberg 14 24.39Stellenbosch Hills 10 15.55Total 39

260
To learn more about wines
Greater Simonsberg 15 21.37Helderberg 14 19.25Stellenbosch Hills 10 19.00Total 39
Friendly reception from cellar staff
Greater Simonsberg 15 22.70Helderberg 14 23.07Stellenbosch Hills 10 11.65Total 39
To experience a winery tour
Greater Simonsberg 15 21.50Helderberg 14 21.07Stellenbosch Hills 10 16.25Total 39
Knowledge of the Great Wine Capitals of the World
Greater Simonsberg 15 22.77Helderberg 14 17.82Stellenbosch Hills 10 18.90Total 39
Reputation (brand) of your wine
Greater Simonsberg 15 22.43Helderberg 14 18.57Stellenbosch Hills 10 18.35Total 39
Medal winning wines
Greater Simonsberg 15 16.90Helderberg 14 22.75Stellenbosch Hills 10 20.80Total 39
John Platter’s Wine Guide
Greater Simonsberg 15 19.87Helderberg 14 24.57Stellenbosch Hills 10 13.80Total 39
B12_1 B12_2 B12_3 B12_4 B12_5 B12_6 B12_7 B12_8
Chi-Square .943 .016 1.226 .307 .153 3.903 1.292 .037df 2 2 2 2 2 2 2 2Asymp. Sig. .624 .992 .542 .858 .926 .142 .524 .982
B12_9 B12_10 B12_11 B12_12 B12_13 B12_14 B12_15 B12_16
Chi-Square 4.109 .398 7.907 1.581 1.731 1.189 2.173 5.589df 2 2 2 2 2 2 2 2Asymp. Sig. .128 .819 .019 .454 .421 .552 .337 .061
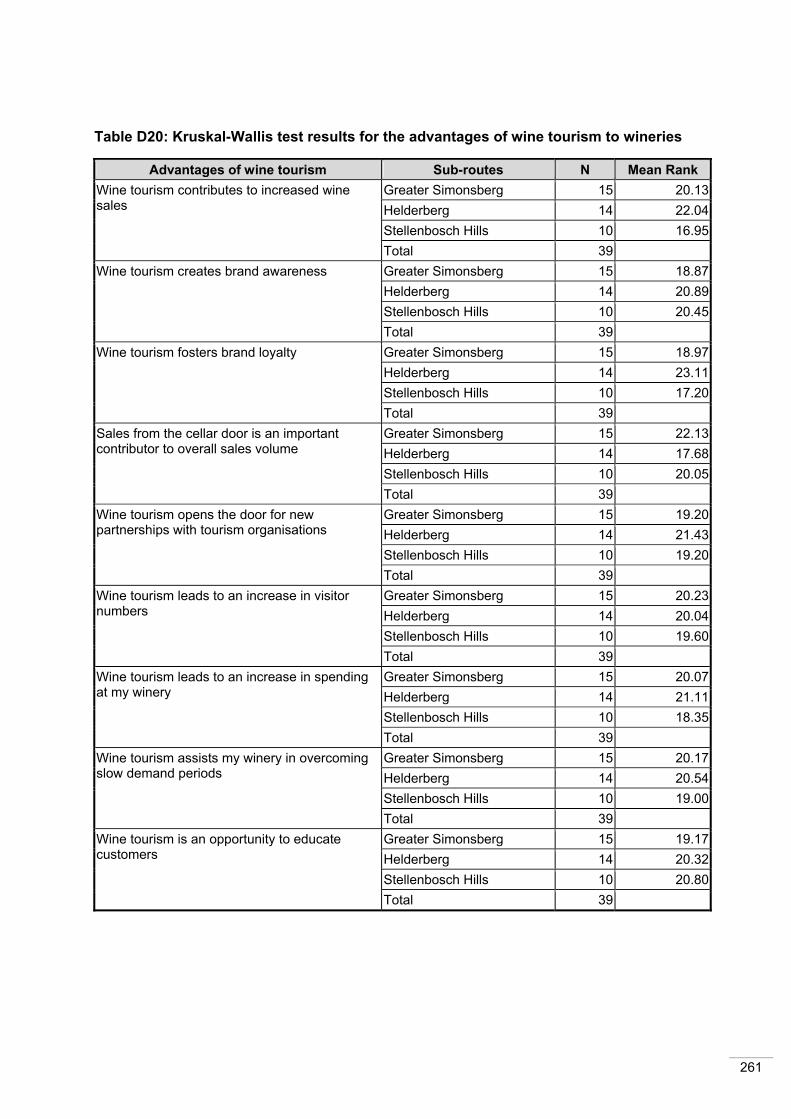
261
Table D20: Kruskal-Wallis test results for the advantages of wine tourism to wineries Advantages of wine tourism Sub-routes N Mean Rank
Wine tourism contributes to increased wine sales
Greater Simonsberg 15 20.13Helderberg 14 22.04Stellenbosch Hills 10 16.95Total 39
Wine tourism creates brand awareness
Greater Simonsberg 15 18.87Helderberg 14 20.89Stellenbosch Hills 10 20.45Total 39
Wine tourism fosters brand loyalty
Greater Simonsberg 15 18.97Helderberg 14 23.11Stellenbosch Hills 10 17.20Total 39
Sales from the cellar door is an important contributor to overall sales volume
Greater Simonsberg 15 22.13Helderberg 14 17.68Stellenbosch Hills 10 20.05Total 39
Wine tourism opens the door for new partnerships with tourism organisations
Greater Simonsberg 15 19.20Helderberg 14 21.43Stellenbosch Hills 10 19.20Total 39
Wine tourism leads to an increase in visitor numbers
Greater Simonsberg 15 20.23Helderberg 14 20.04Stellenbosch Hills 10 19.60Total 39
Wine tourism leads to an increase in spending at my winery
Greater Simonsberg 15 20.07Helderberg 14 21.11Stellenbosch Hills 10 18.35Total 39
Wine tourism assists my winery in overcoming slow demand periods
Greater Simonsberg 15 20.17Helderberg 14 20.54Stellenbosch Hills 10 19.00Total 39
Wine tourism is an opportunity to educate customers
Greater Simonsberg 15 19.17Helderberg 14 20.32Stellenbosch Hills 10 20.80Total 39
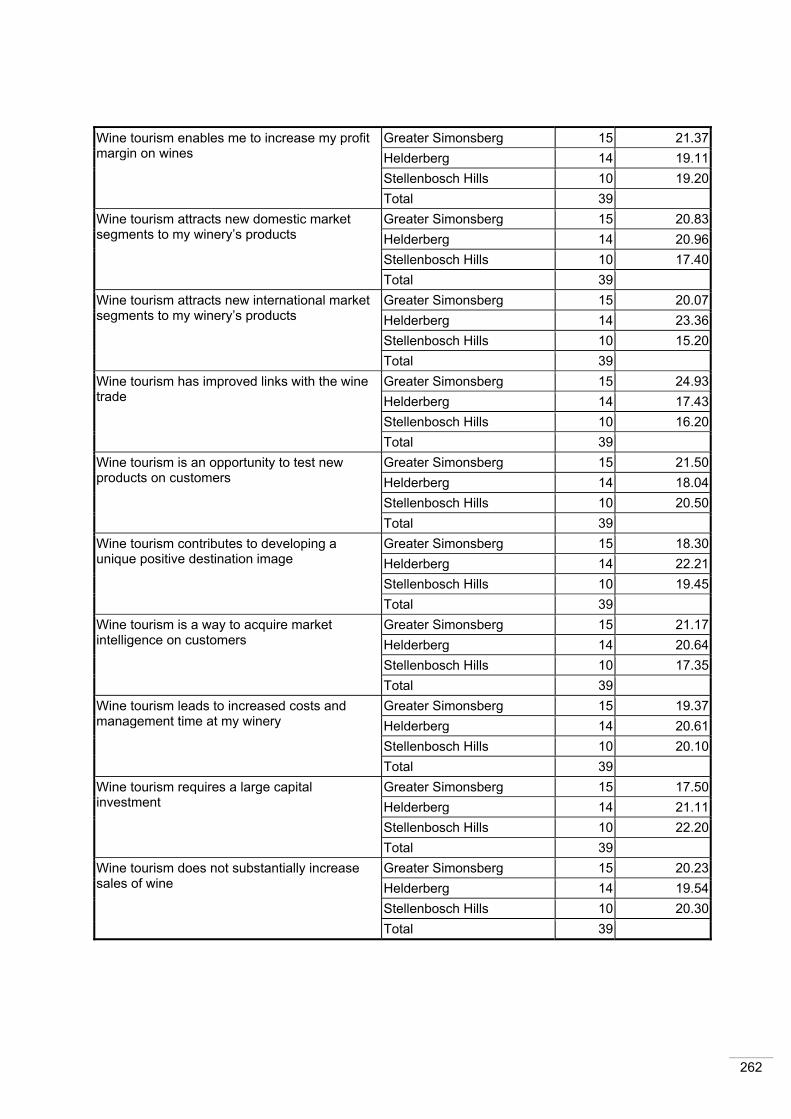
262
Wine tourism enables me to increase my profit margin on wines
Greater Simonsberg 15 21.37Helderberg 14 19.11Stellenbosch Hills 10 19.20Total 39
Wine tourism attracts new domestic market segments to my winery’s products
Greater Simonsberg 15 20.83Helderberg 14 20.96Stellenbosch Hills 10 17.40Total 39
Wine tourism attracts new international market segments to my winery’s products
Greater Simonsberg 15 20.07Helderberg 14 23.36Stellenbosch Hills 10 15.20Total 39
Wine tourism has improved links with the wine trade
Greater Simonsberg 15 24.93Helderberg 14 17.43Stellenbosch Hills 10 16.20Total 39
Wine tourism is an opportunity to test new products on customers
Greater Simonsberg 15 21.50Helderberg 14 18.04Stellenbosch Hills 10 20.50Total 39
Wine tourism contributes to developing a unique positive destination image
Greater Simonsberg 15 18.30Helderberg 14 22.21Stellenbosch Hills 10 19.45Total 39
Wine tourism is a way to acquire market intelligence on customers
Greater Simonsberg 15 21.17Helderberg 14 20.64Stellenbosch Hills 10 17.35Total 39
Wine tourism leads to increased costs and management time at my winery
Greater Simonsberg 15 19.37Helderberg 14 20.61Stellenbosch Hills 10 20.10Total 39
Wine tourism requires a large capital investment
Greater Simonsberg 15 17.50Helderberg 14 21.11Stellenbosch Hills 10 22.20Total 39
Wine tourism does not substantially increase sales of wine
Greater Simonsberg 15 20.23Helderberg 14 19.54Stellenbosch Hills 10 20.30Total 39
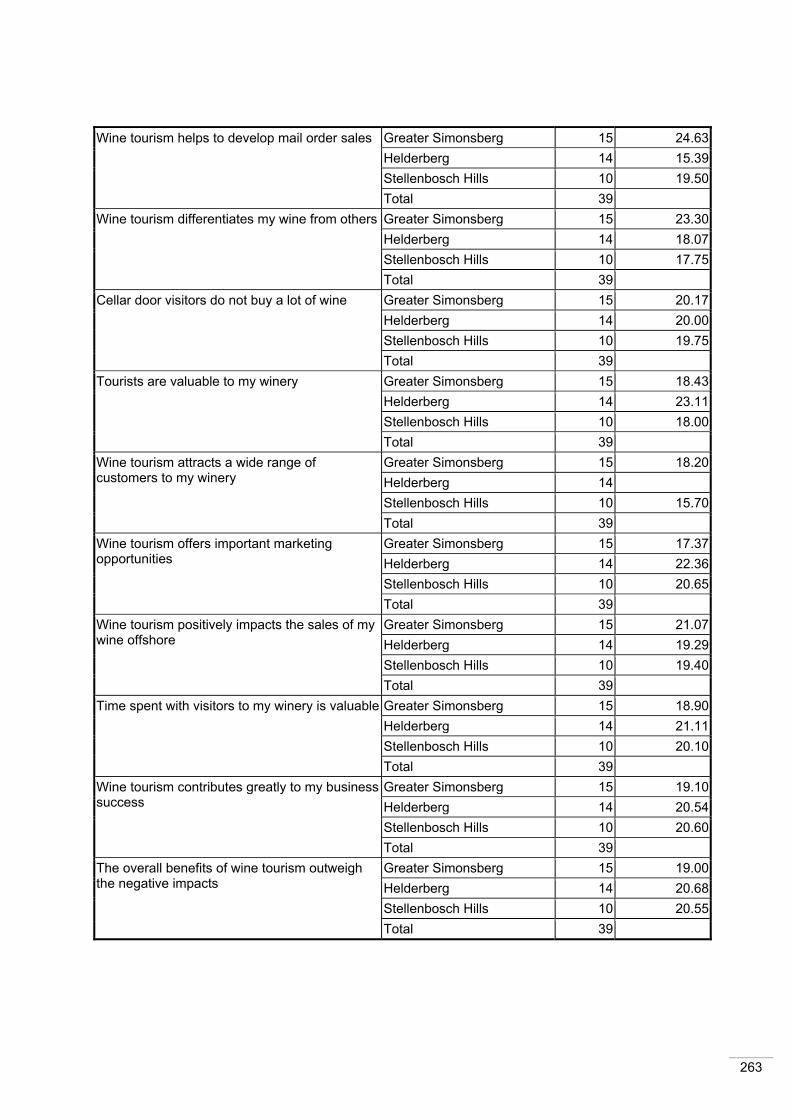
263
Wine tourism helps to develop mail order sales
Greater Simonsberg 15 24.63Helderberg 14 15.39Stellenbosch Hills 10 19.50Total 39
Wine tourism differentiates my wine from others
Greater Simonsberg 15 23.30Helderberg 14 18.07Stellenbosch Hills 10 17.75Total 39
Cellar door visitors do not buy a lot of wine
Greater Simonsberg 15 20.17Helderberg 14 20.00Stellenbosch Hills 10 19.75Total 39
Tourists are valuable to my winery
Greater Simonsberg 15 18.43Helderberg 14 23.11Stellenbosch Hills 10 18.00Total 39
Wine tourism attracts a wide range of customers to my winery
Greater Simonsberg 15 18.20Helderberg 14 Stellenbosch Hills 10 15.70Total 39
Wine tourism offers important marketing opportunities
Greater Simonsberg 15 17.37Helderberg 14 22.36Stellenbosch Hills 10 20.65Total 39
Wine tourism positively impacts the sales of my wine offshore
Greater Simonsberg 15 21.07Helderberg 14 19.29Stellenbosch Hills 10 19.40Total 39
Time spent with visitors to my winery is valuable Greater Simonsberg 15 18.90Helderberg 14 21.11Stellenbosch Hills 10 20.10Total 39
Wine tourism contributes greatly to my business success
Greater Simonsberg 15 19.10Helderberg 14 20.54Stellenbosch Hills 10 20.60Total 39
The overall benefits of wine tourism outweigh the negative impacts
Greater Simonsberg 15 19.00Helderberg 14 20.68Stellenbosch Hills 10 20.55Total 39
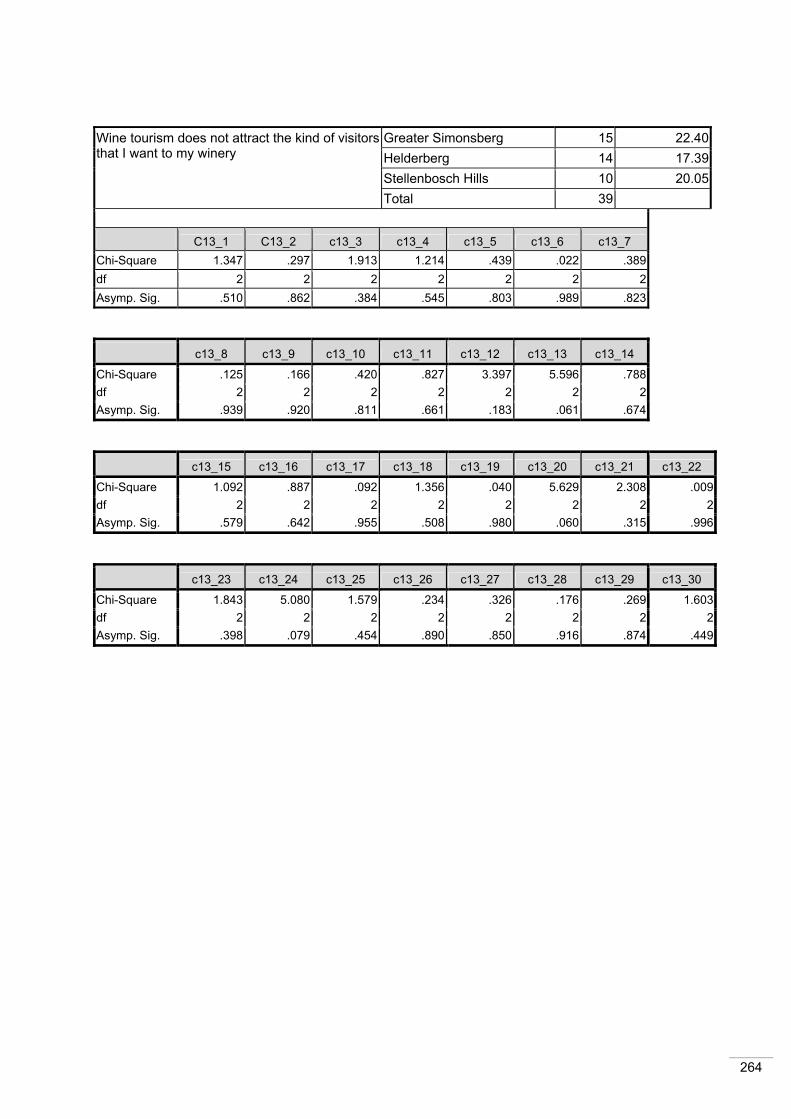
264
Wine tourism does not attract the kind of visitors that I want to my winery
Greater Simonsberg 15 22.40Helderberg 14 17.39Stellenbosch Hills 10 20.05Total 39
C13_1 C13_2 c13_3 c13_4 c13_5 c13_6 c13_7 Chi-Square 1.347 .297 1.913 1.214 .439 .022 .389 df 2 2 2 2 2 2 2 Asymp. Sig. .510 .862 .384 .545 .803 .989 .823
c13_8 c13_9 c13_10 c13_11 c13_12 c13_13 c13_14
Chi-Square .125 .166 .420 .827 3.397 5.596 .788 df 2 2 2 2 2 2 2 Asymp. Sig. .939 .920 .811 .661 .183 .061 .674
c13_15 c13_16 c13_17 c13_18 c13_19 c13_20 c13_21 c13_22
Chi-Square 1.092 .887 .092 1.356 .040 5.629 2.308 .009df 2 2 2 2 2 2 2 2Asymp. Sig. .579 .642 .955 .508 .980 .060 .315 .996
c13_23 c13_24 c13_25 c13_26 c13_27 c13_28 c13_29 c13_30
Chi-Square 1.843 5.080 1.579 .234 .326 .176 .269 1.603df 2 2 2 2 2 2 2 2Asymp. Sig. .398 .079 .454 .890 .850 .916 .874 .449

265
Table D21: Kruskal-Wallis test results for the different points of distribution of wine Points of distribution Sub-routes N Mean Rank
Cellar door sales Greater Simonsberg 15 17.73Helderberg 14 21.43Stellenbosch Hills 10 21.40Total 39
Wholesale
Greater Simonsberg 15 18.27Helderberg 14 22.43Stellenbosch Hills 10 19.20Total 39
Retail Greater Simonsberg 15 19.03Helderberg 14 24.00Stellenbosch Hills 10 15.85Total 39
Exporting Greater Simonsberg 15 21.43Helderberg 14 21.50Stellenbosch Hills 10 15.75Total 39
Own restaurant Greater Simonsberg 15 20.30Helderberg 14 21.25Stellenbosch Hills 10 17.80Total 39
Other restaurants Greater Simonsberg 15 19.93Helderberg 14 20.57Stellenbosch Hills 10 19.30Total 39
Mail order Greater Simonsberg 15 18.47Helderberg 14 23.61Stellenbosch Hills 10 17.25Total 39
Hotels and other accommodation establishments
Greater Simonsberg 15 20.47Helderberg 14 21.39Stellenbosch Hills 10 17.35Total 39
Embassies Greater Simonsberg 15 20.40Helderberg 14 20.14Stellenbosch Hills 10 19.20Total 39
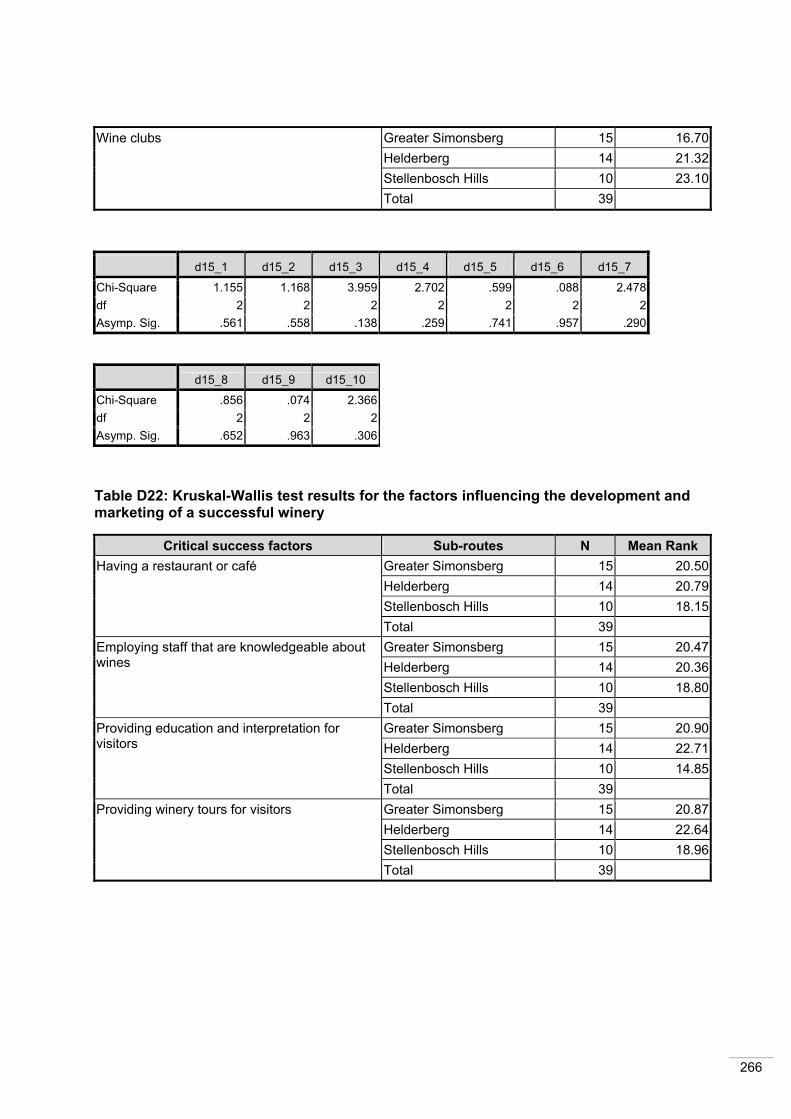
266
Wine clubs Greater Simonsberg 15 16.70Helderberg 14 21.32Stellenbosch Hills 10 23.10Total 39
d15_1 d15_2 d15_3 d15_4 d15_5 d15_6 d15_7
Chi-Square 1.155 1.168 3.959 2.702 .599 .088 2.478 df 2 2 2 2 2 2 2 Asymp. Sig. .561 .558 .138 .259 .741 .957 .290
d15_8 d15_9 d15_10
Chi-Square .856 .074 2.366df 2 2 2Asymp. Sig. .652 .963 .306
Table D22: Kruskal-Wallis test results for the factors influencing the development and marketing of a successful winery
Critical success factors Sub-routes N Mean Rank Having a restaurant or café Greater Simonsberg 15 20.50
Helderberg 14 20.79Stellenbosch Hills 10 18.15Total 39
Employing staff that are knowledgeable about wines
Greater Simonsberg 15 20.47Helderberg 14 20.36Stellenbosch Hills 10 18.80Total 39
Providing education and interpretation for visitors
Greater Simonsberg 15 20.90Helderberg 14 22.71Stellenbosch Hills 10 14.85Total 39
Providing winery tours for visitors Greater Simonsberg 15 20.87Helderberg 14 22.64Stellenbosch Hills 10 18.96Total 39

267
Accommodating large tour groups Greater Simonsberg 15 19.80Helderberg 14 18.71Stellenbosch Hills 10 22.10Total 39
Having the correct accreditation
Greater Simonsberg 15 16.63Helderberg 14 24.54Stellenbosch Hills 10 18.70Total 39
Producing and selling organic wines Greater Simonsberg 15 19.63Helderberg 14 22.93Stellenbosch Hills 10 16.45Total 39
Retailing both wine and other products Greater Simonsberg 15 20.00Helderberg 14 20.54Stellenbosch Hills 10 19.25Total 39
Providing wine appreciation opportunities Greater Simonsberg 15 25.32Helderberg 14 24.32Stellenbosch Hills 10 21.45Total 39
Hosting special events and functions Greater Simonsberg 15 17.93Helderberg 14 19.50Stellenbosch Hills 10 23.80Total 39
Having overnight accommodation on site Greater Simonsberg 15 19.77Helderberg 14 19.89Stellenbosch Hills 10 20.50Total 39
Having an attractive, well-designed winery Greater Simonsberg 15 21.30Helderberg 14 21.93Stellenbosch Hills 10 15.35Total 39
Good sign posting Greater Simonsberg 15 23.37Helderberg 14 21.50Stellenbosch Hills 10 12.85Total 39
Friendly, service oriented staff Greater Simonsberg 15 20.97Helderberg 14 20.54Stellenbosch Hills 10 17.80Total 39

268
d16_1 d16_2 d16_3 d16_4 d16_5 d16_6 d16_7
Chi-Square .412 .228 3.467 3.080 .562 4.039 2.628 df 2 2 2 2 2 2 2 Asymp. Sig. .814 .892 .177 .214 .755 .133 .269
d16_8 d16_9 d16_10 d16_11 d16_12 d16_13 d16_14
Chi-Square .081 6.673 1.844 .029 2.536 6.837 1.150 df 2 2 2 2 2 2 2 Asymp. Sig. .960 .036 .398 .986 .281 .033 .563
Table D23: Kruskal-Wallis test results for wine tourism and its relationship to brand equity
Wine tourism and brand equity Sub-routes N Mean Rank I can increase loyalty to my wine by exhibiting at a wine festival
Greater Simonsberg 15 16.77Helderberg 14 22.21Stellenbosch Hills 10 21.75Total 39
I can increase perceived quality of my wine by having an upmarket tasting room
Greater Simonsberg 15 20.40Helderberg 14 20.64Stellenbosch Hills 10 18.50Total 39
Consumers will make positive brand associations with my wine if I host a wine festival
Greater Simonsberg 15 19.37Helderberg 14 23.39Stellenbosch Hills 10 16.20Total 39
Sponsoring a music event helps create awareness of my brand
Greater Simonsberg 15 20.73Helderberg 14 20.07Stellenbosch Hills 10 18.80Total 39
Hosting a book club in my wine cellar helps create a positive association with my brand
Greater Simonsberg 15 18.07Helderberg 14 18.79Stellenbosch Hills 10 24.60Total 39
Being graded by the Wine Route Association increases the perceived quality of my wine
Greater Simonsberg 15 17.20Helderberg 14 22.46Stellenbosch Hills 10 20.75Total 39

269
A souvenir shop with several branded souvenirs (e.g. caps, hats, T-shirts) increases brand awareness of my winery
Greater Simonsberg 15 18.00Helderberg 14 22.64Stellenbosch Hills 10 19.30Total 39
Winery tasting fosters brand loyalty for my winery
Greater Simonsberg 15 21.80Helderberg 14 17.93Stellenbosch Hills 10 20.20Total 39
Celebrity endorsements increases the perceived quality of my wine
Greater Simonsberg 15 19.40Helderberg 14 18.43Stellenbosch Hills 10 23.10Total 39
Wine festivals increases positive brand associations with my wine
Greater Simonsberg 15 16.13Helderberg 14 24.46Stellenbosch Hills 10 19.55Total 39
Cinema and photography festivals increases positive brand associations with my wine
Greater Simonsberg 15 18.30Helderberg 14 20.29Stellenbosch Hills 10 22.15Total 39
Festivals help create brand awareness of my winery
Greater Simonsberg 15 16.27Helderberg 14 23.21Stellenbosch Hills 10 21.10Total 39
d21_1 d21_2 d21_3 d21_4 d21_5 d21_6 d21_7
Chi-Square 2.252 .268 2.786 .193 2.488 1.791 1.480 df 2 2 2 2 2 2 2 Asymp. Sig. .324 .875 .248 .908 .288 .408 .477
d21_8 d21_9 d21_10 d21_11 d21_12
Chi-Square 1.151 1.185 4.299 .828 3.386df 2 2 2 2 2Asymp. Sig. .562 .553 .117 .661 .184