THE INFLUENCE OF ASSORT MENT OF BEER ON THEIR …
18
STUDIA UBB CHEMIA, LXVI, 2, 2021 (p. 23-40) (RECOMMENDED CITATION) DOI:10.24193/subbchem.2021.2.02 THE INFLUENCE OF ASSORTMENT OF BEER ON THEIR ANTIOXIDANT / PRO-OXIDANT CAPACITY AND PHENOLIC FINGERPRINT CLAUDIA CIMPOIU a,b* , ANCA MILNA a , VIRGIL DANCIU a , ANAMARIA HOSU a,b ABSTRACT. Different assortments of beers, packed in cans and bottles, exist on the market. Beer has a complex and balanced composition, phenolic compounds being one class of bioactive constituents that are of particular interest due to their essential role in the brewing process, physical stability and aroma of this beverage. The aim of this paper is to integrate antioxidant and pro-oxidant evaluation, total phenolic content (TPC) determination, chromatographic fingerprinting and chemometric methods in order to study the influence of the variety and the packing type for beer assortment recognition. The antioxidant capacity evaluation was done by 2,2-azinobis(3- ethylbenzothiazolyne-6-sulphonic acid) radical cation (ABTS) assay and Folin-Ciocalteu method was used and to determine the TPC. Thin-layer chromatography (TLC) and high performance liquid chromatography (HPLC) were applied to obtain the fingerprints of beers. The results show that antioxidant and pro-oxidant capacities, the TPC and the chromatographic fingerprints were influenced by the packing type, the assortment, the alcoholic content and the colour of beer. Principal component analysis and cluster analysis were applied to study the influence of the variety and bottling type of beers on their characteristics. The results demonstrate that by integrating various methods the classification of beers based on their assortment was enable. Keywords: antioxidant capacity, pro-oxidant capacity, phenolics fingerprint, beer assortment, TLC,HPLC, PCA, cluster analysis a Babeş-Bolyai University, Faculty of Chemistry and Chemical Engineering, 11 Arany Janos str., RO-400028, Cluj-Napoca, Romania b Research Center for Advanced Chemical Analysis, Instrumentation and Chemometrics, 11 Arany Janos, 400028 Cluj-Napoca, Romania * Corresponding author e-mail: [email protected]
Transcript of THE INFLUENCE OF ASSORT MENT OF BEER ON THEIR …

STUDIA UBB CHEMIA, LXVI, 2, 2021 (p. 23-40) (RECOMMENDED CITATION) DOI:10.24193/subbchem.2021.2.02
THE INFLUENCE OF ASSORTMENT OF BEER ON THEIR ANTIOXIDANT / PRO-OXIDANT CAPACITY AND
PHENOLIC FINGERPRINT
CLAUDIA CIMPOIUa,b*, ANCA MILNAa, VIRGIL DANCIUa, ANAMARIA HOSUa,b
ABSTRACT. Different assortments of beers, packed in cans and bottles, exist on the market. Beer has a complex and balanced composition, phenolic compounds being one class of bioactive constituents that are of particular interest due to their essential role in the brewing process, physical stability and aroma of this beverage. The aim of this paper is to integrate antioxidant and pro-oxidant evaluation, total phenolic content (TPC) determination, chromatographic fingerprinting and chemometric methods in order to study the influence of the variety and the packing type for beer assortment recognition. The antioxidant capacity evaluation was done by 2,2-azinobis(3- ethylbenzothiazolyne-6-sulphonic acid) radical cation (ABTS) assay and Folin-Ciocalteu method was used and to determine the TPC. Thin-layer chromatography (TLC) and high performance liquid chromatography (HPLC) were applied to obtain the fingerprints of beers. The results show that antioxidant and pro-oxidant capacities, the TPC and the chromatographic fingerprints were influenced by the packing type, the assortment, the alcoholic content and the colour of beer. Principal component analysis and cluster analysis were applied to study the influence of the variety and bottling type of beers on their characteristics. The results demonstrate that by integrating various methods the classification of beers based on their assortment was enable.
Keywords: antioxidant capacity, pro-oxidant capacity, phenolics fingerprint, beer assortment, TLC, HPLC, PCA, cluster analysis
a Babeş-Bolyai University, Faculty of Chemistry and Chemical Engineering, 11 Arany Janos str., RO-400028, Cluj-Napoca, Romania
b Research Center for Advanced Chemical Analysis, Instrumentation and Chemometrics, 11 Arany Janos, 400028 Cluj-Napoca, Romania
* Corresponding author e-mail: [email protected]

CLAUDIA CIMPOIU, ANCA MILNA, VIRGIL DANCIU, ANAMARIA HOSU
24
INTRODUCTION Beer is one of the most commonly consumed alcoholic beverages all
over the world. The basic ingredients of beer are water, malt, hop and yeast. Therefore, their characteristics together with the brewing technologies are of major importance on beer quality [1]. Beer has a complex and balanced composition and compared with other popular natural alcoholic beverages, including wine, beer has a higher nutritional value given by minerals, amino acids, vitamins, carbohydrates and antioxidants [2]. Moreover, it has a low carbohydrate contents and fewer calories and it does not contain any fat [3].
Considering the great number of beer manufacturers, different criteria such as: the fermentation process (top or bottom fermentation), the color (dark or light), the alcohol content (light or strong), the type of added materials, the origin, etc. could be used for the categorization of beers [4]. Regardless of its type, any beer must satisfy some quality requirements: microbial, flavor, colloidal and foam stability [5]. The main factor affecting the taste and aroma of beer is the presence of oxygen, which is unavoidable despite the filling developed technologies. Antioxidant compounds play an important role in maintaining and extending the stability of beer by reducing the effects of oxidation processes. Therefore, beside the antioxidant compounds which naturally exist in beer, others (ascorbic acid, vitamin E) are sometimes added [6]. The main endogenous antioxidants of beer are phenolic compounds and melanoidins. Melanoidins and precursors of natural polyphenols may also have pro-oxidant properties by involving them in the process of oxidation of alcohols to aldehydes during the storage of beer [7]. Phenolic compounds are derived from malt (70–80%) and hop (20–30%), and include mainly simple phenols, benzoic- and cinnamic acid derivatives, coumarins, catechins, di-, tri- and oligomeric proanthocyanidins, chalcones and various flavonoids [8]. Melanoidins are Maillard reaction products, formed during the malting and brewing process, their content being higher in dark beers than in the light ones [9]. The endogenous antioxidants from beer are of major interest not only for brewers, in order to produce qualitative beer, but also for the nutritionists because they are important bioactive compounds with implications in maintaining and ensuring of human health. This is due to the fact that they have biological activities such as: antioxidant effect, anti-inflammatory action, anti-cancer activity, estrogen antagonistic properties, etc. [8]. Therefore, the moderate consumption of beer is associated with lower incidence of cancer, degenerative and cardiovascular diseases and osteoporosis [2,8].

THE INFLUENCE OF ASSORTMENT OF BEER ON THEIR ANTIOXIDANT / PRO-OXIDANT …
25
The analysis of phenolics from beverages can be approached from two different perspectives: the determination of the total phenolic content which is a global assay and the identification and determination of individual phenolic constituents, thus establishing the phenolic profile of a sample. TPC is usually determined by colorimetric methods, based on the reaction between phenolics and different reagents, the commonly used method being the Folin-Ciocalteu assay. An important aspect that must be considered when Folin-Ciocalteu method is applied is that it is not specific for phenolics, these compounds interfering with others with reducing activity (e.g., proteins, Maillard reaction products, sulphite, etc.) [10,11]. Therefore, obtaining the phenolic profile is of major interest. For this purpose, in case of plants or beverage analysis, high performance thin layer chromatography (HPTLC) is often applied [12-14]. Literature shows that only one application of TLC was reported in analysis of beer [15], high performance liquid chromatography (HPLC) with UV [16,17], photodiode array [18-20], electrochemical [21-23] and mass spectrometry [24,25] detection being the most frequent applied technique in order to obtain the phenolic profiles of beers [26,27].
The phenolic content of beer is usually correlated with the antioxidant capacity, which could be determined spectrophotometricaly by various assays based on different reaction mechanisms: electron transfer (ET) of a reduction reaction and hydrogen atoms transfer (HAT). The first mechanism is involved in trolox equivalent antioxidant capacity (TEAC), ferric-ion reducing antioxidant parameter (FRAP), trolox equivalent antioxidant capacity (DPPH), and cupric reducing antioxidant capacity (CUPRAC) assays, the other one being applied in oxygen radical absorbance capacity (ORAC) and total radical trapping antioxidant parameter (TRAP) assays [28]. Also, different constituents of beer with antioxidant activity, such as phenolic compounds and melanoidins, might exhibit pro-oxidant activity in combination with transition metal ions (especially reduced iron and copper ions) involved in the generation of reactive oxygen species which cause the oxidative degradation of beer [29]. Although the pro-oxidant capacity could be evaluated by spectrophotometric measurements, usually by indirect methods [30,31], their application in beer analysis has not been described so far.
Considering the complexity of beer composition and its activities and the fact that from our knowledge there is a lack of information in this direction about beers, the aim of this paper is to study the influence of beer assortments on the antioxidant and pro-oxidant activities, total phenolic content. Also, by integrating spectrophotometric measurements, chromatographic fingerprinting and chemometric evaluation of data a new possibility of beer recognition was obtained.

CLAUDIA CIMPOIU, ANCA MILNA, VIRGIL DANCIU, ANAMARIA HOSU
26
RESULTS AND DISCUSSION Spectrophotometric determinations, TLC and HPLC methods were
applied in the analysis of five different types of beer, each packed in glass bottles and cans, in order to evaluate the influence of assortment on the antioxidant/ pro-oxidant capacities, on phenolic constituents and on the chromatographic fingerprintings of beer.
All the experimental results obtained by spectrophotometric measurements are presented in Table 1.
Table 1. The antioxidant and pro-oxidant capacities and total phenolic
content of analyzed beers.
Beer type Antioxidant capacity
(mg vit C/mL)
Pro-oxidant capacity TPC (mg gallic acid/mL) Equation R2 mL
Premium (1) B 0.776±0.012 y=1.7661x+0.2277 0.9732 0.437±0.004 1.211±0.003
C 0.815±0.010 y=2.0499x+0.2433 0.9865 0.369±0.002 1.366±0.001
Non-alcoholic (2)
B 0.637±0.009 y=0.8723x+0.0884 0.9858 0.745±0.002 0.656±0.008
C 0.782±0.011 y=1.4923x+0.1843 0.9979 0.447±0.003 0.734±0.007
Non-alcoholic Cooler (3)
B 0.859±0.007 y=3.3848x+0.0031 0.9995 0.295±0.002 0.556±0.013
C 0.943±0.009 y=3.6513x+0.2185 0.9916 0.214±0.003 0.585±0.009
Cooler (4) B 1.443±0.013 y=2.4624x+0.1567 0.9904 0.342±0.005 0.751±0.005
C 1.471±0.009 y=2.8173x+0.1832 0.9907 0.290±0.002 0.790±0.006
Black (5) B 1.243±0.011 y=5.3766x+0.1985 0.9903 0.149±0.001 1.431±0.011
C 1.359±0.008 y=5.9372x+0.2239 0.9884 0.131±0.002 1.640±0.009
1. Antioxidant and pro-oxidant capacities Antioxidant capacity of different types of beer was determined using
the ABTS assay that measure the ability of antioxidant compounds to act as free radical scavenger agents, in comparison with different standard compounds, such as Trolox, gallic acid, vitamin C [3]. The obtained results presented in Table 1 exhibit that Cooler beers containing alcohol (4), packaged both in bottle (B) or can (C) have the highest antioxidant capacities (1.443 mg vit C/ mL and 1.471 mg vit C/ mL, respectively) followed by the Black beer (5) whose antioxidant capacities are 1.243 mg vit C/ mL in the bottle beer (B) and 1.359 mg vit C/ mL in the can (C) one. The lowest antioxidant capacities are obtained for non- alcoholic beers (2), the values being about 2 times smaller than those of Cooler beers containing alcohol (4) ones. The fact that Cooler beers

THE INFLUENCE OF ASSORTMENT OF BEER ON THEIR ANTIOXIDANT / PRO-OXIDANT …
27
have the highest antioxidant capacities can be explained by their composition, because they contain lemon juice, orange juice and ascorbic acid added to prevent the oxidative degradation and to improve their flavor stability, compounds which are known to exhibit high antioxidant activities [6]. Moreover, the Cooler beer (4) contain alcohol (1.9%), which makes their antioxidant capacity higher compared to non-alcoholic beers (2) and even with non-alcoholic Cooler beers (3), whose antioxidant capacities are more than 1.5 times smaller, even if except alcohol, they have the same composition as the last ones. Also, Black beer (5), which have the highest alcohol contents, exert the highest antioxidant capacities among alcoholic beers (1, 4 and 5), while non-alcoholic ones (2) have the lowest antioxidant capacities, showing that the antioxidant capacities increases with the increasing of alcohol content. These findings are in agreement with those reported in literature [3,11,32]. Another remark is that for all the analyzed samples, the antioxidant capacity of can beers are higher than those of bottled beers, maybe due to the packing type, because metallic materials from packing systems such cans preserve the quality of beverages, due to its potential action against reactive oxygen species [33]. Statistical analysis proves that the antioxidant capacity of beer is significantly influenced (p<0.05) by the packing mode (p=0.0268) and by the assortment (p = 0.0006), respectively. Also, antioxidant capacity is also influenced by the color of beer. Thus, in the case of Black beer (5), higher antioxidant capacity is observed than in normal colored beers (1, 2). These results are according to other data presented in literature, showing that raw materials such as dark malt which contains melanoidins and reductones formed in kilning or roasting processes, together with the brewing process might have considerable impacts on the antioxidant capacity of beer [11,26].
The experimental results (Table 1) illustrate that pro-oxidant capacities follow an opposite trend to antioxidant capacities, thus the highest value is exhibited by the non-alcoholic beer packed in glass bottle (0.745 mL) (2, 3), while the can of Black beer have the lowest pro-oxidant capacity (0.131 mL). Also, Cooler beers (3, 4) exhibit pro-oxidant capacities lower than those of beers which does not contain lemonade. It can be observed that irrespective of type, beers packed in glass bottle have higher pro-oxidant capacities than those from cans. Statistical analysis proves that the pro-oxidant capacity of beer is significantly influenced (p < 0.05) by the packing type (p=0.000003) and by the assortment (p=0.000025). From our knowledge, other data regarding the determination of the pro-oxidant capacity of beers have not been reported in literature so far.
2. Total phenolic content (TPC) The results (Table 2) show that considerable differences in the TPC values
of the analyzed beers are obtained, varying from 0.556 mg gallic acid/ mL in non-alcoholic Cooler beer packed in glass bottle to 1.640 mg gallic acid/ mL in can
CLAUDIA CIMPOIU, ANCA MILNA, VIRGIL DANCIU, ANAMARIA HOSU
28
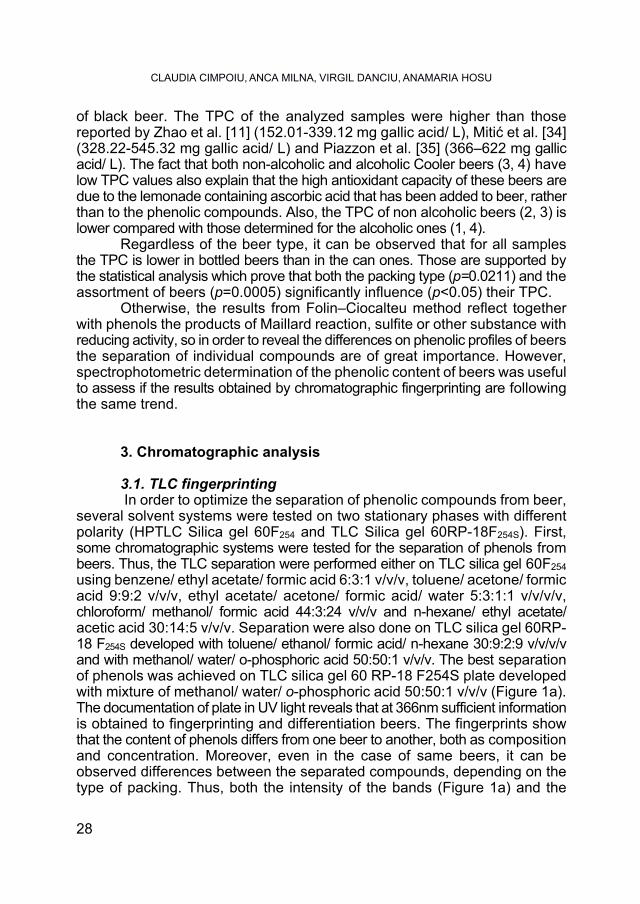
of black beer. The TPC of the analyzed samples were higher than those reported by Zhao et al. [11] (152.01-339.12 mg gallic acid/ L), Mitić et al. [34] (328.22-545.32 mg gallic acid/ L) and Piazzon et al. [35] (366–622 mg gallic acid/ L). The fact that both non-alcoholic and alcoholic Cooler beers (3, 4) have low TPC values also explain that the high antioxidant capacity of these beers are due to the lemonade containing ascorbic acid that has been added to beer, rather than to the phenolic compounds. Also, the TPC of non alcoholic beers (2, 3) is lower compared with those determined for the alcoholic ones (1, 4).
Regardless of the beer type, it can be observed that for all samples the TPC is lower in bottled beers than in the can ones. Those are supported by the statistical analysis which prove that both the packing type (p=0.0211) and the assortment of beers (p=0.0005) significantly influence (p<0.05) their TPC.
Otherwise, the results from Folin–Ciocalteu method reflect together with phenols the products of Maillard reaction, sulfite or other substance with reducing activity, so in order to reveal the differences on phenolic profiles of beers the separation of individual compounds are of great importance. However, spectrophotometric determination of the phenolic content of beers was useful to assess if the results obtained by chromatographic fingerprinting are following the same trend.
3. Chromatographic analysis
3.1. TLC fingerprinting In order to optimize the separation of phenolic compounds from beer,
several solvent systems were tested on two stationary phases with different polarity (HPTLC Silica gel 60F254 and TLC Silica gel 60RP-18F254S). First, some chromatographic systems were tested for the separation of phenols from beers. Thus, the TLC separation were performed either on TLC silica gel 60F254 using benzene/ ethyl acetate/ formic acid 6:3:1 v/v/v, toluene/ acetone/ formic acid 9:9:2 v/v/v, ethyl acetate/ acetone/ formic acid/ water 5:3:1:1 v/v/v/v, chloroform/ methanol/ formic acid 44:3:24 v/v/v and n-hexane/ ethyl acetate/ acetic acid 30:14:5 v/v/v. Separation were also done on TLC silica gel 60RP-18 F254S developed with toluene/ ethanol/ formic acid/ n-hexane 30:9:2:9 v/v/v/v and with methanol/ water/ o-phosphoric acid 50:50:1 v/v/v. The best separation of phenols was achieved on TLC silica gel 60 RP-18 F254S plate developed with mixture of methanol/ water/ o-phosphoric acid 50:50:1 v/v/v (Figure 1a). The documentation of plate in UV light reveals that at 366nm sufficient information is obtained to fingerprinting and differentiation beers. The fingerprints show that the content of phenols differs from one beer to another, both as composition and concentration. Moreover, even in the case of same beers, it can be observed differences between the separated compounds, depending on the type of packing. Thus, both the intensity of the bands (Figure 1a) and the

THE INFLUENCE OF ASSORTMENT OF BEER ON THEIR ANTIOXIDANT / PRO-OXIDANT …
29
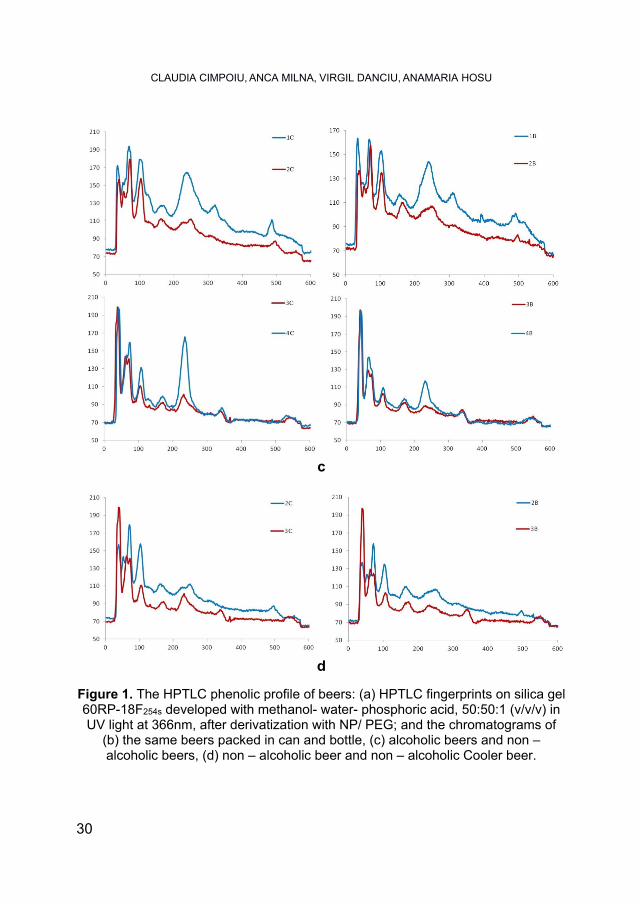
chromatograms (Figure 1b) reveal that the content of phenols is higher in case of can beers (C) than in the case of bottle beers (B). Also, the both non-alcoholic and alcoholic Cooler beers (3 and 4) contain specific compounds that are not detected in all the other beers and may be derived from the lemonade. Another remark is that the beers containing alcohol have higher phenolic content than those without alcohol (Figure 1a and 1c). One unpredictably observation is that, though non-alcoholic Cooler beer (3) contains lemonade, it has a lower phenolic content than the non-alcoholic beer (2) (Figure 1d).
a
b
CLAUDIA CIMPOIU, ANCA MILNA, VIRGIL DANCIU, ANAMARIA HOSU
30
c
d
Figure 1. The HPTLC phenolic profile of beers: (a) HPTLC fingerprints on silica gel 60RP-18F254s developed with methanol- water- phosphoric acid, 50:50:1 (v/v/v) in UV light at 366nm, after derivatization with NP/ PEG; and the chromatograms of
(b) the same beers packed in can and bottle, (c) alcoholic beers and non – alcoholic beers, (d) non – alcoholic beer and non – alcoholic Cooler beer.

THE INFLUENCE OF ASSORTMENT OF BEER ON THEIR ANTIOXIDANT / PRO-OXIDANT …
31
This may be due to the fact that non-alcoholic Cooler beer contain only 40% of non-alcoholic beer and 60% of lemonade, the latter having a not- too-high phenolic content. All these findings are in concordance with the spectrophotometric obtained results (Table 2).
3.2. HPLC fingerprinting Different gradients of mobile phase were tested to find the used one,
which allowed obtaining the HPLC fingerprints of beers samples with a relatively high amount of information. It is found mainly in the elution time window between 4 min and 13 min, which represents the most characteristic part of the fingerprint (Figure 2).
Figure 2. The HPLC chromatograms of beers.

CLAUDIA CIMPOIU, ANCA MILNA, VIRGIL DANCIU, ANAMARIA HOSU
32
The HPLC fingerprints show that that the absorption intensity and the number of the chromatographic peaks differ from one sample to another, depending on the assortment of beer and on the type of bottling. Visually the fingerprints reveal similar chromatographic profiles and from the twenty-eight chromatographic peaks obtained, fourteen of them could be identified as common peaks in almost all beer samples (Table 2).
Table 2. The areas of the HPLC chromatographic peaks of the analyzed beers.
Comp Beer
1C 1B 2C 2B 3C 3B 4C 4B 5C 5B 1 nd nd nd nd nd nd nd nd 1377 1391 2 nd nd nd nd 980.6 991.8 1099 1134 nd nd 3 1899 1093 1872 1789 nd nd nd nd 570.9 544.6 4 505.4 299.7 565.9 549.3 nd nd nd nd 411.5 336.8 5 nd nd nd nd 5449 5862 5371 6188 nd nd 6 568.2 561.9 668.0 359.0 350.5 254.8 nd nd 322.4 366.5 7 779.9 463.1 420.3 341.1 207.5 203.2 203.2 208.3 1153 1138 8 1029 845.5 245.1 190.0 112.5 95.7 331.2 395.3 1134 1107 9 4733 3780 2125 1974 991.5 979.2 1534 1623 4787 4701
10 nd 98.67 nd nd nd nd 72.18 63.87 nd nd 11 869.5 1315 236.8 255.3 178.8 182.9 301.2 380.0 770.6 808.9 12 645.6 732.9 195.9 176.7 81.2 49.8 nd 109.2 573.0 436.3 13 nd 78.3 54.8 48.9 57.1 48.3 53.2 44.6 145.1 159.9 14 7140 6507 3302 3284 1521 1565 2574 2620 6556 6501 15 232.0 316.4 87.7 50.6 nd nd nd nd 190.9 192.8 16 nd nd 77.2 62.6 nd nd nd nd 423.5 504.9 17 901.1 778.0 369.2 357.4 174.0 170.5 272.9 301.7 958.2 1046 18 209.0 164.2 78.3 76.6 42.4 32.9 67.8 72.6 1980 1936 19 nd nd nd nd 60.3 63.4 91.2 38.8 nd nd 20 118.8 65.5 nd nd nd nd nd nd nd nd 21 nd nd nd nd nd nd nd nd 561.7 628.5 22 797.0 825.1 468.3 432.8 213.9 201.6 206.5 235.5 911.8 838.3 23 79.2 72.1 51.0 46.8 nd nd nd nd 316.8 349.5 24 239.7 179.7 72.6 68.1 46.1 51.6 87.6 83.6 328.1 357.1 25 235.1 186.2 56.5 51.2 30.1 32.8 75.4 80.2 351.1 291.2 26 nd nd nd nd nd nd 91.9 87.8 nd nd 27 83.6 81.1 57.1 49.7 30.2 26.6 35.4 32.3 109.1 117.8 28 196.1 178.0 103.2 119.6 131.8 102.8 91.0 116.2 557.5 620.8

THE INFLUENCE OF ASSORTMENT OF BEER ON THEIR ANTIOXIDANT / PRO-OXIDANT …
33
The obtained chromatograms indicate that there are compounds which are characteristic for each beer assortment. Compound 20 is specific for Premium beers (1), compound 1 and 21 are only found in Black beers (5), having a higher concentration in bottled beer than in can one, and also compound 26 is present in Cooler beers (4). In the first part of the chromatogram, until minute 6, compounds 2 and 5 can be observed in beer samples containing lemon juice (3 and 4), with peak areas of approximate 1000mAU and 5500mAU, respectively, which may occur from the lemonade added in beer. Compounds 3 and 4 are found in Premium (1), non-alcoholic (2) and black (5) beer samples, but they are not present in beers containing lemonade (3 and 4). Also, compound 23 is not present in alcoholic and non-alcoholic Cooler beers (3 and 4) and has a high concentration in black beers (5). Moreover, compound 10 is only found in Premium beer packaged in bottle (1B) and in Cooler beers (4).
Significant differences among the contents of the same compounds were observed in different beer assortments, for example, the highest area of compound 14 was 7140mAU in sample 1C and the lowest 1521mAU in sample 3C. Also, compounds 22, 24 and 25 are common in all beers with the highest areas in black beer (5) and lowest in non alcoholic Cooler beer (3). Compounds 27 and 28 are found in all beer samples with highest concentration in black beer (5) and the lowest ones in non-alcoholic and alcoholic Cooler beer 3 and 4, respectively.
The chromatograms of the same beer packaged in glass bottle and in can indicate that, whatever type of beer is considered, the area of almost all chromatographic peaks are higher in case of can beer than in the bottle one. This finding is in concordance with the results obtained both from TLC analysis and also by spectrophotometric determination of TPC (Table 1). There are some differences between samples of the same beer, for example, compounds 10 and 13 being found in sample 1C, but not in sample 1B. Also, the compound 12 is found in all samples, including 4B but it is not present in sample 4C. Moreover, for all types of beer the concentration of compound 14 is higher in can beers than in bottle ones, with the exception of Cooler beers (3, 4), when its concentration is higher in bottle beer (B) than in the can one (C). Compounds 8 and 11 are found in all beer types with lower areas in non-alcoholic beers (2, 3) and lower areas in bottled beers (B) than in can ones (C), with exception of Black beers in which these compounds are in higher concentrations in can beer (C) than in bottle one (B).
4. Statistical analysis First, PCA and CA were applied separately on data from TLC and from
HPLC, but the results show that the beers cannot be classified according to their type only by a single fingerprint. Therefore, it is expected that the use

CLAUDIA CIMPOIU, ANCA MILNA, VIRGIL DANCIU, ANAMARIA HOSU
34
of data both from the digitized TLC chromatograms and the areas of major peaks from LC chromatograms together with spectrophotometric data in one statistical analysis allow a better classification of beers as a result of the large number of variables.
The PCA of the combined data matrix (676 pixels/row for 10 samples) was performed in order to classify the beers according to their type. It can be seen from the Figure 3 that first two principal components retain a cumulative variance of 93.15% making a clear distinction and classification of beers according to their type.
Figure 3. The classification of beers obtained by PC1-PC2 scores plot
Also, the data were subjected to cluster analysis (CA) in order to establish the relationships between beers without using any prior information about these relationships. The samples were grouped according to their similarities using as a clustering criterion Ward’s method with Square Euclidian distance as a measure interval between groups. The obtained classification is illustrated by a dendrogram (Figure 4) in which the beers have similar properties within a cluster and different proprieties between clusters.

THE INFLUENCE OF ASSORTMENT OF BEER ON THEIR ANTIOXIDANT / PRO-OXIDANT …
35
Euclidean distances
0 1000 2000 3000 4000 5000 6000
Linkage Distance
4B
4C
3B
3C
2B
2C
5B
5C
1B
1C
Figure 4. The classification of beers obtained by cluster analysis. CONCLUSIONS
The results reveal that the antioxidant/ pro-oxidant capacities, the
TPC and the chromatographic fingerprints of the analyze beers depend on the assortment, the bottling type, the alcoholic content and the color of the beer. The antioxidant capacity and the TPC follow the same trend in all samples, excepting the Cooler beers, which have high antioxidant capacities but low TPC values, proving that the added lemonade does not improve the phenolic profile of the beer. This fact is also sustained by TLC and HPLC results. The determination of the pro-oxidant capacity of beers is reported for the first time, and the obtained results have an opposite trend than the antioxidant capacities.
The obtained TLC and HPLC fingerprints reveals similar chromatographic profiles, some compounds being present in all beer samples and other being specific for each type of beer. The chromatographic data obtained by two different techniques provide complementary information that allows reliable differentiation of beers. The PCA and CA are successfully used in distinguishing the beers according to their type. The integrated spectrophotometric, chromatographic and chemometric methods enable to study the influence of the type of beers on their properties and to recognize the beer. Moreover, this type of approach can be useful for classification and a further authentication of the beer.

CLAUDIA CIMPOIU, ANCA MILNA, VIRGIL DANCIU, ANAMARIA HOSU
36
EXPERIMENTAL SECTION
1. Reagents and chemicals All solvents used were of HPLC grade, acetonitrile, methanol,
phosphoric acid and formic acid were purchased from Merck (Darmstadt, Germany) Diphenylborinic acid aminoethylester, polyethylene glycol 400 (macrogol), sodium carbonate (Na2CO3), 2,2’-azinobis(3-ethylbenzothiazoline-6-sulfonic acid) diammonium salt (ABTS), potassium persulfate (K2S2O8), potassium ferricyanide, trichloroacetic acid, iron chloride (FeCl3), Folin Ciocalteu reagent, gallic acid, vitamin C, ethyl acetate, dichloromethane, toluene, chloroform, ethanol, n-hexane, acetic acid, and the chromatographic plates (TLC Silica gel 60F254 and TLC Silica gel 60RP-18 F254S) having the size of 20X10 cm were purchased from Merck (Darmstadt, Germany).
The dipping solutions for TLC analysis were prepared as follow: 1 g of diphenylborinic acid aminoethylester was dissolved in 200 mL ethyl acetate for Natural Products (NP) solution and 10 g of polyethylene glycol 400 was dissolved in 200 mL dichloromethane for polyethylene glycol (PEG) solution.
2. Samples Five commercial beers, namely Premium (1), Non-alcoholic (2),
Cooler non-alcoholic (3), Cooler (4) and Black (5), each packed in glass bottle (B) and can (C), produced by Ursus Breweries were obtained from the local market, stored in refrigerator at 4°C and analyzed immediately upon opening to avoid loss of phenols by oxidation. The ingredients of beers, as they are declared by the producer on the label, are presented in Table 3.
Table 3. The characteristic and ingredients of the analyzed beers. Beer
assortment Ingredients Alcohol
content (%, v/v)
Premium (1) water, barley malt, hop 5 Non-alcoholic (2) water, barley malt, hop 0
Non-alcoholic Cooler (3)
60% lemonade (water, sugar, lemon juice from concentrate (3%), orange juice from concentrate, natural lemon flavor, natural orange flavor, natural, ascorbic acid,
carruba seed gum) and 40% non-alcoholic beer from malt (water, barley malt, hop)
0
Cooler (4) 60% lemonade (water, sugar, lemon juice from concentrate (3%), orange juice from concentrate, natural lemon flavor, natural orange flavor, natural, ascorbic acid,
carruba seed gum) and 40% beer from malt (water, barley malt, hop)
1.9
Black (5) water, barley malt, hop 6
THE INFLUENCE OF ASSORTMENT OF BEER ON THEIR ANTIOXIDANT / PRO-OXIDANT …
37
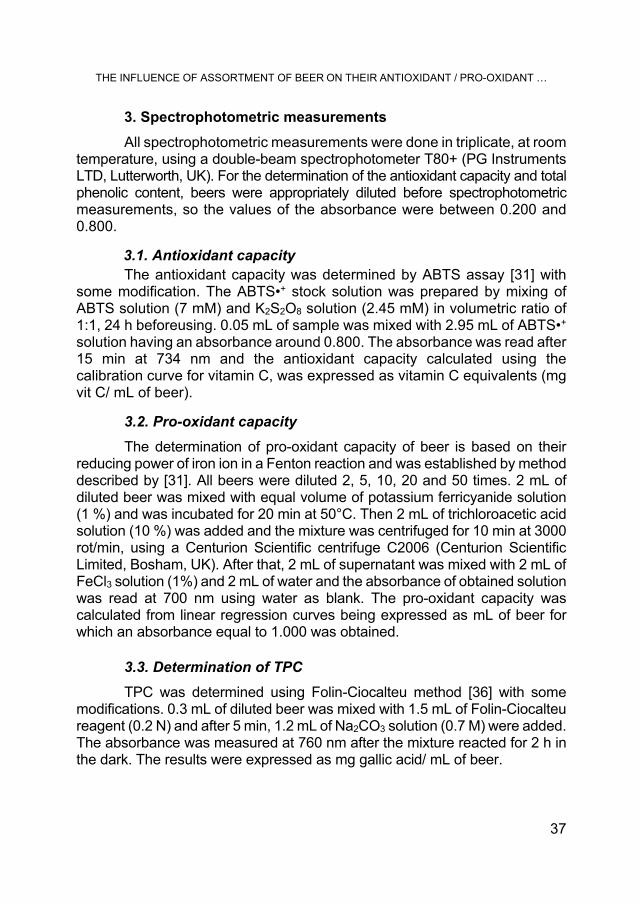
3. Spectrophotometric measurements All spectrophotometric measurements were done in triplicate, at room
temperature, using a double-beam spectrophotometer T80+ (PG Instruments LTD, Lutterworth, UK). For the determination of the antioxidant capacity and total phenolic content, beers were appropriately diluted before spectrophotometric measurements, so the values of the absorbance were between 0.200 and 0.800.
3.1. Antioxidant capacity The antioxidant capacity was determined by ABTS assay [31] with
some modification. The ABTS•+ stock solution was prepared by mixing of ABTS solution (7 mM) and K2S2O8 solution (2.45 mM) in volumetric ratio of 1:1, 24 h beforeusing. 0.05 mL of sample was mixed with 2.95 mL of ABTS•+
solution having an absorbance around 0.800. The absorbance was read after 15 min at 734 nm and the antioxidant capacity calculated using the calibration curve for vitamin C, was expressed as vitamin C equivalents (mg vit C/ mL of beer).
3.2. Pro-oxidant capacity The determination of pro-oxidant capacity of beer is based on their
reducing power of iron ion in a Fenton reaction and was established by method described by [31]. All beers were diluted 2, 5, 10, 20 and 50 times. 2 mL of diluted beer was mixed with equal volume of potassium ferricyanide solution (1 %) and was incubated for 20 min at 50°C. Then 2 mL of trichloroacetic acid solution (10 %) was added and the mixture was centrifuged for 10 min at 3000 rot/min, using a Centurion Scientific centrifuge C2006 (Centurion Scientific Limited, Bosham, UK). After that, 2 mL of supernatant was mixed with 2 mL of FeCl3 solution (1%) and 2 mL of water and the absorbance of obtained solution was read at 700 nm using water as blank. The pro-oxidant capacity was calculated from linear regression curves being expressed as mL of beer for which an absorbance equal to 1.000 was obtained.
3.3. Determination of TPC TPC was determined using Folin-Ciocalteu method [36] with some
modifications. 0.3 mL of diluted beer was mixed with 1.5 mL of Folin-Ciocalteu reagent (0.2 N) and after 5 min, 1.2 mL of Na2CO3 solution (0.7 M) were added. The absorbance was measured at 760 nm after the mixture reacted for 2 h in the dark. The results were expressed as mg gallic acid/ mL of beer.

CLAUDIA CIMPOIU, ANCA MILNA, VIRGIL DANCIU, ANAMARIA HOSU
38
4. Chromatographic analysis
4.1. TLC fingerprinting 5 μL of black beer samples and 10 μL of the other samples were
applied as bands (6 mm) on the chromatographic plates) using a Linomat 5 device CAMAG (Basel, Switzerland). Separation was done on TLC Silica gel 60RP-18 F254S with an optimum mobile phase consisting in methanol- water- phosphoric acid, 10:10:0.2 (v/v/v). After elution, the plate was dried, then heated at 100 °C for 3 min and dipped while still hot in the NP solution, dried in cold air and then immersed in the PEG solution. Documentation was done in UV light (366 nm) using a Reprostar 3 system CAMAG (Basel, Switzerland). The images of the plates were digitally processed using ImageJ computer software to obtain the digitized chromatograms.
4.2. HPLC fingerprinting HPLC analysis was performed using an Agilent 1200 system (Agilent
Technologies Inc.; Santa Clara, CA, USA) equipped with a quaternary pump, column heater and a vacuum degasser. Beer samples were diluted 1:1 (v/v) with 0.1 % v/v formic acid prior to HPLC analysis and filtered through 0.2 μm PTFE membrane filter. Then, 20 μL of each sample were analyzed. Separation was performed on ZORBAX Eclipse XDB-C18 column (150 mm X 4.6 mm i.d., 5 μm). Beer separation was achieved with a binary mixture of (A) 0.1 % v/v formic acid in water and (B) 0.1 % v/v formic acid in acetonitrile. The non-linear gradient elution was: 0 min, 2 % B; 2–16 min, 35 % B; 16–18 min, 23 % - 95 % B; 18–20 min, 95% B; 20–21 min, 95% - 5% B, 21-23 min, 5% B; over a 23 min run time, at a constant flow rate of 0.4 L/min, with column temperature 20°C. Detection was achieved with a UV detector at 254 nm and peak areas were processed with the operating HPLC software (ChemStation, Agilent Technologies Inc.; Santa Clara, CA, USA).
5. Statistical analysis All spectrophotometric reported data are presented as the mean values
± the standard deviation, obtained from the three replicates. The experimental results were subjected to one-way analysis of variance (ANOVA), principal component analysis (PCA), and cluster analysis (CA), using STATISTICA 7 software (StatSoft Inc., Tulsa, USA). The ANOVA analysis was performed in order to determine if the packing type of beers significantly affect the antioxidant/ pro-oxidant capacities and the TPC of beers. The differences were considered to be significant at the level of p< 0.05 for 95% probability. The experimental

THE INFLUENCE OF ASSORTMENT OF BEER ON THEIR ANTIOXIDANT / PRO-OXIDANT …
39
results obtained from spectrophotometric measurements andfrom digitized TLC and HPLC chromatograms were subjected to PCA and CA in order to classify the beers according to their assortment.
REFERENCES
1. H.M. Bettenhausen; L. Barr; C.D. Broeckling; J.M. Chaparro; C. Holbrook; D. Sedin; A.L. Heuberger; Food Res. Int., 2018, 113, 487-504.
2. G. De Gaetano; S. Costanzo; A. Di Castelnuovo; L. Badimon; D. Bejko; A. Alkerwi; G. Chiva-Blanch; R. Estruch; C. La Vecchia; S. Panico; G. Pounis; F. Sofi; S. Stranges; M. Trevisan; F. Ursini; C. Cerletti; M. B. Donati; L. Iacoviello; Nutr. Metab. Cardiovas., 2016, 26, 443-467.
3. P.A. Ribeiro Tafulo; R. Barbosa Queiros; C.M. Delerue-Matos; M. Goreti Ferreira Sales; Food Res. Int., 2010, 43, 1702–1709.
4. S. Wunderlich; W. Back; Overview of manufacturing beer: Ingredients, process and quality criteria. In Beer in health and disease prevention, V. R. Preedy Ed.; Elsevier Academic Press, Amsterdam, Holland, 2009; pp. 3–16.
5. H. Zhao; Effects of processing stages on the profile of phenolic compounds in beer. In Processing and Impact on Active Components in Food, V. R. Preedy Ed.; Elsevier Academic Press, Amsterdam, Holland, 2015; pp. 533-539.
6. E. Jeney-Nagymate; P. Fodor; J. Inst. Brew., 2007, 113, 28–33. 7. D.O. Carvalho; L.M. Gonçalves; L.F. Guido; Compr. Rev. Food Sci. F., 2016,
15, 927-943. 8. C. Gerhäuser; Eur. J. Cancer, 2005, 41, 1941–1954. 9. D. Rivero; S. Pérez-Magariño; M.L. González-Sanjosé; V. Valls-Belles; P.
Codoñer; P. Muñiz; J. Agric. Food Chem., 2005, 53, 3637-3642. 10. A. Davalos; C. Gomez-Cordoves; B. Bartolome; J. Agric. Food Chem., 2003,
51, 2512−2519. 11. Zhao, H.; Chen, W.; Lu, J.; Zhao, M. Phenolic profiles and antioxidant activities
of commercial beers. Food Chem. 2010, 119, 1150–1158. 12. V. Glavnik; I. Vovk; A. Albreht; J. Chromatogr. A, 2017, 1482, 97-108. 13. A. Hosu; V. Danciu; C. Cimpoiu; J. Food Compos. Anal., 2015, 41, 174–180. 14. M. Ligor; O. Kornyšova; A. Maruška; B. Buszewski; J. Planar Chromatogr.-Mod.
TLC, 2008, 21, 355–360. 15. P.M. Ristivojevic; G.E. Morlock; Food Chem., 2018, 260, 344-353. 16. A. Alonso Garcia; B. Cancho Grande; J. Simal Gandara; J. Chromatogr. A,
2004, 1054, 175-180. 17. M.T. Walters; A.P. Heasman; P.S. Hughes; J. Am. Soc. Brew. Chem., 1997, 55,
83-89. 18. L. Montanari; G. Perretti; F. Natella; A. Guidi; P. Fantozzis; LWT - Food Sci.
Technol., 1999; 32, 535-539.

CLAUDIA CIMPOIU, ANCA MILNA, VIRGIL DANCIU, ANAMARIA HOSU
40
19. P.J. Magalhães; S.M. Almeida, A.M. Carvalho, L.M. Gonçalves; J.G. Pacheco; J.M. Cruz; L.F. Guido; A.A. Barros; Food Res. Int., 2011, 44, 351–359.
20. J.L. Goncalves; V.L. Alvesa; F.P. Rodrigues; J.A. Figueira; J.S. Camara; J. Chromatogr. A, 2013, 1304, 42– 51.
21. S. Floridi; L. Montanari; O. Marconi; P. Fantozzi; J. Agric. Food Chem., 2003, 51, 1548-1554.
22. N. Whittle; H. Eldridge; J. Bartley; J.I. Brewing, 1999, 105, 89-99. 23. M. Nardini; A. Ghiselli; Food Chem., 2004, 84, 137–143. 24. N. Whittle; H. Eldridge; J. Bartley; J. Inst. Brew., 1999, 105,89-99. 25. R. Lang; C. Mueller; T. Hofmann; J. Agric. Food Chem., 2006, 54, 5755-5762. 26. C. Leitao; E. Marchioni; M. Bergaentzle; M. Zhao; L. Didierjean; B. Taidi; S.
Ennahar; J. Agric. Food Chem., 2011, 59, 1249–1255. 27. D.O. Carvalho; A.F. Curto; L.F. Guido; Antioxidants, 2015, 4, 563-576. 28. D. Huang; B. Ou; R.L. Prior; J. Agric. Food Chem., 2005, 53, 1841-1856. 29. L.R. Fukumoto; G. Mazza; J. Agric. Food Chem., 2000, 48, 3597-3604. 30. E. Kondakç; M. Özyürek; K. Güçlü; R. Apak; Talanta 2013, 115, 583–589. 31. B. Moldovan; A. Hosu; L. David; C. Cimpoiu; Acta Chim. Slov., 2016, 63, 213-
219. 32. D. Koren; C. Orban; N. Gallo; S. Kun; B. Vecseri-Hegyes; G. Kun-Farkas;
J. Food Sci. Technol., 2017, 54, 1158-1167. 33. M. Ramos; A. Valdes; A.C. Mellinas; M.C. Garrigos; Beverages, 2015, 1, 248-
272. 34. S.S. Mitić; D.D. Paunović; A.N. Pavlović; S.B. Tošić; M.B. Stojković; M.N. Mitić;
Int. J. Food Prop., 2014, 17, 908-922. 35. A. Piazzon; M. Forte; M. Nardini; J. Agric. Food Chem., 2010, 58, 10677–10683. 36. V.L. Singleton; R. Orthofer; R.M. Lamuela-Raventos; Methods Enzymol., 1999,
299, 152-178.