
The Economic Contribution of Working Waterfronts...• When the geographic location of the economic...
36
The Economic Contribution of Working Waterfronts Local Estimation and Case Studies Office for Coastal Management
Transcript of The Economic Contribution of Working Waterfronts...• When the geographic location of the economic...

The Economic Contribution of Working WaterfrontsLocal Estimation and Case Studies
Office for Coastal Management


Table of ContentsIntroduction ...................................................................................................................1
Local Estimation ............................................................................................................5
Step 1: Choose Your Base Data ..............................................................................................5
Step 2: Organize the Data ......................................................................................................8
Step 3: Fill In the Gaps ..........................................................................................................10
Step 4: Analyze .....................................................................................................................11
Case Study: Gloucester, Massachusetts ........................................................................13
Case Study: Puget Sound, Washington .........................................................................15
Case Study: Harpswell, Maine .......................................................................................18
Appendix A: List of Industry-Specific Data Sources and Indicators ................................26
Appendix B: Caveats and Best Practices for Processing Data Sources ...........................29
Appendix C: List of Resources on Non-market Values and Impacts ................................30
NOAA’s Office for Coastal Management
“Coastal management” is the term used by communities and organizations striving to keep the nation’s coasts safe from storms, rich in natural resources, and economically strong. The national lead for these efforts is the National Oceanic and Atmospheric Administration’s Office for Coastal Management, an organization devoted to partnerships, science, and good policy. This agency, housed within the National Ocean Service, oversees major initiatives that include the Coral Reef Conservation Program, Digital Coast, National Coastal Zone Management Program, and National Estuarine Research Reserve System.


1
IntroductionWorking waterfronts represent a valuable economic engine for coastal communities, but quantifying this contribution can be challenging. Obstacles standing in the way include an inconsistent definition of which businesses to include in the analysis, and the difficulties of gathering the needed economic data points.
Data produced by the National Oceanic and Atmospheric Administration (NOAA) have helped to remedy this situation on the national stage by defining the ocean and Great Lakes economy and providing time-series data for economic analysis. NOAA’s recent data show that the ocean and Great Lakes economy directly supports more than three million jobs and contributes more than $350 billion to the nation’s gross domestic product.
NOAA’s economic data, however, are only available down to the county level. To help fill the gap for data at a local scale, NOAA worked with partners from the National Working Waterfronts Network and Maine Sea Grant to create a methodology for use by local leaders to estimate the economic contribution of their working waterfronts (interchangeable with “local ocean economy” in this document).
This publication provides background information about this methodology, ideas and information on data sources, estimation options, and implementation case studies. For a step-by-step guide for generating data using two data set examples, please see the companion document, “The Economic Contribution of Working Waterfronts: Step-by-Step Process Guide using Zip-Code Business Patterns Data.”
An Ocean and Great Lakes Economy Framework
NOAA uses two statistical data sets to describe the economic activity related to the ocean and Great Lakes economy.
• The first is called Economics: National Ocean Watch, or ENOW, which is based on statistics maintained by the Bureau of Labor Statistics for businesses with one or more employees.
• The second data set captures the activity of self-employed workers and is produced by the Census Bureau using confidential data derived from tax records.
Both data sets provide statistics at county, state, regional, and national scales. Data are available for the years 2005 to 2015 and include the following indicators: number of business establishments, employment, wages, gross domestic product, self-employed workers, and gross receipts by self-employed workers.
These data sets, along with the definitions used to produce them, create a framework that can be replicated and customized for different needs and geographies.

2
Defining the Ocean Economy Framework with NAICS
As is the case with most economic data produced by national and state statistical agencies, jobs in the two data sets are organized using the North American Industrial Classification System (NAICS).
NAICS codes represent a hierarchical classification system with varying levels of detail. Using two-digit codes provides a general breakdown of economic activity with a broad level of detail, while a six-digit code represents the finest level of detail. An example of the hierarchy is shown in Figure 1 below.
2-digit NAICS
Economic Sector
11 Agriculture,
Forestry, Fishing and
Hunting
All othersub-sectors...
114Fishing,
Hunting and Trapping
3-digit NAICS
Sub-Sector
All otherindustrygroups...
1141Fishing
4-digitNAICS
Industry Group
11411Fishing
5-digit NAICSNAICS
Industry114111
Finfish Fishing
114112ShellfishFishing
114119Other Marine
Fishing
6-digit NAICS
National Industry
Figure 1. The designation of 2- to 6-digit NAICS code structure – example of the agriculture,
forestry, fishing, and hunting industry (NAICS 11)
NOAA’s ENOW data are compiled using economic activity at the 6-digit level of the NAICS. NOAA defines an economic activity as ocean- or Great Lakes-dependent if it meets at least one of the following criteria:
• Production of goods or services where ocean and marine resources are an input, such as fishing.
• Production of goods or services that will be used primarily or exclusively in the marine setting, such as marine passenger and freight transportation.
• When the geographic location of the economic activity implies a relationship with the ocean, such as beachfront hotels or warehouses that operate near ports.
In total, ENOW covers 47 such classes of these economic activities, organized into six sectors:• Living resources• Marine construction• Marine transportation• Offshore mineral resources• Ship and boat building• Tourism and recreation
The full ENOW ocean economy framework with its 47 NAICS classes and six sectors can be seen on the next page in Table 1.

3
Sector Industry NAICS NAICS Industry (2012 NAICS)
LivingResources
Fish Hatcheries andAquaculture 112511 Finfish Farming and Fish Hatcheries
112512 Shellfish Farming
112519 Other Aquaculture
Fishing 114111 Finfish Fishing
114112 Shellfish Fishing
114119 Other Marine Fishing
Seafood Processing 311710 Seafood Product Preparation and Packaging
Seafood Markets 445220 Fish and Seafood Markets
MarineConstruction
Marine Related Construction 237990 Other Heavy and Civil Engineering
Construction
MarineTransportation
Deep Sea Freight 483111 Deep Sea Freight Transportation
483113 Coastal and Great Lakes Freight Transportation
Marine PassengerTransportation 483112 Deep Sea Passenger Transportation
483114 Coastal and Great Lakes Passenger Transportation
Marine Transportation Services 488310 Port and Harbor Operations
488320 Marine Cargo Handling
488330 Navigational Services to Shipping
488390 Other Support Activities for Water Transportation
Search and Navigation Equipment 334511
Search, Detection, Navigation, Guidance, Aeronautical and Nautical System and Instrument Manufacturing
Warehousing 493110 General Warehousing and Storage
493120 Refrigerated Warehousing and Storage
493130 Farm Product Warehousing and Storage
Ship and Boat Building
Boat Building and Repair 336612 Boat Building and Repair
Ship Building and Repair 336611 Ship Building and Repair
Ocean and Great Lakes Economy Sectors and Industries by NAICS Codes
Table 1. ENOW Ocean Economy Framework – Crosswalk table of ENOW Sectors and 6-digit NAICS

4
(continued)
Sector Industry NAICS NAICS Industry (2012 NAICS)
Offshore Mineral Resources
Limestone, Sand and Gravel212321 Construction Sand and Gravel Mining
212322 Industrial Sand Mining
Oil and Gas Exploration and Production
211111 Crude Petroleum and Natural Gas Extraction
211112 Natural Gas Liquid Extraction
213111 Drilling Oil and Gas Wells
213112 Support Activities for Oil and Gas Operations
541360 Geophysical Exploration and MappingServices
Tourism and Recreation
Boat Dealers 441222 Boat Dealers
Eating and DrinkingPlaces
722511 Full Service Restaurants
722513 Limited Service Eating Places
722514 Cafeterias
722515 Snack and Nonalcoholic Beverage Bars
Hotels and Lodging721110 Hotels (except Casino Hotels) and Motels
721191 Bed and Breakfast Inns
Marinas 713930 Marinas
Recreational VehicleParks and Campsites 721211 RV Parks and Recreational Camps
Scenic Water Tours 487210 Scenic and Sightseeing Transportation, Water
Sporting Goods 339920 Sporting and Athletic Goods Manufacturing
Amusement andRecreation Services
487990 Scenic and Sightseeing Transportation, Other
611620 Sports and Recreation Instruction
532292 Recreation Goods Rental
713990 Amusement and Recreation Services Not Elsewhere Classified
Zoos and Aquaria712130 Zoo and Botanical Gardens
712190 Nature Parks and Other Similar Institutions
State and local data commonly identify different types of economic activity using NAICS codes. However, the ENOW framework can be used as a starting point for a nationally consistent baseline and for data tailored to a local scale.
5
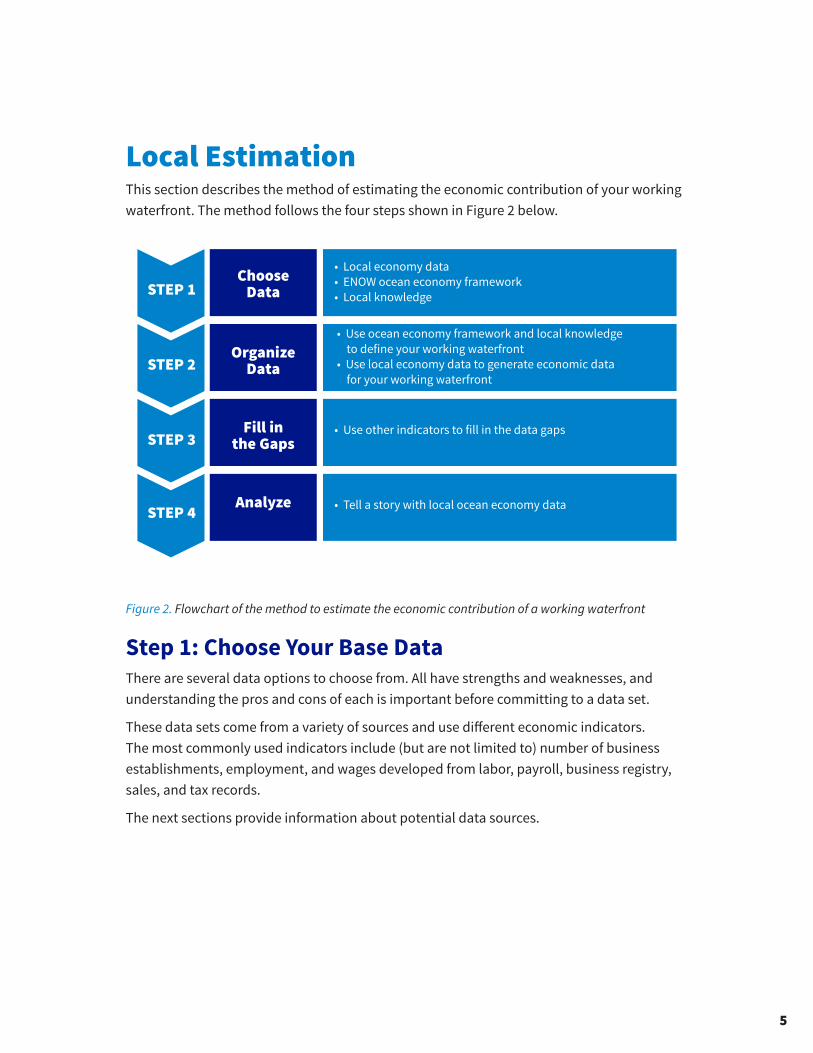
Local EstimationThis section describes the method of estimating the economic contribution of your working waterfront. The method follows the four steps shown in Figure 2 below.
Figure 2. Flowchart of the method to estimate the economic contribution of a working waterfront
Step 1: Choose Your Base DataThere are several data options to choose from. All have strengths and weaknesses, and understanding the pros and cons of each is important before committing to a data set.
These data sets come from a variety of sources and use different economic indicators. The most commonly used indicators include (but are not limited to) number of business establishments, employment, and wages developed from labor, payroll, business registry, sales, and tax records.
The next sections provide information about potential data sources.
STEP 1Choose
Data
OrganizeData
Fill inthe Gaps
Analyze
STEP 2
STEP 3
STEP 4
• Local economy data• ENOW ocean economy framework• Local knowledge
• Use other indicators to fill in the data gaps
• Tell a story with local ocean economy data
• Use ocean economy framework and local knowledge to define your working waterfront • Use local economy data to generate economic data for your working waterfront

6
Nationally Available Data
The most basic and most easily accessible data for the local economy are found in the Census Zip Code Business Patterns data set (www.census.gov/programs-surveys/cbp/data/tables.html). These data provide the number of business establishments, at the zip code level, for most of the U.S. The data are organized into NAICS codes and can be sorted using the ENOW definition of the ocean economy (the six sectors). Businesses are categorized by employment ranges (1 to 4 employees, 5 to 9 employees, 10 to 19 employees, etc.), which means the values being estimated leave room for uncertainty.
• Indicators: establishments, employment• Pros: nationally available; uses NAICS codes• Cons: employment ranges rather than actual numbers of employees
Locally Available Data
Certain states provide data developed by that state’s bureau of labor or a corresponding agency. These data can vary in terms of accessibility, data format, and use of NAICS codes.
Here is an example:
Massachusetts provides employment and wage statistics by the 4-digit NAICS
industries for each city and town. These data are easily accessible on the
website of the Executive Office of Labor and Workforce Development (lmi2.
detma.org/lmi/lmi_oes_a.asp).
In other instances, a state or local agency may have a completed economic study. These agencies include but are not limited to regional, state, and local economic development councils, chambers of commerce, departments of labor and workforce, and departments of revenue and taxation.
Here is an example:
Washington’s Working Coast Project (www.onrc.washington.edu/
AquaticPrograms/WWC.html) reported a list of ocean businesses for the five
Pacific Coast counties in Washington State. These businesses are categorized
according to the type of ocean use.
7
Here is an example:
Island Institute’s publication, “Waypoints: Community Indicators for Maine’s
Coast and Islands” (islandinstitute.org/waypoints), provides clear, accurate
data in a simple, easy-to-use format that is helpful for meeting local needs.
The report includes town-specific data for income, self-employment, lobster
landings, licenses, coastal housing, conserved land, etc.
• Indicators: variable; includes establishments, employment, and wages• Pros: more specific counts of employees; may contain wage information; may contain
spatial information about businesses for mapping• Cons: may not be available to everyone; may not have the same level of industrial detail
Proprietary Data
Private-sector companies are also great data sources. These sources sometimes offer great detail for smaller geographies, but can be costly to access and limited by rules that dictate what can and cannot be shared with the public.
Here is an example:
Esri’s Business Analyst (esri.com/software/businessanalyst) has information
on individual businesses by industries at the Census block-group level.
Indicators include name, location, scale, and number of employees for the
most current year.
However, there are more economical ways to access these businesses data. These approaches include working with universities and research institutes on an educational license, or working with communities or business analysts who already have a subscription to these resources.
Here is an example:
ReferenceUSA (resource.referenceusa.com) provides library patrons with access
to extremely accurate and complete business and consumer data by NAICS
codes. Many libraries, such as Maine State Library, provide members with free
access to this online platform.
• Indicators: establishments, employment, wages, and sales• Pros: more data detail; may contain spatial information about businesses for mapping• Cons: can be cost-prohibitive; restrictions may apply for publishing information

8
Step 2: Organize the DataTo provide an adequate estimation for the economic contribution of local working waterfront, three things are needed: 1) the ENOW framework for defining and organizing the data; 2) local economic data; and 3) local knowledge.
Use Ocean Economy Framework and Local Knowledge to Define Your Working Waterfront
The ENOW ocean economy framework defines the most common ocean industries consistently across the nation. This is a good starting place, but there can be other industries or jobs to consider.
Here is an example: The harbor planners of the City of Gloucester, Massachusetts, identified
grocery product wholesalers, an industry that is not characteristically ocean-
dependent, as a group that nearly exclusively supports the sale of fish and
shellfish in their community. Therefore, they added grocery product wholesalers
into the ENOW ocean economy framework for their analysis.
The locally defined framework, relying on local knowledge, will be used next in generating economic data for your working waterfront.
Use Local Economy Data to Generate Economic Data for Your Working Waterfront
Depending on the availability of local statistics and the extent of their attributes, there are several options for deriving economic data for local working waterfronts.
Here is an example:
If you are working with Census Zip Code Business Patterns data, you can follow
the detailed steps in the companion document, “The Economic Contribution
of Working Waterfronts: Step-by-Step Process Guide using Zip-Code Business
Patterns Data.”
Option 1: If the available data use the 6-digit NAICS or an equivalent classification system, the local-defined ocean economy framework can be directly used to sort the data, categorize the ocean sectors, and estimate the total ocean-dependent portion of the local economy.

9
Option 2: If economic data are aggregated in higher-level industry groups, such as at 4- or 5-digit NAICS codes, the industry groups that contain one or several ocean industries could be used to match with corresponding sectors in the ocean economy framework and demonstrate the ocean-dependent portion of the local economy.
Table 2. Crosswalk Table of ENOW Sectors and 4-digit NAICS
4-digit NAICS Corresponding ENOW Sector 4-digit NAICS Corresponding ENOW Sector
2379 Construction 3399 Tourism and Recreation
1125 Living Resources 4412 Tourism and Recreation
1141 Living Resources 4872 Tourism and Recreation
3117 Living Resources 4879 Tourism and Recreation
4452 Living Resources 5322 Tourism and Recreation
2111 Minerals 6116 Tourism and Recreation
2123 Minerals 7121 Tourism and Recreation
2131 Minerals 7139 Tourism and Recreation
5413 Minerals 7211 Tourism and Recreation
3366 Ship & Boat Building 7212 Tourism and Recreation
4931 Transportation 7221 Tourism and Recreation
3345 Transportation 7222 Tourism and Recreation
4831 Transportation 7211 Tourism and Recreation
4883 Transportation
While the 4- or 5-digit NAICS industry groups lump non-ocean activities together with the ocean activities, therefore causing an overestimation, these industry groups are the closest approximation of the 6-digit NAICS ocean industries.
Option 3: If the available economic data do not have suitable indicators, additional computation is required to make them usable for decision-making.
Here is an example:
Zip Code Business Pattern data provide the number of businesses by the range
of employment size. To get the total employment, an average needs to be
derived by multiplying the midpoint of the employment size range by the total
number of businesses in each employment size category.
Option 4: If a list of businesses is available but not classified by NAICS or an equivalent classification system, additional research is required to sort the data and find out each business’ corresponding 4- or 6-digit NAICS code.
10
Here is an example:
Manta (manta.com) is a business search website used to find business
information by name and location. It includes small businesses and provides
established year, annual revenue, number of employees, and the corresponding
6-digit NAICS code of each business.
Then the data can be aggregated by ocean industries and sectors according to the locally defined ocean economy framework.
Option 5: If no economic data are available at a local scale, ENOW data can be downscaled by applying local factors.
Here is an example:
U.S. Army Corps of Engineers’ Navigation Data Center (www.
navigationdatacenter.us/) maintains records for the corps owned dredges,
dredging contracts, and shore protection projects. With these data, ENOW
marine construction sector data can be apportioned to each local area by the
number and size of these construction projects.
Step 3: Fill In the GapsTo get a full picture of the economic contribution of working waterfronts, it is necessary to consider a broader base of information.
Dig Deeper into Important Industries, Especially Fisheries
In addition, there are further data resources available to give a deeper understanding of what the ocean-dependent jobs support. Supplementary information can be used to show the value and tonnage of cargo moving through ports, barrels of oil produced, and number of fishing vessels, to name a few items. A list of potential additional data resources can be found in Appendix A.
For most industries, employment data will cover the majority of the people involved in the activity. For commercial fishing, however, most people involved with this job category are self-employed. Finding supplemental data that capture the economic impact of fishermen is essential. A variety of resources are available from different agencies, both federal and local. These additional data resources, such as information from the regional statistical cooperatives, license data, and catch-landing data, will give a more in-depth picture of how many people are involved in the fisheries.

11
Here is an example:
The Atlantic Coastal Cooperative Statistics Program (accsp.org) is the principal
source of dependable and timely marine fishery statistics for Atlantic coast
fisheries. It provides the number of fishermen, dealers, vessels, and landing tons
by ports.
Identify Additional Indicators for Ocean Activities Not Reflected in NAICS
Certain industries, such as government agencies (Navy, NOAA, and Coast Guard) and educational research facilities (Darling Marine Lab, Woods Hole Institute) cannot be classified as ocean-dependent based on NAICS codes.
These activities are generally classified under general categories, such as government and education. Finding other ways to describe these resources is important to show the full picture of what is involved in the working waterfronts.
Caveats about Supplementary Indicators
The additional data resources are extremely valuable to give a better understanding of local working waterfronts. They may, however, require additional effort to create a truthful estimate of the economic impact of their industries. For example, if you have access to fishing license data, you may need to identify unique fishermen involved in different fisheries to avoid double-counting.
Besides, these data resources use economic indicators that are very specific to each industry. Thus, additional computation may be required to present supplementary indicators in a consistent manner.
More caveats and best practices are explained in Appendix B.
Step 4: AnalyzeData alone are not enough; good stories can help better demonstrate why and how we need to maintain and develop our working waterfronts.
Tell a Story with Data
Statistics by themselves are useful, but creating a cohesive narrative around the numbers can be much more powerful. For example, the tourism and recreation sector usually accounts for a large percentage of the local ocean economy. In many cases, tourism is heavily reliant on healthy ocean and coastal ecosystems. Tourism is also closely dependent on cultural heritage and traditional ocean activities, such as lobstering and shrimping.

12
Tourism supports many part-time and seasonal jobs, and provides entry-level jobs for young workers. The tourism story demonstrates the need to maintain a good balance between nature and sustainable development.
Be Clear Communicating Assumptions Made
All methods of processing source data will introduce a certain level of error. Some data-processing errors can be avoided using better indicators and methods; if the errors are not avoidable, they need to be well explained.
Here is an example:
In the case of Census Zip Code Business Patterns, the midpoints of employment
ranges are used as proxy for the actual counts of employees per business.
However, for some areas with small populations and many small businesses,
using midpoints can dramatically overestimate the employment totals.
Therefore, the midpoints should be adjusted to adapt to individual cases.
When communicating about estimation methods and outputs, a short explanation is recommended to clarify all the caveats and demonstrate that the approximations are the closest possible values to reflect your working waterfront economy. More caveats and best practices are explained in Appendix B.
Describe the Things You Can’t Easily Count
Another essential factor to consider is the nonmarket (less formal and non-cash transaction) activities of the ocean and Great Lakes resources. These are the values associated with goods and services not well represented in the traditional marketplace, such as healthy fish stocks, scenic vistas, and the production of oxygen.
While these items are not easy to provide a specific value to, they should be considered and described as part of what supports or drives the ocean economy. Appendix C contains a list of resources that provide valuable guidance for data analysis and telling stories.

13
Case Study: Gloucester, MassachusettsIssue
Gloucester, Massachusetts, is one of the oldest fishing communities in the U.S. After experiencing a decline in its fisheries over the last 30 years, Gloucester and its Harbor Plan Committee recognized the need to diversify its maritime economy. An initial assessment showed only 140 fishing jobs as part of the waterfront economy. Knowledge of ocean-dependent industries and jobs was essential to making the case for investment in the community’s working waterfront, so an economic analysis was needed to accurately reflect the maritime workforce.
Figure 3. City of Gloucester’s working waterfront
To achieve its goals, the committee sought better data to accurately characterize and identify the strengths of the maritime sector in order to help develop new, diverse maritime companies.
Choosing Data
Local economic data from Massachusetts’ Executive Office of Labor and Workforce Development include employment and wages statistics classified by 4-digit NAICS codes. The data set includes the same indicators as ENOW source data but discloses information at smaller geographic scales than ENOW, such as cities and town.

14
Organizing Data
Gloucester’s harbor planning director worked with NOAA’s Office for Coastal Management to identify ocean industries using the ENOW framework, as well as some additional industries that were specifically part of the working waterfront in Gloucester. Local knowledge identified that grocery product wholesalers nearly exclusively supported the sale of fish and shellfish product in the community. For this reason, this class of economic activity was added to generate a localized ocean economy framework.
The NAICS codes identified for the Gloucester working waterfront were applied to employment and wages from the state’s labor office. The data were sorted and summarized by ocean industries. Each industry was designated with an approximate ENOW ocean sector, and finally, an economic profile was created for Gloucester’s working waterfront.
Analysis
Gloucester’s working waterfront economic profile is shown in Table 3. Compared with the initial estimate of 140 fishing jobs, the analysis found that 2,300 of the 10,000 jobs in the city could be identified as ocean-dependent.
Table 3. Estimated Contribution of Ocean Industries to Gloucester’s Economy in 2011
Approximate Sector NAICS Industry Description Employment Total Wages
Living Resources 1141 Fishing 125 7,131,226
Living Resources 3117 Seafood Product Preparation & Packaging 561 40,927,222
Living Resources 4452 Specialty Food Stores 74 2,572,677
Offshore Minerals 5413 Architectural and Engineering Services* 44 2,568,877
Tourism & Recreation 4872 Scenic/Sightseeing Transportation, Water 46 904,235
Tourism & Recreation 7121 Museums, Parks and Historical Sites 39 1,034,303
Tourism & Recreation 7139 Other Amusement & Recreation Industries 151 4,312,872
Tourism & Recreation 7211 Traveler Accommodation 93 1,629,139
Tourism & Recreation 7221 Full-Service Restaurants 590 10,583,209
Tourism & Recreation 7222 Limited-Service Eating Places 362 5,440,749
Marine Transportation 4883 Support Activities for Water Transport 7 295,024
Marine Transportation 4931 Warehousing and Storage NA NA
Marine Transportation 4244 Grocery Product Merchant Wholesalers* 203 12,551,310
Marine Transportation 4842 Specialized Freight Trucking* NA NA
All Ocean Sectors - Total 2,295 89,950,843
*Additional activities added to Gloucester’s ocean economy framework.
With the ENOW framework and county-level ENOW data, harbor planners were able to identify ocean-related businesses at a city level and create an economic profile for Gloucester’s working waterfront. Through this analysis, the City of Gloucester changed the local discussion regarding the long-term viability of its working waterfront and moved forward with planning for emerging and diverse markets.

15
Case Study: Olympic Peninsula, Washington
Issue
The Olympic Peninsula, which is located in the northwest corner of the State of Washington, has two major water bodies that face different policy issues. Some parts of Clallam and Jefferson Counties border the Pacific Coast while the other parts border the non-Pacific areas along the Strait of Juan de Fuca and Puget Sound, as shown in Figure 4. Washington Coastal Marine Resource Committees conducted a project called Washington’s Working Coast in collaboration with the Olympic Natural Resources Center, Washington Department of Natural Resources, and other organizations to identify and address the differences between the areas.
Figure 4. Pacific-adjacent zip code areas and non-Pacific zip code areas
Local decision makers were having difficulty finding data needed to address the different issues facing areas along the outer coast of the Olympic Peninsula and the non-Pacific areas along the strait and the sound. Completing an economic analysis of the marine-based sector and the challenges it faced was recognized as an important need. However, local decision makers faced a challenging roadblock when trying to compare these two coastal zones of their state.
16
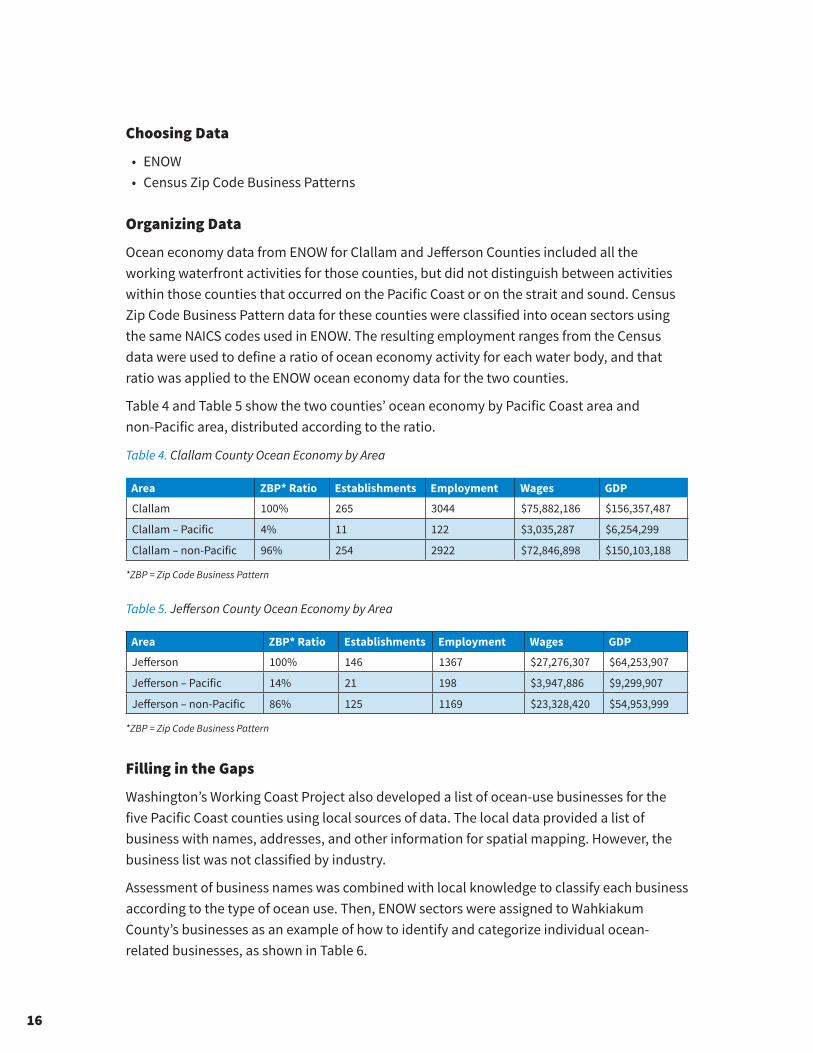
Choosing Data
• ENOW• Census Zip Code Business Patterns
Organizing Data
Ocean economy data from ENOW for Clallam and Jefferson Counties included all the working waterfront activities for those counties, but did not distinguish between activities within those counties that occurred on the Pacific Coast or on the strait and sound. Census Zip Code Business Pattern data for these counties were classified into ocean sectors using the same NAICS codes used in ENOW. The resulting employment ranges from the Census data were used to define a ratio of ocean economy activity for each water body, and that ratio was applied to the ENOW ocean economy data for the two counties.
Table 4 and Table 5 show the two counties’ ocean economy by Pacific Coast area and non-Pacific area, distributed according to the ratio.
Table 4. Clallam County Ocean Economy by Area
Area ZBP* Ratio Establishments Employment Wages GDP
Clallam 100% 265 3044 $75,882,186 $156,357,487
Clallam – Pacific 4% 11 122 $3,035,287 $6,254,299
Clallam – non-Pacific 96% 254 2922 $72,846,898 $150,103,188
*ZBP = Zip Code Business Pattern
Table 5. Jefferson County Ocean Economy by Area
Area ZBP* Ratio Establishments Employment Wages GDP
Jefferson 100% 146 1367 $27,276,307 $64,253,907
Jefferson – Pacific 14% 21 198 $3,947,886 $9,299,907
Jefferson – non-Pacific 86% 125 1169 $23,328,420 $54,953,999
*ZBP = Zip Code Business Pattern
Filling in the Gaps
Washington’s Working Coast Project also developed a list of ocean-use businesses for the five Pacific Coast counties using local sources of data. The local data provided a list of business with names, addresses, and other information for spatial mapping. However, the business list was not classified by industry.
Assessment of business names was combined with local knowledge to classify each business according to the type of ocean use. Then, ENOW sectors were assigned to Wahkiakum County’s businesses as an example of how to identify and categorize individual ocean-related businesses, as shown in Table 6.

17
Table 6. Example List of Wahkiakum County’s Coastal Businesses, 2012
Approximate Sector Business Name Ocean Use Notes
Living Resources Brittany Enterprises Finfish Fishing
Living Resources Fishing Vessel Ida W II Shellfish Fishing Possibly self-employed
Living Resources Kent Martin Fish and Seafood Markets
Living Resources C&H Smoked Fish Fish Processing
Marine Transportation Port District #1 Port and Harbor Operations
Ship and Boat Building Jacob’s Northwest Marine Mechanic Possibly self-employed
Ship and Boat Building Troy Blix Marine Welding Possibly self-employed
Tourism and Recreation Cathlamet Boat Rentals Inc Recreational Goods Rental
Tourism and Recreation Bradley House Inn Accommodations Possibly self-employed
Tourism and Recreation Earl & Shirley’s Riverview Restaurant
Tourism and Recreation Peterson’s Outfitting & Guide Services, Inc. Recreational Fishing
Marine Construction Consolidated Diking District No. 1 Other Specialty Contractors
Not Ocean Industry Cary Brown Backyard Mechanic Not ocean-related
Not Ocean Industry Cathlamet Realty West Realtors Not directly ocean-related
Not Ocean Industry The Gray River Café Restaurant Not shore-adjacent
…….. …….. …….. ……..
The list suggests that many people working in the living resources sector were self-employed fishermen, with at least three family businesses identified. Some businesses identified by this project as tourism-related were not directly ocean-dependent; they either were financial agencies located in shore-adjacent areas but not connected to any ocean sectors, or restaurants and hotels not located in shore-adjacent zip codes.
Analysis
The results indicated that the Pacific Coast accounted for only 4 percent of Clallam County’s ocean-dependent activity and 14 percent of the ocean-dependent activity of Jefferson County. Most of the ocean-dependent economic activities in these counties were focused on the Strait of Juan de Fuca and Puget Sound.
This study demonstrates the process to scale and transfer the ENOW framework. It also serves as a model for other local users to customize ENOW county data to support investment in more resilient and thriving working waterfront initiatives.
18
Case Study: Harpswell, MaineIssue
To develop a method of using the ocean economy framework to estimate the economic contribution of local working waterfronts, Maine Sea Grant and the Office for Coastal Management developed a pilot study that included a step-by-step process guide with examples of how to analyze the results. The area of Harpswell, Maine, was selected by local partners to test the process.
Choosing Data
• Census Zip Code Business Patterns Maine provides employment and wage statistics through the Center for Workforce Research and Information for cities and towns within the state. However, the data are only available at the 2-digit NAICS (economic sector) level.
Because of this, the Census Zip Code Business Pattern data were the source used in this analysis.
Organizing Data
The Zip Code Business Pattern data were sorted directly using the NAICS codes from the ENOW framework. Then the data were summarized by ocean sectors for all coastal zip codes in Maine, as well as for the three local Harpswell zip codes, as shown in Figure 5. The state-level data were used as a baseline comparison for the Harpswell area.

19
Figure 5. Harpswell and shore-adjacent zip code areas in the coastal counties of Maine
There are eight coastal shoreline counties of Maine (Cumberland, Hancock, Knox, Lincoln, Sagadahoc, Waldo, Washington, and York) and 142 shore-adjacent zip code areas in these counties. Of these shore-adjacent zip code areas, 69 (49 percent) had at least one ocean-dependent business establishment.
The town of Harpswell is in Cumberland County, within Casco Bay in the Gulf of Maine. The town includes three of the state’s 142 shore-adjacent zip code areas—Bailey Island, Great Island, and Orr Island (zip code areas: 04079, 04003, 04066).
Analysis
The results show that shore-adjacent zip code areas have 1,837 business establishments that depend on ocean resources, employing 22,657 people. As seen in Table 7, the ocean sectors of shore-adjacent zip code areas, including the hotel and restaurant industry, accounted for about 1 in 10 employees in Maine. Excluding the hotel and restaurant industries, the ocean sectors in shore-adjacent zip code areas accounted for 1 in 49 employees in Maine.

20
Table 7. The Economic Contribution of the Ocean Sectors to Maine’s Shore-Adjacent Zip Code
Areas in 2014
Ocean Sectors Business Establishments Employment
Marine Construction 12 92
Living Resources 330 1,634
Offshore Mineral Resources 3 9
Ship and Boat Building 42 640
Marine Transportation 35 1,013
Tourism and Recreation,Including Hotels and Restaurants 1,415 19,269
Tourism and Recreation,Excluding Hotels and Restaurants 201 1,275
All Ocean Sectors,Including Hotels and Restaurants 1,837 22,657
All Ocean Sectors,Excluding Hotels and Restaurants 623 4,663
Total Economy for Maine’s Shore-Adjacent Zip Codes 19,032 229,187
The Town of Harpswell, as shown in Table 8, supported 146 businesses and employed 419 people. The ocean sectors of Harpswell supported about 44 business establishments and employed about 168 people (Zip Code Business Pattern), accounting for approximately 40 percent of the total employment in Harpswell. Excluding the hotel and restaurant industries, the ocean sectors accounted for 29 percent of employment in Harpswell.
Table 8. The Economic Contribution of the Ocean Sectors to the Town of Harpswell, Maine
Ocean Sectors Business Establishments Employment
Marine Construction 2 6
Living Resources 26 78
Offshore Mineral Resources 0 0
Ship and Boat Building 0 0
Marine Transportation 0 0
Tourism and Recreation,Including Hotels and Restaurants 16 84
Tourism and Recreation,Excluding Hotels and Restaurants 2 38
All Ocean Sectors,Including Hotels and Restaurants 44 168
All Ocean Sectors,Excluding Hotels and Restaurants 30 122
Total Economy for Harpswell 146 419
21
The figures above are limited to employed workers in ocean sectors. Therefore, for the living resources sector, another data set would be needed for a more complete picture of the fishing jobs.
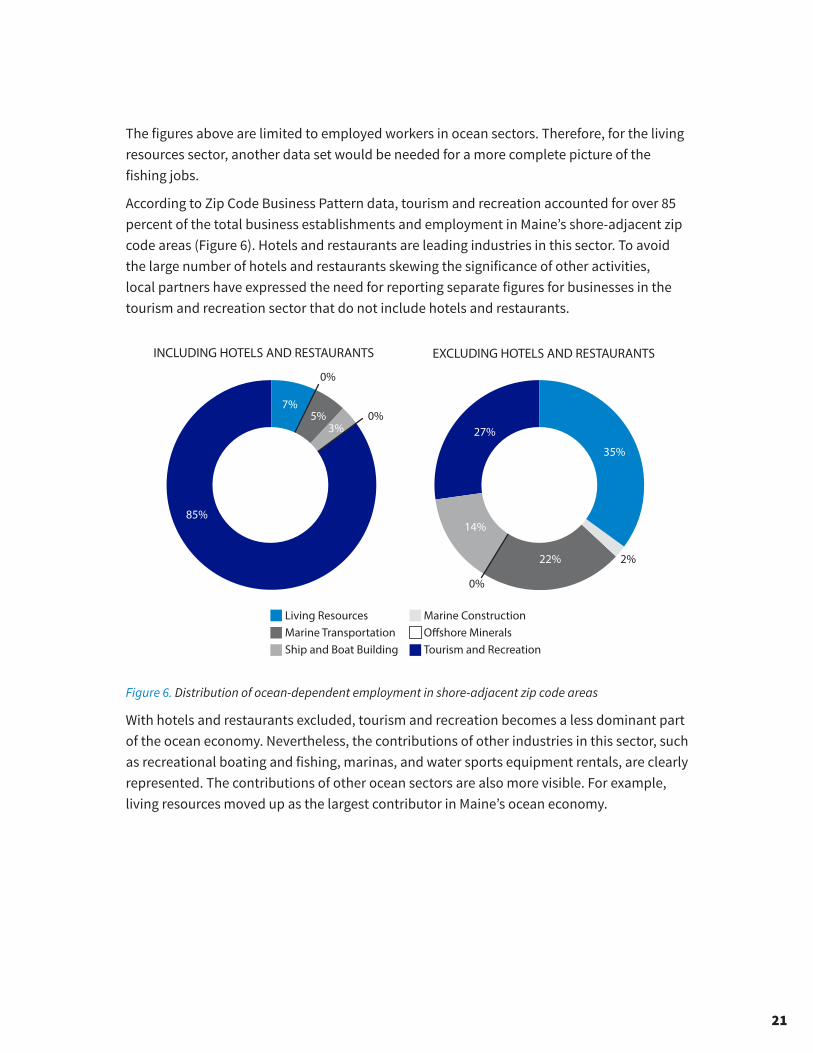
According to Zip Code Business Pattern data, tourism and recreation accounted for over 85 percent of the total business establishments and employment in Maine’s shore-adjacent zip code areas (Figure 6). Hotels and restaurants are leading industries in this sector. To avoid the large number of hotels and restaurants skewing the significance of other activities, local partners have expressed the need for reporting separate figures for businesses in the tourism and recreation sector that do not include hotels and restaurants.
INCLUDING HOTELS AND RESTAURANTS EXCLUDING HOTELS AND RESTAURANTS
Living ResourcesMarine TransportationShip and Boat Building
Marine ConstructionO�shore MineralsTourism and Recreation
85%
7%
27%
14%
22% 2%
0%
0%
0%
35%
5%3%
Figure 6. Distribution of ocean-dependent employment in shore-adjacent zip code areas
With hotels and restaurants excluded, tourism and recreation becomes a less dominant part of the ocean economy. Nevertheless, the contributions of other industries in this sector, such as recreational boating and fishing, marinas, and water sports equipment rentals, are clearly represented. The contributions of other ocean sectors are also more visible. For example, living resources moved up as the largest contributor in Maine’s ocean economy.

22
The geographic distribution of ocean-dependent employment and the share of total employment within each zip code area varies. As expected, zip code areas with greater population have more ocean-dependent jobs, especially in large municipalities such as Portland (Figure 7).
Figure 7. Ocean-dependent employment of shore-adjacent zip code areas, including hotels
and restaurants

23
Though ocean job numbers may look small for less populated zip code areas, they are far more significant locally. Especially in the rural areas with closer proximity to ocean resources, the ocean economy is more dominant and represents a larger share of the local employment (Figure 8). For example, the ocean economy makes up a large percentage of Harpswell’s total employment (40 percent), which is much higher than for the state of Maine (8 percent) and the nation as a whole (2.3 percent).
Figure 8. Ocean-dependent employment as a percentage of the total economy of shore-adjacent
zip code areas, including hotels and restaurants

24
INCLUDING HOTELS AND RESTAURANTS EXCLUDING HOTELS AND RESTAURANTS
Living ResourcesMarine TransportationShip and Boat Building
Marine ConstructionO�shore MineralsTourism and Recreation
50%
4%
27%
64%0%
0%
46%
5%
Figure 9. Distribution of ocean-dependent employment in the town of Harpswell
As is common with most working waterfronts, tourism and recreation contributes significantly to Harpswell’s ocean economy, accounting for about 50 percent of ocean-dependent employment when including hotels and restaurants, and 31 percent when excluding hotels and restaurants (Figure 9).
However, it is also important to note that jobs are only one indicator of economic contribution. For example, the marine construction sector accounted for only 1.4 percent of total employment, but these industries pay much higher wages and generate higher product values. Their contribution can be better explained with more supporting data on wages, sales, or taxes at this scale.
Tourism and recreation is the largest sector for employment. Including hotels and restaurants, this sector makes up half the total employment in Harpswell. Living resources is the second largest sector in terms of employment, accounting for about 46 percent of the total.
With the exclusion of hotels and restaurants from the tourism and recreation sector, the living resources sector makes up a largest component of Harpswell’s ocean economy, accounting for about 64 percent of ocean employment.

25
Fill in the Gaps
Zip Code Business Pattern data do not include data on self-employed workers. To supplement the data and include estimates of self-employed workers, data were requested from the Atlantic Coastal Cooperative Statistics Program. The additional data represent the number of unique licenses that the fishermen, dealers, or vessels held to land in a port.
Table 9. Atlantic Coastal Cooperative Statistics Program Fisheries Data by Ports
of Harpswell, Maine
Port Pounds Value Fishing Contributors
DealerContributors
VesselContributors
East Harpswell 589,595 $2,329,414 33 3 30
Harpswell 1,626,687 $5,293,357 209 29 125
Harpswell Center 657,150 $2,775,457 55 10 44
Harpswell Total 2,284,427 $10,398,228
Harpswell has three ports, East Harpswell, Harpswell, and Harpswell Center. As shown in Table 9, total landings in Harpswell amount to 2.3 million pounds valued at about $10.4 million in 2014.
Harpswell port supports 209 fishermen, 29 dealers, and 125 vessels. Thirty-three and fifty-five fishermen land in East Harpswell port and Harpswell Center, respectively. Since the same fishermen can land in different ports during different fishing trips, adding up fishing, dealer, and vessel contributors can generate double-counting. However, the total number for all three ports (without duplicate records) can be requested from the data source, the Atlantic Coastal Cooperative Statistics Program.

26
Appendix A: List of Industry-Specific Data Sources and IndicatorsCommercial Fishing:
NOAA Fisheries Regional Offices, including ◆ Greater Atlantic Region Permit Office
(greateratlantic.fisheries.noaa.gov/aps/permits/index.html) ◆ Alaska Regional Office Permits and Licenses
(alaskafisheries.noaa.gov/permits-licenses) ◆ Pacific Islands Regional Office Fishing Permits
(fpir.noaa.gov/SFD/SFD_permits_index.html) ◆ Southeast Regional Office List of Current Permits (sero.nmfs.noaa.gov/operations_
management_information_services/constituency_services_branch/freedom_of_information_act/common_foia/index.html)
• The address, landing port, effective date, etc. by each vessel, dealer, or harvesting permit holder
NOAA National Marine Fisheries Partners and Data Contributors (st.nmfs.noaa.gov/data/fis/structure/partnerships), including
◆ Alaska Fisheries Information Network (akfin.org) ◆ Atlantic Coastal Cooperative Statistics Program (accsp.org) ◆ Gulf States Marine Fisheries Commission (www.gsmfc.org) ◆ Pacific Fisheries Information Network (pacfin.psmfc.org) ◆ Western Pacific Fisheries Information Network (www.pifsc.noaa.gov/wpacfin) ◆ Recreational Fisheries Information Network (www.recfin.org)
• Aggregated fishing statistics from both federal and state resources for landing tons, values, fishing licenses, and vessel permits by species and ports
NOAA Commercial Fisheries Statistics (st.nmfs.noaa.gov/commercial-fisheries)• Landing tons and values by species and areas
NOAA Commercial Landings Query (foss.nmfs.noaa.gov)• One-stop shop for fisheries data by states and areas
NOAA Interactive Fisheries Economic Impacts Tool (st.nmfs.noaa.gov/apex/f?p=160:7:224395037917386::NO)
• Total jobs impacted by fishing industries by states and areas
State Departments of Natural Resources• The address, landing port, effective date, etc. by each fishing license and landing permit• Landing tons and values by species and ports
Regional and Local Fishermen and Fishing Supply Merchants’ Associations• Directory of businesses and relevant information

27
Marine Construction:
U.S. Army Corps of Engineers: Corps Owned Dredges (www.navigationdatacenter.us/data/datadrgcorp.htm)
• Information about dredging activities performed by the Corps owned and operated dredges
U.S. Army Corps of Engineers: Dredging Contracts (www.navigationdatacenter.us/dredge/dredge.htm)
• Information of all corps dredging contracts in the designated fiscal year
Marine Transportation:
U.S. Department of Transportation, Maritime Administration: Open Data Portal (marad.dot.gov/resources/data-statistics/)
• Foreign trade statistics by port and district• List of U.S. flag fleet, tug-barges, and carries, etc.• List of merchant and trade fleets• Vessel inventory report• Vessel calls by port, terminal, and lightering area
Port Industry Statistics (aapa-ports.org/unifying/content.aspx?ItemNumber=21048)• Tons and values of import and export by port• Container box traffic by port
Freight Analysis Framework (faf.ornl.gov/fafweb/Default.aspx)• Tons and values of freight movement among states and major metropolitan areas by all modes of
transportation
U.S. Army Corps of Engineers: Ports and Waterways Facilities (www.navigationdatacenter.us/ports/ports.htm)
• List of port facilities• Complete list of docks
U.S. Army Corps of Engineers: National Waterway Network (www.navigationdatacenter.us/data/datanwn.htm)
• Shape files of port facilities and boundaries
Intermodal Transportation Network: All Modes (www-cta.ornl.gov/transnet/Intermodal_Network.html)
• Distribution of National Waterways Network with attached global seaways
Automatic Identification System (AIS) (marinetraffic.com/ais)• Information for vessel traffic services (VTS) from the automatic tracking system installed on ships
AlphaLiner Shipping Information Service (alphaliner.axsmarine.com/PublicTop100)• Number of containerships by shipping company

28
Offshore Minerals:
Energy Information Administration: Crude Oil Production (eia.gov/dnav/pet/pet_crd_crpdn_adc_mbbl_m.htm)
• Barrels of oil production by state and area
Energy Information Administration: Offshore Gross Withdrawals of Natural Gas (eia.gov/dnav/ng/ng_prod_off_s1_a.htm)
• Millions of cubic feet of natural gas production by state and area
Ship and Boat Building and Repairing:
U.S. Department of Transportation, Maritime Administration: Survey of U.S. Shipbuilding and Repair Facilities (marad.dot.gov/ships-and-shipping/national-maritime-resource-and-education-center/shipyard-reports/)
• List of the major U.S. private shipbuilding and repair facilities by region and city
MarineLog Trade Journal: Shipbuilding Contracts (simmonsboardman.com/shipbuildingmarinelog)
• Latest known shipbuilding contracts• North America Shipyard Directory
Local Boat Builders Show Exhibitor List, Boat Trade Associations, Boat Magazines• Directory of businesses and relevant information
Tourism and Recreation:
NOAA National Marine Fisheries Service: Saltwater Angler Expenditures (st.nmfs.noaa.gov/economics/fisheries/recreational/index)
• Trip-based expenditures by states
U.S. Coast Guard, Recreational Vessel Accident Statistics (uscgboating.org/statistics/accident_statistics.php)
• Recreational vessel registration and accident records by state
U.S. Fish and Wildlife Service, State Sport Fishing License Sales Data (wsfrprograms.fws.gov/Subpages/LicenseInfo/Fishing.htm)
• Fishing licenses and costs by state
U.S. Department of Transportation, Maritime Administration: Open Data Portal (marad.dot.gov/resources/data-statistics/)
• Cruise passengers by cruise ship and port
Port Industry Statistics (aapa-ports.org/unifying/content.aspx?ItemNumber=21048)• Cruise passenger traffic by port
State Offices of Tourism• Number of tourists and studies
Local Tourism Industries Report• Number of visitors, hotel occupancy rates, and admission sales• Tourism surveys
Short-Term Rental Homes and Cabins Website (VRBO, AirBnB)• Number of accommodations for tourism and recreation

29
Appendix B: Caveats and Best Practices for Processing Data SourcesA wide variety of supplementary data sources are available to provide a full picture of working waterfront values. However, several issues may arise in assembling these different industry-specific data, such as double-counting. Here is a list of common caveats and best practices to mitigate these issues.
• Some data sets may not have a specific employment or job indicator, so a proxy can be used. Fishing license data, for example, may have a unique identification number for each fisherman. This identifier could be used instead of the total count of individual licenses, which may include duplicates for fishermen involved in multiple fisheries. Using the unique identifier would be a better indicator than total licenses to avoid double-counting.
• Some data sets may contain important geographic information that needs to be considered in the estimation. Business-related data usually reflect the business’ registered address, instead of where the owners come from or where they conduct their business activities. For example, it’s important to realize that fishermen can land their catch in different ports and can be recorded at different locations in the same statistics. Adding up the landing pounds and values across the ports will not double-count the total catch, but adding up the number of fishermen landing at the different ports might generate double-counting.
• Some data sets may contain indicators with similar names, but which use different computation methods. Some job indicators are calculated as an average through the full-time equivalent (FTE). Some job indicators are actual counts of jobs, whether full-time or part-time. For example, employment statistics usually provide FTE numbers, while self-employed statistics usually count actual jobs. A proxy of total jobs could be computed by adding up these two indicators, but the estimation results must be accompanied by an explanation of the methods used.
• Different data sets may not be compatible in a time series. Most data series have a few months, or years, delay in availability. For example, though preliminary employment statistics might be able to be released quarterly, comprehensive annual statistics are usually released with a one- to two-year delay.
• Different data sets may not be compatible in geographic scope. Zip code boundaries and other geographic dimensions of many local data sets change frequently year by year and do not always conform to municipal boundaries. Extra spatial computation might be required to merge different data sets or compare different years of data for one data set.

30
Appendix C: List of Resources on Non-market Values and ImpactsNOAA Office for Coastal Management Coastal County Snapshots (coast.noaa.gov/snapshots)
• Status, trends, and comparison of ocean jobs and wages by county
NOAA Fisheries Social Indicators for Fishing Communities (st.nmfs.noaa.gov/humandimensions/social-indicators)
• Social vulnerability, gentrification pressure, sea level rise vulnerability, fishing engagement, and reliance indicators by fishing communities
NOAA National Marine Sanctuaries Socioeconomics (sanctuaries.noaa.gov/science/socioeconomic)
• Socioeconomic profiles by marine sanctuary sites
NOAA Office for Coastal Management Stories from the Field (coast.noaa.gov/digitalcoast/stories)
• Economic stories at regional, state, and local scales
Working Waterfronts Case Studies, Oral Histories, and Resources (wateraccessus.com/implementation.cfm)
• Models of coastal stakeholders working cooperatively to resolve challenges of competing working waterfront uses
National Ocean Economics Program (NOEP) Non-market Values Overview and Studies (oceaneconomics.org/nonmarket)
• Valuation studies and estimations by state and territory
Marine Ecosystem Services Partnership Mapper and Valuation Library (marineecosystemservices.org/explore)
• Valuation studies and estimations by ecosystem and location
State and Local Marine Labs, Extensions, and Research Institutes• National Association of Marine Laboratories Directory (naml.org/members/directory.php)• Local research and development in the physical, engineering, and life sciences

31

NOAA OFFICE FOR COASTAL MANAGEMENT2018