Telemetry Monitoring For Nurses and Monitor...
14
Nihon Kohden America is a subsidiary of • 800.325.0283 • 90 Icon Street Foothill Ranch CA 92610 • www.nkusa.com Telemetry Monitoring For Nurses and Monitor Technicians May, 2011
Transcript of Telemetry Monitoring For Nurses and Monitor...

Nihon Kohden America is a subsidiary of • 800.325.0283 • 90 Icon Street Foothill Ranch CA 92610 • www.nkusa.com
Telemetry Monitoring
For Nurses and Monitor Technicians
May, 2011

Telemetry ECG Monitoring for Nurses and Monitor Technicians May 2011
2 of 18
Purpose
This self-study packet is designed to introduce the telemetry monitoring users to the basic principles and
procedures for ECG monitoring on the Nihon Kohden telemetry system.
Learning Objectives
By completing this self-study packet, you will be able to:
1. Describe proper ECG electrode placement and skin preparation procedures for continuous
ECG monitoring.
2. Discuss the ST-segment monitoring capabilities.
3. Describe the cleaning procedures and interventions for troubleshooting ECG monitoring issues.
Introduction
The 12-lead ECG is used to help identify primary conduction abnormalities, arrhythmias, cardiac hypertrophy,
pericarditis, electrolyte imbalances, myocardial infarction or ischemia, and the site and extent of these disorders.
The benefits of the 12-lead are expanded as we continuously monitor this ECG tracing on the bedside and
telemetry monitoring systems today.
This packet will quickly review the cardiac anatomy, and describe how the ECG tracing correlates to it. It will
review how the telemetry monitor processes the ECG waveform for heart rate and arrhythmias, and for
pacemaker detection, and lastly, it will discuss the ST-segment monitoring capabilities on the Nihon Kohden
telemetry system.
The way that this heart is stimulated to pump is through its own internal electrical system; the heart’s generator
if you will. This electrical system consists of impulse generator cells, as well as impulse conductor cells that
conduct these impulses to the myocardium to stimulate it to contract and pump the blood. The Sino-atrial (SA)
node, which is located high in the right atrium, is the normal pacemaker in the heart that sets the rhythm and
rate for the cardiac function. Once the impulse is generated in the SA node, it spreads throughout the atria and
down to the Atrio-Ventricular (AV) node, where is it held so that the atria can contract. When the impulse
leaves the AV node, it travels through the Bundle of His, down through the right and left Bundle branches to the
Purkinje fibers that are in contact with the ventricular myocardium. Once these cells are stimulated, they
contract and squeeze the blood from the ventricles and out to the body. It is this ventricular contraction that
produces the palpable pulses. The electrical activity MUST precede the mechanical activity, so it is the
electrical activity that we capture on the monitor as the ECG signal, NOT the mechanical contraction that
generates the pulse.
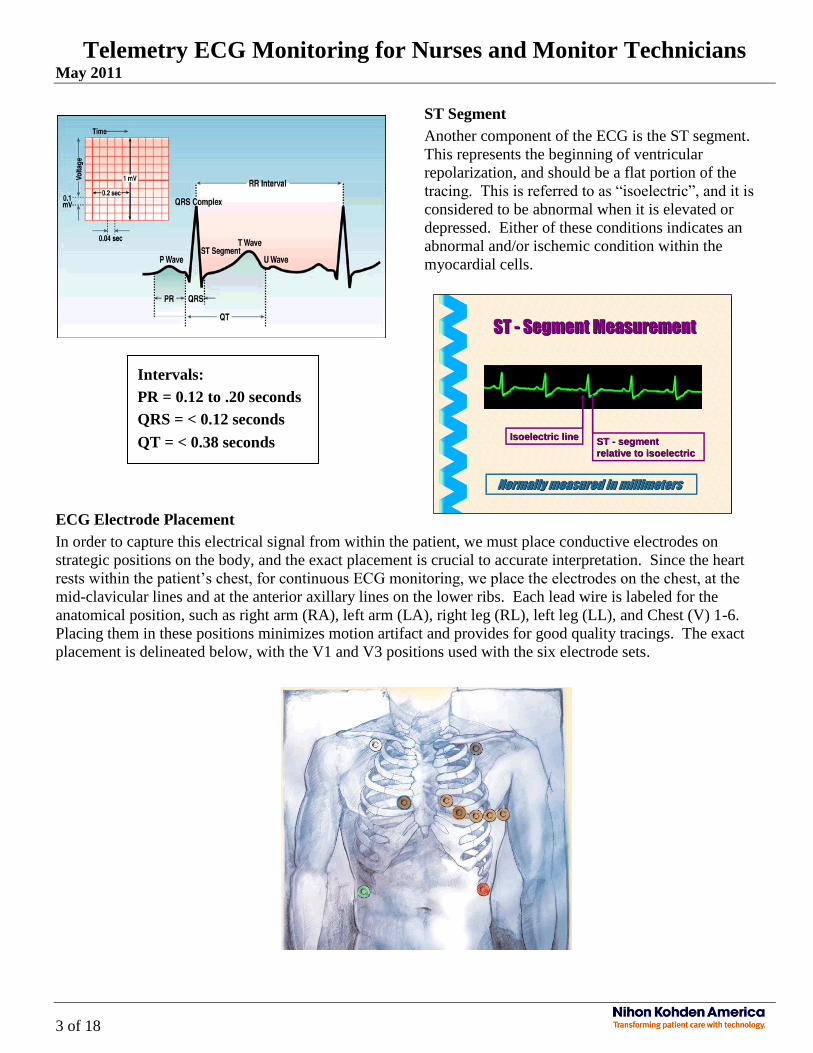
The Electrocardiogram
The electrocardiogram (ECG) is the electrical activity that is captured by placing conductive electrodes onto the
patient. As the impulses travel throughout the heart’s chambers, specific components are produced on the ECG.
The p-wave represents atrial depolarization, which are the electrical changes that are required in order for the
muscle to contract. The PR segment represents the length of time that the impulse is held in the AV node and
Bundle of His before it proceeds through to the Bundle branches. The QRS represents the wave of ventricular
depolarization as it travels through the right and left Bundle branches and the Purkinje fibers to stimulate these
cells. The t-wave represents ventricular depolarization, where the myocardial cells return to the normal
electrical state and prepare to receive the next impulse. Our interest lies in the lengths of time that it takes for
each of these events to occur, and the normal times are listed below.
Telemetry ECG Monitoring for Nurses and Monitor Technicians May 2011
3 of 18
ECG Electrode Placement
In order to capture this electrical signal from within the patient, we must place conductive electrodes on
strategic positions on the body, and the exact placement is crucial to accurate interpretation. Since the heart
rests within the patient’s chest, for continuous ECG monitoring, we place the electrodes on the chest, at the
mid-clavicular lines and at the anterior axillary lines on the lower ribs. Each lead wire is labeled for the
anatomical position, such as right arm (RA), left arm (LA), right leg (RL), left leg (LL), and Chest (V) 1-6.
Placing them in these positions minimizes motion artifact and provides for good quality tracings. The exact
placement is delineated below, with the V1 and V3 positions used with the six electrode sets.
ST Segment
Another component of the ECG is the ST
segment. This represents the beginning of
ventricular repolarization, and should be a flat
portion of the tracing. This is referred to as
“isoelectric”, and it is considered to be
abnormal when it is elevated or depressed.
Either of these conditions indicates an
abnormal and/or ischemic condition within the
myocardial cells.
ST ST -- Segment MeasurementSegment Measurement
Isoelectric lineIsoelectric lineST ST -- segment segment
relative to isoelectricrelative to isoelectric
Normally measured in millimeters Normally measured in millimeters
Intervals:
PR = 0.12 to .20 seconds
QRS = < 0.12 seconds
QT = < 0.38 seconds
ST Segment
Another component of the ECG is the ST segment.
This represents the beginning of ventricular
repolarization, and should be a flat portion of the
tracing. This is referred to as “isoelectric”, and it is
considered to be abnormal when it is elevated or
depressed. Either of these conditions indicates an
abnormal and/or ischemic condition within the
myocardial cells.

Telemetry ECG Monitoring for Nurses and Monitor Technicians May 2011
4 of 18
Chest Leads
The six-electrode lead set allows you to continuously monitor eight leads of the 12 lead ECG: I, II, III, aVR,
aVL, aVF, and two V-leads. The recommended starting V leads are V1 and V3 as V1 is used to evaluate QRS
morphology in tachy-arrhythmias, and V3 is the most sensitive lead for detecting anterior wall ischemia in the
left ventricular (ST segment). If the patient has ischemia in another wall of the left ventricle, the second V lead
can be placed in a different position to monitor for that condition. Or if the patient has chest dressings, V6 can
be used instead of V1. It is recommended that you check with the physician for the best placement for the
patient.
But not only is it important to place the electrodes correctly, but it is even more important to prepare the skin to
conduct the impulses from the patient to the monitor. The following procedure for continuous ECG monitoring
is accepted as policy at Renown and is supported by the American Association of Critical Care Nurses (AACN)
Skin Preparation
1. Select electrode site according to placement diagram and the patient’s condition
2. Clip excess hair
3. Gently abrade skin with dry gauze to remove dead cells. Dead cells interfere with electrical conduction
and cause inadequate tracings for analysis
4. If the skin is oily, clean site with alcohol and friction if necessary to remove skin oils and allow the site
to dry. This step is not required for every patient
5. Attach lead-wire to electrode
6. Attach electrode to patient, pressing circumference of electrode to secure
7. Change electrodes according manufacturers recommendations to insure adequacy of adhesive and
conduction medium
NOTE: Fasten lead-wire to skin with tape to minimize interference from patient motion (Stress Loop),
if necessary.
ECG Electrode sidebar
ECG electrodes conduct the small electrical currents (less than 1mV) from the patient to the monitor.
The monitor, or transmitter, then amplifies this current so that it can be displayed on the screen. If an
electrode becomes dry or does not make good contact with the skin, it cannot conduct the current, but
rather, holds onto it, causing a “saturation” of the ECG signal. When this occurs, the signal is too strong
for the monitor to display until the electrode discharges it, much like a static electricity discharge. An
offset is seen on the ECG tracing and a loss of signal is detected until the charge is released.

Telemetry ECG Monitoring for Nurses and Monitor Technicians May 2011
5 of 18
Selecting the ECG lead
The ECG lead choices are presented in the ECG>Lead Select menu on the central monitor. To access this
menu, touch the patient window, and then touch his heart rate value to enter the ECG parameter setup menu.
The Trace 1 and Trace 2 ECG leads are used for heart rate, pacemaker and arrhythmia processing using the
single or multi lead analysis controls. To change the lead, touch the desired option for each trace.
In addition to changing the lead(s) that are used for processing, this also controls the leads that are displayed in
the All Beds and Individual Beds real time displays, and in the full disclosure storage for the first and second
tracings: Trace 1 and Trace 2. When you change the ECG leads, the full disclosure will store the new lead as
Trace 1 and Trace 2 based on this screen selection.
There are times when the patient’s condition warrants monitoring other than the V1 and V3 chest leads. In this
case, the electrode positions are moved to the appropriate chest position on the patient, and the lead label is
changed for the Va and Vb leads in the ECG>Lead Name menu to reflect the actual position.
Auto Lead Change
The AUTO LEAD CHANGE function (ECG>Other Settings Tab) allows the monitor to switch between leads I,
II, III when single limb lead monitoring electrodes are lost (RA/LA/LL) to continue ECG monitoring and
arrhythmia processing. When this occurs, an AUTO LEAD CHANGE message appears on the screen to
indicate that the selected lead is not available. When the electrode is replaced, the selected monitored lead is
displayed.
NOTE: The right leg electrode is the ground for the system. If this electrode is lost, all ECG waveforms
are lost and a CHECK ELECTRODE message is displayed until this electrode/lead-wire is replaced. Lost
V-lead electrodes result in the CHECK ELECTRODE message as well.

Telemetry ECG Monitoring for Nurses and Monitor Technicians May 2011
6 of 18
Arrhythmia Monitoring
The ECG waveform is monitored for heart rate, arrhythmias, ST segment measurements and pacemaker
activity. Single or multi-lead analysis is available, and when ARRHYTHMIA ANALYSIS setting is set to ON,
the monitor uses a template matching method to determine the ECG rhythm in the monitored analysis lead or
leads. It “learns” the rhythm over about a 10-second period and displays the dominant QRS when the patient is
attached to the monitor, when the lead is changed, when a “CHECK ELECTRODE” alarm is resolved or when
the patient’s dominant ECG waveform changes. This dominant QRS(s) is displayed in the ECG menu and is
the reference waveform that is used to compare with each beat of the real time waveform and to label
arrhythmias accordingly. Up to eight templates are created if the complexes are variable, such as with atrial
fibrillation, and with demand pacemakers. If the new beat exceeds the criteria for a normal beat, the monitor
will analyze it and make a call based on the following criteria:
Event Description
Asystole > 3-10 seconds (selectable) with no QRS – most select 3 seconds
VF Greater than four seconds of ventricular fibrillation
VT Ventricular Tachycardia. 9 or more consecutive VPC’s at a rate >100/min
VPC Run VPC short run. User selects 3-8 consecutive VPC’s – most select 3
Couplet Paired VPC’s
Early VPC VPC with a time interval from the preceding normal QRS of < approx. 40% of normal R-R
Bigeminy 3 or more consecutive pairs of VPC and normal QRS
Freq VPC VPC rate/minute reaching or exceeding preset VPC limit
Tachycardia Reaching the upper HR limit
Bradycardia Reaching the lower HR limit
When abnormal beats are identified by the monitor, it labels them in the algorithm, and it annotates them on the
on the stored event in the Arrhythmia Recall screens. The following annotations are used:
• N: Normal beat
• V: Ventricular premature contraction (VPC)
• P: Paced beat
• -: Noise
• ?: Cannot classify (learning)
These annotations are helpful in determining the cause of an alarm, as the clinician can determine if the beats
are true, if there is NOISE in the tracing that prevented the monitor for being able to analyze the rhythm, or if
the monitor is labeling artifact as ventricular beats. The clinician can take appropriate action based on his or her
interpretation of the call.

Telemetry ECG Monitoring for Nurses and Monitor Technicians May 2011
7 of 18
Optimal QRS Morphology in the Monitored Lead(s)
To determine the best lead or leads for arrhythmia monitoring on an individual patient, (Trace 1 and/or Trace
2); insure that the electrodes are placed in the appropriate positions on the patient and then view all leads in the
ECG 12-lead Display screen to decide which lead best meets the following criteria;
o Normal QRS must be greater than 0.5 mV (one large box at x1 sensitivity on the ECG paper) and
less than 2.0 mV (four large boxes) amplitude for arrhythmia detection.
o Normal QRS should have similar amplitude to VPC beat or paced beat.
o P wave should be less than 0.2 mV (2 small boxes at x1 sensitivity) amplitude (otherwise may be
counted as another QRS).
o T wave amplitude should be less than 1/3 of the normal QRS (otherwise may be counted as
another QRS).
o The selected lead should have minimal baseline noise to provide for accurate QRS detection.
The ECG QRS Detection Sensitivity is set to AUTO for the monitor to automatically find the optimal
sensitivity for arrhythmia processing, which should be x1 or x2. If you find that the ECG waveform requires a
x4 display setting, this indicates that the amplitude of the ECG signal is adequate, and you risk having events go
undetected or for having false asystole or bradycardia alarms. Insure that the left leg electrode is positioned
appropriately to provide the tallest QRS complex in lead II.
The monitor will analyze the rhythm and annotate the beats, but it is possible that a V-tach rhythm could be
interpreted as v-fib and vice versa due to the varying morphology of some complexes. If the true event is
labeled as either V-tach or V-fib, the interpretation is considered to be accurate.
QRS1 = Normal QRS
QRS2 = VPC

Telemetry ECG Monitoring for Nurses and Monitor Technicians May 2011
8 of 18
LEARN ECG
There are times when you should manually "relearn" the reference ECG waveform, such as when the patient’s
rhythm has changed, or if the monitor is labeling a normal beat a VPC or an abnormal rhythm as normal. If
there is any doubt about the arrhythmia analysis, manually relearn the patient's rhythm using the LEARN ECG
key in the ECG parameter setup menu on the central station. This process learns the current complexes as the
dominant QRS’s, and should eliminate the false analysis as long as adequate tracings are maintained as
previously discussed.
CAUTION: Do not learn ventricular complexes as this directs the monitor to learn them as normal and
to disregard them when they occur. This can lead to missed ventricular rhythm events on the monitor.
Pacemaker Detection
The monitor detects the presence of a paced rhythm if the PACE DETECT function is turned to ON in the
ECG>Other Settings tab and if the pace impulse is of a voltage that the monitor can detect. Any beat that is
detected to be preceded by a pacer spike is labeled as P and is not analyzed for arrhythmias.
When pacing is detected, a PACING message appears on the screen. A tall mark appears to enhance each pace
impulse if the pacing MARK is turned to ON.
There are many types of pacemakers on the market today, so if the paced rhythm is not being detected, or if the
monitor is labeling the paced beats as ventricular, it may be because the algorithm cannot “see” the pace
impulse but sees the wide QRS. In this case, the clinician has options to improve the detection.
It may be necessary to “relearn” the rhythm as we discussed, but moving the left leg electrode closer to the heart
for lead II analysis or changing the Trace 1 ECG lead are better choices. The monitor only uses Trace 1 for
pacemaker detection.
The V1 lead may be beneficial for pace detection if the electrode is placed correctly at the 4th
intercostal space
at the right sternal border, as this position provides a different view of the electrical activity.
NOTE: If you place the V1 lead in the Trace 1 ECG lead position, it is important to also change the second
Trace 2 lead from V1 to the other analysis lead choice.
Telemetry ECG Monitoring for Nurses and Monitor Technicians May 2011
9 of 18
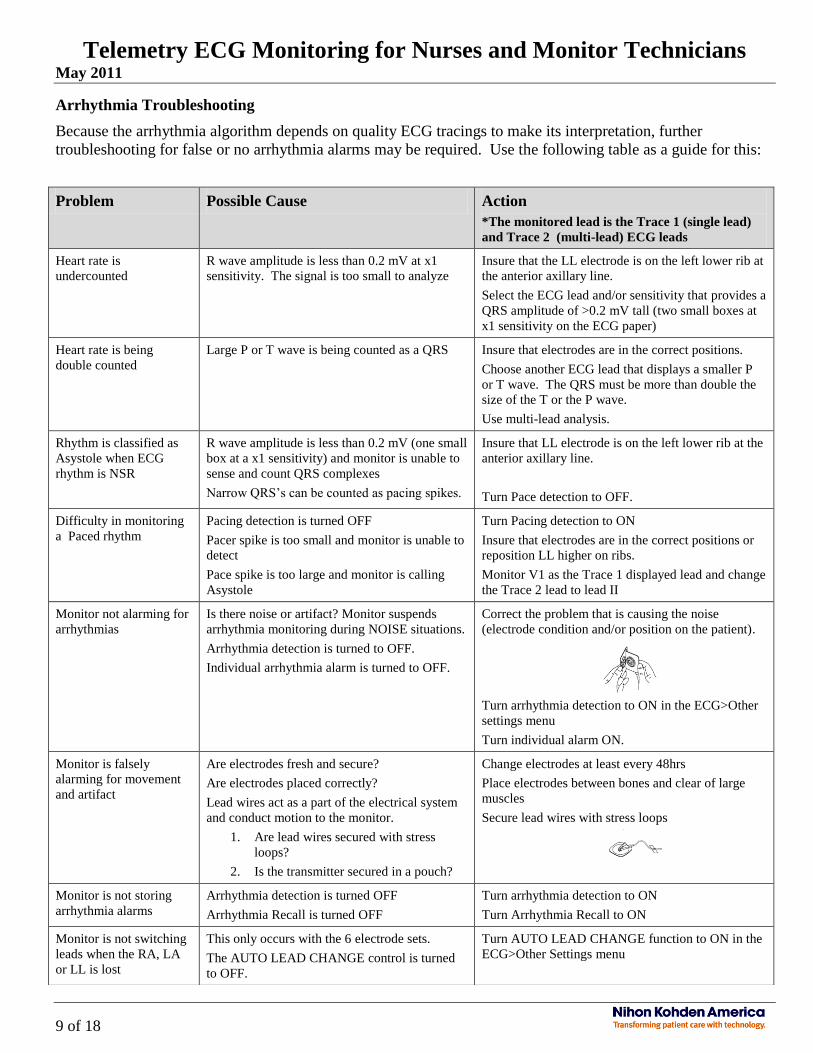
Arrhythmia Troubleshooting
Because the arrhythmia algorithm depends on quality ECG tracings to make its interpretation, further
troubleshooting for false or no arrhythmia alarms may be required. Use the following table as a guide for this:
Problem Possible Cause Action
*The monitored lead is the Trace 1 (single lead)
and Trace 2 (multi-lead) ECG leads
Heart rate is
undercounted
R wave amplitude is less than 0.2 mV at x1
sensitivity. The signal is too small to analyze
Insure that the LL electrode is on the left lower rib at
the anterior axillary line.
Select the ECG lead and/or sensitivity that provides a
QRS amplitude of >0.2 mV tall (two small boxes at
x1 sensitivity on the ECG paper)
Heart rate is being
double counted
Large P or T wave is being counted as a QRS Insure that electrodes are in the correct positions.
Choose another ECG lead that displays a smaller P
or T wave. The QRS must be more than double the
size of the T or the P wave.
Use multi-lead analysis.
Rhythm is classified as
Asystole when ECG
rhythm is NSR
R wave amplitude is less than 0.2 mV (one small
box at a x1 sensitivity) and monitor is unable to
sense and count QRS complexes
Narrow QRS’s can be counted as pacing spikes.
Insure that LL electrode is on the left lower rib at the
anterior axillary line.
Turn Pace detection to OFF.
Difficulty in monitoring
a Paced rhythm
Pacing detection is turned OFF
Pacer spike is too small and monitor is unable to
detect
Pace spike is too large and monitor is calling
Asystole
Turn Pacing detection to ON
Insure that electrodes are in the correct positions or
reposition LL higher on ribs.
Monitor V1 as the Trace 1 displayed lead and change
the Trace 2 lead to lead II
Monitor not alarming for
arrhythmias
Is there noise or artifact? Monitor suspends
arrhythmia monitoring during NOISE situations.
Arrhythmia detection is turned to OFF.
Individual arrhythmia alarm is turned to OFF.
Correct the problem that is causing the noise
(electrode condition and/or position on the patient).
Turn arrhythmia detection to ON in the ECG>Other
settings menu
Turn individual alarm ON.
Monitor is falsely
alarming for movement
and artifact
Are electrodes fresh and secure?
Are electrodes placed correctly?
Lead wires act as a part of the electrical system
and conduct motion to the monitor.
1. Are lead wires secured with stress
loops?
2. Is the transmitter secured in a pouch?
Change electrodes at least every 48hrs
Place electrodes between bones and clear of large
muscles
Secure lead wires with stress loops
Monitor is not storing
arrhythmia alarms
Arrhythmia detection is turned OFF
Arrhythmia Recall is turned OFF
Turn arrhythmia detection to ON
Turn Arrhythmia Recall to ON
Monitor is not switching
leads when the RA, LA
or LL is lost
This only occurs with the 6 electrode sets.
The AUTO LEAD CHANGE control is turned
to OFF.
Turn AUTO LEAD CHANGE function to ON in the
ECG>Other Settings menu

Telemetry ECG Monitoring for Nurses and Monitor Technicians May 2011
10 of 18
ST Segment Monitoring
But there is another reason to use multiple leads of ECG. The 10-second snapshot is a single point in time, and
your patients’ cardiovascular status is a dynamic process. Unless you take this 12-lead at the time that he is
experiencing a change in his condition, you will not see these changes on the sample. That’s where continuous
monitoring in all 12 leads is beneficial. The Nihon Kohden system provides continuous ST segment monitoring
on all leads that you are monitoring. These values are displayed on the screen, and they are captured as digital
numeric values and as minute-average waveforms within the monitors’ storage functions. There is also an
alarm function to notify you of changes if you choose.
Telemetry ECG Monitoring for Nurses and Monitor Technicians May 2011
11 of 18
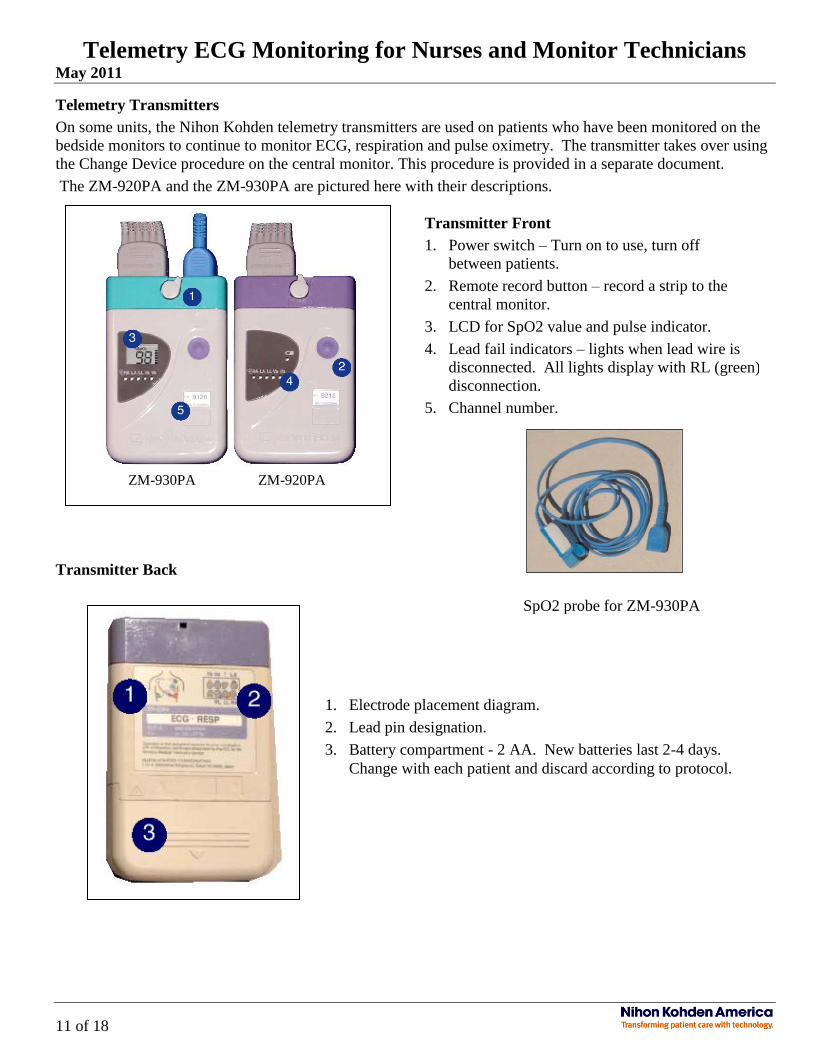
Telemetry Transmitters
On some units, the Nihon Kohden telemetry transmitters are used on patients who have been monitored on the
bedside monitors to continue to monitor ECG, respiration and pulse oximetry. The transmitter takes over using
the Change Device procedure on the central monitor. This procedure is provided in a separate document.
The ZM-920PA and the ZM-930PA are pictured here with their descriptions.
Transmitter Back
SpO2 probe for ZM-930PA
1. Electrode placement diagram.
2. Lead pin designation.
3. Battery compartment - 2 AA. New batteries last 2-4 days.
Change with each patient and discard according to protocol.
ZM-930PA ZM-920PA
Transmitter Front
1. Power switch – Turn on to use, turn off
between patients.
2. Remote record button – record a strip to the
central monitor.
3. LCD for SpO2 value and pulse indicator.
4. Lead fail indicators – lights when lead wire is
disconnected. All lights display with RL (green)
disconnection.
5. Channel number.

Telemetry ECG Monitoring for Nurses and Monitor Technicians May 2011
12 of 18
Cleaning the Transmitter
Wipe the outside surface of the transmitter and electrode lead wires with a non-abrasive cloth moistened with
disinfecting alcohol or neutral detergent (i.e. Ivory) diluted with water. Dry completely.
Disinfecting the Transmitter
Wipe the outside surface of the transmitter and electrode lead wires with a non-abrasive cloth moistened with
any of the disinfectants listed below. Use the recommended concentrations.
Disinfectant Concentration (%) Example
ProSpray Spray or wipes
Disinfecting Alcohol 70%
Sporocidin Disinfectant Spray or wipes
Glutaraldehyde solution 2.0 Cidex
Hydrochloric alkyl diaminoethylglycine 0.5
Benzalkonium chloride 0.2 BZK Towelettes
Benzethonium chloride solution 0.2
Chlorohexidine gluconate solution 0.5 Hibistat®
Respiration Monitoring
In addition to ECG monitoring that we’ve discussed above, the Nihon Kohden transmitters detect respiration
through the right arm and left leg ECG electrodes. By placing the LL electrode on the lower rib at the anterior
axillary line, you will see a good respiration lead, in addition to the ECG on most patients. As the patient
breathes, the monitor detects a change in the electrical current and it displays a waveform on the screen. A per-
minute respiratory rate is displayed and stored in the monitor trends as well. To improve the respiration
detection, use fresh electrodes and you can move the LL electrode up to the 5th
intercostal space if you choose.
SpO2 – Oxygen Saturation
The ZM-930PA transmitters monitor SpO2 continuously using an infrared finger
sensor that attaches to the transmitter. The SpO2 value and a pulse indicator are
displayed on the transmitter display and the SpO2 and pulse rate values and a
waveform are displayed on the central monitor screen. These values are trended in
the monitor’s memory.

Telemetry ECG Monitoring for Nurses and Monitor Technicians May 2011
13 of 18
Conclusion
Continuous ECG monitoring was developed in an effort to provide clinicians with continuous ECG information
in an effort to improve mortality rates for patients experiencing acute myocardial infarctions. But through the
decades of using this technology in conjunction with their clinical expertise, clinicians have identified many
more clinical applications for it.
ECG monitoring has become a standard of care, not only in intensive care units, but in virtually every patient
care area in the hospital. The technology has evolved to be able to detect the heart rate and rhythm, to include
paced ones, and we are now able to monitor this rhythm for morphological and ST changes so that we can
detect changes in our patient’s condition and to intervene in a timely manner. By acquiring the best tracings
possible and by monitoring in the appropriate leads for the patient, clinicians facilitate improved outcomes
during his hospital stay.
The Nihon Kohden telemetry monitoring system provides the capability to continuously monitor one or eight,
leads of ECG for the clinician to use in the course of hospital treatment. This technology is a tool in the
clinician’s assessment toolbox, to be used in conjunction with clinical judgment, and not as a replacement for it,
and the clinician’s responsibility is to insure that this monitor data is accurate and valid.
We do this by using the proper ECG monitoring procedures for skin preparation and electrode placement, by
choosing the appropriate leads for monitoring based on the patients’ condition, and by addressing true as well as
false alarm situations. The analysis that is reported by the monitor is only as good as the information that it has
to work with. If it is provided with good information for analysis, it will report data that is useful in clinical
decision-making that supports the ultimate goal for improving patient outcomes.

Telemetry ECG Monitoring for Nurses and Monitor Technicians May 2011
14 of 18
References
AACN, (1998). Clinical reference for critical care nurses, 4th Edition. Mosby, St. Louis
AHA (2004) Practice Standards for Electrocardiographic Monitoring in Hospital Settings: An American Heart
Association Scientific Statement From the Councils on Cardiovascular Nursing, Clinical Cardiology,
and Cardiovascular Disease in the Young. AHA Scientific Statement. Retrieved February, 2005 from
http://www.circulationaha.org
Bell, N. (1992). Clinical significance of ST-segment monitoring. Critical Care Nursing Clinics
of North America, 4 (2).
Drew, B. (2002). Celebrating the 100th birthday of the electrocardiagram: Lessons learned from
research in cardiac monitoring. American Journal of Critical Care, 11 (4).
Drew, B. (2003). Value of monitoring a second precordial lead for patients in a telemetry unit.
Retrieved February, 2002 from www.gemedicalsystems.com.
Goode, D.P. (1984). The human body: The heart, the living pump. Torstar books, NY.
Grauer, K. (1998). A practical guide to ECG interpretation (2nd edition). Mosby, St. Louis.
Leeper, B. (2001). ST-segment monitoring across the continuum. AACN NTI News, July.