Taking Quality Assurance to the Next Level · Sysmex America Inc. ......
40
Taking Quality Assurance to the Next Level: Craig Vilk, MT(ASCP)SH CM Hematology Technical Specialist, MultiCare Health System, Tacoma, WA New Tools for Managing Quality Control and Quantifying their Impact on Lab Quality Metrics Scott Lesher Director, Technical QA Sysmex America Inc.
Transcript of Taking Quality Assurance to the Next Level · Sysmex America Inc. ......

Taking Quality Assurance to the Next Level:
Craig Vilk, MT(ASCP)SHCM
Hematology Technical Specialist, MultiCare Health System, Tacoma, WA
New Tools for Managing Quality Control and Quantifying their Impact on Lab Quality Metrics
Scott Lesher Director, Technical QA Sysmex America Inc.

BeyondCare℠ Quality Monitor is a revolu4onary new way to monitor analyzer performance, minimize down4me and maximize efficiency. This simplified approach to real-‐4me quality assurance monitoring can detect slight changes in analyzer performance as they happen, which can impact not only laboratory performance but hospital performance as well.
MODERNIZATION OF LABORATORY QC

HAS YOUR QUALITY CONTROL PROCESS FAILED YOU? Significant change in calibration during a routine 6 month
calibration verification event Bias exceeding ±3SDI when reviewing a peer comparison
report Unsatisfactory rating on a CLIA Proficiency Test Survey Increased repeats or reviews on patient samples, affecting staff
productivity or TAT Complaints from physicians or having to revise patient results Difficulty maintaining correlation between analyzers

HEMATOLOGY CALIBRATOR & QC
• Biological Calibrator & QC – Each batch of cells are different – Minimized matrix effect
• Cells react to analyzer reagents and hardware
• Similar to whole blood, cells con4nue to change in the vial
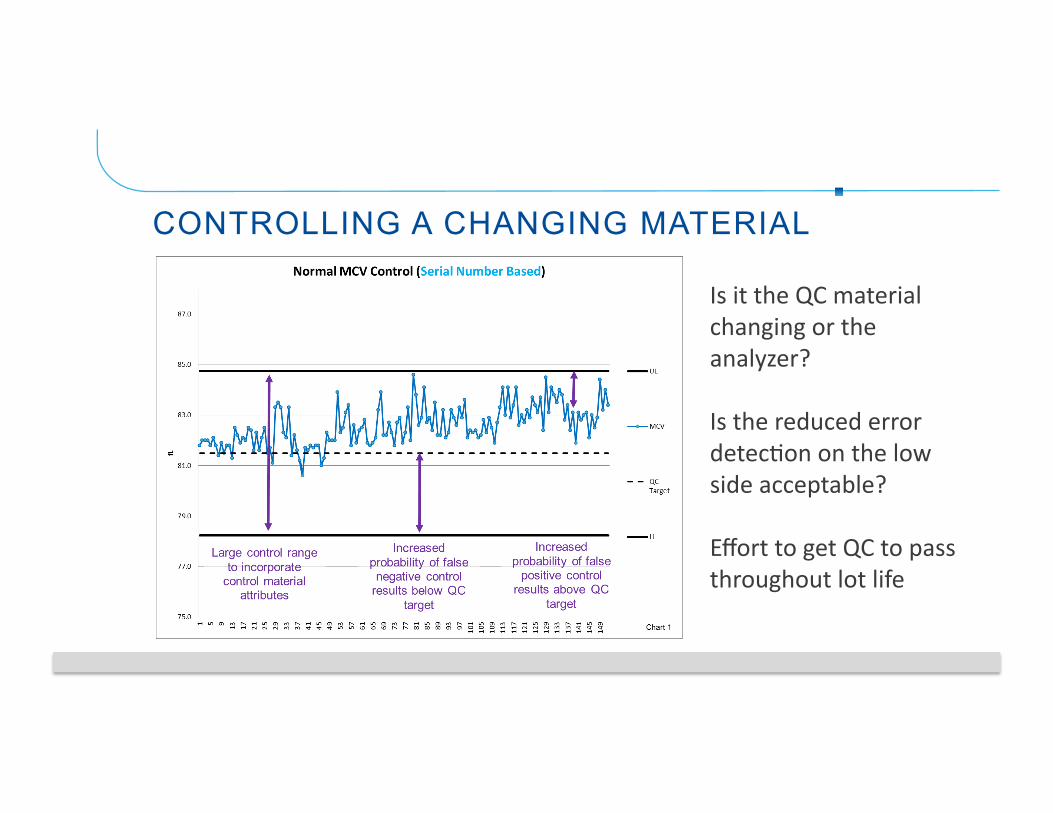
CONTROLLING A CHANGING MATERIAL
Is it the QC material changing or the analyzer?
Is the reduced error detec4on on the low side acceptable?
Effort to get QC to pass throughout lot life

TECHNOLOGY SOLUTIONS (BIG DATA)
1 Kim SJ, Lee EY, Song YJ, Song J, The instability of commercial control materials in quality control of mean corpuscular volume, Clinica Chimica Acta 434 (2014) 11-‐15.
A study from S.J. Kim et al. found MCV driZ can exceed 4SD by the 5th week of a control life [1]. The study also found re-‐establishment of the target mean value frequently might be a solu4on. The paper does iden4fy frequent target mean establishment might be “inefficient as it may considerably increase both the workloads and the expense of the laboratory”.

Automated real-time application that pushes information and instructions for consistent QA process Consistent process for service team and laboratory
Integrated QA application Traceability to international conventional reference measurement procedures IQAP Peer comparison Analyzer diagnostics data 13 algorithms for immediate error detection every time QC is run
Partnered approach in analyzer quality assurance

Quan4fying the Impact on Lab Quality Metrics Craig Vilk, MT(ASCP)SHCM
Hematology Technical Specialist,
Mul4Care Health System, Tacoma, WA

OBJECTIVES FOR TODAY
Gain an understanding of the BeyondCareSM Quality Monitor Describe how the use of the BeyondCareSM Quality Monitor can positively impact laboratory metrics such as TAT Discuss how the BeyondCareSM Quality Monitor can have a positive impact on the laboratory budget Explain how the change in laboratory metrics can impact hospital metrics such as ER length of stay

Quality Control What is Quality Control?

ESTABLISHING AN EFFECTIVE QUALITY SYSTEM IS CHALLENGING What to monitor?
QC shifts Coefficient of Variation (CV) Drift parameters Hardware
How to monitor it? Total error goals (TEa)
Correct Documentation What is required? How long to keep?
Laboratories must be able to demonstrate that there is an effec3ve ‘quality system’ in place and not just a series of uncoordinated ac3vi3es.1

Test method Quality • The first step to building a control plan is to understand
the test quality – Six Sigma is a great process to understand test method
quality – The higher the sigma score(σ) the easier to control – Test methods with sigma scores <3σ require rigorous
control processes to ensure clinical goals are met • The presentation is focused on automated cell counters
with sigma score >5σ – Easy to control with high probability to achieve clinical goals
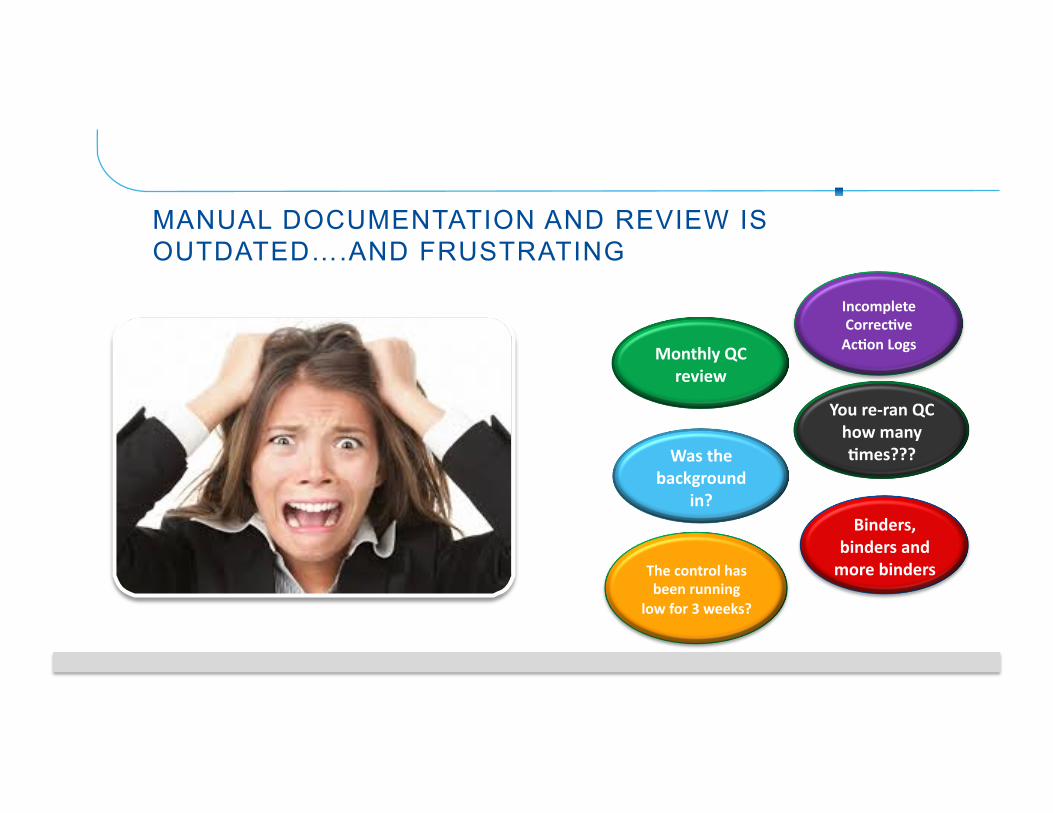
MANUAL DOCUMENTATION AND REVIEW IS OUTDATED….AND FRUSTRATING
Monthly QC review
Incomplete Correc@ve Ac@on Logs
The control has been running
low for 3 weeks?
Binders, binders and more binders
Was the background
in?
You re-‐ran QC how many @mes???

BeyondCare℠ Quality Monitor will transform the way laboratories manage quality control
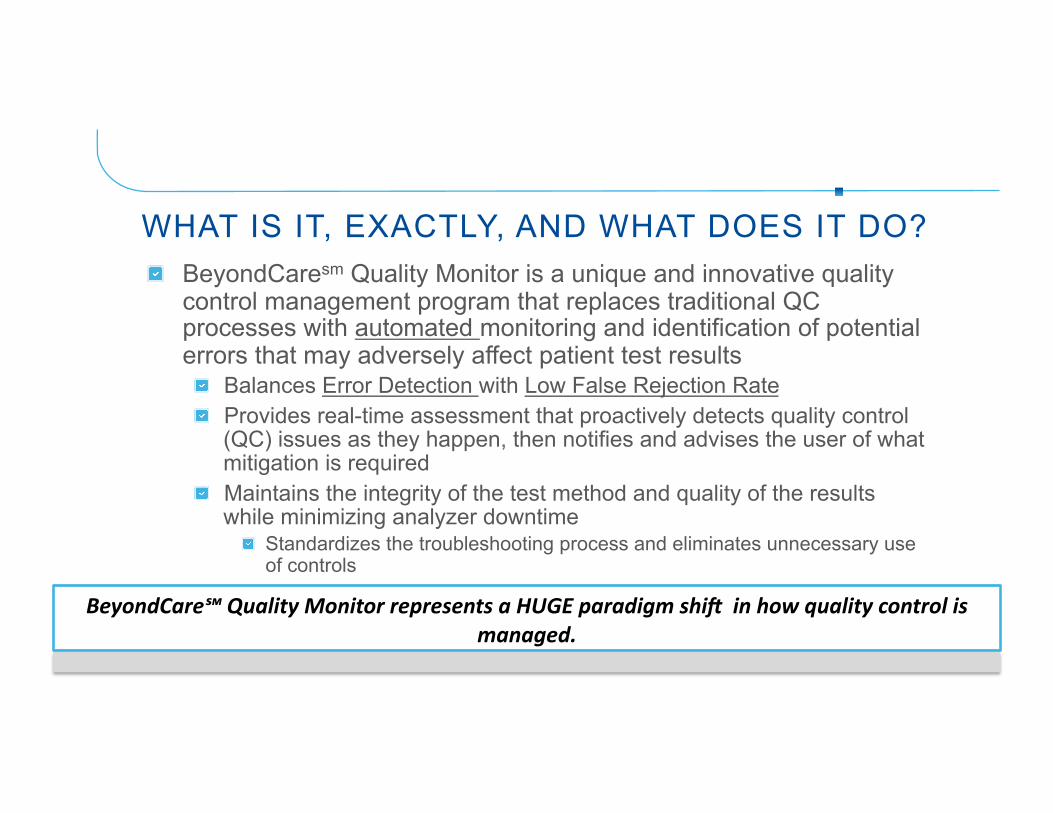
WHAT IS IT, EXACTLY, AND WHAT DOES IT DO? BeyondCaresm Quality Monitor is a unique and innovative quality
control management program that replaces traditional QC processes with automated monitoring and identification of potential errors that may adversely affect patient test results Balances Error Detection with Low False Rejection Rate Provides real-time assessment that proactively detects quality control
(QC) issues as they happen, then notifies and advises the user of what mitigation is required Maintains the integrity of the test method and quality of the results
while minimizing analyzer downtime Standardizes the troubleshooting process and eliminates unnecessary use of controls
BeyondCare℠ Quality Monitor represents a HUGE paradigm shiI in how quality control is managed.
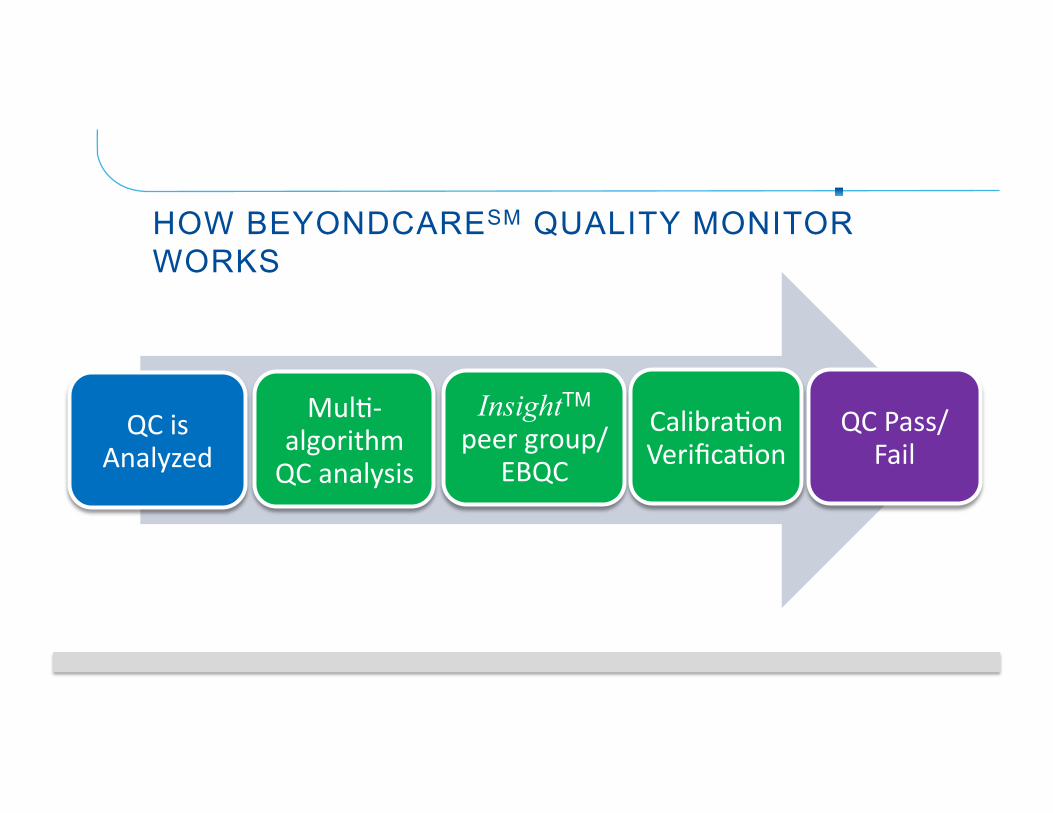
HOW BEYONDCARESM QUALITY MONITOR WORKS
QC is Analyzed
Mul4-‐algorithm QC analysis
InsightTM peer group/
EBQC
Calibra4on Verifica4on
QC Pass/Fail

BEYONDCARESM QUALITY MONITOR DASHBOARD
• Color-coded analyzer tabs for at-a-glance status updates
• Green = good to go • Yellow = more
information or action required
• Red = unresolved problem requires service intervention
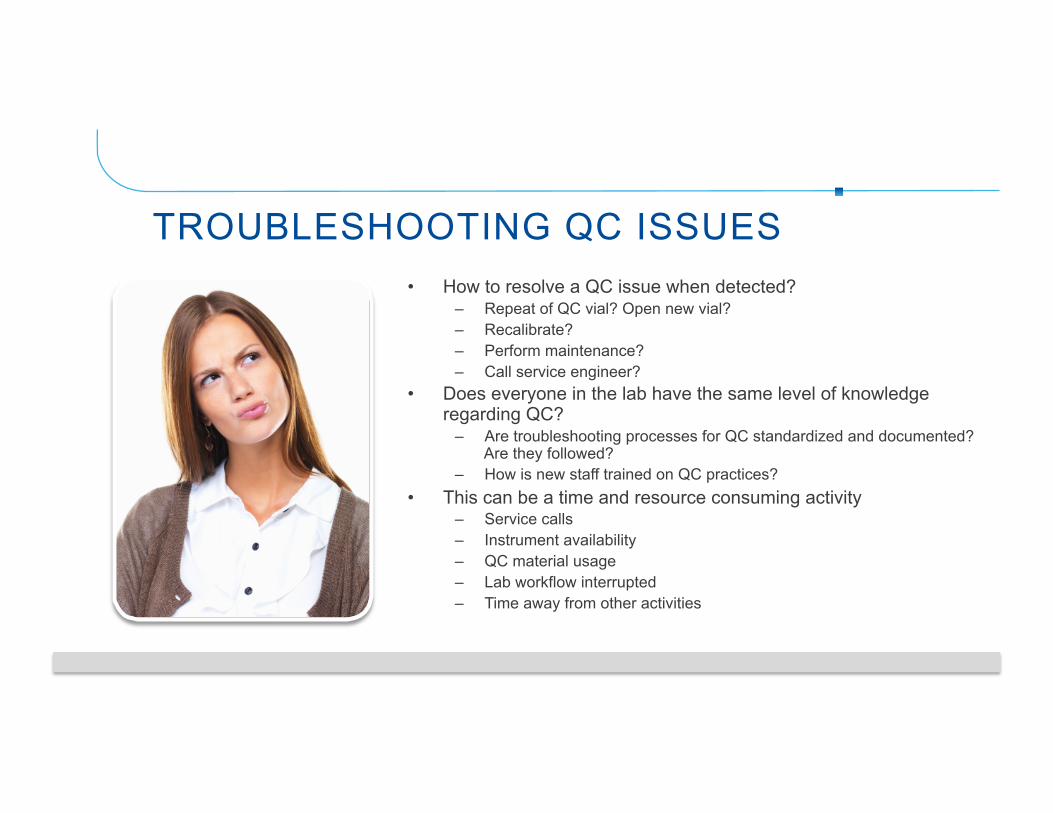
TROUBLESHOOTING QC ISSUES • How to resolve a QC issue when detected?
– Repeat of QC vial? Open new vial? – Recalibrate? – Perform maintenance? – Call service engineer?
• Does everyone in the lab have the same level of knowledge regarding QC?
– Are troubleshooting processes for QC standardized and documented? Are they followed?
– How is new staff trained on QC practices? • This can be a time and resource consuming activity
– Service calls – Instrument availability – QC material usage – Lab workflow interrupted – Time away from other activities

Easy identification of action required
BEYONDCARESM QUALITY MONITOR DASHBOARD

Information & instructions at time of need
BEYONDCARESM QUALITY MONITOR DASHBOARD

STREAMLINED REPORTING AND DOCUMENTATION
April 2016 21
Controls analyzed 3 times a day
Exceeded time between QC
analysis
QC and Backgrounds failed, Service
event, Calibration and
QC passed
Intermittent QC failures
monitored and proactive
service event to resolve issue

DETAILED DAILY VERIFICATION REPORT
Normalizes control levels to view in one chart
PloO
ng to
percent of
allowab
le error
Number of QC runs each day
Month and Day
Daily Pass/Fail
Easy paJern iden3fica3on means earlier iden3fica3on of shiIs, trends & errors.
Number of QC runs each day
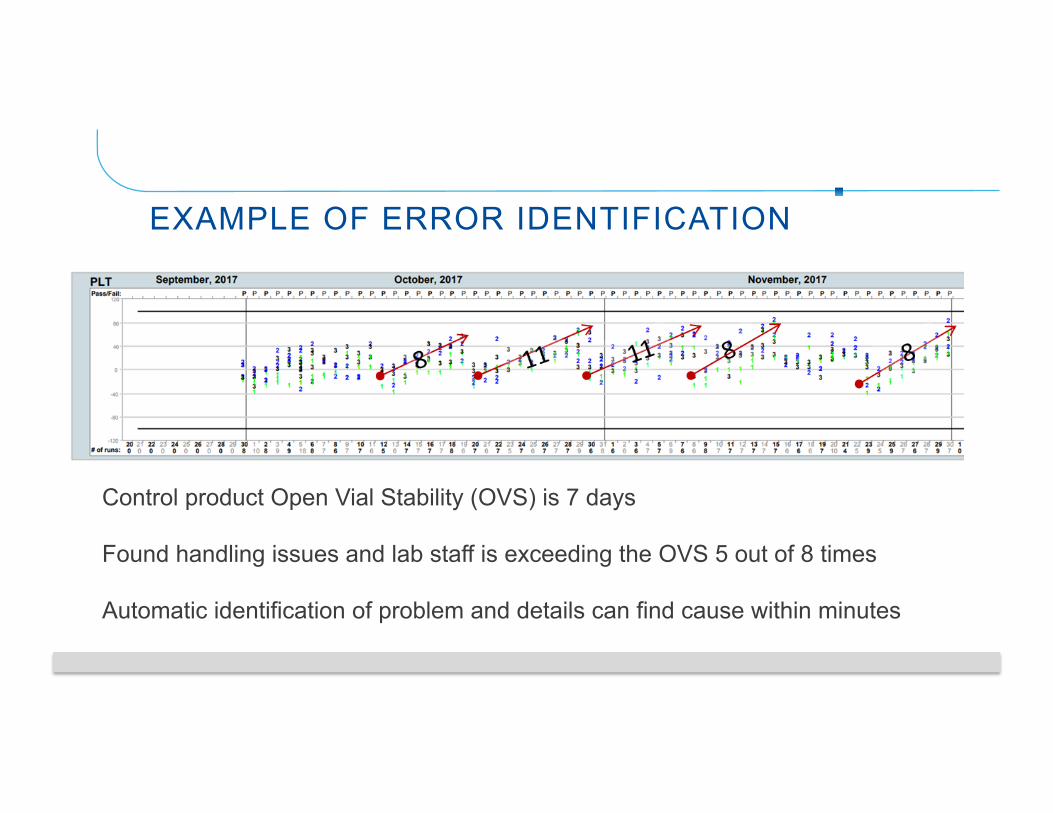
EXAMPLE OF ERROR IDENTIFICATION
Control product Open Vial Stability (OVS) is 7 days
Found handling issues and lab staff is exceeding the OVS 5 out of 8 times
Automatic identification of problem and details can find cause within minutes

DAILY CALIBRATION VERIFICATION
No 4me-‐based calibra4on verifica4on events
Real-‐4me iden4fica4on and resolu4on of issues Eliminates wai4ng 6 months to iden4fy and resolve shiZs, trends or errors.
Calibra4on verifica4on done (and documented!) every 4me QC is analyzed
Traceable to interna4onal reference methods Peer group integra4on Reports are printable on demand to streamline inspec4ons.

WHY THE RIGHT NUMBER MATTERS

Defined as how many Defects Per Million (DPM)
Scale: 0 to 6 (Sigma short-‐term scale)
6 Sigma = World Class Performance = 3.4 DPM
3 Sigma = Minimal Performance = 66,806 DPM
How do we measure 6 Sigma Performance in the laboratory?
Six Sigma

Sigma-‐metric equa4on for analy4cal process performance
Sigma metric = (TEa – bias observed) / CV observed
• Imprecision = CV of quality control materials
• Inaccuracy (Bias) = CAP surveys or peer comparisons
• TEa = EP Evaluator or Westgard Website
Six Sigma

Sigma Quality Monitoring
• Sigma process allows for control limits placed at normal QC distribution
• Quick detection of accuracy or precision changes
• Sigma for error detection between 3 to 4σ
• QC Monitoring (error detection) • Patient Results Quality • Patient sample test method
should have highest sigma possible
>3σ • High sigma score indicates small
accuracy and precision changes do not affect result quality
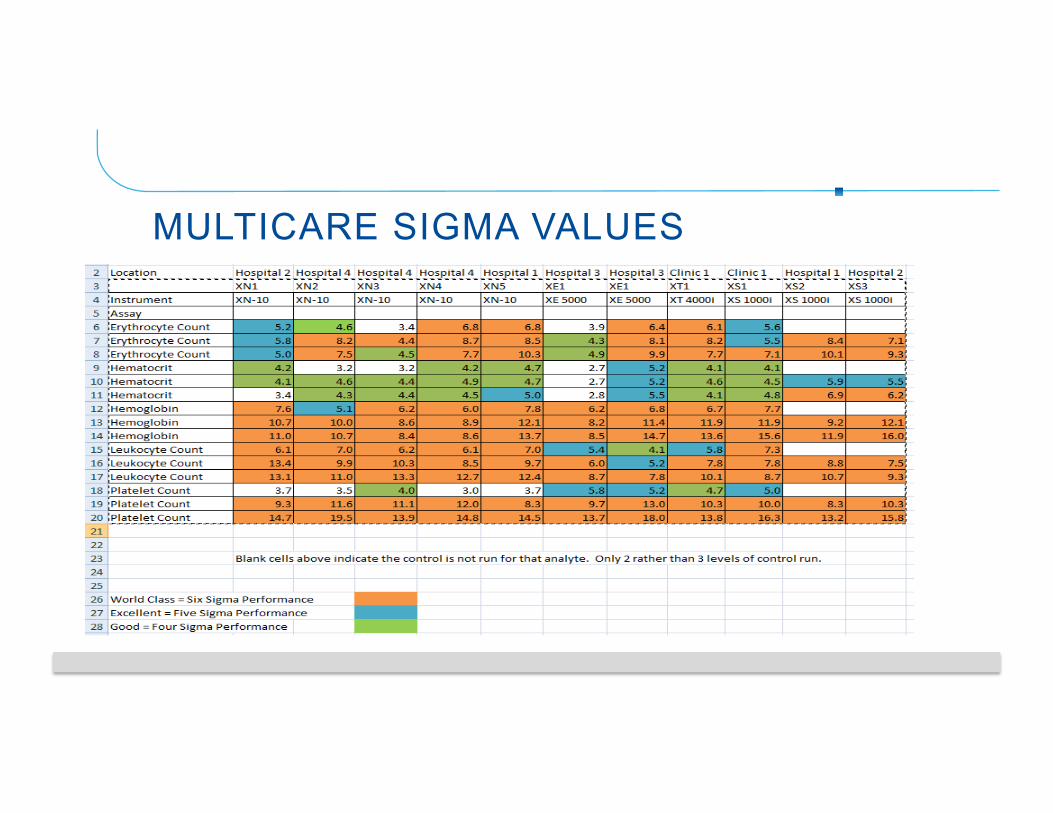
MULTICARE SIGMA VALUES

INSIGHT REPORT
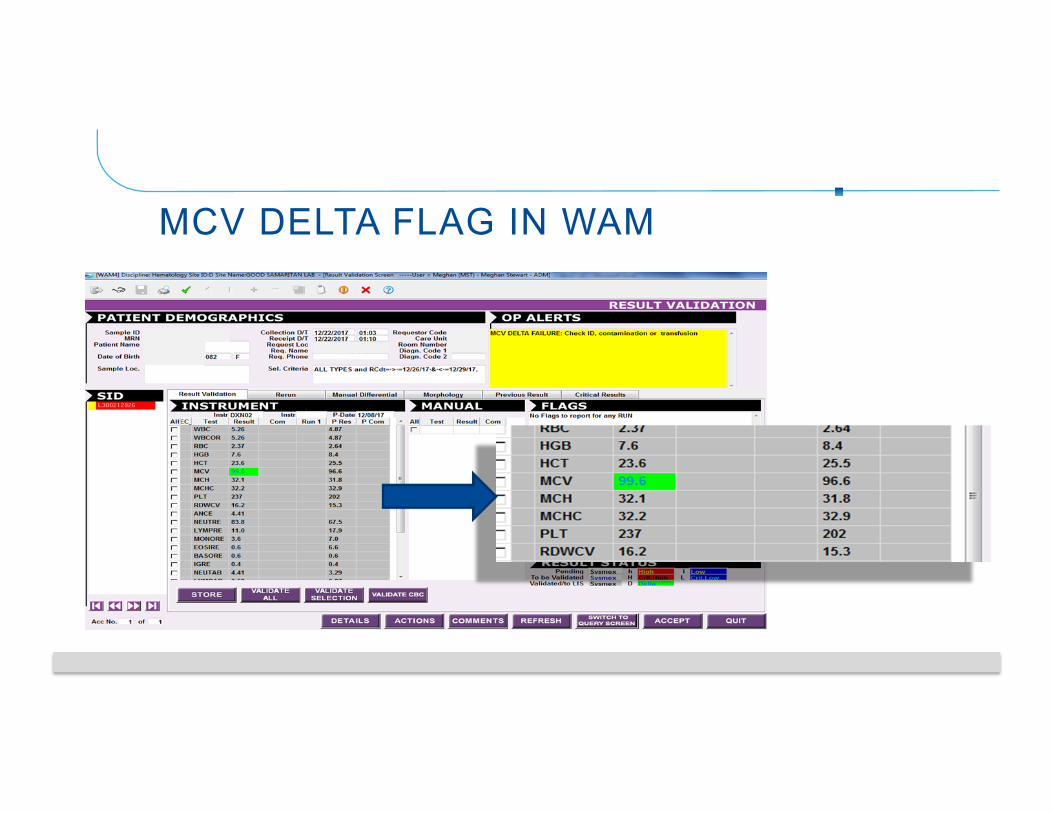
MCV DELTA FLAG IN WAM

EMERGENCY ROOM TURNAROUND TIME
“a 10-‐minute reduc4on in test turnaround 4me was associated with a nearly 7-‐minute reduc4on in length
of stay in the ED.”

EMERGENCY ROOM TURN AROUND TIME
0%
10%
20%
30%
40%
50%
60%
70%
80%
90%
100% CBC
>20
16-20
10-15
<=10

COST COMPONENT
Various costs are hidden along the total tes4ng process.
Through the use of Six Sigma, there are opportuni4es to reduce cost by improving the quality in laboratory.

SIX SIGMA AND COST Health care organizations are now beginning to use Six Sigma to monitor error rates.

COST BREAKDOWN
BCQM can affect the
analy@cal phase.
61.9% of errors
15.0% of errors
23.1% of errors

WHAT TO DO WITH AN ERROR
Once an error is detected, what is done by the laboratory to make sure the error doesn’t happen again?

YOU GET WHAT YOU PAY FOR?
It is traditionally assumed that higher quality means higher costs or “you get what you pay for”. The beauty of BeyondCare is that the cost is minimal by using software and algorithms to achieve this higher quality.

SUMMARY
The BeyondCare Quality Monitor can decrease your laboratory’s turnaround time by maintaining high Sigma values, which can decrease length of stay in the ED. The BeyondCare Quality Monitor can have a positive impact on your laboratory’s budget by detecting errors immediately.

T H AN K YOU